Manganese superoxide dismutase suppresses hypoxic induction of hypoxia-inducible factor-1α and...
13
Manganese superoxide dismutase suppresses hypoxic induction of hypoxia-inducible factor-1a and vascular endothelial growth factor Min Wang 1 , Jeanie S Kirk 1 , Sujatha Venkataraman 1 , Frederick E Domann 1 , Hannah J Zhang 1 , Freya Q Schafer 1 , Shawn W Flanagan 1 , Christine J Weydert 1 , Douglas R Spitz 1 , Garry R Buettner 1 and Larry W Oberley* ,1 1 Department of Radiation Oncology, Free Radical and Radiation Biology Program, Holden Comprehensive Cancer Center, The University of Iowa, Iowa City, IA 52242-1181, USA Hypoxia-inducible factor-1 (HIF-1) is a transcription factor that governs cellular responses to reduced O 2 availability by mediating crucial homeostatic processes. HIF-1 is composed of an HIF-1a subunit and an HIF-1b subunit. HIF-1a is degraded following enzyme-dependent hydroxylation of prolines of HIF-1a in the presence of molecular oxygen, Fe 2 þ , a-ketoglutarate, and ascorbate. These cofactors contribute to the redox environment of cells. The antioxidant enzyme manganese superoxide dismutase (MnSOD) also modulates the cellular redox environment. Here we show that MnSOD suppressed hypoxic accumulation of HIF-1a protein in human breast carcinoma MCF-7 cells. This suppression was biphasic depending on MnSOD activity. At low levels of MnSOD activity, HIF-1a protein accumulated under hypoxic conditions. At moderate levels of MnSOD activity (two- to six-fold increase compared to parent cells), these accumulations were blocked. However, at higher levels of MnSOD activity (>6-fold increase), accumulation of HIF-1a protein was again observed. This biphasic modulation was observed under both 1 and 4% O 2 . Coexpression of mitochondrial hydrogen peroxide-remov- ing proteins prevented the accumulation of HIF-1a protein in cells with high levels of MnSOD; this effect demon- strates that the restabilization of HIF-1a observed in high MnSOD overexpressors is probably due to hydrogen peroxide, most likely produced from MnSOD. Hypoxic induction of vascular endothelial growth factor (VEGF) protein was also suppressed by elevated MnSOD activity and its levels reflected HIF-1a protein levels. These observations demonstrated that HIF-1a accumulation and VEGF expression could be modulated by the antioxidant enzyme MnSOD. Oncogene (2005) 24, 8154–8166. doi:10.1038/sj.onc.1208986; published online 19 September 2005 Keywords: HIF-1; VEGF; angiogenesis; hypoxia; MnSOD Introduction Hypoxia describes a low oxygen concentration environ- ment that can be caused by stroke, coronary artery disease, trauma, or high rate of cell proliferation such as encountered in solid tumors (Dewhirst et al., 1989). Because the proliferation rate of tumor cells is usually faster than that of normal endothelial cells that form microvessels into tumors, tumor microvessels do not function as efficiently as those in normal tissues, leading to the widespread hypoxia in solid tumors (Shah-Yukich and Nelson, 1988). Tumor cells that have adapted to hypoxic conditions are thought to play critical roles in tumor progression (Hockel et al., 1996). Among the first responses at the onset of hypoxia is an increase in the protein levels of hypoxia-inducible factor-1 (HIF-1) (Wang and Semenza, 1993b). HIF-1 responds to reduced O 2 availability by mediating crucial homeostatic processes such as angio- genesis, glycolysis, and erythropoiesis (Semenza, 2000). As a transcription factor, HIF-1 has more than 40 target genes and the number continues to increase. Vascular endothelial growth factor (VEGF) is one of HIF-1 downstream genes (Liu et al., 1995). VEGF is a powerful mitogenic cytokine specific for endothelial cells; its production triggers the angiogenic cascade and tumor neovascularization processes (Nagy et al., 2002). VEGF controls not only the onset, but also the extent and duration of these processes. Hypoxia, which is a common characteristic of solid tumors, is a stimulus leading to the induction of VEGF via the regulation of HIF-1 (Semenza, 2001b; Kim et al., 2003; Pugh and Ratcliffe, 2003a). HIF-1 is a heterodimer consisting of two subunits, HIF-1a and HIF-1b (Wang and Semenza, 1993a). When oxygen is sufficient, HIF-1a is constantly being made and then degraded by the ubiquitin–proteasome path- way via the von Hippel–Lindau (VHL) tumor suppres- sor protein (Maxwell et al., 1999). VHL protein binds to HIF-1a, causing ubiquitinylation of this protein, which is then degraded by the 26S proteasome (Salceda and Caro, 1997). The binding of VHL to HIF-1a requires hydroxylation of proline residues inside the oxygen- dependent degradation domain (ODD) of HIF-1a (Bruick and McKnight, 2001). Proline 402 and proline 564 Received 14 June 2004; revised 10 June 2005; accepted 30 June 2005; published online 19 September 2005 *Correspondence: LW Oberley, Department of Radiation Oncology, Free Radical and Radiation Biology Program, B180 Medical Laboratories, The University of Iowa, Iowa City, IA 52242-1181, USA; E-mail: [email protected] Oncogene (2005) 24, 8154–8166 & 2005 Nature Publishing Group All rights reserved 0950-9232/05 $30.00 www.nature.com/onc
-
Upload
independent -
Category
Documents
-
view
0 -
download
0
Transcript of Manganese superoxide dismutase suppresses hypoxic induction of hypoxia-inducible factor-1α and...

Manganese superoxide dismutase suppresses hypoxic induction
of hypoxia-inducible factor-1a and vascular endothelial growth factor
Min Wang1, Jeanie S Kirk1, Sujatha Venkataraman1, Frederick E Domann1, Hannah J Zhang1,Freya Q Schafer1, Shawn W Flanagan1, Christine J Weydert1, Douglas R Spitz1,Garry R Buettner1 and Larry W Oberley*,1
1Department of Radiation Oncology, Free Radical and Radiation Biology Program, Holden Comprehensive Cancer Center,The University of Iowa, Iowa City, IA 52242-1181, USA
Hypoxia-inducible factor-1 (HIF-1) is a transcriptionfactor that governs cellular responses to reduced O2
availability by mediating crucial homeostatic processes.HIF-1 is composed of an HIF-1a subunit and an HIF-1bsubunit. HIF-1a is degraded following enzyme-dependenthydroxylation of prolines of HIF-1a in the presence ofmolecular oxygen, Fe2þ , a-ketoglutarate, and ascorbate.These cofactors contribute to the redox environment ofcells. The antioxidant enzyme manganese superoxidedismutase (MnSOD) also modulates the cellular redoxenvironment. Here we show that MnSOD suppressedhypoxic accumulation of HIF-1a protein in human breastcarcinoma MCF-7 cells. This suppression was biphasicdepending on MnSOD activity. At low levels of MnSODactivity, HIF-1a protein accumulated under hypoxicconditions. At moderate levels of MnSOD activity (two-to six-fold increase compared to parent cells), theseaccumulations were blocked. However, at higher levels ofMnSOD activity (>6-fold increase), accumulation ofHIF-1a protein was again observed. This biphasicmodulation was observed under both 1 and 4% O2.Coexpression of mitochondrial hydrogen peroxide-remov-ing proteins prevented the accumulation of HIF-1a proteinin cells with high levels of MnSOD; this effect demon-strates that the restabilization of HIF-1a observed in highMnSOD overexpressors is probably due to hydrogenperoxide, most likely produced from MnSOD. Hypoxicinduction of vascular endothelial growth factor (VEGF)protein was also suppressed by elevated MnSOD activityand its levels reflected HIF-1a protein levels. Theseobservations demonstrated that HIF-1a accumulationand VEGF expression could be modulated by theantioxidant enzyme MnSOD.Oncogene (2005) 24, 8154–8166. doi:10.1038/sj.onc.1208986;published online 19 September 2005
Keywords: HIF-1; VEGF; angiogenesis; hypoxia; MnSOD
Introduction
Hypoxia describes a low oxygen concentration environ-ment that can be caused by stroke, coronary arterydisease, trauma, or high rate of cell proliferation such asencountered in solid tumors (Dewhirst et al., 1989).Because the proliferation rate of tumor cells is usuallyfaster than that of normal endothelial cells that formmicrovessels into tumors, tumor microvessels do notfunction as efficiently as those in normal tissues, leadingto the widespread hypoxia in solid tumors (Shah-Yukichand Nelson, 1988).Tumor cells that have adapted to hypoxic conditions
are thought to play critical roles in tumor progression(Hockel et al., 1996). Among the first responses at theonset of hypoxia is an increase in the protein levels ofhypoxia-inducible factor-1 (HIF-1) (Wang and Semenza,1993b). HIF-1 responds to reduced O2 availability bymediating crucial homeostatic processes such as angio-genesis, glycolysis, and erythropoiesis (Semenza, 2000).As a transcription factor, HIF-1 has more than 40 targetgenes and the number continues to increase. Vascularendothelial growth factor (VEGF) is one of HIF-1downstream genes (Liu et al., 1995). VEGF is apowerful mitogenic cytokine specific for endothelialcells; its production triggers the angiogenic cascade andtumor neovascularization processes (Nagy et al., 2002).VEGF controls not only the onset, but also the extentand duration of these processes. Hypoxia, which is acommon characteristic of solid tumors, is a stimulusleading to the induction of VEGF via the regulation ofHIF-1 (Semenza, 2001b; Kim et al., 2003; Pugh andRatcliffe, 2003a).HIF-1 is a heterodimer consisting of two subunits,
HIF-1a and HIF-1b (Wang and Semenza, 1993a). Whenoxygen is sufficient, HIF-1a is constantly being madeand then degraded by the ubiquitin–proteasome path-way via the von Hippel–Lindau (VHL) tumor suppres-sor protein (Maxwell et al., 1999). VHL protein binds toHIF-1a, causing ubiquitinylation of this protein, whichis then degraded by the 26S proteasome (Salceda andCaro, 1997). The binding of VHL to HIF-1a requireshydroxylation of proline residues inside the oxygen-dependent degradation domain (ODD) of HIF-1a(Bruick and McKnight, 2001). Proline402 and proline564
Received 14 June 2004; revised 10 June 2005; accepted 30 June 2005;published online 19 September 2005
*Correspondence: LW Oberley, Department of Radiation Oncology,Free Radical and Radiation Biology Program, B180 MedicalLaboratories, The University of Iowa, Iowa City, IA 52242-1181,USA; E-mail: [email protected]
Oncogene (2005) 24, 8154–8166& 2005 Nature Publishing Group All rights reserved 0950-9232/05 $30.00
www.nature.com/onc

are hydroxylated by HIF-prolyl hydroxylase, whichneeds the presence of several cofactors to gain fullactivity. These cofactors are molecular oxygen, Fe2þ ,a-ketoglutarate, and ascorbate (Jaakkola et al., 2001;Kondo and Kaelin, 2001; Semenza, 2001a; Pugh andRatcliffe, 2003b). During hydroxylation, one atom ofthe O2 molecule is incorporated into succinate upondecarboxylation of a-ketoglutarate and the other into ahydroxyl group on the proline residue. The Fe2þ islocated inside the active site of HIF-prolyl hydroxylase(McNeill et al., 2002).Reactive oxygen species (ROS), such as superoxide
and hydrogen peroxide (H2O2), are known to serve assignal transducers (Nakamura et al., 1997; Powis et al.,1997; Suzuki et al., 1997; Schafer and Buettner, 2001). Ithas been shown that ROS can participate in the hypoxiasignal transduction pathway that mediates the stabiliza-tion of HIF-1a (Chandel et al., 2000; Schroedl et al.,2002; Park et al., 2003). Manganese superoxide dis-mutase (MnSOD) is a primary antioxidant enzyme thatis located in the mitochondrial matrix. It has beenshown that the malignant phenotype is suppressed whenMnSOD activity is elevated in certain cancer cells (Liet al., 1998a, b; Zhang et al., 1999). MnSOD has beenimplicated as a tumor suppressor and as a metastasissuppressor in some tumor cell lines (Oberley andBuettner, 1979; Oberley and Oberley, 1988; Bravardet al., 1992). MnSOD modulates the cellular redoxenvironment by converting superoxide radical (O2
��) toH2O2 and dioxygen. Therefore, MnSOD may affect theexpression of redox-sensitive genes, including HIF-1.Here we are the first to show that MnSOD over-expression suppressed the hypoxic accumulation ofHIF-1a in human breast carcinoma MCF-7 cells. Thehypoxic induction of VEGF protein was also suppressedby elevation of MnSOD.
Results
Increased MnSOD activity suppressed hypoxicaccumulation of HIF-1a protein in cells exposed to 1% O2
To test the role of elevated MnSOD activity on hypoxicaccumulation of HIF-1a protein, 12 previously char-acterized (Zhang et al., 1999) stably transfected MCF-7clones with different MnSOD activities as well asparental (untransfected) cells were used. These cloneswere produced by transfection with pcDNA3 plasmidscontaining sense MnSOD cDNA or containing noMnSOD insert (Neo clone) by the lipofectAmine (LifeTechnologies, Gaithersburg, MD, USA) method. TheG418-resistant colonies were isolated by cloning ringsand maintained in medium supplemented with 400mg/mlG418 (Life Technologies). The MnSOD clones werecharacterized and found to have a less malignantphenotype than the parental cells as indicated by (1)decreased plating efficiency, (2) elongated cell popula-tion doubling time, (3) lower clonogenic fraction in softagar, and (4) complete inhibition or delayed onset oftumor formation in nude mice, as well as slower growth
of tumors that formed (Zhang et al., 1999). These 13different cell lines were exposed to 1% O2 for 4 h. Thiscondition did not change MnSOD activity during thistime frame (data not shown). Immediately afterhypoxia, protein was harvested and HIF-1a proteinlevels were analysed by Western blotting (Figure 1a).The results showed that at low levels of MnSOD activity(parental cells (WT) and transfected clones with thesame activity (Neo and SOD23)), HIF-1a proteinaccumulated. In clones where MnSOD activity wasmoderately increased (two- to six-fold relative to that ofthe parent cells), HIF-1a protein levels were decreased.The levels of HIF-1a protein decreased with increasingMnSOD activity until they were no longer detectable inclones with three- and six-fold increase in MnSODactivity. However, in clones where MnSOD activity wasincreased to a higher level (>6-fold), HIF-1a proteinwas again detected, and increased with increasingMnSOD activity. Regression analysis demonstrated alinear inverse correlation of HIF-1a with low levels ofMnSOD activity (one- to three-fold), whereas at highlevels of MnSOD (>6-fold), a linear positive correlationwas observed (Figure 1b).
Figure 1 Plasmid transfection of MnSOD suppressed HIF-1aprotein accumulation after 4 h exposure to 1% O2. (a) Western blotshowing HIF-1a protein levels in 12 different MnSOD stablytransfected clones plus parental MCF-7 cells after 4 h exposure to1% O2. The first three lanes were samples from MCF-7 parentalcells, Neo vector control, and a clone with the same activity asparental cells. The remaining 10 lanes were samples from cloneswith increasing MnSOD activity. The bottom row of numbersindicates the relative MnSOD activity compared to the parentalMCF-7 cells. The actual MnSOD activities of the clones werepreviously measured (Zhang et al., 1999) to be (in units/mg protein)WT (772), Neo4 (773), SOD15 (1974), SOD18 (1172), SOD23(1072), SOD50 (2376), Mn1 (6278), Mn11 (142720), Mn28(57710), Mn44 (4479), Mn52 (4476), Mn59 (5372), and Mn63(5278). (b) Regression analysis of HIF-1a protein and MnSODactivity shows a biphasic effect. HIF-1a protein levels werequantified by densitometry and normalized to a-tubulin levels.Similar results were obtained in a repeated experiment
MnSOD suppresses HIF-1 and VEGFM Wang et al
8155
Oncogene
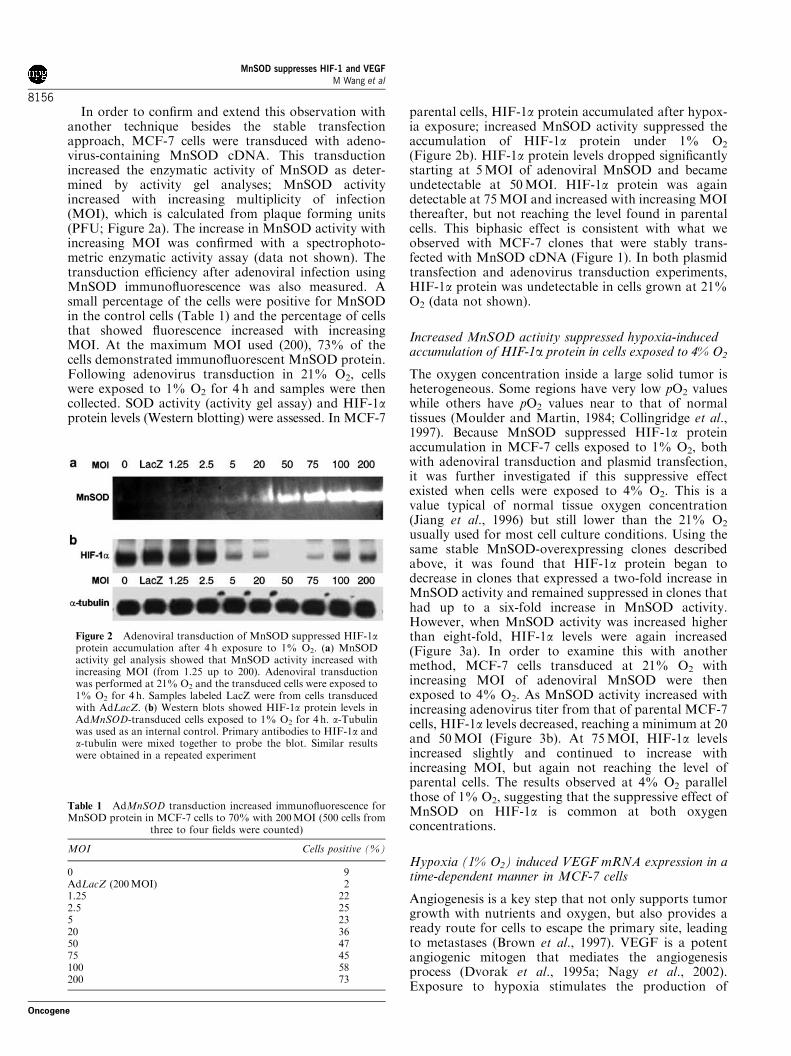
In order to confirm and extend this observation withanother technique besides the stable transfectionapproach, MCF-7 cells were transduced with adeno-virus-containing MnSOD cDNA. This transductionincreased the enzymatic activity of MnSOD as deter-mined by activity gel analyses; MnSOD activityincreased with increasing multiplicity of infection(MOI), which is calculated from plaque forming units(PFU; Figure 2a). The increase in MnSOD activity withincreasing MOI was confirmed with a spectrophoto-metric enzymatic activity assay (data not shown). Thetransduction efficiency after adenoviral infection usingMnSOD immunofluorescence was also measured. Asmall percentage of the cells were positive for MnSODin the control cells (Table 1) and the percentage of cellsthat showed fluorescence increased with increasingMOI. At the maximum MOI used (200), 73% of thecells demonstrated immunofluorescent MnSOD protein.Following adenovirus transduction in 21% O2, cellswere exposed to 1% O2 for 4 h and samples were thencollected. SOD activity (activity gel assay) and HIF-1aprotein levels (Western blotting) were assessed. In MCF-7
parental cells, HIF-1a protein accumulated after hypox-ia exposure; increased MnSOD activity suppressed theaccumulation of HIF-1a protein under 1% O2(Figure 2b). HIF-1a protein levels dropped significantlystarting at 5MOI of adenoviral MnSOD and becameundetectable at 50MOI. HIF-1a protein was againdetectable at 75MOI and increased with increasing MOIthereafter, but not reaching the level found in parentalcells. This biphasic effect is consistent with what weobserved with MCF-7 clones that were stably trans-fected with MnSOD cDNA (Figure 1). In both plasmidtransfection and adenovirus transduction experiments,HIF-1a protein was undetectable in cells grown at 21%O2 (data not shown).
Increased MnSOD activity suppressed hypoxia-inducedaccumulation of HIF-1a protein in cells exposed to 4% O2
The oxygen concentration inside a large solid tumor isheterogeneous. Some regions have very low pO2 valueswhile others have pO2 values near to that of normaltissues (Moulder and Martin, 1984; Collingridge et al.,1997). Because MnSOD suppressed HIF-1a proteinaccumulation in MCF-7 cells exposed to 1% O2, bothwith adenoviral transduction and plasmid transfection,it was further investigated if this suppressive effectexisted when cells were exposed to 4% O2. This is avalue typical of normal tissue oxygen concentration(Jiang et al., 1996) but still lower than the 21% O2usually used for most cell culture conditions. Using thesame stable MnSOD-overexpressing clones describedabove, it was found that HIF-1a protein began todecrease in clones that expressed a two-fold increase inMnSOD activity and remained suppressed in clones thathad up to a six-fold increase in MnSOD activity.However, when MnSOD activity was increased higherthan eight-fold, HIF-1a levels were again increased(Figure 3a). In order to examine this with anothermethod, MCF-7 cells transduced at 21% O2 withincreasing MOI of adenoviral MnSOD were thenexposed to 4% O2. As MnSOD activity increased withincreasing adenovirus titer from that of parental MCF-7cells, HIF-1a levels decreased, reaching a minimum at 20and 50MOI (Figure 3b). At 75MOI, HIF-1a levelsincreased slightly and continued to increase withincreasing MOI, but again not reaching the level ofparental cells. The results observed at 4% O2 parallelthose of 1% O2, suggesting that the suppressive effect ofMnSOD on HIF-1a is common at both oxygenconcentrations.
Hypoxia (1% O2) induced VEGF mRNA expression in atime-dependent manner in MCF-7 cells
Angiogenesis is a key step that not only supports tumorgrowth with nutrients and oxygen, but also provides aready route for cells to escape the primary site, leadingto metastases (Brown et al., 1997). VEGF is a potentangiogenic mitogen that mediates the angiogenesisprocess (Dvorak et al., 1995a; Nagy et al., 2002).Exposure to hypoxia stimulates the production of
Figure 2 Adenoviral transduction of MnSOD suppressed HIF-1aprotein accumulation after 4 h exposure to 1% O2. (a) MnSODactivity gel analysis showed that MnSOD activity increased withincreasing MOI (from 1.25 up to 200). Adenoviral transductionwas performed at 21% O2 and the transduced cells were exposed to1% O2 for 4 h. Samples labeled LacZ were from cells transducedwith AdLacZ. (b) Western blots showed HIF-1a protein levels inAdMnSOD-transduced cells exposed to 1% O2 for 4 h. a-Tubulinwas used as an internal control. Primary antibodies to HIF-1a anda-tubulin were mixed together to probe the blot. Similar resultswere obtained in a repeated experiment
Table 1 AdMnSOD transduction increased immunofluorescence forMnSOD protein in MCF-7 cells to 70% with 200MOI (500 cells from
three to four fields were counted)
MOI Cells positive (%)
0 9AdLacZ (200MOI) 21.25 222.5 255 2320 3650 4775 45100 58200 73
MnSOD suppresses HIF-1 and VEGFM Wang et al
8156
Oncogene

VEGF, mainly through the induction of the transcrip-tion factor HIF-1 (Kim et al., 2003). With theobservation that MnSOD suppressed hypoxic accumu-lation of HIF-1a protein, the effect of increasingMnSOD activity on hypoxic induction of VEGF inMCF-7 cells was also measured.Wild-type (WT) MCF-7 cells after hypoxic exposure
(1% O2) for various times were lysed and total RNAisolated to be used in both semiquantitative and real-time RT–PCR measurements. VEGF-A mRNA expres-sion increased dramatically after cells were exposed tohypoxia for 6 h, compared to cells without hypoxiaexposure. This induction continued in cells that wereexposed for longer times (Figure 4a). To confirm theseresults, quantitative real-time RT–PCR for VEGF-Aexpression was also carried out using the primersdescribed in Materials and methods (Figure 4b). Theresults also suggested that VEGF-A expression in-creased with time of exposure of cells to 1% O2.Therefore, real-time RT–PCR confirmed that VEGF-Aexpression increased in MCF-7 WT cells after exposureto 1% O2.
Hypoxic induction of VEGF-A mRNA was suppressed byincreased MnSOD in cells exposed to 1% O2 in stabletransfectants
As VEGF-A mRNA expression increased substantiallywith 6 h of hypoxia, the effect of increased MnSOD
Figure 3 Elevated MnSOD activities suppressed HIF-1a proteinaccumulation at 4% O2. (a) Plasmid transfection of MnSODsuppressed normoxic (4% O2, 4 h) accumulation of HIF-1aprotein. Western blot shows HIF-1a protein levels in differentMnSOD stably transfected clones of MCF-7 cells with 4 h ofexposure to 4% O2. The top row of numbers indicates the relativeMnSOD activity in 12 different clones compared to MCF-7 WTcells. a-Tubulin was used as an internal control. The 12 differentclones are the same as used in Figure 1. Similar results wereobtained in repeated experiments. (b) Adenoviral transduction ofMnSOD suppressed HIF-1a protein accumulation at 4% O2. Thetop panel shows that MnSOD activity increased with increasingMOI (from 1.25 up to 200). Adenoviral transduction wasperformed at 21% O2 and the transduced cells were exposed to4% O2. The second and third panels show Western blots for HIF-1a and a-tubulin, respectively, from cells exposed to 4% O2 for 4 h.Similar results were obtained in repeat experiments
Figure 4 MnSOD overexpression suppressed hypoxic induction ofVEGF-A mRNA in MCF-7 cells. (a) Steady-state levels of VEGFmRNA increased with time when MCF-7 WT cells were subjectedto hypoxia. Cells were exposed to hypoxia (1% O2) for varioustimes. Total RNA was then isolated and semiquantitative RT–PCRwas carried out. b-Actin was used as the internal control. Similarresults were observed in repeated experiments. M: DNA marker;N: negative control (without mRNA samples); 0, 2, 4, 6, 12, and24 h are different times of hypoxia exposure (1% O2). (b)Quantitative RT–PCR analysis also documented an increase inVEGF-A expression with time (0–24h) of exposure of MCF-7 WTcells to 1% hypoxia. The VEGF-A expressions in samples werenormalized with 18S rRNA. Values are mean7s.e. of three sampleseach from two separate experiments. *Po0.05, group statisticallydifferent from 0 time controls by one-way ANOVA analysis. (c) Arepresentative result shows that MnSOD overexpression sup-pressed hypoxic (1% O2, 6 h) induction of VEGF mRNA in sevendistinct MnSOD stably transfected clones as well as parental MCF-7 cells. M: DNA marker; N: negative control (without mRNAsamples). (d) Quantitative RT–PCR analysis of VEGF-A expres-sion in different MnSOD-overexpressing clones subjected to 6 h ofhypoxia compared to cells grown at 21% (0 h of hypoxia). The bargraph illustrates that there is differential induction of VEGF-Aexpression in MCF-7 clones. Results are from measurementsrepeated three times from the same sample
MnSOD suppresses HIF-1 and VEGFM Wang et al
8157
Oncogene

activity on VEGF-A mRNA expression at this time wasstudied. Because MnSOD modulated HIF-1a and HIF-1a accumulation leads to VEGF expression, it wasanticipated that MnSOD would modulate VEGF.Indeed, MnSOD transfection modulated VEGF-Aexpression with hypoxic exposure parallel to theobservation with HIF-1a. After cells were exposed to6 h hypoxia, VEGF-A mRNA expression was induced inparental cells. In cells with intermediate levels ofMnSOD, the induction was suppressed (Figure 4c). Tovalidate these findings, quantitative real-time RT–PCRwas carried out with some of the clones that weresubjected to hypoxia (1% O2) and compared to that at21% O2 (Figure 4d). The VEGF-A expression in WTcells was more than three-fold increased after 6 h ofhypoxia compared to cells under 21% O2. VEGFexpression was about 1.5-fold in clone SOD50 that hasa three-fold increase in MnSOD activity. The clone thathad a six-fold in MnSOD activity (Mn52) showed abouta 2.4-fold increase in VEGF-A mRNA levels. In theclone with higher MnSOD activity (19-fold, Mn11) theVEGF-A expression was suppressed in hypoxia, but notto the level observed in SOD50 clones. These data showthat VEGF-A mRNA levels are induced by hypoxia, butthe levels are suppressed in MnSOD-overexpressing cellswith again a biphasic effect.
MnSOD suppressed the secretion of VEGF protein withhypoxia stimulation (1% O2)
As a mitogenic cytokine, VEGF protein is usuallysecreted outside the cells to stimulate the proliferation ofendothelial cells (Dvorak et al., 1995b). To determine ifVEGF protein secretion followed the trend of its mRNAexpression, the pattern of VEGF protein secretion withhypoxia stimulation was examined. MCF-7 WT cellswere exposed to hypoxia for various times and VEGFconcentrations were measured. Hypoxia exposure in-creased the amount of VEGF protein (Figure 5a). Theamount of VEGF protein increased rapidly from 8 until12 h in the hypoxia-treated cells; after 12 h, VEGF levelscontinued to increase, but at a lower rate than earliertimes. VEGF protein also increased in nonhypoxic cells,but at a much slower rate than in hypoxic cells.Moreover, most of the VEGF protein accumulated inthe medium and only small amounts were found insidethe cells (Figure 5a).To determine the suppressive effect of elevated
MnSOD activity on the secretion of VEGF protein,seven stably transfected MCF-7 clones with variousMnSOD activity (described above) together withparental cells were exposed to hypoxia (1% O2) for12 h. Media from these clones were then collectedand VEGF concentrations were measured. IncreasedMnSOD activity significantly decreased VEGF proteinlevels (Figure 5b). The suppression of VEGF protein byMnSOD was biphasic, with the greatest suppression atlow to medium MnSOD levels and less suppression athigher MnSOD levels, consistent with what wasobserved with HIF-1a protein and VEGF mRNAlevels.
Adenoviral transduction of cellular catalase increasedcatalase activity in MCF-7 Neo vector control cells
Throughout this work, a biphasic effect was observed.One possible explanation for the stabilization of HIF-1aseen at high levels of MnSOD is that H2O2 producedfrom MnSOD overwhelms the endogenous peroxide-removing systems and causes HIF-1a to increase. Inorder to examine this hypothesis, extracellular H2O2levels in these cell lines stably overexpressing MnSODwere measured. Cells overexpressing MnSOD did havehigher levels of exogenous H2O2, but there was nodifference between hypoxic and nonhypoxic cells (datanot shown). This result suggested that H2O2 could bethe effector of the biphasic effect since it was elevated incells with high levels of MnSOD. Moreover, we have
Figure 5 MnSOD overexpression suppressed VEGF proteinsecretion in MCF-7 cells. (a) Hypoxia induced the secretion ofVEGF protein in a time-dependent manner in MCF-7 WT cells.MCF-7 WT cells were exposed to hypoxia (1% O2) for varioustimes. VEGF concentration was measured with a human VEGF-ELISA kit (R&D Systems, Minneapolis, MN, USA). VEGFproduction increased when cells were exposed to hypoxia forlonger times. VEGF was mainly secreted outside the cell as theconcentration of VEGF in tissue culture medium was much higherthan that in the cell lysate. Values represent mean7s.d. of threemeasurements of a single sample. (b) MnSOD overexpressionsuppressed VEGF protein secretion in MCF-7 cells. VEGF proteinwas measured after 12 h of hypoxia (1% O2) in seven distinct clonesplus MCF-7 parental cells with various MnSOD activities. Valuesrepresent mean7s.e.m. of three independent experiments. *ByStudent’s t-test analysis, hypoxia-treated cells were different fromnonhypoxic cells at Po0.05 level
MnSOD suppresses HIF-1 and VEGFM Wang et al
8158
Oncogene
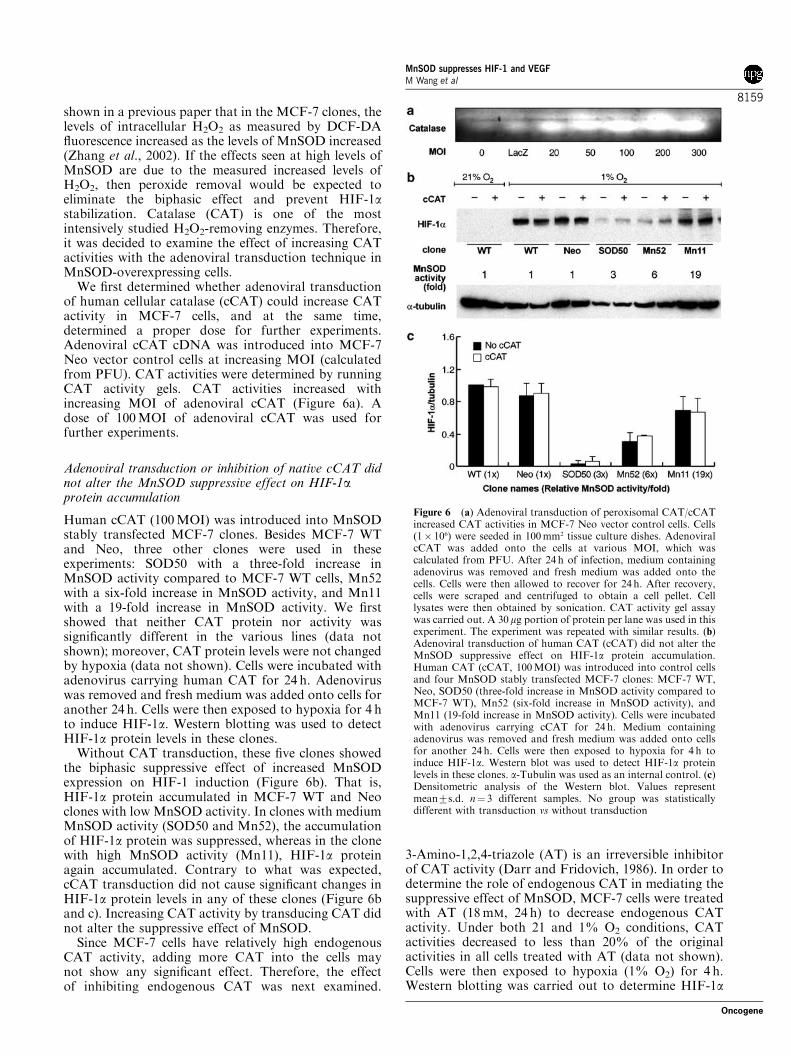
shown in a previous paper that in the MCF-7 clones, thelevels of intracellular H2O2 as measured by DCF-DAfluorescence increased as the levels of MnSOD increased(Zhang et al., 2002). If the effects seen at high levels ofMnSOD are due to the measured increased levels ofH2O2, then peroxide removal would be expected toeliminate the biphasic effect and prevent HIF-1astabilization. Catalase (CAT) is one of the mostintensively studied H2O2-removing enzymes. Therefore,it was decided to examine the effect of increasing CATactivities with the adenoviral transduction technique inMnSOD-overexpressing cells.We first determined whether adenoviral transduction
of human cellular catalase (cCAT) could increase CATactivity in MCF-7 cells, and at the same time,determined a proper dose for further experiments.Adenoviral cCAT cDNA was introduced into MCF-7Neo vector control cells at increasing MOI (calculatedfrom PFU). CAT activities were determined by runningCAT activity gels. CAT activities increased withincreasing MOI of adenoviral cCAT (Figure 6a). Adose of 100MOI of adenoviral cCAT was used forfurther experiments.
Adenoviral transduction or inhibition of native cCAT didnot alter the MnSOD suppressive effect on HIF-1aprotein accumulation
Human cCAT (100MOI) was introduced into MnSODstably transfected MCF-7 clones. Besides MCF-7 WTand Neo, three other clones were used in theseexperiments: SOD50 with a three-fold increase inMnSOD activity compared to MCF-7 WT cells, Mn52with a six-fold increase in MnSOD activity, and Mn11with a 19-fold increase in MnSOD activity. We firstshowed that neither CAT protein nor activity wassignificantly different in the various lines (data notshown); moreover, CAT protein levels were not changedby hypoxia (data not shown). Cells were incubated withadenovirus carrying human CAT for 24 h. Adenoviruswas removed and fresh medium was added onto cells foranother 24 h. Cells were then exposed to hypoxia for 4 hto induce HIF-1a. Western blotting was used to detectHIF-1a protein levels in these clones.Without CAT transduction, these five clones showed
the biphasic suppressive effect of increased MnSODexpression on HIF-1 induction (Figure 6b). That is,HIF-1a protein accumulated in MCF-7 WT and Neoclones with low MnSOD activity. In clones with mediumMnSOD activity (SOD50 and Mn52), the accumulationof HIF-1a protein was suppressed, whereas in the clonewith high MnSOD activity (Mn11), HIF-1a proteinagain accumulated. Contrary to what was expected,cCAT transduction did not cause significant changes inHIF-1a protein levels in any of these clones (Figure 6band c). Increasing CAT activity by transducing CAT didnot alter the suppressive effect of MnSOD.Since MCF-7 cells have relatively high endogenous
CAT activity, adding more CAT into the cells maynot show any significant effect. Therefore, the effectof inhibiting endogenous CAT was next examined.
3-Amino-1,2,4-triazole (AT) is an irreversible inhibitorof CAT activity (Darr and Fridovich, 1986). In order todetermine the role of endogenous CAT in mediating thesuppressive effect of MnSOD, MCF-7 cells were treatedwith AT (18mM, 24 h) to decrease endogenous CATactivity. Under both 21 and 1% O2 conditions, CATactivities decreased to less than 20% of the originalactivities in all cells treated with AT (data not shown).Cells were then exposed to hypoxia (1% O2) for 4 h.Western blotting was carried out to determine HIF-1a
Figure 6 (a) Adenoviral transduction of peroxisomal CAT/cCATincreased CAT activities in MCF-7 Neo vector control cells. Cells(1� 106) were seeded in 100mm2 tissue culture dishes. AdenoviralcCAT was added onto the cells at various MOI, which wascalculated from PFU. After 24 h of infection, medium containingadenovirus was removed and fresh medium was added onto thecells. Cells were then allowed to recover for 24 h. After recovery,cells were scraped and centrifuged to obtain a cell pellet. Celllysates were then obtained by sonication. CAT activity gel assaywas carried out. A 30mg portion of protein per lane was used in thisexperiment. The experiment was repeated with similar results. (b)Adenoviral transduction of human CAT (cCAT) did not alter theMnSOD suppressive effect on HIF-1a protein accumulation.Human CAT (cCAT, 100MOI) was introduced into control cellsand four MnSOD stably transfected MCF-7 clones: MCF-7 WT,Neo, SOD50 (three-fold increase in MnSOD activity compared toMCF-7 WT), Mn52 (six-fold increase in MnSOD activity), andMn11 (19-fold increase in MnSOD activity). Cells were incubatedwith adenovirus carrying cCAT for 24 h. Medium containingadenovirus was removed and fresh medium was added onto cellsfor another 24 h. Cells were then exposed to hypoxia for 4 h toinduce HIF-1a. Western blot was used to detect HIF-1a proteinlevels in these clones. a-Tubulin was used as an internal control. (c)Densitometric analysis of the Western blot. Values representmean7s.d. n¼ 3 different samples. No group was statisticallydifferent with transduction vs without transduction
MnSOD suppresses HIF-1 and VEGFM Wang et al
8159
Oncogene
protein changes. Similar to increasing CAT activity withadenoviral transduction, CAT inhibition induced by ATdid not cause significant changes in HIF-1a proteinlevels in MnSOD-overexpressing clones (data notshown). These results suggested that peroxide removalby CAT did not play a role in mediating the suppressiveeffect of MnSOD on hypoxic induction of HIF-1. Since
MnSOD is located in the mitochondria and CATremoves peroxide outside the mitochondria in eitherperoxisomes or cytoplasm, the location of the peroxide-removing system may be important and responsible forthese negative results.
Adenoviral transduction of mitochondrial catalaseincreased CAT activity in MCF-7 Neo vector control cells
Since neither native CAT transduction nor CATinhibition changed the suppressive effect of MnSOD, ahuman adenoviral CAT construct with a mitochondrialtargeting sequence was obtained to test whetherthe location of the peroxide-removing system wasimportant.Adenoviral mitochondrial catalase (mCAT) was made
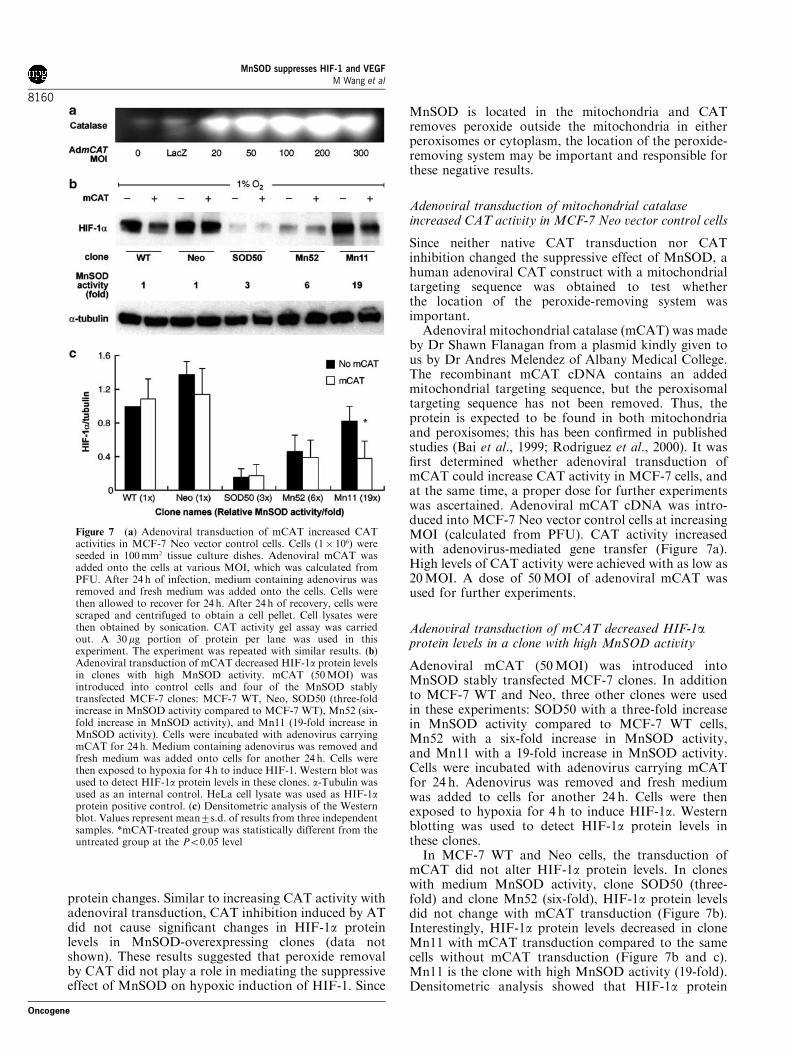
by Dr Shawn Flanagan from a plasmid kindly given tous by Dr Andres Melendez of Albany Medical College.The recombinant mCAT cDNA contains an addedmitochondrial targeting sequence, but the peroxisomaltargeting sequence has not been removed. Thus, theprotein is expected to be found in both mitochondriaand peroxisomes; this has been confirmed in publishedstudies (Bai et al., 1999; Rodriguez et al., 2000). It wasfirst determined whether adenoviral transduction ofmCAT could increase CAT activity in MCF-7 cells, andat the same time, a proper dose for further experimentswas ascertained. Adenoviral mCAT cDNA was intro-duced into MCF-7 Neo vector control cells at increasingMOI (calculated from PFU). CAT activity increasedwith adenovirus-mediated gene transfer (Figure 7a).High levels of CAT activity were achieved with as low as20MOI. A dose of 50MOI of adenoviral mCAT wasused for further experiments.
Adenoviral transduction of mCAT decreased HIF-1aprotein levels in a clone with high MnSOD activity
Adenoviral mCAT (50MOI) was introduced intoMnSOD stably transfected MCF-7 clones. In additionto MCF-7 WT and Neo, three other clones were usedin these experiments: SOD50 with a three-fold increasein MnSOD activity compared to MCF-7 WT cells,Mn52 with a six-fold increase in MnSOD activity,and Mn11 with a 19-fold increase in MnSOD activity.Cells were incubated with adenovirus carrying mCATfor 24 h. Adenovirus was removed and fresh mediumwas added to cells for another 24 h. Cells were thenexposed to hypoxia for 4 h to induce HIF-1a. Westernblotting was used to detect HIF-1a protein levels inthese clones.In MCF-7 WT and Neo cells, the transduction of
mCAT did not alter HIF-1a protein levels. In cloneswith medium MnSOD activity, clone SOD50 (three-fold) and clone Mn52 (six-fold), HIF-1a protein levelsdid not change with mCAT transduction (Figure 7b).Interestingly, HIF-1a protein levels decreased in cloneMn11 with mCAT transduction compared to the samecells without mCAT transduction (Figure 7b and c).Mn11 is the clone with high MnSOD activity (19-fold).Densitometric analysis showed that HIF-1a protein
Figure 7 (a) Adenoviral transduction of mCAT increased CATactivities in MCF-7 Neo vector control cells. Cells (1� 106) wereseeded in 100mm2 tissue culture dishes. Adenoviral mCAT wasadded onto the cells at various MOI, which was calculated fromPFU. After 24 h of infection, medium containing adenovirus wasremoved and fresh medium was added onto the cells. Cells werethen allowed to recover for 24 h. After 24 h of recovery, cells werescraped and centrifuged to obtain a cell pellet. Cell lysates werethen obtained by sonication. CAT activity gel assay was carriedout. A 30 mg portion of protein per lane was used in thisexperiment. The experiment was repeated with similar results. (b)Adenoviral transduction of mCAT decreased HIF-1a protein levelsin clones with high MnSOD activity. mCAT (50MOI) wasintroduced into control cells and four of the MnSOD stablytransfected MCF-7 clones: MCF-7 WT, Neo, SOD50 (three-foldincrease in MnSOD activity compared to MCF-7 WT), Mn52 (six-fold increase in MnSOD activity), and Mn11 (19-fold increase inMnSOD activity). Cells were incubated with adenovirus carryingmCAT for 24 h. Medium containing adenovirus was removed andfresh medium was added onto cells for another 24 h. Cells werethen exposed to hypoxia for 4 h to induce HIF-1. Western blot wasused to detect HIF-1a protein levels in these clones. a-Tubulin wasused as an internal control. HeLa cell lysate was used as HIF-1aprotein positive control. (c) Densitometric analysis of the Westernblot. Values represent mean7s.d. of results from three independentsamples. *mCAT-treated group was statistically different from theuntreated group at the Po0.05 level
MnSOD suppresses HIF-1 and VEGFM Wang et al
8160
Oncogene
levels decreased significantly in Mn11 after the trans-duction of mCAT to a level of about 50% of theuntransduced cells (Figure 7c).
Adenoviral transduction of glutathione peroxidase-1increased GPx activity in MCF-7 Neo vector control cells
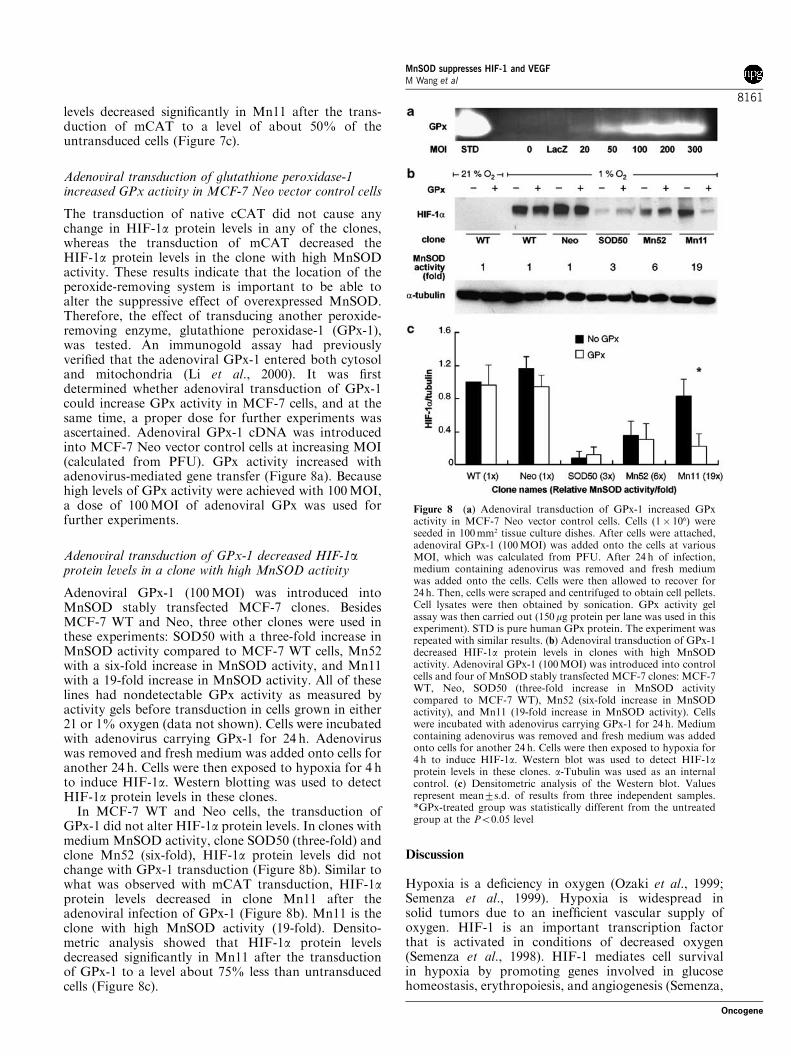
The transduction of native cCAT did not cause anychange in HIF-1a protein levels in any of the clones,whereas the transduction of mCAT decreased theHIF-1a protein levels in the clone with high MnSODactivity. These results indicate that the location of theperoxide-removing system is important to be able toalter the suppressive effect of overexpressed MnSOD.Therefore, the effect of transducing another peroxide-removing enzyme, glutathione peroxidase-1 (GPx-1),was tested. An immunogold assay had previouslyverified that the adenoviral GPx-1 entered both cytosoland mitochondria (Li et al., 2000). It was firstdetermined whether adenoviral transduction of GPx-1could increase GPx activity in MCF-7 cells, and at thesame time, a proper dose for further experiments wasascertained. Adenoviral GPx-1 cDNA was introducedinto MCF-7 Neo vector control cells at increasing MOI(calculated from PFU). GPx activity increased withadenovirus-mediated gene transfer (Figure 8a). Becausehigh levels of GPx activity were achieved with 100MOI,a dose of 100MOI of adenoviral GPx was used forfurther experiments.
Adenoviral transduction of GPx-1 decreased HIF-1aprotein levels in a clone with high MnSOD activity
Adenoviral GPx-1 (100MOI) was introduced intoMnSOD stably transfected MCF-7 clones. BesidesMCF-7 WT and Neo, three other clones were used inthese experiments: SOD50 with a three-fold increase inMnSOD activity compared to MCF-7 WT cells, Mn52with a six-fold increase in MnSOD activity, and Mn11with a 19-fold increase in MnSOD activity. All of theselines had nondetectable GPx activity as measured byactivity gels before transduction in cells grown in either21 or 1% oxygen (data not shown). Cells were incubatedwith adenovirus carrying GPx-1 for 24 h. Adenoviruswas removed and fresh medium was added onto cells foranother 24 h. Cells were then exposed to hypoxia for 4 hto induce HIF-1a. Western blotting was used to detectHIF-1a protein levels in these clones.In MCF-7 WT and Neo cells, the transduction of
GPx-1 did not alter HIF-1a protein levels. In clones withmedium MnSOD activity, clone SOD50 (three-fold) andclone Mn52 (six-fold), HIF-1a protein levels did notchange with GPx-1 transduction (Figure 8b). Similar towhat was observed with mCAT transduction, HIF-1aprotein levels decreased in clone Mn11 after theadenoviral infection of GPx-1 (Figure 8b). Mn11 is theclone with high MnSOD activity (19-fold). Densito-metric analysis showed that HIF-1a protein levelsdecreased significantly in Mn11 after the transductionof GPx-1 to a level about 75% less than untransducedcells (Figure 8c).
Discussion
Hypoxia is a deficiency in oxygen (Ozaki et al., 1999;Semenza et al., 1999). Hypoxia is widespread insolid tumors due to an inefficient vascular supply ofoxygen. HIF-1 is an important transcription factorthat is activated in conditions of decreased oxygen(Semenza et al., 1998). HIF-1 mediates cell survivalin hypoxia by promoting genes involved in glucosehomeostasis, erythropoiesis, and angiogenesis (Semenza,
Figure 8 (a) Adenoviral transduction of GPx-1 increased GPxactivity in MCF-7 Neo vector control cells. Cells (1� 106) wereseeded in 100mm2 tissue culture dishes. After cells were attached,adenoviral GPx-1 (100MOI) was added onto the cells at variousMOI, which was calculated from PFU. After 24 h of infection,medium containing adenovirus was removed and fresh mediumwas added onto the cells. Cells were then allowed to recover for24 h. Then, cells were scraped and centrifuged to obtain cell pellets.Cell lysates were then obtained by sonication. GPx activity gelassay was then carried out (150mg protein per lane was used in thisexperiment). STD is pure human GPx protein. The experiment wasrepeated with similar results. (b) Adenoviral transduction of GPx-1decreased HIF-1a protein levels in clones with high MnSODactivity. Adenoviral GPx-1 (100MOI) was introduced into controlcells and four of MnSOD stably transfected MCF-7 clones: MCF-7WT, Neo, SOD50 (three-fold increase in MnSOD activitycompared to MCF-7 WT), Mn52 (six-fold increase in MnSODactivity), and Mn11 (19-fold increase in MnSOD activity). Cellswere incubated with adenovirus carrying GPx-1 for 24 h. Mediumcontaining adenovirus was removed and fresh medium was addedonto cells for another 24 h. Cells were then exposed to hypoxia for4 h to induce HIF-1a. Western blot was used to detect HIF-1aprotein levels in these clones. a-Tubulin was used as an internalcontrol. (c) Densitometric analysis of the Western blot. Valuesrepresent mean7s.d. of results from three independent samples.*GPx-treated group was statistically different from the untreatedgroup at the Po0.05 level
MnSOD suppresses HIF-1 and VEGFM Wang et al
8161
Oncogene
1999). While normal tissue and benign breast tumorsdo not exhibit increased HIF-1 activity, evidencefor a graded increase in activity has been demonstratedin the progression from preneoplastic lesions to cancermetastases (Bos et al., 2001). Moreover, a positivecorrelation has been found between HIF-1 expressionand vascularization in brain tumors (Zagzag et al.,2000).As one of the HIF-1 downstream genes, VEGF is a
pivotal mitogen that mediates endothelial cell prolifera-tion and new vessel formation, a process known asangiogenesis. Hypoxic induction of VEGF is mediatedby HIF-1 (Forsythe et al., 1996).MnSOD is an important antioxidant enzyme involved
in cancer cell growth. A change in the level of MnSODenzyme activity will change the redox status of the celland affect the expression of redox-sensitive genes andproteins. HIF-1 is known to be a redox-sensitiveprotein, but the effect of MnSOD on HIF-1 expressionhas not been studied until the present work (Huanget al., 1996; Chandel et al., 2000; Kelley and Parsons,2001). It has been shown both in vitro and in vivo thattumor growth is suppressed with MnSOD overexpres-sion (Li et al., 1998a, b; Zhang et al., 1999). MnSOD hasbeen proposed as a tumor suppressor gene (Oberley andOberley, 1988; Bravard et al., 1992). MnSOD catalysesthe reaction 2O2
��þ 2Hþ-H2O2þO2. It is well ac-cepted that a change in MnSOD activity will result in achange in the steady-state level of superoxide (O2
��). Thefact that a moderate increase in MnSOD decreased theaccumulation of HIF-1a suggests an involvement ofsuperoxide. It has been observed that a moderateincrease in nitric oxide (NO�) decreased HIF-1aaccumulation (Mateo et al., 2003; Thomas et al.,2004). Because NO� reacts rapidly with O2
��, an increasein NO� will decrease the steady-state level of O2
��, similarto an increase in MnSOD activity. These observationssuggest that superoxide could modulate HIF-1a accu-mulation.However, a product of MnSOD enzymatic activity,
H2O2, is a highly diffusible molecule that moves freelyacross cell membranes. H2O2 also contributes to theredox environment of the cell (Oberley and Buettner,1979). Therefore, H2O2 may also be a link betweenMnSOD and HIF-1a. Both superoxide and H2O2 couldreact with the iron of HIF-prolyl hydroxylase, modulat-ing its activity and affecting the accumulation of HIF-1a. However, superoxide in general causes reduction ofiron, while H2O2 will oxidize it:
Fe3þ þO��2 ! Fe2þ þO2
Fe2þ þH2O2 ! Fe3þ þOH� þHO�
If Fe2þ is necessary for HIF-1a-prolyl hydroxylase (PH)activity, then superoxide radical should increase PHactivity, and H2O2 should decrease PH activity. Thus,superoxide radical should decrease the levels of HIF-1a,while H2O2 should increase the levels of HIF-1a. Ourdata as discussed below show just this for H2O2, but the
opposite for superoxide radical: the higher the SODlevels and thus the lower the levels of superoxide radical,the lower the levels of HIF-1a, until very high levels ofSOD are reached.We have shown here that MnSOD suppressed
hypoxic accumulation of HIF-1a protein, which led tolower levels of VEGF. Moderate levels of MnSODactivity (two- to six-fold increase compared to parentcells) in MCF-7 cells abolished the hypoxic accumula-tion of HIF-1a protein and the induction of VEGF.Surprisingly, higher levels of MnSOD allowed HIF-1aprotein accumulation, showing a biphasic modulationon HIF-1a accumulation. Interestingly, in these highMnSOD-overexpressing cells, HIF-1a never returned tovalues near those of the parent cells; in other words,HIF-1a was still suppressed relative to parent cellsand vector control. We hypothesize that elevationof MnSOD to moderate levels (physiological levelsfor most normal tissues; see Oberley et al., 1989) willlower the steady-state level of superoxide, which thenlowers HIF-1a levels. However, if MnSOD is increasedabove these levels, H2O2 could be a modulator. Anamount of peroxide may be produced that is above thelevels that the endogenous peroxide-removing capabil-ities of the cell can accommodate. Too much H2O2 thenleads to inhibition of HIF-1a degradation and HIF-1aaccumulates. As mentioned above, this effect of highMnSOD could be due to oxidation of iron, removingthe required Fe2þ and also producing the damaginghydroxyl radical.It is well accepted that increasing SOD levels lowers
the steady-state levels of superoxide radicals, but there isstill controversy over whether the levels of H2O2increase (Omar and McCord, 1990; Li et al., 2000).We have argued that in cells, H2O2 levels must increaseafter increases in MnSOD based on three observations:(1) after stable overexpression of MnSOD, in manyclones either CAT or GPx levels are found to increasealso (Liu et al., 1997; Zhong et al., 1997; Li et al.,1998b); (2) stable expression of either CAT (Rodriguezet al., 2000) or GPx (Li et al., 2000) modulates theeffects of MnSOD overexpression; and (3) assays ofeither intracellular (Zhang et al., 2002) or extracellularH2O2 (Wenk et al., 1999) concentrations show increasesafter MnSOD overexpression. The problem with themeasurements of H2O2 is that the extracellular measure-ments are quite specific, but it is unclear where theH2O2 is coming from, and the intracellular measure-ments are made with nonspecific assays. We havemeasured both intracellular and extracellular H2O2 inthe cells used in the present work. Using dihydrofluor-escein diacetate, we found that fluorescence increasedin the stable MnSOD-overexpressing MCF-7 cell linesas the MnSOD activity increased (Zhang et al., 2002).The fluorescence was most likely due to intracellularH2O2 since it was blocked by adenoviral CAT or GPxand by the GPx mimic ebselen (Zhang et al., 2002).Moreover, in the present study, we measured extra-cellular H2O2 in these cell lines and found that the levelsincreased with increasing MnSOD activity (data notshown). Thus, the levels of both intracellular and
MnSOD suppresses HIF-1 and VEGFM Wang et al
8162
Oncogene

extracellular H2O2 appear to increase as the MnSODlevels increase. The reason why H2O2 levels increaseafter MnSOD overexpression is still the subject ofintense study.Another possibility for the effecter of MnSOD over-
expression is molecular oxygen. MnSOD produces bothH2O2 and O2. Moreover, reduction of Fe
3þ by super-oxide also produces O2 as shown above. HIF-1adegradation ensues upon the hydroxylation of prolinesas accomplished by HIF-prolyl hydroxylase. Thisspecific prolyl hydroxylase requires 2-oxoglutarate,Fe2þ , ascorbate, and molecular oxygen for enzymaticactivity (Jaakkola et al., 2001; Kondo and Kaelin, 2001;Semenza, 2001a; Pugh and Ratcliffe, 2003b). All of thesecofactors can be found in mitochondria as well ascytoplasm. Thus, the oxygen produced by MnSOD isalso a possible effecter for the MnSOD suppressiveeffect we have observed. A mitochondrial localizationfor the effects we have observed is suggested because (1)MnSOD is known to be found in the mitochondria and(2) the induction of HIF-1 accumulation was blocked byCAT when it was found in mitochondria, but not bynative peroxisomal CAT.Our results are consistent with what we have observed
with tumor incidence and tumor growth in nude miceafter MnSOD overexpression (Zhang et al., 1999). Thatis, the incidence of tumors and growth of the tumorsthat do form decrease when MnSOD activity isincreased to a moderate level (o6-fold). However,MnSOD does not further suppress the tumor formationwhen its activity is increased to a higher level (>6-fold),and indeed some of the tumor suppression effect is lost(Zhang et al., 1999). This suggests that the in vivo tumorsuppressive function of MnSOD may be achieved by theinhibition of HIF-1 protein accumulation. By control-ling HIF-1 protein and thereby controlling the expres-sion of HIF-1 downstream genes that are involved intumor metabolism and growth, such as VEGF, MnSODmay control a switch for genes that allow tumor growthand progression. These results suggest that MnSODmay inhibit tumor angiogenesis and that part of thetumor suppressive effect seen in vivo may be due toinhibition of angiogenesis.In support of this proposal, Wheeler et al. (2003) have
shown that adenovirus transduction of SOD3 (extra-cellular SOD or ecSOD) inhibits the growth of B16melanoma cells in mice. At 2 weeks after implantation,B16 tumor size was 65% smaller in mice infected withAdecSOD in comparison with mice infected withAdlacZ. Tumors from AdecSOD-infected mice ex-pressed less VEGF protein. Importantly, blood vesseldensity as assessed by two different ways was markedlyreduced in tumors from AdecSOD-infected mice com-pared with controls. Wheeler et al. did not examine theeffects of MnSOD overexpression and did not determineif HIF-1 was involved. However, this study is consistentwith our findings of the dramatic effect of MnSODoverexpression on HIF-1a accumulation and VEGFexpression.Last, a strong inducer of MnSOD is TNF-a (Wong
et al., 1989). Therefore, one would expect that TNF-a
would induce MnSOD in certain cells, leading tolowered levels of HIF-1a and VEGF. Future work isneeded to investigate the role of cytokines in theregulation of this pathway.
Materials and methods
Cell culture
Human breast adenocarcinoma MCF-7 cells were routinelycultured in Eagle’s MEM containing 0.1mM nonessentialamino acids, 1mM sodium pyruvate, and 10% FBS, andincubated at 371C with 95% air and 5% CO2. MCF-7 clonesthat were stably transfected with MnSOD and Neo werecultured in the same medium supplemented with 400 mg/mlG418 (Life Technologies Inc.). The medium was generallychanged every 3–4 days.
Hypoxic treatment
Cells were seeded into 60mm tissue culture dishes (CorningScientific Products DIV, Acton, MA, USA) and the mediumwas replaced with fresh medium before hypoxic treatment. Thedishes were transferred to a modular incubator chamber(Billups-Rothenberg, Del Mar, CA, USA) that was flushedwith either 1% O2 (1% O2, 5% CO2 and balanced with N2) or4% O2 (4% O2, 5% CO2 and balanced with N2) for 4min at arate of 20 l/min, then sealed and placed at 371C. If longerincubation times were necessary, gas was replaced at 6 hintervals.
Adenovirus infection
Adenoviral MnSOD, adenoviral cCAT, and adenoviral GPxwere made originally in the laboratory of Dr John Engelhardt(Zwacka et al., 1998; Li et al., 2001) and were manufactured atThe University of Iowa’s Vector Core Facility or ViraquestInc. (North Liberty, IA, USA). The original AdGPx produceda product with a myc tag (Li et al., 2001), but in the presentwork the AdGPx was modified so that it produced a nativeGPx without a myc tag. The mCAT plasmid was obtainedfrom Dr Andres Melendez and was made into an adenovirusconstruct by Viraquest Inc. with the help of Dr ShawnFlanagan. For Western and activity gel analyses, MCF-7 cellswere plated into 60mm dishes at a density of 5� 105 cells/platein full media. The next day, adenovirus (prepared in 3%sucrose/phosphate-buffered saline (PBS)) was added to thecells containing 2ml of media in each dish. To the appropriatedishes, a dose of 1.25–200MOI of adenoviral constructs wasadded. The MOI for all experiments was calculated from PFU,which was determined by the Vector Core or Viraquest Inc.Following a 24 h incubation, the viral particles were removedand fresh medium was added. All infections were carried out at21% O2. Exposure to 1 and 4% O2 was carried out at 24 h afteradenoviral removal.
Adenoviral transduction efficiency
MCF-7 cells (2� 104) were plated into eight-well slides (Nunc)and allowed to attach overnight. Various titers of AdMnSOD(1.25–200MOI) or AdLacZ (200MOI) were added for 24 h.Media were changed at 24 h. Cells were fixed with 4%gluteraldehyde at 48 h. Cells were incubated with humanMnSOD primary antibody and goat anti-rabbit Alexa 488secondary antibody (Molecular Probes). The cell images werecaptured and analysed with Image J. A total of 500 cells wereanalysed for each MOI from three to four fields. The threshold
MnSOD suppresses HIF-1 and VEGFM Wang et al
8163
Oncogene

for positive fluorescent staining was set at half the maximalpixel intensity. All cells below the threshold were not scored.The number of positively stained cells divided by the totalnumber of cells was used to determine the percent immuno-fluorescence per sample.
Cell homogenization for SOD activity gel and SOD Westernblot
Cells were washed in PBS (KCl 2.7mM, KH2PO4 1.5mM,NaHPO4 8mM, and NaCl 136.9mM, pH 7.0), scrapeharvested, and pelleted at 12 000 g for 10 s in 1.5ml microfugetubes. The supernatant was removed and cells were resus-pended in 50mM phosphate buffer (PB, pH 7.8) and sonicatedon ice for 3� 30 s using a Vibra Cell cup horn sonicator(Sonics and Materials Inc., Danbury, CT, USA) at maximumpower. Protein concentration was estimated by the Bradfordmethod (Bio-Rad Laboratories, Hercules, CA, USA) andstandardized with bovine serum albumin.
Antioxidant protein activity gels
In this technique, nondissociating electrophoresis gels are run(Tulchin et al., 1976) with ammonium persulfate used as theinitiator in the running gel (12.5%) and riboflavin-light in thestacking gel (5%). Once run, the gels were stained for SODactivity (Beauchamp and Fridovich, 1971). The gels werestained for CAT or GPx activity according to a previouslypublished method (Sun et al., 1988).
MnSOD activity assay
SOD activities were determined using the modified nitrobluetetrazolium (NBT) method described earlier (Oberley andSpitz, 1984; Spitz and Oberley, 1989). The competitionreaction between SOD and the superoxide indicator molecule,NBT, is the basis of this indirect assay. Xanthine/xanthineoxidase was used to generate superoxide, the substrate ofSOD. Different amounts of total protein sample were addedto the reaction until the maximal inhibition of the reactionwas obtained as measured by a spectrophotometer at560 nm. Total SOD activity was determined by the amountof protein necessary for half-maximal inhibition of theNBT reaction. MnSOD activity was quantified in the presenceof 5mM sodium cyanide, which inhibits CuZnSOD activity.One unit of activity was defined as the concentration ofSOD that reduced the NBT reaction to one-half of themaximum.
SOD Western blot
The amount of immunoreactive MnSOD protein was mea-sured by Western blotting (Oberley et al., 1989). Briefly, cellhomogenates (30 mg) were processed by SDS–PAGE andtransferred to PVDF (Millipore Corporation, Bedford, MA,USA) membranes. The membrane was then probed with rabbitanti-MnSOD IgG (1 : 1000 dilution). The secondary antibodywas goat anti-rabbit IgG (Pharmingen/Transduction Labora-tories, San Diego, CA, USA) used at 1 : 5000 dilution. Blotswere visualized using Chemiluminescent Developer (Pierce,Rockford, IL, USA) and exposed to film. The bands wereexamined with a computerized digital imaging system usingAlphaImager 2000 software (Alpha Innotech, San Leandro,CA, USA). The integrated density values (IDV) were obtainedby integrating all of the pixel values in the area of one bandafter correction for background.
Protein harvest for HIF-1a Western blot
The medium was removed from tissue culture dishes. Afterrinsing twice with PBS, 100ml of boiling lysis buffer (1% SDS,1.0mM sodium orthovanadate, and 10mM Tris pH 7.4) wasadded to the cells. Cell lysates were then scraped andtransferred into microcentrifuge tubes and boiled for 5min.Protein concentrations were determined with the Bio-Rad DCprotein assay (Bio-Rad Laboratories, Hercules, CA, USA) asdescribed by the manufacturer.
HIF-1a Western blot
A 30mg portion of total protein was separated on a 4–20%gradient Tris-HCl polyacrylamide ready gel (Bio-Rad Labora-tories, Hercules, CA, USA). Then, the protein was electro-transferred onto a PVDF membrane (Millipore Corporation,Bedford, MA, USA) by running at 100V for 1 h. For HIF-1aWestern blot, the primary antibody was mouse anti-HIF-1aIgG (Pharmingen/Transduction Laboratories, San Diego, CA,USA) used at 1 : 2000 dilution. For a-tubulin Western blot, theprimary antibody was mouse anti-human a-tubulin (SantaCruz Biotechnology, Santa Cruz, CA, USA) used at 1 : 5000dilution. The secondary antibody used against both primaryantibodies was goat anti-mouse IgG (Pharmingen/Transduc-tion Laboratories, San Diego, CA, USA) used at 1 : 2000dilution. Blots were visualized using Chemiluminescent Devel-oper (Pierce, Rockford, IL, USA) and exposed to film. Thebands were examined with a computerized digital imagingsystem using AlphaImager 2000 software (Alpha Innotech,San Leandro, CA, USA). The IDV were obtained byintegrating all of the pixel values in the area of one band aftercorrection for background.
Semiquantitative RT–PCR analysis
Total RNA was extracted by the Qiagen RNeasy kit (QiagenInc., Valencia, CA, USA) as recommended by the manufac-turer. RT–PCR was carried out using a Qiagen One-StepRT–PCR kit (Qiagen, Valencia, CA, USA) according to themanufacturer’s recommendation. The RT–PCR product waselectrophoresed on a 1% agarose gel.
Analysis of VEGF-A expression using quantitative real-timeRT–PCR
The isolated RNA was reverse transcribed using the cDNAHigh-Capacity Archive kit according to the manufacturer’sprotocol (Applied Biosystems, Foster City, CA, USA). Quanti-tative real-time RT–PCR was performed on an ABI PRISM7000 (Applied Biosystems, Foster City, CA, USA) using theTaqMan PCR master mix (Applied Biosystems, Foster City,CA, USA) . Primers for amplification of VEGF-A cDNA weredesigned using Primer Express (ABI) and were 50-CTC TACCTC CAC CAT GCC AAG-30 (forward) and 50-AGA CATCCA TGA ACT TCA CCA CTT C-30 (reverse) and wereobtained from IDT Inc. (Coralville, IA, USA). The PCRreactions were performed in 50ml volumes containing 150ngcDNA, 270nM of forward and reverse primers for VEGF-A,0.09mM fluorescent VEGF-A probe (IDT Inc.), and 2x-TaqManPCR master mix. The PCR sequential thermal cycling profilewas as follows: 951C for 10min followed by 40 cycles of 951Cfor 15 s with a final extension of 601C for 1 h. Sinceamplification products were detected using TaqMan, dissocia-tion curves were performed to verify specificity of the productsformed during PCR (data not shown). 18S rRNA was measuredusing the SYBR Green PCR master mix (ABI) and theexpression level of VEGF-A was normalized to 18S rRNA.
MnSOD suppresses HIF-1 and VEGFM Wang et al
8164
Oncogene
H2O2 measurement
The concentrations of H2O2 were determined with the AmplexRed Hydrogen Peroxide/Peroxidase Assay Kit (MolecularProbes, Eugene, OR, USA). MCF-7 WT and other clones wereexposed to hypoxia (1% O2) for 0.5, 1, and 2 h. Right afterhypoxic exposure, PB on the cells was collected and theconcentration of H2O2 was determined by measuring resorufinwith absorbance at B560 nm. Cells that were exposed tononhypoxia (21% O2) for the corresponding times were usedas controls.
Statistics
Pearson’s regression and correlation analysis were used todetermine the relationship between the MnSOD activities andHIF-1a protein levels. The R2 and P-value were calculatedusing Microsoft Excel software. Student’s t-test for twosamples assuming equal variance was used for the comparisonof HIF-1a and VEGF protein levels between MCF-7 WT cellsand MnSOD-transfected clones, and for the comparison ofHIF-1a protein levels after the transduction of GPx-1, cCAT,
mCAT, or AT treatment. To estimate statistical difference inthe induction of VEGF in WT cells with time, one-wayANOVA with Bonferroni correction was performed using theSAS software program.
AbbreviationsHIF-1, hypoxia-inducible factor-1; MnSOD, manganesesuperoxide dismutase; MOI, multiplicity of infection; NBT,nitroblue tetrazolium; ROS, reactive oxygen species; VEGF,vascular endothelial growth factor; VHL, von Hippel–Lindau.
AcknowledgementsWe thank Dr Douglas Trask for generously giving us theVEGF-A primers. We thank Ms Kellie B Goranson for herexcellent editorial assistance. This research was supported by aUniversity of Iowa Carver Trust Medical Research InitiativeGrant and NIH Grants CA66081 and CA81090. MW waspartially supported by a Department of Defense predoctoraltraineeship award from the Breast Cancer Research Program(DAMD17-02-1-0425).
References
Bai J, Rodriguez AM, Melendez JA and Cederbaum AI.(1999). J. Biol. Chem., 274, 26217–26224.
Beauchamp C and Fridovich I. (1971). Anal. Biochem., 44,276–287.
Bos R, Zhong H, Hanrahan CF, Mommers EC, Semenza GL,Pinedo HM, Abeloff MD, Simons JW, van Diest PJ and vander Wall E. (2001). J. Natl. Cancer Inst., 93, 309–314.
Bravard A, Sabatier L, Hoffschir F, Ricoul M, Luccioni C andDutrillaux B. (1992). Int. J. Cancer, 51, 476–480.
Brown LF, Detmar M, Claffey K, Nagy JA, Feng D, DvorakAM and Dvorak HF. (1997). Exs, 79, 233–269.
Bruick RK and McKnight SL. (2001). Science, 294,
1337–1340.Chandel NS, McClintock DS, Feliciano CE, Wood TM,Melendez JA, Rodriguez AM and Schumacker PT. (2000).J. Biol. Chem., 275, 25130–25138.
Collingridge DR, Young WK, Vojnovic B, Wardman P,Lynch EM, Hill SA and Chaplin DJ. (1997). Radiat. Res.,147, 329–334.
Darr D and Fridovich I. (1986). Biochem. Pharmacol., 35,3642.
Dewhirst MW, Tso CY, Oliver R, Gustafson CS, Secomb TWand Gross JF. (1989). Int. J. Radiat. Oncol. Biol. Phys., 17,91–99.
Dvorak HF, Brown LF, Detmar M and Dvorak AM. (1995a).Am. J. Pathol., 146, 1029–1039.
Dvorak HF, Detmar M, Claffey KP, Nagy JA, van de Water Land Senger DR. (1995b). Int. Arch. Allergy Immunol., 107,233–235.
Forsythe JA, Jiang BH, Iyer NV, Agani F, Leung SW,Koos RD and Semenza GL. (1996). Mol. Cell. Biol., 16,4604–4613.
Hockel M, Schlenger K, Aral B, Mitze M, Schaffer U andVaupel P. (1996). Cancer Res., 56, 4509–4515.
Huang LE, Arany Z, Livingston DM and Bunn HF. (1996).J. Biol. Chem., 271, 32253–32259.
Jaakkola P, Mole DR, Tian YM, Wilson MI, Gielbert J,Gaskell SJ, Kriegsheim A, Hebestreit HF, Mukherji M,Schofield CJ, Maxwell PH, Pugh CW and Ratcliffe PJ.(2001). Science, 292, 468–472.
Jiang B-H, Semenza GL, Bauer C and Marti HH. (1996). Am.J. Physiol., 271, C1172–C1180.
Kelley MR and Parsons SH. (2001). Antioxid. Redox. Signal.,3, 671–683.
Kim KW, Choi KS, Bae MK, Jeong JW and Moon HE.(2003). J. Biochem. Mol. Biol., 36, 120–127.
Kondo K and Kaelin Jr WG. (2001). Exp. Cell Res., 264,117–125.
Li JJ, Oberley LW, Fan M and Colburn NH. (1998a). FASEBJ., 12, 1713–1723.
Li N, Oberley TD, Oberley LW and Zhong W. (1998b).Prostate, 35, 221–233.
Li Q, Sanlioglu S, Li S, Ritchie T, Oberley LW and EngelhardtJF. (2001). Antioxid. Redox. Signal., 3, 415–432.
Li S, Yan T, Yang J-Q, Oberley TD and Oberley LW. (2000).Cancer Res., 60, 3927–3939.
Liu R, Oberley TD and Oberley LW. (1997). Hum. Gene Ther.,8, 585–595.
Liu Y, Cox SR, Morita T and Kourembanas S. (1995). Circ.Res., 77, 638–643.
Mateo J, Garcia-Lecea M, Cadenas S, Hernandez C andMoncada S. (2003). Biochem. J., 376, 537–544.
Maxwell PH, Wiesener MS, Chang GW, Clifford SC, VauxEC, Cockman ME, Wykoff CC, Pugh CW, Maher ER andRatcliffe PJ. (1999). Nature, 399, 271–275.
McNeill LA, Hewitson KS, Gleadle JM, Horsfall LE, OldhamNJ, Maxwell PH, Pugh CW, Ratcliffe PJ and Schofield CJ.(2002). Bioorg. Med. Chem. Lett., 12, 1547–1550.
Moulder JE and Martin DF. (1984). Radiat. Res., 98, 536–548.Nagy JA, Vasile E, Feng D, Sundberg C, Brown LF, DetmarMJ, Lawitts JA, Benjamin L, Tan X, Manseau EJ, DvorakAM and Dvorak HF. (2002). J. Exp. Med., 196, 1497–1506.
Nakamura H, Nakamura K and Yodoi J. (1997). Annu. Rev.Immunol., 15, 351–369.
Oberley LW and Buettner GR. (1979). Cancer Res., 39,
1141–1149.Oberley LW, McCormick ML, Sierra-Rivera E and Kasemset-St Clair D. (1989). Free Radic. Biol. Med., 6, 379–384.
Oberley LW and Oberley TD. (1988). Mol. Cell. Biochem., 84,147–153.
Oberley LW and Spitz DR. (1984). Methods Enzymol., 105,457–464.
Omar BA and McCord JM. (1990). Free Radic. Biol. Med., 9,473–478.
MnSOD suppresses HIF-1 and VEGFM Wang et al
8165
Oncogene
Ozaki H, Yu AY, Della N, Ozaki K, Luna JD, Yamada H,Hackett SF, Okamoto N, Zack DJ, Semenza GL andCampochiaro PA. (1999). Invest. Ophthalmol. Vis. Sci., 40,182–189.
Park JH, Kim TY, Jong HS, Chun YS, Park JW, Lee CT, JungHC, Kim NK and Bang YJ. (2003). Clin. Cancer Res., 9,433–440.
Powis G, Gasdaska JR and Baker A. (1997). Adv. Pharmacol.,38, 329–359.
Pugh CW and Ratcliffe PJ. (2003a). Nat. Med., 9, 677–684.Pugh CW and Ratcliffe PJ. (2003b). Semin. Cancer Biol., 13,83–89.
Rodriguez AM, Carrico PM, Mazurkiewicz JE and MelendezJA. (2000). Free Radic. Biol. Med., 29, 801–813.
Salceda S and Caro J. (1997). J. Biol. Chem., 272, 22642–22647.
Schafer FQ and Buettner GR. (2001). Free Radic. Biol. Med.,30, 1191–1212.
Schroedl C, McClintock DS, Budinger GR and Chandel NS.(2002). Am. J. Physiol. Lung Cell. Mol. Physiol., 283,L922–L931.
Semenza GL. (1999). Annu. Rev. Cell Dev. Biol., 15, 551–578.Semenza GL. (2000). Crit. Rev. Biochem. Mol. Biol., 35, 71–103.Semenza GL. (2001a). Cell, 107, 1–3.Semenza GL. (2001b). J. Clin. Invest., 108, 39–40.Semenza GL, Agani F, Iyer N, Jiang BH, Leung S, Wiener Cand Yu A. (1998). Chest, 114, 40S–45S.
Semenza GL, Agani F, Iyer N, Kotch L, Laughner E, Leung Sand Yu A. (1999). Ann. NY Acad. Sci., 874, 262–268.
Shah-Yukich AA and Nelson AC. (1988). Lab. Invest., 58,236–244.
Spitz DR and Oberley LW. (1989). Anal. Biochem., 179, 8–18,1989.
Sun Y, Elwell JH and Oberley LW. (1988). Free Radic. Res.Commun., 5, 67–75.
Suzuki YJ, Forman HJ and Sevanian A. (1997). Free Radic.Biol. Med., 22, 269–285.
Thomas D, Espey M, Ridnour L, Hofseth LJ, Mancardi D,Harnu CC and Wink DA. (2004). Proc. Natl. Acad. Sci.USA, 101, 8894–8899.
Tulchin N, Ornstein L and Davis BJ. (1976). Anal. Biochem.,72, 485–490.
Wang GL and Semenza GL. (1993a). J. Biol. Chem., 268,21513–21518.
Wang GL and Semenza GL. (1993b). Proc. Natl. Acad. Sci.USA, 90, 4304–4308.
Wenk J, Brenneisen P, Wlaschek M, Poswig A, Briviba K,Oberley TD and Scharffetter-Kochanek K. (1999). J. Biol.Chem., 274, 25869–25876.
Wong GHW, Elwell JH, Oberley LW and Goeddel DV.(1989). Cell, 58, 923–931.
Wheeler MD, Smutney OM and Samulski RJ. (2003). Mol.Cancer Res., 1, 871–881.
Zagzag D, Zhong H, Scalzitti JM, Laughner E,Simons JW and Semenza GL. (2000). Cancer, 88,
2606–2618.Zhang HJ, Yan T, Oberley TD and Oberley LW. (1999).
Cancer Res., 59, 6276–6283.Zhang HJ, Zhao W, Venkataraman S, Robbins MEC,Buettner GR, Kregel K and Oberley LW. (2002). J. Biol.Chem., 277, 20919–20926.
Zhong W, Oberley LW, Oberley TD and StClair DK. (1997).Oncogene, 14, 481–490.
Zwacka RM, Zhou W, Zhang Y, Darby CJ, Dudus L,Halldorson J, Oberley L and Engelhardt JF. (1998). Nat.Med., 4, 698–704.
MnSOD suppresses HIF-1 and VEGFM Wang et al
8166
Oncogene