OVERALL HEAT TRANSFER COEFFICIENT OF R407C/HC290/HC600a REFRIGERANT MIXTURE FLOWING THROUGH A...
13
OVERALL HEAT TRANSFER COEFFICIENT OF R407C/HC290/HC600a REFRIGERANT MIXTURE FLOWING THROUGH A FIN-AND-TUBE EVAPORATOR MARIA HERBERT RAJ * ,‡ , DHASAN MOHAN LAL * ,§ and SURESH PREMIL KUMAR †,¶ * Refrigeration and Air-Conditioning Division Department of Mechanical Engineering College of Engineering Guindy Anna University, Sardar Patel Road, Guindy Chennai 600 025, Tamil Nadu, India † Annai Vailankanni College of Engineering AVK Nagar, Pothaiyadi Salai, Azhagappapuram P. O, K. K. District 629 401, Tamil Nadu, India ‡ [email protected] § [email protected] ¶ sureshpremil@rediffmail.com Received 9 August 2012 Accepted 24 January 2013 Published 1 March 2013 R22 has been used as a refrigerant in residential air-conditioners and heat pumps for many decades. Even as the Montreal protocol set the phasing out of R22 due to its ODP, many alternatives to R22 are found in published literature. The M20 refrigerant mixture is one such alternative with speci¯c advantages. This paper presents the heat transfer characteristics of the M20 refrigerant mixture, °owing through a ¯n-and-tube evaporator, experimentally studied in an appliance tested in a psychrometric test facility. The experimental setup consisted of a window air-conditioner ¯xed in a psychrometric room with instruments to measure the temperatures/ pressures of the refrigerant and mass °ow rate of the refrigerant as well as air. The experiment was carried out in accordance with the Bureau of Indian Standards (BIS) and American Society of Heating Refrigerating Air-Conditioning Engineers (ASHRAE) test conditions. M20 being con- sidered as an alternative for R22, the overall heat transfer coe±cient of the M20 refrigerant mixture has been evaluated, and compared with that of R22. It can be observed that the heat transfer coe±cient of R22 is better than that of the M20 refrigerant mixture, for the prevailing °ow conditions in the evaporator. The reduction in the overall heat transfer coe±cient of the M20 refrigerant mixture as compared to R22, ranges from 7.3% to 20.7%. Keywords : Overall heat transfer coe±cient; refrigerant mixture; ¯n-and-tube evaporator. International Journal of Air-Conditioning and Refrigeration Vol. 21, No. 1 (2013) 1350003 (13 pages) © World Scienti¯c Publishing Company DOI: 10.1142/S201013251350003X 1350003-1
Transcript of OVERALL HEAT TRANSFER COEFFICIENT OF R407C/HC290/HC600a REFRIGERANT MIXTURE FLOWING THROUGH A...

OVERALL HEAT TRANSFER COEFFICIENTOF R407C/HC290/HC600a REFRIGERANT
MIXTURE FLOWING THROUGHA FIN-AND-TUBE EVAPORATOR
MARIA HERBERT RAJ*,‡, DHASAN MOHAN LAL*,§
and SURESH PREMIL KUMAR†,¶
*Refrigeration and Air-Conditioning DivisionDepartment of Mechanical Engineering
College of Engineering GuindyAnna University, Sardar Patel Road, Guindy
Chennai 600 025, Tamil Nadu, India†Annai Vailankanni College of Engineering
AVK Nagar, Pothaiyadi Salai, AzhagappapuramP. O, K. K. District 629 401, Tamil Nadu, India
‡[email protected]§[email protected]
Received 9 August 2012
Accepted 24 January 2013
Published 1 March 2013
R22 has been used as a refrigerant in residential air-conditioners and heat pumps for manydecades. Even as the Montreal protocol set the phasing out of R22 due to its ODP, manyalternatives to R22 are found in published literature. The M20 refrigerant mixture is one suchalternative with speci¯c advantages. This paper presents the heat transfer characteristics of theM20 refrigerant mixture, °owing through a ¯n-and-tube evaporator, experimentally studied in anappliance tested in a psychrometric test facility. The experimental setup consisted of a windowair-conditioner ¯xed in a psychrometric room with instruments to measure the temperatures/pressures of the refrigerant and mass °ow rate of the refrigerant as well as air. The experiment wascarried out in accordance with the Bureau of Indian Standards (BIS) and American Society ofHeating Refrigerating Air-Conditioning Engineers (ASHRAE) test conditions. M20 being con-sidered as an alternative for R22, the overall heat transfer coe±cient of the M20 refrigerantmixture has been evaluated, and compared with that of R22. It can be observed that the heattransfer coe±cient of R22 is better than that of the M20 refrigerant mixture, for the prevailing°ow conditions in the evaporator. The reduction in the overall heat transfer coe±cient of the M20refrigerant mixture as compared to R22, ranges from 7.3% to 20.7%.
Keywords: Overall heat transfer coe±cient; refrigerant mixture; ¯n-and-tube evaporator.
International Journal of Air-Conditioning and RefrigerationVol. 21, No. 1 (2013) 1350003 (13 pages)© World Scienti¯c Publishing CompanyDOI: 10.1142/S201013251350003X
1350003-1

Nomenclature
ASHRAE :American Society of Heating RefrigeratingAir-Conditioning Engineers
BIS : Bureau of Indian StandardsCH :Capillary header
COP :Coe±cient of performanceDBT :Dry bulb temperatureDT :Domestic capacity rating test condition
DTM :Domestic maximum operating test conditionsETA :Export test A capacity rating test condition
ETAM :Export test A maximum operating test conditionETB :Export test B capacity rating test conditionHTC :Heat transfer coe±cientHFC :Hydro°urocarbon
k :Thermal conductivityLMTD :Logarithmic mean temperature di®erence
LR : Liquid receiverm :mass °ow rate
MFM :Mass °ow meterODP :Ozone depleting potential
P : PressurePOE :Polyol esterPT :Process tubeQ :Heat transfer rate
Ref : RefrigerantRTD :Resistance temperature detectorSG : Sight glassT :Temperature
TA :ASHRAE Test ATB :ASHRAE Test BU :Overall heat transfer coe±cient
VFD :Variable frequency driveWBT :Wet bulb temperature
Subscript
a : airave : Average
DBT :Dry bulb temperaturee : evaporatori : Refrigerant side
lm : LMTDr : Refrigeranto : Outerw :Wall
WBT :Wet bulb temperature
1. Introduction
R22 is largely employed in the industrial refrigera-tion ¯eld, residential air-conditioning and heatpumps and although it has a low Ozone depletingpotential (ODP) (0.055), it is necessary to considerthe large amount of R22 that commonly escapes
from commercial and domestic units into the at-mosphere. Among the new refrigerants, the onecurrently accepted to replace R22 is R407C, which isa zeotropic mixture of R32, R125 and R134a (23%,25% and 52% by wt.), because it is believed tobe environmentally acceptable with zero ODP.R407Cs' main thermodynamic properties are veryclose to those of R22, allowing the utilization of thismixture in the place of R22, even though R407C'sperformance was slightly lower than that of R22.1,2
But as hydro-°urocarbons (HFCs) are immisciblewith conventional mineral oil, polyol ester (POE)oils are used in the compressor instead of mineral oil.But POE is highly hygroscopic in nature, and willcause adverse e®ects in the system.
Published literature indicates that the addition ofhydrocarbons will overcome the miscibility problemof the HFC refrigerants with mineral oil. Sekharet al.5,6 conducted a performance study on a domesticrefrigerator attached with a secondary refrigerantcalorimeter, a bottle cooler and a walk-in-cooler withR134a/R290/R600a as a substitute for R12. Fromthe study it was found, that the addition of 9% HCblend (R290:R600a¼ 45.2:54.8 by mass) to R134a,could solve the miscibility problem of R134a withmineral oil. It was observed that the R134a/R290/R600a refrigerant system's performance was betterthan that of the R12 system.
Jabaraj et al.3 conducted a study to identify thepossibility of using HFC407C/HC290/HC600a re-frigerant mixture as a substitute for R22 in a windowair-conditioner, with mineral oil as the lubricant. Itwas concluded that the Coe±cient of performance(COP) of M20 (R407C 80% and HC blend 20%) wasbetter than that of R22. Jabaraj et al.4 also reportedthat M20 could be a viable alternative, since, it had9.5�12.7% higher refrigerating capacity, and 11.9%to 13.2% higher actual COP than that of R22.The per day energy consumption was 4.8% to 9.5%lower, and the pull down time was 32.5% shorterthan that of R22. However, it is to be noted thatthese results were obtained with 19% increasedcondenser length, when charged with M20. Further,Herbert and Mohan Lal5 conducted a study, usingM20 refrigerant mixture for its applicability in awindow air-conditioner, without any system modi-¯cation, and concluded that M20 refrigerant mix-ture could be used in an existing system without anymodi¯cation in the condenser. It was also reportedthat under retro¯tted condition, the M20 refrigerantmixture could be used in the existing system, even
M. Herbert Raj, D. Mohan Lal & S. Premil Kumar
1350003-2

though its performance was about 10% lower thanthat of R22, which alleviates the POE oil problemwith R407C.
In the past decades, the evaporation of the pureand mixed refrigerant had been studied, bothexperimentally and analytically, inside the tube-in-tube horizontal and vertical tubes, by a large num-ber of researchers. A large number of correlationshave been proposed based on the experimental data,to predict the heat transfer coe±cient in forced con-vective boiling for pure and refrigerant mixtures.6�11
Even though, many experimental studies have beencarried out for the evaporation of CFCs and HCFCs,little data is available for the new HFCs.
Plate type ¯n-and-tube heat exchangers aremostly employed in air-conditioners, heat pumps,etc. During the past few decades, many researchworks have been carried out on the air-side perfor-mance of the ¯n-and-tube evaporator, and the heattransfer/friction characteristics of the ¯n-and-tubeevaporator with di®erent ¯n con¯gurations wereanalyzed.14�17 Based on the experimental database,the heat transfer and friction correlations wereevolved for the air-side. The determined evaporativeheat transfer coe±cients and correlations to predictthe heat transfer coe±cient of the refrigerant °ow-ing through the ¯n-and-tube heat exchangers withplain, wavy or louvered ¯ns, are very limited in openliterature.
Horuz18 investigated theoretically and experi-mentally, the parameters a®ecting the coolingcapacity and overall heat transfer coe±cient of a ¯n-and-tube heat exchanger, using R717, R22, R502,R134a and R12 refrigerants. The air velocity, ¯nspacing, tube diameter, evaporator temperature,refrigerant type and frost height were varied duringthe experimentation. It was concluded that the the-oretical heat transfer coe±cients were 15% to 30%higher than those of the experimental data. It wasproved that the heat transfer rate varied more withthe variation of the airmass °ow rate passing throughthe evaporator coils. Somchai et al.19 studied the two-phase heat transfer coe±cient of R134a, evaporatinginside a plate ¯n-and-tube evaporator, with plain ¯ngeometry. The experiments were conducted at theaverage saturated refrigerant temperatures of 4:0�Cto 9:0�C for evaporation, and 39:0�C to 45:0�C forcondensation. During experimentation, the volu-metric °ow rate of air passing through the evaporatorwas varied between 0.25m3 s�1 and 0.5m3 s�1 for theevaporator and between 0.7m3 s�1 and 1.25m3 s�1
for the condenser. For practical applications, a newcorrelation was proposed, based on the experimentaldata, and the predicted results were compared withthe existing correlations.
The usual approach to the design of a heat ex-changer is to estimate an average heat transfer co-e±cient for the °uids on each side of the heatexchanger and calculate an overall heat transfercoe±cient. The average heat transfer coe±cient forthe °uids can be obtained by any one availablecorrelation with varying degrees of accuracy levels.New alternative refrigerants provide an additionaldi±culty in predicting the heat transfer and °uidperformance, because there is a lack of experimentaldata available, with which to validate the existingcorrelations. The knowledge of the overall heattransfer coe±cient is of prime importance, to opti-mise the design of heat exchangers for refrigerationand air conditioning applications, when M20 is usedinstead of R22. When charged in window air-con-ditioners the M20 refrigerant mixture's °ow rate ispractically governed by the rating of the systemcomponents, the thermo physical properties of therefrigerant, and the operating conditions of thesystem. The °ow rate is one of the main parameters,which decides the heat transfer characteristics of thesystem.
The objective of the present study is to conductexperiments to analyze the heat transfer character-istics of a residential 1.5 TR window air-conditionerunder di®erent operating conditions, using the M20refrigerant in a retro¯tted condition. The experi-mentally determined overall heat transfer coe±cientof M20 is compared with that of R22, charged in thesame window air-conditioners. Hence, the study hasbeen made in a window air-conditioner, operated inaccordance with the performance test conditionsprescribed in BIS20 and ASHRAE.21 This would givean understanding of the reason behind the perfor-mance variation in the R22 system, when retro¯ttedwith M20.
2. Experimentation
The experimental facility consists mainly of thepsychometric test room, and the unit under testsuitably instrumented to conduct the heat transfercharacteristic's study. An experimental set-up wasconstructed as shown in Fig. 1, that would facilitatethe study of the heat transfer characteristics of awindow air-conditioner, in various indoor and
Heat Transfer Characteristics of M20 Refrigerant Mixture Flowing Through Fin-and-Tube Evaporator
1350003-3
outdoor conditions, in accordance with di®erentstandards (BIS and ASHRAE).
The psychometric room consists of two adjacentchambers, to maintain indoor and outdoor condi-tions respectively. Both the rooms have separateAHUs with a cooling coil (Dehumidi¯er), air heaterand steam injection facility (Humidi¯er), which arecontrolled/modulated by a suitable feedback controlsystem, to maintain the required indoor and outdoortest conditions mentioned in Table 1. The facilityhas been designed to maintain individual tempera-ture readings within the tolerance prescribed in BIS-1391-199220 and ASHRAE-116-199521 standards(�0:5�C for dry bulb temperatures (DBT) and�0:3�C for wet bulb temperatures (WBT)). Sixtemperature sensors (DBT) were strategicallylocated in each room, to con¯rm the uniformity inroom temperature (DBT) within �0:5�C.
To measure the supply air °ow rate from the unitunder test (UUT), a code tester is available in theindoor room. This code tester design is based on theASHRAE 41.2-198722 standard. The code testerconsists of a set of nozzles that can be suitably se-lected to allow the air to °ow through the selectednozzle. The pressure drop across the nozzle is mea-sured using a di®erential pressure transducer. Thereis an auxiliary blower driven with a Variable fre-quency drive (VFD), to maintain zero gauge pres-sure at the receiving chamber. This is done, so thatthe UUT does not experience any resistance tothrow the supply air, due to the upstream surginge®ect of the °ow through nozzle. The code tester wasconnected with a suitable leak proof duct to thesupply grill of the UUT. The air °ow rate was variedusing a selector switch, generally available in win-dow air-conditioner appliances.
Coo
ling
coil
Hea
ting
coil
Con
dens
er
Eva
pora
tor
Steam supply
Cooling coil
MFM
Indoor chamber
Capillary
Outdoor chamber
SG Drier Heating coil
Code Tester
Nozzle
Compressor
UUT
AHU AHU
Steam Supply Receiving
chamber
Part
ition
wal
l Fig. 1. Schematic diagram of experimental setup.
Table 1. Indoor and outdoor air temperatures as prescribed by the BIS and ASHRAEstandards.
Sl. No Test Type Indoor Outdoor
DBT [�C] WBT [�C] DBT [�C] WBT [�C]
1 BIS-DT Capacity rating 27 19 35 302 BIS-DT Maximum 35 24 46 273 BIS-ETA Capacity rating 27 19 35 244 BIS-ETA Maximum 32 23 43 265 BIS-ETB Capacity rating 29 19 46 246 ASHRAE Test-A 26.7 19.4 35 23.97 ASHRAE Test-B 26.7 19.4 27.8 18.3
M. Herbert Raj, D. Mohan Lal & S. Premil Kumar
1350003-4

In general, the mass velocity, heat °ux, inletquality and saturation temperature and pressure,are the major factors which a®ect the evaporativeheat transfer in all the heat exchangers. Thereviewed literature revealed that most of the heattransfer studies were carried out on a tube-in-tubeheat exchanger. In real appliances, the mass °owrate of the refrigerant, the evaporator pressure,evaporator heat °ux and vapor fraction of the re-frigerant at the entry and exit of evaporator, aredecided by the functioning of the compressor andpressure drop across the expansion device, whichare, in turn, decided by the indoor and outdoorconditions. Due to the above, in practical cases, theheat transfer coe±cient in a window air-conditioneris mainly a®ected by the evaporator and condenserinlet of the DBT/WBT. In this study, the indoorand outdoor DBT/WBT are varied in accordancewith the BIS-1391-199220 and ASHRAE-116-199521
standards, as given in Table 1, and the corre-sponding heat transfer characteristics of the evapo-rator are studied, with R22 and M20 as therefrigerants. The BIS standard considers the do-mestic conditions (including DBT and WBT) aswell as international climatic conditions (export testconditions). For summer air conditioning, the entirerange of DBT and WBT that globally prevail (allround the year), are by and large covered in thevarious test conditions prescribed by the BIS andASHRAE standards.
The unit under test was suitably modi¯ed toconnect the temperature sensors (resistance tem-perature detectors (RTDs) PT100-class A �0:15�Caccuracy) and pressure sensors (�0:1% accuracy)across each component. Hence, eight numbers ofpiezo-resistive pressure transmitters were connectedacross the system, to measure the pressure at theinlet of the evaporator/condenser and outlet of theevaporator/condenser. The accuracy of the pressuretransmitters is �0:1% and the output is 4�20mA.The mass °ow rate of the refrigerant was measuredby a Coriolis type mass °ow meter (�0:1% accura-cy) connected in the liquid line. All the entire °owlines along with the components were properly in-sulated to avoid heat in¯ltration. The evaporatorswith plain ¯n geometry are made from aluminumplate ¯nned, copper tubes. The external dimensionof the ¯n-and-tube evaporator is 410� 365� 90mm(height� width� depth). The outer diameter of thecopper tube is 9.52mm. Separate lengths ofcapillaries were used for R22 and M20. To optimize
the capillary length for M20, four lengths viz.0.8382, 0.762, 0.7112 and 0.6604m (1.6764mmdiameter) were ¯xed to a header. Separate handshuto® valves were used to select the required cap-illary, which is to be included in the circuit. Onesight glass was provided in the liquid line to checkthe condition of the condensed refrigerant in thecircuit. The supply and return air DBT/WBT aremeasured by two sets of RTDs (�0:15�C accuracyclass A), which are located in a ¯xture, and can bemoved up and down, as well as to the sides.
The ¯n-and-tube evaporator used for the heattransfer study has a parallel cross °ow staggeredtube arrangement. The air outlet temperatures aremeasured by inserting the RTDs between the rowsof the evaporator. Depending upon the step pitch,the RTDs are ¯xed on a rod, and the height of therod is equal to the height of the evaporator. In thistest, the wall temperature was measured in everytube at the start of the U-bend in the evaporator.Moreover, since the M20 refrigerant mixture iszeotropic, in every tube the wall temperatures weremeasured at the top, bottom, and sides, and theaverage of these four temperatures is considered asthe local wall temperature.
All the measured data are logged into a PCthrough a suitable data logging system. Once thesteady state condition is achieved, all the data willbe automatically logged in to the system. Thesteady state condition is manually con¯rmed bychecking the uniformity in temperature, indicatedby all the room temperature sensors in accordancewith the test conditions. After the stabilization ofthe indoor and outdoor air temperatures, refrigeranttemperatures and pressures at all points, the °owrates of the refrigerant and air were scanned andrecorded in the computer, through a data acquisi-tion system.
2.1. Experimental procedure
The heat transfer rate of the system was determinedin accordance with the BIS-1391-199220 and ASH-RAE-116-199521 test conditions for a residentialsized air conditioner. In the air enthalpy testmethod, the refrigerating capacity (heat transferrate) is determined from the di®erence in enthalpiesobtained against the DBT and WBT of the air en-tering and leaving the UUT, and the associated air°ow rate under speci¯ed test conditions. The massof air was calculated, using the measured pressure
Heat Transfer Characteristics of M20 Refrigerant Mixture Flowing Through Fin-and-Tube Evaporator
1350003-5
drop across the nozzle, and the DBT and WBT ofthe sample air in the code tester based on theASHRAE standard 41.2-1987.22 The refrigerant sidemeasurements were also taken to ensure that themaximum di®erence between the air side and re-frigerant side capacity was less than 6%, as pre-scribed in the standards. The properties ofrefrigerant were extracted from REFPROP 7.0.23
To have a realistic comparison of the heattransfer characteristics of the M20 refrigerant mix-ture with a conventional refrigerant, the experimentwas carried out initially with the conventionalrefrigerant R22. During experimentation with R22,both the capillary length as recommended by themanufacturer and the optimum charge quantity of1400 g were considered. The charge quantity of themixture required for the M20 system is not equal tothat of R22, as the speci¯c volume of M20 is di®er-ent. Jabaraj et al.3 have calculated the equivalentcharge quantity, based on the speci¯c volume ofM20 at the suction of the compressor, for domesticair conditioners. The same procedure is followed inthe present study for the calculation of the equiva-lent charge quantity. Considering the speci¯c vol-ume (REFPROP23) of the refrigerants, theequivalent quantity of R22 for 1 g of the R407C andHC blend is 1.037 g and 2.29 g, respectively.
Let `HFC' be the mass of R407C present in themixture, `HC' be the mass of HC blend in the mix-ture, `HCFC' be the R22 charge quantity in asystem, and `m' be the mass fraction of HC blend;then,
1:037HFCþ 2:29HC ¼HCFC ; ð1ÞHFC ¼ð1�m=mÞHC : ð2Þ
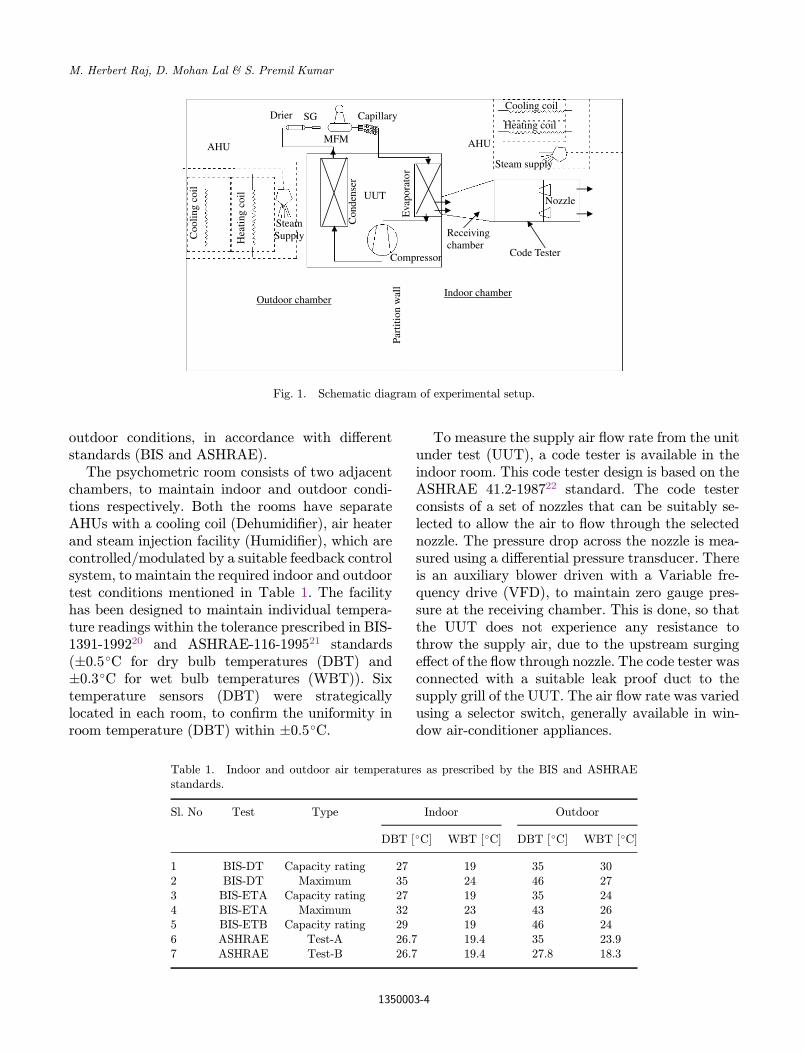
Using the above equations the mass of the R407Cand HC blend present in unit mass of M20 wascalculated. Before starting the experiment with themixture, it was prepared separately in a cylinder.The equivalent optimum charge quantity of 1201 gwas maintained for the M20 refrigerant mixture andthe capillary tube length was optimized for themaximum COP of the system at the BIS DT testcondition as given in Table 1. Figure 2 shows thevariation of the COP of the system with the capil-lary length, when M20 is charged. From Fig. 2 it isobserved, that the COP of the M20 refrigerantsystem attained the maximum for a capillary lengthof 0.7114m, and this has been selected for furtherstudy.
Before starting the experiment, the requiredquantity of mixture was prepared separately in acylinder. The equivalent charge quantity of themixture for 1400 g of R22 was obtained, along withthe mass of R407C and the HC blend, making use ofthe speci¯c volume ratios at suction conditions.Each mixture component was weighed individuallyin an electronic balance with an accuracy of �0:1 gand ¯lled in the cylinder with the help of a suitablecharging manifold. In the steady state the refriger-ant mass °ow rate, pressure, and temperature acrossthe evaporator, the DBT/WBT of the return as wellas the supply air, and mass °ow rate of air, weremeasured for various indoor and outdoor roomconditions, as given in Table 1. After completing allthe heat transfer characteristic tests with R22, therefrigerant was recovered, and the optimum chargequantity of the M20 mixture was charged. Thesame tests for the heat transfer characteristics wererepeated with M20.
2.2. Data Reduction
Once the indoor and outdoor chamber test condi-tions are reached, and the steady state conditionshave been achieved, the required parameters arescanned and recorded in the personnel computerthrough the data acquisition systems. The refriger-ant properties were evaluated, using the softwareREFPROP 7.0. The overall heat transfer coe±cient,U is calculated using Eq. (3).
Uo ¼Qa
FAo�Tlm
; ð3Þ
where �Tlm is the logarithmic mean temperaturedi®erence, Ao is the outside surface area and F is the
2.2
2.21
2.22
2.23
2.24
2.25
2.26
2.27
2.28
0.63 0.65 0.67 0.69 0.71 0.73 0.75 0.77 0.79 0.81 0.83 0.85 0.87
Capillary Length (m)
CO
P
Refrigerant - M20 Charge quantity -1201g Length - 0.7112 m Diameter - 0.00152m
Fig. 2. Variation of the COP of the system with capillarylength.
M. Herbert Raj, D. Mohan Lal & S. Premil Kumar
1350003-6
correction factor which is equal to 1,19 for this kindof ¯n-and-tube evaporator. The heat transfer ratefrom the air side is calculated, using the measuredDBT andWBT of the supply and return air, and thecalculated mass °ow rate of air,
Qa ¼ m:að�haÞ : ð4Þ
The LMTD was determined from the inlet and exittemperatures of the air and refrigerant °owingthrough the evaporator.
3. Results and Discussion
This section deals with the overall heat transfercoe±cients of R22 and the M20 refrigerant mixturein the evaporator of a window air-conditioner, op-erated under standard indoor and outdoor condi-tions. The experimental overall heat transfercoe±cients of R22 and the M20 refrigerant mixtureare compared. Experiments are performed in thetest conditions given in Table 1, using R22 and theM20 refrigerant mixture. The optimized capillaryand charge quantity are maintained during experi-mentation. Based on the measured parameters, viz.the mass °ow rate, the pressures and temperaturesacross the evaporator; the logarithmic mean tem-perature di®erence (LMTD), heat °ux and theoverall heat transfer coe±cients of R22 and the M20refrigerant mixture are calculated and compared.
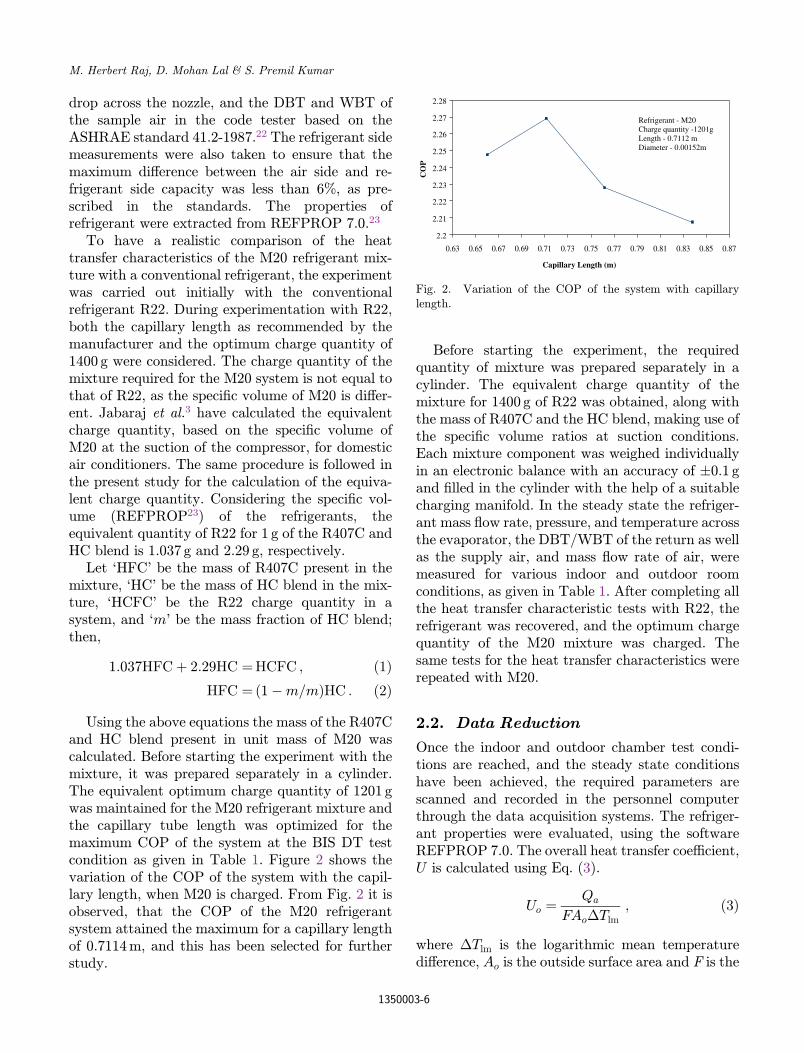
Figure 3 shows the refrigerant mass °ow rate ofR22 and the M20 refrigerant mixture under di®erentoperating conditions. The mass °ow rate of R22varies in the range of 91.8 kg h�1 to 110.4 kg h�1, butfor the M20 refrigerant mixture the mass °ow rate
varies in the range of 87.2 kg h�1 to 99.2 kg h�1. TheM20 refrigerant mass °ow rate is lower in the rangeof 5.0% to 11.3%, than that of R22. The lower mass°ow rate can be attributed to its higher speci¯cvolume as compared to R22, for which the com-pressor was originally designed. However, in spite ofthe low °ow rates received, the drop in the systemheat °ux (refrigerating capacity) is very marginal.
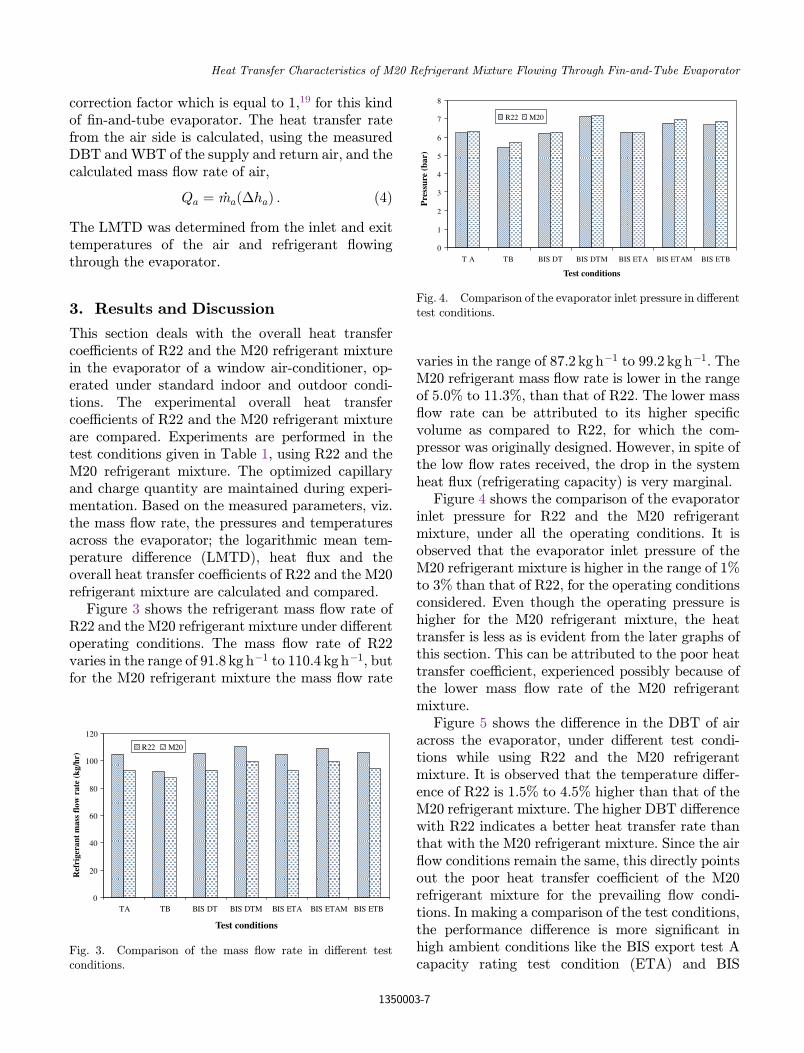
Figure 4 shows the comparison of the evaporatorinlet pressure for R22 and the M20 refrigerantmixture, under all the operating conditions. It isobserved that the evaporator inlet pressure of theM20 refrigerant mixture is higher in the range of 1%to 3% than that of R22, for the operating conditionsconsidered. Even though the operating pressure ishigher for the M20 refrigerant mixture, the heattransfer is less as is evident from the later graphs ofthis section. This can be attributed to the poor heattransfer coe±cient, experienced possibly because ofthe lower mass °ow rate of the M20 refrigerantmixture.
Figure 5 shows the di®erence in the DBT of airacross the evaporator, under di®erent test condi-tions while using R22 and the M20 refrigerantmixture. It is observed that the temperature di®er-ence of R22 is 1.5% to 4.5% higher than that of theM20 refrigerant mixture. The higher DBT di®erencewith R22 indicates a better heat transfer rate thanthat with the M20 refrigerant mixture. Since the air°ow conditions remain the same, this directly pointsout the poor heat transfer coe±cient of the M20refrigerant mixture for the prevailing °ow condi-tions. In making a comparison of the test conditions,the performance di®erence is more signi¯cant inhigh ambient conditions like the BIS export test Acapacity rating test condition (ETA) and BIS
0
20
40
60
80
100
120
TA TB BIS DT BIS DTM BIS ETA BIS ETAM BIS ETB
Test conditions
Ref
rige
rant
mas
s fl
ow r
ate
(kg/
hr)
R22 M20
Fig. 3. Comparison of the mass °ow rate in di®erent testconditions.
0
1
2
3
4
5
6
7
8
T A TB BIS DT BIS DTM BIS ETA BIS ETAM BIS ETB
Test conditions
Pre
ssur
e (b
ar)
R22 M20
Fig. 4. Comparison of the evaporator inlet pressure in di®erenttest conditions.
Heat Transfer Characteristics of M20 Refrigerant Mixture Flowing Through Fin-and-Tube Evaporator
1350003-7

export test B capacity rating test condition (ETB).However, the overall loss in the heat °ux is only lessthan 7%, as revealed in Fig. 10.
Figure 6 shows the di®erence in the WBT of airacross the evaporator, under di®erent test condi-tions, while using R22 and the M20 refrigerantmixture. It is observed that the WBT di®erencewith R22 is 2.9% to 12.7% higher than that with theM20 refrigerant mixture. This reduced drop in theWBT results in a lesser dehumidi¯cation e®ect, andin turn, the refrigerating e®ect also decreases. Dueto the temperature glide, the equilibrium tempera-ture of the M20 refrigerant mixture is continuouslyincreased from the inlet of the evaporator to theoutlet. Hence, the wall temperature of the M20 re-frigerant mixture does not remain the same as withR22. This has resulted in a decreased DBT andWBT di®erence, across the evaporator.
Figure 7 shows the comparison of the outer walltemperature (Two) with the number of tubes ina ¯n-and-tube evaporator, in the BIS domestic
capacity rating test condition (DT) operating con-ditions for R22 and the M20 refrigerant mixture.Since the trend remained the same irrespective ofthe test conditions, the BIS DT condition whichis the closest to the typical tropical weather, isconsidered for the discussion of the heat transfercoe±cient. Due to the temperature glide, the equi-librium temperature of the M20 refrigerant mixtureis continuously increased from the inlet of theevaporator to the outlet. Hence, the wall tempera-ture of the M20 refrigerant mixture does not remainthe same as with R22. It is observed that the mea-sured wall temperature of R22 is initially increasedin the ¯rst row, and slightly decreased in the secondand third rows. Moreover, the wall temperaturewith R22 is lower than that with the M20 refrigerantmixture. The lower wall temperature will o®er bet-ter DBT and WBT di®erences across the evapora-tor. Hence, a better heat transfer rate and heattransfer coe±cient can be expected with the R22refrigerant. The higher wall temperature with M20can be attributed to higher vapor fraction entry intothe evaporator and the temperature glide.
For R22 the saturation temperature decreasesalong the length, because of the pressure drop in thetube during boiling, but the temperature increasesat the outlet of the evaporator due to the super-heated condition. The interruption of the liquid ¯lmin an annular °ow is known as the dryout phe-nomenon, and it is attributed to the e®ect of evap-oration and hydrodynamic forces, that cause theentrainment of droplets from the liquid ¯lm. In heat°ux controlled systems, the beginning of dryout isaccompanied by a decrease in the heat transfer co-e±cient, and consequently, by an increase in thewall temperature.
0
1
2
3
4
5
6
7
8
9
TA TB BIS DT BIS DTM BIS ETA BIS ETAM BIS ETB
Test conditions
WB
T d
iffe
renc
e (o C
)
R22 M20
Fig. 6. Comparison of the di®erence in the WBT of air acrossthe evaporator under di®erent test conditions.
0
2
4
6
8
10
12
14
16
18
20
1 2 3 4 5 6 7 8 9 10 11 12 13 14 15 16 17 18 19 20 21 22 23 24
Tube number along the refrigerant flow path
Tem
pera
ture
(o C
)
Two_M20 Two_R22
Fig. 7. Comparison of the wall temperature distribution alongthe refrigerant °ow path.
11
11.5
12
12.5
13
13.5
14
TA TB BIS DT BIS DTM BIS ETA BIS ETAM BIS ETB
Test conditions
DB
T d
iffe
renc
e (o C
)
R22 M20
Fig. 5. Comparison of the di®erence in the DBT of air acrossthe evaporator under di®erent test conditions.
M. Herbert Raj, D. Mohan Lal & S. Premil Kumar
1350003-8

Figure 8 shows the comparison of the LMTD re-alized with R22 and the M20 refrigerant mixture inthe evaporator. The LMTD is higher with M20 asthe refrigerant. It is observed that the LMTD withM20 is 2.0% to 6.0% higher than that with R22. Thisis because of the glide experienced by the refriger-ant, leading to a small temperature di®erence be-tween the hot and cold °uid at the exit for a parallel
°ow con¯guration. However, in spite of the higherLMTD the heat °ux is lower, because of the highercoil temperature due to the temperature glide,leading to a lower drop in the WBT as well as theDBT. A lesser drop in the DBT and WBT indicatesa lesser latent heat removal, and a correspondingreduction in the heat °ux.
Figure 9 shows a comparison of the calculatedvapor fraction of R22 and the M20 refrigerantmixture under the various operating conditions. It isobserved that the vapor fraction of the M20 refrig-erant mixture that enters the evaporator is higherthan that of R22, under all the operating conditions.Generally, in the capillary tube the two phase °ow ismainly in°uenced by the liquid and vapor speci¯cvolumes. The degree of subcooling at the inlet to thecapillary also signi¯cantly in°uences the exit dry-ness fraction. In the case of the M20 refrigerantmixture, the temperature glide and the latent heatof condensation increase the condenser load, leadingto incomplete condensation as seen in Table 2.Hence, the entry to the capillary itself is in the two-phase region, which has been calculated by themeasured pressure and temperature at the outlet ofthe condenser.
This is re°ected as a higher dryness fraction atthe entry to the evaporator, as compared to the casewith R22. The liquid and vapor speci¯c volumes ofthe M20 refrigerant mixture are higher than those ofR22. Due to the absence of sub cooling and thehigher liquid and vapor speci¯c volumes of the M20refrigerant mixture, the vapor fraction at the entryof the evaporator is higher than that of R22. It is tobe recalled, that Jabaraj et al.3,4 have reportedbetter performance with M20 charge, because of the19% extra length envisaged in the condenser, whencharged with M20. Obviously, a larger condenser
4
5
6
7
8
9
10
T A T B BIS DT BIS DTM BIS ETA BIS ETAM BIS ETB
Test conditions
LM
TD
(o C
)
R22 M20
Fig. 8. Comparison of the calculated LMTD of R22 and M20.
0
0.1
0.2
0.3
0.4
0.5
0.6
T A T B BIS DT BIS DTM BIS ETA BIS ETAM BIS ETB
Test conditions
Vap
or f
ract
ion
R22 M20
Fig. 9. Inlet vapor fraction of R22 and M20 under di®erentoperating conditions.
Table 2. Condenser outlet conditions.
Test conditions R22 M20
Pco [bar] Tsat [�C] Tco[
�C] Pco [bar] Tl [�C] Tco [�C]
BIS DT 21.73 55.0 45.4 22.19 45.1 47.2BIS DTM 27.11 65.0 62.1 27.31 54.7 55.9BIS ETA 21.83 55.2 45.5 22.32 45.3 46.2BIS ETAM 25.43 62.2 58.5 25.89 52.1 54.6BIS ETB 26.57 64.2 61.1 26.85 53.9 55.2ASHRAE A 21.83 55.5 44.9 22.25 45.2 46.5ASHRAE B 18.41 47.67 39.5 19.31 38.9 40.6
Heat Transfer Characteristics of M20 Refrigerant Mixture Flowing Through Fin-and-Tube Evaporator
1350003-9

area would facilitate better condensation thatavoids this higher dryness condition at the evapo-rator inlet.
Figure 10 shows the variation of the heat °ux forR22 and the M20 refrigerant mixture under variousoperating conditions. It is found that the heat °uxdecreases with an increase in the outdoor air tem-perature. The heat °ux of the M20 refrigerantmixture is lower in the range of 3.1% to 8.7% thanthat of R22, since the vapor fraction at the entry tothe evaporator is higher, and also the mass °owrate is lower than that of R22. It is also observedthat in the BIS ETB and BIS DTM operatingconditions the heat °ux di®erence between the M20refrigerant mixture and R22 is lower than that, inthe other operating conditions. It can be inferredthat the loss in the heat °ux of M20 is lower athigher ambient conditions compared to the otherambient conditions.
It can also be seen that the heat °ux realized, ismainly dependent on the outdoor conditions ratherthan the indoor conditions. The fact that the con-denser temperature and liquid subcooling depends onthe condenser inlet air temperature is ascribed to thisphenomenon. As the degree of subcooling decreaseswith increasing condenser inlet air temperature, themass °ow rate of the refrigerant increases, and thedryness fraction at the inlet of the evaporator alsoincreases leading to the poor heat °ux experienced inthe evaporator. It is also found that the heat °uxdecreases as the magnitude of the drop in the refrig-eration e®ect outweighs the rise in themass °ow rate.The net e®ect is manifested as a reduced heat °uxwhich is clearly seen in these graphs.
It is to be noted that the in°uence of the con-densing temperature on the refrigerating capacity,
in terms of the heat °ux drop could be realized onlythrough a heat transfer study in a real appliance,and not in conventional heat transfer study testsections, and this is the main highlight of this study.The evaporator heat °ux realized with the M20 re-frigerant is lower than that with R22. It can be seenthat the reduction in the evaporator °ux rangesfrom 3.1% to 8.7% for M20, as compared to R22.
Figure 11 shows the comparison of the experi-mental overall heat transfer coe±cients of R22 andthe M20 refrigerant mixture. It is observed that theoverall heat transfer coe±cient decreases with anincrease in the outdoor conditions, which are thesame for both R22 and the M20 refrigerant mixture.An increase in the outdoor temperature increasesthe condenser pressure leading to an increase in thesaturation temperature of the refrigerant, in theevaporator as well as the vapor fraction at the entryof the evaporator. As the inlet vapor fractionincreases, the heat °ux decreases in the evaporatordue to the lesser wetted perimeter inside the coil andthe lower latent heat absorption rates. It is foundthat the overall heat transfer coe±cient of the M20refrigerant mixture, is lower in the range of 7.3% to20.8% than that of R22, under all operating condi-tions. This can be attributed to the lower heat °uxexperienced with the M20 refrigerant mixture be-cause of the lower °ow rates due to the limitedcondenser capacity. The LMTD of the evaporatorwith the M20 refrigerant mixture is also higher thanthat with R22, and due to all these reasons theoverall heat transfer coe±cient of the M20 refriger-ant mixture is lower than that of R22.
For the M20 refrigerant mixture, the liquidthermal conductivity and viscosity are lower thanR22 for as given in Table 3.23 The vapor thermalconductivity of the M20 refrigerant mixture is
0
2000
4000
6000
8000
10000
12000
T A TB BIS DT BIS DTM BIS ETA BIS ETAM BIS ETB
Test conditions
Hea
t fl
ux (
W/m
2 )
R22 M20
Fig. 10. Calculated evaporator heat °ux with R22 and M20under di®erent operating conditions.
0
50
100
150
200
250
T A T B BIS DT BIS DTM BIS ETA BIS ETAM BIS ETB
Test conditions
Ove
rall
heat
tra
nsfe
r co
effi
cien
t
(W m
-2K
-1)
R22 M20
Fig. 11. Overall heat transfer coe±cients of R22 and M20.
M. Herbert Raj, D. Mohan Lal & S. Premil Kumar
1350003-10

higher than that of R22. Thermal conductivity isone of the important properties that a®ect heattransfer. If the thermal conductivity is higher, theheat transfer rate will also be higher.12 Latent heatis also an important property, which a®ects the heattransfer coe±cient.12 These changes in the liquidproperties are responsible for the reduction in theheat transfer in the liquid layer. Jung et al.10
reported that nonideal variations in the physicalproperties accounted for 80% of the heat transferdegradation seen with the mixture; the remaining20% was caused by the mass transfer resistance inthe convective boiling region. Mass transfer resis-tance is a common phenomenon in the vaporizationof a multi component mixture, which causes thereduction in the heat transfer coe±cient of M20.Because of the mass transfer resistance, di®usions ofthe more volatile component from the bulk liquid tothe interface, and from the interface to the bulkvapor, cause a reduction in the heat and masstransfer rate.
4. Conclusion
The heat-transfer characteristics of the M20 refrig-erant mixture and R22 were investigated experi-mentally in a ¯n-and-tube evaporator of a windowair-conditioner, under di®erent test conditions pre-scribed by the BIS and ASHRAE standards. Basedon the measurements the following conclusions aredrawn,
(1) The M20 refrigerant mass °ow rate is lower inthe range of 5.0% to 11.3% than that of R22.
(2) The evaporator inlet pressure of the M20 re-frigerant mixture is higher in the range of 1% to3% than that of R22.
(3) The DBT as well as WBT di®erence across theevaporator is lower for M20 than that of R22.These lower DBT and WBT di®erences o®er alower heat °ux.
(4) It is observed that the LMTD with M20 is 2.0%to 6.0% higher than that with the R22 refrig-erant. This is because of the glide experiencedby the refrigerant leading to a smaller temper-ature di®erence between the hot and cold °uidat the exit, for the parallel °ow con¯gurationwith the M20 refrigerant mixture.
(5) The heat °ux of the M20 refrigerant mixture islower in the range of 3.1% to 8.7% than that ofR22, since the vapor fraction at the entry to theevaporator is higher, and the mass °ow rate islower than that of R22.
(6) The overall heat transfer coe±cient of the M20refrigerant mixture is lower in the range of 7.3%to 20.8% than that of R22, under all operatingconditions.
Due to the absence of sub cooling, and the higherliquid and vapor speci¯c volumes of the M20 re-frigerant mixture, the vapor fraction at the entry ofthe evaporator is higher than that of R22. This is themain drawback with the M20 refrigerant mixture,while considering it as an alternative to R22 forretro¯tting. However, if the condenser length is in-creased, as pointed out by Jabaraj et al.,3,4 thebetter condensation can make the M20 refrigerantmixture superior to R22. Needless to say, that inspite of the above drawback, it can be used as aretro¯t refrigerant with a 7.7% reduction in the heat°ux (refrigerating capacity) and 4.4% reduction inthe COP, because of its compatibility with mineraloil, and ozone friendly characteristics.
Table 3. Thermo physical properties of R22 and M20.
Saturation properties R22 @ 4�C M20@ 4�C R22@ 6�C M20@ 6�C
Liquid thermal conductivity [Wm�1 K�1] 0.09294 0.09011 0.09204 0.08909
Vapor thermal conductivity [Wm�1 K�1] 0.00968 0.01349 0.00982 0.013681
Latent heat [kJ kg�1] 201.79 211.98 200.11 209.76
Liquid viscosity [�Pa-s] 206.77 154.64 202.32 150.82Vapor Viscosity [�Pa-s] 11.535 11.142 11.621 11.222Pressure-Liquid [bar] 5.6605 7.8123 6.0259 8.2789
Heat Transfer Characteristics of M20 Refrigerant Mixture Flowing Through Fin-and-Tube Evaporator
1350003-11

Appendix-I
Uncertainty analysis
Experimentation using the R22 and the M20 refrigerant mixture, included the measurement of air tem-peratures (DBT and WBT), pressure di®erence across the nozzles, refrigerant temperature and pressures atvarious locations of the system, and the refrigerant mass °ow rate. The air-side heat transfer rate, refrig-erant-side heat transfer rate, and the overall heat transfer coe±cient were calculated, based on the measuredparameters. The calculated uncertainties on the overall heat transfer coe±cient vary from 3.0% to 4.3%under all operating conditions. The uncertainties of R22 and the M20 refrigerant mixture were calculatedfrom the equations listed below.
Uo ¼Qa;ac
�Tlm
; ð5ÞQa;act ¼m
:að�haÞ ; ð6Þ
�ha ¼ fðTWBT;TDBTÞ ; ð7Þ�Tlm ¼ fðTe;in;Te;out;TDBT;supply;TDBT;returnÞ ; ð8Þ
�Qa;act ¼�m:a
m:a
� �2
þ ��ha
�ha
� �2" #1=2
; ð9Þ
�m:a ¼
��Pnozzle
�Pnozzle
� �2
þ �TWBT
TWBT
� �2
�þ �TWBT
TWBT
� �2#1=2
; ð10Þ
��ha ¼�ha;supply
ha;supply
� �2
þ �ha;return
ha;return
� �2" #
1=2
; ð11Þ
�ha;supply ¼�TWBT
TWBT
� �2
þ �TDBT
TDBT
� �2" #
1=2
; ð12Þ
��Tlm ¼ �Te;in
Te;in
� �2
þ �Te;out
Te;out
� �2"
þ �TDBT;supply
TDBT;supply
� �2
þ �TDBT;return
TDBT;return
� �2#1=2
; ð13Þ
Appendix-II
Speci¯cations of the components
The speci¯cation of the components used in window air conditioner is given in the below table.
Compressor Condenser Evaporator Drier Capillary tube
Hermetically sealedreciprocating type
Make: Kirloskar Copeland
Ltd.
Model: KCH522HAELubricant: Mineral oil
Cooling capacity: 5250W
(1.5 TR)Rated power: 2000W
Plate ¯n and tube aircooled condenser
Number of rows: 3
Material: Copper
Copper tube size:diameter: 9.5mm
Length per tube:
525mmNumber of tubes: 48
Width: 87mm
Height: 440mm
Fins per inch: 12
Plate ¯n and tube — Dry expansiontype
Number of rows: 3
Number of circuit: 2
Material: CopperCopper tube size: diameter — 9.5mm
Length per tube: 366mm
Number of tubes/circuit: 24Width: 87mm
Height: 406mm
Fins per inch: 12
Tube layout: staggeredarrangement
Molecular sievetype
R22: Bore 1.542mmand length 0.8382m
M20: Bore 1.524 mm
and length 0.7112 m
M. Herbert Raj, D. Mohan Lal & S. Premil Kumar
1350003-12
References
1. A. Greco, R. Mastrolla and A. Palombo, HFC407Cas an alternative to HCFC22 in vapour compressionplant: An experimental study, Int. J. Energy Res. 21(1997) 1087�1098.
2. S. Devotta, A. S. Padalkar and N. K. Sane, Perfor-mance assessment of HCFC-22 window air condi-tioner retro¯tted with R-407C, Appl. Thermal Eng.25 (2005) 2937�2949.
3. D. B. Jabaraj, A. Narendran, D. Mohan Lal and S.Renganarayanan, Evolving an optimal compositionof HFC407C/HC290/HC600a mixture as an alter-native to HCFC22 in window air conditioners, Int. J.Thermal Sci. 46 (2007) 276�283.
4. D. B. Jabaraj, P. Avinash, D. Mohan Lal and S.Renganarayanan, Experimental investigation ofHFC407C/HC290/HC600a mixture in a window airconditioner, Energy Conversion and Management47 (2006) 2578�2590.
5. S. Joseph Sekhar, D. Mohan Lal and S. Renganar-ayanan, Improved energy e±ciency for CFC do-mestic refrigerators retro¯tted with ozone-friendlyHFC134a/HC refrigerant mixture, Int. J. ThermalSci. 43 (2004) 307�314.
6. S. Joseph Sekhar, K. Senthil Kumar and D. MohanLal, Ozone friendly HFC134a/HC mixture compat-ible with mineral oil in refrigeration system improvesenergy e±ciency of a walk in cooler, Energy Con-version and Management 45 (2004) 1175�1186.
7. M. Herbert Raj and D. Mohan Lal, A comparativestudy on the performance of a R22 window air con-ditioner retro¯tted with R407C/R290/R600a re-frigerant mixture, Int. J. Ambient Energy 29(4)(2008) 207�217.
8. X. Boissieux, M. R. Heikal and R. A. Johns, Two-phase heat transfer coe±cients of three HFC refrig-erants inside a horizontal smooth tube, Part I:evaporation, Int. J. Refrigeration 23 (2000)269�283.
9. T. Y. Choi, Y. J. Kim, M. S. Kim and S. T. Ro,Evaporation heat transfer of R32, R134a, R32/134aand R32/125/134a inside a horizontal smooth tube,Int. J. Heat Mass Transfer 43 (2000) 3651�3660.
10. K. E. Gungor and R. H. S. Winterton, Simpli¯edgeneral correlation for saturated °ow boiling andcomparisons of correlations with data, Chem. Eng.Res. Design 65 (1987) 148�156.
11. D. Jung and R. Radermacher, Prediction of evapo-ration heat transfer coe±cient and pressure drop ofrefrigerant mixtures in horizontal tubes, Int. J. Re-frigeration 16 (1993) 201�209.
12. D. S. Jung, M. McLinden, R. Radermacher andD. Didion, Horizontal °ow boiling heat transfer
experiments with a mixture of R22/R114, Int. J.Heal Mass Transfer 32(1) (1989) 131�145.
13. S. G. Kandlikar, A general correlation for saturatedtwo-phase °ow boiling heat transfer inside horizon-tal and vertical tubes, ASME Transactions, J. HeatTransfer 112 (1990) 219�228.
14. H. Wijaya and Mark W. Spatz, Two-phase °ow heattransfer and pressure drop characteristics of R22 andR32/R125, ASHRAE Trans.: Symposia 101 (1995)1020�1027.
15. C. C. Wang and K. Y. Chi, Heat transfer and frictioncharacteristics of plain ¯n-and-tube heat exchangers,Part I: New experimental data, Int. J. Heat MassTransfer 43 (2000) 2681�2691.
16. C. C. Wang and K. Y. Chi, Heat transfer and frictioncharacteristics of plain ¯n-and-tube heat exchangers,Part I: Correlation, Int. J. Heat Mass Transfer 43(2000) 2693�2700.
17. R. L. Webb, Air-side heat transfer correlations for°at and wavy plate ¯n-and-tube geometrics, ASH-RAE Trans., SL-90-1-2, 96 (1990) 445�449.
18. C. C. Wang, J. Y. Jang and N. F. Chiou, TechnicalNote, A heat transfer and friction correlation forwavy ¯n-and-tube heat exchangers, Int. J. HeatMass Transfer 42 (1999) 1919�1924.
19. G. Lozza and U. Merlo, An experimental investiga-tion of heat transfer and friction losses of interruptedand wavy ¯ns for ¯n-and-tube heat exchangers, Int.J. Refrigeration 24 (2001) 409�416.
20. I. Horuz, Experimental and theoretical performanceanalysis of air-cooled plate-¯nned tube evaporators,Int. J. Commun. Heat Mass Transfer 25(6) (1998)787�798.
21. S. Wongwises, W. Duangthongsuk and P. Napon,Tube-side two-phase heat transfer coe±cient of re-frigerant HFC134a °owing through a ¯n-and-tubeevaporator, Int. Commun. Heat Mass Transfer 29(2002) 387�400.
22. Bureau of Indian Standards. Room Air ConditionersSpeci¯cation, Part I: Unitary Air Conditioners, IS-1391, New Delhi, India, 1992.
23. ASHRAE standards, Methods for Testing for RatingSeasonal E±ciency of Unitary Air Conditioners andHeat Pumps, ANSI/ASHRAE 116-1995, Atlanta.
24. ASHRAE standards, Standards Methods for Labo-ratory Air Flow Measurement, ANSI/ ASHRAE41.2.1987, Atlanta.
25. National Institute of Standards and Technology,NIST, Thermodynamic Properties of Refrigerantsand Refrigerant Mixtures, Data base (REFPROPV.7).
Heat Transfer Characteristics of M20 Refrigerant Mixture Flowing Through Fin-and-Tube Evaporator
1350003-13