An Experimentally Validated Modeling of Refrigerant Distribution in a Parallel Microchannel...
10
Hanfei Tuo is a Phd student in the Department of Mechanical Engineering, University of Illinois, Urbana, IL. Algirdas Bielskus is a master student in the Department of Mechanical Engineering, University of Illinois, Urbana, IL. Pega Hrnjak is a professor in the Department of Mechanical Engineering, University of Illinois, Urbana, IL. An Experimentally Validated Modeling of Refrigerant Distribution in a Parallel Microchannel Evaporator Hanfei Tuo Algirdas Bielskus Pega Hrnjak, PhD, PE Student Member ASHRAE Student Fellow ASHRAE ABSTRACT This paper describes modeling of two phase flow distribution in a microchannel evaporator, on the basis of the pseudo 2-D finite volume method. Emphasis is placed on refrigerant-side heat transfer and pressure drop characteristics. The global flow distribution is based on the mechanistic fact that the pressure drop along each flow path containing an individual microchannel tube must be the same. Both the primary pressure drop across the microchannel tube and minor pressure drops are included. This model simulates refrigerant distribution in a microchannel evaporator for two cases. Firstly, flash gas generated in the expansion valve is separated and only single phase liquid is supplied into the evaporator; the second case is a conventional direct expansion operation where refrigerant in two-phase state is directly fed into the evaporator. Mass flow rate and quality in each microchannel tube, overall pressure drop and evaporator surface temperatures are obtained and then compared to data taken from the experimental facility, and good agreement is attained for the experimental and predicted data. INTRODUCTION In various air conditioning and refrigeration systems, the aluminum parallel microchannel heat exchangers have become widely used, since they aid in reducing system size and refrigerant charge, and also enhance heat transfer performance and lower refrigerant side pressure drop. However, the use of a microchannel heat exchanger faces problems of refrigerant distribution in headers, especially for evaporators where the entering refrigerant is usually in a two phase state. Two-phase refrigerant distribution in a header-branch tube configuration has been well studied by many scholars (Bowers, et al., 2006; Hwang et al., 2007; Tompkins et al., 2002; Zou & Hrnjak, 2009). So far, typical approaches consist of using flow remedies to prevent separated flow along the inlet header (Jiang, J. et al., 2010), developing special nozzles to create a Stokes flow as being investigated by Fei et al. (2002), and adding a valve to bypass the flash gas for residential and mobile A/C systems (Beaver et al., 1999; Tuo et al., 2011). Numerical modeling of such type heat exchangers is essential for the purpose of saving experimental cost and shortening design duration for optimization of heat exchanger. Kim & Bullard (2000) modeled the performance of an microchannel evaporator with CO 2 as the refrigerant. A first principles-based model was developed by Yin et al. (2001) for a transcritical CO 2 gas cooler, using a finite element method. However, these models did not consider maldistribution of refrigerant among parallel tubes, but reasonable predictions of the overall performances were still obtained. It may be due to the fact that CO 2 evaporator usually is in multi-pass design with baffles, thus lessening potential degrees of maldistribution with the penalty of pressure drop. CH-12-C048 © 2012 ASHRAE 375
Transcript of An Experimentally Validated Modeling of Refrigerant Distribution in a Parallel Microchannel...

Hanfei Tuo is a Phd student in the Department of Mechanical Engineering, University of Illinois, Urbana, IL. Algirdas Bielskus is a master student in the Department of Mechanical Engineering, University of Illinois, Urbana, IL. Pega Hrnjak is a professor in the Department of Mechanical Engineering, University of Illinois, Urbana, IL.
An Experimentally Validated Modeling of Refrigerant Distribution in a Parallel Microchannel Evaporator
Hanfei Tuo Algirdas Bielskus Pega Hrnjak, PhD, PE Student Member ASHRAE Student Fellow ASHRAE
ABSTRACT
This paper describes modeling of two phase flow distribution in a microchannel evaporator, on the basis of the pseudo
2-D finite volume method. Emphasis is placed on refrigerant-side heat transfer and pressure drop characteristics. The global
flow distribution is based on the mechanistic fact that the pressure drop along each flow path containing an individual
microchannel tube must be the same. Both the primary pressure drop across the microchannel tube and minor pressure
drops are included.
This model simulates refrigerant distribution in a microchannel evaporator for two cases. Firstly, flash gas generated
in the expansion valve is separated and only single phase liquid is supplied into the evaporator; the second case is a
conventional direct expansion operation where refrigerant in two-phase state is directly fed into the evaporator. Mass flow
rate and quality in each microchannel tube, overall pressure drop and evaporator surface temperatures are obtained and
then compared to data taken from the experimental facility, and good agreement is attained for the experimental and
predicted data.
INTRODUCTION
In various air conditioning and refrigeration systems, the aluminum parallel microchannel heat exchangers have become widely used, since they aid in reducing system size and refrigerant charge, and also enhance heat transfer performance and lower refrigerant side pressure drop. However, the use of a microchannel heat exchanger faces problems of refrigerant distribution in headers, especially for evaporators where the entering refrigerant is usually in a two phase state.
Two-phase refrigerant distribution in a header-branch tube configuration has been well studied by many scholars (Bowers, et al., 2006; Hwang et al., 2007; Tompkins et al., 2002; Zou & Hrnjak, 2009). So far, typical approaches consist of using flow remedies to prevent separated flow along the inlet header (Jiang, J. et al., 2010), developing special nozzles to create a Stokes flow as being investigated by Fei et al. (2002), and adding a valve to bypass the flash gas for residential and mobile A/C systems (Beaver et al., 1999; Tuo et al., 2011).
Numerical modeling of such type heat exchangers is essential for the purpose of saving experimental cost and shortening design duration for optimization of heat exchanger. Kim & Bullard (2000) modeled the performance of an microchannel evaporator with CO2 as the refrigerant. A first principles-based model was developed by Yin et al. (2001) for a transcritical CO2 gas cooler, using a finite element method. However, these models did not consider maldistribution of refrigerant among parallel tubes, but reasonable predictions of the overall performances were still obtained. It may be due to the fact that CO2 evaporator usually is in multi-pass design with baffles, thus lessening potential degrees of maldistribution with the penalty of pressure drop.
CH-12-C048
© 2012 ASHRAE 375
Brix et al. (2009) developed a simplified model for refrigerant maldistribution in only two microchannel tubes and a distribution factor was introduced to quantify the effects of maldistribution on the heat exchanger performance. Zietlow and Pettersen (1995) developed a microchannel condenser model for R134a refrigerant. By dividing headers into a series of segments, refrigerant inventory in headers and small channels was the first time simulated. Based on a similar approach, Litch and Hrnjak (1999) modeled a microchannel ammonia condenser, and further a quality distribution profile on the intermediate header imposed to simulate maldistribution. Kulkarni et al. (2004) discussed the header design issues for microchannel evaporators, and it was concluded that inlet header geometric parameters should be carefully selected to avoid gravity-induced and pressure-induced refrigerant maldistribution. Ablanque et al. (2010) created a numerical simulation model of two-phase flow distribution in a system with multiple t-junction branches. Yin et al. (2002) characterized individual pressure loss coefficients in a microchannel heat exchanger by using single-phase nitrogen flow test.
The purpose of this paper is to develop a microchannel evaporator model considering refrigerant distribution among the multiple parallel tubes. The emphasis is placed on the characteristic pressure drop and minor losses associated with inlet/outlet headers, contraction/expansion loss associated with fluid entering and leaving tubes respectively.
EXPERIMENTAL SETUP
Figure 1. Schematic diagram of test facility
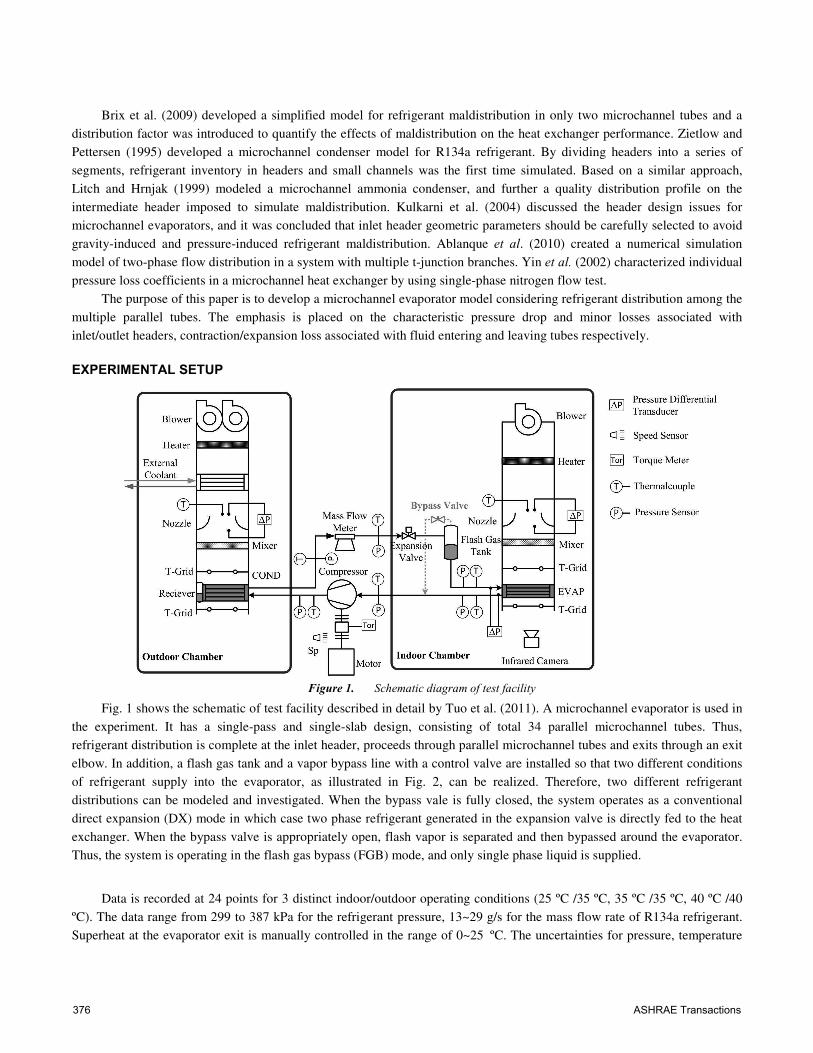
Fig. 1 shows the schematic of test facility described in detail by Tuo et al. (2011). A microchannel evaporator is used in the experiment. It has a single-pass and single-slab design, consisting of total 34 parallel microchannel tubes. Thus, refrigerant distribution is complete at the inlet header, proceeds through parallel microchannel tubes and exits through an exit elbow. In addition, a flash gas tank and a vapor bypass line with a control valve are installed so that two different conditions of refrigerant supply into the evaporator, as illustrated in Fig. 2, can be realized. Therefore, two different refrigerant distributions can be modeled and investigated. When the bypass vale is fully closed, the system operates as a conventional direct expansion (DX) mode in which case two phase refrigerant generated in the expansion valve is directly fed to the heat exchanger. When the bypass valve is appropriately open, flash vapor is separated and then bypassed around the evaporator. Thus, the system is operating in the flash gas bypass (FGB) mode, and only single phase liquid is supplied.
Data is recorded at 24 points for 3 distinct indoor/outdoor operating conditions (25 ºC /35 ºC, 35 ºC /35 ºC, 40 ºC /40 ºC). The data range from 299 to 387 kPa for the refrigerant pressure, 13~29 g/s for the mass flow rate of R134a refrigerant. Superheat at the evaporator exit is manually controlled in the range of 0~25 ºC. The uncertainties for pressure, temperature
376 ASHRAE Transactions
and mass flow rate measurements were about ± 3.56 kPa, ±0.5 ºC and ±0.1%, respectively. The resulting uncertainty for the capacity measurement was about 3.3%. A refrigerant-side energy balance and an air-side energy balance are measured to calculate system capacities. For all of the tests carried out, the differences between the balanced capacities are within 3% of each other.
Figure 2. Two configurations of refrigerant supply to the microchannel evaporator
DISTRIBUTION MODEL DESCPRIPTION
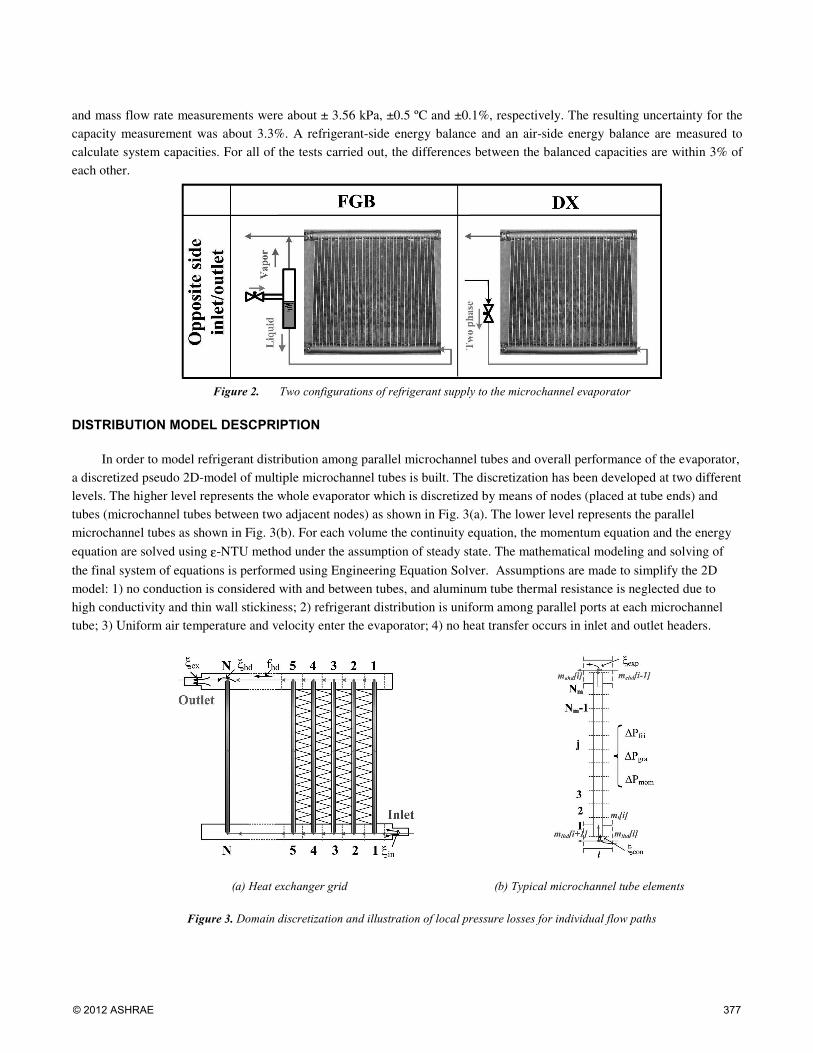
In order to model refrigerant distribution among parallel microchannel tubes and overall performance of the evaporator, a discretized pseudo 2D-model of multiple microchannel tubes is built. The discretization has been developed at two different levels. The higher level represents the whole evaporator which is discretized by means of nodes (placed at tube ends) and tubes (microchannel tubes between two adjacent nodes) as shown in Fig. 3(a). The lower level represents the parallel microchannel tubes as shown in Fig. 3(b). For each volume the continuity equation, the momentum equation and the energy
equation are solved using ε-NTU method under the assumption of steady state. The mathematical modeling and solving of
the final system of equations is performed using Engineering Equation Solver. Assumptions are made to simplify the 2D model: 1) no conduction is considered with and between tubes, and aluminum tube thermal resistance is neglected due to high conductivity and thin wall stickiness; 2) refrigerant distribution is uniform among parallel ports at each microchannel tube; 3) Uniform air temperature and velocity enter the evaporator; 4) no heat transfer occurs in inlet and outlet headers.
(a) Heat exchanger grid (b) Typical microchannel tube elements
Figure 3. Domain discretization and illustration of local pressure losses for individual flow paths
© 2012 ASHRAE 377
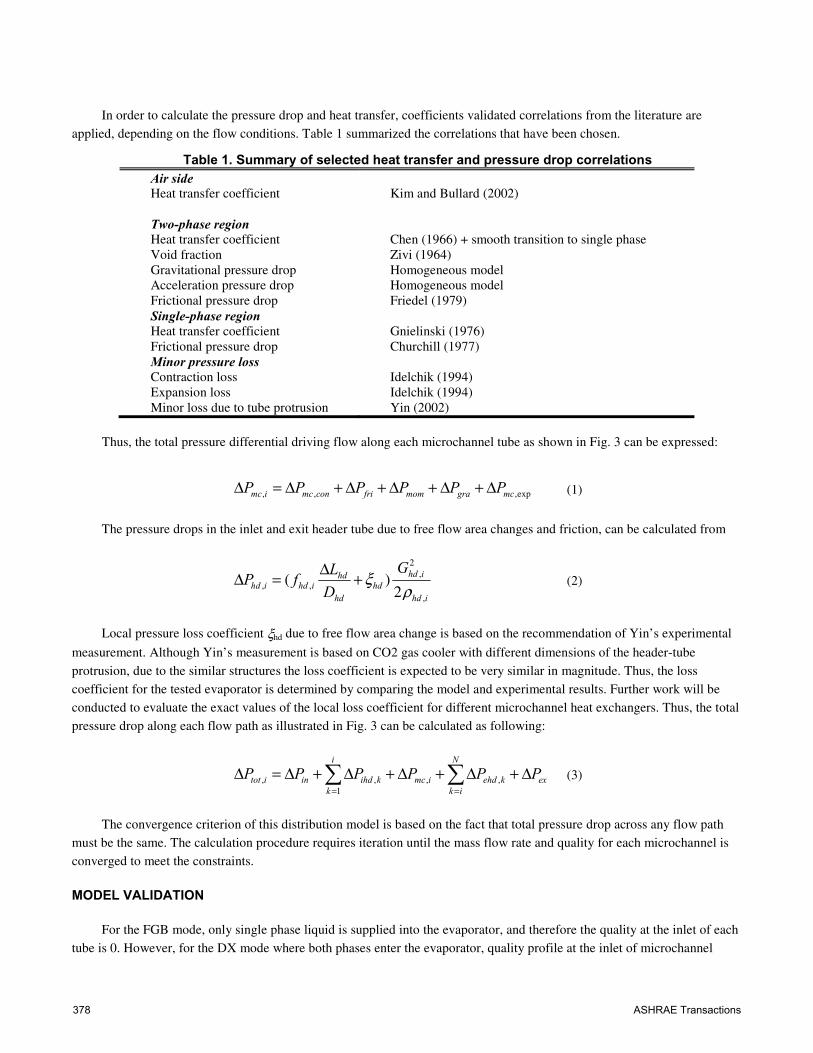
In order to calculate the pressure drop and heat transfer, coefficients validated correlations from the literature are applied, depending on the flow conditions. Table 1 summarized the correlations that have been chosen.
Table 1. Summary of selected heat transfer and pressure drop correlations Air side Heat transfer coefficient Kim and Bullard (2002) Two-phase region
Heat transfer coefficient Chen (1966) + smooth transition to single phase Void fraction Zivi (1964) Gravitational pressure drop Homogeneous model Acceleration pressure drop Homogeneous model Frictional pressure drop Friedel (1979) Single-phase region Heat transfer coefficient Gnielinski (1976) Frictional pressure drop Churchill (1977) Minor pressure loss Contraction loss Idelchik (1994) Expansion loss Idelchik (1994) Minor loss due to tube protrusion Yin (2002)
Thus, the total pressure differential driving flow along each microchannel tube as shown in Fig. 3 can be expressed:
, , ,expmc i mc con fri mom gra mcP P P P P P∆ = ∆ + ∆ + ∆ + ∆ + ∆ (1)
The pressure drops in the inlet and exit header tube due to free flow area changes and friction, can be calculated from
2,
, ,,
( )2
hd ihdhd i hd i hd
hd hd i
GLP f
Dξ
ρ
∆∆ = + (2)
Local pressure loss coefficient ξhd due to free flow area change is based on the recommendation of Yin’s experimental
measurement. Although Yin’s measurement is based on CO2 gas cooler with different dimensions of the header-tube protrusion, due to the similar structures the loss coefficient is expected to be very similar in magnitude. Thus, the loss coefficient for the tested evaporator is determined by comparing the model and experimental results. Further work will be conducted to evaluate the exact values of the local loss coefficient for different microchannel heat exchangers. Thus, the total pressure drop along each flow path as illustrated in Fig. 3 can be calculated as following:
, , , ,1
i N
tot i in ihd k mc i ehd k ex
k k i
P P P P P P= =
∆ = ∆ + ∆ + ∆ + ∆ + ∆∑ ∑ (3)
The convergence criterion of this distribution model is based on the fact that total pressure drop across any flow path must be the same. The calculation procedure requires iteration until the mass flow rate and quality for each microchannel is converged to meet the constraints.
MODEL VALIDATION
For the FGB mode, only single phase liquid is supplied into the evaporator, and therefore the quality at the inlet of each tube is 0. However, for the DX mode where both phases enter the evaporator, quality profile at the inlet of microchannel
378 ASHRAE Transactions
tubes should be introduced in the model. Although refrigerant two phase distribution for the structure of a horizontal manifold with vertical upward flow microchannel tube has been extensively studied experimentally, few physical models are developed to predict phase distribution. The related work has been done by Jin (2006), who made an empirical correlation in the form of a three piece linear profile to predict the qualities along a horizontal header. However, this model is based on experimental data obtained by an intrusive measurement approach where the outlet header is disassembled and flow meter is installed at each branch tube. Therefore, outlet header pressure drop and its effect on phase distribution were not included, despite its considerable impact on distribution as described in the previous section. However, it is still able to capture the fundamental physics of quality distribution induced by gravitational force. Thus, in this study a simplified linear two-piece line quality profile is used for purpose of improving model convergence but without losing generality.
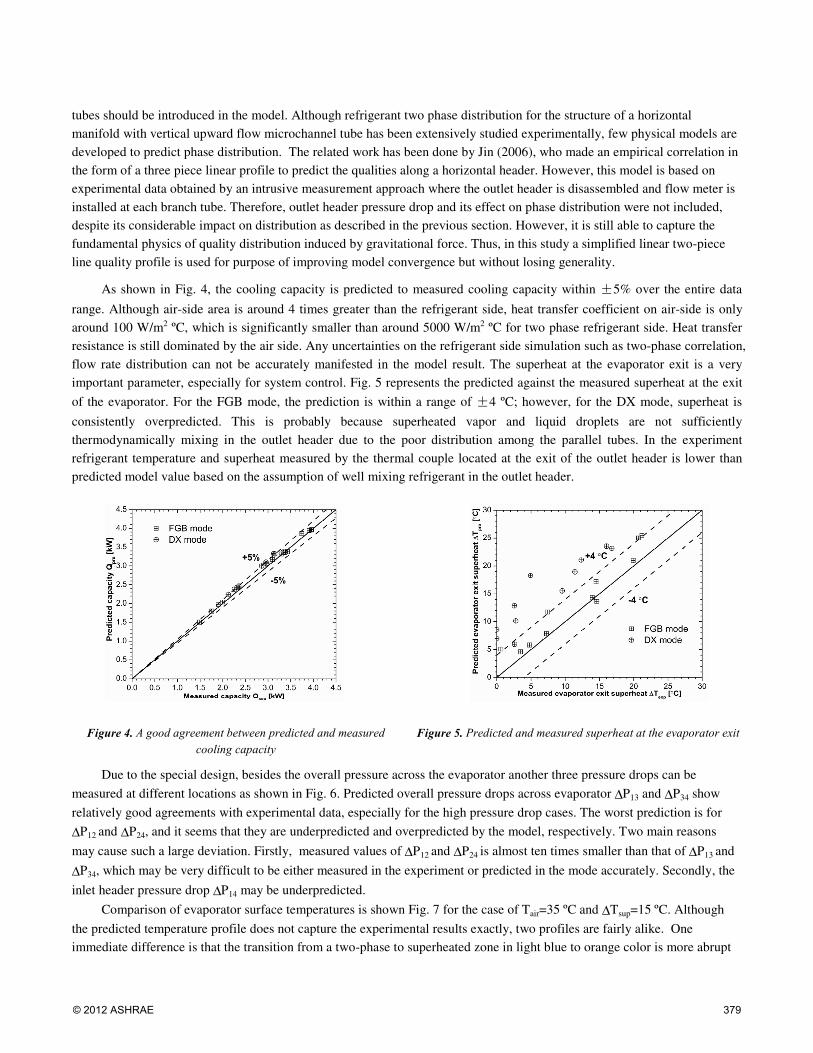
As shown in Fig. 4, the cooling capacity is predicted to measured cooling capacity within ±5% over the entire data
range. Although air-side area is around 4 times greater than the refrigerant side, heat transfer coefficient on air-side is only around 100 W/m2 ºC, which is significantly smaller than around 5000 W/m2 ºC for two phase refrigerant side. Heat transfer resistance is still dominated by the air side. Any uncertainties on the refrigerant side simulation such as two-phase correlation, flow rate distribution can not be accurately manifested in the model result. The superheat at the evaporator exit is a very important parameter, especially for system control. Fig. 5 represents the predicted against the measured superheat at the exit
of the evaporator. For the FGB mode, the prediction is within a range of ±4 ºC; however, for the DX mode, superheat is
consistently overpredicted. This is probably because superheated vapor and liquid droplets are not sufficiently thermodynamically mixing in the outlet header due to the poor distribution among the parallel tubes. In the experiment refrigerant temperature and superheat measured by the thermal couple located at the exit of the outlet header is lower than predicted model value based on the assumption of well mixing refrigerant in the outlet header.
Figure 4. A good agreement between predicted and measured
cooling capacity
Figure 5. Predicted and measured superheat at the evaporator exit
Due to the special design, besides the overall pressure across the evaporator another three pressure drops can be
measured at different locations as shown in Fig. 6. Predicted overall pressure drops across evaporator ∆P13 and ∆P34 show
relatively good agreements with experimental data, especially for the high pressure drop cases. The worst prediction is for
∆P12 and ∆P24, and it seems that they are underpredicted and overpredicted by the model, respectively. Two main reasons
may cause such a large deviation. Firstly, measured values of ∆P12 and ∆P24 is almost ten times smaller than that of ∆P13 and
∆P34, which may be very difficult to be either measured in the experiment or predicted in the mode accurately. Secondly, the
inlet header pressure drop ∆P14 may be underpredicted.
Comparison of evaporator surface temperatures is shown Fig. 7 for the case of Tair=35 ºC and ∆Tsup=15 ºC. Although
the predicted temperature profile does not capture the experimental results exactly, two profiles are fairly alike. One immediate difference is that the transition from a two-phase to superheated zone in light blue to orange color is more abrupt
© 2012 ASHRAE 379
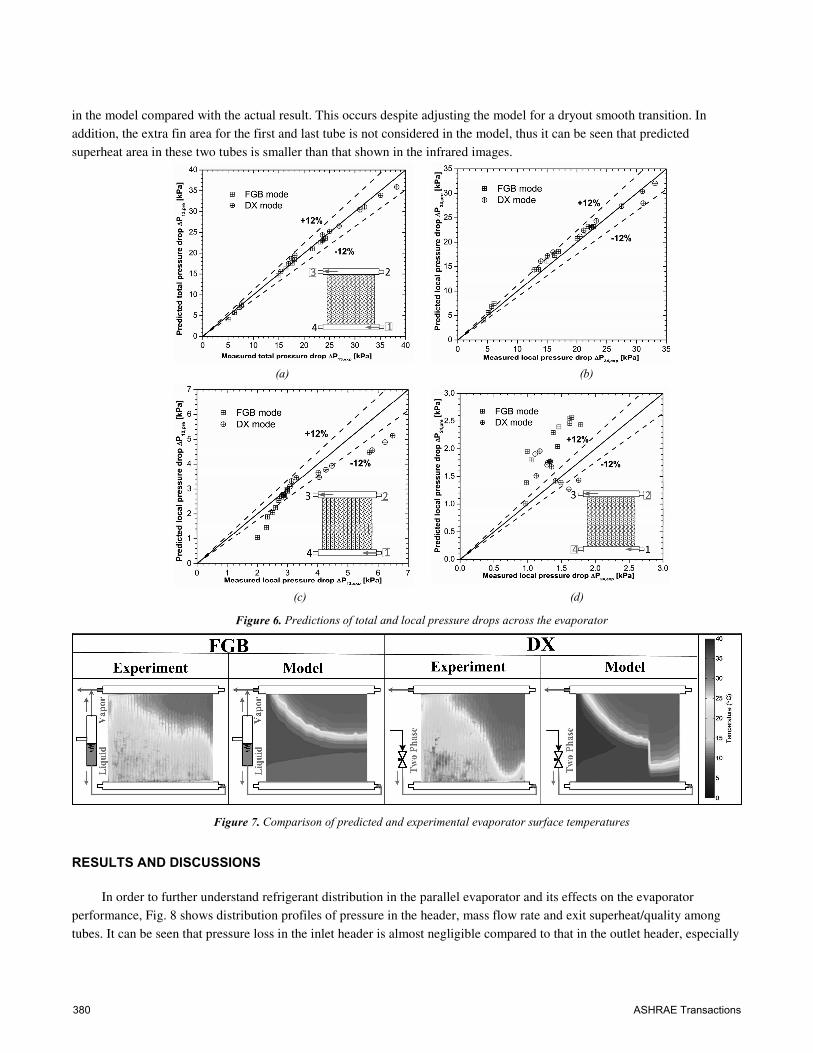
in the model compared with the actual result. This occurs despite adjusting the model for a dryout smooth transition. In addition, the extra fin area for the first and last tube is not considered in the model, thus it can be seen that predicted superheat area in these two tubes is smaller than that shown in the infrared images.
(a) (b)
(c) (d)
Figure 6. Predictions of total and local pressure drops across the evaporator
Figure 7. Comparison of predicted and experimental evaporator surface temperatures
RESULTS AND DISCUSSIONS
In order to further understand refrigerant distribution in the parallel evaporator and its effects on the evaporator performance, Fig. 8 shows distribution profiles of pressure in the header, mass flow rate and exit superheat/quality among tubes. It can be seen that pressure loss in the inlet header is almost negligible compared to that in the outlet header, especially
380 ASHRAE Transactions
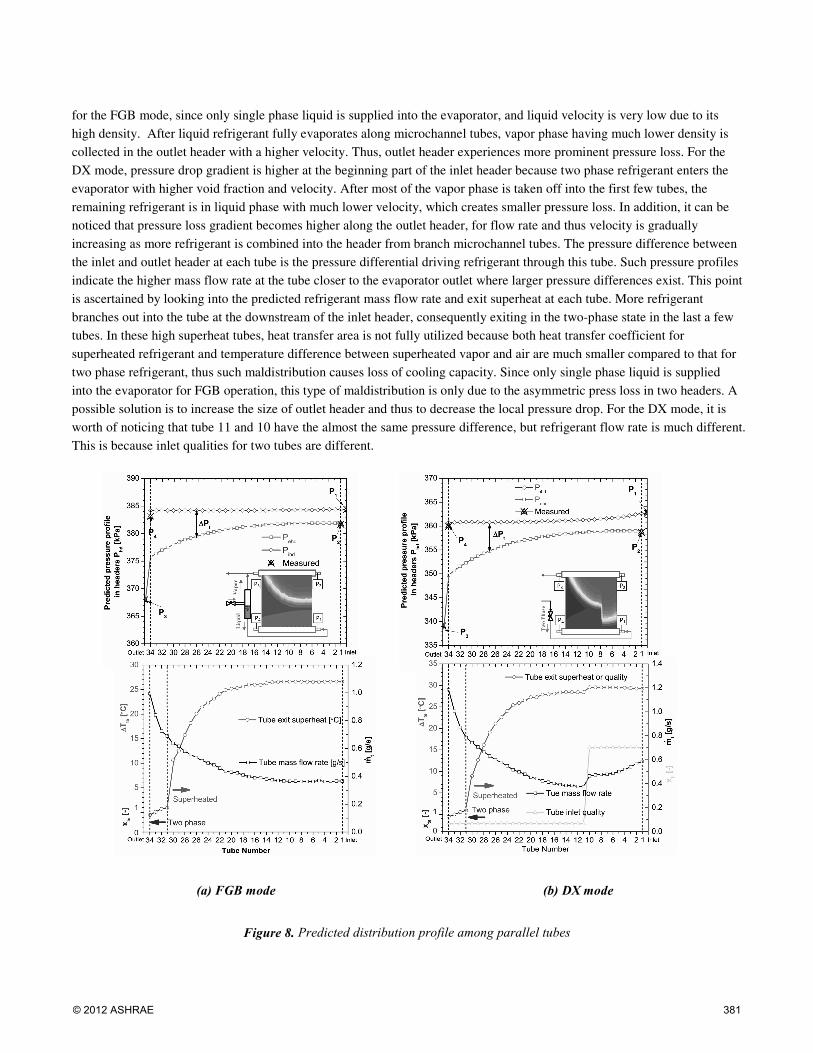
for the FGB mode, since only single phase liquid is supplied into the evaporator, and liquid velocity is very low due to its high density. After liquid refrigerant fully evaporates along microchannel tubes, vapor phase having much lower density is collected in the outlet header with a higher velocity. Thus, outlet header experiences more prominent pressure loss. For the DX mode, pressure drop gradient is higher at the beginning part of the inlet header because two phase refrigerant enters the evaporator with higher void fraction and velocity. After most of the vapor phase is taken off into the first few tubes, the remaining refrigerant is in liquid phase with much lower velocity, which creates smaller pressure loss. In addition, it can be noticed that pressure loss gradient becomes higher along the outlet header, for flow rate and thus velocity is gradually increasing as more refrigerant is combined into the header from branch microchannel tubes. The pressure difference between the inlet and outlet header at each tube is the pressure differential driving refrigerant through this tube. Such pressure profiles indicate the higher mass flow rate at the tube closer to the evaporator outlet where larger pressure differences exist. This point is ascertained by looking into the predicted refrigerant mass flow rate and exit superheat at each tube. More refrigerant branches out into the tube at the downstream of the inlet header, consequently exiting in the two-phase state in the last a few tubes. In these high superheat tubes, heat transfer area is not fully utilized because both heat transfer coefficient for superheated refrigerant and temperature difference between superheated vapor and air are much smaller compared to that for two phase refrigerant, thus such maldistribution causes loss of cooling capacity. Since only single phase liquid is supplied into the evaporator for FGB operation, this type of maldistribution is only due to the asymmetric press loss in two headers. A possible solution is to increase the size of outlet header and thus to decrease the local pressure drop. For the DX mode, it is worth of noticing that tube 11 and 10 have the almost the same pressure difference, but refrigerant flow rate is much different. This is because inlet qualities for two tubes are different.
(a) FGB mode (b) DX mode
Figure 8. Predicted distribution profile among parallel tubes
© 2012 ASHRAE 381

CONCLUSION
A 2D model of a microchannel evaporator is built in order to numerically investigate the effects of refrigerant distribution in the parallel microchannels on the heat exchanger performance. Individual pressure drop characteristics in the entire heat exchanger are considered, including that across microchannel tubes, minor loss associated with inlet/outlet of headers and evaporator. The model is based on the fact that total pressure drop along each flow path containing individual tubes is identical. The model is validated against a set of experimental data obtained in mobile A/C facility. Good agreement is found in the perspectives of cooling capacity, superheat and pressure drops.
For the FGB mode where only single phase liquid is supplied into the evaporator, asymmetric pressure loss in inlet and outlet headers causes pressure differential experienced by each tube is significantly different. The tubes closer to the evaporator outlet receive much higher liquid flow rate than those next to the inlet. Such mass flow maldistribution is pressure-induced and can be improved by reducing the magnitude of pressure loss within the outlet header relative to that in the tubes. For the DX mode where vapor-liquid phase after the expansion valve directly enters the evaporator, a simplified two-piece linear quality distribution profile is introduced, and a reasonably good prediction of surface temperatures is obtained compared to that taken by infrared camera. In this scenario, poor distribution is caused due to two reasons, i.e. different pressure differential across each tube and uneven phase distribution at the inlet of each tube.
ACKNOWLEDGMENTS
We are grateful for financial and technical support from the Air Conditioning and Refrigeration Center (ACRC) at the University of Illinois.
NOMENCLATURE
ξ = pressure loss coefficient (-)
ρ = refrigerant density (kg/m3)
D = Diameter (m)
f = frictional factor (-)
G = Mass flux (kg/m2-s)
Lhd = element length of headers (m)
m = Mass flow rate (g/s)
P = Pressure (kPa)
Q = Cooling capacity (kW)
T = Temperature (ºC)
x = Quality (-)
Subscripts
con = contraction pressure loss
ehd = outlet header
exp = experimental measurement or expansion pressure loss
ex = exit
fri = frictional pressure drop
gra = gravitational pressure drop
382 ASHRAE Transactions
ihd = inlet header
in = inlet
mc = microchannel tube
mom = momentum pressure drop
pre = predicted
sup = refrigerant superheat
REFERENCES
Ablanque, N., C. Oliet, J. Rigola, C.D. Perez-Segarra, and A. Oliva, 2010. Two-phase flow distribution in multiple parallel tubes. International Journal of Thermal Sciences, 49(6): 909-921.
Beaver A.C., Yin J., Bullard C.W., Hrnjak P.S., 1999. An experimental investigation of transcritical carbondioxide systems for residential air-conditioning. ACRC Report CR-18. USA: University of Illinois at Urbana-Champaign.
Bowers, C.D., T.A. Newell, and P.S. Hrnjak, 2006. Experimental Investigation of Two-Phase Refrigerant Distribution in a Microchannel Manifold, ACRC Report-TR245.
Brix, W., M.R. Karn, and B. Elmegaard, 2009. Modeling refrigerant distribution in microchannel evaporators. International Journal of
Refrigeration, 32(7): 1736-1743. Chen, J.C., 1966. Correlation for boiling heat transfer to saturated fluids in convective flow. Industrial & engineering chemistry process
design and development, 5(3): 322-339. Churchill, S.W., 1977. Friction-factor equation spans all fluid flow regimes. Chemical Engineering, 84(24): 91-92. Friedel, L., 1979. Improved friction pressure drop correlations for horizontal and vertical two-phase pipe flow. Paper E2, European Two
Phase Flow Group Meeting, Ispra, Italy. Gnielinski, V, 1976. New equations for heat and mass transfer in turbulent pipe and channel flow. International Chemical Engineering,
16(2): 359-368. Hwang, Y., D. Jin, and R. Radermacher, 2007. Refrigerant distribution in minichannel evaporator manifolds. HVAC & R Research, 13(4):
543-555. Idelchik, I.E., 1994. Handbook of hydraulic resistance. 3rd edition, CRC Press. Jiang, J., X. Lu, and L. Huang, 2010. Refrigerant distributor for heat exchanger, U.S. Patent No 20100242535 A1.
Jin, D., 2006. Investigation on refrigerant distribution in evaporator manifolds. PhD Thesis, University of Maryland, College Park.
Kim, M.H., and C. W. Bullard, 2000. Development of a microchannel evaporator model for a CO2 air-conditioning system. Energy, 26(10): 931-948.
Kulkarni, T., C.W. Bullard, and K. Cho, 2004. Header design tradeoffs in microchannel evaporators. Applied Thermal Engineering, 24(5-6): 759-776.
Litch, A.D., and P.S. Hrnjak, 1999. Condensation of ammonia in microchannel heat exchangers. ACRC Report CR-22. USA: University of Illinois.
Peng, F., D. Cantrak, and P.S. Hrnjak, 2002. Refrigerant distribution in the inlet header of plate evaporators, SAE Paper No.2002-01-0948. Tomkins, D.M., T. Yoo, P.S. Hrnjak, T. A. Newell, and K. Cho, 2002. Flow distribution and pressure drop in microchannel manifolds. In:
Proceedings of the 9th International Refrigeration and Air Conditioning Conference at Purdue, R6-4. Tuo, H.F., A. Bielskus, and P.S. Hrnjak, 2011. Effect of flash gas bypass on the performance of R134a mobile air-conditioning system with
microchannel evaporator. SAE International Journal of Materials and Manufacturing, 4(1): 231-239. Yin, J.M., C.W. Bullard, and P.S. Hrnjak, 2001. R-744 gas cooler model development and validation. International Journal of
Refrigeration, 24(7): 692-701. Yin, J.M, C.W. Bullard, and P.S. Hrnjak, 2002. Single-phase pressure drop measurements in a microchannel heat exchanger. Heat Transfer
engineering, 23(4): 3-12. Zivi, S.M, 1964. Estimation of steady-state stem void-fraction by means of the principle of minimum entropy production. ASME Journal of
Heat Transfer, 86: 247-252
Zou, Y., and P.S. Hrnjak, 2010. Performance measurement and visualization on the refrigerant distribution in the vertical manifold of the microchannel tube heat exchanger, Master Thesis, University of Illinois at Urbana-Champaign.
Zielow, D.C. and C.O. Pedersen, 1995. Heat transfer and flow characteristics of condensing refrigerants in small-channel crossflow heat exchangers. ACRC Report TR-73. USA: University of Illinois.
© 2012 ASHRAE 383

Copyright of ASHRAE Transactions is the property of ASHRAE and its content may not be copied or emailed
to multiple sites or posted to a listserv without the copyright holder's express written permission. However,
users may print, download, or email articles for individual use.