The Christian Sogdian manuscript C5 as an Example of "Translation Literature": Work in Progress
Origin of C2––C5 dicarboxylic acids in the European atmosphere
inferred from year-round aerosol study conducted at a west-east
transect
M. Legrand,1 S. Preunkert,1 T. Oliveira,2 C. A. Pio,2 S. Hammer,3 A. Gelencser,4
A. Kasper-Giebl,5 and P. Laj6
Received 12 September 2006; revised 1 March 2007; accepted 27 March 2007; published 22 August 2007.
[1] An atmospheric study of C2–C5 dicarboxylic acids was conducted over two years atseven sites located from the Azores to eastern continental European sites. The lowestconcentrations of total C2–C5 diacids are observed at the Azores (Portugal) and at 4360 melevation in the Alps (�50 ng m�3), and the highest (400 ng m�3) are observed at therural K-puszta site (Hungary). Quasi-absent at surface sites, the seasonal cycle of totaldiacids is characterized by a pronounced summer maximum at elevated sites, the highestsummer level (510 ng m�3) being observed at the forested mountain site ofSchauinsland (Germany). Whatever site and season, oxalic acid is always the mostabundant diacid with a relative abundance higher than 60%. The climatology of C2–C5
diacids in Europe is discussed versus environmental conditions at sites (marine/continental, rural/forested, boundary layer/free troposphere, and winter/summer).Observations are used to discuss the possible sources of C2–C5 diacids, with specialemphasis on their primary versus secondary and natural versus anthropogenic origin. Atsurface sites in winter, fast secondary productions in wood burning plumes in addition tosecondary production from volatile organic carbon (VOC) species emitted byvehicles seem to be important contributors. In summer the impact of anthropogenicsources is weakened and biogenic emissions from vegetation (unsaturated fatty acids,isoprene, oxygenated VOCs, and eventually monoterpenes) likely represent majorprecursors of diacids. At the Azores, diacids are not only related to long-range transportfrom continents but also to marine biogenic emissions from phytoplankton, particularly insummer.
Citation: Legrand, M., S. Preunkert, T. Oliveira, C. A. Pio, S. Hammer, A. Gelencser, A. Kasper-Giebl, and P. Laj (2007), Origin of
C2 –C5 dicarboxylic acids in the European atmosphere inferred from year-round aerosol study conducted at a west-east transect,
J. Geophys. Res., 112, D23S07, doi:10.1029/2006JD008019.
1. Introduction
[2] Numerous organic compounds significantly contributeto the aerosol load of the atmosphere and thus to theradiative forcing of climate. Among others the influenceof organic aerosol on cloud droplet formation is a key pointin evaluating effects of anthropogenic emissions on climate.
In contrast to sulfate more uncertainties exist about organicsand in particular for secondary organic aerosol specieswhich are more oxygenated and hygroscopic than primaryorganic species [Saxena and Hildemann, 1996]. Amongoxygenated organic species, dicarboxylic acids are probablythe best quantified species, though they represent a smallfraction of the total organic mass [Kawamura and Ikushima,1993; Mader et al., 2004]. In addition to serve as CCN,glutaric acid, a C5 dicarboxylic acid found in the atmo-sphere, increases the CCN activation of major inorganicaerosol such as ammonium sulfate [Cruz and Pandis, 1997,1998]. These findings suggest a potentially important roleplayed by dicarboxylic acids on radiative forcing andstimulate their studies since the sources of diacids in theatmosphere remain poorly understood and quantified.[3] Whatever the region (urban, rural, ormarine), oxalic acid
(C2: HOOCCOOH) is always found to be the most abundantdiacid followed by succinic (C4: HOOC(CH2)2COOH) and/ormalonic (C3: HOOCCH2COOH) acid with concentrations ofseveral hundreds of nanograms per cubic meter in urbanregions [Kawamura and Ikushima, 1993; Kawamura and
JOURNAL OF GEOPHYSICAL RESEARCH, VOL. 112, D23S07, doi:10.1029/2006JD008019, 2007
1Laboratoire de Glaciologie et Geophysique de l’Environnement duCentre National de la Recherche Scientifique, St. Martin d’Heres, France.
2Departamento de Ambiente e Ordenamento, Universidade de Aveiro,Aveiro, Portugal.
3Institut fur Umweltphysik, Ruprecht Karls-Universitat Heidelberg,Heidelberg, Germany.
4Air Chemistry Group of the Hungarian Academy of Sciences,University of Pannonia, Veszprem, Hungary.
5Institute for Chemical Technologies and Analytics, Vienna Universityof Technology, Vienna, Austria.
6Laboratoire de Meteorologie Physique, Centre National de laRecherche Scientifique, Universite Blaise Pascal, Aubieres, France.
Copyright 2007 by the American Geophysical Union.0148-0227/07/2006JD008019
D23S07 1 of 14
Kaplan, 1987] to a few tens of nanograms per cubic meter inremote marine boundary layer [Kawamura and Sakaguchi,1999; Sempere and Kawamura, 2003]. In Europe, the mostcontinuous study of diacids was conducted over one year byKerminen et al. [2000] at Helsinki (60�N). Although availabledata on diacids are more sparse at midlatitudes in Europe, theytend to show that oxalic acid levels at rural sites are notconsiderably different from those at urban sites [Limbeck andPuxbaum, 1999; Rohrl and Lammel, 2001].[4] Motor exhausts have been proposed to be primary
sources of oxalic, malonic, succinic, and glutaric (C5:HOOC(CH2)3COOH) acids [Kawamura and Kaplan,1987; Grosjean, 1989]. Some of these diacids are alsoemitted by wood burning, particularly malonic acid (pinewood) and succinic acid (oak wood) [Rogge et al., 1998].Note that until now no direct source of malic (hydroxysuc-cinic: hC4: HOOCCH2CHOHCOOH) and tartaric (dihy-droxysuccinic: dhC4: HOOC(CHOH)2COOH) acids hasbeen identified.[5] Glutaric, succinic, and adipic (C6:HOOC(CH2)4COOH)
acids have been identified in laboratory studies [Hatakeyamaet al., 1985] as secondary organic aerosol products of thereaction of O3 with cyclohexene, a symmetrical alkene mol-ecule similar to monoterpenes emitted by the biosphere.Kalberer et al. [2000] suggested that malonic and oxalic acidsare also produced in the cyclohexene-ozone system.[6] Unsaturated fatty acids with a double bond at the C9
position like cis-9-octadecenoic (oleic) acid are oxidized intoC9 diacid (azelaic acid) and other products hereafter mainlyoxidized into shorter diacids [Kawamura and Gagosian,1987; Kawamura and Sakaguchi, 1999; Matsunaga et al.,1999]. These unsaturated acids which are abundant inmarine phytoplankton and terrestrial higher plant leavesare also emitted by anthropogenic sources such as meatcooking [Rogge et al., 1991] and wood burning processes[Rogge et al., 1998].[7] Warneck [2003] suggested that in the marine atmo-
sphere clouds generate oxalic acid from glyoxal formed byoxidation of acetylene and glycolaldehyde formed by oxi-dation of ethene. Note that along these processes glyoxylicacid (CHOCOOH) represents a key intermediate whereasdiacids other than oxalic acid are not produced. Dealingwith the formation of dicarboxylic acids in the continentalatmosphere Ervens et al. [2004] also consider production ofglyoxal from toluene and of glycolaldehyde from isopreneas well as aqueous phase reactions of adipic and glutaricacids produced by oxidation of cyclohexene. Recently moreliterature has become available on the formation of oxalicacid that includes also the oxidation of methylglyoxal, anoxidation product of toluene and isoprene, via intermediatesteps involving pyruvic and acetic acids [Lim et al., 2005;Carlton et al., 2006]. Since this diacid production pathwayalso forms oligomers [Altieri et al., 2006], the knowledge ofthe sources of diacids is also of importance for the under-standing of secondary organic aerosol formation.[8] The relative contribution of primary and secondary
sources of diacids in the atmosphere remains poorly under-stood. Even though it is agreed that they are likely to bemainly secondary in origin it is not known in whichproportion their precursors come from anthropogenic andbiogenic sources.
[9] In this work we report a year-round study of chemicalcomposition of aerosols collected from mid-2002 to mid-2004 at different sites located along a west-east transect inEurope, from the Azores to Hungary, including high-elevation sites in the Alps. The climatology of C2–C5
diacids (oxalic, malic, malonic, succinic, tartaric, andglutaric) in Europe will be presented and discussed versusenvironmental conditions at sites (marine versus continen-tal, rural versus forested, boundary layer versus free tropo-sphere, and winter versus summer). The observations areused to discuss their possible sources in terms of primaryversus secondary and natural versus anthropogenic origin.Discussions are done in the light of data on 210Pb, inor-ganic ions like sulfate and potassium, and other organicspecies (total organic carbon, and selected organic tracers)gained in the framework of the CARBOSOL project whichwas dedicated to the study of the present and retrospectivestate of the organic versus inorganic aerosol over Europe[Legrand and Puxbaum, 2007].
2. Sampling and Analysis
[10] During the CARBOSOL project 540 high-volumeaerosol samples were almost continuously collected at sixsites along a west-east transect of 4000 km across Europe.From west to east the sites are: Azores denoted AZO(Terceira Islands, Portugal, 38�N, 27�W, 50 m above sealevel (a.s.l.), oceanic conditions), Aveiro (AVE, Portuguesecoast, 40�N, 8�W, 40 m a.sl., Atlantic coast), Puy de Dome(PDD, center of France, 45�N, 2�E, 1450 m a.s.l., ruralhighlands), Schauinsland (SIL, mountain ridge of the BlackForest in southwestern Germany, 47�N, 07�E, 1205 m a.s.l.,forested highlands), Sonnblick (SBO, high alpine site inAustria, 47�N, 12�E, 3106 m a.s.l., mountain peak in thecentral Alps) and K-puszta (KPZ, central plain of Hungary,46�N, 19�E, 136 m a.s.l., plain surrounded by forests). Moredetailed descriptions of sites are given by Pio et al. [2007].Weekly aerosol samplings on quartz fiber filters werecarried at a flow rate of 20–60 m3 STP h�1 at each sitefrom summer/fall 2002 to summer/fall 2004. After sam-pling, filter samples were wrapped in aluminum foil andimmediately transported to the laboratory in charge of thesampling site, where they were stored at �20�C. Batches ofsampled filters were divided into several fractions, enclosedinto heated treated aluminum cylinders, and sent by expressmail to the various laboratories participating in the analyt-ical work where they were stored at cold temperature untilanalysis. In contrast to AZO, AVE, SBO and KPZ where aPM 2–2.5 inlet was deployed, at SIL and PDD a PM 10inlet was used. That has to be kept in mind when comparingdata related to coarse particles. Nevertheless, compositionof size-segregated aerosol investigated during CARBOSOL(not presented in this paper) showed that, in PM10 aerosol,more than 90% of EC and 80% of OC are in PM2.5particles.[11] Additional samplings were achieved at Vallot (VO,
4360 m a.s.l., French Alps) by using an automatic aerosolsampler supplied by solar panels [Preunkert et al., 2002].A year-round study of sulfate previously conducted thereindicates that VO is the only European sampling site locatedin summer above the mixed layer [Preunkert et al., 2001].From April 2002 to September 2003 aerosol studies included
D23S07 LEGRAND ET AL.: LIGHT DICARBOXYLIC ACIDS IN EUROPE
2 of 14
D23S07
C2–C5 diacids with the aim to document their levels above4000 m elevation [Legrand et al., 2005]. The flow rate ofthe device is 3 L STP per minute and aerosol samples cover7–10 days in summer and 20 days in winter. Because ofthe limited energy supply available at VO no continuoushigh-volume aerosol sampling needed for investigation ofother organic compounds was possible. However, intensivefield campaigns were organized at the site in summer 2004(25–26 May and 31 August to 3 September) and 3 quartzfiber filters were collected by sucking around 1000 m3 STPof air with a high-volume sampler and analyzed for ions aswell as for other organic compounds.[12] Oxalate (�OOCCOO�), malonate (�OOCCH2COO
�),succinate (�OOC(CH2)2COO�), malate (�OOCCH2
CHOHCOO�), tartarate (�OOC(CHOH)2COO�), and gluta-
rate (�OOC(CH2)3COO�) were quantified with a Dionex
600 chromatograph equipped with an AS11 separatorcolumn and a gradient pump system as detailed by Ricardet al. [2002]. Glyoxylic acid (CHOCOO�), a monocar-boxylic acid of interest for further discussions on the originof diacids, was also investigated by using similar ionchromatography working conditions. For all dicarboxylicacids as well as glyoxylic acid the detection limit is close to1 ng m�3 (from 0.5 to 1.3 ng m�3) and is related to theaccuracy of the ion chromatography. For the low-volumeaerosol sampling achieved at VO the detection limits are0.5 ng m�3 for oxalic and malonic acids, and 0.1 ng m�3 forother dicarboxylic acids. Only the malonic acid levels inwinter were there so low that they could not be alwaysdetected.[13] The climatology of diacids in terms of sources will
be discussed in the light of other information gainedduring the CARBOSOL project. They include 210Pb, total(elemental and organic) carbon (TC), levoglucosan, differ-ent families of organic compounds investigated by usinggas chromatography/mass spectrometer (GC-MS), as wellas some inorganic species like sulfate, MSA, and potassi-um. Details on analytical methods deployed for analysis of
these compounds are given by Pio et al. [2007, andreferences therein].
3. Data Presentation
[14] The total mass concentrations of C2–C5 diacidsobserved at the CARBOSOL sites are reported in Table 1for winter (October to March) and summer (April toSeptember) along with the levels of glyoxylic acid. Totalorganic carbon (TC), anthropogenic fraction of sulfate, andfraction of potassium not related to sea salt and dustemissions that will be used for discussions on origin ofdiacids, are also reported.[15] The calculation of the anthropogenic fraction of
sulfate, mainly secondarily produced from SO2 emissions,requires the knowledge of the amount of primary sulfaterelated to sea salt and dust emissions and of the biogenicone related to oxidation of DMS emitted by phytoplankton.As detailed by Pio et al. [2007], this was done by usingsodium, calcium and methanesulfonate data. In this workwe also use the fraction of potassium present in excess withrespect to sea salt as well as dust material (denoted Nss-ndust-K). This potassium fraction is well representative ofsubmicronic aerosol primarily emitted in the atmosphereduring wood burning [Cachier et al., 1991]. As detailed byPio et al. [2007] this fine fraction of potassium can beestimated from the total potassium by using sodium andcalcium data.[16] At VO in summer the composition of aerosol col-
lected on the few available high-volume samples is com-pared in Table 1 with those continuously sampled with alow-volume sampler. The mean level of sulfate and totalC2–C5 diacids of high-volume filters are very consistentwith those of low-volume continuous sampling suggestingthat the few high-volume aerosol samples collected insummer 2004 are well representative of mean summerconditions at that site.[17] Measurements made on filters collected at SBO in
summer 2003 surprisingly showed a mean total C2–C5
diacids (30 ng m�3) far lower than the one observed at
Table 1. Summer (S) andWinter (W) Concentrations of Total Organic Carbon (TC in CarbonMass), Anthropogenic Sulfate, Non-Sea-Salt
and Nondust Fraction of Potassium, Total C2–C5 Diacids (Total Mass), and Glyoxylic Acid at the CARBOSOL Sitesa
Sites TC, mgC m�3 Anthropogenic SO4, ng m�3 Nss-ndust-K, ng m�3 Total C2–C5, ng m�3 Glyoxylic, ng m�3
KPZ (S) 5.6 ± 1.9 3602 ± 1154 110 ± 85 375 ± 139 9 ± 7KPZ (W) 8.9 ± 4.9 4767 ± 3975 303 ± 204 409 ± 290 38 ± 43AVE (S) 3.7 ± 1.8 3950 ± 2330 125 ± 73 374 ± 213 6 ± 7AVE (W) 8.8 ± 4.4 2110 ± 1481 201 ± 99 320 ± 190 11 ± 7SIL (S) 3.7 ± 1.8 2990 ± 1378 77 ± 61 507 ± 257 9 ± 8SIL (W) 1.6 ± 1.0 1440 ± 1067 44 ± 35 190 ± 181 8 ± 7PDD (S) 2.6 ± 1.4 1780 ± 960 37 ± 23 299 ± 184 13 ± 15PDD (W) 1.0 ± 0.8 757 ± 720 21 ± 23 112 ± 129 4 ± 4SBO (S) 1.6 ± 1.0 956 ± 628 nd �148b �2b
SBO (W) 0.5 ± 0.5 376 ± 314 nd Nd ndVO (S)c 0.3 548 8 82 4VO (S)d nd 437 ± 207 7 ± 4 67 ± 43 ndVO (W)d nd 145 ± 65 3 ± 2 14 ± 9 ndAZO (S) 0.4 ± 0.2 980 ± 850 15 ± 18 88 ± 57 0.7 ± 0.7AZO (W) 0.3 ± 0.2 333 ± 444 10 ± 17 43 ± 46 0.8 ± 0.6
aTC, sulfate, and potassium data are from Pio et al. [2007]. nd, not determined.bEstimated from a limited number of samples (see section 3).cMean value of three high-volume filters collected at this site (see section 2).dMean values observed on continuous low-volume sampling at this site.
D23S07 LEGRAND ET AL.: LIGHT DICARBOXYLIC ACIDS IN EUROPE
3 of 14
D23S07
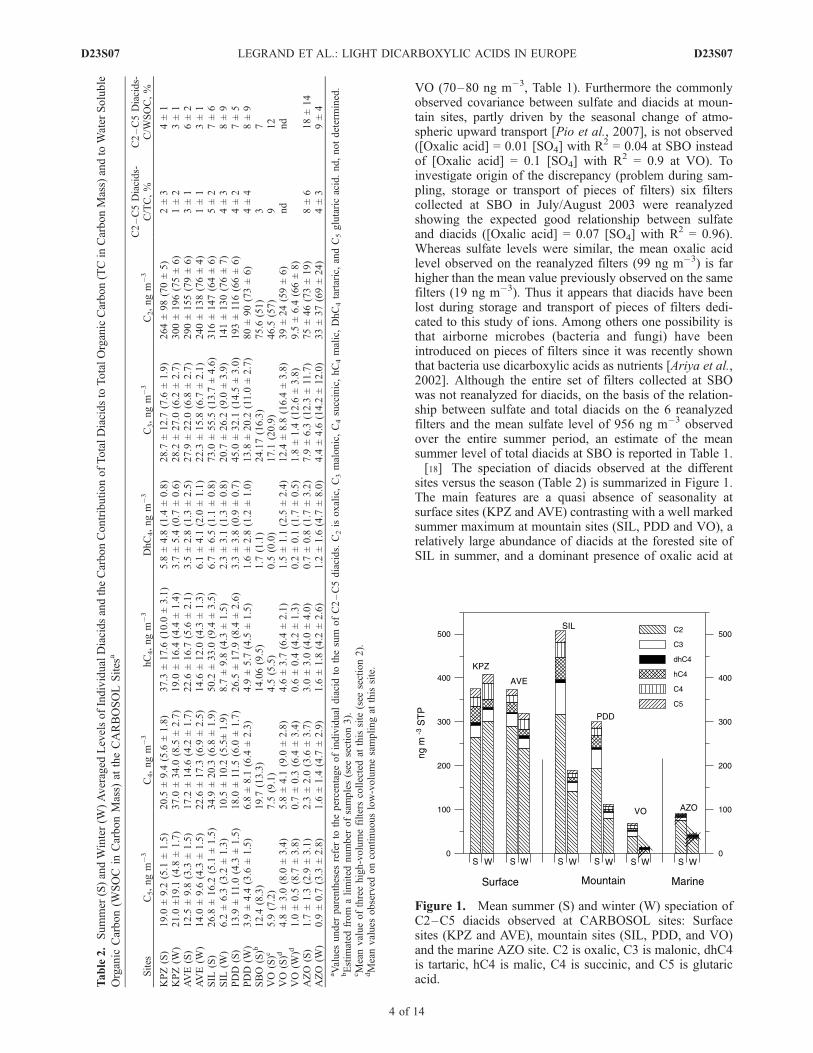
VO (70–80 ng m�3, Table 1). Furthermore the commonlyobserved covariance between sulfate and diacids at moun-tain sites, partly driven by the seasonal change of atmo-spheric upward transport [Pio et al., 2007], is not observed([Oxalic acid] = 0.01 [SO4] with R2 = 0.04 at SBO insteadof [Oxalic acid] = 0.1 [SO4] with R2 = 0.9 at VO). Toinvestigate origin of the discrepancy (problem during sam-pling, storage or transport of pieces of filters) six filterscollected at SBO in July/August 2003 were reanalyzedshowing the expected good relationship between sulfateand diacids ([Oxalic acid] = 0.07 [SO4] with R2 = 0.96).Whereas sulfate levels were similar, the mean oxalic acidlevel observed on the reanalyzed filters (99 ng m�3) is farhigher than the mean value previously observed on the samefilters (19 ng m�3). Thus it appears that diacids have beenlost during storage and transport of pieces of filters dedi-cated to this study of ions. Among others one possibility isthat airborne microbes (bacteria and fungi) have beenintroduced on pieces of filters since it was recently shownthat bacteria use dicarboxylic acids as nutrients [Ariya et al.,2002]. Although the entire set of filters collected at SBOwas not reanalyzed for diacids, on the basis of the relation-ship between sulfate and total diacids on the 6 reanalyzedfilters and the mean sulfate level of 956 ng m�3 observedover the entire summer period, an estimate of the meansummer level of total diacids at SBO is reported in Table 1.[18] The speciation of diacids observed at the different
sites versus the season (Table 2) is summarized in Figure 1.The main features are a quasi absence of seasonality atsurface sites (KPZ and AVE) contrasting with a well markedsummer maximum at mountain sites (SIL, PDD and VO), arelatively large abundance of diacids at the forested site ofSIL in summer, and a dominant presence of oxalic acid at
Table2.Summer
(S)andWinter(W
)Averaged
LevelsofIndividualDiacidsandtheCarbonContributionofTotalDiacidsto
TotalOrganicCarbon(TCin
CarbonMass)andto
Water
Soluble
Organic
Carbon(W
SOC
inCarbonMass)
attheCARBOSOLSites
a
Sites
C5,ngm
�3
C4,ngm
�3
hC4,ngm
�3
DhC4,ngm
�3
C3,ngm
�3
C2,ngm
�3
C2–C5Diacids-
C/TC,%
C2–C5Diacids-
C/W
SOC,%
KPZ(S)
19.0
±9.2
(5.1
±1.5)
20.5
±9.4
(5.6
±1.8)
37.3
±17.6
(10.0
±3.1)
5.8
±4.8
(1.4
±0.8)
28.7
±12.7
(7.6
±1.9)
264±98(70±5)
2±3
4±1
KPZ(W
)21.0
±19.1
(4.8
±1.7)
37.0
±34.0
(8.5
±2.7)
19.0
±16.4
(4.4
±1.4)
3.7
±5.4
(0.7
±0.6)
28.2
±27.0
(6.2
±2.7)
300±196(75±6)
1±2
3±1
AVE(S)
12.5
±9.8
(3.3
±1.5)
17.2
±14.6
(4.2
±1.7)
22.6
±16.7
(5.6
±2.1)
3.5
±2.8
(1.3
±2.5)
27.9
±22.0
(6.8
±2.7)
290±155(79±6)
3±1
6±2
AVE(W
)14.0
±9.6
(4.3
±1.5)
22.6
±17.3
(6.9
±2.5)
14.6
±12.0
(4.3
±1.3)
6.1
±4.1
(2.0
±1.1)
22.3
±15.8
(6.7
±2.1)
240±138(76±4)
1±1
3±1
SIL
(S)
26.8
±16.2
(5.1
±1.5)
34.9
±20.3
(6.8
±1.9)
50.2
±33.0
(9.4
±3.5)
6.7
±6.5
(1.1
±0.8)
73.0
±55.5
(13.7
±4.6)
316±147(64±6)
5±2
7±6
SIL
(W)
6.2
±6.3
(3.2
±1.3)
10.5
±10.2
(5.5±1.9)
8.7
±9.8
(4.3
±1.5)
2.3
±3.1
(1.3
±0.8)
20.7
±26.2
(9.0
±3.9)
141±130(76±7)
4±3
8±9
PDD
(S)
13.9
±11.0
(4.3
±1.5)
18.0
±11.5
(6.0
±1.7)
26.5
±17.9
(8.4
±2.6)
3.3
±3.8
(0.9
±0.7)
45.0
±32.1
(14.5
±3.0)
193±116(66±6)
4±2
7±5
PDD
(W)
3.9
±4.4
(3.6
±1.5)
6.8
±8.1
(6.4
±2.3)
4.9
±5.7
(4.5
±1.5)
1.6
±2.8
(1.2
±1.0)
13.8
±20.2
(11.0
±2.7)
80±90(73±6)
4±4
8±9
SBO
(S)b
12.4
(8.3)
19.7
(13.3)
14.06(9.5)
1.7
(1.1)
24.17(16.3)
75.6
(51)
37
VO
(S)c
5.9
(7.2)
7.5
(9.1)
4.5
(5.5)
0.5
(0.0)
17.1
(20.9)
46.5
(57)
912
VO
(S)d
4.8
±3.0
(8.0
±3.4)
5.8
±4.1
(9.0
±2.8)
4.6
±3.7
(6.4
±2.1)
1.5
±1.1
(2.5
±2.4)
12.4
±8.8
(16.4
±3.8)
39±24(59±6)
nd
nd
VO
(W)d
1.0
±0.5
(8.7
±3.8)
0.7
±0.3
(6.4
±3.4)
0.6
±0.4
(4.2
±1.3)
0.2
±0.1
(1.7
±0.5)
1.8
±1.4
(12.6
±3.8)
9.5
±6.4
(66±8)
AZO
(S)
1.7
±1.3
(2.9
±3.1)
2.3
±2.0
(3.6
±3.7)
3.0
±3.0
(4.0
±4.0)
0.7
±0.8
(1.7
±3.2)
7.9
±6.3
(12.3
±11.7)
75±46(73±19)
8±6
18±14
AZO
(W)
0.9
±0.7
(3.3
±2.8)
1.6
±1.4
(4.7
±2.9)
1.6
±1.8
(4.2
±2.6)
1.2
±1.6
(4.7
±8.0)
4.4
±4.6
(14.2
±12.0)
33±37(69±24)
4±3
9±4
aValues
under
parentheses
referto
thepercentageofindividual
diacidto
thesum
ofC2–C5diacids.C2isoxalic,C3malonic,C4succinic,hC4malic,DhC4tartaric,andC5glutaricacid.nd,notdetermined.
bEstim
ated
from
alimited
number
ofsamples(see
section3).
cMeanvalueofthreehigh-volumefilterscollectedat
thissite
(see
section2).
dMeanvalues
observed
oncontinuouslow-volumesamplingat
thissite.
Figure 1. Mean summer (S) and winter (W) speciation ofC2–C5 diacids observed at CARBOSOL sites: Surfacesites (KPZ and AVE), mountain sites (SIL, PDD, and VO)and the marine AZO site. C2 is oxalic, C3 is malonic, dhC4is tartaric, hC4 is malic, C4 is succinic, and C5 is glutaricacid.
D23S07 LEGRAND ET AL.: LIGHT DICARBOXYLIC ACIDS IN EUROPE
4 of 14
D23S07
AZO. These differences aimed to explain the atmosphericbudget of diacids in Europe.
4. Origins of Diacids at Surface Continental Sites
[19] The mean total mass concentration of C2–C5 diac-ids exhibits no significant seasonality at KPZ and AVE(Figure 1). That does not mean however that the strength ofemissions is similar in winter and summer since, as sug-gested by 210Pb data [Hammer et al., 2007], stable con-ditions developing in winter at surface sites reduce thevertical mixing intensity at that season. Selecting filtersamples corresponding to time periods over which 222Rnactivities (222Rn data gained by IUP Heidelberg during theCARBOSOL project will be discussed elsewhere) are lowerthan 5 Bq m�3 at AVE, we found a mean diacid level 30%higher in summer than in winter (275 ng m�3 instead of208 ng m�3) whereas the mean 222Rn activity of selectedsamples remains similar (2.5 Bq m�3 for summer and2.7 Bq m�3 for winter samples). Therefore we have to keepin mind that KPZ and AVE sites may likely experiencewinter accumulation of diacids emitted by surrounding localto regional sources whereas in summer diacids would comefrom larger-scale emissions.[20] Whatever the season, oxalic acid is the dominant
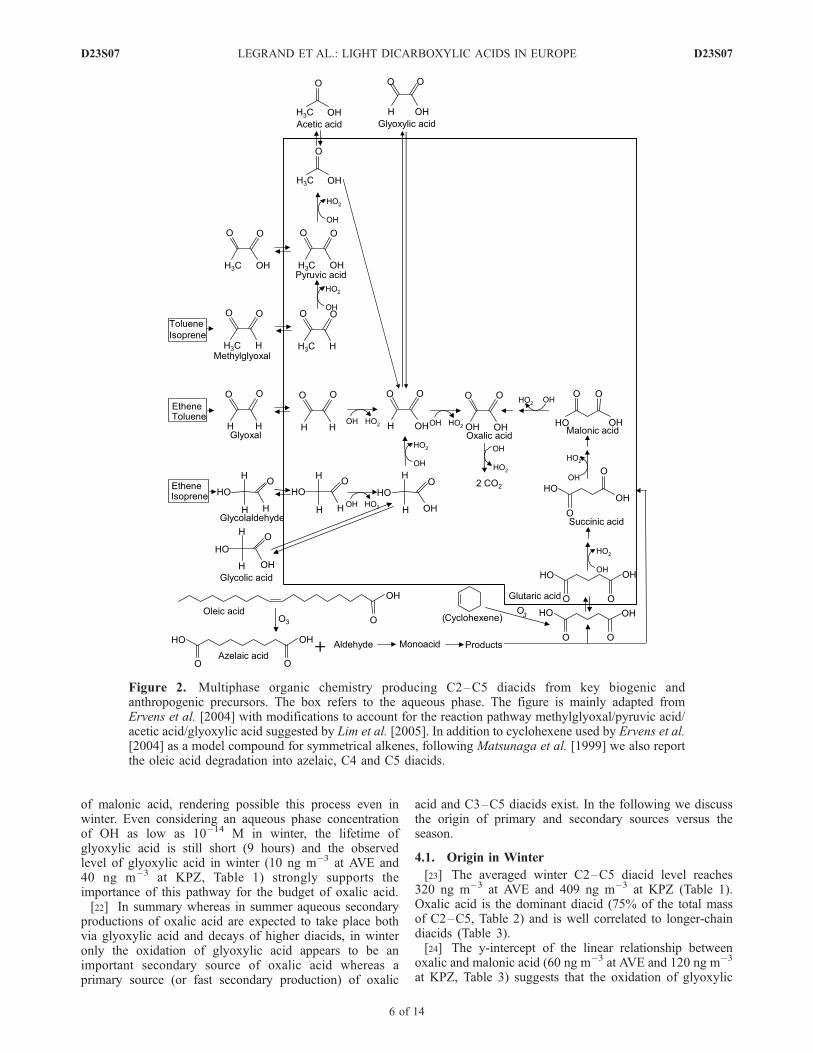
diacid (70 to 80% of the C2–C5 sum, Table 2). Althoughthe level of oxalic acid is always correlated to the ones oflonger-chain diacids, the correlation coefficients are sys-tematically weaker in summer than in winter, particularlywith glutaric acid (Table 3). High values of correlationcoefficients suggest that the C2–C5 diacids are eitherprimarily emitted (or fast secondarily produced) togetherwith a dominant fraction as oxalic acid or stronglyconnected to each other in a chain of reactions transformingglutaric acid into oxalic acid. Such a chain of reactions cantake place in cloud water as reported in Figure 2. However,a good correlation between the different diacids wouldrequire almost identical reaction rates in the successiveoxidation steps, otherwise ones would have accumulatedand others would have been depleted, depending on age ofaerosol and ambient conditions. That is not the case sinceOH aqueous phase reaction is thought to be more efficienton C3 and C4 diacids than on glutaric acid [Ervens et al.,2004]. With a rate constant of 1.107 M�1 s�1 for the OHreaction with glutaric acid (5.107 M�1 s�1 with succinic andmalonic acids) and simulated aqueous phase concentrationsof OH in June of 10�13 M in early morning and late
afternoon (5 10�13 M at noon), Ervens et al. [2004] showedthat successive oxidation steps of C5 into shorter diacidsefficiently proceed in summer. In winter the aqueous phaseconcentrations of OH would be lowered because of thedecrease of its major sources (transfer of OH from the gasphase, aqueous phase photolysis of H2O2, reaction H2O2 +Fe2+/Cu+ [Ervens et al., 2003a] following the decrease ofsunlight and H2O2 level. Another change of the efficiencyof OH reactions with diacids from winter to summer wouldbe related to pH change since anions react faster than theiracidic forms [Ervens et al., 2003b]. In order to evaluateseasonal change in pH of aerosol we examine the imbal-ance between cations (Na+, NH4
+, K+, Mg2+, and Ca2+) andanions (Cl�, NO3
�, SO42�, and C2–C5 dicarboxylates).
Both at AVE and KPZ an imbalance between cationsand anions (DC) representing less than 3% of the ionicbudget of aerosol (S) is found (DC = �5 nEq m�3 forS = 202 nEq m�3 at AVE, DC = 14 nEq m�3 for S =485 nEq m�3 at KPZ). The imbalance between cationsand anions thus remains close to experimental errors indetermining ionic species and points out the neutral charac-ter of aerosol at AVE and KPZ. Furthermore no significantchange of the imbalance between cations and anions is seenfrom winter to summer. These considerations thereforesuggest that the aqueous phase decays of longer into shorterdiacids mainly depend on OH levels and are more efficientin summer than in winter. That is also supported by thelarger abundance of succinic acid with respect to malic acidat KPZ in winter whereas the reverse is observed in summer(Table 3). Since no direct emissions have been identified formalic acid, likely formed by hydroxylation of succinic acid,this change of the partitioning in C4 diacids again signalsmore efficient aqueous phase C2–C5 reactions in summerthan in winter.[21] Since no primary source of diacids (vehicular emis-
sions, wood combustion, meat cooking operations) emitsoxalic acid alone, the y-intercept of the linear relationshipbetween oxalic and malonic acid (mean value of 90 ng m�3
at AVE and 100 ng m�3 at KPZ, Table 3) suggests that,whatever the season, another production of oxalic acid, notrelated to the decay of longer diacids, occurs at the twosites. Referring to our knowledge of secondary productionsof diacids (Figure 2) a possible production of oxalic acidmay be the oxidation of glyoxylic acid. The OH rateconstant of the aqueous phase oxidation of glyoxylate(K = 3.109 M�1 s�1 [Ervens et al., 2004]) is far larger that
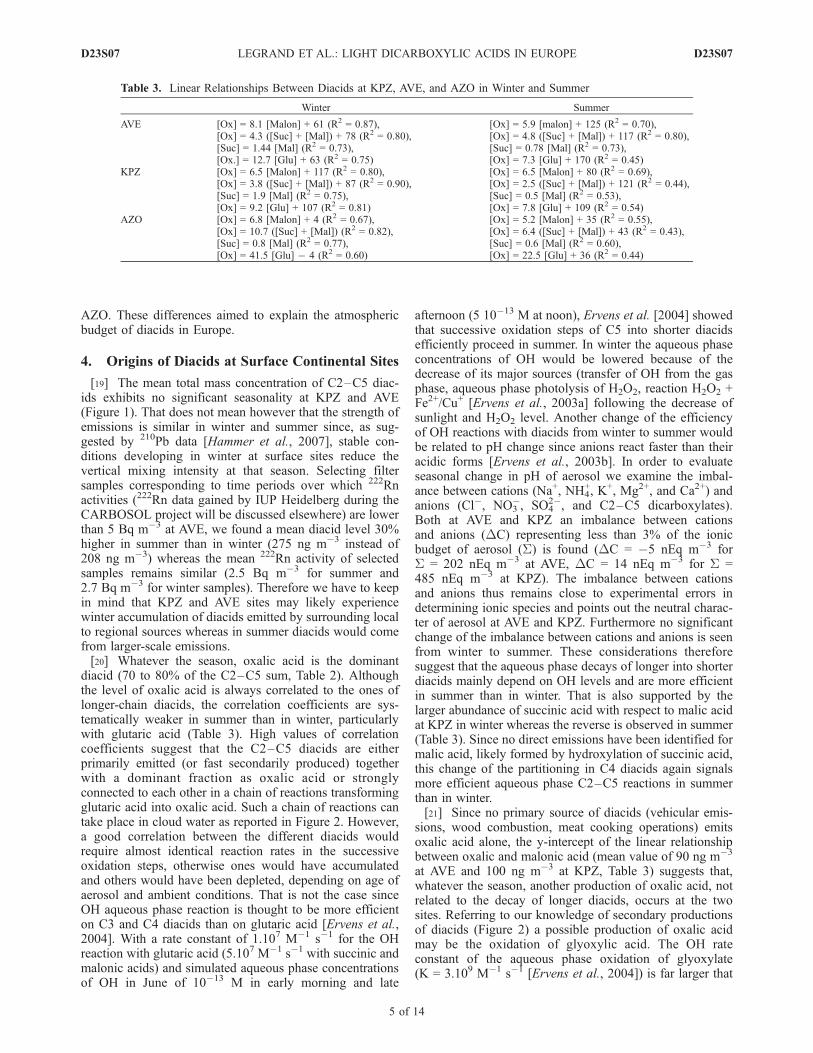
Table 3. Linear Relationships Between Diacids at KPZ, AVE, and AZO in Winter and Summer
Winter Summer
AVE [Ox] = 8.1 [Malon] + 61 (R2 = 0.87),[Ox] = 4.3 ([Suc] + [Mal]) + 78 (R2 = 0.80),[Suc] = 1.44 [Mal] (R2 = 0.73),[Ox.] = 12.7 [Glu] + 63 (R2 = 0.75)
[Ox] = 5.9 [malon] + 125 (R2 = 0.70),[Ox] = 4.8 ([Suc] + [Mal]) + 117 (R2 = 0.80),[Suc] = 0.78 [Mal] (R2 = 0.73),[Ox] = 7.3 [Glu] + 170 (R2 = 0.45)
KPZ [Ox] = 6.5 [Malon] + 117 (R2 = 0.80),[Ox] = 3.8 ([Suc] + [Mal]) + 87 (R2 = 0.90),[Suc] = 1.9 [Mal] (R2 = 0.75),[Ox] = 9.2 [Glu] + 107 (R2 = 0.81)
[Ox] = 6.5 [Malon] + 80 (R2 = 0.69),[Ox] = 2.5 ([Suc] + [Mal]) + 121 (R2 = 0.44),[Suc] = 0.5 [Mal] (R2 = 0.53),[Ox] = 7.8 [Glu] + 109 (R2 = 0.54)
AZO [Ox] = 6.8 [Malon] + 4 (R2 = 0.67),[Ox] = 10.7 ([Suc] + [Mal]) (R2 = 0.82),[Suc] = 0.8 [Mal] (R2 = 0.77),[Ox] = 41.5 [Glu] � 4 (R2 = 0.60)
[Ox] = 5.2 [Malon] + 35 (R2 = 0.55),[Ox] = 6.4 ([Suc] + [Mal]) + 43 (R2 = 0.43),[Suc] = 0.6 [Mal] (R2 = 0.60),[Ox] = 22.5 [Glu] + 36 (R2 = 0.44)
D23S07 LEGRAND ET AL.: LIGHT DICARBOXYLIC ACIDS IN EUROPE
5 of 14
D23S07
of malonic acid, rendering possible this process even inwinter. Even considering an aqueous phase concentrationof OH as low as 10�14 M in winter, the lifetime ofglyoxylic acid is still short (9 hours) and the observedlevel of glyoxylic acid in winter (10 ng m�3 at AVE and40 ng m�3 at KPZ, Table 1) strongly supports theimportance of this pathway for the budget of oxalic acid.[22] In summary whereas in summer aqueous secondary
productions of oxalic acid are expected to take place bothvia glyoxylic acid and decays of higher diacids, in winteronly the oxidation of glyoxylic acid appears to be animportant secondary source of oxalic acid whereas aprimary source (or fast secondary production) of oxalic
acid and C3–C5 diacids exist. In the following we discussthe origin of primary and secondary sources versus theseason.
4.1. Origin in Winter
[23] The averaged winter C2–C5 diacid level reaches320 ng m�3 at AVE and 409 ng m�3 at KPZ (Table 1).Oxalic acid is the dominant diacid (75% of the total massof C2–C5, Table 2) and is well correlated to longer-chaindiacids (Table 3).[24] The y-intercept of the linear relationship between
oxalic and malonic acid (60 ng m�3 at AVE and 120 ng m�3
at KPZ, Table 3) suggests that the oxidation of glyoxylic
Figure 2. Multiphase organic chemistry producing C2–C5 diacids from key biogenic andanthropogenic precursors. The box refers to the aqueous phase. The figure is mainly adapted fromErvens et al. [2004] with modifications to account for the reaction pathway methylglyoxal/pyruvic acid/acetic acid/glyoxylic acid suggested by Lim et al. [2005]. In addition to cyclohexene used by Ervens et al.[2004] as a model compound for symmetrical alkenes, following Matsunaga et al. [1999] we also reportthe oleic acid degradation into azelaic, C4 and C5 diacids.
D23S07 LEGRAND ET AL.: LIGHT DICARBOXYLIC ACIDS IN EUROPE
6 of 14
D23S07
acid may contribute to 25% and 40% of the level of oxalicacid at AVE and KPZ, respectively. Assuming that biogenicemissions of isoprene are low at that season, a possiblesource of glyoxylic acid may be the oxidation of tolueneand ethene emitted by vehicles. Some n-alkanes can be usedto trace back vehicular emissions. In urban areas n-alkanesranging from C23 to C34 are mainly emitted by fossil fuelcombustion and plant waxes. N-alkanes (C23–C34) weremeasured during the CARBOSOL project by Oliveira et al.[2007]. The concentrations of anthropogenic n-alkanes(C23–C34) calculated by subtracting the contribution ofwax n-alkanes (taken as Cn � 0.5 * (Cn�1 + Cn+1), Oliveiraet al. [2007]) to total n-alkanes are of 15 ng m�3 at AVE and32 ng m�3 at KPZ in winter. To date similar calculationsdone on concentrations of individual C23 to C34 reportedon a seasonal basis at the large city of Los Angeles byRogge et al. [1993] indicate there a mean winter concen-tration of anthropogenic n-alkanes (C23–C34) of 67 ngm�3. From that it can be concluded that KPZ, and to alesser extent AVE, are significantly impacted by vehicularemissions that represent indeed a plausible source of oxalicacid via glyoxylic acid produced by the oxidation of tolueneand ethene at the two sites in winter.[25] As discussed above it is likely that in winter the
decay of C5 in the aqueous phase will not contribute to theobserved C2–C4 diacids at surface sites. If correct, aprimary source of diacids may contribute to the level ofC3–C5 diacids and to about two thirds of that of oxalate.Primary sources of C2–C5 include wood burning, vehicularexhausts and meat cooking operations but their significanceis not well established. First the importance of vehicularexhaust for the C2–C5 atmospheric budget remains unclear.Vehicles, particularly diesel-powered engines, were found toemit significant amounts of C2–C5 diacids with a domi-nance of oxalic acid, 3 times less succinic acid, and 6 timesless malonic and glutaric acids [Kawamura and Kaplan,1987]. However, a chemical mass balance receptor modelapplied by Schauer et al. [1996] to the Los Angeles basinindicated that malonic acid is there related to wood burning,succinic and glutaric acids from both meat cooking andwood burning, and no significant contribution from vehic-ular emissions is found for these three diacids. Notehowever that the most abundant diacid, oxalic acid, wasnot apportioned by Schauer et al. [1996]. Although basedon one test, the distribution of diacids in diesel engineexhaust observed by Kawamura and Kaplan [1987] israther consistent with the slopes of linear relationshipsbetween oxalic and other diacids observed in winter atKPZ (Table 3), with a dominance of oxalic on C4 diacids,
the latter being dominant with respect to both malonic andglutaric acids. However, a rather similar distribution ofdiacids dominated by oxalic, followed by succinic andglutaric acids was also reported in biomass burning plumes.[26] Levoglucosan analysis made during CARBOSOL on
monthly pooled filters [Puxbaum et al., 2007] indicatewinter levels of 600 ng m�3 and 1000 ng m�3 at KPZand AVE, respectively, suggesting high contribution ofbiomass smoke to organic matter at these sites in winter.Wood burning experiments have shown that C3–C5 diacidsare present in biomass burning plumes [Rogge et al., 1998]but unfortunately oxalic acid was not documented. As far aswe know the most complete data set on C2–C5 diacids inwood burning plumes is from Gao et al. [2003] on savannafires. In smoke aerosols collected directly over the fire theauthors found a large amount of potassium (13,810 ng m�3)and some diacids among which oxalic (750 ng m�3) dom-inates succinic (470 ng m�3) and glutaric acid (300 ng m�3).Using potassium to account for the dilution of the plumesGao et al. [2003] showed that the concentrations of glutaric,succinic and oxalic acids strongly increased after 40 min ofaging. For instance the glutarate to potassium ratio, close to1% reached 15% after 40 min. A similar increase is observedfor the oxalate to potassium ratio, 2% over the fire and 25%after 40 min. This formation of diacids during the initialaging of smoke aerosol was attributed to fast secondaryproductions in the smoke plume. Even higher enrichment ofdiacids with respect to potassium have been observed inlong-range transported boreal wildfire smokes in summerwith ratios of oxalate and succinate to potassium of 10 and 5,respectively [Sillanpaa et al., 2005]. In this latter case, it isclear that, during the few days aging of the air in summer,aqueous phase reactions of diacids have proceeded. In orderto evaluate to what extent wood burning (fast secondaryproductions and primary emissions) is a source of diacids atAVE and KPZ, we report in Table 4 the correlation betweendiacids and nss-ndust-potassium levels observed in winter.Glutaric and succinic acids are well correlated with nss-ndust-K and the slopes of the linear relationship (�0.1) aresimilar to those observed by Gao et al. [2003] during theinitial aging of smoke aerosol (0.15). Furthermore the quasi-nul y-intercepts of correlations suggest that glutaric andsuccinic acids are strongly related to the emissions of nss-ndust-potassium. The slope of the relationship betweenoxalic acid and nss-ndust-potassium which ranges from 0.4at KPZ to 0.9 at AVE are higher than the oxalate topotassium ratio found by Gao et al. [2003] after 40 min ofaging of the smoke plume. Interestingly the y-intercepts ofthe correlation between oxalic acid and nss-ndust-potassiumare close to those of the correlation between malonate andoxalate, consistently pointing out the existence of the sec-ondary production of oxalic acid from glyoxylic acid. Thecase of malonic acid appears more complex with levels stillrather well correlated to those of nss-ndust-potassium atAVE but not at KPZ. Gao et al. [2003] pointed out thesingularity of malonic acid with respect to other diacid,being most of the time absent from the smoke plumes.Reversely, malonic acid was found to be the most abundantC3–C5 diacids emitted by pine wood burning [Rogge et al.,1998]. Oliveira et al. [2007] showed a far larger level ofdehydroabietic acid, a resinic acid emitted by the combus-tion of pine, at AVE than KPZ in winter (90 ng m�3 instead
Table 4. Relationships Between Diacids and nss-ndust-K at KPZ
and AVE in Winter
Site Relationships
KPZ [Glu] = 0.06 [nss-ndust-K] + 0 (R2 = 0.76),[Suc] = 0.11 [nss-ndust-K] + 1 (R2 = 0.74),[Malon] = 0.05 [nss-ndust-K] + 10 (R2 = 0.17),[Ox] = 0.44 [nss-ndust-K] + 146 (R2 = 0.30)
AVE [Glu] = 0.08 [nss-ndust-K] � 1 (R2 = 0.64),[Suc] = 0.13 [nss-ndust-K] � 3 (R2 = 0.56),[Malon] = 0.09 [nss-ndust-K] + 4 (R2 = 0.32),[Ox] = 0.90 [nss-ndust-K] + 60 (R2 = 0.40)
D23S07 LEGRAND ET AL.: LIGHT DICARBOXYLIC ACIDS IN EUROPE
7 of 14
D23S07
of 15 ng m�3) which may explain the better correlationbetween malonic acid and wood smoke compounds at AVEthan at KPZ.[27] Finally, the oxidation of unsaturated fatty acids such
as oleic acid mainly emitted by meat cooking and woodburning [Rogge et al., 1991, 1998] may be another second-ary source of diacids in winter. Once emitted in the atmo-sphere oleic acid is rapidly destroyed, producing azelaic acidand other products which are further oxidized into glutaricand succinic acid (Figure 2). Schauer et al. [1996] found thatat Los Angeles succinic and glutaric acids are related to bothwood burning and meat cooking. Although oleic acid hasbeen observed at a significant level in winter, particularly atKPZ (5.7 ng m�3 [Oliveira et al., 2007]), its level remainsfar lower than that in Los Angeles (40 ng m�3 [Rogge et al.,1993]).
4.2. Origin in Summer
[28] At KPZ and AVE the level of anthropogenicn-alkanes estimated by Oliveira et al. [2007] decreases insummer compared to winter (8 ng m�3 instead 15 ng m�3 atAVE and 11 ng m�3 instead of 32 ng m�3 at KPZ). Thatlikely reflects a more efficient dispersion of pollutantsemitted at a regional scale by vehicular traffic. This moreefficient dispersion of vehicular emissions would also lead toa decrease of the y-intercept of the relationship betweenoxalic and malonic acids from winter to summer, followingthe expected decrease of toluene and ethene. That is not thecase with a y-intercept of the relationship between oxalic andmalonic acids of 80 ng m�3 (instead of 117 ng m�3 inwinter) at KPZ and 125 ng m�3 (instead of 61 ng m�3 inwinter) at AVE (Table 3). Isoprene, whose emissions are farlarger in summer than in winter, would be the main precursorof glyoxylic acid in summer thereafter oxidized into oxalicacid (Figure 2).[29] The level of levoglucosan is decreased by a factor of
10 in summer (�70 ng m�3) compared to winter at AVEand KPZ [Puxbaum et al., 2007]. The total C2–C5 diacidlevel not related to the oxidation of glyoxylic acid intooxalic acid (i.e., the sum of C3–C5 diacids plus the C2 levelof which the y-intercept of the correlation between malonicand oxalic acid has been subtracted) reaches 290 ng m�3 atKPZ and 260 ng m�3 at AVE in winter. Similar values arestill found in summer (295 ng m�3 at KPZ and 250 ng m�3
at AVE) suggesting that important sources of C2–C5 otherthan wood burning exist at that season. As discussed later insection 6 biogenic emissions from vegetation would repre-sent a large source of glutaric acid at surface sites in summerand as discussed above glutaric acid can be oxidized intoshorter-chain diacids via aqueous phase reactions at thatseason. Preceding discussions lead to the conclusion that insummer diacids are mainly secondarily produced. Thisconclusion is well supported by an example of the sizedistribution of diacids in summer reported in Figure 3,showing the accumulation of oxalic acid (i.e., the endproduct) in more aged particles that also contain moresulfate.[30] In conclusion, at surface sites regional emissions
from vehicles (toluene and ethene oxidized via glyoxylicacid into oxalic acid) and wood burning (fast secondaryproductions in the plumes) seem to be the major sources ofdiacids in winter. In summer the contribution of these
anthropogenic processes is weakened but the contributionof biogenic emissions becomes important. Among biogenicprecursors of diacids we suspect isoprene via the oxidationof glyoxylic acid but also other compounds leading to theproduction of C3–C5 diacids as will be discussed insection 6.
5. Changes of Diacids Versus Elevation OverEurope
[31] As seen in Table 1, the total concentration of diacidsstrongly decreased with altitude in winter (a factor of 26between the surface sites of KPZ and AVE and the highelevated alpine VO site). The corresponding decrease ofanthropogenic sulfate is similar (a factor of 24) but lowerthan the one of non-sea-salt-non-dust potassium (a factor of80). The relatively lower decrease of diacids and sulfatewith height compared to the one of non-sea-salt-non-dustpotassium, a species in submicron particles primarily emit-ted in the atmosphere, tends to suggest that a weak photo-chemical production of diacids takes place throughout alarge part of the troposphere similarly to the production ofsulfate from SO2.[32] In summer the decrease with height is less pro-
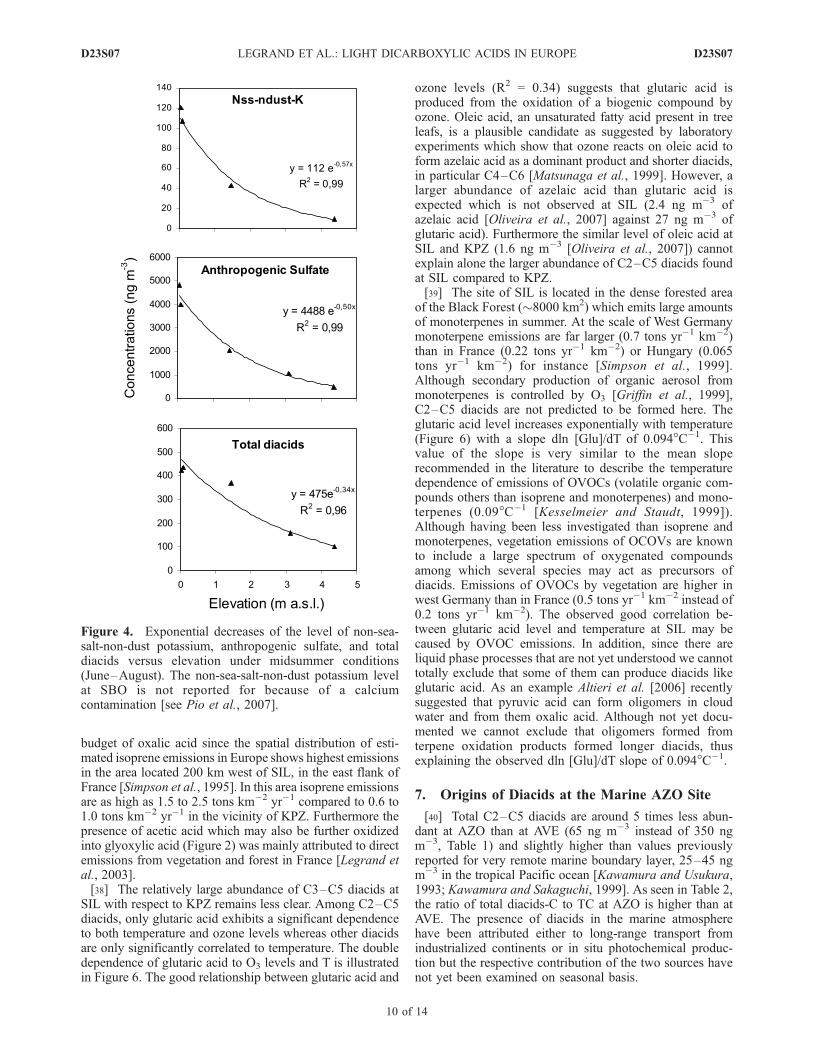
nounced than in winter for all species with a factor of 5.5for total diacids, 8.5 for sulfate, and 17 for nss-non-dust-K(Table 1). This is first due to a more efficient upwardtransport of air masses from the boundary layer in summerthan in winter, as confirmed by radioisotope data [Pio et al.,2007]. In addition, the weaker vertical decrease of diacidsand sulfate than those of a primary species like nss-non-dust-K points out the existence of secondary production ofsulfate and diacids. The weaker decrease of diacids thansulfate, as already discussed by Legrand et al. [2005],suggests a faster mass formation rate of sulfate than diacidsin agreement with the finding of Ervens et al. [2004]. Onthe basis of the extended data set of this study, in thefollowing we discuss further photochemical productions ofdiacids.[33] In Figure 4 we first compare the changes with
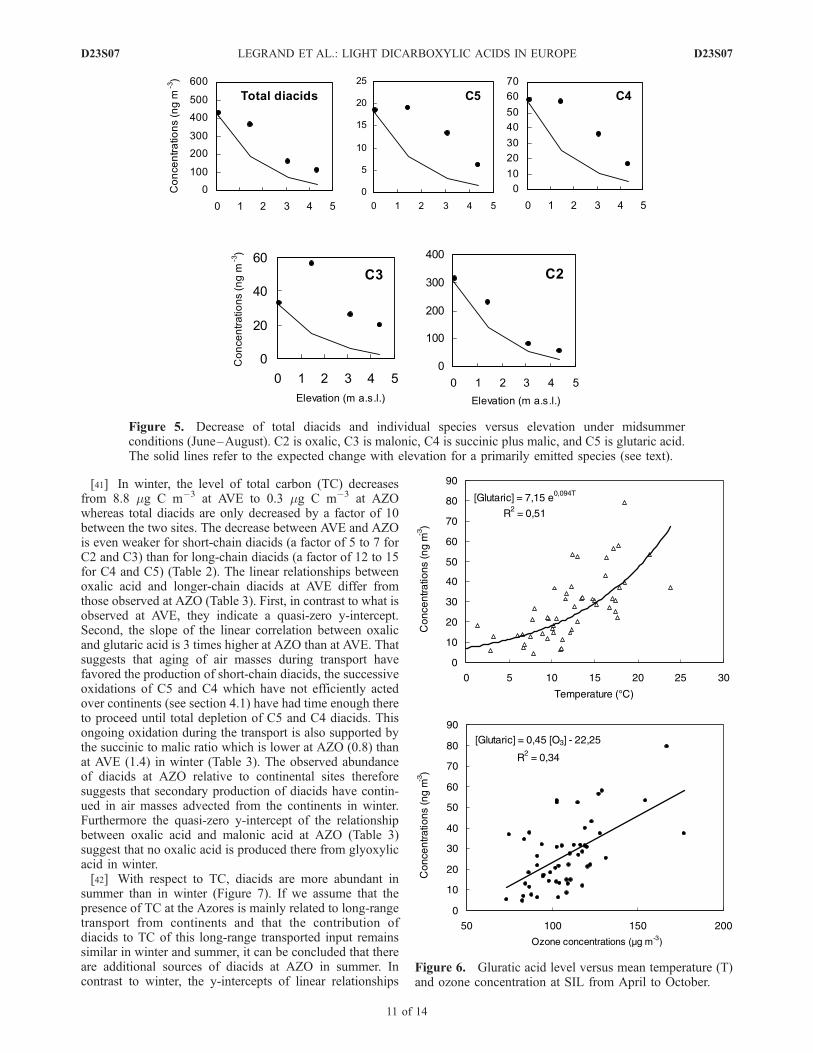
altitude for midsummer conditions (June to August) be-tween total diacids and other species like potassium andsulfate. We here have discarded data from SIL which arevery particular with respect to diacids as will be discussed insection 7. From the surface to 4360 m elevation the level ofprimary specie (potassium) decreases exponentially by afactor 11 whereas the ones of sulfate and total diacids onlydecrease by a factor of 8 and 4, respectively.[34] Figure 5 shows important differences in vertical
profile of the individual diacids. From the surface to1500 m elevation glutaric and C4 diacids remain unchangedwhereas oxalic acid decreases but to a lesser extent than aprimary specie. The decrease between the surface and4300 m elevation is weaker for C4–C5 diacids (glutaric,succinic, and malic) than for oxalic acid (a factor of to 2 to3 instead of 5.7). As a result, although being the end productof oxidation processes, oxalic acid is still the major diacid at4360 m elevation but its contribution to total diacids (60%)becomes weaker there than at lower elevation (�70%). Thisfinding of a weakened contribution of oxalic to the total massof diacids when aerosol has experienced enough cloudcycles to reach steady state is in agreement with simulations
D23S07 LEGRAND ET AL.: LIGHT DICARBOXYLIC ACIDS IN EUROPE
8 of 14
D23S07
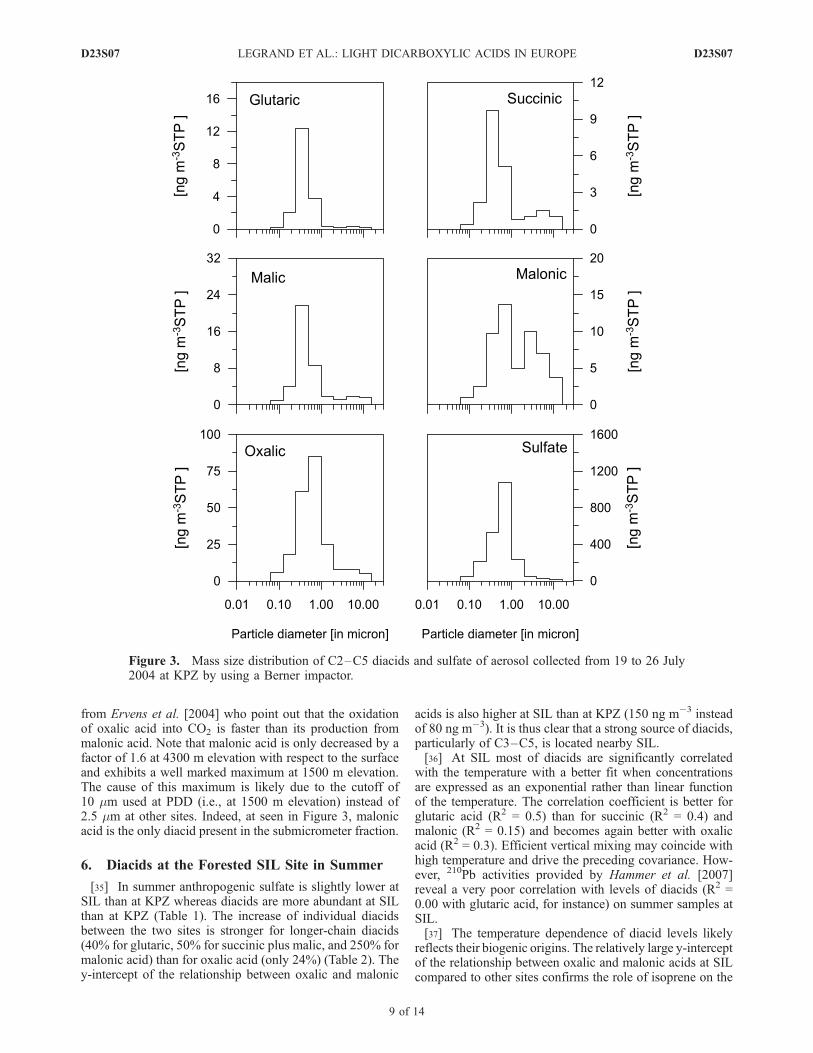
from Ervens et al. [2004] who point out that the oxidationof oxalic acid into CO2 is faster than its production frommalonic acid. Note that malonic acid is only decreased by afactor of 1.6 at 4300 m elevation with respect to the surfaceand exhibits a well marked maximum at 1500 m elevation.The cause of this maximum is likely due to the cutoff of10 mm used at PDD (i.e., at 1500 m elevation) instead of2.5 mm at other sites. Indeed, at seen in Figure 3, malonicacid is the only diacid present in the submicrometer fraction.
6. Diacids at the Forested SIL Site in Summer
[35] In summer anthropogenic sulfate is slightly lower atSIL than at KPZ whereas diacids are more abundant at SILthan at KPZ (Table 1). The increase of individual diacidsbetween the two sites is stronger for longer-chain diacids(40% for glutaric, 50% for succinic plus malic, and 250% formalonic acid) than for oxalic acid (only 24%) (Table 2). They-intercept of the relationship between oxalic and malonic
acids is also higher at SIL than at KPZ (150 ng m�3 insteadof 80 ng m�3). It is thus clear that a strong source of diacids,particularly of C3–C5, is located nearby SIL.[36] At SIL most of diacids are significantly correlated
with the temperature with a better fit when concentrationsare expressed as an exponential rather than linear functionof the temperature. The correlation coefficient is better forglutaric acid (R2 = 0.5) than for succinic (R2 = 0.4) andmalonic (R2 = 0.15) and becomes again better with oxalicacid (R2 = 0.3). Efficient vertical mixing may coincide withhigh temperature and drive the preceding covariance. How-ever, 210Pb activities provided by Hammer et al. [2007]reveal a very poor correlation with levels of diacids (R2 =0.00 with glutaric acid, for instance) on summer samples atSIL.[37] The temperature dependence of diacid levels likely
reflects their biogenic origins. The relatively large y-interceptof the relationship between oxalic and malonic acids at SILcompared to other sites confirms the role of isoprene on the
Figure 3. Mass size distribution of C2–C5 diacids and sulfate of aerosol collected from 19 to 26 July2004 at KPZ by using a Berner impactor.
D23S07 LEGRAND ET AL.: LIGHT DICARBOXYLIC ACIDS IN EUROPE
9 of 14
D23S07
budget of oxalic acid since the spatial distribution of esti-mated isoprene emissions in Europe shows highest emissionsin the area located 200 km west of SIL, in the east flank ofFrance [Simpson et al., 1995]. In this area isoprene emissionsare as high as 1.5 to 2.5 tons km�2 yr�1 compared to 0.6 to1.0 tons km�2 yr�1 in the vicinity of KPZ. Furthermore thepresence of acetic acid which may also be further oxidizedinto glyoxylic acid (Figure 2) was mainly attributed to directemissions from vegetation and forest in France [Legrand etal., 2003].[38] The relatively large abundance of C3–C5 diacids at
SIL with respect to KPZ remains less clear. Among C2–C5diacids, only glutaric acid exhibits a significant dependenceto both temperature and ozone levels whereas other diacidsare only significantly correlated to temperature. The doubledependence of glutaric acid to O3 levels and T is illustratedin Figure 6. The good relationship between glutaric acid and
ozone levels (R2 = 0.34) suggests that glutaric acid isproduced from the oxidation of a biogenic compound byozone. Oleic acid, an unsaturated fatty acid present in treeleafs, is a plausible candidate as suggested by laboratoryexperiments which show that ozone reacts on oleic acid toform azelaic acid as a dominant product and shorter diacids,in particular C4–C6 [Matsunaga et al., 1999]. However, alarger abundance of azelaic acid than glutaric acid isexpected which is not observed at SIL (2.4 ng m�3 ofazelaic acid [Oliveira et al., 2007] against 27 ng m�3 ofglutaric acid). Furthermore the similar level of oleic acid atSIL and KPZ (1.6 ng m�3 [Oliveira et al., 2007]) cannotexplain alone the larger abundance of C2–C5 diacids foundat SIL compared to KPZ.[39] The site of SIL is located in the dense forested area
of the Black Forest (�8000 km2) which emits large amountsof monoterpenes in summer. At the scale of West Germanymonoterpene emissions are far larger (0.7 tons yr�1 km�2)than in France (0.22 tons yr�1 km�2) or Hungary (0.065tons yr�1 km�2) for instance [Simpson et al., 1999].Although secondary production of organic aerosol frommonoterpenes is controlled by O3 [Griffin et al., 1999],C2–C5 diacids are not predicted to be formed here. Theglutaric acid level increases exponentially with temperature(Figure 6) with a slope dln [Glu]/dT of 0.094�C�1. Thisvalue of the slope is very similar to the mean sloperecommended in the literature to describe the temperaturedependence of emissions of OVOCs (volatile organic com-pounds others than isoprene and monoterpenes) and mono-terpenes (0.09�C�1 [Kesselmeier and Staudt, 1999]).Although having been less investigated than isoprene andmonoterpenes, vegetation emissions of OCOVs are knownto include a large spectrum of oxygenated compoundsamong which several species may act as precursors ofdiacids. Emissions of OVOCs by vegetation are higher inwest Germany than in France (0.5 tons yr�1 km�2 instead of0.2 tons yr�1 km�2). The observed good correlation be-tween glutaric acid level and temperature at SIL may becaused by OVOC emissions. In addition, since there areliquid phase processes that are not yet understood we cannottotally exclude that some of them can produce diacids likeglutaric acid. As an example Altieri et al. [2006] recentlysuggested that pyruvic acid can form oligomers in cloudwater and from them oxalic acid. Although not yet docu-mented we cannot exclude that oligomers formed fromterpene oxidation products formed longer diacids, thusexplaining the observed dln [Glu]/dT slope of 0.094�C�1.
7. Origins of Diacids at the Marine AZO Site
[40] Total C2–C5 diacids are around 5 times less abun-dant at AZO than at AVE (65 ng m�3 instead of 350 ngm�3, Table 1) and slightly higher than values previouslyreported for very remote marine boundary layer, 25–45 ngm�3 in the tropical Pacific ocean [Kawamura and Usukura,1993; Kawamura and Sakaguchi, 1999]. As seen in Table 2,the ratio of total diacids-C to TC at AZO is higher than atAVE. The presence of diacids in the marine atmospherehave been attributed either to long-range transport fromindustrialized continents or in situ photochemical produc-tion but the respective contribution of the two sources havenot yet been examined on seasonal basis.
Figure 4. Exponential decreases of the level of non-sea-salt-non-dust potassium, anthropogenic sulfate, and totaldiacids versus elevation under midsummer conditions(June–August). The non-sea-salt-non-dust potassium levelat SBO is not reported for because of a calciumcontamination [see Pio et al., 2007].
D23S07 LEGRAND ET AL.: LIGHT DICARBOXYLIC ACIDS IN EUROPE
10 of 14
D23S07
[41] In winter, the level of total carbon (TC) decreasesfrom 8.8 mg C m�3 at AVE to 0.3 mg C m�3 at AZOwhereas total diacids are only decreased by a factor of 10between the two sites. The decrease between AVE and AZOis even weaker for short-chain diacids (a factor of 5 to 7 forC2 and C3) than for long-chain diacids (a factor of 12 to 15for C4 and C5) (Table 2). The linear relationships betweenoxalic acid and longer-chain diacids at AVE differ fromthose observed at AZO (Table 3). First, in contrast to what isobserved at AVE, they indicate a quasi-zero y-intercept.Second, the slope of the linear correlation between oxalicand glutaric acid is 3 times higher at AZO than at AVE. Thatsuggests that aging of air masses during transport havefavored the production of short-chain diacids, the successiveoxidations of C5 and C4 which have not efficiently actedover continents (see section 4.1) have had time enough thereto proceed until total depletion of C5 and C4 diacids. Thisongoing oxidation during the transport is also supported bythe succinic to malic ratio which is lower at AZO (0.8) thanat AVE (1.4) in winter (Table 3). The observed abundanceof diacids at AZO relative to continental sites thereforesuggests that secondary production of diacids have contin-ued in air masses advected from the continents in winter.Furthermore the quasi-zero y-intercept of the relationshipbetween oxalic acid and malonic acid at AZO (Table 3)suggest that no oxalic acid is produced there from glyoxylicacid in winter.[42] With respect to TC, diacids are more abundant in
summer than in winter (Figure 7). If we assume that thepresence of TC at the Azores is mainly related to long-rangetransport from continents and that the contribution ofdiacids to TC of this long-range transported input remainssimilar in winter and summer, it can be concluded that thereare additional sources of diacids at AZO in summer. Incontrast to winter, the y-intercepts of linear relationships
Figure 5. Decrease of total diacids and individual species versus elevation under midsummerconditions (June–August). C2 is oxalic, C3 is malonic, C4 is succinic plus malic, and C5 is glutaric acid.The solid lines refer to the expected change with elevation for a primarily emitted species (see text).
Figure 6. Gluratic acid level versus mean temperature (T)and ozone concentration at SIL from April to October.
D23S07 LEGRAND ET AL.: LIGHT DICARBOXYLIC ACIDS IN EUROPE
11 of 14
D23S07
between oxalic acid and longer-chain diacids at AZO differfrom zero in summer (Table 3). This observation supportsthe preceding assumption that in addition to the long-rangetransport from continents which mainly explains the pres-ence of all diacids in winter at AZO, other sources ofdiacids exist there in summer. If not we would expect anincrease of the slope for the different relationships betweenoxalic acid and longer-chain diacids in summer compared towinter and that is not the case as seen in Table 3. Unsat-urated fatty acids such as linoleic and oleic acids, that arecommon in phytoplankton, were detected in aerosol atAZO, particularly in summer [Oliveira et al., 2007]. They
may act as precursors of C4 and C5 diacids at AZO insummer.[43] The y-intercept of the linear relationship between
oxalic and malonic acid in summer (35 ng m�3, Table 3)suggests that, in addition to the oxidation of C3–C5 diacidsinto oxalic acid, another source of oxalic acid exists. Etheneemitted from the marine biosphere may act as a precursor ofoxalic acid via the aqueous phase oxidation of glyoxal andhydroxyacetaldehyde into glyoxylic acid thereafter oxidizedinto oxalic acid (Figure 2).Warneck [2003] estimated that inthe marine atmosphere 8 to 16 ng m�3 of oxalic acid may beproduced by the oxidation of ethene.
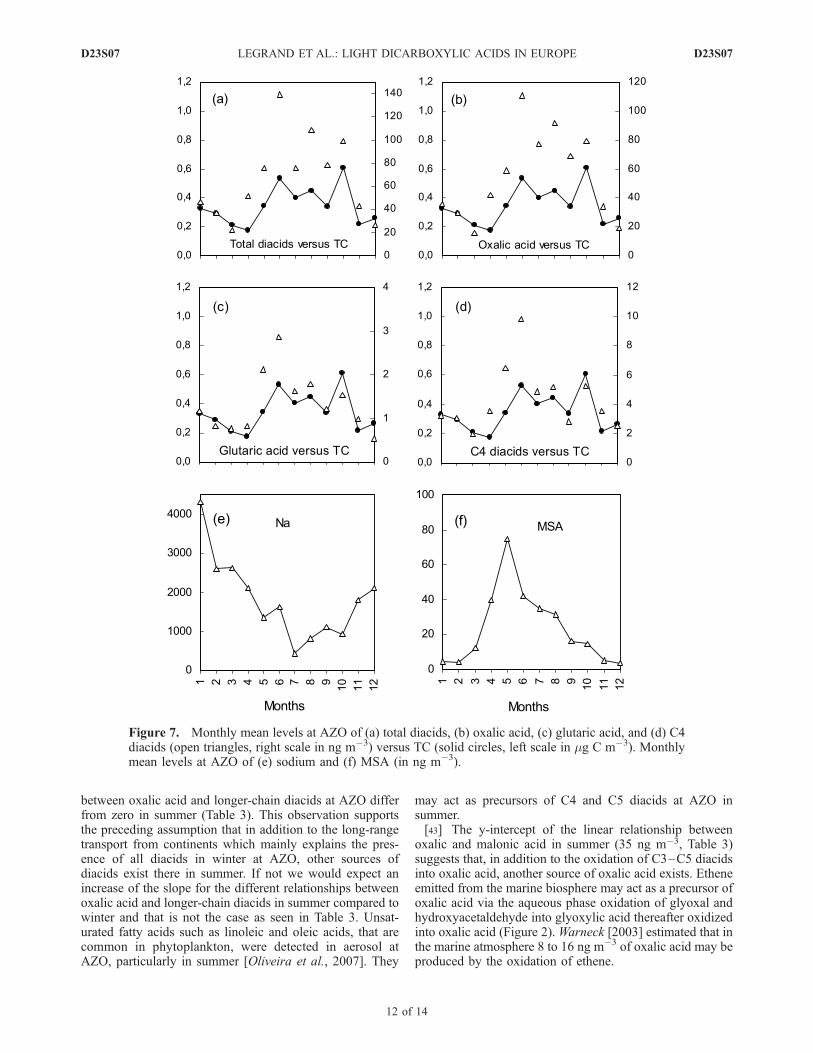
Figure 7. Monthly mean levels at AZO of (a) total diacids, (b) oxalic acid, (c) glutaric acid, and (d) C4diacids (open triangles, right scale in ng m�3) versus TC (solid circles, left scale in mg C m�3). Monthlymean levels at AZO of (e) sodium and (f) MSA (in ng m�3).
D23S07 LEGRAND ET AL.: LIGHT DICARBOXYLIC ACIDS IN EUROPE
12 of 14
D23S07
[44] As seen in Figure 7 there are some differences in thetemporal recovery of summer level of diacids. WhereasC4–C5 diacids peak in May–June, oxalic acid remainshigh from April to September. Such a difference is not asurprise given the two processes here involved. Unsaturatedfatty acids are emitted into the atmosphere with sea-saltparticles whereas gaseous emissions of ethene are thoughtto be related to the presence of dissolved organic materialreleased in seawater by algae then photochemically trans-formed into alkenes [Ratte et al., 1998]. Emissions ofunsaturated fatty acids would accompany sea-salt emissionswhich are higher in spring than in summer as suggested bysodium levels (Figure 7). Emissions of ethene are controlledby radiations which are larger during the entire summerperiod. Note that the level of total diacids sometimes largelyexceeds that of MSA (Figure 7) which is interestingbecause, in addition to sulfur species derived from DMSoxidation, these highly water soluble organic diacids maycontribute to CCN mass in the marine atmosphere.[45] In conclusion this year-round study of diacids at a
marine site suggests that, in addition to secondary produc-tion of diacids during transport of air masses advected fromcontinents, unsaturated fatty acids from phytoplanktonemitted with sea salt and ethene produced by photooxida-tion of dissolved organic carbon represent a local source ofdiacids in summer.
8. Conclusions
[46] A two-year-round climatology of C2–C5 diacidsobtained in Europe was discussed versus environmentalconditions at sites (marine/continental, rural/forested,boundary layer/free troposphere, and winter/summer).Backed up by additional investigations on radioisotope(210Pb), inorganic fractions (anthropogenic sulfate, and finefraction of primarily emitted potassium), and organic com-pounds (total organic carbon, n-alkanes, levoglucosan) thediacid observations have been used to highlight their origins.Continental surface sites seem to be influenced in winter byfast production of C2–C5 diacids in wood burning plumes,and secondary aqueous phase production of oxalic acid fromaldehydes formed by the rapid oxidation of toluene andethene emitted by cars. Whereas C3–C5 diacids seem tocome mainly from wood burning plumes, it is suggested thataround two thirds of C2 are related to this source and onethird of C2 to secondary production from toluene and ethenevehicular emissions. In summer, vehicular emissions andwood burning plumes are more efficiently dispersed from theboundary layer and emissions from larger scale becomeimportant. It is suggested that 30–40% of C2 are related toaqueous production from biogenic precursors (isoprene andacetic acid emitted by vegetation). The presence of C3–C5diacids and of the left fraction of oxalic acid is less clear,likely related to other biogenic precursors (unsaturated fattyacids and oxygenated volatile organic compounds). Furtherworks are here needed to evaluate possible aqueous phaseproduction of oligomers from products of monoterpeneoxidation. Observations support the suggested aqueous ox-idation of longer into shorter diacids. These reactions whichmainly take place in summer are slower than the oxidation ofSO2 into sulfate, leading to an enrichment of diacids inaerosol in the free troposphere. Diacids present at the Azores
are not only related to long-range transport from continentsbut also to in situ productions from precursors emitted by themarine biosphere (particulate unsaturated fatty acids andethene) in summer. Finally, whatever the season and the site,secondary aqueous phase productions always appear impor-tant for the budget of diacids. That stimulates further studiesof these liquid phase reactions since other species likeoligomers, which might contribute more to aerosol mass,are here suspected to be produced as well.
[47] Acknowledgments. The project was funded by EU contractEVK2 CT2001-00113. The authors acknowledge the contribution of manymembers of the CARBOSOL team for sampling, sample handling andtransfer. The authors would like to thank the three anonymous reviewers fortheir helpful comments on the manuscript and Barbara Ervens and KimitakaKawamura for helpful discussions.
ReferencesAltieri, K. E., A. G. Carlton, H.-J. Lim, B. J. Turpin, and S. P. Seitzinger(2006), Evidence for oligomer formation in clouds: Reactions of isopreneoxidation products, Environ. Sci. Technol., 40, 4956–4960.
Ariya, P. A., O. Nepotchatykh, O. Ignatova, and M. Amyor (2002), Micro-biological degradation of atmospheric organic compounds, Geophys. Res.Lett., 29(22), 2077, doi:10.1029/2002GL015637.
Cachier, H., J. Ducret,M. P. Bremond, A. Gaudichet, J. P. Lacaux, V. Yoboue,and J. Baudet (1991), Characterisation of biomass burning aerosols insavanna region of the Ivory Coast, in Global Biomass Burning, editedby J. Levine, pp. 174–180, MIT Press, Cambridge, Mass.
Carlton, A. G., B. J. Turpin, H.-J. Lim, K. E. Altieri, and S. Seitzinger(2006), Link between isoprene and secondary organic aerosol (SOA):Pyruvic acid oxidation yields low volatility organic acids in clouds, Geo-phys. Res. Lett., 33, L06822, doi:10.1029/2005GL025374.
Cruz, C. N., and S. N. Pandis (1997), A study of the ability of secondaryorganic aerosol to act as cloud condensation nuclei, Atmos. Environ., 31,2205–2214.
Cruz, C. N., and S. N. Pandis (1998), The effect of organic coatings on thecloud condensation nuclei activation of inorganic atmospheric aerosol,J. Geophys. Res., 103, 13,111–13,123.
Ervens, B., et al. (2003a), CAPRAM 2.4 (MODAC mechanism): An ex-tended and condensed tropospheric aqueous phase mechanism and its ap-plication, J. Geophys. Res., 108(D14), 4426, doi:10.1029/2002JD002202.
Ervens, B., S.Gligorovski, andH.Herrmann (2003b), Temperature-dependentrate constants for hydroxyl radical reactions with organic compounds inaqueous phase, Phys. Chem. Chem. Phys., 5, 1811–1824.
Ervens, B., G. Feingold, G. J. Frost, and S. M. Kreidenweis (2004), Amodeling study of aqueous production of dicarboxylic acids: 1. Chemicalpathways and speciated organic mass production, J. Geophys. Res., 109,D15205, doi:10.1029/2003JD004387.
Gao, S., D. A. Hegg, P. V. Hobbs, T. W. Kirchstetter, B. I. Magi, andM. Sadilek (2003), Water-soluble organic components in aerosols asso-ciated with savanna fires in southern Africa: Identification, evolution,and distribution, J. Geophys. Res., 108(D13), 8491, doi:10.1029/2002JD002324.
Griffin, R. J., D. R. Cocker III, R. C. Flagan, and J. H. Seinfeld (1999),Organic aerosol formation from the oxidation of biogenic hydrocarbons,J. Geophys. Res., 104, 3555–3567.
Grosjean, D. (1989), Organic acids in southern California air: Ambientconcentrations, mobile source emissions, in situ formation and removalprocesses, Environ. Sci. Technol., 23, 1506–1514.
Hammer, S., D. Wagenbach, S. Preunkert, C. Pio, and F. Meinhardt (2007),Observations of 210Pb within CARBOSOL: A diagnostic tool for asses-sing the spatiotemporal variability of related chemical aerosol species?,J. Geophys. Res., doi:10.1029/2006JD008065, in press.
Hatakeyama, S., T. Tanonaka, J. Weng, H. Bandow, H. Takagi, andH. Akimoto (1985), Ozone-cyclohexene reaction in air: Quantitativeanalyses of particulate products and the reaction mechanism, Environ.Sci. Technol., 19, 935–942.
Kalberer, M., J. Yu, D. R. Cocker, R. C. Flagan, and J. H. Seinfeld (2000),Aerosol formation in the cyclohexene-ozone system, Environ. Sci. Tech-nol., 34, 4894–4901.
Kawamura, K., and R. B. Gagosian (1987), Implications of w-oxocarboxylicacids in the remote atmosphere for photo-oxidation of unsaturated fattyacids, Nature, 325, 330–332.
Kawamura, K., and K. Ikushima (1993), Seasonal changes in the distribu-tion of dicarboxylic acids in the urban atmosphere, Environ. Sci. Tech-nol., 27, 2227–2235.
D23S07 LEGRAND ET AL.: LIGHT DICARBOXYLIC ACIDS IN EUROPE
13 of 14
D23S07

Kawamura, K., and I. R. Kaplan (1987), Motor exhaust emissions as pri-mary source for dicarboxylic acids in Los Angeles ambient air, Environ.Sci. Technol., 21, 105–110.
Kawamura, K., and F. Sakaguchi (1999), Molecular distribution of watersoluble dicarboxylic acids in marine aerosols over the Pacific Oceanincluding tropics, J. Geophys. Res., 104, 3501–3509.
Kawamura, K., and K. Usukura (1993), Distributions of low molecularweight dicarboxylic acids in the north Pacific aerosol samples, J. Ocea-nogr., 49, 271–283.
Kerminen, V.-M., C. Ojanen, T. Pakkanen, R. Hillamo, M. Aurela, andJ. Merilainen (2000), Low-molecular-weight dicarboxylic acids in anurban and rural atmosphere, J. Aerosol Sci., 31, 349–362.
Kesselmeier, J., and M. Staudt (1999), Biogenic volatile organic com-pounds (VOC): An overview on emission, physiology, and ecology,J. Atmos. Chem., 33, 23–88.
Legrand, M., and H. Puxbaum (2007), Summary of the CARBOSOL pro-ject: Present and retrospective state of organic versus inorganic aerosolover Europe, J. Geophys. Res., doi:10.1029/2006JD008271, in press.
Legrand, M., S. Preunkert, D. Wagenbach, H. Cachier, and H. Puxbaum(2003), A historical record of formate and acetate from a high-elevationAlpine glacier: Implications for their natural versus anthropogenic bud-gets at the European scale, J. Geophys. Res., 108(D24), 4788,doi:10.1029/2003JD003594.
Legrand, M., S. Preunkert, C. Galy-Lacaux, C. Liousse, and D. Wagenbach(2005), Atmospheric year-round records of dicarboxylic acids and sulfateat three French sites located between 630 and 4360 m elevation,J. Geophys. Res., 110, D13302, doi:10.1029/2004JD005515.
Lim, H.-J., A. G. Carlton, and B. J. Turpin (2005), Isoprene forms second-ary organic aerosol through cloud processing: Model simulations, Envir-on. Sci. Technol., 39, 4441–4446.
Limbeck, A., and H. Puxbaum (1999), Organic acids in continental back-ground aerosols, Atmos. Environ., 33, 1847–1852.
Mader, B. T., J. Z. Yu, J. H. Xu, Q. F. Li, W. S. Wu, R. C. Flagan, and J. H.Seinfeld (2004), Molecular composition of the water-soluble fraction ofatmospheric carbonaceous aerosols collected during ACE-Asia, J. Geo-phys. Res., 109, D06206, doi:10.1029/2003JD004105.
Matsunaga, S., K. Kawamura, T. Nakatsuka, and N. Ohkouchi (1999),Preliminary study on laboratory photochemical formation of low weightdicarboxylic acids from unsaturated fatty acid (oleic acid), Res. Org.Geochem., 14, 19–25.
Oliveira, T. S., C. A. Pio, C. A. Alves, A. J. D. Silvestre, M. Evtyugina, J. V.Afonso, P. Fialho, M. Legrand, H. Puxbaum, and A. Gelencser (2007),Seasonal variation of particulate lipophilic organic compounds at non-urban sites in Europe, J. Geophys. Res., doi:10.1029/2007JD008504, inpress.
Pio, C. A., et al. (2007), Climatology of aerosol composition (organicversus inorganic) at non-urban areas on a west-east transect across Eur-ope, J. Geophys. Res., doi:10.1029/2006JD008038, in press.
Preunkert, S., M. Legrand, and D. Wagenbach (2001), Sulfate trends in aCol du Dome (French Alps) ice core: A record of anthropogenic sulphatelevels in the European midtroposphere over the twentieth century,J. Geophys. Res., 106, 31,991–32,004.
Preunkert, S., D. Wagenbach, and M. Legrand (2002), Improvement andcharacterization of an automatic aerosol sampler at high-Alpine drillingsites, Atmos. Environ., 36, 1221–1232.
Puxbaum, H., A. Caseiro, A. Sanchez-Ochoa, A. Kasper-Giebl, M. Claeys,A. Gelencser, M. Legrand, S. Preunkert, and C. Pio (2007), Levoglucosanlevels at background sites in Europe for assessing the impact of biomasscombustion on the European aerosol background, J. Geophys. Res.,doi:10.1029/2006JD008114, in press.
Ratte, M., O. Bulok, A. Spitzy, and J. Rudolph (1998), Photochemicalalkene formation in seawater from dissolved organic carbon: Resultsfrom laboratory experiments, J. Geophys. Res., 103, 5707–5715.
Ricard, V., J.-L. Jaffrezo, V.-M. Kerminen, R. E. Hillamo, M. Sillanpaa,S. Ruellan, C. Liousse, and H. Cachier (2002), Two years of continuousaerosol measurements in northern Finland, J. Geophys. Res., 107(D11),4129, doi:10.1029/2001JD000952.
Rogge, W. F., L. M. Hildemann, M. A. Mazurek, G. R. Cass, and B. R. T.Simoneit (1991), Sources of fine organic aerosol. 1. Charbrollers andmeat cooking operations, Environ. Sci. Technol., 25, 1112–1125.
Rogge, W. F., M. A. Mazurek, L. M. Hildemann, and G. R. Cass (1993),Quantification of urban organic aerosol at a molecular level: Identifica-tion, abundance and seasonal variation, Atmos. Environ., 27, 1309–1330.
Rogge, W. F., L. M. Hildemann, M. A. Mazurek, G. R. Cass, and B. R. T.Simoneit (1998), Sources of fine organic aerosol. 9. Pine, oak, and syn-thetic log combustion in residential fireplaces, Environ. Sci. Technol., 32,13–22.
Rohrl, A., and G. Lammel (2001), Low-molecular weight dicarboxylicacids and glyoxylic acid: Seasonal and air mass characteristics, Environ.Sci. Technol., 35, 95–101.
Saxena, P., and L. M. Hildemann (1996), Water-soluble organics in atmo-spheric particles: A critical review of the literature and application ofthermodynamics to identify candidate compounds, J. Atmos. Chem.,24, 57–109.
Schauer, J. J., W. F. Rogge, L. M. Hildemann, M. A. Mazurek, and G. R.Cass (1996), Source apportionment of airborne particulate matter usingorganic compounds as tracers, Atmos. Environ., 30, 3837–3855.
Sempere, R., and K. Kawamura (2003), Trans-hemispheric contribution ofC2–C10 a, w-dicarboxylic acids, and related polar compounds to water-soluble organic carbon in the western Pacific aerosols in relation tophotochemical oxidation reactions, Global Biogeochem. Cycles, 17(2),1069, doi:10.1029/2002GB001980.
Sillanpaa, S., S. Saarikoski, R. Hillamo, A. Pennanen, U. Makkonen,Z. Spolnik, R. Van Grieken, T. Koskentalo, and R. Salonen (2005), Che-mical composition, mass size distribution and sources analysis of long-range transported wildfire smokes in Helsinki, Sci. Total Environ., 350,119–135.
Simpson, S., A. Guenther, C. N. Hewitt, and R. Steinbrecher (1995), Bio-genic emissions in Europe: 1. Estimates and uncertainties, J. Geophys.Res., 100, 22,875–22,890.
Simpson, S., et al. (1999), Inventorying emissions from nature in Europe,J. Geophys. Res., 104, 8113–8152.
Warneck, P. (2003), In-cloud chemistry opens pathway to the formation ofoxalic acid in the marine atmosphere, Atmos. Environ., 37, 2423–2427.
�����������������������A. Gelencser, Air Chemistry Group of the Hungarian Academy of
Sciences, University of Pannonia, Egyetem u. 10, H-8200 Veszprem,Hungary.S. Hammer, Institut fur Umweltphysik, Ruprecht Karls-Universitat
Heidelberg, D-69120 Heidelberg, Germany.A. Kasper-Giebl, Institute for Chemical Technologies and Analytics,
Vienna University of Technology, Getreidemarkt 9/164-UPA, A-1060Vienna, Austria.P. Laj, Laboratoire de Meteorologie Physique, Centre National de la
Recherche Scientifique, Universite Blaise Pascal, 24 Avenue des Landais,F-63177 Aubiere cedex, France.M. Legrand and S. Preunkert, Laboratoire de Glaciologie et Geophysique
de l’Environnement, Centre National de la Recherche Scientifique, St.Martin d’Heres F-38402, France. ([email protected])T. Oliveira and C. A. Pio, Departamento de Ambiente e Ordenamento,
Universidade de Aveiro, 3810-193 Aveiro, Portugal.
D23S07 LEGRAND ET AL.: LIGHT DICARBOXYLIC ACIDS IN EUROPE
14 of 14
D23S07
Copyright © 2022 FDOKUMEN