Relationship between Permeability Glycoprotein (P-gp) Gene ...
Upload
independentCategory
view
0download
0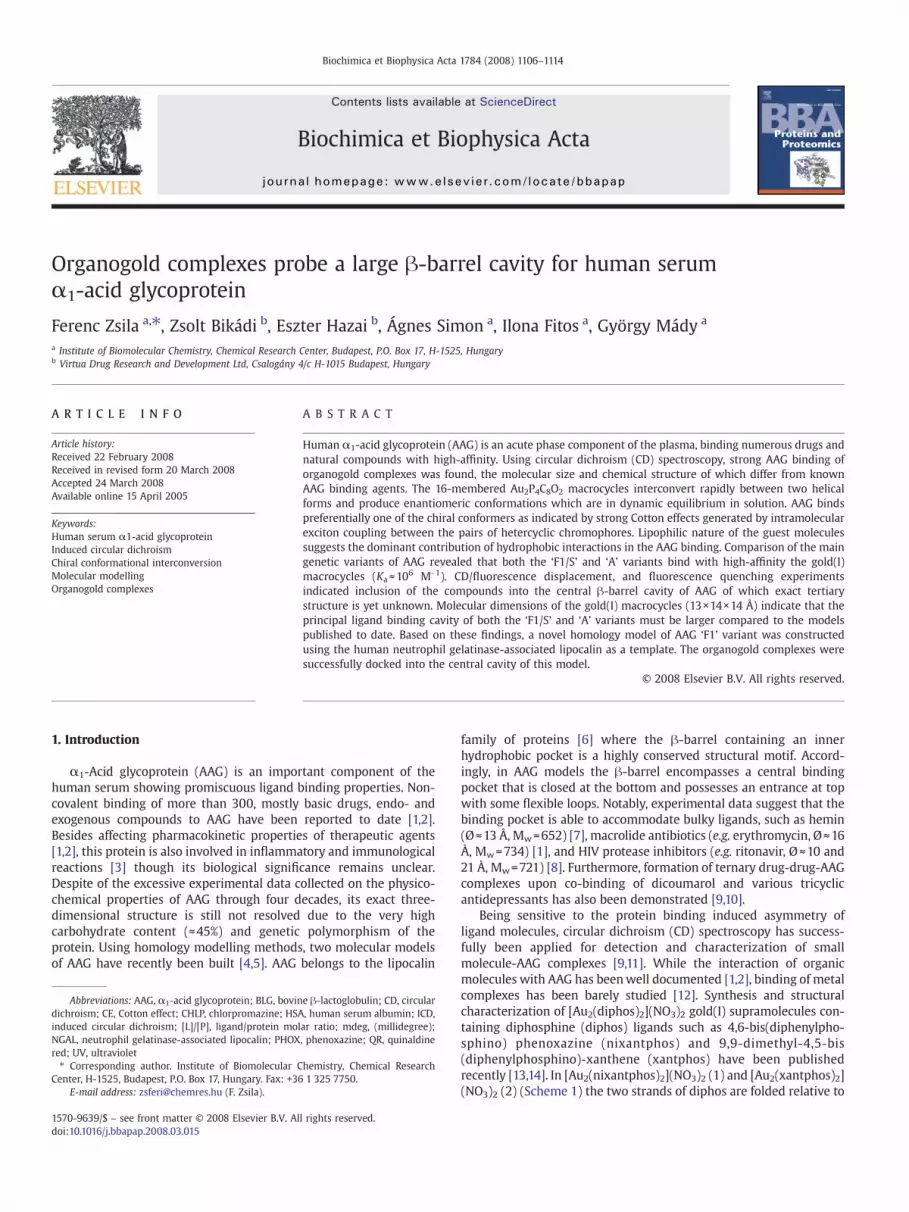
Biochimica et Biophysica Acta 1784 (2008) 1106–1114
Contents lists available at ScienceDirect
Biochimica et Biophysica Acta
j ourna l homepage: www.e lsev ie r.com/ locate /bbapap
Organogold complexes probe a large β-barrel cavity for human serumα1-acid glycoprotein
Ferenc Zsila a,⁎, Zsolt Bikádi b, Eszter Hazai b, Ágnes Simon a, Ilona Fitos a, György Mády a
a Institute of Biomolecular Chemistry, Chemical Research Center, Budapest, P.O. Box 17, H-1525, Hungaryb Virtua Drug Research and Development Ltd, Csalogány 4/c H-1015 Budapest, Hungary
Abbreviations: AAG, α1-acid glycoprotein; BLG, bovindichroism; CE, Cotton effect; CHLP, chlorpromazine; HSAinduced circular dichroism; [L]/[P], ligand/protein molNGAL, neutrophil gelatinase-associated lipocalin; PHOXred; UV, ultraviolet⁎ Corresponding author. Institute of Biomolecular C
Center, H-1525, Budapest, P.O. Box 17, Hungary. Fax: +36E-mail address: [email protected] (F. Zsila).
1570-9639/$ – see front matter © 2008 Elsevier B.V. Aldoi:10.1016/j.bbapap.2008.03.015
A B S T R A C T
A R T I C L E I N F OArticle history:
Human α1-acid glycoprotein Received 22 February 2008Received in revised form 20 March 2008Accepted 24 March 2008Available online 15 April 2005Keywords:Human serum α1-acid glycoproteinInduced circular dichroismChiral conformational interconversionMolecular modellingOrganogold complexes
(AAG) is an acute phase component of the plasma, binding numerous drugs andnatural compounds with high-affinity. Using circular dichroism (CD) spectroscopy, strong AAG binding oforganogold complexes was found, the molecular size and chemical structure of which differ from knownAAG binding agents. The 16-membered Au2P4C8O2 macrocycles interconvert rapidly between two helicalforms and produce enantiomeric conformations which are in dynamic equilibrium in solution. AAG bindspreferentially one of the chiral conformers as indicated by strong Cotton effects generated by intramolecularexciton coupling between the pairs of hetercyclic chromophores. Lipophilic nature of the guest moleculessuggests the dominant contribution of hydrophobic interactions in the AAG binding. Comparison of the maingenetic variants of AAG revealed that both the ‘F1/S’ and ‘A’ variants bind with high-affinity the gold(I)macrocycles (Ka≈106 M-1). CD/fluorescence displacement, and fluorescence quenching experimentsindicated inclusion of the compounds into the central β-barrel cavity of AAG of which exact tertiarystructure is yet unknown. Molecular dimensions of the gold(I) macrocycles (13×14×14 Å) indicate that theprincipal ligand binding cavity of both the ‘F1/S’ and ‘A’ variants must be larger compared to the modelspublished to date. Based on these findings, a novel homology model of AAG ‘F1’ variant was constructedusing the human neutrophil gelatinase-associated lipocalin as a template. The organogold complexes weresuccessfully docked into the central cavity of this model.
© 2008 Elsevier B.V. All rights reserved.
1. Introduction
α1-Acid glycoprotein (AAG) is an important component of thehuman serum showing promiscuous ligand binding properties. Non-covalent binding of more than 300, mostly basic drugs, endo- andexogenous compounds to AAG have been reported to date [1,2].Besides affecting pharmacokinetic properties of therapeutic agents[1,2], this protein is also involved in inflammatory and immunologicalreactions [3] though its biological significance remains unclear.Despite of the excessive experimental data collected on the physico-chemical properties of AAG through four decades, its exact three-dimensional structure is still not resolved due to the very highcarbohydrate content (≈45%) and genetic polymorphism of theprotein. Using homology modelling methods, two molecular modelsof AAG have recently been built [4,5]. AAG belongs to the lipocalin
e β-lactoglobulin; CD, circular, human serum albumin; ICD,ar ratio; mdeg, (millidegree);, phenoxazine; QR, quinaldine
hemistry, Chemical Research1 325 7750.
l rights reserved.
family of proteins [6] where the β-barrel containing an innerhydrophobic pocket is a highly conserved structural motif. Accord-ingly, in AAG models the β-barrel encompasses a central bindingpocket that is closed at the bottom and possesses an entrance at topwith some flexible loops. Notably, experimental data suggest that thebinding pocket is able to accommodate bulky ligands, such as hemin(Ø≈13 Å, Mw=652) [7], macrolide antibiotics (e.g. erythromycin, Ø≈16Å, Mw=734) [1], and HIV protease inhibitors (e.g. ritonavir, Ø≈10 and21 Å, Mw=721) [8]. Furthermore, formation of ternary drug-drug-AAGcomplexes upon co-binding of dicoumarol and various tricyclicantidepressants has also been demonstrated [9,10].
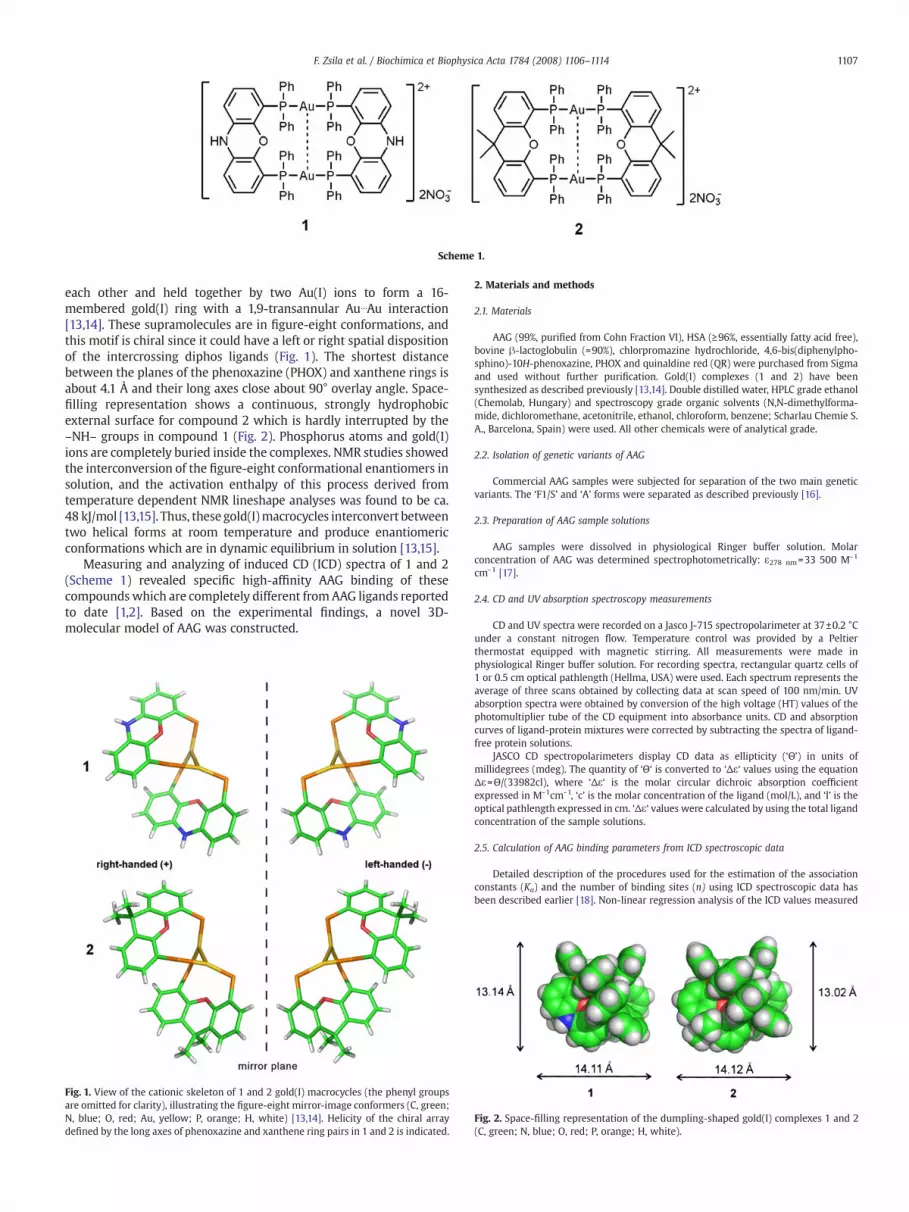
Being sensitive to the protein binding induced asymmetry ofligand molecules, circular dichroism (CD) spectroscopy has success-fully been applied for detection and characterization of smallmolecule-AAG complexes [9,11]. While the interaction of organicmolecules with AAG has beenwell documented [1,2], binding of metalcomplexes has been barely studied [12]. Synthesis and structuralcharacterization of [Au2(diphos)2](NO3)2 gold(I) supramolecules con-taining diphosphine (diphos) ligands such as 4,6-bis(diphenylpho-sphino) phenoxazine (nixantphos) and 9,9-dimethyl-4,5-bis(diphenylphosphino)-xanthene (xantphos) have been publishedrecently [13,14]. In [Au2(nixantphos)2](NO3)2 (1) and [Au2(xantphos)2](NO3)2 (2) (Scheme 1) the two strands of diphos are folded relative to
Scheme 1.
1107F. Zsila et al. / Biochimica et Biophysica Acta 1784 (2008) 1106–1114
each other and held together by two Au(I) ions to form a 16-membered gold(I) ring with a 1,9-transannular Au⋯Au interaction[13,14]. These supramolecules are in figure-eight conformations, andthis motif is chiral since it could have a left or right spatial dispositionof the intercrossing diphos ligands (Fig. 1). The shortest distancebetween the planes of the phenoxazine (PHOX) and xanthene rings isabout 4.1 Å and their long axes close about 90° overlay angle. Space-filling representation shows a continuous, strongly hydrophobicexternal surface for compound 2 which is hardly interrupted by the–NH– groups in compound 1 (Fig. 2). Phosphorus atoms and gold(I)ions are completely buried inside the complexes. NMR studies showedthe interconversion of the figure-eight conformational enantiomers insolution, and the activation enthalpy of this process derived fromtemperature dependent NMR lineshape analyses was found to be ca.48 kJ/mol [13,15]. Thus, these gold(I)macrocycles interconvert betweentwo helical forms at room temperature and produce enantiomericconformations which are in dynamic equilibrium in solution [13,15].
Measuring and analyzing of induced CD (ICD) spectra of 1 and 2(Scheme 1) revealed specific high-affinity AAG binding of thesecompoundswhich are completely different fromAAG ligands reportedto date [1,2]. Based on the experimental findings, a novel 3D-molecular model of AAG was constructed.
Fig. 1. View of the cationic skeleton of 1 and 2 gold(I) macrocycles (the phenyl groupsare omitted for clarity), illustrating the figure-eight mirror-image conformers (C, green;N, blue; O, red; Au, yellow; P, orange; H, white) [13,14]. Helicity of the chiral arraydefined by the long axes of phenoxazine and xanthene ring pairs in 1 and 2 is indicated.
2. Materials and methods
2.1. Materials
AAG (99%, purified from Cohn Fraction VI), HSA (≥96%, essentially fatty acid free),bovine β-lactoglobulin (≈90%), chlorpromazine hydrochloride, 4,6-bis(diphenylpho-sphino)-10H-phenoxazine, PHOX and quinaldine red (QR) were purchased from Sigmaand used without further purification. Gold(I) complexes (1 and 2) have beensynthesized as described previously [13,14]. Double distilled water, HPLC grade ethanol(Chemolab, Hungary) and spectroscopy grade organic solvents (N,N-dimethylforma-mide, dichloromethane, acetonitrile, ethanol, chloroform, benzene; Scharlau Chemie S.A., Barcelona, Spain) were used. All other chemicals were of analytical grade.
2.2. Isolation of genetic variants of AAG
Commercial AAG samples were subjected for separation of the two main geneticvariants. The ‘F1/S’ and ‘A’ forms were separated as described previously [16].
2.3. Preparation of AAG sample solutions
AAG samples were dissolved in physiological Ringer buffer solution. Molarconcentration of AAG was determined spectrophotometrically: ε278 nm=33 500 M-1
cm-1 [17].
2.4. CD and UV absorption spectroscopy measurements
CD and UV spectra were recorded on a Jasco J-715 spectropolarimeter at 37±0.2 °Cunder a constant nitrogen flow. Temperature control was provided by a Peltierthermostat equipped with magnetic stirring. All measurements were made inphysiological Ringer buffer solution. For recording spectra, rectangular quartz cells of1 or 0.5 cm optical pathlength (Hellma, USA) were used. Each spectrum represents theaverage of three scans obtained by collecting data at scan speed of 100 nm/min. UVabsorption spectra were obtained by conversion of the high voltage (HT) values of thephotomultiplier tube of the CD equipment into absorbance units. CD and absorptioncurves of ligand-protein mixtures were corrected by subtracting the spectra of ligand-free protein solutions.
JASCO CD spectropolarimeters display CD data as ellipticity (‘Θ’) in units ofmillidegrees (mdeg). The quantity of ‘Θ‘ is converted to ‘Δε‘ values using the equationΔε=Θ/(33982cl), where ‘Δε‘ is the molar circular dichroic absorption coefficientexpressed in M-1cm-1, ‘c’ is the molar concentration of the ligand (mol/L), and ‘l’ is theoptical pathlength expressed in cm. ‘Δε‘ values were calculated by using the total ligandconcentration of the sample solutions.
2.5. Calculation of AAG binding parameters from ICD spectroscopic data
Detailed description of the procedures used for the estimation of the associationconstants (Ka) and the number of binding sites (n) using ICD spectroscopic data hasbeen described earlier [18]. Non-linear regression analysis of the ICD values measured
Fig. 2. Space-filling representation of the dumpling-shaped gold(I) complexes 1 and 2(C, green; N, blue; O, red; P, orange; H, white).
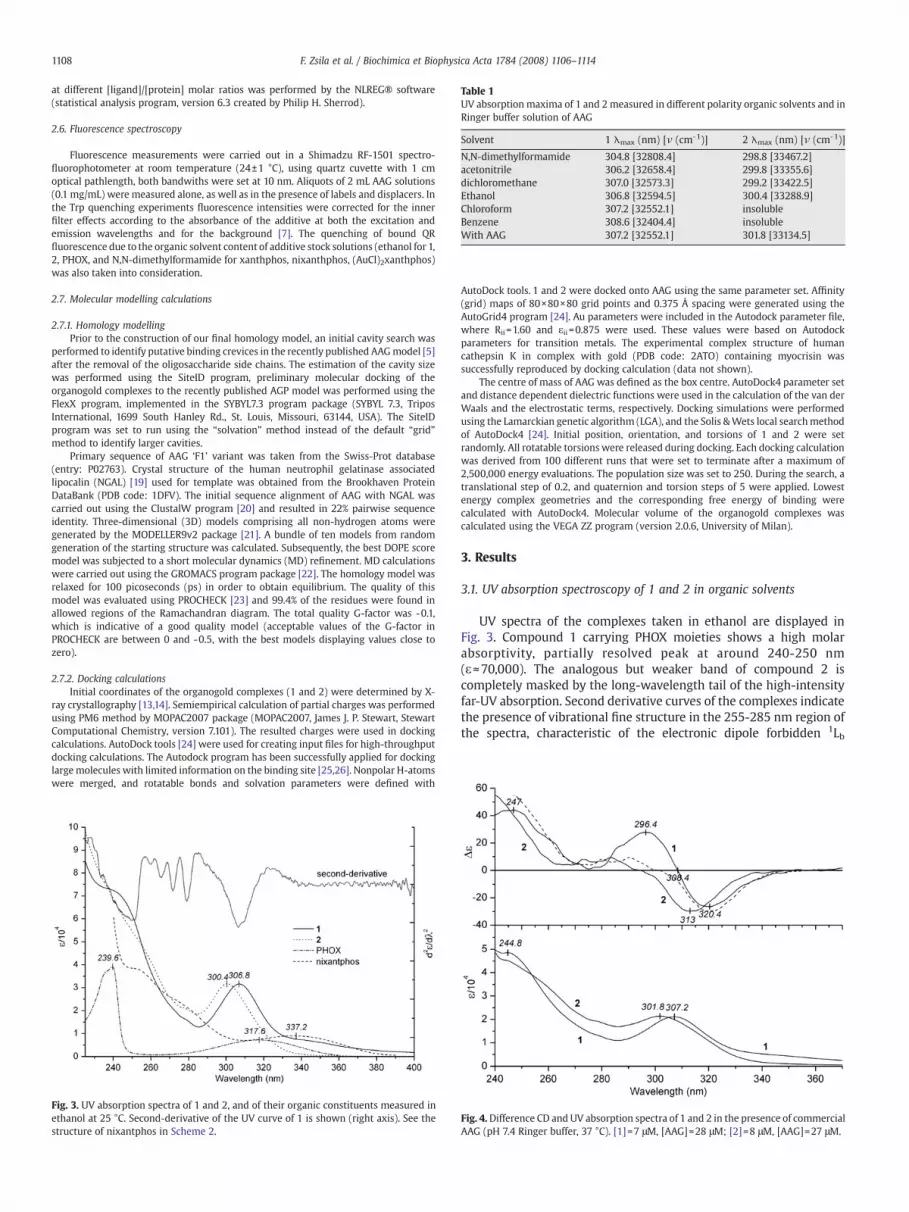
Table 1UV absorption maxima of 1 and 2measured in different polarity organic solvents and inRinger buffer solution of AAG
Solvent 1 λmax (nm) [ν (cm-1)] 2 λmax (nm) [ν (cm-1)]
N,N-dimethylformamide 304.8 [32808.4] 298.8 [33467.2]acetonitrile 306.2 [32658.4] 299.8 [33355.6]dichloromethane 307.0 [32573.3] 299.2 [33422.5]Ethanol 306.8 [32594.5] 300.4 [33288.9]Chloroform 307.2 [32552.1] insolubleBenzene 308.6 [32404.4] insolubleWith AAG 307.2 [32552.1] 301.8 [33134.5]
1108 F. Zsila et al. / Biochimica et Biophysica Acta 1784 (2008) 1106–1114
at different [ligand]/[protein] molar ratios was performed by the NLREG® software(statistical analysis program, version 6.3 created by Philip H. Sherrod).
2.6. Fluorescence spectroscopy
Fluorescence measurements were carried out in a Shimadzu RF-1501 spectro-fluorophotometer at room temperature (24±1 °C), using quartz cuvette with 1 cmoptical pathlength, both bandwiths were set at 10 nm. Aliquots of 2 mL AAG solutions(0.1 mg/mL) were measured alone, as well as in the presence of labels and displacers. Inthe Trp quenching experiments fluorescence intensities were corrected for the innerfilter effects according to the absorbance of the additive at both the excitation andemission wavelengths and for the background [7]. The quenching of bound QRfluorescence due to the organic solvent content of additive stock solutions (ethanol for 1,2, PHOX, and N,N-dimethylformamide for xanthphos, nixanthphos, (AuCl)2xanthphos)was also taken into consideration.
2.7. Molecular modelling calculations
2.7.1. Homology modellingPrior to the construction of our final homology model, an initial cavity search was
performed to identify putative binding crevices in the recently published AAGmodel [5]after the removal of the oligosaccharide side chains. The estimation of the cavity sizewas performed using the SiteID program, preliminary molecular docking of theorganogold complexes to the recently published AGP model was performed using theFlexX program, implemented in the SYBYL7.3 program package (SYBYL 7.3, TriposInternational, 1699 South Hanley Rd., St. Louis, Missouri, 63144, USA). The SiteIDprogram was set to run using the “solvation” method instead of the default “grid”method to identify larger cavities.
Primary sequence of AAG ‘F1’ variant was taken from the Swiss-Prot database(entry: P02763). Crystal structure of the human neutrophil gelatinase associatedlipocalin (NGAL) [19] used for template was obtained from the Brookhaven ProteinDataBank (PDB code: 1DFV). The initial sequence alignment of AAG with NGAL wascarried out using the ClustalW program [20] and resulted in 22% pairwise sequenceidentity. Three-dimensional (3D) models comprising all non-hydrogen atoms weregenerated by the MODELLER9v2 package [21]. A bundle of ten models from randomgeneration of the starting structure was calculated. Subsequently, the best DOPE scoremodel was subjected to a short molecular dynamics (MD) refinement. MD calculationswere carried out using the GROMACS program package [22]. The homology model wasrelaxed for 100 picoseconds (ps) in order to obtain equilibrium. The quality of thismodel was evaluated using PROCHECK [23] and 99.4% of the residues were found inallowed regions of the Ramachandran diagram. The total quality G-factor was -0.1,which is indicative of a good quality model (acceptable values of the G-factor inPROCHECK are between 0 and -0.5, with the best models displaying values close tozero).
2.7.2. Docking calculationsInitial coordinates of the organogold complexes (1 and 2) were determined by X-
ray crystallography [13,14]. Semiempirical calculation of partial charges was performedusing PM6 method by MOPAC2007 package (MOPAC2007, James J. P. Stewart, StewartComputational Chemistry, version 7.101). The resulted charges were used in dockingcalculations. AutoDock tools [24] were used for creating input files for high-throughputdocking calculations. The Autodock program has been successfully applied for dockinglargemolecules with limited information on the binding site [25,26]. Nonpolar H-atomswere merged, and rotatable bonds and solvation parameters were defined with
Fig. 3. UV absorption spectra of 1 and 2, and of their organic constituents measured inethanol at 25 °C. Second-derivative of the UV curve of 1 is shown (right axis). See thestructure of nixantphos in Scheme 2.
AutoDock tools. 1 and 2 were docked onto AAG using the same parameter set. Affinity(grid) maps of 80×80×80 grid points and 0.375 Å spacing were generated using theAutoGrid4 program [24]. Au parameters were included in the Autodock parameter file,where Rii=1.60 and εii =0.875 were used. These values were based on Autodockparameters for transition metals. The experimental complex structure of humancathepsin K in complex with gold (PDB code: 2ATO) containing myocrisin wassuccessfully reproduced by docking calculation (data not shown).
The centre of mass of AAG was defined as the box centre. AutoDock4 parameter setand distance dependent dielectric functions were used in the calculation of the van derWaals and the electrostatic terms, respectively. Docking simulations were performedusing the Lamarckian genetic algorithm (LGA), and the Solis &Wets local searchmethodof AutoDock4 [24]. Initial position, orientation, and torsions of 1 and 2 were setrandomly. All rotatable torsions were released during docking. Each docking calculationwas derived from 100 different runs that were set to terminate after a maximum of2,500,000 energy evaluations. The population size was set to 250. During the search, atranslational step of 0.2, and quaternion and torsion steps of 5 were applied. Lowestenergy complex geometries and the corresponding free energy of binding werecalculated with AutoDock4. Molecular volume of the organogold complexes wascalculated using the VEGA ZZ program (version 2.0.6, University of Milan).
3. Results
3.1. UV absorption spectroscopy of 1 and 2 in organic solvents
UV spectra of the complexes taken in ethanol are displayed inFig. 3. Compound 1 carrying PHOX moieties shows a high molarabsorptivity, partially resolved peak at around 240-250 nm(ε≈70,000). The analogous but weaker band of compound 2 iscompletely masked by the long-wavelength tail of the high-intensityfar-UV absorption. Second derivative curves of the complexes indicatethe presence of vibrational fine structure in the 255-285 nm region ofthe spectra, characteristic of the electronic dipole forbidden 1Lb
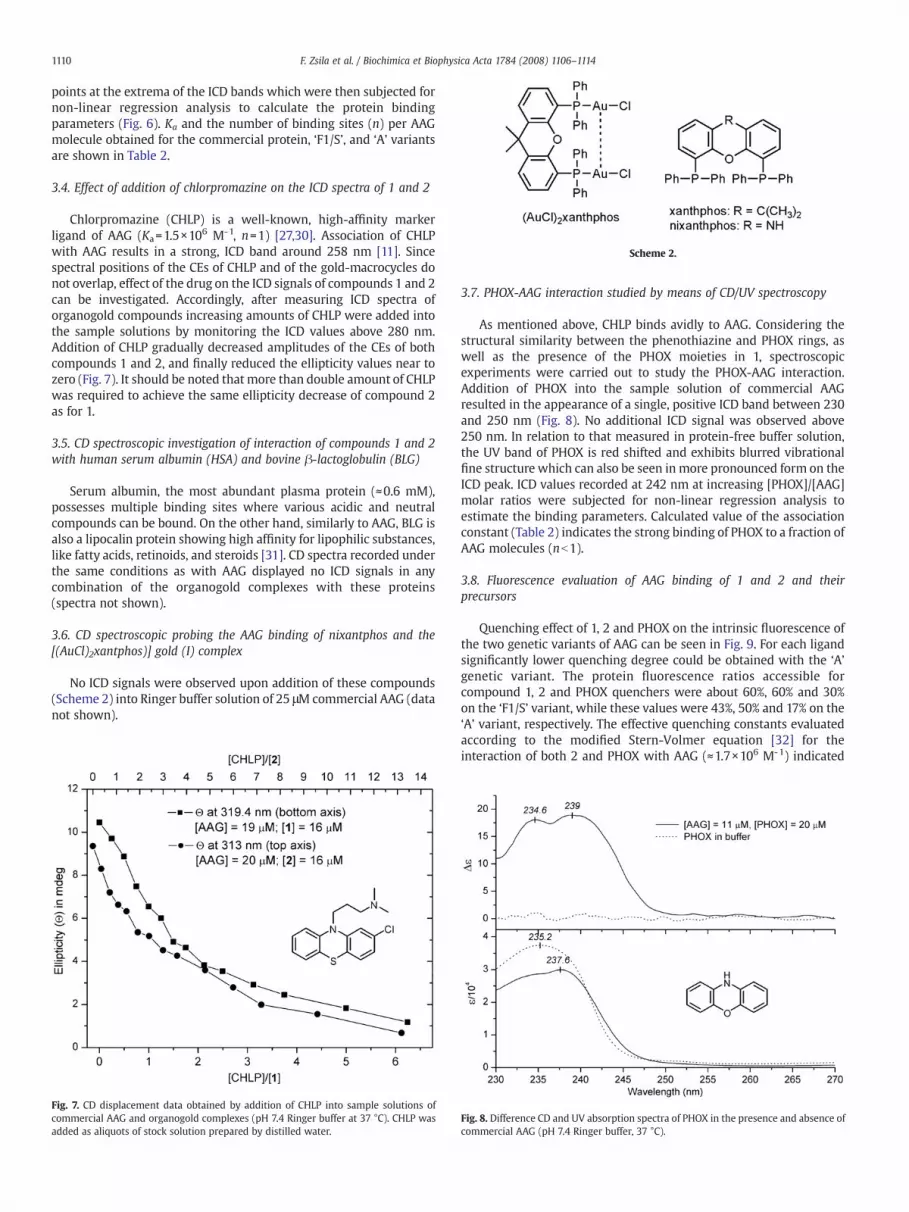
Fig. 4.Difference CD and UV absorption spectra of 1 and 2 in the presence of commercialAAG (pH 7.4 Ringer buffer, 37 °C). [1]=7 μM, [AAG]=28 μM; [2]=8 μM, [AAG]=27 μM.

Fig. 6. ICD titration data points of the gold(I) complexes and the curves fitted on them bynon-linear regression analysis. [AAG] (commercial)=28 and 27 μM for 1 and 2,respectively.
1109F. Zsila et al. / Biochimica et Biophysica Acta 1784 (2008) 1106–1114
transitions of the phenyl rings (Fig. 3). Above 285 nm, bothcompounds display strong, separate UV bands, at 300.4 and at306.8 nm; the latter peak is followed by a low-intensity tail extendingabove 350 nm. Long-wavelength UV bands of the complexes exhibitbathochromic shift with decreasing solvent polarity (Table 1).
UV spectra of nixantphos and PHOX were also recorded (Fig. 3).Moderate intensity, broad, unstructured absorption peaks wereobserved in the low-energy region of the spectra centred at317.6 nm and 337.2 nm, respectively. Shape and wavelength positionof these bands differ considerably from that of the 306.8 nm UV peakof compound 1. It should be noted that the broad, long-wavelengthband of nixantphos overlaps considerably with the absorption regionof compound 1 above 325 nm (Fig. 3).
3.2. CD and UV absorption spectroscopic studies of binding of 1 and 2 tocommercial AAG and its separated genetic variants
Upon mixing of small aliquots of ethanolic stock solution ofcompound 1 into the Ringer buffer solution of 28 μM AAG, asymmetrical, high molar intensity (Δε) negative-positive CE pairappeared between 275 and 300 nm (Fig. 4), showing increasingellipticity values (mdeg) with the increasing concentration of theligand (not shown). No further enhancement of the peak ellipticitywas observed after reaching the 1.4 [1]/[AAG] molar ratio. The zerocross-over point between the CEs at 308 nm closely matches with theUV absorption maximum (307.2 nm). Neither the shape nor theposition of the ICD bands showed alteration during increase of [L]/[P]ratios. A third, intense positive ICD band was also measured in theshort-wavelength region with a maximum around 247 nm. Incomparison to that measured in polar organic solvents (Table 1), theUV peak of compound 1 is red shifted in the presence of AAG (Fig. 4),similarly to the band positions observed in apolar media.
Addition of compound 2 into AAG solution resulted in an intensenegative CE centered at 313 nm (Fig. 4). Shift of the ICD curve tolonger wavelengths by 7 nm (see the dashed line in Fig. 4) points outthe high similarity between the negative CEs of compounds 1 and 2. Aless intense (Δεmax≈+9) positive ICD signal was measured between275-301 nm. Maximum of the strong positive CD peak at shorterwavelengths cannot be determined exactly since it extends below240 nm where the intrinsic CD and UV activity of AAG becomesdominant.
Fig. 5. Difference CD spectra of 1 and 2 in the presence of ‘F1/S’ and ‘A’ genetic variantsof AAG (pH 7.4 Ringer buffer, 37 °C). [1]=5 μM, [F1/S]=28 μM; [1]=5 μM, [A]=24 μM;[2]=6 μM, [F1/S]= [A]=24 μM.
In relation to the absorption spectra taken in N,N-dimethylforma-mide (Table 1), 2-AAG interaction resulted in a substantially largerbathochromic shift of the UV peak (Δν=333 cm-1) than that foundwith the nixantphos ligand (Δν=256 cm-1).
AAG exists in two main genetic forms called ‘F1/S’ and ‘A’ variantsof which primary sequences differ from each other in 22 residues [1].Commercial (pooled) AAG samples consist largely of a 70:30 mixtureof the ‘F1/S’ and ’A’ variants. Since the variants show different drug-binding properties [9,27–29], additional spectroscopic experimentswere carried out by addition of compounds 1 and 2 to the samplesolutions of the ‘F1/S’ and ‘A’ forms. In relation to the spectrameasured with commercial AAG (Fig. 4), very similar but two-foldintense ICD bands were obtained upon mixing of compounds 1 and 2into ‘F1/S’ solution (Fig. 5). However, the CEs induced by the ‘A’ variantdiffer significantly both in positions and magnitudes from thatobserved with the commercial protein and the ‘F1/S’ form (Fig. 5).Molar intensities of these CD peaks are smaller than those obtainedwith the commercial AAG and their extrema are shifted to longerwavelengths. In the presence of the ‘A’ variant, UV absorption maximaof 1 and 2 also show bathochromic shift compared to commercial AAG(λmax is 309 nm for 1, and 305 nm for 2; curves not shown).
3.3. Calculation of AAG binding parameteres of 1 and 2
CD titration of AAG solutions with gold(I) complexes at constantprotein concentration allowed collection of large number of data
Table 2AAG binding parameters of organogold complexes and PHOX calculated from their ICDellipticity values
Guest Ka (M-1) n λ of detection (nm) r2
commercial AAG 1 4.7 (±0.5)×105 1 319.6 0.99943.6 (±0.3)×105 1 297 0.99934.8 (±0.6)×105 1 247 0.9988
2 2.6 (±0.6)×106 0.8 313.6 0.9989PHOX 6.2 (±0.1)×105 0.6 242 0.9955
‘F1/S’ 1 7.1 (±0.9)×105 1 319.2 0.99901.1 (±0.2)×106 1 297 0.9984
2 3.1 (±0.9)×106 0.9 312.6 0.9987‘A’ 1 2.5 (±0.9)×106 0.6 328.4 0.9965
2.5(±0.7)×106 0.6 300.2 0.99852 2.6 (±1.1)×106 0.8 319.2 0.9956
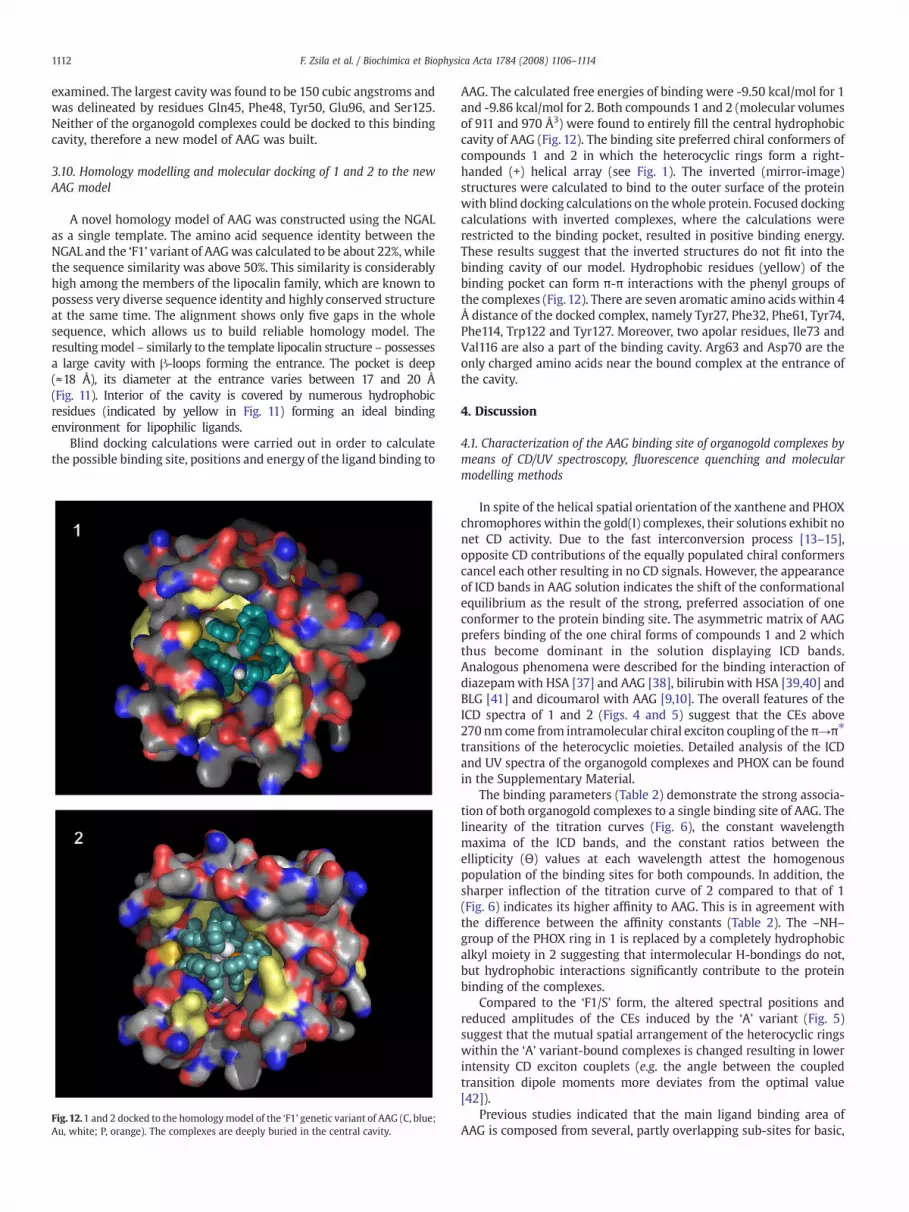
Scheme 2.
1110 F. Zsila et al. / Biochimica et Biophysica Acta 1784 (2008) 1106–1114
points at the extrema of the ICD bands which were then subjected fornon-linear regression analysis to calculate the protein bindingparameters (Fig. 6). Ka and the number of binding sites (n) per AAGmolecule obtained for the commercial protein, ‘F1/S’, and ‘A’ variantsare shown in Table 2.
3.4. Effect of addition of chlorpromazine on the ICD spectra of 1 and 2
Chlorpromazine (CHLP) is a well-known, high-affinity markerligand of AAG (Ka=1.5×10⁶ M-1, n=1) [27,30]. Association of CHLPwith AAG results in a strong, ICD band around 258 nm [11]. Sincespectral positions of the CEs of CHLP and of the gold-macrocycles donot overlap, effect of the drug on the ICD signals of compounds 1 and 2can be investigated. Accordingly, after measuring ICD spectra oforganogold compounds increasing amounts of CHLP were added intothe sample solutions by monitoring the ICD values above 280 nm.Addition of CHLP gradually decreased amplitudes of the CEs of bothcompounds 1 and 2, and finally reduced the ellipticity values near tozero (Fig. 7). It should be noted that more than double amount of CHLPwas required to achieve the same ellipticity decrease of compound 2as for 1.
3.5. CD spectroscopic investigation of interaction of compounds 1 and 2with human serum albumin (HSA) and bovine β-lactoglobulin (BLG)
Serum albumin, the most abundant plasma protein (≈0.6 mM),possesses multiple binding sites where various acidic and neutralcompounds can be bound. On the other hand, similarly to AAG, BLG isalso a lipocalin protein showing high affinity for lipophilic substances,like fatty acids, retinoids, and steroids [31]. CD spectra recorded underthe same conditions as with AAG displayed no ICD signals in anycombination of the organogold complexes with these proteins(spectra not shown).
3.6. CD spectroscopic probing the AAG binding of nixantphos and the[(AuCl)2xantphos)] gold (I) complex
No ICD signals were observed upon addition of these compounds(Scheme 2) into Ringer buffer solution of 25 μM commercial AAG (datanot shown).
Fig. 7. CD displacement data obtained by addition of CHLP into sample solutions ofcommercial AAG and organogold complexes (pH 7.4 Ringer buffer at 37 °C). CHLP wasadded as aliquots of stock solution prepared by distilled water.
3.7. PHOX-AAG interaction studied by means of CD/UV spectroscopy
As mentioned above, CHLP binds avidly to AAG. Considering thestructural similarity between the phenothiazine and PHOX rings, aswell as the presence of the PHOX moieties in 1, spectroscopicexperiments were carried out to study the PHOX-AAG interaction.Addition of PHOX into the sample solution of commercial AAGresulted in the appearance of a single, positive ICD band between 230and 250 nm (Fig. 8). No additional ICD signal was observed above250 nm. In relation to that measured in protein-free buffer solution,the UV band of PHOX is red shifted and exhibits blurred vibrationalfine structure which can also be seen in more pronounced form on theICD peak. ICD values recorded at 242 nm at increasing [PHOX]/[AAG]molar ratios were subjected for non-linear regression analysis toestimate the binding parameters. Calculated value of the associationconstant (Table 2) indicates the strong binding of PHOX to a fraction ofAAG molecules (nb1).
3.8. Fluorescence evaluation of AAG binding of 1 and 2 and theirprecursors
Quenching effect of 1, 2 and PHOX on the intrinsic fluorescence ofthe two genetic variants of AAG can be seen in Fig. 9. For each ligandsignificantly lower quenching degree could be obtained with the ‘A’genetic variant. The protein fluorescence ratios accessible forcompound 1, 2 and PHOX quenchers were about 60%, 60% and 30%on the ‘F1/S’ variant, while these values were 43%, 50% and 17% on the‘A’ variant, respectively. The effective quenching constants evaluatedaccording to the modified Stern-Volmer equation [32] for theinteraction of both 2 and PHOX with AAG (≈1.7×10⁶ M-1) indicated
Fig. 8. Difference CD and UV absorption spectra of PHOX in the presence and absence ofcommercial AAG (pH 7.4 Ringer buffer, 37 °C).

Fig. 9. Effects of PHOX and organogold complexes on the intrinsic tryptophan fluorescence of the ‘F1/S’ and ‘A’ genetic variants of AAG (2.5 μM). Excitation and emission wavelengthswere 280 and 332 nm, respectively.
1111F. Zsila et al. / Biochimica et Biophysica Acta 1784 (2008) 1106–1114
no variant selectivity. In case of 1, however, the evaluated quenchingconstant value on the ‘A’ variant is markedly higher (≈3×10⁶ M-1)compared to the ‘F1/S’ variant (≈6×10⁵ M-1). The obtained resultssuggest, that unlike the tricyclic PHOX, the organogold complexeshave intense interaction with the aromatic residues of AAG, especiallyin case of the ‘F1/S’ variant. The fluorescence emission of AAGoriginates from 3 Trp and 11 Tyr residues, but the Tyr contribution islow [33]. AAG has two classes of Trp residues, Trp25 and Trp122 areembedded in the protein core, while Trp160 is exposed on the outersurface [32]. Compounds bound inside the central cavity of AAGtypically quench the 60-70% of the intrinsic protein fluorescence[28,30,34]. It seems to fit for the binding of 1 and 2 to the ‘F1/S’ variant.In the strong interaction of compound 1 with the ‘A’ variant, however,less Trp residues are involved. It is also valid for compound 2, thoughits variant difference is less pronounced.
Quinaldine red is a fluorescent probe of AAG [35,36], the fluo-rescence of the free dye is negligible. Fig. 10 shows the quenchingeffect of the investigated compounds on the fluorescence of QR boundon commercial AAG. It can be seen that compound 1, 2 and PHOXprovoke pronounced displacements, while the half-molecules aremuch weaker quenchers. Applying the Stern-Volmer equation [32],
Fig. 10. Quenching of 2 μMQR fluorescence in 2.5 μM commercial AAG solution by 1 and2 and their precursors. Excitation and emission wavelengths were 495 and 576 nm,respectively.
quenching constant values of 7×10⁵ M-1 and 6×10⁵ M-1 could bedetermined for 2 and PHOX, respectively. The displacing curve ofcompound 1 was of non-competitive fashion, showing weakerdisplacements at low concentrations, while more effective displace-ment of QR at higher concentrations. Since QR fluorescence incommercial AAG solution belongs dominantly to the ‘F1/S’ variant[36], the irregular displacing curve may reflect the preferred bindingof compound 1 on the ‘A’ variant.
Thequenchingconstants of xanthphosandnixanthphos (Scheme2)were found tobe 3×10⁵M-1 and1.5×105M-1, respectively. The effect of(AuCl)2xanthphos (Scheme 2) was similar to that of xanthphos, but itslow solubility caused some disturbances.
3.9. Cavity search and molecular docking of 1 and 2 to the previous AAGmodel [4,5]
In an attempt to identify the putative binding pocket of theorganogold complexes the recently published model of AAG [5] was
Fig. 11. Homology model of the ‘F1’ genetic variant of AAG in surface representation.Aromatic amino acids are yellow colored, acidic amino acids are shown in red, basicamino acids in blue, all other residues are shown in grey. Molecular dimensions of thecentral binding cavity are indicated.
1112 F. Zsila et al. / Biochimica et Biophysica Acta 1784 (2008) 1106–1114
examined. The largest cavity was found to be 150 cubic angstroms andwas delineated by residues Gln45, Phe48, Tyr50, Glu96, and Ser125.Neither of the organogold complexes could be docked to this bindingcavity, therefore a new model of AAG was built.
3.10. Homology modelling and molecular docking of 1 and 2 to the newAAG model
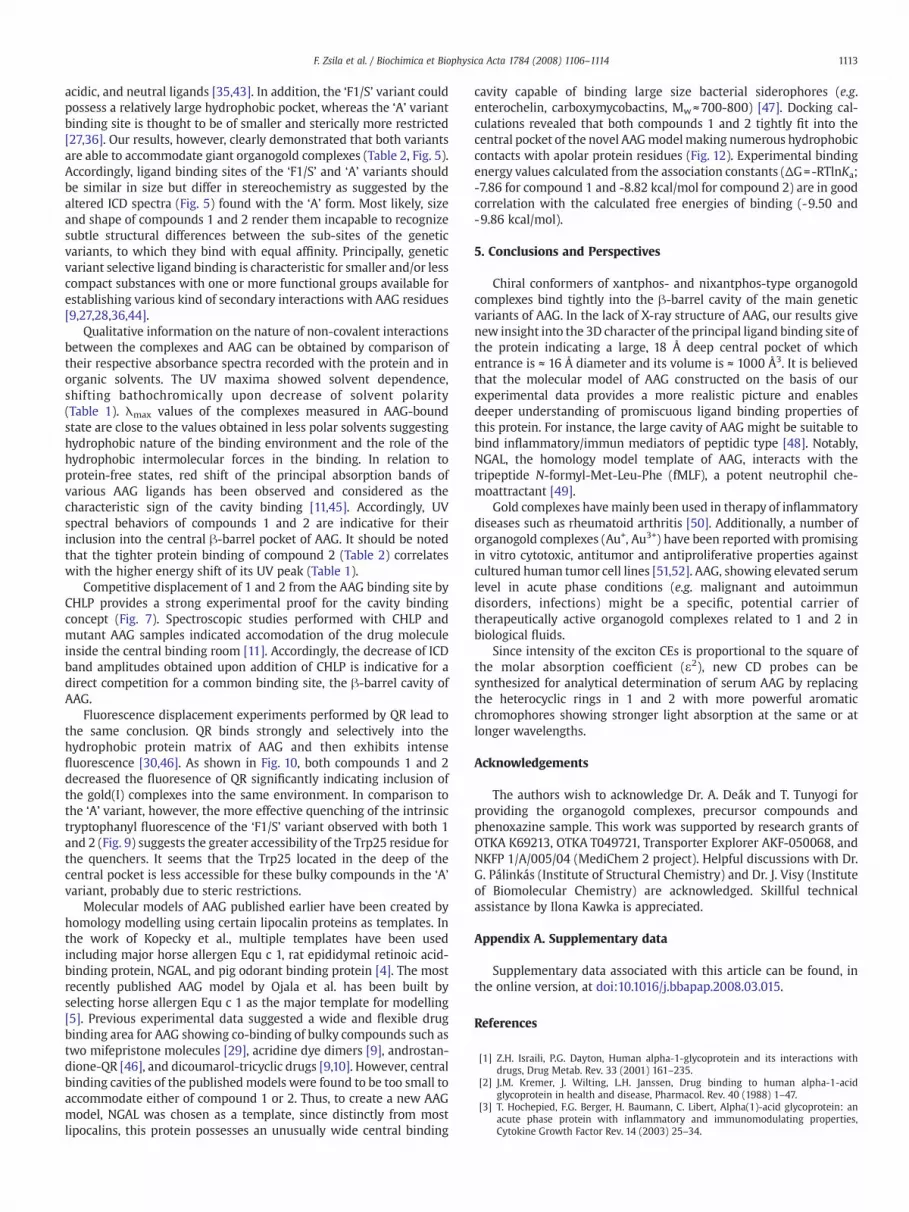
A novel homology model of AAG was constructed using the NGALas a single template. The amino acid sequence identity between theNGAL and the ‘F1’ variant of AAGwas calculated to be about 22%, whilethe sequence similarity was above 50%. This similarity is considerablyhigh among the members of the lipocalin family, which are known topossess very diverse sequence identity and highly conserved structureat the same time. The alignment shows only five gaps in the wholesequence, which allows us to build reliable homology model. Theresultingmodel – similarly to the template lipocalin structure – possessesa large cavity with β-loops forming the entrance. The pocket is deep(≈18 Å), its diameter at the entrance varies between 17 and 20 Å(Fig. 11). Interior of the cavity is covered by numerous hydrophobicresidues (indicated by yellow in Fig. 11) forming an ideal bindingenvironment for lipophilic ligands.
Blind docking calculations were carried out in order to calculatethe possible binding site, positions and energy of the ligand binding to
Fig.12.1 and 2 docked to the homologymodel of the ‘F1’ genetic variant of AAG (C, blue;Au, white; P, orange). The complexes are deeply buried in the central cavity.
AAG. The calculated free energies of binding were -9.50 kcal/mol for 1and -9.86 kcal/mol for 2. Both compounds 1 and 2 (molecular volumesof 911 and 970 Å3) were found to entirely fill the central hydrophobiccavity of AAG (Fig. 12). The binding site preferred chiral conformers ofcompounds 1 and 2 in which the heterocyclic rings form a right-handed (+) helical array (see Fig. 1). The inverted (mirror-image)structures were calculated to bind to the outer surface of the proteinwith blind docking calculations on thewhole protein. Focused dockingcalculations with inverted complexes, where the calculations wererestricted to the binding pocket, resulted in positive binding energy.These results suggest that the inverted structures do not fit into thebinding cavity of our model. Hydrophobic residues (yellow) of thebinding pocket can form π-π interactions with the phenyl groups ofthe complexes (Fig. 12). There are seven aromatic amino acids within 4Å distance of the docked complex, namely Tyr27, Phe32, Phe61, Tyr74,Phe114, Trp122 and Tyr127. Moreover, two apolar residues, Ile73 andVal116 are also a part of the binding cavity. Arg63 and Asp70 are theonly charged amino acids near the bound complex at the entrance ofthe cavity.
4. Discussion
4.1. Characterization of the AAG binding site of organogold complexes bymeans of CD/UV spectroscopy, fluorescence quenching and molecularmodelling methods
In spite of the helical spatial orientation of the xanthene and PHOXchromophores within the gold(I) complexes, their solutions exhibit nonet CD activity. Due to the fast interconversion process [13–15],opposite CD contributions of the equally populated chiral conformerscancel each other resulting in no CD signals. However, the appearanceof ICD bands in AAG solution indicates the shift of the conformationalequilibrium as the result of the strong, preferred association of oneconformer to the protein binding site. The asymmetric matrix of AAGprefers binding of the one chiral forms of compounds 1 and 2 whichthus become dominant in the solution displaying ICD bands.Analogous phenomena were described for the binding interaction ofdiazepamwith HSA [37] and AAG [38], bilirubin with HSA [39,40] andBLG [41] and dicoumarol with AAG [9,10]. The overall features of theICD spectra of 1 and 2 (Figs. 4 and 5) suggest that the CEs above270 nm come from intramolecular chiral exciton coupling of the π→π⁎
transitions of the heterocyclic moieties. Detailed analysis of the ICDand UV spectra of the organogold complexes and PHOX can be foundin the Supplementary Material.
The binding parameters (Table 2) demonstrate the strong associa-tion of both organogold complexes to a single binding site of AAG. Thelinearity of the titration curves (Fig. 6), the constant wavelengthmaxima of the ICD bands, and the constant ratios between theellipticity (Θ) values at each wavelength attest the homogenouspopulation of the binding sites for both compounds. In addition, thesharper inflection of the titration curve of 2 compared to that of 1(Fig. 6) indicates its higher affinity to AAG. This is in agreement withthe difference between the affinity constants (Table 2). The –NH–group of the PHOX ring in 1 is replaced by a completely hydrophobicalkyl moiety in 2 suggesting that intermolecular H-bondings do not,but hydrophobic interactions significantly contribute to the proteinbinding of the complexes.
Compared to the ‘F1/S’ form, the altered spectral positions andreduced amplitudes of the CEs induced by the ‘A’ variant (Fig. 5)suggest that the mutual spatial arrangement of the heterocyclic ringswithin the ‘A’ variant-bound complexes is changed resulting in lowerintensity CD exciton couplets (e.g. the angle between the coupledtransition dipole moments more deviates from the optimal value[42]).
Previous studies indicated that the main ligand binding area ofAAG is composed from several, partly overlapping sub-sites for basic,
1113F. Zsila et al. / Biochimica et Biophysica Acta 1784 (2008) 1106–1114
acidic, and neutral ligands [35,43]. In addition, the ‘F1/S’ variant couldpossess a relatively large hydrophobic pocket, whereas the ‘A’ variantbinding site is thought to be of smaller and sterically more restricted[27,36]. Our results, however, clearly demonstrated that both variantsare able to accommodate giant organogold complexes (Table 2, Fig. 5).Accordingly, ligand binding sites of the ‘F1/S’ and ‘A’ variants shouldbe similar in size but differ in stereochemistry as suggested by thealtered ICD spectra (Fig. 5) found with the ‘A’ form. Most likely, sizeand shape of compounds 1 and 2 render them incapable to recognizesubtle structural differences between the sub-sites of the geneticvariants, to which they bind with equal affinity. Principally, geneticvariant selective ligand binding is characteristic for smaller and/or lesscompact substances with one or more functional groups available forestablishing various kind of secondary interactions with AAG residues[9,27,28,36,44].
Qualitative information on the nature of non-covalent interactionsbetween the complexes and AAG can be obtained by comparison oftheir respective absorbance spectra recorded with the protein and inorganic solvents. The UV maxima showed solvent dependence,shifting bathochromically upon decrease of solvent polarity(Table 1). λmax values of the complexes measured in AAG-boundstate are close to the values obtained in less polar solvents suggestinghydrophobic nature of the binding environment and the role of thehydrophobic intermolecular forces in the binding. In relation toprotein-free states, red shift of the principal absorption bands ofvarious AAG ligands has been observed and considered as thecharacteristic sign of the cavity binding [11,45]. Accordingly, UVspectral behaviors of compounds 1 and 2 are indicative for theirinclusion into the central β-barrel pocket of AAG. It should be notedthat the tighter protein binding of compound 2 (Table 2) correlateswith the higher energy shift of its UV peak (Table 1).
Competitive displacement of 1 and 2 from the AAG binding site byCHLP provides a strong experimental proof for the cavity bindingconcept (Fig. 7). Spectroscopic studies performed with CHLP andmutant AAG samples indicated accomodation of the drug moleculeinside the central binding room [11]. Accordingly, the decrease of ICDband amplitudes obtained upon addition of CHLP is indicative for adirect competition for a common binding site, the β-barrel cavity ofAAG.
Fluorescence displacement experiments performed by QR lead tothe same conclusion. QR binds strongly and selectively into thehydrophobic protein matrix of AAG and then exhibits intensefluorescence [30,46]. As shown in Fig. 10, both compounds 1 and 2decreased the fluoresence of QR significantly indicating inclusion ofthe gold(I) complexes into the same environment. In comparison tothe ‘A’ variant, however, the more effective quenching of the intrinsictryptophanyl fluorescence of the ‘F1/S’ variant observed with both 1and 2 (Fig. 9) suggests the greater accessibility of the Trp25 residue forthe quenchers. It seems that the Trp25 located in the deep of thecentral pocket is less accessible for these bulky compounds in the ‘A’variant, probably due to steric restrictions.
Molecular models of AAG published earlier have been created byhomology modelling using certain lipocalin proteins as templates. Inthe work of Kopecky et al., multiple templates have been usedincluding major horse allergen Equ c 1, rat epididymal retinoic acid-binding protein, NGAL, and pig odorant binding protein [4]. The mostrecently published AAG model by Ojala et al. has been built byselecting horse allergen Equ c 1 as the major template for modelling[5]. Previous experimental data suggested a wide and flexible drugbinding area for AAG showing co-binding of bulky compounds such astwo mifepristone molecules [29], acridine dye dimers [9], androstan-dione-QR [46], and dicoumarol-tricyclic drugs [9,10]. However, centralbinding cavities of the published models were found to be too small toaccommodate either of compound 1 or 2. Thus, to create a new AAGmodel, NGAL was chosen as a template, since distinctly from mostlipocalins, this protein possesses an unusually wide central binding
cavity capable of binding large size bacterial siderophores (e.g.enterochelin, carboxymycobactins, Mw≈700-800) [47]. Docking cal-culations revealed that both compounds 1 and 2 tightly fit into thecentral pocket of the novel AAGmodelmaking numerous hydrophobiccontacts with apolar protein residues (Fig. 12). Experimental bindingenergy values calculated from the association constants (ΔG=-RTlnKa;-7.86 for compound 1 and -8.82 kcal/mol for compound 2) are in goodcorrelation with the calculated free energies of binding (-9.50 and-9.86 kcal/mol).
5. Conclusions and Perspectives
Chiral conformers of xantphos- and nixantphos-type organogoldcomplexes bind tightly into the β-barrel cavity of the main geneticvariants of AAG. In the lack of X-ray structure of AAG, our results givenew insight into the 3D character of the principal ligand binding site ofthe protein indicating a large, 18 Å deep central pocket of whichentrance is ≈ 16 Å diameter and its volume is ≈ 1000 Å3. It is believedthat the molecular model of AAG constructed on the basis of ourexperimental data provides a more realistic picture and enablesdeeper understanding of promiscuous ligand binding properties ofthis protein. For instance, the large cavity of AAG might be suitable tobind inflammatory/immun mediators of peptidic type [48]. Notably,NGAL, the homology model template of AAG, interacts with thetripeptide N-formyl-Met-Leu-Phe (fMLF), a potent neutrophil che-moattractant [49].
Gold complexes have mainly been used in therapy of inflammatorydiseases such as rheumatoid arthritis [50]. Additionally, a number oforganogold complexes (Au+, Au3+) have been reported with promisingin vitro cytotoxic, antitumor and antiproliferative properties againstcultured human tumor cell lines [51,52]. AAG, showing elevated serumlevel in acute phase conditions (e.g. malignant and autoimmundisorders, infections) might be a specific, potential carrier oftherapeutically active organogold complexes related to 1 and 2 inbiological fluids.
Since intensity of the exciton CEs is proportional to the square ofthe molar absorption coefficient (ε2), new CD probes can besynthesized for analytical determination of serum AAG by replacingthe heterocyclic rings in 1 and 2 with more powerful aromaticchromophores showing stronger light absorption at the same or atlonger wavelengths.
Acknowledgements
The authors wish to acknowledge Dr. A. Deák and T. Tunyogi forproviding the organogold complexes, precursor compounds andphenoxazine sample. This work was supported by research grants ofOTKA K69213, OTKA T049721, Transporter Explorer AKF-050068, andNKFP 1/A/005/04 (MediChem 2 project). Helpful discussions with Dr.G. Pálinkás (Institute of Structural Chemistry) and Dr. J. Visy (Instituteof Biomolecular Chemistry) are acknowledged. Skillful technicalassistance by Ilona Kawka is appreciated.
Appendix A. Supplementary data
Supplementary data associated with this article can be found, inthe online version, at doi:10.1016/j.bbapap.2008.03.015.
References
[1] Z.H. Israili, P.G. Dayton, Human alpha-1-glycoprotein and its interactions withdrugs, Drug Metab. Rev. 33 (2001) 161–235.
[2] J.M. Kremer, J. Wilting, L.H. Janssen, Drug binding to human alpha-1-acidglycoprotein in health and disease, Pharmacol. Rev. 40 (1988) 1–47.
[3] T. Hochepied, F.G. Berger, H. Baumann, C. Libert, Alpha(1)-acid glycoprotein: anacute phase protein with inflammatory and immunomodulating properties,Cytokine Growth Factor Rev. 14 (2003) 25–34.

1114 F. Zsila et al. / Biochimica et Biophysica Acta 1784 (2008) 1106–1114
[4] V. Kopecky Jr., R. Ettrich, K. Hofbauerova, V. Baumruk, Structure of humanalpha1-acid glycoprotein and its high-affinity binding site, Biochem. Biophys.Res. Commun. 300 (2003) 41–46.
[5] P.J. Ojala, M. Hermansson, M. Tolvanen, K. Polvinen, T. Hirvonen, U. Impola, M.Jauhiainen, P. Somerharju, J. Parkkinen, Identification of alpha-1 acid glycoproteinas a lysophospholipid binding protein: a complementary role to albumin in thescavenging of lysophosphatidylcholine, Biochemistry 45 (2006) 14021–14031.
[6] D.A. Breustedt, D.L. Schonfeld, A. Skerra, Comparative ligand-binding analysis often human lipocalins, Biochim. Biophys. Acta 1764 (2006) 161–173.
[7] J.R. Albani, Tertiary structure of human alpha1-acid glycoprotein (orosomucoid).Straightforward fluorescence experiments revealing the presence of a bindingpocket, Carbohydr. Res. 339 (2004) 607–612.
[8] A. Schon, M. del Mar Ingaramo, E. Freire, The binding of HIV-1 protease inhibitorsto human serum proteins, Biophys. Chem. 105 (2003) 221–230.
[9] I. Fitos, J. Visy, F. Zsila, Z. Bikádi, G. Mády, M. Simonyi, Specific ligand binding ongenetic variants of human α1-acid glycoprotein studied by circular dichroismspectroscopy, Biochem. Pharmacol. 67 (2004) 679–688.
[10] T. Miyoshi, R. Yamamichi, T. Maruyama, M. Otagiri, Reversal of signs of inducedcotton effects of dicumarol-α1-acid glycoprotein systems by phenothiazineneuroleptics through ternary complexation, Pharm. Res. 9 (1992) 845–849.
[11] F. Zsila, Y. Iwao, The drug binding site of human α1-acid glycoprotein: insight frominduced circular dichroism and electronic absorption spectra, Biochim. Biophys.Acta 1770 (2007) 797–809.
[12] H.Y. Shrivastava, B.U. Nair, Chromium(III)-mediated structural modification ofglycoprotein: impact of the ligand and the oxidants, Biochem. Biophys. Res.Commun. 285 (2001) 915–920.
[13] A. Deák, T. Megyes, G. Tárkányi, P. Király, L. Biczók, G. Pálinkás, P.J. Stang, Synthesisand solution- and solid-state characterization of gold(I) rings with short Au⋯Auinteractions. Spontaneous resolution of a gold(I) complex, J. Am. Chem. Soc. 128(2006) 12668–12670.
[14] T. Tunyogi, A. Deák, G. Tárkányi, P. Király, G. Pálinkás, Solvent-assisted spontaneousresolution of a 16-membered ring containing gold(I) showing short Au⋯Au aurophilicinteraction and a figure-eight conformation, Inorg. Chem. 47 (2008) 2049–2055.
[15] G. Tárkányi, P. Király, G. Pálinkás, A. Deák, Conformational analysis of a helicallydistorted gold(I) macrocycle derived from xantphos: evidence fort he aurophilicAu⋯Au interaction from NMR, Magn. Reson. Chem. 45 (2007) 917–924.
[16] L.P. Cogswell III, D.E. Raines, S. Parekh, O. Jonas, J.E. Maggio, G.R. Strichartz,Development of a novel probe for measuring drug binding to the F1⁎S variant ofhuman alpha 1-acid glycoprotein, J. Pharm. Sci. 90 (2001) 1407–1423.
[17] H.B. Halsall, R.C. Austin, J.L. Dage, H. Sun, K.T. Schlueter, Structural aspects ofalpha1-acid glycoprotein and its interactions, in: S.Y. Otagirim, B. Testa, J.P.Tillement (Eds.), International Symposium on Serum Albumin & Alpha1−AcidGlycoprotein from basic sciences to clinical applications, 2000, pp. 45–54,Kumamoto, Japan.
[18] F. Zsila, Z. Bikádi, M. Simonyi, Probing the binding of the flavonoid, quercetin tohuman serum albumin by circular dichroism, electronic absorption spectroscopyand molecular modelling methods, Biochem. Pharmacol. 65 (2003) 447–456.
[19] D.H. Goetz, S.T. Willie, R.S. Armen, T. Bratt, N. Borregaard, R.K. Strong, Ligandpreference inferred from the structure of neutrophil gelatinase associated lipocalin,Biochemistry 39 (2000) 1935–1941.
[20] J.D. Thompson, D.G. Higgins, T.J. Gibson, CLUSTAL W: improving the sensitivity ofprogressive multiple sequence alignment through sequence weighting, position-specific gap penalties and weight matrix choice, Nucleic Acids Res. 22 (1994)4673–4680.
[21] A. Sali, T.L. Blundell, Comparative protein modelling by satisfaction of spatialrestraints, J. Mol. Biol. 234 (1993) 779–815.
[22] D. Van Der Spoel, E. Lindahl, B. Hess, G. Groenhof, A.E. Mark, H.J. Berendsen,GROMACS: fast, flexible, and free, J. Comput. Chem. 26 (2005) 1701–1718.
[23] R.A. Laskowski, M.W. Macarthur, D.S. Moss, J.M. Thornton, Procheck - A program tocheck the stereochemical quality of protein structures, J. Appl. Crystallogr. 26(1993) 283–291.
[24] D.S. Goodsell, G.M. Morris, A.J. Olson, Automated docking of flexible ligands:Applications of AutoDock, J. Mol. Recogn. 9 (1996) 1–5.
[25] A. Simon, A. Czajlik, A. Perczel, G. Keri, L. Nyikos, Z. Emri, J. Kardos, Binding crevicefor TT-232 in a homology model of type 1 somatostatin receptor, Biochem.Biophys. Res. Commun. 316 (2004) 1059–1064.
[26] E. Hazai, Z. Bikádi, F. Zsila, S.F. Lockwood, Non-covalent binding of disodiumdisuccinate astaxanthin to the catalytic site of phosphodiesterase 5Å: A molecularmodeling study, Lett. Drug Des. Discov. 4 (2007) 128–136.
[27] F. Herve, G. Caron, J.C. Duche, P. Gaillard, N. Abd Rahman, A. Tsantili-Kakoulidou, P.A.Carrupt, P. d'Athis, J.P. Tillement, B. Testa, Ligand specificity of the genetic variants ofhuman alpha1-acid glycoprotein: generation of a three-dimensional quantitativestructure-activity relationshipmodel fordrug binding to theAvariant,Mol. Pharmacol.54 (1998) 129–138.
[28] I. Fitos, J. Visy, F. Zsila, G. Mády, M. Simonyi, Selective binding of imatinib to thegenetic variants of human α1-acid glycoprotein, Biochim. Biophys. Acta 1760(2006) 1704–1712.
[29] F. Herve, E. Gomas, J.C. Duche, J.P. Tillement, Evidence for differences in the bindingof drugs to the two main genetic variants of human alpha 1-acid glycoprotein, Br.J. Clin. Pharmacol. 36 (1993) 241–249.
[30] K. Nishi, N. Fukunaga, M. Otagiri, Construction of expression system for humanalpha 1-acid glycoprotein in Pichia pastoris and evaluation of its drug-bindingproperties, Drug Metab. Dispos. 32 (2004) 1069–1074.
[31] G. Kontopidis, C. Holt, L. Sawyer, Invited review: beta-lactoglobulin: bindingproperties, structure, and function, J. Dairy Sci. 87 (2004) 785–796.
[32] J.R. Albani, Binding effect of progesterone on the dynamics of alpha1-acidglycoprotein, Biochim. Biophys. Acta 1336 (1997) 349–359.
[33] J.R. Albani, New insights in the interpretation of tryptophan fluorescence : originof the fluorescence lifetime and characterization of a new fluorescence parameterin proteins: the emission to excitation ratio, J. Fluoresc. 17 (2007) 406–417.
[34] H.H. Parikh, K. McElwain, V. Balasubramanian, W. Leung, D. Wong, M.E. Morris, M.Ramanathan, A rapid spectrofluorimetric technique for determining drug-serumprotein binding suitable for high-throughput screening, Pharm. Res. 17 (2000)632–637.
[35] T. Maruyama, M. Otagiri, A. Takadate, Characterization of drug binding sites onalpha 1-acid glycoprotein, Chem. Pharm. Bull. (Tokyo) 38 (1990) 1688–1691.
[36] E. Hazai, J. Visy, I. Fitos, Z. Bikádi, M. Simonyi, Selective binding of coumarinenantiomers to human α1-acid glycoprotein genetic variants, Bioorg. Med. Chem.14 (2006) 1959–1965.
[37] T. Alebic-Kolbah, F. Kajfez, S. Rendic, V. Sunjic, A. Konowal, G. Snatzke, Circulardichroism and gel filtration study of binding of prochiral and chiral1,4-benzodiazepin-2-ones to human serum albumin, Biochem. Pharmacol. 28(1979) 2457–2464.
[38] I. Fitos, J. Visy, F. Zsila, G. Mády, M. Simonyi, Conformation selectivity in the bindingof diazepam and analogues to α1-acid glycoprotein, Bioorg. Med. Chem. 15 (2007)4857–4862.
[39] M.M. Khan, S. Muzammil, S. Tayyab, Chloroform-induced conformational changes inthe bound pigment in bilirubin-albumin complexes, Biochimie 82 (2000) 203–209.
[40] D.A. Lighnter, W.M. Wijekoon, M.H. Zhang, Understanding bilirubin conformationand binding. Circular dichroism of human serum albumin complexes withbilirubin and its esters, J. Biol. Chem. 263 (1988) 16669–16676.
[41] F. Zsila, A new ligand for an old lipocalin: induced circular dichroism spectra revealbinding of bilirubin to bovine β-lactoglobulin, FEBS Lett. 539 (2003) 85–90.
[42] N. Harada, S.L. Chen, K. Nakanishi, Quantitative definition of exciton chirality anddistant effect in exciton chirality method, J. Am. Chem. Soc. 97 (1975) 5345–5352.
[43] K. Matsumoto, K. Sukimoto, K. Nishi, T. Maruyama, A. Suenaga, M. Otagiri,Characterization of ligand binding sites on the α1-acid glycoprotein in humans,bovines and dogs, Drug Metab. Pharmacokinet. 17 (2002) 300–306.
[44] P. Jolliet-Riant, M.F. Boukef, J.C. Duche, N. Simon, J.P. Tillement, The genetic variantA of human alpha 1-acid glycoprotein limits the blood to brain transfer of drugs itbinds, Life Sci. 62 (1998) PL219–PL226.
[45] F. Zsila, H. Matsunaga, Z. Bikádi, J. Haginaka, Multiple ligand-binding properties ofthe lipocalin member chicken α1-acid glycoprotein studied by circular dichroismand electronic absorption spectroscopy: the essential role of the conservedtryptophan residue, Biochim. Biophys. Acta 1760 (2006) 1248–1273.
[46] H. Imamura, T. Maruyama, H. Okabe, H. Shimada, M. Otagiri, A simple and rapidfluorometric determination method of α1-acid glycoprotein in serum usingquinaldine red, Pharm. Res. 11 (1994) 566–570.
[47] M.A. Holmes, W. Paulsene, X. Jide, C. Ratledge, R.K. Strong, Siderocalin (Lcn 2) alsobinds carboxymycobactins, potentially defending against mycobacterial infectionsthrough iron sequestration, Structure 13 (2005) 29–41.
[48] K. Matsumoto, K. Nishi, M. Kikuchi, D. Kadowaki, Y. Tokutomi, N. Tokutomi, K.Nishi, A. Suenaga, M. Otagiri, Alpha1-acid glycoprotein suppresses rat acuteinflammatory paw edema through the inhibition of neutrophils activation andprostaglandin E2 generation, Biol. Pharm. Bull. 30 (2007) 1226–1230.
[49] T. Bratt, S. Ohlson, N. Borregaard, Interactions between neutrophil gelatinase-associated lipocalin and natural lipophilic ligands, Biochim. Biophys. Acta 1472(1999) 262–269.
[50] L. Messori, G. Marcon, Gold complexes in the treatment of rheumatoid arthritis,Met. Ions Biol. Syst. 41 (2004) 279–304.
[51] A. Casini, M.A. Cinellu, G. Minghetti, C. Gabbiani, M. Coronnello, E. Mini, L. Messori,Structural and solution chemistry, antiproliferative effects, and DNA and proteinbinding properties of a series of dinuclear gold(III) compounds with bipyridylligands, J. Med. Chem. 49 (2006) 5524–5531.
[52] O. Rackham, S.J. Nichols, P.J. Leedman, S.J. Berners-Price, A. Filipovska, A gold(I)phosphine complex selectively induces apoptosis in breast cancer cells: Implica-tions for anticancer therapeutics targeted to mitochondria, Biochem. Pharmacol.74 (2007) 992–1002.
Copyright © 2022 FDOKUMEN