bharat petroleum corporation limited, mumbai refinery, mahul
Upload
khangminh22Category
view
0download
0
1
Bright Star University
Faculty of Engineering
Chemical Engineering Department
DESIGN OF OIL REFINERY TO OPERATE
200,000 BARREL PER DAY
A Project Submitted in Partial Fulfillment of the Requirements for
the Degree of B. Sc. In Chemical Engineering
By
Students student NO
Nawal Mohamed Ramadan 21152840
Qarnas Youssef Mohamed 21152849
Haniyeh Ibrahim Saleh 21152839
Anwar EL-Shamekh emragea 21152844
Supervisor
Dr. Raheel. G Raheel
Jun / 2019
2
CERTIFICATE
This project work entitled:
DESIGN OF OIL REFINERY TO OPERATE
200,000 BARREL PER DAY
Which is being submitted the following students
Nawal Mohamed Ramadan 21152840
Qarnas Youssef Mohamed 21152849
Haniyeh Ibrahim Saleh 21152839
Anwar EL-Shamekh emragea 21152844
In partial fulfillment of the requirements for the award of B.Sc. degree In
chemical engineering has been carried out under my supervisor and
accepted for representation.
Name ……………………………….…...
Signature ……………………….……….
Corrected approved copy for records
Name ……………………....... Name …………………….…...
Signature ……………………... Signature ………….………….
Date …………………….………
The members of the committee to examine the B.Sc. project find it
satisfactory and recommend that it be accepted.
1- Name Chair
2- Name Member
3- Name Member
Date

3
ABSTRACT
The worldwide oil refining industry currently faces strong challenges related to
concerns about future feedstock and characteristics of oil products. These challenges
favor two main strategies for the sector: the first strategy is increasing refinement
complexity and versatility; the second is integrating the refining and petrochemical
industries, adding value to the crude oil while guarantee market share to premium oil
products. Both strategies aim at increasing production of highly specified oil products,
simultaneously reducing the environmental impacts of the refining industry. The aim
of this study is design an oil refinery to operate a 200,000 barrel per day with a
feasibility building of this platform unit in Braga city.
Material balance, energy balance and a furnace design are done in this project,
Feasibility for the study is done, and also the unit operations are taken in the account
in this study.

4
ACKNOWLEDGMENT
بعد
شكر هللا عز وجل ال تعد وال تحصى التيعلى نعمه
نتقدمالهي ال يطيب الليل اإل بشكرك .. وال يطيب النهار اإل بطاعتك .. وال تطيب اللحظات اإل بذكرك .. وال تطيب اآلخرة اإل
بعفوك .. وال تطيب الجنة اإل برؤيتك .. إلى من بلغ الرسالة .. وأدى األمانة ونصح األمة .. إلى نبي الرحمة ونور
رسولنا محمد صلي هللا عليه وسلم...........................................................العالمين .........
تأخذمن إلىمن تسهر لننام وتجوع لنشبع إلىالقلب الحنون والحضن الدافئ إلىالتي تحترق لتضئ دربنا إلى الشمعة
إلىني فرحي ركمن تشا إلىاشعر به أنمن تحس بحزني قبل إلى أموريمن تعينني في كل إلىمن عمرها وتعطينا
أمي الحبيبة .....................................................................................................اعز البشر
إلى من جعله هللا سبباً في وجودي إلى مثلي األعلى ومعلمي في الحياة إلى قارب النجاة إلى الكرم والعطاء إلى الخير
أبي العزيز.....................................إلى من كان وراء كل نجاح أحققه أهدى هذا البحث حباً وتقديراً اليه ...
إلى سندي وقوة مالذي بعد هللا .. إلى من آثروني على نفسهم . إلى من علموني علم الحياة .. إلى من أظهروا لي ما
أخوتي وأخواتي....................................................................هو أجمل من الحياة .................
إلى من سطرت معهم على جدار الزمن أجمل الذكريات إلى نور العين إلى نبض القلب الذي به أحيا ولن
األصدقاء واألحباب.................................................................................انساهم...............
أساتذتي الكرام...............................إلى من وضح رؤيتي وأنار بالعلم طريقي ........إلى من علمني حرفاً
وكلمة الذين كفروا السفلى بدم الشهداء قديما وحديثا من أجل أن تكون كلمة هللا هى العليا تالذى ارتوالي االرض
يأرضنا الحبيبة ووطنا الغال........................................................................................
إلى كل هؤالء نقدم لهم كل
►شكر وعرفانال◄

5
وتقدير شكر
يسرنا أن نتقدم بخالص شكرنا وامتناننا إلى من كانوا سببا
، في إتمام وصولنا إلى هذه المرحلة في مسيرتنا الدراسية
أساتذتنا في المعهد العالي لبناء القدرات التقنية وجميع العاملين
في األقسام العلمية واإلدارية ، ونخص بالذكر منهم :
ه والمعلم في متابعته لنا وتيسيره الذي كان مثاالً للمشرف و المَوجِّ
لمراحل العمل في هذا المشروع
وال ننسى أن نتوجه بشكرنا إلى كل من مد يد العون لنا إلنجاح هذا
منهم : صوباألخالعمل
وهللا ولي التوفيق
-طلبة المشروع :

6
TABLE OF CONTENTS
ABSTRACT………………………………………………………………….. I
ACKNOWLEDGMENT………………………………………………….. II
LIST OF FIGURES………………………………………………………... VI
LIST OF TABLES…………………………………………………………. VII
LIST OF SYMBOLS……………………………………………………… VIII
CHAPTER (1): Overview
1.1: Introduction………………………………………………………….……... 1
1.2: History……………………………………………………………….……... 3
1.3: PETROLEUM …………..…………………………………………………. 4
1.3.1: The Composition of Petroleum …….……………………………... 4
1.3.2: Petroleum in Chemistry ……...…………………………………... 6
1.4: CLASSIFICATION OF PETROLEUM …………...……………...………. 8
1.5: 1.5. API GRAVITY ……………………………………………………...... 8
1.6 FLASH POINT ………………………...…………………………………... 10
1.7: VISCOCITY ……………………………..…………………….…………..
1.8: CRUDE DISTILLATION UNIT (CDU) ………………………...…………
1.9: REFLUX ……………………………………………………………………
10
11
15
CHAPTER (2): Unit Operations
2.1: Traditional Classification Of Processes……………………………………. 16
2.2: Essential Processes Based On Different Physical Principles………………. 16
2.3: Examples Of Unit Operations………………………………………............ 17
2.4: General Overview About Unit Operations………………………………….
18
CHAPTER (3): Material Balance
3.1: Introduction… …………………………………………………………….... 40
3.2: Mass Feedback (Recycle) ………………….………………………………. 41
3.3: Commercial Use……………………………………………………………. 41
3.4: Basic Calculation……………………………………… ………………….. 42
3.5: The Material Balance on The Stripper Towers …………………………….. 49
3.6: The Material Balances About The Stripper Of Kerosene ….……………….
3.7: Material Balance About The Stripper Of Diesel……………………………. 50
52
CHAPTER (4): Energy Balance
4.1: Types of Energy……………………………………… …………................ 54
4.2: Calculation Of Energy Balance For Heat exchanger……………………….. 55

7
CHAPTER (5): Design Of Heat Exchanger
5.1: SHELL AND TUBE HEAT EXCHANGER DESIGN…………..………... 63
5.1.1: Selection of tube material ………………………………………… 64
5.1.2: Applications and uses …………………………………………...…
5.2: SHELL AND TUBE EXCHANGERS: CONSTRUCTION DETAILS…… 65
66
5.3: STEPS FOR DESIGN OF HEAT EXCHANGER………………….……...
5.4: MODIFIED DESIGN………………………………………………………
5.5: OPTIMIZATION USING A CAD PROGRAM……………………………
5.6: SHAPE PARTS OF THE HEAT EXCHANGER………………………….
67
78
82
83
CHAPTER (6): Economic Study
6.1: FEASIBILITY STUDY……………………………..………………….….. 86
6.2: PLANT COST………………………….……………………………….….. 87
6.3: COST INDEX…………………………..………………………….............. 87
6.4: THE COST OF PRODUCTS AND RAW MATERIAL………….……….. 88
6.5: DEPRECIATION……………………………………………….………….. 90
6.6: THE COST OF THE OPERATION………...……………………………… 90
6.7: CASH FLOW……………………………………………………….............. 91
6.8: PAY- BACK PERIOD…………………………………………….………... 92
CONCLUSION……………………………………………………………….
94
RECOMMENDATION…………………………………………………….
94
REFERENCES……………………………………………………………….
APPENDIX
95
Appendix (A)…………………………………………………………………… 97
Appendix (B) …………………………………………………………………... 101

8
LIST OF FIGURES
Fig. 1.1: distillation tower ……………………………….............................. 12
Fig. 1.2: petroleum distillation unit …………………..…………………...
14
Fig. 2.1: Shell and tube Heat Exchanger………………………………..... 19
Fig. 2.2: Straight Tube Heat Exchanger (One Pass Tube-Side) …...… 20
Fig. 2.3: Straight Tube Heat Exchanger (Two Pass Tube Side) …...… 20
Fig. 2.4:Air-cooled exchangers bundle position……………………….... 21
Fig. 2.5: Fan cooler, Induced draft……………………………................... 21
Fig. 2.6: Fan cooler, Forced draft……………………………..................... 22
Fig. 2.7: Indirectly fired furnace……………………………...................... 23
Fig. 2.8: Cabin furnaces with horizontal tubes………………………...... 24
Fig. 2.9: Vertical cylindrical……………………………............................ 25
Fig. 2.10: Steam striping…………………………….................................. 27
Fig. 2.11: Stabilizer unit…………………………….................................. 29
Fig. 2.12: Separators three phase Horizontal Separator…………….…. 30
Fig. 2.13: Separators three phase Vertical Separator………………...… 31
Fig. 2.14: Separators three phase, Spherical Separator………………… 32
Fig. 2.15: Typical fixed-bed down flow catalytic reformer……...…… 34
Fig. 2.16: Reciprocating piston compressor………………………...…… 35
Fig. 2.17: Centrifugal compressor………………………………................. 37
Fig. 2.18: Centrifugal pump and Fluid path through the pump…...….. 38
Fig. 2.19: The hydraulic components in a single-stage in-line pump.. 38
Fig. 2.20: Schematics of ejectors………..…………………….................... 39
Fig. 3.1: percentages the product according the boiling point………... 44
Fig. 3.2: shows the logarithmic curve ……..……………………...............
Fig. 3.3: Material balance Stripper (H.N) ……..…………………............
Fig. 3.4: Material balance stripper (kerosene) ……..……………………
Fig. 3.5: Material balance strippers (diesel) ……..……………………....
Fig. 3.6: Diagram shows the unity of the oil refining………………..
46
50
51
53
53
Fig. 4.1: shows increase temperature crude oil inside heat exchanger 61
Fig. 5.1: U-tube heat exchanger ……………………………………........... 63
Fig. 5.2: Straight tube heat exchanger (one pass tube)…..…………….. 64
Fig. 5.3: Straight tube heat e xchanger (one pass 64

9
tube)…...…………….
Fig. 5.4U-tube heat exchanger constructions…………….……………...
Fig. 5.5: Design procedures for shell-and-tube heat exchangers……..
66
67
Fig. 5.6: temperature correction factors ……….........................................
Fig. 5.7: Shell-bundle clearances ……………….........................................
Fig. 5.8: Tube-side heat-transfer factor…………………………………...
Fig. 5.9: Tube-side friction factors ……………………………..…………
71
73
74
77
LIST OF TABLES
Tab. 1.1: chemical elements of petroleum …………...……..……….… 5
Tab. 1.2: the percentage of hydrocarbons in petroleum ………............
Tab. 1.3: Classification of Petroleum………………………………..
Tab. 1.4: Destinations for Straight-Run Distillates………………….
5
7
13
Tab. 2.1: Main types of pumps……………………………….................... 36
Tab. 3.1: range boiling temperature to each product …….……………. 43
Tab. 3.2: State work column……………………….. ………………… 43
Tab. 3.3: the percent of product with specific gravity …………...……. 46
Tab. 4.1: initial and final temperature for oil products …….……......... 55
Tab. 4.2: temperature crude oil in each unit…………………..……….... 62
Tab. 4.3: the overall energy balance ……………………………………...
Tab. 5.1. Shows Physical Properties for oil and kerosene……………
Tab. 5.2. Constant for use in equation tube arrangement……………..
62
69
72
Tab. 6.1: The flow rate of products and their prices….…………….… 89
Tab. 6.2: The flow rate of the raw material and their prices.………... 89

10
LIST OF SYMBOLS
SGoil Specific gravity of the crude oil
API American petroleum institute
Bbl Barrel
ρ Density
Ds Shell inside diameter
ut Tube-side velocity
Ao Heat transfer area
Ds Baffle spacing
Re Tube-side heat transfer coefficient
RWM Raw material
I.B.P Initial boiling point
F.B.P Final boiling point
Q The heat liberated
LPG Liquid petroleum gas
∆T temperature difference
NTubes Number of tubes
L.N Light naphtha
H.N Heavy naphtha
Gal Gallon
Re Reynolds number
jh Heat transfer factor

11

12
CHAPTER ONE
INTRODUCTION
Oil refinery or petroleum refinery is an industrial process plant where crude oil is
transformed and refined into more useful products such as petroleum naphtha, gasoline, diesel
fuel, asphalt base, heating oil, kerosene, liquefied petroleum gas, jet fuel and fuel oils. Oil
refineries are typically large, sprawling industrial complexes with extensive piping running
throughout, carrying streams of fluids between large chemical processing units, such as
distillation columns. In many ways, oil refineries use much of the technology of, and can be
thought of, as types of chemical plants.The crude oil feedstock has typically been processed
by an oil production plant. There is usually an oil depot at or near an oil refinery for the
storage of incoming crude oil feedstock as well as bulk liquid products.Petroleum refineries
are very large industrial complexes that involve many different processing units and auxiliary
facilities such as utility units and storage tanks. Each refinery has its own unique arrangement
and combination of refining processes largely determined by the refinery location, desired
products and economic considerations.An oil refinery is considered an essential part of the
downstream side of the petroleum industry; some modern petroleum refineries process as
much as 800,000 to 900,000 barrels (127,000 to 143,000 cubic meters) per day of crude
oil.According to the Oil and Gas Journal in the world a total of 636 refineries were operated
on the 31 December 2014 for a total capacity of 87.75 million barrels (13,951,000
m3(.Jamnagar Refinery is the largest oil refinery. Located in Gujarat, India, it is owned by
Reliance (1)

13
1.2. HISTORY
Prior to the nineteenth century, petroleum was known and utilized in various fashions
in Babylon, Egypt, China, Philippines, Rome and Azerbaijan. However, the modern history of
the petroleum industry is said to have begun in 1846 when Abraham Gessner of Nova
Scotia, Canada devised a process to produce kerosene from coal. Shortly thereafter, in
1854, Ignacy Lukasiewicz began producing kerosene from hand-dug oil wells near the town
of Krosno, Poland. The first large petroleum refinery was built in Ploesti, Romania in 1856
using the abundant oil available in Romania. In North America, the first oil well was drilled
in 1858 by James Miller Williams in Ontario, Canada. In the United States, the petroleum
industry began in 1859 when Edwin Drake found oil near Titusville, Pennsylvania. The
industry grew slowly in the 1800s, primarily producing kerosene for oil lamps. In the early
twentieth century, the introduction of the internal combustion engine and its use in
automobiles created a market for gasoline that was the impetus for fairly rapid growth of the
petroleum industry. The early finds of petroleum like those in Ontario and Pennsylvania were
soon outstripped by large oil "booms" in Oklahoma, Texas and California. Prior to World
War II in the early 1940s, most petroleum refineries in the United States consisted simply
of crude oil distillation units (often referred to as atmospheric crude oil distillation units).
Some refineries also had vacuum distillation units as well as thermal cracking units such
as visbreakers (viscosity breakers, units to lower the viscosity of the oil). All of the many
other refining processes discussed below were developed during the war or within a few years
after the war. They became commercially available within 5 to 10 years after the war ended
and the worldwide petroleum industry experienced very rapid growth. The driving force for
that growth in technology and in the number and size of refineries worldwide was the
growing demand for automotive gasoline and aircraft fuel.In the United States, for various
complex economic and political reasons, the construction of new refineries came to a virtual
stop in about the 1980s. However, many of the existing refineries in the United States have
revamped many of their units and/or constructed add-on units in order to: increase their
crude oil processing capacity, increase the octane rating of their product gasoline, lower
the sulfur content of their diesel fuel and home heating fuels to comply with environmental
regulations and comply with environmental air pollution and water pollution requirements.
(1)

14
1.3. PETROLEUM
1.3.1. The Composition of Petroleum
In its strictest sense, petroleum includes only crude oil, but in common usage it
includes all liquid, gaseous and solid hydrocarbons. Under surface pressure and temperature
conditions, lighter hydrocarbons methane, ethane, propane and butane occur as gases, while
pentane and heavier hydrocarbons are in the form of liquids or solids. However, in an
underground oil reservoir the proportions of gas, liquid, and solid depend on subsurface
conditions and on the phase diagram of the petroleum mixture, oil well produces
predominantly crude oil, with some natural gas dissolved in it. Because the pressure is lower
at the surface than underground, some of the gas will come out of solution and be recovered
(or burned) as associated gas or solution gas. A gas well produces predominantly natural gas.
However, because the underground temperature and pressure are higher than at the surface,
the gas may contain heavier hydrocarbons such as pentane, hexane, and heptane in the
gaseous state. At surface conditions these will condense out of the gas to form "natural gas
condensate", often shortened to condensate. Condensate resembles gasoline in appearance and
is similar in composition to some volatile light crude oils.The proportion of light
hydrocarbons in the petroleum mixture varies greatly among different oil fields, ranging from
as much as 97 percent by weight in the lighter oils to as little as 50 percent in the heavier oils
and bitumens. (1).The hydrocarbons in crude oil are mostly alkanes, cycloalkanes and various
aromatic hydrocarbons, while the other organic compounds contain nitrogen, oxygen and
sulfur, and trace amounts of metals such as iron, nickel, copper and vanadium. Many oil
reservoirs contain live bacteria, the exact molecular composition of crude oil varies widely
from formation to formation but the proportion of chemical elements varies over fairly narrow
limits as follows:

15
Table (1-1) chemical elements of petroleum
Element Percent range
Carbon 83 to 85%
Hydrogen 10 to 14%
Nitrogen 0.1 to 2%
Oxygen 0.05 to 1.5%
Sulfur 0.05 to 6.0%
Metals < 0.1%
Four different types of hydrocarbon molecules appear in crude oil. The relative
percentage of each varies from oil to oil, determining the properties of each oil. (1)
Table (1-2) the percentage of hydrocarbons in petroleum
Hydrocarbon Average Range
Alkanes (paraffins) 30% 15 to 60%
Naphthenes 49% 30 to 60%
Aromatics 15% 3 to 30%
Asphaltics 6% remainde
1.3.2. Petroleum in Chemistry

16
Petroleum is a mixture of a very large number of different hydrocarbons; the most
commonly found molecules are alkanes (paraffins), cycloalkanes (naphthenes), aromatic
hydrocarbons, or more complicated chemicals like asphaltenes. Each petroleum variety has a
unique mix of molecules, which define its physical and chemical properties, like color and
viscosity. The petroleum contains many of chemical compounds and principally contains of
the following compounds:
1- Paraffins: are also called alkanes and have the general formula of CnH2n+2, where n is the
number of carbon atoms. Paraffin's from C1 to C40 usually appeared in crude oil and represent
up to 20% of crude by volume. Since paraffin's are fully saturated (no double bond), they are
stable and remain unchanged over long periods of geological time, Paraffins are straight-chain
Paraffins or branched-chain Paraffins, For example:
CH3CH3
heptanen-
CH3 CH3
CH3
CH3
2,3-dimethylpentane
2- Aromatics: are an important series of hydrocarbons found in almost every petroleum
mixture from any part of the world. Aromatics are cyclic but unsaturated hydrocarbons that
begin with benzene molecule (C6H6) and contain carbon-carbon double bonds. Some of the
common aromatics found in petroleum and crude oils are benzene and its derivatives with
attached methyl, ethyl, propyl, or higher alkyl groups. This series of aromatics is called
alkylbenzenes and have a general formula of CnH2n-6 (where n ≥ 6). For example:

17
CH3 CH3
CH3
Benzene Toluene Xylene
3- Naphthenes or cycloalkanes are ring or cyclic saturated hydrocarbons with the general
formula of CnH2n. Cyclopentane (C5H10), cyclohexane (C6H12), and their derivatives such as
n-alkylcyclopentanes are normally found in crude oils. Thermodynamic studies show that
naphthenes rings with five and six carbon atoms are the most stable naphthenic hydrocarbons.
The content of Cycloparaffins in petroleum may vary up to 60%. For example:
R
Cyclopentane Cyclohexane Alkylcyclohexane
4- Olefins: are another series of noncyclic hydrocarbons but they are unsaturated and have at
least one double bond between carbon-carbon atoms. Compounds with one double bond are
called monoolefins or alkenes. monoolefins have a general formula of CnH2n. Olefins are
uncommon in crude oils due to their reactivity with hydrogen that makes them saturated;
however, they can be produced in refineries through cracking reactions. For example:

18
CH3 CH3
CH3 CH3
2,4-dimethylpentane
1.4. CLASSIFICATION OF PETROLEUM
Table (1-3) Classification of Petroleum (2).
Class of petroleum Composition of 250–300 °C fraction,
wt. %
Par. Napth Arom. Wax Asph.
Paraffinic 46—61 22–32 12–25 1.5–10 0–6
Paraffinic-naphtenic 42–45 38–39 16–20 1–6 0–6
Naphthenic 15–26 61–76 8–13 Trace 0–6
Paraffinic-naphtenic-aromatic
27–35 36–47 26–33 0.5–1 0–10
Aromatic 0–8 57–78 20–25 0–0.5 0–20

19
1.5. API GRAVITY
API stands for the American Petroleum Institute, which is the major United
States trade association for the oil and natural gas industry. The API represents about 400
corporations in the petroleum industry and helps to set standards for production, refinement,
and distribution of petroleum products. They also advocate on behalf of the industry. One of
the most important standards that the API has set is the method used for measuring the
density of petroleum. This standard is called the API gravity.Specific gravity is a ratio of the
density of one substance to the density of a reference substance, usually water. The API
gravity is nothing more than the standard specific gravity used by the oil industry, which
compares the density of oil to that of water through a calculation designed to ensure
consistency in measurement. Less dense oil or “light oil” is preferable to more dense oil as it
contains greater quantities of hydrocarbons that can be converted to gasoline. Petroleum is
less dense that water and in 1916, the U.S. government instituted the Baumé scale as the
standard measure for any liquid less dense than water. This, in most cases, applies to oil. The
value used in this scale was 141.5 (see calculation below), but subsequent testing showed that,
due to error, the actual value should be 140. The government changed the scale to 140 to
correct the issue, but the use of 141.5 had become so entrenched in the oil industry that the
API decided to create the API gravity scale using the old value of 141.5.
API gravity is calculated using the specific gravity of oil, which is nothing more than
the ratio of its density to that of water (density of the oil/density of water). Specific gravity for
API calculations is always determined at 60 degrees Fahrenheit. API gravity is found as
follows:
API gravity = (141.5/Specific Gravity) – 131.5
Though API values do not have units, they are often referred to as degrees. So the
API gravity of West Texas Intermediate is said to be 39.6 degrees. API gravity moves
inversely to density, which means the denser oil is, the lower its API gravity will be. An API
of 10 is equivalent to water, which means any oil with an API above 10 will float on water
while any with an API below 10 will sink.

20
The API gravity is used to classify oils as light, medium, heavy, or extra heavy. As
the “weight” of oil is the largest determinant of its market value, API gravity is exceptionally
important. The API values for each “weight” are as follows:
Light – API > 31.1
Medium – API between 22.3 and 31.1
Heavy – API < 22.3
Extra Heavy – API < 10.0
These are only rough valuations as the exact demarcation in API gravity between
light and heavy oil changes depending on the region from which oil came. The fluctuation as
to what constitutes light crude in a given region is the result of commodity trading in oil.
Because density is a measure of weight per volume, API can be used to calculate how
many barrels of crude can be extracted from a metric ton of a given oil. A metric ton of West
Texas Intermediate, with an API of 39.6, will produce 7.6 barrels (at 42 gallons each). The
calculation is:
Barrels per metric ton = 1/ [(141.5/ (API + 131.5) x 0.159]. (1)
1.6. FLASH POINT
The flash point of an oil is the temperature at which the vapor above the oil will
momentarily flash or explode. This temperature is determined by laboratory testing using an
apparatus consisting of a closed cup containing the oil, heating and stirring equipment, and a
special adjustable flame. The type of apparatus used for middle distillate and fuel oils is called
the Pensky Marten (PM), while the apparatus used in
thecaseofKeroseneandlighterdistillatesiscalledtheAbel.Referencetothesetests are given later in
this Handbook, and full details of the tests methods and procedures are given in ASTM
Standards Part 7, Petroleum products and Lubricants.
There are many empirical methods for determining flash points from the ASTM
distillation curve. One such correlation is given by the expression Flash point ◦F=0.77 (ASTM
5% ◦F−150◦F). (1)

21
1.7. VISCOCITY
The viscosity of oil is a measure of its resistance to internal flow and is an indication
of its lubricating qualities, in the oil industry it is usual to quote viscosities either in
centistokes (which is the unit for kinematic viscosity), and seconds Saybolt universal, seconds
Saybolt furol, or seconds Redwood. These units have been correlated and such correlations
can be found in most data books. In the laboratory, test data on viscosities is usually
determined at temperatures of 100◦F, 130◦F, or 210◦F. In the case of fuel oils temperatures of
122◦F and 210◦F are used.(1)
1.8. CRUDE DISTILLATION UNIT (CDU)
Crude oil distillation is more complicated than product distillation, in part because
crude oils contain water, salts, and suspended solids. To reduce corrosion, plugging, and
fouling in crude heaters and towers, and to prevent the poisoning of catalysts in downstream
units, these contaminants are removed by a process called desalting. The two most typical
methods of crude-oil desalting – chemical and electrostatic separation – use hot water to
dissolve the salts and collect suspended solids. In chemical desalting, water and surfactants
are added to the crude, heated to dissolve salts and other impurities, and then sent to a settling
tank where the water and oil separate. In electrostatic desalting, chemicals are replaced with a
strong electrostatic charge, which drives the separation of water from oil.
Modern crude distillation towers can process 200,000 barrels of oil per day. They can
be up to 150 feet (50 meters) tall and contain 20 to 40 fractionation trays spaced at regular
intervals. In some towers, the trays in the top section are replaced with structured packing.
Before reaching the tower, desalted oil goes through a network of pre-heat exchangers to a
fired heater, which brings the temperature up to about 650°F (343°C). If the oil gets much
hotter than this, it starts to crack and deposit carbon inside the pipes and equipment through
which it flows
The hot crude enters the distillation tower just above the bottom. Steam is added to
enhance separation; it does so largely by decreasing vapor pressure in the column. When hot
oil enters the tower, most of it vaporizes. Unvaporized heavy fuel oil and/or asphalt residue
drops to the bottom of the tower, where it is drawn off. The vapors rise through the distillation
trays, which contain perforations and bubble caps (Figure 1-1). Each tray permits vapors from
below to bubble through the cooler, condensed liquid on top of the trayThis provides
excellent vapor/liquid contacting. Condensed liquid flows down through a pipe to the hotter
tray below, where the higher temperature causes re-evaporation. A given molecule evaporates
and condenses many times before finally leaving the tower. Products are collected from the

22
top, bottom and side of the column. Sidedraw products are taken from trays at which the
temperature corresponds to the cutpoint for a desired product. In modern towers, a portion of
each sidedraw stream is returned to the tower to control tray temperatures and further enhance
separation. Part of the top product is also returned; this “reflux” flow plays a major role in
controlling temperature at the top of the tower
Fig (1-1) distillation tower
23
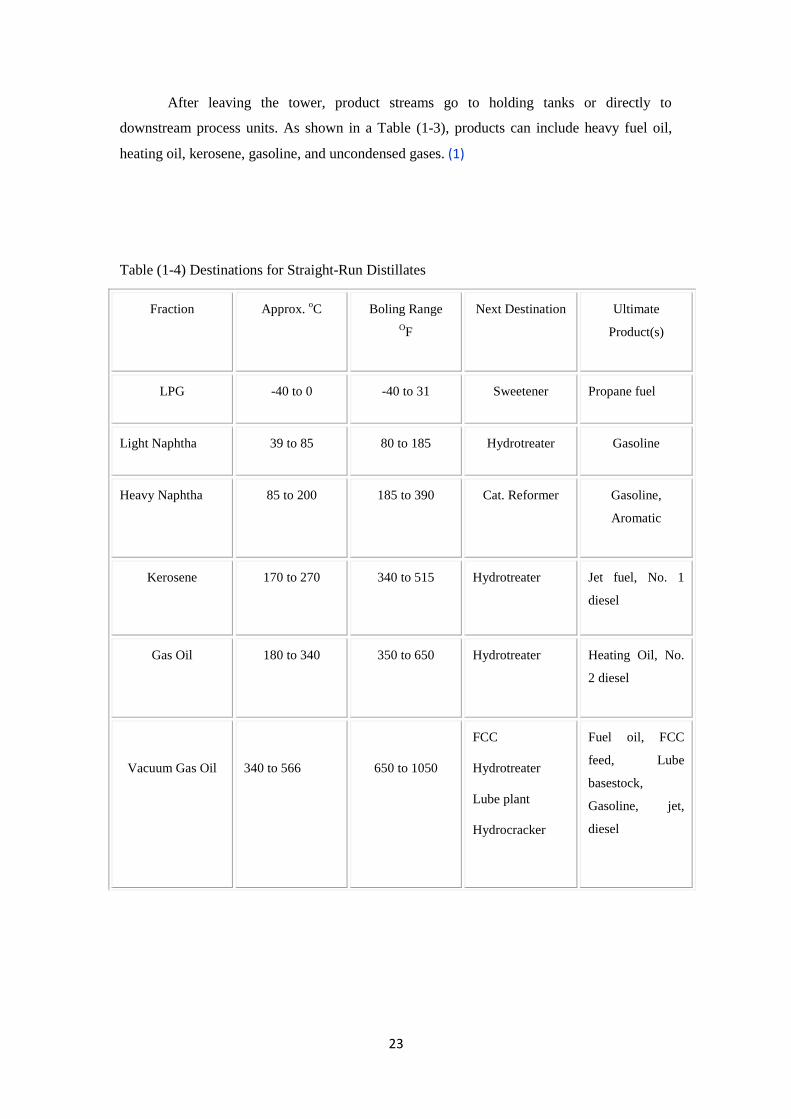
After leaving the tower, product streams go to holding tanks or directly to
downstream process units. As shown in a Table (1-3), products can include heavy fuel oil,
heating oil, kerosene, gasoline, and uncondensed gases. (1)
Table (1-4) Destinations for Straight-Run Distillates
Fraction Approx. oC
Boling Range
OF
Next Destination Ultimate
Product(s)
LPG -40 to 0 -40 to 31 Sweetener Propane fuel
Light Naphtha 39 to 85 80 to 185 Hydrotreater Gasoline
Heavy Naphtha 85 to 200 185 to 390 Cat. Reformer Gasoline,
Aromatic
Kerosene 170 to 270 340 to 515 Hydrotreater Jet fuel, No. 1
diesel
Gas Oil 180 to 340 350 to 650 Hydrotreater Heating Oil, No.
2 diesel
Vacuum Gas Oil
340 to 566
650 to 1050
FCC
Hydrotreater
Lube plant
Hydrocracker
Fuel oil, FCC
feed, Lube
basestock,
Gasoline, jet,
diesel

24
Residue
>540
>1000
Coker
Visbreaker
Asphalt Unit
Hydrotreater
cooker gas oil
Visbreaker gas
oil, Deasphalted
oil

25
Fig (1-2) petroleum distillation unit
26
1.9 REFLUX
In normal distillation columns, heat is added to the column from a reboiler and
removed in an overhead condenser. A part of the distillate condensed in overhead condenser
is returned to the column as reflux to aid fractionation. This approach is not feasible in crude
distillation because the overhead temperature is too low for recovery of heat. Also the vapor
and liquid flows in column increase markedly from bottom to top, requiring a very large-
diameter tower. To recover the maximum heat and have uniform vapor and liquid loads in the
column, intermediate refluxes are withdrawn, they exchange heat with incoming crude oil
before entering the furnace and are returned to the plate above in the column (1)

27

28
CHAPTER TWO
UNIT OPERATIONS
Chemical Engineering has developed from chemical technology and became
an independent branch of knowledge. It is a generalized method of description of
processes and equipment of chemical and food technologies. Chemical Engineering
relies on mathematics, physics, chemistry and physical chemistry. The unit operations
are very important part in the chemical industries.
2.1. TRADITIONAL CLASSIFICATION OF PROCESSES
Mechanical processes
Hydro dynamical processes
Heat transport processes
Mass transport processes (or diffusion separation processes)
Chemical processes
Biochemical and biological processes
2.2. ESSENTIAL PROCESSES BASED ON DIFFERENT
PHYSICAL PRINCIPLES:
1) Transport Processes
Momentum transport – used in hydrodynamics and fluid flow.
Energy transport – used in description of heat transfer and heat exchangers.
Mass transport – used in diffusion-separation processes.
2) Transformation Processes
Phase change: it is used in heat exchange accompanied by boiling or
condensation and in mass change such as distillation, drying.
Chemical reaction: it is used in description of chemical reactors.
Unit Operations: it involve certain type of processes carried out in a specific
equipment .(2)
29
2.3. EXAMPLES OF UNIT OPERATIONS:
Fluid transportation, filtration settling, fluidization, mixing : they involve
hydro mechanical processes
Heat exchange, evaporation : they involve energy (heat) transport
Extraction, absorption, drying, and distillation, membranes: they involve mass
transport.
Reactors, bioreactors: they involve chemical reaction
The refinery is thus a very complex technical facility and its productivity can
be ensured only by strict and constant control of all the component parts, to guarantee
product quality, operational safety and environment protection, theses aims are
attained by measurement, control and supervision techniques, which are now of vital
importance in all petroleum and petrochemical complexes.Since there are numerous
and varied pieces of equipment involved they have been grouped in type categories
having similar functions. In this connection, the classification of chemical engineering
unit operations has been used and the following will be examined successively:
1. Equipment for separating the components of a mixture, either by mass
transfer between phases (gas-liquid or liquid-liquid) or by physical separation
of multiphase systems such as gas-liquid, liquid-liquid, gas-solid, and liquid-
solid mixtures.
2. Equipment for achieving heat transfers, such as furnaces and heat exchangers.
3. Equipment called reactors where chemical reactions take place.
4. Equipment used to accomplish the mechanical operations of fluid transport
( pumps, compressors, or mixing).( 2)
This chapter studies the types of the unit operations that is used in reformer and
hydrotreating unit

30
2.4. GENERAL OVERVIEW ABOUT UNIT OPERATIONS
1. Heat Exchangers
The purpose of heat exchanger:
a) - Cooling:
The gasoline product that is going to storage to reduce its Vapor pressure
General unit intercoolers remove the heat of reaction between reactors
Fractionator’s condensers condense the overhead, part of which may be the
product and the other part of which may be reflux that is returned to the
column to help effect a separation.
b) - Heating:
Fractionator’s rebuilders are used to add heat to fractionation column that
effects a separation.
Reactor charge heaters are used to heat the charge up to the reaction
temperature.
c) - To exchange heat between hot and cold process streams:
Feed exchanger that is used to heat the reactor charge by exchanging heat with
the reactor effluent.
Fractionator’s feed-bottoms exchanger that is used to heat the feed by
exchanging heat with the bottom.
Shell and Tube Heat Exchangers
A shell and tube heat exchanger is a class of heat exchanger designs. It is the
most common type of heat exchanger in oil refineries and other large chemical
processes and is suited for higher-pressure applications. It consists of a tube bundle
enclosed in a cylindrical casing called a shell. One fluid runs through the tubes, and
another fluid flows over the tubes (through the shell) to transfer heat between the two
fluids.Two fluids, of different starting temperatures, flow through the heat exchanger.
One flows through the tubes (the tube side) and the other flows outside the tubes but
inside the shell (the shell side). Heat is transferred from one fluid to the other through
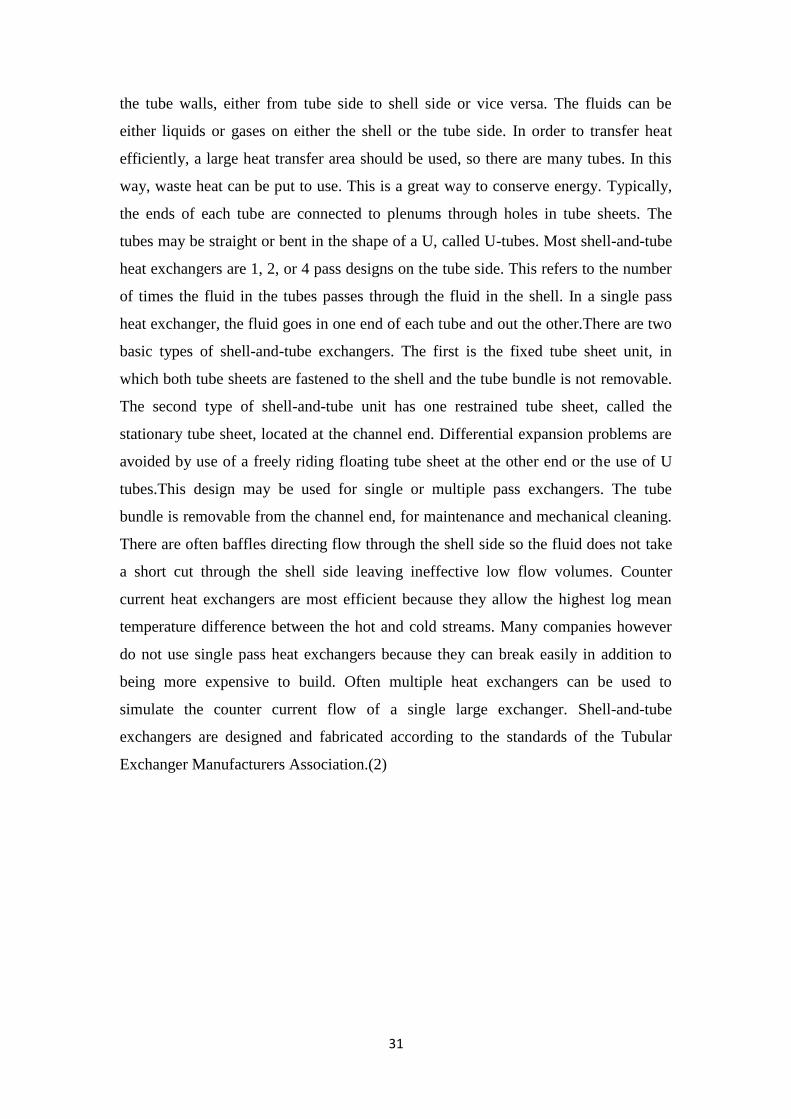
31
the tube walls, either from tube side to shell side or vice versa. The fluids can be
either liquids or gases on either the shell or the tube side. In order to transfer heat
efficiently, a large heat transfer area should be used, so there are many tubes. In this
way, waste heat can be put to use. This is a great way to conserve energy. Typically,
the ends of each tube are connected to plenums through holes in tube sheets. The
tubes may be straight or bent in the shape of a U, called U-tubes. Most shell-and-tube
heat exchangers are 1, 2, or 4 pass designs on the tube side. This refers to the number
of times the fluid in the tubes passes through the fluid in the shell. In a single pass
heat exchanger, the fluid goes in one end of each tube and out the other.There are two
basic types of shell-and-tube exchangers. The first is the fixed tube sheet unit, in
which both tube sheets are fastened to the shell and the tube bundle is not removable.
The second type of shell-and-tube unit has one restrained tube sheet, called the
stationary tube sheet, located at the channel end. Differential expansion problems are
avoided by use of a freely riding floating tube sheet at the other end or the use of U
tubes.This design may be used for single or multiple pass exchangers. The tube
bundle is removable from the channel end, for maintenance and mechanical cleaning.
There are often baffles directing flow through the shell side so the fluid does not take
a short cut through the shell side leaving ineffective low flow volumes. Counter
current heat exchangers are most efficient because they allow the highest log mean
temperature difference between the hot and cold streams. Many companies however
do not use single pass heat exchangers because they can break easily in addition to
being more expensive to build. Often multiple heat exchangers can be used to
simulate the counter current flow of a single large exchanger. Shell-and-tube
exchangers are designed and fabricated according to the standards of the Tubular
Exchanger Manufacturers Association.(2)

32
Fig(2-1( Shell and tube Heat Exchanger
`
Fig(2-2) Straight Tube Heat Exchanger (One Pass Tube-Side: Countercurrent Flow)

33
Fig(2-3) Straight Tube Heat Exchanger (Two Pass Tube Side)
2. Fan Coolers
Air-cooled exchangers use atmospheric air as a cooling fluid. After being
sucked in by fans, the air goes through the usually finned tube bundles where a fluid
circulating inside is to be cooled or condensed. The bundles can be horizontal, vertical
or inclined, with the air and fluid on the tube side circulating in cross flow figure (2-
4), Bundles are horizontal in most air coolers employed with petroleum products.(2)
Fig(2-4) Air-cooled exchangers bundle position
A. Horizontal. B. Vertical. C. Inclined.
Induced draft: when the fans are placed above the bundles.

34
Fig(2-5) Fan cooler, Induced draft
Forced draft: when the fans are placed below the bundles.
Fig(2-6) Fan cooler, Forced draft
3. Heaters
Heater or Furnaces are equipment where fluids are heated by the gases
produced by combustion of a liquid or gaseous fuel. They are termed direct fired

35
furnaces, as the heat of the combustion gases is directly transmitted to the cold fluid
that circulates in a tubular coil. These furnaces are different from indirectly fired
furnaces where the process fluid to be heated circulates in a tube bundle submerged in
a hot fluid, which is itself heated directly by the fuel combustion gases figure (2-
7).(2).Direct fired furnaces must also be distinguished from mixing type furnaces
(such as catalyst regenerators) where the process fluid is raised to the specified
temperature by mixing with the fuel combustion gases.
Fig(2-7) Indirectly fired furnace
There are numerous layouts for tubes in the radiation and convection sections
and for one section in relation to the other. There are consequently many types of
furnaces, that can however be classified into the different categories:
Cabin Furnaces With Horizontal Tubes

36
Here the general shape of the radiation section is a parallelepiped, with the
greatest length being horizontal. The tubes are placed horizontally on the longest side
walls. The burners are located on the floor, on the lower part of the longest side walls
or on the end walls where there are no tubes. Figure (2-8).(2)
Figure (2-8) Cabin furnaces with horizontal tubes
Vertical Cylindrical

37
The radiation section is in the shape of a cylinder with vertical axis. The
burners are located on the floor at the base of the cylinder. The heat exchanger area
covers the vertical walls and therefore exhibits circular symmetry with respect to the
heating assembly figure (2-9). (2)

38
Fig(2-9) Vertical cylindrical

39
4. Steam Striping (Stripper)
A wastewater stream is heated and put in intimate contact with steam in a
packed or tray tower. The combined effects of the steam and heat, or temperature
cause organic material to transfer from the liquid to the vapor phase. This material is
then carried out with the vapor. As contacting proceeds down the tower, the
wastewater becomes leaner in the organic material while the vapor phase becomes
more enriched as it travels up the tower Steam is injected at the bottom of the tower to
provide heat and vapor flow. Clean water leaves the bottom of the tower. The
wastewater is fed at the top of the tower and the steam leaves the top heavily laden
with organic material. This steam/organic combination is condensed and processed
further as detailed in the next few pages. The net effect achieved in the steam stripper
and condenser is that a contaminated wastewater and steam are injected into the tower
and a clean water stream is obtained. Some organic materials are not totally miscible
in water and separate into a distinct organic phase when the concentration exceeds the
solubility limit. Most aromatics and halogenated organics fall in this category. Steam
stripping applications for these types of compounds can be very effective, since a
good part of the concentration of the organic can be accomplished in a decanter as
indicated in figure (3-10). In this case, the water layer is recycled to the stripping
column for reprocessing. The design of the decanter poses some interesting questions
since the water flow is generally significantly larger than the organic flow.
Furthermore, in some cases (benzene, toluene, etc), the organic layer is the lighter of
the two liquid phases. In applications involving halogenated organics, the organic
liquid is heavier than water. Needless to say, good models to predict the phase
behavior of the system in question are essential.(3)

40
Fig(2-10) Steam striping using structured packing. Water (light phase) is recycled as
reflux at top of stripper

41
5. Stabilizer
Condensate stabilization units are an important tool in making condensate
from natural gas streams easier to manage. Designs vary, but the goals of
implementing a stabilization unit are usually the same: increase recovery of
hydrocarbons, remove corrosive components, and create transport-ready product.
Carbon dioxide and hydrogen sulfide corrode transport infrastructure, and lighter
hydrocarbons like methane in the condensate are more dangerous to handle.
Removing these while optimizing recovery of constituents like methane and propane
means safer product and more profitable operations Raw natural gas liquids (NGLs)
are introduced into the stabilization unit at a high pressure through a shutdown valve
and preheated to a specific temperature. Afterwards, the pressure of the liquid feed is
dropped via a control valve, creating both a liquid and gas phase. At this point water
can be flashed out and removed from the stream, while any light gasses that escape
can be flashed off or recovered. The remaining hydrocarbon liquids are then heated
through a bottom exchanger before entering into a contactor or stabilizer tower.
Tower designs can vary from tray to packed column, but the idea is generally the
same: a reboiler heats the hydrocarbon liquid, causing two separate phases again.
Lighter hydrocarbons with lower boiling points rise up the tower as a gas, while the
heavier hydrocarbons contact the trays or packing in the column, collect, and stream
down to the bottom of the tower as a liquid. Using either flash drum liquids or another
technique, the NGLs are cooled and routed to a pipeline or storage facility. The vapor
that rose through the tower may be flashed off in a downstream flare (if permitted by
regulations) or routed to an NGL recovery skid designed to compress and store the
lighter hydrocarbons for later processing or use.Modern designs of condensate
stabilizer units have several advantages. They are increasingly designed to be of a
pretested, skid-mounted, modular design for rapid installation and start-up. These
modular units can be ordered based on specific needs, from low BPD well-site
recovery to high BPD midstream NGL processing. Hot or heat medium oil systems
help reduces emissions, while compression cycles can be optimized with digital
control systems. Additional equipment can be added or modified for special-case
scenarios as well.

42
Fig(2-11) Stabilizer unit
Stabilizer Unit Working Description
After upstream separation, the condensate stream enters the unit. It is first
preheated in the inlet heat exchanger and then flows into the upper section of the
stabilizer tower. Inside the tower, the light components – typically methane, ethane,
propane, and butane – rise and exit the overhead vapor outlet. The heavier liquid
components descend and pass through the indirect heater to cause additional vapor to
flash off, rise and exit the tower. Stabilized liquids collect in the bottom of the tower.
They are routed to the inlet heat exchanger to cool. Stabilized liquid product then
flows to storage tanks. The vapor that exits the tower flows through an ambient cooler
and then to a low-pressure separator. Gas from the separator is routed to compression
for delivery to market. NGLs exit the separator and flow to a blow case where they
are pressurized for a bullet tank or pipeline.(4)

43
6. Separators
A separator is a device used for separating oil, gases and water contained in
the effluent, this called be three phase separator, while a separator that used for
separating two phase called be two phase separator.
Three Phase Separators
1. Horizontal Separator
They have a very high exchange surface. These separators generally have a
smaller diameter than vertical separators for the same, quantity of gas and offer a
larger gas/liquid interface. They are also easier to mount on skids.
Fig(2-12) Separators three phase, Horizontal Separator
Advantages of horizontal separator
Horizontal separators are ideally suited to well streams having high gas-oil
ratios, constant flow, and small liquid surge. Horizontal separators are smaller and
less expensive than vertical separators for a given gas capacity. Liquid particles in the
wells stream travel horizontally and downward at the same time as a result of two
forces acting upon them-the horizontal force of the gas stream and the downward
force of gravity. Therefore, higher gas velocities can be permitted in horizontal
separators and still obtain the same degree of separation as in vertical separators.
Also, the horizontal separators have a much greater gas-liquid interface area than
other types which aids in the release of solution gas and reduction of foam, the
horizontal configuration is best suited for liquid-liquid-gas.
44
Disadvantages of horizontal separator
Becomes expensive and heavy when large sizes are required, liquid level
control is critical for horizontal separators; they are much harder to clean.
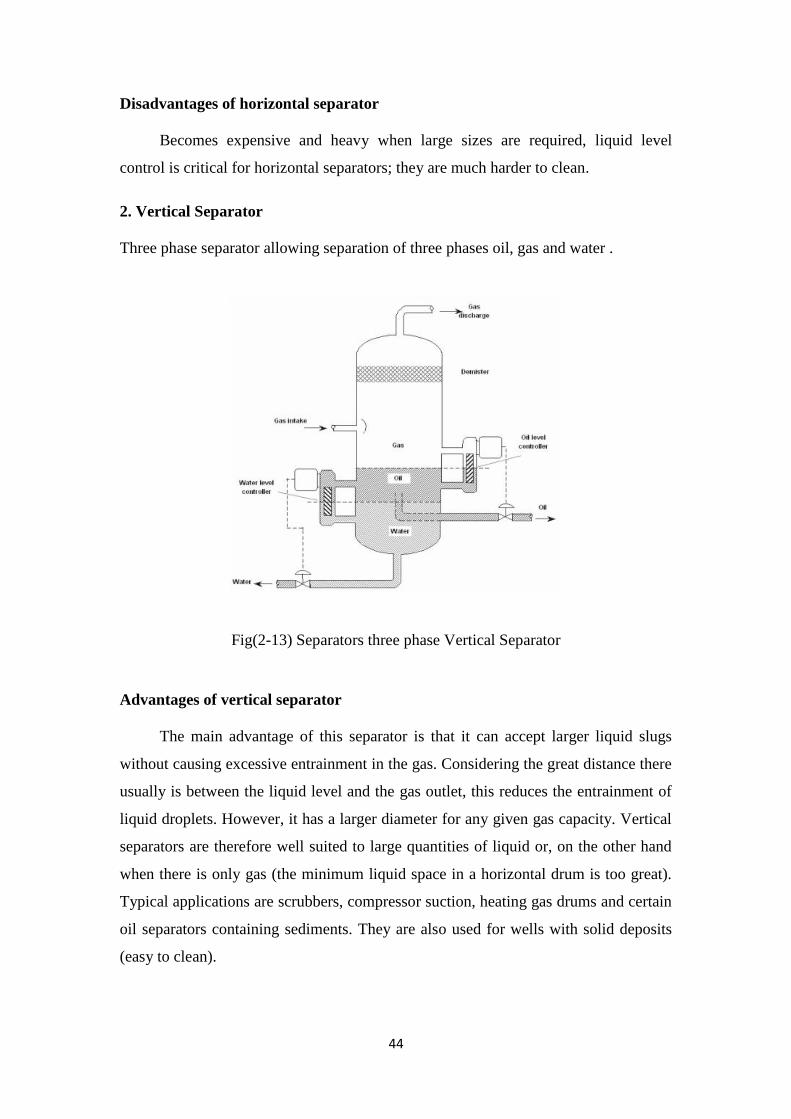
2. Vertical Separator
Three phase separator allowing separation of three phases oil, gas and water .
Fig(2-13) Separators three phase Vertical Separator
Advantages of vertical separator
The main advantage of this separator is that it can accept larger liquid slugs
without causing excessive entrainment in the gas. Considering the great distance there
usually is between the liquid level and the gas outlet, this reduces the entrainment of
liquid droplets. However, it has a larger diameter for any given gas capacity. Vertical
separators are therefore well suited to large quantities of liquid or, on the other hand
when there is only gas (the minimum liquid space in a horizontal drum is too great).
Typical applications are scrubbers, compressor suction, heating gas drums and certain
oil separators containing sediments. They are also used for wells with solid deposits
(easy to clean).

45
Disadvantages of vertical separator
Equipment is expensive and heavy when large sizes are required. A vertical
separator for the same capacity is usually larger than a horizontal separator.
3. Spherical Separator
These types of separators are not very common and are reserved for wells with
very high gas-oil ratios (gas + condensate wells).
Fig(2-14) Separators three phase, Spherical Separator
Advantages of spherical separator
They are relatively low-cost and compact, but with a limited liquid retention
time and decantation section. Their advantage is their compact size but they offer
small capacities. They are very easy to handle. Another interesting point of
importance is that owing to their spherical shape, they can support all pressure ranges
Disadvantages of spherical separator
Use in three-phase separation is, therefore, very difficult if not impossible.
Two Phase Separators
This type of operation is very frequently encountered in actual practice in
most processes. Gravity separation is then often utilized due to its simplicity and low

46
cost. The problem of separating either a vapor phase and a liquid phase or two
immiscible liquid phases arises
constantly in the refinery. The operation is carried out in vertical or horizontal drums
whose seizing is such that two objectives are accomplished: residence time is
sufficiently long for the separation to occur as completely as possible and
entrainments of one in the other are reduced to a minimum.(5)
Gas-Liquid separation
Liquid-Liquid separation
Gas-Solid separation
Liquid-Solid separation
7. Distillation Tower
An apparatus used widely for countercurrent contacting of vapor and liquid to
effectseparations by distillation or absorption. In general, the apparatus consists of a c
ylindricalvessel with internals designed to obtain multiple contacting of ascending vap
or and descendingliquid, together with means for introducing or generating liquid at t
he top and vapor at thebottom.In a column that can be applied to distillation (see illust
ration), a vapor condenser is used toproduce liquid (reflux) which is returned to the to
p, and a liquid heater (reboiler) is used togenerate vapor for introduction at the bottom
. In a simple absorber, the absorption oil is the topliquid and the feed gas is the bottom
vapor. In all cases, changes in composition produce heateffects and volume changes,
so that there is a temperature gradient and a variation in vapor,and liquid flows from t
op to bottom of the column. These changes affect the internal flow ratesfrom point to
point throughout the column and must be considered in its design.Distillation columns
used in industrial plants range in diameter from a few inches to 40 ft (12 m)and in hei
ght from 10 to 200 ft (3 to 60 m). They operate at pressures as low as a fewmillimeter
s of mercury and as high as 3000 lb/in.2 (2 megapascals) at temperatures from 300to 7
00°F (180 to 370°C). They are made of steel and other metals, of ceramics and glass,
andeven of such materials as bonded carbon and plastics.A variety of internal devices
have been used to obtain more efficient contacting of vapor and liquid. The most
widely used devices are the bubble cap plates the perforated or sieve plate, and the
packed column.

47
Fig(2-15) Distillation Tower
The bubble cap plate is a horizontal deck with a large number of chimneys over which
circular or rectangular caps are mounted to channel and distribute the vapor through
the liquid. Liquid flows by gravity downward from plate to plate through separate
passages known as down comers. (5)
8. Compressors
A compressor is a machine designed to raise the pressure of compressible fluid
that passes through it. The name indicates that the fluid becomes compressed (its
volume decreases) as the pressure increases. Since gases are compressible fluids they
require compressors, while liquid require pumps as they are practically
incompressible. Gases can be considered incompressible for very low compression

48
ratios and blowers or fans are used. The compressors most commonly used in a
refinery are reciprocating piston compressors in the positive displacement category
and centrifugal compressors in the dynamic category.
Reciprocating Piston Compressor
This type of compressor used a proven technology that has been known for
some time and is the most widely employed of the positive displacement compressors
for power rating of 100 to 5000 KW.
Fig(2-16) Reciprocating piston compressor
Centrifugal Compressor
These compressors are widely used in refining and in the chemical and
petrochemical industries. They are built according to API 617 standards, are very
compact and can develop significant power in comparison with their size.( 2)

49
Fig(2-17) Centrifugal compressor
9. Pumps
Pumps allow liquids to be circulated and are found in different forms in
refining units. They can be classified into two main categories:
1- Centrifugal pumps.
2- Positive displacement pumps.
Table (2-1) Main types of pumps
Category Type Structure
Centrifugal
Single-stage
Multi-stage
Volute
Diffuser
Regenerative
Vertical
Helico-centrifugal
Axial flow
positive displacement
Rotary Gear-Lobe
Screw-Peripheral
Vane -Progressive cavity
Reciprocating Piston
Diaphragm
Plunger

50
There are a great many subgroups as indicated in table (2-1). Choosing
among the different types depends on numerous parameters, some of the most
important being the capacity (flow rate m3/h), the pressure head that is generated by
the pump, the type of liquid pumped (in particular its viscosity and vapor pressure
under inlet conditions). An initial selection is generally made on basis of the first two
criteria mentioned, i.e. the capacity and the pressure generated. The centrifugal pump
is often the only possible choice for high capacities, whereas positive displacement
pumps are better suited to generating high pressure differenc Other criteria such as the
viscosity of the pumped liquid can modify this initial choice. A positive displacement
pump is generally recommended to pump liquid with a viscosity higher than 2000cP.
In actual practice there are often situation where the choice requires taking other
parameters, in particular economic ones, into account.(5)
Centrifugal Pumps
In its simplest form, a centrifugal pump consists of impeller equipped with
radial vanes rotating inside a shell called the pump casing. The working principle is to
use the centrifugal force generated by the rotating impeller to transfer kinetic energy
to the pumped liquid This energy is then converted into pressure when the fluid
velocity decreases. Principle of the centrifugal pump An increase in the fluid pressure
from the pump inlet to its outlet is created when the pump is in operation. This
pressure difference drives the fluid through the system or plant.The centrifugal pump
creates an increase in pressure by transferring mechanical energy from the motor to
the fluid through the rotating impeller. The fluid flows from the inlet to the impeller
center and out along its blades. The centrifugal force hereby increases the fluid
velocity and consequently also the kinetic energy is transformed to pressure.

51
Fig(2-18) Centrifugal pump and Fluid path through the pump
Hydraulic components: The principles of the hydraulic components are
common for most centrifugal pumps. The hydraulic components are the parts in
contact with the fluid. Figure (2-19) shows the hydraulic components in a single-stage
in-line pump. (5)
Fig(2-19) The hydraulic components in a single-stage in-line pump.

52
Advantages of centrifugal pump
The centrifugal pump is the most used pump type in the world. The principle is
simple, well-described and thoroughly tested, and the pump is robust, effective and
relatively inexpensive to produce. There is a wide range of variations based on the
principle of the centrifugal pump and consisting of the same basic hydraulic parts.
Disadvantages of centrifugal pump
The centrifugal pump is not better suited to generating high pressure
difference, and there problem are that happen in the pump, the liquid specification
problem (Cavitation, Air pockets, Scales and Corrosion), operational problem and
mechanical problem.(6)
10. Ejectors
An ejector is a device that uses a motive fluid passing through a diffuser at
high speed. A negative pressure is thus generated that entrains another fluid. The
principle is in fact an application of the Bernoulli theorem that expresses the
conservation of momentum in a system. The steam expands is entropic ally through
the entrance orifice in the suction chamber. It then mixes with the gas being evacuated
at constant pressure and with no loss in momentum. A large part of the steam kinetic
energy is converted in to heat. The mixture then flows through the diffuser, with the
mixture kinetic energy being converted into a pressure increase. Isentropic
compression efficiency is approximately 80 %. (2)
Fig(2-20) Schematics of ejectors A. Single nozzle. B. Multiple nozzles

53

54
CHAPTER THREE
MATERIAL BALANCE
3.1. INTRODUCTION
Material balances are important first step when designing a new process or
analyzing an existing one. They are almost always prerequisite to all other calculations in the
solution of process engineering problems. Material balances are nothing more than the
application of the law of conservation of mass, which states that mass can neither be
created nor destroyed. Thus, you cannot, for example, specify an input to a reactor of one
ton of naphtha and an output of two tons of gasoline or gases or anything else. One ton of
total material input will only give one ton of total output, i.e. total mass of input = total mass
of output. A material balance is an accounting for material. Thus, material balances are often
compared to the balancing of current accounts. They are used in industry to calculate mass
flow rates of different streams entering or leaving chemical or physical processes.
The General Balance Equation Suppose propane is a component of both the input and
output streams of a continuous process unit shown below, these flow rates of the input and
output are measured and found to be different.
If there are no leaks and the measurements are correct, then the other possibilities
that can account for this difference are that propane is either being generated, consumed,
or accumulated within the unit.
A balance (or inventory) on a material in a system (a single process unit, a collection
of units, or an entire process) may be written in the following general way:
. Input + generation − output − consumption = accumulation
(Enter (produced (leave (consumed (buildup
Through within through within within
System) system) system) system) system)

55
This general balance equation may be written for any material that enters or
leaves any process system; it can be applied to the total mass of this material or to any
molecular or atomic species involved in the process. The general balance equation
may be simplified according to the process at hand. For example, by definition, the
accumulation term for steady-state continuous process is zero. Thus the above
equation becomes:
Input + generation = output + consumption
For physical process, since there is no chemical reaction, the generation and
consumption terms will become zero, and the balance equation for steady-state
physical process will be simply reduced to:
Input = Output
3.2. MASS FEEDBACK (RECYCLE)
Mass balances can be performed across systems which have cyclic flows. In
these systems output streams are fed back into the input of a unit, often for further
reprocessing.
Such systems are common in grinding circuits, where materials are crushed then
sieved to only allow a particular size of particle out of the circuit and the larger
particles are returned to the grinder. However, recycle flows are by no means
restricted to solid mechanics operations; they are used in liquid and gas flows, as well.
One such example is in cooling towers, where water is pumped through a tower many
times, with only a small quantity of water drawn off at each pass (to prevent solids
build up) until it has either evaporated or exited with the drawn off water.
The use of the recycle aids in increasing overall conversion of input products,
which is useful for low per-pass conversion processes (such as the Haber
process).(7)
3.3. COMMERCIAL USE
In industrial process plants, using the fact that the mass entering and leaving any
portion of a process plant must balance, data validation and reconciliation algorithms may
be employed to correct measured flows, provided that enough redundancy of flow

56
measurements exist to permit statistical reconciliation and exclusion of detectably
erroneous measurements. Since all real world measured values contain inherent error, the
reconciled measurements provide a better basis than the measured values do for financial
reporting, optimization, and regulatory reporting. Software packages exist to make this
commercially feasible on a daily basis .(7)
3.4. BASIC CALCULATIONS
The basic calculation for design the units of refinery is 200000 𝑏𝑎𝑟𝑙/𝑑𝑎𝑦
200000 𝑏𝑎𝑟𝑙 159 𝑙𝑖𝑡𝑒𝑟 1 𝑘𝑔
𝑑𝑎𝑦 1 𝑏𝑎𝑟𝑟𝑒𝑙 1 𝑙𝑖𝑡𝑒𝑟
= 31800000 𝑘𝑔/𝑑𝑎𝑦
The specific gravity of the crude oil from table specificationat temperature 15.7 ℃ is 0.8418
𝑆𝐺𝑜𝑖𝑙 =𝜌𝑜𝑖𝑙
𝜌𝐻2𝑜
𝜌𝑜𝑖𝑙 = 𝑆𝐺𝑜𝑖𝑙 × 𝜌𝐻2𝑂 = 0.8418 × 1000 𝐾𝑔
𝑚3
𝜌𝑜𝑖𝑙 = 841.8 𝐾𝑔
𝑚3
𝑉𝑜𝑖𝑙 = 𝑚𝑜𝑖𝑙
𝜌𝑜𝑖𝑙=
31800000𝐾𝑔/𝑑𝑎𝑦
841.8 𝐾𝑔/𝑚3
𝑉𝑜𝑖𝑙 = 37776𝑚3
𝑑𝑎𝑦

57
𝐴𝑃𝐼 𝑔𝑟𝑎𝑣𝑖𝑡𝑦 =141.5
𝑆𝐺− 131.5
=141.5
0.8418− 131.5 = 36.5921
From table of distillation products (ASTM) for oil and from TBP chart (2.1),the volume
percent (V %) of all products the distillation column is calculated
Table (3-1) range boiling temperature to each product (ASTM)
Light
naphtha
Heavy
naphtha
Kerosene diesel residue
I.P.P
10
30
50
70
90
95
F.P.B
20
54
80
99
116
137
-
167
190
160
162
166
170
176
180
206
148
180
198
204
208
216
220
242
192
246
270
280
304
326
334
348
230
342
358
-
-
-
-
358
Table (3-2) State work column (temperature – pressure)

58
Heat outlet temp
Heavy Naphtha
Kerosene
Diesel
Residue
Flash zoon temp
Bottom temp
Top temp
Top pressure
Level
343 ℃
153 ℃
184 ℃
256 ℃
320 ℃
325 ℃
320 ℃
98 ℃
0.56 kg/cm3
52%
Figure (3-1) percentages the product according the boiling point
The percent of each product in the crude oil is calculated by using the relationship
betweentemperature range (I.B.P and FBP) and percent volume (𝑉%) fromtable (2.1)
andfigure (2.1) drawing by excel program.

59
Where the factor of steam that injects with the product increases the temperature of the
product in the equipment. The calculations are mentioned below:
LPG from 10 ℃𝑡𝑜→ 90 ℃
𝑉𝐿𝑃𝐺% = 𝑉𝑖 + 𝑉𝑓
2 × 𝐹𝑎𝑐𝑡𝑜𝑟 𝑜𝑓 𝑠𝑡𝑒𝑎𝑚 (𝐿𝐵𝐺)
= 1.5 + 7
2= 4.25 × 0.33 = 1.4
𝐿. 𝑁 𝑓𝑟𝑜𝑚 20℃ → 167℃
𝑉𝐿. 𝑁% = 𝑉𝑖 + 𝑉𝐹
2 × 𝐹𝑎𝑐𝑡𝑜𝑟 𝑠𝑡𝑒𝑎𝑚 (𝐿. 𝑁)
𝑉𝐿. 𝑁% = 15.5 + 26
2 × 0.29 = 6
𝑉𝐻. 𝑁% = 𝑉𝑖 + 𝑉𝐹
2 × 𝐹𝑎𝑐𝑡𝑜𝑟 𝑠𝑡𝑒𝑎𝑚 (𝐻. 𝑁)
𝑉𝐻. 𝑁% = 2 + 20
2 × 0.72 = 15.1
𝐾𝑒𝑟 𝑓𝑟𝑜𝑚 148℃ → 242℃
𝑉𝐾𝐸𝑅 % = 𝑉𝑖 + 𝑉𝐹
2 × 𝐹𝑎𝑐𝑡𝑜𝑟 𝑠𝑡𝑒𝑎𝑚 (𝐾𝑒𝑟)
𝑉𝐾𝐸𝑅 % = 18 + 32
2 × 0.22 = 5.5
𝐷𝑖𝑠𝑒𝑙 𝑓𝑟𝑜𝑚 192℃ 𝑡𝑜→ 348℃
𝑉𝐷𝑖𝑒𝑠𝑒𝑙% = 𝑉𝑖 + 𝑉𝐹
2 × 𝐹𝑎𝑐𝑡𝑜𝑟 𝑠𝑡𝑒𝑎𝑚 (𝐷𝑖𝑠𝑒𝑙)
𝑉𝐷𝑖𝑒𝑠𝑒𝑙% = 25 + 52
2 × 0.31 = 12
𝑅𝑒𝑠𝑖𝑑𝑢𝑚 𝑓𝑟𝑜𝑚 230℃ 𝑡𝑜→ 358℃
= 𝑉𝑖 + 𝑉𝐹
2 × 𝐹𝑎𝑐𝑡𝑜𝑟 𝑠𝑡𝑒𝑎𝑚 (𝑅𝑒𝑠𝑖𝑑𝑢𝑚)
𝑉𝑅𝑒𝑠𝑖𝑑𝑢𝑚% = 30 + 52
2 × 1.46 = 59.86

60
After the calculation of the percent products, the volume of the flow rates for all products
could be found:
𝑉𝐿𝑃𝐺 = 𝑉𝑜𝑖𝑙 × 𝑝𝑒𝑟𝑐𝑒𝑛𝑡(𝐿𝑃𝐺)
= 37776𝑚3
𝑑𝑎𝑦 × 0.014 = 528.864
𝑚3
𝑑𝑎𝑦
𝑉𝐿.𝑁 = 𝑉𝑜𝑖𝑙 × 𝑝𝑒𝑟𝑐𝑒𝑛𝑡(𝐿. 𝑁)
= 37776𝑚3
𝑑𝑎𝑦 × 0.06 = 2266.56
𝑚3
𝑑𝑎𝑦
𝑉𝐻.𝑁 = 𝑉𝑜𝑖𝑙 × 𝑝𝑒𝑟𝑐𝑒𝑛𝑡(𝐻. 𝑁)
= 37776𝑚3
𝑑𝑎𝑦 × 0.151 = 5704.176
𝑚3
𝑑𝑎𝑦
𝑉𝐾𝑒𝑟 = 𝑉𝑜𝑖𝑙 × 𝑝𝑒𝑟𝑐𝑒𝑛𝑡(𝐾𝑒𝑟)
= 37776𝑚3
𝑑𝑎𝑦 × 0.055 = 2077.68
𝑚3
𝑑𝑎𝑦
𝑉𝐷𝑖𝑒𝑠𝑒𝑙 = 𝑉𝑜𝑖𝑙 × 𝑝𝑒𝑟𝑐𝑒𝑛𝑡(𝐷𝑖𝑒𝑠𝑒𝑙)
= 37776𝑚3
𝑑𝑎𝑦 × 0.12 = 4533.12
𝑚3
𝑑𝑎𝑦
𝑉𝑟𝑒𝑠𝑖𝑑𝑢𝑚 = 𝑉𝑜𝑖𝑙 × 𝑝𝑒𝑟𝑐𝑒𝑛𝑡(𝑟𝑒𝑠𝑖𝑑𝑢𝑚)
= 37776𝑚3
𝑑𝑎𝑦 × 0.5986 = 22612.7136
𝑚3
𝑑𝑎𝑦
𝑉𝑡𝑜𝑡𝑎𝑙 = 𝑉𝐿𝑃𝐺 + 𝑉𝐿.𝑁 + 𝑉𝐻.𝑁 + 𝑉𝐾𝑒𝑟 + 𝑉𝐷𝑖𝑒𝑠𝑒𝑙 + 𝑉𝑟𝑒𝑠𝑖𝑑𝑢𝑚
𝑉𝑡𝑜𝑡𝑎𝑙 = 528.864 + 2266.56 + 5704.176 + 2077.68 + 4533.12 + 22612.7136
= 37723.1136𝑚3
𝑑𝑎𝑦
The calculation of the specific gravity of all products is done by using Figure (2.2) that
shows the relation between percent of volume of the product (V%) and the specific density as
following:

61
Figure(3-2) shows the logarithmic curve between the percent of the product and specific
weight
Table (3-3) the percent of product with specific gravity as resulting from figure( 2-2)
V% S.G
1.4
15.1
6
5.5
1.2
60
0.67
0.74
0.78
0.79
0.84
0.90
The calculation of the density for the product with the percent of the oil is done as following:
𝑆. 𝐺 = 𝜌𝑝𝑟𝑜𝑑𝑢𝑐𝑡
𝜌𝑤𝑎𝑡𝑒𝑟

62
𝜌𝐿𝑃𝐺 = 𝑆. 𝐺𝐿𝑃𝐺 × 𝜌𝑤𝑎𝑡𝑒𝑟 = 0.67 × 1000𝐾𝑔
𝑚3= 670
𝐾𝑔
𝑚3
𝑚𝐿𝑃𝐺 = 𝜌𝐿𝑃𝐺 × 𝑉𝐿𝑃𝐺 = 670 𝐾𝑔
𝑚3 × .528.864
𝑚3
𝑑𝑎𝑦= 354338.88
𝐾𝑔
𝑑𝑎𝑦
𝜌𝐿.𝑁 = 𝑆. 𝐺𝐿.𝑁 × 𝜌𝑤𝑎𝑡𝑒𝑟 = 0.74 × 1000 𝐾𝑔
𝑚3= 740
𝐾𝑔
𝑚3
𝑚𝐿.𝑁 = 𝜌𝐿.𝑁 × 𝑉𝐿.𝑁 = 740 𝐾𝑔
𝑚3 × 2266.56
𝑚3
𝑑𝑎𝑦= 1677254.4
𝐾𝑔
𝑑𝑎𝑦
𝜌𝐻.𝑁 = 𝑆. 𝐺𝐻.𝑁 × 𝜌𝑤𝑎𝑡𝑒𝑟 = 0.78 × 1000 𝐾𝑔
𝑚3= 780
𝐾𝑔
𝑚3
𝑚𝐻.𝑁 = 𝜌𝐻.𝑁 × 𝑉𝐻.𝑁 = 780 𝐾𝑔
𝑚3 × 5704.176
𝑚3
𝑑𝑎𝑦= 4449257.28
𝐾𝑔
𝑑𝑎𝑦
𝜌𝐾𝑒𝑟 = 𝑆. 𝐺𝐾𝑒𝑟 × 𝜌𝑤𝑎𝑡𝑒𝑟 = 0.79 × 1000 𝐾𝑔
𝑚3= 790
𝐾𝑔
𝑚3
𝑚𝐾𝑒𝑟 = 𝜌𝐾𝑒𝑟 × 𝑉𝐾𝑒𝑟 = 790 𝐾𝑔
𝑚3 × 2077.68
𝑚3
𝑑𝑎𝑦= 1641367.2
𝐾𝑔
𝑑𝑎𝑦
𝜌𝐷𝑖𝑒𝑠𝑙 = 𝑆. 𝐺𝐷𝑖𝑒𝑠𝑙 × 𝜌𝑤𝑎𝑡𝑒𝑟 = 0.84 × 1000 𝐾𝑔
𝑚3= 840
𝐾𝑔
𝑚3
𝑚𝐷𝑖𝑒𝑠𝑙 = 𝜌𝐷𝑖𝑒𝑠𝑙 × 𝑉𝐷𝑖𝑒𝑠𝑙 = 840 𝐾𝑔
𝑚3 × 4533.12
𝑚3
𝑑𝑎𝑦= 3807820.8
𝐾𝑔
𝑑𝑎𝑦
𝜌𝑟𝑒𝑠𝑖𝑑𝑢𝑚 = 𝑆. 𝐺𝑟𝑒𝑠𝑖𝑑𝑢𝑚 × 𝜌𝑤𝑎𝑡𝑒𝑟 = 0.90 × 1000 𝐾𝑔
𝑚3= 900
𝐾𝑔
𝑚3
𝑚𝑟𝑒𝑠𝑖𝑑𝑢𝑚 = 𝜌𝑟𝑒𝑠𝑖𝑑𝑢𝑚 × 𝑉𝑟𝑒𝑠𝑖𝑑𝑢𝑚 = 900 𝐾𝑔
𝑚3 × 22612.7136
𝑚3
𝑑𝑎𝑦= 20351442.24
𝐾𝑔
𝑑𝑎𝑦

63
The next calculations where done to make sure that the material balance are correct and found
percent error:
𝑚𝑡𝑜𝑡𝑎𝑙 = 528864 + 5704176 + 2266560 + 2077680 + 4533120 + 22612713.6
= 37723113.6 𝐾𝑔
𝑑𝑎𝑦
37723113.6 𝐾𝑔
𝑑𝑎𝑦 ×
1 𝑚3
1000 𝐾𝑔= 37723.1136
𝑚3
𝑑𝑎𝑦
𝑚 = 𝑉𝑜𝑖𝑙 × 𝜌𝑜𝑖𝑙 = 37723.1136𝑚3
𝑑𝑎𝑦 × 841.8
𝐾𝑔
𝑚3= 31755317.03
𝐾𝑔
𝑑𝑎𝑦
Where: 31755317.03 𝐾𝑔
𝑑𝑎𝑦 ×
1𝑙𝑖𝑡𝑒𝑟
1𝑘𝑔 ×
1𝑏𝑎𝑟𝑟𝑒𝑙
159 𝑙𝑖𝑡𝑒𝑟
Vtotal = 199718.975𝑏𝑎𝑟𝑟𝑒𝑙
𝑑𝑎𝑦
Product Percent
volume%
Volume
product 𝑚3
𝑑𝑎𝑦
S.G 𝑑𝑒𝑛𝑠𝑖𝑡𝑦
𝐾𝑔
𝑚3 𝑚𝑎𝑠𝑠 𝑝𝑟𝑜𝑑𝑢𝑐𝑡
𝐾𝑔
𝑑𝑎𝑦
M.M
LPG
1.4
528.864 0.67
-
670
354338.88
L.N
15.1 5704.176 0.734
740
4449257.28 100
H.N
6
2266.56 0.78
780
1677254.4 150
Kerosene
5.5
2077.68 0.79
790
1641367.2 165
Diesel
12
4533.12 0.84
840
3807820.8 215
Residue 60 22612.7136 0.90 900 20351442.24 320

64
𝑒𝑟𝑟𝑜𝑟 = 𝑡𝑟𝑢𝑒 𝑣𝑎𝑙𝑢𝑒 − 𝑓𝑎𝑙𝑠𝑒 𝑣𝑎𝑙𝑢𝑒
𝑡𝑟𝑢𝑒 𝑓𝑎𝑙𝑢𝑒
= 200000 − 199718.975
200000 × 100 = 0.14%
Out put In put
200000 199718.975
3.5. The Material Balance on The Stripper Towers:
The calculations of the inputs and the outputs percent and refluxes about the strippers are
done as following:
1-material balance about stripper of heavy naphtha (H.N):
Percent reflux in top tower is constant (6%)
The input amount for strippers towers (H.N) and steam =
𝑚𝑎𝑠𝑠 𝑜𝑓 𝐻. 𝑁 𝑡𝑜𝑡𝑎𝑙
(𝑡𝑜𝑡𝑎𝑙 𝑝𝑒𝑟𝑐𝑒𝑛𝑡% − 𝑝𝑒𝑟𝑐𝑒𝑛𝑡 𝑟𝑒𝑓𝑙𝑢𝑥)× 100
2266560𝐾𝑔𝑑𝑎𝑦
(100 − 6)× 100 = 2411234.043
𝐾𝑔
𝑑𝑎𝑦
The percent of reflux at the top of the column (H.N) and steam= (H.N) Input to
strippers– (input without reflux)
2411234.043𝐾𝑔
𝑑𝑎𝑦− 2266560
𝐾𝑔
𝑑𝑎𝑦= 144674.0426
𝐾𝑔
𝑑𝑎𝑦
𝑇ℎ𝑒 𝑎𝑚𝑜𝑢𝑛𝑡 𝑏𝑦 𝑔𝑎𝑙𝑙𝑜𝑛 𝑢𝑛𝑖𝑡 (𝑔𝑎𝑙):
= 144674.0426𝐾𝑔
𝑑𝑎𝑦 ×
1 𝑙𝑖𝑡𝑒𝑟
1 𝐾𝑔 ×
1 𝑔𝑎𝑙
3.785412 𝑙𝑖𝑡𝑒𝑟
= 38218.83658𝑔𝑎𝑙
𝑑𝑎𝑦
The amount steam injected to stripper will be stander for (H.N)
Amount steam = 0.2268 𝐾𝑔
𝑔𝑎𝑙
The amount steam = (H.N) reflux percent ×steam amount = 38218.83658𝑔𝑎𝑙
𝑑𝑎𝑦 ×
0.2268𝐾𝑔
𝑔𝑎𝑙= 8668.032136
𝐾𝑔
𝑑𝑎𝑦

65
Total of reflux Amount from steam and (H.N)
= Amount steam + (H.N) reflux at the top column
=8668.032136𝐾𝑔
𝑑𝑎𝑦+ 144674.0426
𝐾𝑔
𝑑𝑎𝑦= 153342.0747
𝐾𝑔
𝑑𝑎𝑦
The product bottom of (H.N)stripper = input of (H.N)stripper + amount of steam –
reflux amount of steam and (H.N)
= 2411234.043 + 8668.032136 − 153342.0747 = 2266560𝐾𝑔
𝑑𝑎𝑦
Figure 3.3 Material balance Stripper (H.N)
Out put In put
2419902.075 2419902.075
3.6. The Material Balances About The Stripper Of Kerosene (ker):
The percent of reflux at the top of the tower is constant (4%)
The input amount to Kerosene stripper tower= 𝑡𝑜𝑡𝑎𝑙 𝑚𝑎𝑠𝑠 𝑜𝑓 𝑘𝑒𝑟𝑜𝑠𝑒𝑛𝑒
(𝑡𝑜𝑡𝑎𝑙 𝑝𝑒𝑟𝑐𝑒𝑛𝑡%−𝑟𝑒𝑓𝑙𝑢𝑥 𝑝𝑒𝑟𝑐𝑒𝑛𝑡 )× 100
2077680𝐾𝑔𝑑𝑎𝑦
(100 − 4)× 100 = 2164250
𝐾𝑔
𝑑𝑎𝑦
The Percent of reflux at the top of the column (Ker) and steam = Input to strippers
(Ker) – (input without reflux)
66
= 2164250𝐾𝑔
𝑑𝑎𝑦− 2077680
𝐾𝑔
𝑑𝑎𝑦= 86570
𝐾𝑔
𝑑𝑎𝑦
𝑇ℎ𝑒 𝑎𝑚𝑜𝑢𝑛𝑡 𝑏𝑦 𝑔𝑎𝑙𝑙𝑜𝑛 𝑢𝑛𝑖𝑡 (𝑔𝑎𝑙) = 86570𝐾𝑔
𝑑𝑎𝑦 ×
1𝑙𝑖𝑡𝑒𝑟
1𝐾𝑔 ×
1𝑔𝑎𝑙
3.785412𝑙𝑖𝑡𝑒𝑟
= 22869.37327𝑔𝑎𝑙
𝑑𝑎𝑦
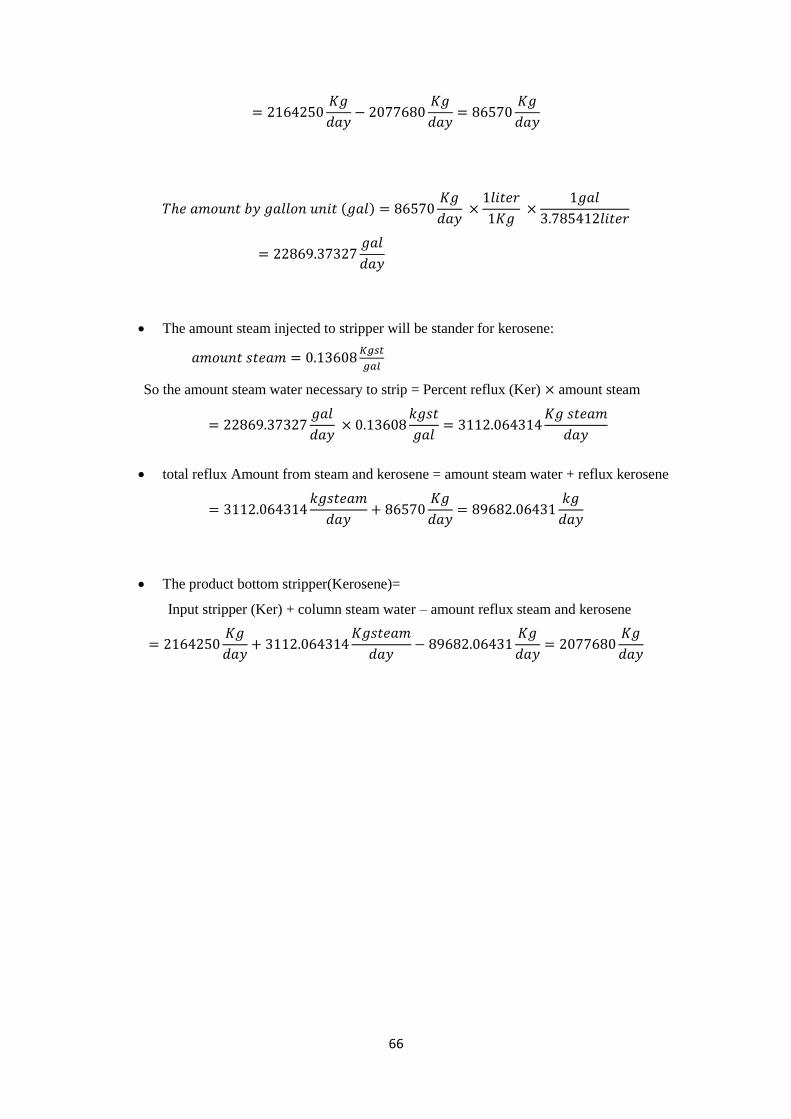
The amount steam injected to stripper will be stander for kerosene:
𝑎𝑚𝑜𝑢𝑛𝑡 𝑠𝑡𝑒𝑎𝑚 = 0.13608𝐾𝑔𝑠𝑡
𝑔𝑎𝑙
So the amount steam water necessary to strip = Percent reflux (Ker) × amount steam
= 22869.37327𝑔𝑎𝑙
𝑑𝑎𝑦 × 0.13608
𝑘𝑔𝑠𝑡
𝑔𝑎𝑙= 3112.064314
𝐾𝑔 𝑠𝑡𝑒𝑎𝑚
𝑑𝑎𝑦
total reflux Amount from steam and kerosene = amount steam water + reflux kerosene
= 3112.064314𝑘𝑔𝑠𝑡𝑒𝑎𝑚
𝑑𝑎𝑦+ 86570
𝐾𝑔
𝑑𝑎𝑦= 89682.06431
𝑘𝑔
𝑑𝑎𝑦
The product bottom stripper(Kerosene)=
Input stripper (Ker) + column steam water – amount reflux steam and kerosene
= 2164250𝐾𝑔
𝑑𝑎𝑦+ 3112.064314
𝐾𝑔𝑠𝑡𝑒𝑎𝑚
𝑑𝑎𝑦− 89682.06431
𝐾𝑔
𝑑𝑎𝑦= 2077680
𝐾𝑔
𝑑𝑎𝑦

67
Figure3.4 Material balance stripper (kerosene)
Out put In put
2167362.06431 2167362.06431
3.7. Material -Balance about the Stripper of Diesel (diel).
The Percent reflux in top tower is constant (2%)
The input amount to diesel stripper tower (die) and steam
=𝑚𝑎𝑠𝑠 𝑜𝑓 𝑑𝑖𝑒𝑠𝑒𝑙 𝑡𝑜𝑡𝑎𝑙
𝑡𝑜𝑡𝑎𝑙 𝑝𝑒𝑟𝑐𝑒𝑛𝑡% − 𝑝𝑒𝑟𝑐𝑒𝑛𝑡 𝑟𝑒𝑓𝑙𝑢𝑥 × 100
= 4533120
𝑘𝑔𝑑𝑎𝑦
100 − 2 × 100 = 4625632.653
𝑘𝑔
𝑑𝑎𝑦
The Percent of reflux at the top of column (die) and steam =
Input to stripper (diesel) and steam – input without reflux
= 4625632.653𝑘𝑔
𝑑𝑎𝑦− 4533120
𝑘𝑔
𝑑𝑎𝑦= 92512.65306
𝑘𝑔
𝑑𝑎𝑦

68
𝑇ℎ𝑒 𝑎𝑚𝑜𝑢𝑛𝑡 𝑏𝑦 𝑔𝑎𝑙𝑙𝑜𝑛 𝑢𝑛𝑖𝑡 (𝑔𝑎𝑙) = 92512.65306𝑘𝑔
𝑑𝑎𝑦 ×
1𝑙𝑖𝑡𝑒𝑟
1𝑘𝑔 ×
1𝑔𝑎𝑙
3.785412𝑙𝑖𝑡𝑒𝑟
= 24439.25603𝑔𝑎𝑙
𝑑𝑎𝑦
The amount steam injected to stripper will be stander for diesel:
𝑎𝑚𝑜𝑢𝑛𝑡 𝑠𝑡𝑒𝑎𝑚 = 0.02265𝑘𝑔
𝑔𝑎𝑙So
amount steam water = percent reflux (diesel) × amount steam
24439.25603𝑔𝑎𝑙
𝑑𝑎𝑦 × 0.02265
𝑘𝑔
𝑔𝑎𝑙= 553.5491492
𝑘𝑔𝑠𝑡𝑒𝑎𝑚
𝑑𝑎𝑦
total reflux Amount from steam and diesel = amount steam water + reflux top
= 553.5491492 + 92512.65306 = 93066.20221𝑘𝑔
𝑑𝑎𝑦
The product bottom column diesel=
Input stripper (diesel) + amount steam water – amount reflux Steam and (diesel)
= 4625632.653 + 553.5491492 − 93066.20221 = 4533120𝑘𝑔
𝑑𝑎𝑦
Figure 3.5 Material balance strippers (diesel)
In put Out put
4626186.2021492 4626186.20221

69
The simulation for these calculations are done by MATLAB available in the appendix
Figure (3.6) Diagram shows the unity of the oil refining and production ratio passes in each
unit

70
CHAPTER FOUR

71
ENERGY BALANCE
When the mass transfer balance derived by applying the law of conservation of mass,
which states that the total generation of mass is 0, also there is one more major conservation
law which provides an additional equation which is the conservation of energy.
4.1. TYPES OF ENERGY`
In order to write an energy balance, we need to know what kinds of energy can
enter or leave a system. Here are some examples (this is not an exhaustive list by any
means) of the types of energy that can be gained or lost.
1. A system could gain or lose kinetic energy, if we're analyzing a moving system.
2. Again, if the system is moving, there could be potential energy changes.
3. Heat could enter the system via conduction, convection, or radiation.
4. Work (either expansion work or shaft work) could be done on, or by, the system.
The total amount of energy entering the system is the sum of all of the different
types entering the system. (8)
4.2. CALCULATION OF ENERGY BALANCE FOR THE HEAT EXCHANGERS

72
The energy balance for all units which use 8 heat exchangers
Table (4-1) initial and final temperature for oil products and their specific heat
Unit Inlet temperature℃ Outlet temperature ℃ specific heat
𝐾𝐽/𝐾𝑔℃
Crude Oil 26.67 - 2.55
Heavy naphtha 141.67 82.22 2.007
Kerosene 180.56 40 2.14
Cold Diesel A ,B 171.11 81.11 2.30
Heavy naphtha
pumproulid A ,B
175.56 97.78 2.007
Cold Residue A,B 254.44 161.11 2.39
Hot Diesel 252.22 182.22 2.30
Diesel pumproulid A
,B
270.56 195.56 2.30
Hot Residue 356.11 254.44 2.39
1-Heavy Naphtha heat exchanger
The temperature of crude oil equal 26.67℃
The temperature of heavy naphtha that inlet to the heat exchanger = 141.67℃
The temperature of heavy naphtha that outlet from the heat exchanger = 82.22℃
And by using the total energy equation Q = mc∆T
Where:

73
m: the mass of product
c: specific heat for product
∆T: temperature difference
(mH.N*cpH.N*∆TH.N) = (moil*cpOil*∆TOil)
(5701476*2.007*(141.67-82.22))= (29733489.6*2.55*∆T)
∆T = 680278165.6 / 75820398.48
∆T=8.97℃
TOil out =TOil int+8.97
TOil out =35.64℃
2- Kerosene heat exchanger
The temperature of kerosene that inlet to the heat exchanger =180.56℃
The temperature of kerosene that outlet from the heat exchanger = 40℃
The temperature of crude oil which inlet to the second heat exchanger = 35.64℃
(mke*cpke*∆T)=(mOil*cpoil*∆T)
(2077680*2.14*(180.56-40))-(29733489.6*2.55*∆T)
∆T= 624962819.7 / 75820398.48
∆T=8.243℃
TOil out =TOil int+8.243
=35.64+8.243
TOil out =43.88℃
3-1 cold diesel (A) heat exchanger
The temperature of cold diesel that inlet to the heat exchanger = 171.11℃
The temperature of cold diesel that outlet from the heat exchanger =81.11℃
The temperature of crude oil inlet to the heat exchanger = 43.88℃

74
(mco Die*cpco Die *∆T) = (mOil *cpOil *∆TOil)
(4533120*2.30*(171.11-81.11)) = (29733489.6*2.55*∆T)
∆T = 938355840 / 75820398.48
∆𝑇 = 12.38℃
TOil out =TOil in +12.38
=43.88 +12.38
TOil out=56.26℃
3-2 cold diesel (B) heat exchanger
QDie =mOil*cpoil*∆𝑇
=29733489.6*2.55*∆T
∆T = 12.38℃
TOil out =Toil in+12.38
=56.26+12.38
TOil out=68.64℃
4-1 Heavy Naphtha pumproulid (A) heat exchanger
The temperature of Heavy Naphtha inlet to the heat exchanger = 175.56℃
The temperature of Heavy Naphtha outlet from the heat exchanger = 97.78℃
The temperature of crude oil inlet to the heat exchanger = 68.64℃
mH.N*cpH.N*∆𝑇= mOil*cpOil*∆𝑇
5701476*2.007*(175.56-97.78)=29733489.6*2.55*∆𝑇
∆T = 890025832.2 / 75820398.48
∆𝑇 = 11.74
TOil out= Toil in+11.74
TOil out =80.38℃

75
4-2 Heavy Naphtha pumproulid heat (B) exchanger
QH.N=mOil *cpOil*∆𝑇
890025832.2=29733489.6*2.55*∆𝑇
∆𝑇 = 11.74℃
TOil out =80.38+11.74
=92.12℃
5-1 the cold residue (A) heat exchanger
The temperature of cold residue inlet to the heat exchanger = 254.44℃
The temperature of cold residue outlet from the heat exchanger = 161.11℃
The temperature of crude oil inlet to the heat exchanger = 92.12℃
mC.Re*cpC.Re*∆𝑇=mOil *cpOil *∆𝑇
22612713.6*2.39*(254.44-161.11) =29733489.6*2.55*∆𝑇
∆T = 5043962499 / 75820398.48
∆𝑇 = 66.53℃
Toil out =92.12+66.53
=158.65℃
5-2 the cold residue (B) heat exchanger
QC.Re= mOil *cpOil *∆𝑇
5043962499=29733489.6*2.55*∆𝑇
∆𝑇 = 66.53℃
Toil out=158.65+66.53
Toil out=225.18℃
6- Hot Diesel heat exchanger
The temperature of hot diesel inlet to the heat exchanger = 252.22℃

76
The temperature of hot diesel outlet from the heat exchanger = 182.22℃
The temperature of the crude oil inlet to the heat exchanger = 225.18℃
mH.De*cpH.De*∆𝑇=mOil*cpOil*∆𝑇
4533120*2.30*(252.22-182.22 ) =29733489.6*2.55*∆𝑇
∆T = 729832320 / 75820398.48
∆𝑇 = 9.63℃
TOil out =225.18+9.63
TOil out=234.81℃
7-1 Diesel pumparoulid (A) heat exchanger
The temperature of diesel pumparoulid inlet to the heat exchanger = 270.56℃
The temperature of diesel pumparoulid outlet from the heat exchanger = 195.56℃
The temperature of diesel pumparoulid inlet the to heat exchanger = 234.81℃
mDe.P*cpDe.P*∆𝑇=mOil*cpOil*∆𝑇
4533120*2.30*(270.56-195.56)=29733489.6*2.55*∆𝑇
∆T = 781963200 / 75820398.48
∆𝑇 = 10.3℃
TOil out=234.81+10.3
TOil out=245.12℃
7-2 Diesel pumparoulid (B) heat exchanger
QDe.p=mOil*cpOil*∆𝑇
781963200=29733489*2.55*∆𝑇
∆𝑇 = 10.3℃
TOil out=245.12+10.3
TOil out=255.4℃

77
8- Hot Residue heat exchanger
The temperature of hot residue inlet to the heat exchanger = 356.11℃
The temperature of hot residue outlet from the heat exchanger = 54.44℃
The temperature of crude oil inlet to the heat exchanger = 255.4℃
mH.De*cpH.De*∆𝑇=mOil*cpOil*∆𝑇
22612713.6*2.39*(356.11-254.44) = 29733489.6*2.55*∆𝑇
∆T = 5494692674 / 75820398.48
∆𝑇 = 72.47℃
TOil out =255.4+72.47
TOil out =327.79℃ this is the final temperature of crude oil
Figure(4.1)shows increase temperature crude oil inside heat exchanger
Line Product
Oil
Heavy naphtha
Kerosene

78
Diesel
Radium
Table (4-2) temperature crude oil in each unit
Heat Exchanger temperature of out oil (KJ)
E1
E2
E3A
E3B
E4A
E4B
E5A
E5B
E6
E7A
E7B
E8
35.64
43.88
56.26
68.64
80.38
92.12
158.65
225.18
234.81
245.12
255.4
327.79
Table (4-3) the overall energy balance
Qin Qout
680278165.6
624962819.7
938355840
890025832.2
5043962499
72983232
78196320
5494692674
680108974.4
624760083.5
938656533.2
890131478.2
5044331111
729771335.4
781935769.5
5494628457
1.382*1010
1.382*1010
Q in = Q out
1.382*1010
= 1.382*1010
Qin Q out
Crude unit

79

80
CHAPTER FIVE
DESIGN OF SHELL&TUBE HEAT EXCHANGER
A shell and tube heat exchanger is a class of heat exchanger designs.[1][2]
It is
the most common type of heat exchanger in oil refineries and other large chemical
processes, and is suited for higher-pressure applications. As its name implies, this
type of heat exchanger consists of a shell (a large pressure vessel) with a bundle of
tubes inside it. One fluid runs through the tubes, and another fluid flows over the
tubes (through the shell) to transfer heat between the two fluids. The set of tubes is
called a tube bundle, and may be composed of several types of tubes: plain,
longitudinally finned, etc. (9)
5.1. SHELL AND TUBE HEAT EXCHANGER DESIGN
There can be many variations on the shell and tube design. Typically, the ends
of each tube are connected to plenums (sometimes called water boxes) through holes
in tubesheets. The tubes may be straight or bent in the shape of a U, called U-tubes.
Fig (5-1) U-tube heat exchanger
In nuclear power plants called pressurized water reactors, large heat exchangers
called steam generators are two-phase, shell-and-tube heat exchangers which typically

81
have U-tubes. They are used to boil water recycled from a surface condenser into
steam to drive a turbine to produce power. Most shell-and-tube heat exchangers are
either 1, 2, or 4 pass designs on the tube side. This refers to the number of times the
fluid in the tubes passes through the fluid in the shell. In a single pass heat exchanger,
the fluid goes in one end of each tube and out the other. (10)
Fig (5-2) Straight tube heat exchanger (one pass tube)
Surface condensers in power plants are often 1-pass straight-tube heat exchangers
(see surface condenser for diagram). Two and four pass designs are common because
the fluid can enter and exit on the same side. This makes construction much simpler.
Fig (5-3) Straight tube heat exchanger (two pass tube)
There are often baffles directing flow through the shell side so the fluid does
not take a short cut through the shell side leaving ineffective low flow volumes. These

82
are generally attached to the tube bundle rather than the shell in order that the bundle
is still removable for maintenance.
Counter current heat exchangers are most efficient because they allow the highest log
mean temperature difference between the hot and cold streams. Many companies
however do not use two pass heat exchangers with a u-tube because they can break
easily in addition to being more expensive to build. Often multiple heat exchangers
can be used to simulate the counter current flow of a single large exchanger. (9)
5.1.1. Selection of tube material
To be able to transfer heat well, the tube material should have good thermal
conductivity. Because heat is transferred from a hot to a cold side through the tubes,
there is a temperature difference through the width of the tubes. Because of the
tendency of the tube material to thermally expand differently at various
temperatures, thermal stresses occur during operation. This is in addition to
any stress from high pressures from the fluids themselves. The tube material also
should be compatible with both the shell and tube side fluids for long periods under
the operating conditions (temperatures, pressures, pH, etc.) to minimize deterioration
such as corrosion. All of these requirements call for careful selection of strong,
thermally-conductive, corrosion-resistant, high quality tube materials,
typically metals, including aluminum, copper alloy, stainless steel, carbon steel, non-
ferrous copper alloy, Inconel, nickel, Hastelloy and titanium] Fluoropolymerssuch
as Perfluoroalkoxy alkane (PFA) and Fluorinated ethylene propylene (FEP) are also
used to produce the tubing material due to their high resistance to extreme
temperatures.[4]
Poor choice of tube material could result in a leak through a tube
between the shell and tube sides causing fluid cross-contamination and possibly loss
of pressure. (9)
5.1.2. Applications and uses
The simple design of a shell and tube heat exchanger makes it an ideal cooling
solution for a wide variety of applications. One of the most common applications is
the cooling of hydraulic fluid and oil in engines, transmissions and hydraulic power
packs. With the right choice of materials they can also be used to cool or heat other

83
mediums, such as swimming pool water or charge air. One of the big advantages of
using a shell and tube heat exchanger is that they are often easy to service, particularly
with models where a floating tube bundle (where the tube plates are not welded to the
outer shell) is available. (9)
5.2. SHELL AND TUBE EXCHANGERS: CONSTRUCTION
DETAILS
The principal types of shell and tube exchanger are shown in Figures to
The standard nomenclature used for shell and tube exchanger is given below:
1. Shell 15. Floating-head support
2. Shell cover 16. Weir
3. Floating-head cover 17. Split ring
4. Floating-tube plate 18. Tube
5. Clamp ring 19. Tube bundle
6. Fixed-tube sheet (tube plate) 20. Pass partition
7. Channel (end-box or header) 21. Floating-head gland (packed gland)
8. Channel cover 22. Floating-head gland ring
9. Branch (nozzle) 23. Vent connection
10. Tie rod and spacer 24. Drain connection
11. Cross baffle or tube-support plate 25. Test connection
12. Impingement baffles 26. Expansion bellows
13. Longitudinal baffle 27. Lifting ring
14. Support bracket
Fig (5-4) U-tube heat exchanger constructions

84
5.3. STEPS FOR DESIGN OF HEAT EXCHANGER:
Design a shell-and-tube exchanger for the following data:
2077680kg/day =86570kg/h of kerosene (42°API) leaves the base of a kerosene side-
stripping column at 180.56℃ and is to be cooled to 40℃ by exchange with
37723113.6kg/day=1571796.4kg/h light crude oil (34°API) coming from storage at
33.74℃. The kerosene enters the exchanger at a pressure of 5 bar and the crude oil at
6.5 bar. A pressure drop of 0.8 bar is permissible on both streams. Allowance should
be made for fouling by including a fouling factor of 0.0003 (𝑊/𝑚2℃)−1on the crude
stream and 0.0002 (𝑊/𝑚2℃)−1on the kerosene stream.
An algorithm for the design of shell-and tube exchangers is shown in Figure 4.2 the
procedure set out in this figure will be followed in the design.
Fig(5-5) Design procedures for shell-and-tube heat exchangers
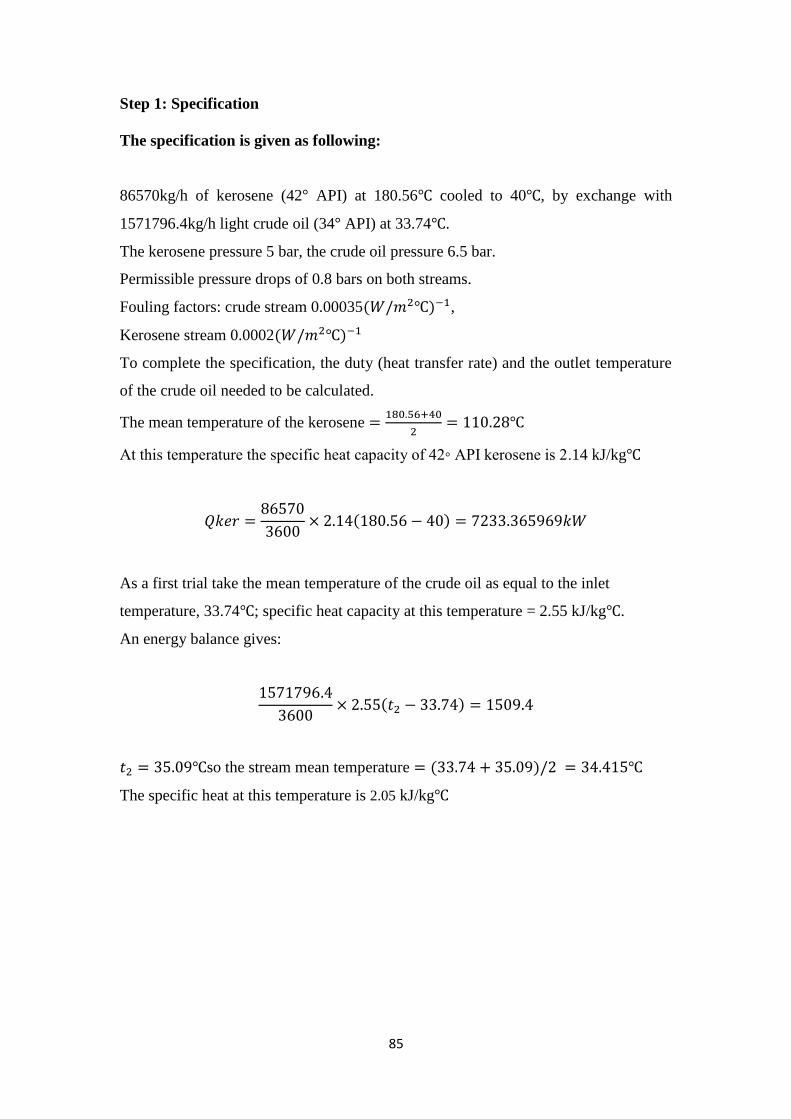
85
Step 1: Specification
The specification is given as following:
86570kg/h of kerosene (42° API) at 180.56℃ cooled to 40℃, by exchange with
1571796.4kg/h light crude oil (34° API) at 33.74℃.
The kerosene pressure 5 bar, the crude oil pressure 6.5 bar.
Permissible pressure drops of 0.8 bars on both streams.
Fouling factors: crude stream 0.00035(𝑊/𝑚2℃)−1,
Kerosene stream 0.0002(𝑊/𝑚2℃)−1
To complete the specification, the duty (heat transfer rate) and the outlet temperature
of the crude oil needed to be calculated.
The mean temperature of the kerosene =180.56+40
2= 110.28℃
At this temperature the specific heat capacity of 42◦ API kerosene is 2.14 kJ/kg℃
𝑄𝑘𝑒𝑟 =86570
3600× 2.14(180.56 − 40) = 7233.365969𝑘𝑊
As a first trial take the mean temperature of the crude oil as equal to the inlet
temperature, 33.74℃; specific heat capacity at this temperature = 2.55 kJ/kg℃.
An energy balance gives:
1571796.4
3600× 2.55(𝑡2 − 33.74) = 1509.4
𝑡2 = 35.09℃so the stream mean temperature = (33.74 + 35.09)/2 = 34.415℃
The specific heat at this temperature is 2.05 kJ/kg℃

86
Step 2: Physical Properties:
Tab (5-1) shows Physical Properties for oil and kerosene.
Kerosene Inlet Mean Outlet
Temperature 180.56 110.28 40 ℃
specific heat 2.72 2.47 2.26 kJ/kg℃
Thermal conductivity 0.130 0.132 0.135 W/m℃
Density 690 730 770 kg/m3
Viscosity 0.22 0.43 0.80 mN sm−2
Crude oil Outlet Mean inlet
Temperature 37.179 35.45 33.74 ℃
specific heat 2.09 2.05 2.01 kJ/kg℃
Thermal conductivity 0.133 0.134 0.135 W/m℃
Density 800 820 840 kg/m3
Viscosity 2.4 3.2 4.3 mN sm−2

87
Step 3: Overall coefficient
For an exchange of this type the overall coefficient will be in the range
300 to 500𝑊/𝑚2 ℃, between heavy oils and steams; so start with 300
𝑊/𝑚2 ℃
Step 4: Exchanger type and dimensions
An even number of tube passes is usually the preferred arrangement, as these
positions the inlet and outlet nozzles at the same end of the exchanger, which
simplifies the pipework.
Start with one shell pass and 2 tube passes.
∆𝑇𝑙𝑚 =(180.56 − 35.09) − (40 − 33.74)
ln(180.56 − 35.09)
(40 − 33.74)
= 44.253℃
𝑅 =(𝑇1 − 𝑇2)
(𝑡2 − 𝑡1)
𝑅 =(180.56 − 40)
(35.09 − 33.74)= 104.11
𝑆 =(35.09 − 33.74)
(180.56 − 33.74)= 0.0096

88
Fig (5-6) temperature correction factors
From Figure 4.3 temperature correction factor one shell pass two or more even tube
passes𝐹𝑡 = 0.75, which is acceptable.
So, ∆𝑇𝑚 = 0.75 × 44.253 = 33.18975℃
Step 5: Heat transfer area
𝐴𝑜 =1509.4 × 103
300 × 33.18975= 151.593 𝑚2
Step 6: Layout and tube size
Using a split-ring floating head exchanger for efficiency and ease of cleaning
Neither fluid is corrosive, noris the operating pressure not high, so plain carbon steel
can be used for the shell and tubes.
The crude is dirtier than the kerosene, so put the crude through the tubes and the
kerosene in the shell.
Use 19.05 mm (3/4 inch) outside diameter, 14.83 mm inside diameter, 5 m Long tubes
on a triangular 23.81 mm pitch.

89
Step 7: Number of tubes
Area of one tube (neglecting thickness of tube sheets)
= 𝜋 × 19.05 × 10−3 × 5 = 0.2992 𝑚2
Number of tubes = A heat transfer / A one tube =151.593 /0.2992 = 506.66
So, for 2 passes, tubes per pass = 325 tubes
Check the tube-side velocity at this stage to see if it looks reasonable.
Tube cross-sectional area =𝜋
4(14.83 × 10⁻³)2 = 0.0001727 𝑚2
So area per pass = 325 × 0.0001727 = 0.05612 𝑚2
Volumetric flow =1571796.4
3600×
1
820= 0.5325 𝑚3/𝑠
Tube-side velocity, ut =Qoil
A tube one pass =
0.5325
0.05612= 9.4877 m/s
The velocity is satisfactory, between 3 to 5m/s, but may be a little low. This will show
up when the pressure drop is calculated.
Step 8: Bundle and shell diameter
Table (5-2) Constant for use in equation tube arrangement

90
Equivalent diameter, cross-sectional areas and wetted perimeters
From Table 5.2, for 2 tube passes,K1 = 0.249, n1 = 2.207
So, 𝐷𝑏 = 19.05 (506.66
0.249)
1
2.207= 601.17 𝑚𝑚 (0.601 𝑚)
Fig (5-7) Shell-bundle clearances

91
For a split-ring floating head exchanger the typical shell clearance from Figure (4-4)
is 63 mm, so the shell inside diameter,
𝐷𝑠 = 601.17 + 63 = 664.17𝑚𝑚
Step 9: Tube-side heat transfer coefficient
𝑅𝑒 =
= 820×9.4877×14.83×10−3
3.2×10−3 = 0.03605 (0.03605 /1000=3605)
𝑃𝑟 = = 2.05 × 103 × 3.2 × 10−3
0.134= 48.96
𝐿
𝑑𝑖=
5000
14.83= 337
From Figure (4-5), so reading is 𝑗ℎ = 3.2 × 10⁻³
Fig (5.8) Tube-side heat-transfer factor

92
𝑁𝑢 = 3.2 × 10⁻³(0.03605)(48.96)0.33 = 0.0004166(0.4166)
ℎ𝑖 = 0.4166 × (0.134
14.83 × 10⁻³) = 3.76(376) 𝑊/𝑚2 ℃
This is clearly too low if U◦ is to be 300 W/m2℃. The tube-side velocity did look
low, so increase the number of tube passes to 4. This will halve the cross-sectional
area in each pass and double the velocity.
New
𝑢𝑡 = 2 × 9.4877 = 18.9754 𝑚/𝑠
And
𝑅𝑒 = 2 × 0.03605 = 0.0721
𝑗ℎ = 3.2 × 10⁻³
ℎ𝑖 = (0.134
14.83 × 10−3) × 3.8 × 10−3(0.0721)(48.96)0.33 = 8939 𝑊/𝑚2 ℃
Step 10: Shell-side heat transfer coefficient
Kern’s method will be used.
With 4 tube passes the shell diameter will be larger than that calculated for 2 passes.
For 4 passes K1 =0.175 and n1 =2.285
𝐷𝑏 = 19.05 (506.66
0.175)
1
2.285= 623.5𝑚𝑚 (0.623 𝑚)
The bundle to shell clearance is still around 56 mm, giving:
𝐷𝑠 = 623.5 + 56 = 679.5 𝑚𝑚

93
As a first trial take the baffle spacing = 𝐷𝑠/5, say 150 mm. This spacing should give
good heat transfer without too high a pressure drop.
𝐴𝑠 =(23.81 − 19.05)
23.81× 679 × 135.8 = 18433.89 𝑚𝑚2 = 0.01843𝑚2
𝑑𝑒 =1.10
19.05(23.812 − 0.917 × 19.052) = 13.52 𝑚𝑚
Volumetric flow-rate on shell-side =86570
3600×
1
730= 0.0329
𝑚3
𝑠
Shell-side velocity = q/𝐴𝑠 =0.0329
0.01843= 1.785 𝑚/𝑠
𝑅𝑒 =730 × 1.620 × 13.52 × 10−3
0.43 × 10−3= 37183.14(3.718 × 10⁴)
𝑃𝑟 =2.14 × 103 × 0.43 × 10−3
0.132= 6.97
Use segmental baffles with a 25% cut. This should give a reasonable heat transfer
coefficient without too large a pressure drop.
From Figure(4-5) , 𝑗ℎ = 4.52 × 10⁻³.
Neglecting the viscosity correction:
ℎ𝑠 = (0.132
13.52× 103) × 4.52 × 10−3 × 37183.14 × 6.970.33 = 3114 𝑊/𝑚2 ℃

94
Step 11: Overall coefficient
The overall coefficient calculation from this relation:
1
𝑈𝑜= (
1
8939+ 0.00035)
19.05
14.83+
19.05 × 10⁻³ ln (19.0514.83)
2 × 55+
1
3266+ 0.0002
𝑈𝑜 = 863.93 𝑊/𝑚2 ℃
This is above the initial estimate of 300 𝑊/𝑚2 ℃. The number of tubes could
possibly be reduced, but first check the pressure drops.
Step 12: Pressure drop Tube-side
651 tubes, 4 passes, tube inside diameter 14.83 mm,𝑢𝑡 = 9.487 m/s,
𝑅𝑒 = 7.2 × 10³. From Figure (5.9),so reading 𝑗𝑓 = 5 × 10⁻³.
Fig (5-9) Tube-side friction factors

95
∆𝑃𝑡 = 4 (8 × 5 × 10−3 (5000
14.83) + 2.5)
(820 × 9.4872)
2
= 4(13.5 + 2.5)(820 × 902)
2
= 23596 𝑁/𝑚2 ,2.3 𝑏𝑎𝑟
5.4. MODIFIED DESIGN
The tube velocity needs to be reduced. This will reduce the heat transfer
coefficient, so the number of tubes must be increased to compensate. There will be a
pressure drop across the inlet and outlet nozzles. Allow 0.1 bars for this, a typical
figure (about 15% of the total); which leaves 0.7 bars across the tubes. Pressure drop
is roughly proportional to the square of the velocity and 𝑢𝑡 is proportional to the
number of tubes per pass. So the pressure drop calculated for 240 tubes can be used to
estimate the number of tubes required.
Tubes needed = 240/(0.6/1.4)0.5 = 366
Say, 360 with 4 passes.
Retain 4 passes as the heat transfer coefficient will be too low with 2 passes.
Second trial design: 360 tubes 19.05 mm out diameter, 14.83 mm inside diameter, 5 m
long, triangular pitch 23.81 mm.
Db = 19.05 (360
0.175)
12.207
= 604 mm (0.604 m)

96
From Figure (4-4) clearance with this bundle diameter D 59 mm
𝐷𝑠 = 604 + 59 = 663 𝑚𝑚
Cross-sectional area per pass =360
4(14.83 × 10⁻³)2 𝜋
4= 0.01555 𝑚2
Tube velocity 𝑢𝑡 =𝑞
𝐴=
0.0237
0.01555= 1.524
𝑚
𝑠
𝑅𝑒 =820 × 1.524 × 14.83 × 10−3
3.2 × 10−3= 5792
L/d is the same as the first trial, 337
𝑗ℎ = 3.6 × 10⁻³
ℎ𝑖 = (0.134
14.83× 103) × 3.6 × 10−3(5792)(48.96)0.33 = 680 𝑊/𝑚2 ℃
This looks satisfactory, but checks the pressure drop before doing the shell-side
calculation.
𝑗𝑓 = 5.5 × 10⁻³
∆𝑃𝑡 = 4 (8 × 5.5 × 10−3 (5000
14.83) + 2.5)
(820 × 1.5242)
2
= 66,029 𝑁/𝑚2 , 0.66 𝑏𝑎𝑟
Well within specification.
Keep the same baffle cut and spacing.
𝐴𝑠 =(23.81 − 19.05)
23.81× 663 × 100 = 13254 𝑚𝑚2 = 0.01325 𝑚2
𝑢𝑠 =0.0076
0.01325 = 0.574 𝑚/𝑠
𝑑𝑒 = 13.52 𝑚𝑚, 𝑎𝑠 𝑏𝑒𝑓𝑜𝑟𝑒
𝑅𝑒 =730 × 0.574 × 13.52 × 10−3
0.43 × 10−3= 13175 , (1.3 × 10⁴)
𝑃𝑟 = 8.05

97
𝑗ℎ = 4.8 × 10⁻³ , 𝑗𝑓 = 4.6 × 10⁻³
ℎ𝑠 = (0.132
13.52 × 10−3) × 4.8 × 10−3 × 13175 × (6.97)0.33 = 1172 𝑊/𝑚2 ℃
∆𝑃𝑠 = 8 × 4.6 × 10−3 (663
13.52) (
5000
14.83)
(730 × 0.5742)
2
= 73169.5 𝑁/𝑚2 , 1.2 𝑏𝑎𝑟
Too high; the specification only allowed 0.8 overall, including the loss over the
nozzles.
Check the overall coefficient to see if there is room to modify the shell-side design.
1
𝑈𝑜= (
1
683+ 0.00035)
19.05
14.83+
19.05 × 10⁻³ ln (19.0514.88)
2 × 55+
1
1172+ 0.0002
𝑈𝑜 = 291.79 𝑊/𝑚2 ℃
𝑈𝑜 𝑟𝑒𝑞𝑢𝑖𝑟𝑒𝑑 =𝑄
(𝐴𝑜∆𝑇𝑙𝑚), 𝐴𝑜 = 360 × 0.2992 = 107.7 𝑚2,
𝑠𝑜 𝑈𝑜 𝑟𝑒𝑞𝑢𝑖𝑟𝑒𝑑 =1509.4 × 103
(107.7 × 44.253)= 316 𝑊/𝑚2 ℃
The estimated overall coefficient is well above that required for design, 302 compared
to 192𝑊/𝑚2 ℃, which gives scope for reducing the shell-side pressure drop.
Allow a drop of 0.1 bars for the shell inlet and outlet nozzles, leaving 0.7 bar for the
shell-side flow. So, to keep within the specification, the shell-side velocity will have
to be reduced by around√(1/2) = 0.707. To achieve this baffle spacing will need to
be increased to 100/0.707 = 141, say 140 mm.
As =(23.81 − 19.05)
23.81× 663 × 140 = 1855 mm2 = 0.186 m2
us =0.0076
0.186 = 0.408 m/s

98
Giving: 𝑅𝑒 = 10,443, ℎ𝑠 = 1177 𝑊/𝑚2 ℃, ∆𝑃𝑠 = 0.47 𝑏𝑎𝑟,and 𝑈𝑜 =
288 𝑊/𝑚2 ℃.
The pressure drop is now well within the specification.
Step 13: Estimate cost
The cost of this design can be estimated on the value of parts to construct it.
Step 14: Optimization
There is scope for optimizing the design by reducing the number of tubes, as the
pressure drops are well within specification and the overall coefficient is well above
that needed.
However, the method used for estimating the coefficient and pressure drop on the
shell-side (Kern’s method) is not accurate, so keeping to this design will give some
margin of safety.
Summary: the proposed design
Split ring, floating head, 1 shell pass, and 4 tube passes.
360 carbon steel tubes, 5 m long, 19.05 mm out diameter, 14.83 mm inside diameter,
triangular pitch,
Pitch 23.18 mm.
Heat transfer area 107.7 𝑚2 (based on outside diameter).
Shell inside diameter 597 mm (600 mm), baffle spacing 140 mm, 25% cut.
Tube-side coefficient 680𝑊/𝑚2 ℃, clean
Shell-side coefficient 1366𝑊/𝑚2 ℃,, clean.
Overall coefficient, estimated 288𝑊/𝑚2 ℃, dirty.
Overall coefficient required 197𝑊/𝑚2 ℃, dirty.
Dirt/Fouling factors:
Tube-side (crude oil) 0.00035 (𝑊/𝑚2 ℃)−1.
Shell-side (kerosene) 0.0002 (𝑊/𝑚2 ℃)−1.
Pressure drops:

99
Tube-side, estimated 0.40 bar, +0.1 for nozzles; specified 0.8 bar overall.
Shell-side, estimated 0.45 bar, +0.1 for nozzles; specified 0.8 bar overall.
5.5. OPTIMIZATION USING A CAD PROGRAM
The use of a proprietary computer program (HTFS, M-TASC) to find the
lowest cost design that meets the specification resulted in the design set out below.
The program selected longer tubes, to minimize the cost. This has resulted in an
exchanger with a shell length to diameter ratio of greater than 10: 1. This could cause
problems in supporting the shell, and in withdrawing the tube bundle for maintenance.
The CAD program was rerun with the tube length restricted to 3500 mm, to produce a
more compact design. This gave a design with 349 tubes, 4 passes, in a shell 540 mm
diameter. The setting plan for this design is shown in Figure.
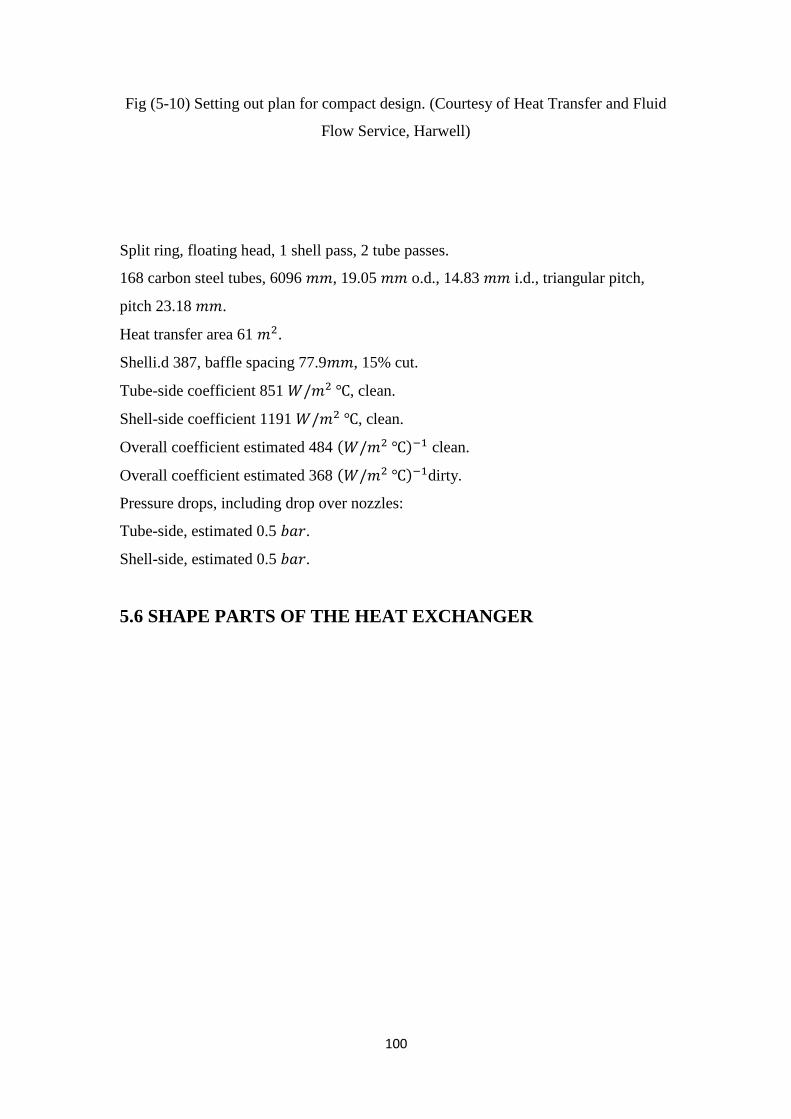
100
Fig (5-10) Setting out plan for compact design. (Courtesy of Heat Transfer and Fluid
Flow Service, Harwell)
Split ring, floating head, 1 shell pass, 2 tube passes.
168 carbon steel tubes, 6096 𝑚𝑚, 19.05 𝑚𝑚 o.d., 14.83 𝑚𝑚 i.d., triangular pitch,
pitch 23.18 𝑚𝑚.
Heat transfer area 61 𝑚2.
Shelli.d 387, baffle spacing 77.9𝑚𝑚, 15% cut.
Tube-side coefficient 851 𝑊/𝑚2 ℃, clean.
Shell-side coefficient 1191 𝑊/𝑚2 ℃, clean.
Overall coefficient estimated 484 (𝑊/𝑚2 ℃)−1 clean.
Overall coefficient estimated 368 (𝑊/𝑚2 ℃)−1dirty.
Pressure drops, including drop over nozzles:
Tube-side, estimated 0.5 𝑏𝑎𝑟.
Shell-side, estimated 0.5 𝑏𝑎𝑟.
5.6 SHAPE PARTS OF THE HEAT EXCHANGER

101
Fig (5-11) the tube arrangement
Fig (5-10) The tube geometry

102
Fig (5-11) Types of baffle used in shell and tube heat exchangers. (a) Segmental (b)
Segmental and strip (c) Disc and doughnut (d) Orifice

103
Fig (5-12) Clearance and flow areas in the shell-side of a shell and tube exchanger

104

105
CHAPTER SIX
ECONOMIC STUDY
6.1. FEASIBILITY STUDY
A feasibility study is an analysis of how successfully a project can be completed,
accounting for factors that affect it such as economic, technological, legal and scheduling
factors. Project managers use feasibility studies to determine potential positive and negative
outcomes of a project before investing a considerable amount of time and money into it. A
feasibility study aims to objectively and rationally uncover the strengths and weaknesses of
an existing business or proposed venture, opportunities and threats present in
the environment, the resources required to carry through, and ultimately the prospects for
success. In its simplest terms, the two criteria to judge feasibility are cost required
and value to be attained. A well-designed feasibility study should provide a historical
background of the business or project, a description of the product or service, accounting
statements, details of the operations and management, marketing research and policies,
financial data, legal requirements and tax obligations. Generally, feasibility studies precede
technical development and project implementation. A feasibility study evaluates the
project's potential for success; therefore, perceived objectivity is an important factor in the
credibility of the study for potential investors and lending institutions. It must therefore be
conducted with an objective, unbiased approach to provide information upon which
decisions can be based. A feasibility study tests the viability of an idea, a project or even a
new business. The goal of a feasibility study is to place emphasis on potential problems that
could occur if a project is pursued and determine if, after all significant factors are
considered, the project should be pursued. Feasibility studies also allow a business to
address where and how it will operate, potential obstacles, competition and the funding
needed to get the business up and running.(11)

106
6.2. PLANT COST
It is often necessary to estimate the cost of a piece of plant when no cost data are
available for the particular size of operational capacity involved. Good results can be
obtained by using the logarithmic relationship known as the six-tenths-factor rule, if the new
piece of plant is similar to one of another capacity for which cost data are available.
According to this rule, if the cost of a given unit at one capacity is known, the cost of a
similar unit with X times the capacity of the first is approximately (X) m times the cost of the
initial unit.(12)
m
Cost of plant B = cost of plant A (capac.of plant B capac.of plant A
)
m= 𝑐𝑢𝑟𝑟𝑒𝑛𝑡 𝑦𝑒𝑎𝑟−𝑜𝑟𝑖𝑔𝑖𝑛𝑎𝑙 𝑦𝑒𝑎𝑟
100
In this project there a comparison the prices of the sarrir refinery that have capacity
of 20.000 barrel per day with a plant have capacity 200.000 barrel per day, which recover
the order of gasoline stations in tobruck city, The cost of plant B must be converting from
the original year (1989) to present year (2018) depending on the cost index to obtain the
fixed cost. And the cost of plant A= 1.3*108$, m= 0.27
0.27
Cost of plant B = 1.3*108 (200.000
20.000 ) = 2.4* 10 8 $
6.3. COST INDEX
Most cost data which are available for immediate use in a preliminary or predesign
estimate are based on conditions at some time in the past. Because prices may change
considerably with time due to changes in economic conditions, some method must be used
for updating cost data applicable at a past date to costs that are representative of conditions

107
at a later time; this can be done by the use of cost indexes. A cost index is merely an index
value for a given point in time showing the cost at that time relative to a certain base time. If
the cost at some time in the past is known, the equivalent cost at the present time can be
determined by multiplying the original cost by the ratio of the present index value to the
index value applicable when the original cost was obtained.Cost indexes can be used to give
a general estimate, but no index can take into account all factors, such as special
technological advancements or local conditions. The common indexes permit fairly accurate
estimates if the time period involved is less than 10 years.
present cost = original cost ∗(index value at present time)
(index value at time original cost was obtained)
Cost index at present time (2018) = (1090)
Cost index at original time (1989) = (800)
Present cost (2016) = 2.4*10 8 *
(1090)
(800)
Fixed cost = Present cost = 3.27*10 8 $
Assume the variable cost equal 60% of fixed cost
Variable cost = 0.6 * fixed cost = 1.9*10 8
$
Total cost = fixed cost +Variable cost = 5.03*10 8$

108
6.4. THE COST OF PRODUCTS AND RAW MATERIAL
The next table shows the price of the products and the flow rate for each product by
cubic meter per day, data taken from mass balance and the price for the year 2018, assume
the products prices equal 50$/m3
Table (6-2) the flow rate of products and their prices.(13)
Products
Price $/m3
m3/Day
LPG 50 528.864
Light naphtha 50 5704.176
Heavy naphtha 50 2266.56
Kerosene 50 2077.68
Diesel 50 4533.12
Residue 50
22612.7136
The cost of the products = (the flow rate for the product1* its price + product2 *its price ….)
Assume the working house for the units is 7200 hr/year, which equal 300 day/year
The cost of the products/ day = [(528.864*50) + (5704.176*50) + (2266.56*50) +
(2077.68*50) + (4533.12*50) + (22612.7136*50)]*300
= 5.65*108 $/year
The next table shows the flow rate for raw materials and their
Cost, assume the price of the raw material equal 10$/m3

109
Table (6-2) the flow rate of the raw material and their prices.(13)
Raw material
$/m3
Flow rate m3/day
Crude oil
10
37776
The cost of the RWM = (the flow rate for the RWM 1* its price + RWM 2 *its price...)
The cost of RWM /year = [(37776*10)] * 300 = 1.13*108 $/year
6.5. DEPRECIATION
Depreciation is an accounting method of allocating the cost of a tangible asset over
its useful life. Businesses depreciate long-term assets for both tax and accounting purposes.
For tax purposes, businesses can deduct the cost of the tangible assets they purchase as
business expenses; however, businesses must depreciate these assets in accordance with
IRS rules about how and when the deduction may be taken.
Assume 30 years depreciation period and the installation has no salvage value
Depreciation =total cost (C)
life period (n)
Depreciation =5.03 ∗ 108
30= 1.7 ∗ 107 $/𝑦𝑒𝑎𝑟
110
6.6. THE COST OF THE OPERATION
The cost of operation is the business strategy implemented in many companies to gain
a huge market. Cost of operation is the cost acquired in completing one operation. It may be a
conversion of inputs into the outputs or labor costs etc. If the cost of operation is low then it is
easy to maintain cost leadership and gain the market with competitive advantage.
Operating cost = Raw material (RM) + utilities (util) + operation labor + others
RM + DEP = 90% from production cost
Production cost =RM + DEP
0.9
Production cost =1.13 ∗ 108 + 1.7 ∗ 107
0.9= 1.44 ∗ 108 $/𝑦𝑒𝑎𝑟
Util + Labor = 0.1 * production cost
Util + Labor = 0.1 *1.44 ∗ 108 = 1.44 ∗ 107 $/year
Operating cost =1.44 ∗ 108 + 1.44 ∗ 107 = 1.59*108 $/year
6.7. CASH FLOW
Cash flow is the net amount of cash and cash-equivalents moving into and out of a
business. Positive cash flow indicates that a company's liquid assets are increasing, enabling it
to settle debts, reinvest in its business, return money to shareholders, pay expenses and
provide a buffer against future financial challenges. Negative cash flow indicates that a
company's liquid assets are decreasing. Net cash flow is distinguished from net income, which
includes accounts receivable and other items for which payment has not actually been
received. Cash flow is used to assess the quality of a company's income, that is, how liquid it
is, which can indicate whether the company is positioned to remain solvent.

111
Cash Flow Analysis
Cash flows are often transformed into measures that give information e.g. on a
company's value and situation:
To determine a project's rate of return or value. The time of cash flows into and out of
projects are used as inputs in financial models such as internal rate of return and net
present value.
To determine problems with a business's liquidity. Being profitable does not
necessarily mean being liquid. A company can fail because of a shortage of cash even
while profitable.
As an alternative measure of a business's profits when it is believed that accrual
accounting concepts do not represent economic realities. For instance, a company
may be notionally profitable but generating little operational cash (as may be the case
for a company that barters its products rather than selling for cash). In such a case, the
company may be deriving additional operating cash by issuing shares or raising
additional debt finance.
Cash flow can be used to evaluate the 'quality' of income generated by accrual
accounting. When net income is composed of large non-cash items it is considered
low quality.
To evaluate the risks within a financial product, e.g., matching cash requirements,
evaluating default risk, re-investment requirements, etc.
Cash flow = Net profit
Years 1-30 Prices $/year
Income 5.65*108
Operating -1.59*108
Depreciation -1.7*107
The net profit =3.88*108
Cash flow = 3.88*108$/year
6.8. PAY- BACK PERIOD

112
Payback period is the time in which the initial cash outflow of an investment is
expected to be recovered from the cash inflows generated by the investment. It is one of the
simplest investment appraisal techniques.
Formula
The formula to calculate payback period of a project depends on whether the cash
flow per period from the project is even or uneven. In case they are even, the formula to
calculate payback period is:
pay − back period =Total cost
cash flow
pay − back period =5.03 ∗ 108
3.88 ∗ 108= 1.297 𝑦𝑒𝑎𝑟
Advantages of Payback Period are:
1. Payback period is very simple to calculate.
2. It can be a measure of risk inherent in a project. Since cash flows that occur later in a
project's life are considered more uncertain, payback period provides an indication of how
certain the project cash inflows are.
3. For companies facing liquidity problems, it provides a good ranking of projects that
would return money early.
Disadvantages of Payback Period are:
1. Payback period does not take into account the time value of money which is a serious
drawback since it can lead to wrong decisions. A variation of payback method that
attempts to remove this drawback is called discounted method.
2. It does not take into account, the cash flows that occur after the payback period. (11)

113

114
CONCLUSION
1. It is crucial to take into account the importance of having oil refinery producing units
in Libya.
2. A maximizing factor to the oil refinery producing unit of Sarir must be taken into
account to have one in Brega city.
3. The classification of the crude oil is an important factor for the unit design
4. The material balance for this unit was 200,000 barrel of oil per day
5. The overall energy balance for the heat exchangers 1, 2…..8 was 1.382*1010KJ.
6. The cost of Brega refinery was ……..
RECOMMINDATIONS
1. The designing of the heater is recommended for further study.
2. Applying the same study for different crude oils.
3. Adding a chapter for the process control.
115
REFERENCES
(1)-BAAQMD 9-10, “NOx and CO from Boilers, Steam Generators, and Process Heaters in
Petroleum Refineries,” Jan. 5, 1994
(2)-Pierre Trambouze, Petroleum Refinery 4 Materials And Equipment, 2000
(3)-Peach leaf, Jaeger Products, Inc., Houston, Texas, http://www.jaeger.com,2016
(4)-http://www.ogj.com/seb/2016
(5)-Brix Jacobsen -Department Head, Structural and Fluid Mechanics, R&T- book: The
Centrifugal Pump, RESEARCH AND TECHNOLOGY, www.grundfos.com, 2006
(6)-Paresh Girdhar B. Eng. (Mech Eng.), Practical Centrifugal Pumps -Design, Operation and
Maintenance, www.integra-india.com, 2005
(7)-Himmelblau, David M. Basic Principles and Calculations in Chemical Engineering (2nd
ed.). Prentice Hall. (1967).
(8)-Europa http://ec.europa.eu/eurostat/web/energy/data/energy-balances, 2016
Haifa, Oil Refineries Ltd, Israel, [email protected],2016
(9)-Surinder Park ash, Refining Processes Handbook, United States of America,
http://www.gulfpp.com, 2003
(10)-Bytocom , http://www.bytocom.com/vb/t31198.html,2015
(11)-www.investopedia.com/22/10/2016
(12)-Klaus D. Timmerhaus, Professors of Chemical Engineering University of Colorado,
Plant Design And Economics For Chemical Engineers, 1991
(13)-Sarir field, Libya, 2016
(14)-Albadwe, www.unep.org/pcfv/PDF/AlbadweYahaConf.pdf- , 2015
(15)-Aris. A normalization for the Thiele modulus. Ind. Eng. Chem. Fundam., 4:227, 1965.
(16)-David Neil MacKenzie , A Concise Pahlavi Dictionary. Oxford University Press. p. 57.
ISBN 978-1-934768-59-4. (1971).
(17)-David S. J. “Stan” Jones & Peter R. Puja, Handbook of Petroleum Processing, University
of Illinois at Chicago , USA, http:/ /www.springer.com, 2006

116
(18)-James G. Speight, CD&W Inc., The Chemistry and Technology of Petroleum,
Wyoming, http://www.taylorandfrancis.com, 2007
(19)-James H. Gary, Colorado School of Mines & Glenn E. Handwork, Consulting Chemical
Engineer, Petroleum Refining Technology and Economic, http:/ /www.dekker.com, 2001
(20)-John jechura, jechura@ mines.edu , gasoline upgrading, 2015
(21)-Khalid Abdullah, Dr. in Omear Al-Mukhtar university, corrosion control, 2015
(22)-Mahmoud Ibrahim, Arabian heath institute, Damascus, 1988
\(23)-Raheel G. Raheel, Dr., in Tobruk university ,Petroleum Refinery, 2016
(24)-Reyad Shawabkeh, Dr. Department of Chemical Engineering, King Fahd University of
Petroleum & Minerals, e-mail: [email protected] ,2010.
(25)-Riazi, M.R. Characterization and Properties of Petroleum Fractions, ASTM, 2005.
(26)-Richard L. Myers, The 100 most important chemical compounds /a reference guide/
library of Congress Cataloging-in-Publication Data, 2007
(27)-Weissermel, K., and Arpe, H.-J. Industrial Organic Chemistry. Verilog Chemise, New
York, 1978
(28)-Wikispaces , https://tectec-22.wikispaces.com/file/view3+الواجب/. PPt, 2015
(29)-Yahiya Ail Badawey and Dr. Hawarey Almaamary, sana university 2007

117
Appendix A
Simulation to mass balance Unit by MATLAB
1- % material balance
2- function [x]= matblan(oilvol,sgoil)
3- clc
4- format short
5- syms oilmas
6- oilmas= solve(oilvol*159==oilmas);
7- dw=1000;
8- doil=sgoil*dw;
9- API=(141.5/sgoil)-131.5;
10- voloil=oilmas/doil;
11- pg1=4.25*0.33;
12- ln1=6;
13- hn1=15.1;
14- ker1=25*0.22;
15- die1=38.5*0.31;
16- res1=41*1.46;
17- %the mass of product
18- vlpg=voloil*(pg1/100);
19- vln=voloil*(ln1/100);
20- vhn=voloil*(hn1/100);
21- vker=voloil*(ker1/100);
22- vdie=voloil*(die1/100);
23- vres=voloil*(res1/100);
24- vtotal=(vlpg+vln+vhn+vker+vdie+vres);
25- dlpg=650; dln=740; dhn=780;
26- dker=790; ddie=840; dres=900;
27- mlpg=vlpg*dlpg;

118
28- mln=vln*dln;
29- mhn=vhn*dhn;
30- mker=vker*dker;
31- mdie=vdie*ddie;
32- mres=vres*dres;
33- %material bulence on strippres
34- unit=(1/3.785412);
35- sghn=0.78; sgker=0.79; sgdes=0.84;
36- sglpg=0.65; sgres=0.90; sgln= 0.74;
37- mlpg1=mlpg/sglpg;
38- mln1=mln/sgln;
39- mhn1=mhn/sghn;
40- mker1=mker/sgker;
41- mdie1= mdie/sgdes;
42- mres1=mres/sgres;
43- mtotal=mlpg1+mln1+mhn1+mdie1+mker1+mres1;
44- %heavy naphata
45- hnstrp=(mhn1/(100-6))*100;
46- refluxhntop=hnstrp-mhn1;
47- refluxhntop1=refluxhntop*unit;
48- stem=0.2268;
49- amountstemh2o=refluxhntop1*stem;
50- totalrefluxhn=amountstemh2o + refluxhntop;
51- trefluxtop=totalrefluxhn + refluxhntop;
52- %theproduct botem strippres H.N
53- prodstrihn=((hnstrp + amountstemh2o) - trefluxtop);
54- %steripper Kerosen
55- kerstrp=(mker1/(100-4))*100;
56- refluxtop=kerstrp - mker1;
57- refluxker1=refluxtop*unit;
58- amountstem=0.13608;
59- stemh2o=refluxker1*amountstem;

119
60- treflux=stemh2o + refluxtop;
61- %proudect of kerosen
62- proker=(kerstrp + stemh2o) - treflux;
63- %desele
64- dieinp=(mdie1*(100/98));
65- diereflx=dieinp-mdie1;
66- diereflx1=diereflx*unit;
67- amountstemdie=0.02265;
68- stmh2o=amountstemdie*diereflx1;
69- totalref=stmh2o + diereflx;
70- %prudect
71- prdcolum=(dieinp + stmh2o) - totalref;
72- disp('the API=')
73- double(API)
74- disp('mass of oil=')
75- double(mtotal)
76- disp('mass of LPG=')
77- double(mlpg1)
78- disp('mass of Light naphtha =')
79- double(mln1)
80- disp('mass of Heavy naphtha =')
81- double(mhn1)
82- disp('mass of Kerosene =')
83- double(mker1)
84- disp('mass of Diesel =')
85- double( mdie1 )
86- disp('mass of Residue =')
87- double(mres1)
88- disp('the mass of heavy naphtha inlet the striper=')
89- double(hnstrp)
90- disp('the total reflux H.N=')
91- double(trefluxtop)

120
92- disp('the product from strip H.N=')
93- double(prodstrihn)
94- disp('the mass of Kerosene inlet the striper=')
95- double(kerstrp)
96- disp('the total reflux Ker=')
97- double(treflux)
98- disp('the product from strip Ker=')
99- double(proker)
100- disp('the mass of Diesel inlet the striper=')
101- double(dieinp)
102- disp('the total reflux Diesel=')
103- double(totalref)
104- disp('the product from strip Die=')
105- double(prdcolum)

121
Appendix B
Simulation To The Energy Balance By MATLAB
1- % energy balance
2- function [x]=
3- enblan(to1,mo,mhn,mk,md,mre)
4- clc
5- thn1=141.67;
6- thn2=82.22;
7- cpo=2.55;
8- cphn= 2.007;
9- dthn=thn1-thn2;
10- syms dto
11- dto = solve ((mhn*cphn*dthn)==(mo*cpo*dto));
12- syms to2
13- to2=solve (dto==to2-to1);
14- cpk=2.14;
15- tk1=180.56;
16- tk2=40;
17- dtk=(tk1-tk2);
18- syms dto1
19- dto1= solve((mk*cpk*dtk)==(mo*cpo*dto1));
20- syms to3
21- to3 =solve (dto1==to3-to2);
22- cpd=2.30;
23- td1=171.11; td2=81.11;
24- dtd=(td1-td2);
25- syms dto2
26- dto2= solve ((md*cpd*dtd)==(mo*cpo*dto2));

122
27- syms to4
28- to4= solve(dto2==to4-to3);
29- syms dtod
30- dtod= solve((md*cpd*dtd)==(mo*cpo*dtod));
31- syms to5
32- to5= solve(dtod==to5-to4);
33- thnp1=175.56; thnp2=97.78;
34- dthnp=(thnp1-thnp2);
35- syms dto3
36- dto3= solve((mhn*cphn*dthnp)==(mo*cpo*dto3));
37- syms to6
38- to6= solve(dto3==to6-to5);
39- syms dto3b
40- dto3b= solve ((mhn*cphn*dthnp)==(mo*cpo*dto3b));
41- syms to6b
42- to6b= solve (dto3b==(to6b-to6));
43- tcr1=254.44; tcr2=161.11;
44- cpre=2.39;
45- dtcr=(tcr1-tcr2);
46- syms dt4
47- dt4=solve ((mre*cpre*dtcr)==(mo*cpo*dt4));
48- syms to7
49- to7=solve(dt4==to7-to6b);
50- syms dt4b
51- dt4b= solve((mre*cpre*dtcr)==(mo*cpo*dt4b));
52- syms to7b
53- to7b=solve (dt4b==to7b-to7);
54- thd1=252.22; thd2=182.22;
55- dthd=(thd1-thd2);
56- syms dt5
57- dt5= solve((md*cpd*dthd)==(mo*cpo*dt5));
58- syms to8
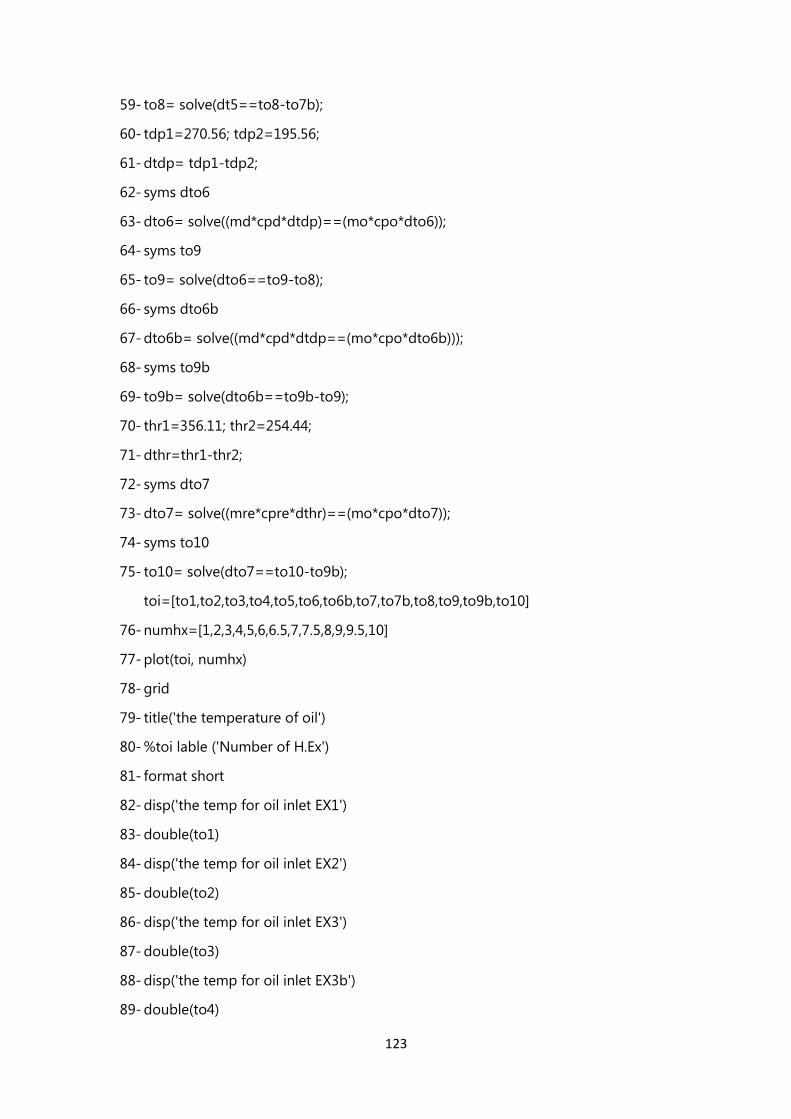
123
59- to8= solve(dt5==to8-to7b);
60- tdp1=270.56; tdp2=195.56;
61- dtdp= tdp1-tdp2;
62- syms dto6
63- dto6= solve((md*cpd*dtdp)==(mo*cpo*dto6));
64- syms to9
65- to9= solve(dto6==to9-to8);
66- syms dto6b
67- dto6b= solve((md*cpd*dtdp==(mo*cpo*dto6b)));
68- syms to9b
69- to9b= solve(dto6b==to9b-to9);
70- thr1=356.11; thr2=254.44;
71- dthr=thr1-thr2;
72- syms dto7
73- dto7= solve((mre*cpre*dthr)==(mo*cpo*dto7));
74- syms to10
75- to10= solve(dto7==to10-to9b);
toi=[to1,to2,to3,to4,to5,to6,to6b,to7,to7b,to8,to9,to9b,to10]
76- numhx=[1,2,3,4,5,6,6.5,7,7.5,8,9,9.5,10]
77- plot(toi, numhx)
78- grid
79- title('the temperature of oil')
80- %toi lable ('Number of H.Ex')
81- format short
82- disp('the temp for oil inlet EX1')
83- double(to1)
84- disp('the temp for oil inlet EX2')
85- double(to2)
86- disp('the temp for oil inlet EX3')
87- double(to3)
88- disp('the temp for oil inlet EX3b')
89- double(to4)

124
90- disp('the temp for oil inlet EX4')
91- double(to5)
92- disp('the temp for oil inlet EX4b')
93- double(to6)
94- disp('the temp for oil inlet EX5')
95- double(to6b)
96- disp('the temp for oil inlet EX5b')
97- double(to7)
98- disp('the temp for oil inlet EX6')
99- double(to7b)
100- disp('the temp for oil inlet EX7')
101- double(to8)
102- disp('the temp for oil inlet EX7b')
103- double(to9)
104- disp('the temp for oil inlet EX8')
105- double(to9b)
106- disp('the temp for oil out the unit')
107- double(to10)
Copyright © 2022 FDOKUMEN