THE EFFECT OF GALACTIC PROPERTIES ON THE ESCAPE FRACTION OF IONIZING PHOTONS
IOP PUBLISHING PHYSICS IN MEDICINE AND BIOLOGY
Phys. Med. Biol. 54 (2009) 6645–6673 doi:10.1088/0031-9155/54/21/014
Organ dose conversion coefficients on an ICRP-basedChinese adult male voxel model from idealizedexternal photons exposures
Liye Liu1,2,3, Zhi Zeng1,2,3, Junli Li1,2,3, Rui Qiu1, Binquan Zhang4,Jizeng Ma5, Ren Li1, Wenqian Li1 and Lei Bi1
1 Department of Engineering Physics, Tsinghua University, Beijing, 100084, People’s Republicof China2 Key Laboratory of Particle & Radiation Imaging (Tsinghua University), Ministry of Education3 Key Laboratory of High Energy Radiation Imaging Fundamental Science for National Defense4 China Institute for Radiation Protection, Taiyuan, 030006, People’s Republic of China5 China Institute for Atomic Energy, Beijing, 102413, People’s Republic of China
E-mail: [email protected]
Received 26 May 2009, in final form 27 September 2009Published 20 October 2009Online at stacks.iop.org/PMB/54/6645
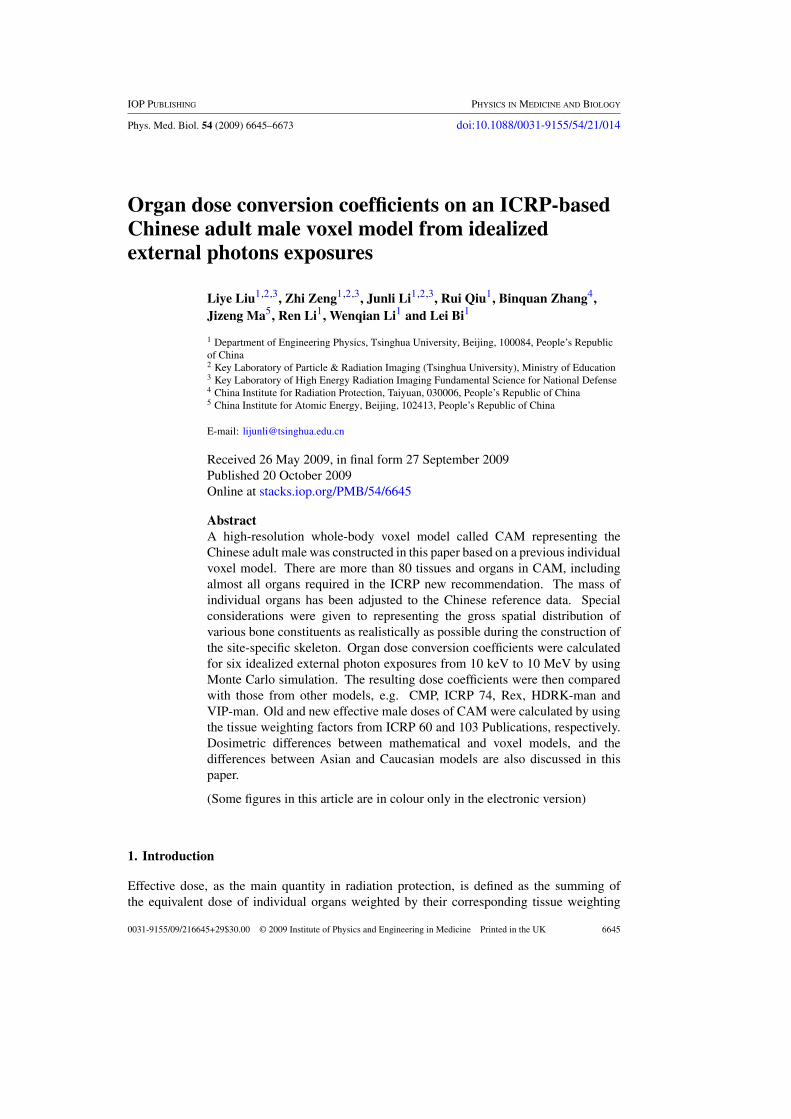
AbstractA high-resolution whole-body voxel model called CAM representing theChinese adult male was constructed in this paper based on a previous individualvoxel model. There are more than 80 tissues and organs in CAM, includingalmost all organs required in the ICRP new recommendation. The mass ofindividual organs has been adjusted to the Chinese reference data. Specialconsiderations were given to representing the gross spatial distribution ofvarious bone constituents as realistically as possible during the construction ofthe site-specific skeleton. Organ dose conversion coefficients were calculatedfor six idealized external photon exposures from 10 keV to 10 MeV by usingMonte Carlo simulation. The resulting dose coefficients were then comparedwith those from other models, e.g. CMP, ICRP 74, Rex, HDRK-man andVIP-man. Old and new effective male doses of CAM were calculated by usingthe tissue weighting factors from ICRP 60 and 103 Publications, respectively.Dosimetric differences between mathematical and voxel models, and thedifferences between Asian and Caucasian models are also discussed in thispaper.
(Some figures in this article are in colour only in the electronic version)
1. Introduction
Effective dose, as the main quantity in radiation protection, is defined as the summing ofthe equivalent dose of individual organs weighted by their corresponding tissue weighting
0031-9155/09/216645+29$30.00 © 2009 Institute of Physics and Engineering in Medicine Printed in the UK 6645

6646 L Liu et al
factors. Since equivalent dose in the tissues or organs of the body is not directly measurable,measurement of the effective dose is not possible. These quantities are categorized as theso-called protection quantities. In order to assess effective dose or equivalent dose of organs,conversion coefficients are usually employed to relate them to ‘operational quantities’, e.g.fluence and air kerma, which can be measured by using proper instruments. Therefore, acomputational model of human body plays an important role for calculating the various doseconversion coefficients in radiation protection. Mathematical models were used widely in thepast decades for the above purpose, while voxel models representing more accurate anatomyhave been adopted in recent years. A brief introduction of computational models is given inthe following sections.
1.1. Mathematical models
Mathematical models known as MIRD-style phantoms were included in the MIRD pamphletno 5 by the Medical Internal Radiation Dose (MIRD) Committee, where the body and organswere described by various mathematical equations (Snyder et al 1969, 1978, Cristy andEckerman 1987). The dose conversion coefficients for external exposure provided by ICRP74 Publication (ICRP 1996) were calculated based on ADAM and EVA mathematical models(Kramer et al 1982, Zankl et al 1997). Apart from the above Caucasian mathematical models,the first non-Caucasian mathematical model was established in India by Biju and Nagarajan(2000). In 2002, a Chinese mathematical phantom named CMP, representing a Chinesereference man, was developed by Fan (2002). Specific absorbed fractions (SAFs) for internaldose assessment and dose coefficients for external photon irradiation calculated with CMPwere reported by Qiu et al (2008, 2009). Meanwhile, effort for establishing a system ofKorean reference man models also has been undertaken in Korea (Lee and Lee 2006). As aresult, Korean adult male stylized phantom (KMIRD) was reported by Park et al (2006, 2008).
1.2. Voxel models
Although mathematical models continue to be improved, such as revised gastrointestinal (GI)tract (Poston et al 1996), new model of navy cavity and major airway (Deloar et al 1997),kidney model (Bouchet et al 2003) and dynamics (4D) stylized models (Segars 2001, Segarset al 2004, Paganetti 2004), the human body is so complex that it cannot be modeled accuratelyby using a few equations in mathematical phantoms. Voxel models, constructed from medicalimage data obtained from real persons, can give a more realistic anatomic description of humanbody than the mathematical phantoms (ICRP 2007).
Since the first voxel model was reported by Gibbs et al (1984), considerable effortshave been made to develop voxel models based on computed tomography (CT), magneticresonance imaging (MRI) or color photographs in the past 30 years. Nowadays, more than30 individual voxel-based models have been reported by many authors (Zaidi and Xu 2007).Zubal et al (1994) constructed an adult male phantom based on CT images from an adult malepatient. NORMAN and NAOMI based on MRI data of healthy volunteers were introduced byDimbylow (1995, 1997, 2005). In 2000, VIP-Man was developed by Xu and his colleagues(2000) based on cross-sectional color photographic images of an adult male cadaver from theVisible Human Project. Shi and Xu (2004) also developed an 8 month pregnant woman modelfrom CT images. The MAX and FAX models were developed by Kramer et al (2003, 2004a,2004b, 2005, 2006a, 2006b, 2007). GSF-series voxel models, e.g. BABY, GOLEM, etc,were developed by Zankl and her colleagues (Zankl et al 1988, Zankl and Wittmann 2001,Petoussi-Henss et al 2002). In 2007, ICRP decided to use the voxel-based model as an ICRP

Organ dose conversion coefficients on an ICRP-based CAM voxel model 6647
reference model in its new recommendation (ICRP 2007). Organ dose conversion coefficientsfor photon external irradiation on Rex and Regina, conform to the reference mass of ICRPPublications 70 (ICRP 1995) and 89 (ICRP 2002), were reported by Schlattl et al (2007).
Voxel models representing other ethnic groups have also been developed in recent years.The first Asian voxel model, Otoko, was established based on whole-body CT data of a patientby Saito et al (2001). Adult male and female Japanese voxel phantoms from MR imagesof volunteers were introduced by Nagaoka et al (2004). Another high-resolution Japaneseadult male voxel phantom was developed for photon self-absorption fraction calculation bySato et al (2007). The first Korean tomographic male phantom, KORMAN (Korean MAN),was developed from MR images of a healthy volunteer by Lee et al (2004), and the revisedmodels KTMAN-1 and KTMAN-2 were then established (Lee et al 2006b). Recently, a High-Definition Reference Korean-Man (HDRK-man) model was reported by Kim et al (2008).In China, Zhang et al (2005) introduced the first CAM voxel model for radiation protectionpurpose, later denoted as CNMAN (Zhang et al 2007a), which was constructed based on theChinese Visible Human Data Set. Then, Zeng et al (2006) developed a CAM voxel model,CVP, based on MR images for Chinese astronauts’ dose assessment in space. More recently,Zhang et al (2007b, 2008) developed another CAM voxel model, called Visible ChineseHuman (VCH), using the high-resolution transversal photographs of a CAM cadaver.
1.3. The purpose of this paper
This paper describes the construction of a Chinese reference adult male voxel model, hereafterreferred as CAM, based on a pre-established Chinese individual model CNMAN (Zhang et al2007a). CAM has more than 80 tissues and organs, including almost all organs assigned withtissue weighting factors in ICRP new recommendation (ICRP 2007). After implementingCAM into Monte Carlo simulation code MCNPX, organ dose conversion coefficients werecalculated for idealized photons exposure from 10 keV to 10 MeV. The dose data from CAMwere then compared with those from other models, such as CMP (Qiu et al 2009), ICRP74 Publication (ICRP 1996), Rex (Schlattl et al 2007), HDRK-man (Kim et al 2008), VCH(Zhang et al 2008) and VIP-man (Xu et al 2000). Dosimetric differences between mathematicaland voxel models, and those between the Chinese and Caucasian models will also be discussedin this paper.
2. Methods and materials
2.1. Main procedure for the construction of CAM
The main procedure for constructing a CAM voxel model can be described in the followingsix steps: (1) to select a proper individual voxel model as a base model for CAM; (2) todetermine the proper voxel size in CAM according to the Asian skeleton reference volume;(3) to construct the site-specific skeleton for CAM; (4) to segment the organs that are notsegmented in the base model, and to segment the organ’s wall from its content for alimentarytract; (5) to adjust the mass of individual organs to Chinese reference values (Wang et al 1998,GBZ 2007); (6) to adjust the body weight by modifying the amount of remaining soft tissue.
In the first step, the Chinese individual voxel model, CNMAN (Zhang et al 2007a),was selected as the base model for CAM. The previous model was constructed from high-resolution color photographs of a 35 year old Chinese male cadaver (170 cm in height and65 kg in weight), who had similar height and weight to the Chinese reference adult male(170 cm, 63 kg; taken from GBZ (2007)). The values of perpendicular voxel size in CNMAN
6648 L Liu et al
(a) (b) (c)
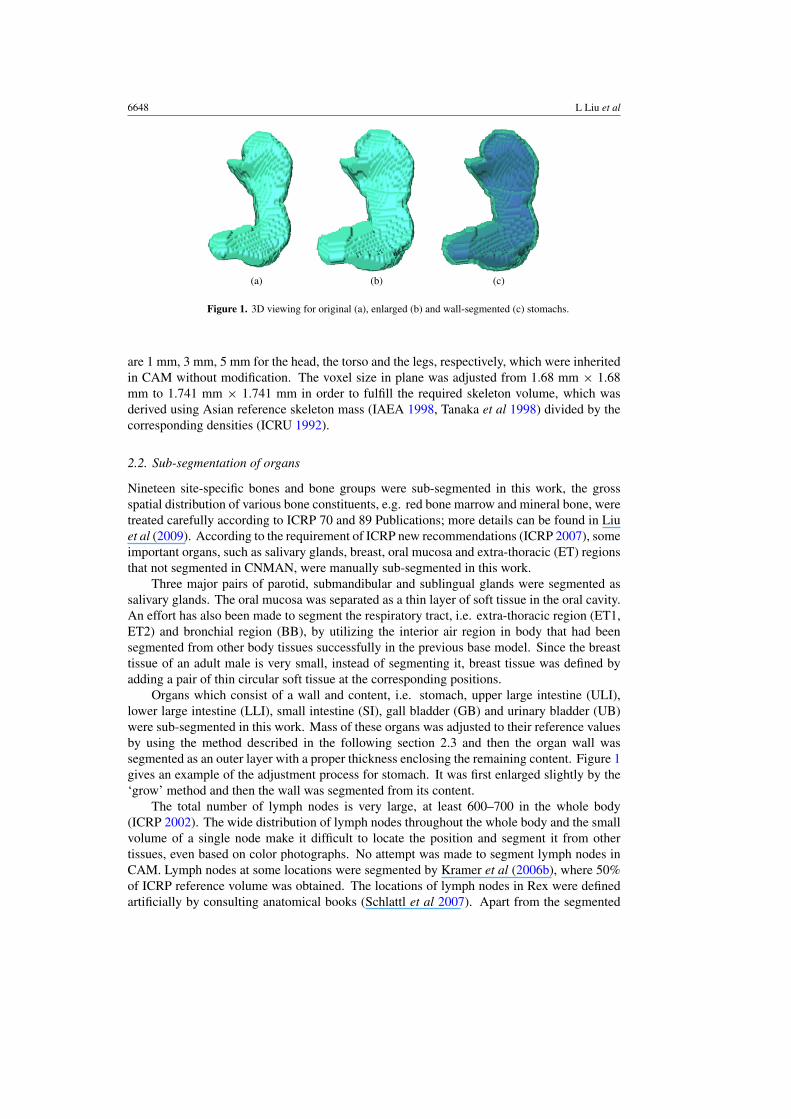
Figure 1. 3D viewing for original (a), enlarged (b) and wall-segmented (c) stomachs.
are 1 mm, 3 mm, 5 mm for the head, the torso and the legs, respectively, which were inheritedin CAM without modification. The voxel size in plane was adjusted from 1.68 mm × 1.68mm to 1.741 mm × 1.741 mm in order to fulfill the required skeleton volume, which wasderived using Asian reference skeleton mass (IAEA 1998, Tanaka et al 1998) divided by thecorresponding densities (ICRU 1992).
2.2. Sub-segmentation of organs
Nineteen site-specific bones and bone groups were sub-segmented in this work, the grossspatial distribution of various bone constituents, e.g. red bone marrow and mineral bone, weretreated carefully according to ICRP 70 and 89 Publications; more details can be found in Liuet al (2009). According to the requirement of ICRP new recommendations (ICRP 2007), someimportant organs, such as salivary glands, breast, oral mucosa and extra-thoracic (ET) regionsthat not segmented in CNMAN, were manually sub-segmented in this work.
Three major pairs of parotid, submandibular and sublingual glands were segmented assalivary glands. The oral mucosa was separated as a thin layer of soft tissue in the oral cavity.An effort has also been made to segment the respiratory tract, i.e. extra-thoracic region (ET1,ET2) and bronchial region (BB), by utilizing the interior air region in body that had beensegmented from other body tissues successfully in the previous base model. Since the breasttissue of an adult male is very small, instead of segmenting it, breast tissue was defined byadding a pair of thin circular soft tissue at the corresponding positions.
Organs which consist of a wall and content, i.e. stomach, upper large intestine (ULI),lower large intestine (LLI), small intestine (SI), gall bladder (GB) and urinary bladder (UB)were sub-segmented in this work. Mass of these organs was adjusted to their reference valuesby using the method described in the following section 2.3 and then the organ wall wassegmented as an outer layer with a proper thickness enclosing the remaining content. Figure 1gives an example of the adjustment process for stomach. It was first enlarged slightly by the‘grow’ method and then the wall was segmented from its content.
The total number of lymph nodes is very large, at least 600–700 in the whole body(ICRP 2002). The wide distribution of lymph nodes throughout the whole body and the smallvolume of a single node make it difficult to locate the position and segment it from othertissues, even based on color photographs. No attempt was made to segment lymph nodes inCAM. Lymph nodes at some locations were segmented by Kramer et al (2006b), where 50%of ICRP reference volume was obtained. The locations of lymph nodes in Rex were definedartificially by consulting anatomical books (Schlattl et al 2007). Apart from the segmented

Organ dose conversion coefficients on an ICRP-based CAM voxel model 6649
Figure 2. Deformation of the spleen during the adjustment process (left: before adjustment, right:after adjustment).
organs in CAM, the rest parts of the body including muscle, adipose, lymph nodes and othertissues were referred to as unseparated soft tissue.
2.3. Adjustment of organ mass to the Chinese reference values
Although the cadaver had a height and weight approximate to the values of Chinese referenceman, the calculated weight of CNMAN was 54.2 kg, which was −14% less than the referenceweight (63 kg). Because of the small thickness of skin, some adipose tissues adjacent to skinwere segmented falsely as a part of skin during the construction process of CNMAN. Theskin mass in CNMAN was 4016.4 g, which was about 67% higher than the reference value(2400 g). Larger deviations could also be observed for other organs between CNMAN andChinese reference data, which even reached 250% for spleen. In order to develop a voxelmodel representing Chinese reference man, adjustment of organ mass was carried out in thispaper using the method similar to that introduced by Becker et al (2007).
Obviously, adjustment of organ mass should be implemented by changing its volume.The desired volume for each organ can be derived from the reference mass divided by itscorresponding density, which is taken from the ICRU 46 report. With Matlab programming,the adjustments were performed by the so-called erosion and grow methods in this paper. Theerosion method was used for those organs whose original mass was larger than the referencevalue. It simply reduced the organ volume by reassigning the organ’s surface voxels as softtissue until the desired volume was achieved. On the other hand, if the original mass of organwas less than the reference value, the grow method was employed. It enlarged the organ volumeby reassigning the surrounding voxels as the desired organ, if only that those voxels did notbelong to any other segmented organs, i.e. those voxels belonged to the un-separated soft tissuein the body. It is believed that the realistic anatomy can be maintained for most organs duringthe above adjustment process. As shown in figure 2, a little anatomical deformation can be seenfor spleen, which encountered the biggest change in mass from 577.1 g to 164.7 g.
After the adjustment of all organs except skin having been completed, the weight of thewhole body was adjusted by growing the outer surface of the body and specifying the newgrowing voxels as soft tissue. Skin is a special organ which covers the human body with asmall thickness. It was the last one to be segmented and adjusted by assigning the surfacevoxels of the body as skin through the erosion method.
6650 L Liu et al
2.4. Monte Carlo simulation
The CAM voxel model was implemented into MCNPX by using repeated geometry structure,i.e. Universe, Lattice and Fill cards. A series of functions written by Matlab language wasused to adapt the voxel model raw data to MCNP syntax. Voxels belonging to one organ wereassigned with the same universe number. A total of 81 universes were used for description ofthe corresponding organs or tissues in CAM.
Tissue density and element compositions for an adult male from the ICRU 46 report(ICRU 1992) were used in the MC simulation. Cross-section libraries of mcplib04 and el03were used for photons and electrons transport, respectively. Photons and secondary photonswere followed down to 1 keV, while the energy cutoff for electrons was set as 50 keV. Energydeposited in each organ was recorded by F8 tally, which could give a more accurate estimatefor organ dose than F6 tally (kerma approximation). As discussed by many authors (ICRP1996, Xu et al 2000, Qiu et al 2009), the kerma approximation method used in ICRP 74Publication would give an overestimation of dose for the superficial organs, such as skin andthyroid, where the secondary charged particle equilibrium (CPE) could not be achieved forhigh-energy photons.
The absorbed dose to segmented organs was calculated directly from the depositedenergies divided by its corresponding mass. The dose to red bone marrow (RBM) cannot becalculated directly due to its small dimensions. The three-correction-factors (3CFs) method(Zankl et al 2002, Kramer et al 2003) was used to derive the RBM dose. Meanwhile, the doseto spongiosa was used as a surrogate for the bone surface dose (Liu et al 2009). The absorbeddose to the unseparated tissue in CAM was used as a substitute for those to lymph nodes andmuscle.
3. Result and discussion
3.1. CAM voxel model
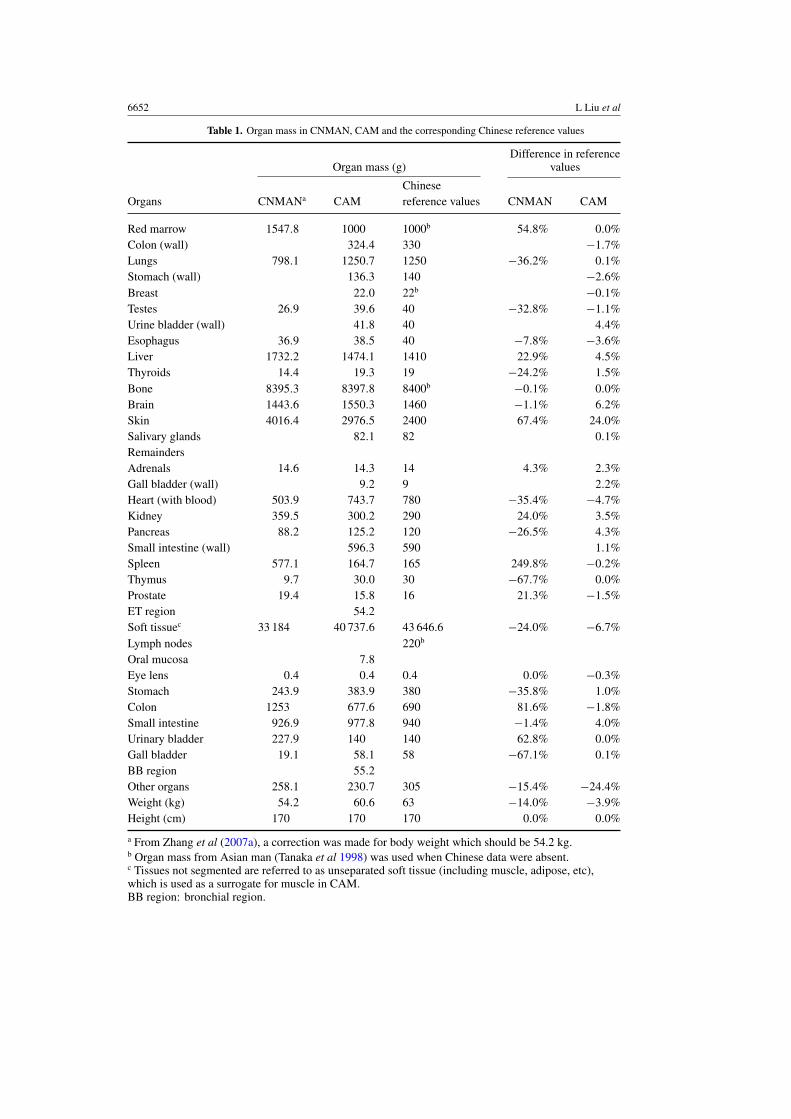
The CAM voxel model is shown graphically in figure 3. Nineteen site-specific bonesand various major organs are labeled in the pictures. Table 1 summarizes the massesof individual organs and tissues in CAM. For comparisons purpose, organ masses of theprevious model CNMAN and Chinese reference data are also given in the table. Organ massdifferences between voxel models and Chinese reference data are presented in the last twocolumns.
As can be seen in table 1, good agreement of organ mass between CAM and Chinesereference data was achieved for almost all organs except for skin. Because the voxel size inplane of CAM is 1.741 mm, larger than the proper thickness of skin (about 1.3 mm), it is notpossible to model the skin accurately. The result mass of skin (2976.5 g) is 24% higher thanthe Chinese reference value (2400 g).
Original mass of lungs in CNMAN was 798.1 g, which was calculated by multiplyingthe lungs volume with the density of 0.26 g cm−3. This value of density is for lungs with fullinhalation as footnoted in the ICRU 46 report. The base model was previously constructed fromcolor photographs of the cadaver, whose lungs should be without full inhalation. Therefore,higher density should be used for these lungs. No adjustment was carried out for lungs inthis work. Instead, in order to achieve the required lung mass (1250 g), a derived density of0.379 g cm−3 was used for CAM’s lungs which volume is 3300 cm3. It is interesting to noticethat the value of lungs density used in Rex is 0.38 g cm−3 (Schlattl et al 2007), it is almostequal to the above derived value used in CAM.

Organ dose conversion coefficients on an ICRP-based CAM voxel model 6651
Figure 3. 3D view for site-specific bones (left) and major organs (right) in the CAM model; somebones and organs are not shown in the pictures.
3.2. Dose conversion coefficients for idealized external photons exposures
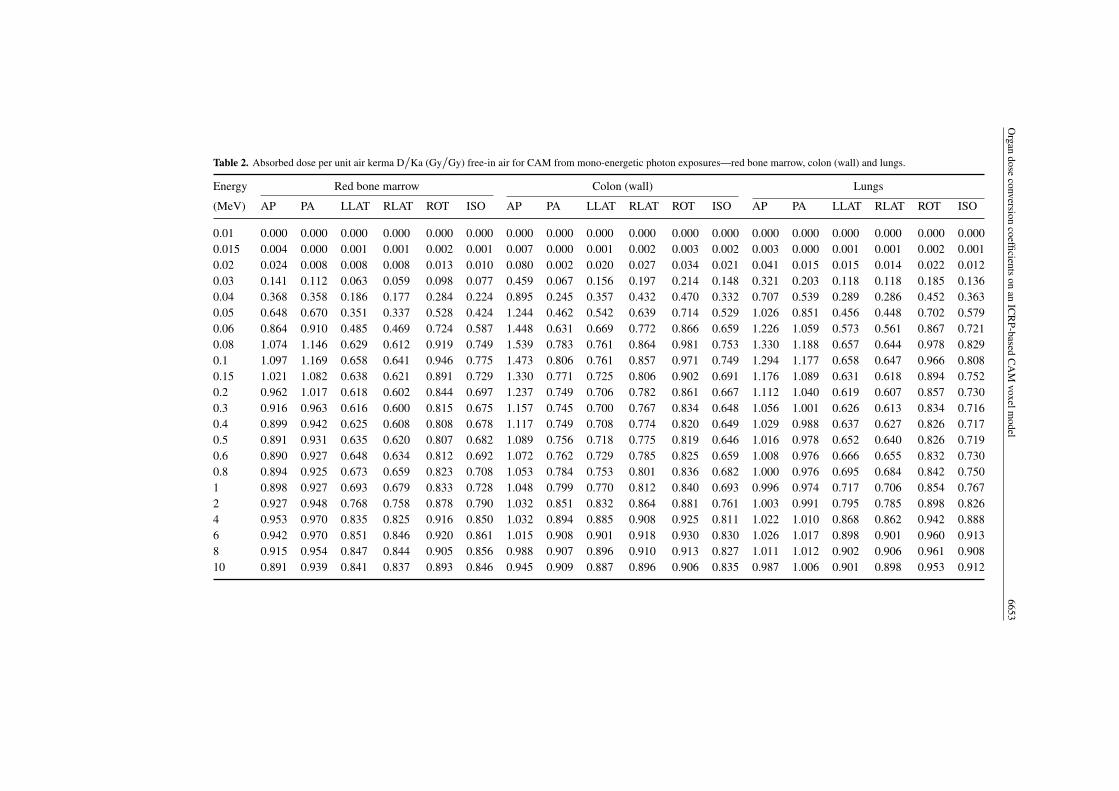
Six idealized irradiation geometries investigated in this paper were antero-posterior (AP),postero-anterior (PA), left-side lateral (LLAT), right-side lateral (RLAT), rotational (ROT)and isotropic (ISO) geometries. The total amount of 3432 organ dose conversion coefficientswere calculated for 26 organs, 6 irradiation geometries and 22 energy groups of mono-energeticphotons ranging from 10 keV to 10 MeV. The statistical uncertainties of MC simulation wereless than 1% for photons with incident energies greater than 20 keV, a little larger statisticalerrors were presented for some small and deep organs irradiated by photons with energiesbelow 20 keV. Only 0.6% of all dose data are reported with statistical errors greater than 10%.The absorbed dose coefficients for various organs of CAM are presented in table 2–11.
3.3. Comparison of dose coefficients among different models
Dose coefficients from CAM were compared with those from other models, i.e. Rex, CMP,ICRP 74, HDRK-man, VCH and VIP-man. Considering that the CMP (Chinese mathematicalphantom) represents the Chinese reference man, while Rex and ICRP 74 are voxel-based andmathematical models both representing the ICRP reference man respectively, major attentionswere given to the comparisons between CAM and the three models. For the low energy upto approximately 30 keV, photons are easily shielded by the body tissues. The organ dose
6652 L Liu et al
Table 1. Organ mass in CNMAN, CAM and the corresponding Chinese reference values
Organ mass (g)Difference in reference
values
ChineseOrgans CNMANa CAM reference values CNMAN CAM
Red marrow 1547.8 1000 1000b 54.8% 0.0%Colon (wall) 324.4 330 −1.7%Lungs 798.1 1250.7 1250 −36.2% 0.1%Stomach (wall) 136.3 140 −2.6%Breast 22.0 22b −0.1%Testes 26.9 39.6 40 −32.8% −1.1%Urine bladder (wall) 41.8 40 4.4%Esophagus 36.9 38.5 40 −7.8% −3.6%Liver 1732.2 1474.1 1410 22.9% 4.5%Thyroids 14.4 19.3 19 −24.2% 1.5%Bone 8395.3 8397.8 8400b −0.1% 0.0%Brain 1443.6 1550.3 1460 −1.1% 6.2%Skin 4016.4 2976.5 2400 67.4% 24.0%Salivary glands 82.1 82 0.1%RemaindersAdrenals 14.6 14.3 14 4.3% 2.3%Gall bladder (wall) 9.2 9 2.2%Heart (with blood) 503.9 743.7 780 −35.4% −4.7%Kidney 359.5 300.2 290 24.0% 3.5%Pancreas 88.2 125.2 120 −26.5% 4.3%Small intestine (wall) 596.3 590 1.1%Spleen 577.1 164.7 165 249.8% −0.2%Thymus 9.7 30.0 30 −67.7% 0.0%Prostate 19.4 15.8 16 21.3% −1.5%ET region 54.2Soft tissuec 33 184 40 737.6 43 646.6 −24.0% −6.7%Lymph nodes 220b
Oral mucosa 7.8Eye lens 0.4 0.4 0.4 0.0% −0.3%Stomach 243.9 383.9 380 −35.8% 1.0%Colon 1253 677.6 690 81.6% −1.8%Small intestine 926.9 977.8 940 −1.4% 4.0%Urinary bladder 227.9 140 140 62.8% 0.0%Gall bladder 19.1 58.1 58 −67.1% 0.1%BB region 55.2Other organs 258.1 230.7 305 −15.4% −24.4%Weight (kg) 54.2 60.6 63 −14.0% −3.9%Height (cm) 170 170 170 0.0% 0.0%
a From Zhang et al (2007a), a correction was made for body weight which should be 54.2 kg.b Organ mass from Asian man (Tanaka et al 1998) was used when Chinese data were absent.c Tissues not segmented are referred to as unseparated soft tissue (including muscle, adipose, etc),which is used as a surrogate for muscle in CAM.BB region: bronchial region.
Organ
doseconversion
coefficientson
anIC
RP-based
CA
Mvoxelm
odel6653
Table 2. Absorbed dose per unit air kerma D/Ka (Gy/Gy) free-in air for CAM from mono-energetic photon exposures—red bone marrow, colon (wall) and lungs.
Energy Red bone marrow Colon (wall) Lungs
(MeV) AP PA LLAT RLAT ROT ISO AP PA LLAT RLAT ROT ISO AP PA LLAT RLAT ROT ISO
0.01 0.000 0.000 0.000 0.000 0.000 0.000 0.000 0.000 0.000 0.000 0.000 0.000 0.000 0.000 0.000 0.000 0.000 0.0000.015 0.004 0.000 0.001 0.001 0.002 0.001 0.007 0.000 0.001 0.002 0.003 0.002 0.003 0.000 0.001 0.001 0.002 0.0010.02 0.024 0.008 0.008 0.008 0.013 0.010 0.080 0.002 0.020 0.027 0.034 0.021 0.041 0.015 0.015 0.014 0.022 0.0120.03 0.141 0.112 0.063 0.059 0.098 0.077 0.459 0.067 0.156 0.197 0.214 0.148 0.321 0.203 0.118 0.118 0.185 0.1360.04 0.368 0.358 0.186 0.177 0.284 0.224 0.895 0.245 0.357 0.432 0.470 0.332 0.707 0.539 0.289 0.286 0.452 0.3630.05 0.648 0.670 0.351 0.337 0.528 0.424 1.244 0.462 0.542 0.639 0.714 0.529 1.026 0.851 0.456 0.448 0.702 0.5790.06 0.864 0.910 0.485 0.469 0.724 0.587 1.448 0.631 0.669 0.772 0.866 0.659 1.226 1.059 0.573 0.561 0.867 0.7210.08 1.074 1.146 0.629 0.612 0.919 0.749 1.539 0.783 0.761 0.864 0.981 0.753 1.330 1.188 0.657 0.644 0.978 0.8290.1 1.097 1.169 0.658 0.641 0.946 0.775 1.473 0.806 0.761 0.857 0.971 0.749 1.294 1.177 0.658 0.647 0.966 0.8080.15 1.021 1.082 0.638 0.621 0.891 0.729 1.330 0.771 0.725 0.806 0.902 0.691 1.176 1.089 0.631 0.618 0.894 0.7520.2 0.962 1.017 0.618 0.602 0.844 0.697 1.237 0.749 0.706 0.782 0.861 0.667 1.112 1.040 0.619 0.607 0.857 0.7300.3 0.916 0.963 0.616 0.600 0.815 0.675 1.157 0.745 0.700 0.767 0.834 0.648 1.056 1.001 0.626 0.613 0.834 0.7160.4 0.899 0.942 0.625 0.608 0.808 0.678 1.117 0.749 0.708 0.774 0.820 0.649 1.029 0.988 0.637 0.627 0.826 0.7170.5 0.891 0.931 0.635 0.620 0.807 0.682 1.089 0.756 0.718 0.775 0.819 0.646 1.016 0.978 0.652 0.640 0.826 0.7190.6 0.890 0.927 0.648 0.634 0.812 0.692 1.072 0.762 0.729 0.785 0.825 0.659 1.008 0.976 0.666 0.655 0.832 0.7300.8 0.894 0.925 0.673 0.659 0.823 0.708 1.053 0.784 0.753 0.801 0.836 0.682 1.000 0.976 0.695 0.684 0.842 0.7501 0.898 0.927 0.693 0.679 0.833 0.728 1.048 0.799 0.770 0.812 0.840 0.693 0.996 0.974 0.717 0.706 0.854 0.7672 0.927 0.948 0.768 0.758 0.878 0.790 1.032 0.851 0.832 0.864 0.881 0.761 1.003 0.991 0.795 0.785 0.898 0.8264 0.953 0.970 0.835 0.825 0.916 0.850 1.032 0.894 0.885 0.908 0.925 0.811 1.022 1.010 0.868 0.862 0.942 0.8886 0.942 0.970 0.851 0.846 0.920 0.861 1.015 0.908 0.901 0.918 0.930 0.830 1.026 1.017 0.898 0.901 0.960 0.9138 0.915 0.954 0.847 0.844 0.905 0.856 0.988 0.907 0.896 0.910 0.913 0.827 1.011 1.012 0.902 0.906 0.961 0.90810 0.891 0.939 0.841 0.837 0.893 0.846 0.945 0.909 0.887 0.896 0.906 0.835 0.987 1.006 0.901 0.898 0.953 0.912
6654L
Liu
etal
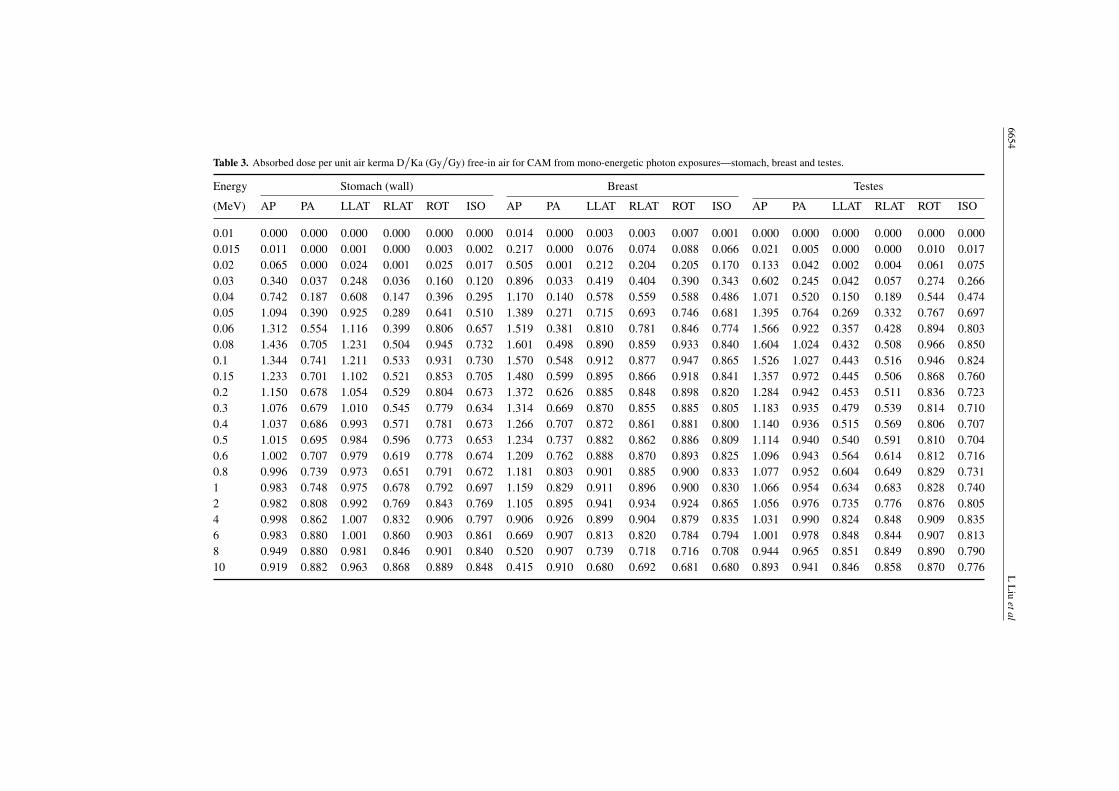
Table 3. Absorbed dose per unit air kerma D/Ka (Gy/Gy) free-in air for CAM from mono-energetic photon exposures—stomach, breast and testes.
Energy Stomach (wall) Breast Testes
(MeV) AP PA LLAT RLAT ROT ISO AP PA LLAT RLAT ROT ISO AP PA LLAT RLAT ROT ISO
0.01 0.000 0.000 0.000 0.000 0.000 0.000 0.014 0.000 0.003 0.003 0.007 0.001 0.000 0.000 0.000 0.000 0.000 0.0000.015 0.011 0.000 0.001 0.000 0.003 0.002 0.217 0.000 0.076 0.074 0.088 0.066 0.021 0.005 0.000 0.000 0.010 0.0170.02 0.065 0.000 0.024 0.001 0.025 0.017 0.505 0.001 0.212 0.204 0.205 0.170 0.133 0.042 0.002 0.004 0.061 0.0750.03 0.340 0.037 0.248 0.036 0.160 0.120 0.896 0.033 0.419 0.404 0.390 0.343 0.602 0.245 0.042 0.057 0.274 0.2660.04 0.742 0.187 0.608 0.147 0.396 0.295 1.170 0.140 0.578 0.559 0.588 0.486 1.071 0.520 0.150 0.189 0.544 0.4740.05 1.094 0.390 0.925 0.289 0.641 0.510 1.389 0.271 0.715 0.693 0.746 0.681 1.395 0.764 0.269 0.332 0.767 0.6970.06 1.312 0.554 1.116 0.399 0.806 0.657 1.519 0.381 0.810 0.781 0.846 0.774 1.566 0.922 0.357 0.428 0.894 0.8030.08 1.436 0.705 1.231 0.504 0.945 0.732 1.601 0.498 0.890 0.859 0.933 0.840 1.604 1.024 0.432 0.508 0.966 0.8500.1 1.344 0.741 1.211 0.533 0.931 0.730 1.570 0.548 0.912 0.877 0.947 0.865 1.526 1.027 0.443 0.516 0.946 0.8240.15 1.233 0.701 1.102 0.521 0.853 0.705 1.480 0.599 0.895 0.866 0.918 0.841 1.357 0.972 0.445 0.506 0.868 0.7600.2 1.150 0.678 1.054 0.529 0.804 0.673 1.372 0.626 0.885 0.848 0.898 0.820 1.284 0.942 0.453 0.511 0.836 0.7230.3 1.076 0.679 1.010 0.545 0.779 0.634 1.314 0.669 0.870 0.855 0.885 0.805 1.183 0.935 0.479 0.539 0.814 0.7100.4 1.037 0.686 0.993 0.571 0.781 0.673 1.266 0.707 0.872 0.861 0.881 0.800 1.140 0.936 0.515 0.569 0.806 0.7070.5 1.015 0.695 0.984 0.596 0.773 0.653 1.234 0.737 0.882 0.862 0.886 0.809 1.114 0.940 0.540 0.591 0.810 0.7040.6 1.002 0.707 0.979 0.619 0.778 0.674 1.209 0.762 0.888 0.870 0.893 0.825 1.096 0.943 0.564 0.614 0.812 0.7160.8 0.996 0.739 0.973 0.651 0.791 0.672 1.181 0.803 0.901 0.885 0.900 0.833 1.077 0.952 0.604 0.649 0.829 0.7311 0.983 0.748 0.975 0.678 0.792 0.697 1.159 0.829 0.911 0.896 0.900 0.830 1.066 0.954 0.634 0.683 0.828 0.7402 0.982 0.808 0.992 0.769 0.843 0.769 1.105 0.895 0.941 0.934 0.924 0.865 1.056 0.976 0.735 0.776 0.876 0.8054 0.998 0.862 1.007 0.832 0.906 0.797 0.906 0.926 0.899 0.904 0.879 0.835 1.031 0.990 0.824 0.848 0.909 0.8356 0.983 0.880 1.001 0.860 0.903 0.861 0.669 0.907 0.813 0.820 0.784 0.794 1.001 0.978 0.848 0.844 0.907 0.8138 0.949 0.880 0.981 0.846 0.901 0.840 0.520 0.907 0.739 0.718 0.716 0.708 0.944 0.965 0.851 0.849 0.890 0.79010 0.919 0.882 0.963 0.868 0.889 0.848 0.415 0.910 0.680 0.692 0.681 0.680 0.893 0.941 0.846 0.858 0.870 0.776

Organ
doseconversion
coefficientson
anIC
RP-based
CA
Mvoxelm
odel6655
Table 4. Absorbed dose per unit air kerma D/Ka (Gy/Gy) free-in air for CAM from mono-energetic photon exposures—urinary bladder (wall), esophagus and liver.
Energy Urinary bladder (wall) Esophagus Liver
(MeV) AP PA LLAT RLAT ROT ISO AP PA LLAT RLAT ROT ISO AP PA LLAT RLAT ROT ISO
0.01 0.000 0.000 0.000 0.000 0.000 0.000 0.000 0.000 0.000 0.000 0.000 0.000 0.000 0.000 0.000 0.000 0.000 0.0000.015 0.000 0.000 0.000 0.000 0.000 0.000 0.007 0.000 0.000 0.000 0.001 0.001 0.002 0.000 0.000 0.001 0.001 0.0000.02 0.009 0.002 0.000 0.000 0.004 0.002 0.045 0.000 0.004 0.003 0.012 0.007 0.031 0.003 0.003 0.023 0.015 0.0100.03 0.183 0.087 0.014 0.016 0.083 0.053 0.223 0.048 0.081 0.064 0.111 0.076 0.275 0.077 0.052 0.232 0.155 0.1120.04 0.540 0.343 0.093 0.100 0.268 0.208 0.539 0.262 0.263 0.222 0.324 0.246 0.665 0.281 0.181 0.569 0.406 0.3050.05 0.898 0.644 0.223 0.240 0.517 0.401 0.858 0.538 0.462 0.403 0.566 0.457 1.017 0.520 0.331 0.866 0.663 0.5200.06 1.148 0.865 0.345 0.362 0.718 0.546 1.078 0.760 0.609 0.539 0.758 0.612 1.239 0.706 0.445 1.051 0.842 0.6690.08 1.318 1.059 0.465 0.486 0.866 0.694 1.215 0.937 0.730 0.654 0.908 0.732 1.353 0.851 0.540 1.150 0.957 0.7670.1 1.295 1.068 0.505 0.512 0.898 0.676 1.216 0.951 0.743 0.674 0.914 0.741 1.304 0.859 0.554 1.122 0.942 0.7640.15 1.166 0.985 0.491 0.506 0.820 0.642 1.086 0.878 0.717 0.653 0.850 0.704 1.157 0.798 0.533 1.020 0.855 0.7000.2 1.085 0.945 0.489 0.502 0.778 0.622 0.994 0.839 0.708 0.649 0.819 0.668 1.076 0.766 0.526 0.969 0.810 0.6670.3 1.008 0.906 0.508 0.517 0.739 0.601 0.959 0.812 0.713 0.654 0.790 0.659 1.008 0.748 0.537 0.932 0.777 0.6470.4 0.983 0.887 0.530 0.537 0.747 0.599 0.938 0.805 0.727 0.676 0.789 0.667 0.977 0.748 0.555 0.919 0.770 0.6450.5 0.963 0.879 0.542 0.547 0.758 0.623 0.927 0.801 0.743 0.690 0.789 0.679 0.960 0.751 0.574 0.913 0.770 0.6540.6 0.956 0.874 0.565 0.567 0.749 0.632 0.918 0.804 0.757 0.706 0.789 0.684 0.951 0.758 0.593 0.913 0.773 0.6630.8 0.948 0.883 0.596 0.593 0.771 0.640 0.912 0.813 0.778 0.734 0.806 0.717 0.945 0.775 0.624 0.919 0.785 0.6801 0.946 0.882 0.617 0.624 0.777 0.660 0.913 0.826 0.798 0.761 0.814 0.734 0.941 0.789 0.650 0.923 0.797 0.6942 0.958 0.914 0.720 0.728 0.821 0.728 0.922 0.866 0.865 0.837 0.873 0.786 0.955 0.841 0.737 0.946 0.845 0.7584 0.973 0.948 0.805 0.811 0.873 0.796 0.963 0.904 0.907 0.889 0.906 0.856 0.974 0.888 0.811 0.970 0.893 0.8196 0.979 0.948 0.832 0.846 0.895 0.833 0.960 0.920 0.925 0.905 0.923 0.875 0.977 0.903 0.838 0.971 0.904 0.8388 0.973 0.940 0.838 0.856 0.903 0.833 0.933 0.925 0.916 0.908 0.917 0.866 0.963 0.902 0.843 0.962 0.900 0.83810 0.975 0.935 0.843 0.846 0.909 0.817 0.915 0.926 0.910 0.894 0.915 0.869 0.944 0.903 0.846 0.944 0.893 0.842
6656L
Liu
etal
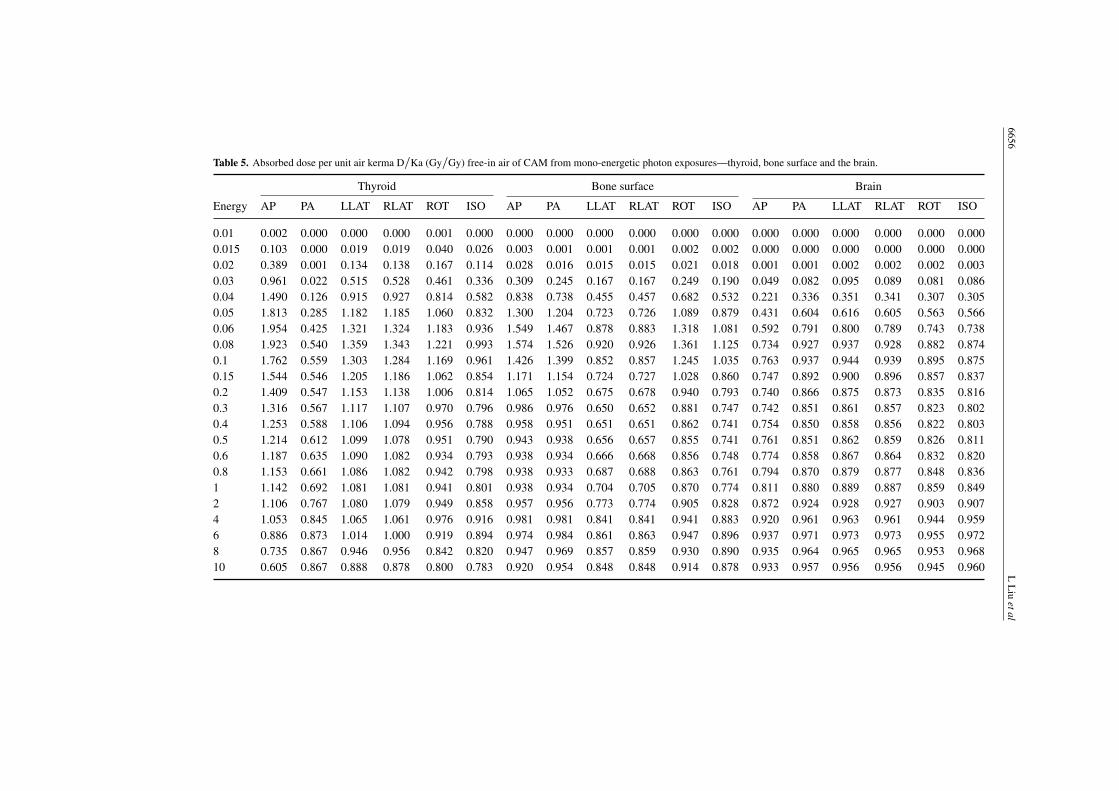
Table 5. Absorbed dose per unit air kerma D/Ka (Gy/Gy) free-in air of CAM from mono-energetic photon exposures—thyroid, bone surface and the brain.
Thyroid Bone surface Brain
Energy AP PA LLAT RLAT ROT ISO AP PA LLAT RLAT ROT ISO AP PA LLAT RLAT ROT ISO
0.01 0.002 0.000 0.000 0.000 0.001 0.000 0.000 0.000 0.000 0.000 0.000 0.000 0.000 0.000 0.000 0.000 0.000 0.0000.015 0.103 0.000 0.019 0.019 0.040 0.026 0.003 0.001 0.001 0.001 0.002 0.002 0.000 0.000 0.000 0.000 0.000 0.0000.02 0.389 0.001 0.134 0.138 0.167 0.114 0.028 0.016 0.015 0.015 0.021 0.018 0.001 0.001 0.002 0.002 0.002 0.0030.03 0.961 0.022 0.515 0.528 0.461 0.336 0.309 0.245 0.167 0.167 0.249 0.190 0.049 0.082 0.095 0.089 0.081 0.0860.04 1.490 0.126 0.915 0.927 0.814 0.582 0.838 0.738 0.455 0.457 0.682 0.532 0.221 0.336 0.351 0.341 0.307 0.3050.05 1.813 0.285 1.182 1.185 1.060 0.832 1.300 1.204 0.723 0.726 1.089 0.879 0.431 0.604 0.616 0.605 0.563 0.5660.06 1.954 0.425 1.321 1.324 1.183 0.936 1.549 1.467 0.878 0.883 1.318 1.081 0.592 0.791 0.800 0.789 0.743 0.7380.08 1.923 0.540 1.359 1.343 1.221 0.993 1.574 1.526 0.920 0.926 1.361 1.125 0.734 0.927 0.937 0.928 0.882 0.8740.1 1.762 0.559 1.303 1.284 1.169 0.961 1.426 1.399 0.852 0.857 1.245 1.035 0.763 0.937 0.944 0.939 0.895 0.8750.15 1.544 0.546 1.205 1.186 1.062 0.854 1.171 1.154 0.724 0.727 1.028 0.860 0.747 0.892 0.900 0.896 0.857 0.8370.2 1.409 0.547 1.153 1.138 1.006 0.814 1.065 1.052 0.675 0.678 0.940 0.793 0.740 0.866 0.875 0.873 0.835 0.8160.3 1.316 0.567 1.117 1.107 0.970 0.796 0.986 0.976 0.650 0.652 0.881 0.747 0.742 0.851 0.861 0.857 0.823 0.8020.4 1.253 0.588 1.106 1.094 0.956 0.788 0.958 0.951 0.651 0.651 0.862 0.741 0.754 0.850 0.858 0.856 0.822 0.8030.5 1.214 0.612 1.099 1.078 0.951 0.790 0.943 0.938 0.656 0.657 0.855 0.741 0.761 0.851 0.862 0.859 0.826 0.8110.6 1.187 0.635 1.090 1.082 0.934 0.793 0.938 0.934 0.666 0.668 0.856 0.748 0.774 0.858 0.867 0.864 0.832 0.8200.8 1.153 0.661 1.086 1.082 0.942 0.798 0.938 0.933 0.687 0.688 0.863 0.761 0.794 0.870 0.879 0.877 0.848 0.8361 1.142 0.692 1.081 1.081 0.941 0.801 0.938 0.934 0.704 0.705 0.870 0.774 0.811 0.880 0.889 0.887 0.859 0.8492 1.106 0.767 1.080 1.079 0.949 0.858 0.957 0.956 0.773 0.774 0.905 0.828 0.872 0.924 0.928 0.927 0.903 0.9074 1.053 0.845 1.065 1.061 0.976 0.916 0.981 0.981 0.841 0.841 0.941 0.883 0.920 0.961 0.963 0.961 0.944 0.9596 0.886 0.873 1.014 1.000 0.919 0.894 0.974 0.984 0.861 0.863 0.947 0.896 0.937 0.971 0.973 0.973 0.955 0.9728 0.735 0.867 0.946 0.956 0.842 0.820 0.947 0.969 0.857 0.859 0.930 0.890 0.935 0.964 0.965 0.965 0.953 0.96810 0.605 0.867 0.888 0.878 0.800 0.783 0.920 0.954 0.848 0.848 0.914 0.878 0.933 0.957 0.956 0.956 0.945 0.960
Organ
doseconversion
coefficientson
anIC
RP-based
CA
Mvoxelm
odel6657
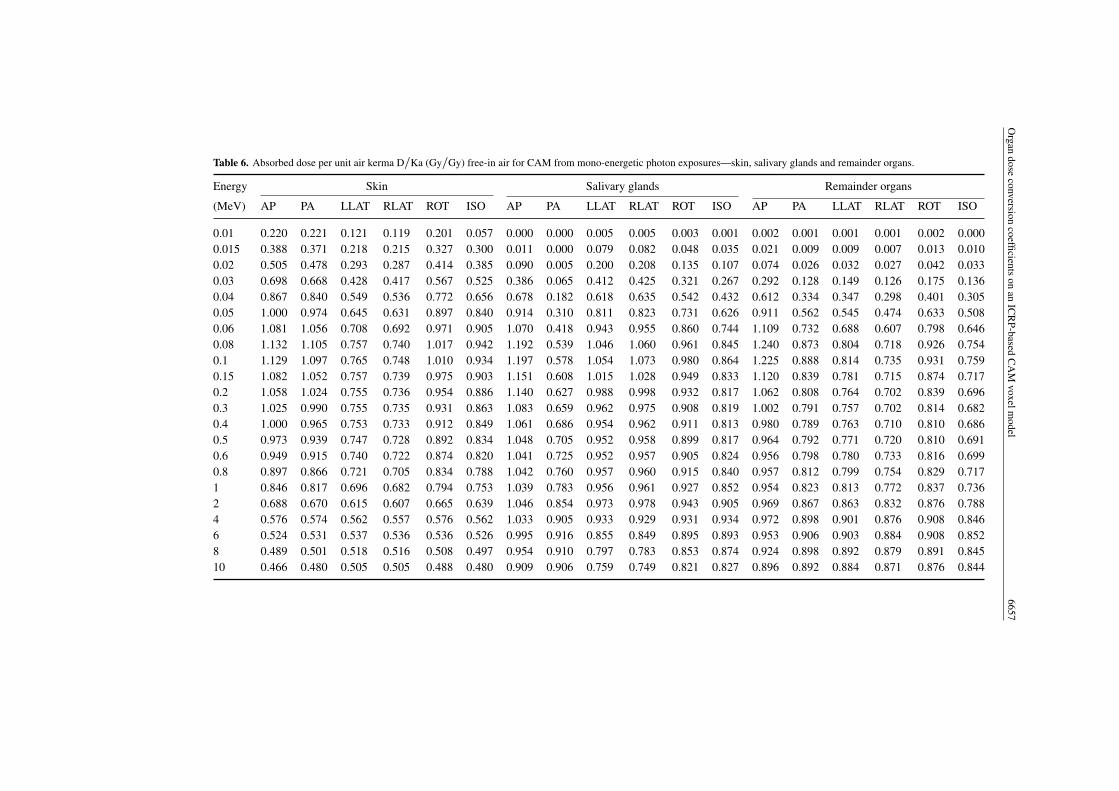
Table 6. Absorbed dose per unit air kerma D/Ka (Gy/Gy) free-in air for CAM from mono-energetic photon exposures—skin, salivary glands and remainder organs.
Energy Skin Salivary glands Remainder organs
(MeV) AP PA LLAT RLAT ROT ISO AP PA LLAT RLAT ROT ISO AP PA LLAT RLAT ROT ISO
0.01 0.220 0.221 0.121 0.119 0.201 0.057 0.000 0.000 0.005 0.005 0.003 0.001 0.002 0.001 0.001 0.001 0.002 0.0000.015 0.388 0.371 0.218 0.215 0.327 0.300 0.011 0.000 0.079 0.082 0.048 0.035 0.021 0.009 0.009 0.007 0.013 0.0100.02 0.505 0.478 0.293 0.287 0.414 0.385 0.090 0.005 0.200 0.208 0.135 0.107 0.074 0.026 0.032 0.027 0.042 0.0330.03 0.698 0.668 0.428 0.417 0.567 0.525 0.386 0.065 0.412 0.425 0.321 0.267 0.292 0.128 0.149 0.126 0.175 0.1360.04 0.867 0.840 0.549 0.536 0.772 0.656 0.678 0.182 0.618 0.635 0.542 0.432 0.612 0.334 0.347 0.298 0.401 0.3050.05 1.000 0.974 0.645 0.631 0.897 0.840 0.914 0.310 0.811 0.823 0.731 0.626 0.911 0.562 0.545 0.474 0.633 0.5080.06 1.081 1.056 0.708 0.692 0.971 0.905 1.070 0.418 0.943 0.955 0.860 0.744 1.109 0.732 0.688 0.607 0.798 0.6460.08 1.132 1.105 0.757 0.740 1.017 0.942 1.192 0.539 1.046 1.060 0.961 0.845 1.240 0.873 0.804 0.718 0.926 0.7540.1 1.129 1.097 0.765 0.748 1.010 0.934 1.197 0.578 1.054 1.073 0.980 0.864 1.225 0.888 0.814 0.735 0.931 0.7590.15 1.082 1.052 0.757 0.739 0.975 0.903 1.151 0.608 1.015 1.028 0.949 0.833 1.120 0.839 0.781 0.715 0.874 0.7170.2 1.058 1.024 0.755 0.736 0.954 0.886 1.140 0.627 0.988 0.998 0.932 0.817 1.062 0.808 0.764 0.702 0.839 0.6960.3 1.025 0.990 0.755 0.735 0.931 0.863 1.083 0.659 0.962 0.975 0.908 0.819 1.002 0.791 0.757 0.702 0.814 0.6820.4 1.000 0.965 0.753 0.733 0.912 0.849 1.061 0.686 0.954 0.962 0.911 0.813 0.980 0.789 0.763 0.710 0.810 0.6860.5 0.973 0.939 0.747 0.728 0.892 0.834 1.048 0.705 0.952 0.958 0.899 0.817 0.964 0.792 0.771 0.720 0.810 0.6910.6 0.949 0.915 0.740 0.722 0.874 0.820 1.041 0.725 0.952 0.957 0.905 0.824 0.956 0.798 0.780 0.733 0.816 0.6990.8 0.897 0.866 0.721 0.705 0.834 0.788 1.042 0.760 0.957 0.960 0.915 0.840 0.957 0.812 0.799 0.754 0.829 0.7171 0.846 0.817 0.696 0.682 0.794 0.753 1.039 0.783 0.956 0.961 0.927 0.852 0.954 0.823 0.813 0.772 0.837 0.7362 0.688 0.670 0.615 0.607 0.665 0.639 1.046 0.854 0.973 0.978 0.943 0.905 0.969 0.867 0.863 0.832 0.876 0.7884 0.576 0.574 0.562 0.557 0.576 0.562 1.033 0.905 0.933 0.929 0.931 0.934 0.972 0.898 0.901 0.876 0.908 0.8466 0.524 0.531 0.537 0.536 0.536 0.526 0.995 0.916 0.855 0.849 0.895 0.893 0.953 0.906 0.903 0.884 0.908 0.8528 0.489 0.501 0.518 0.516 0.508 0.497 0.954 0.910 0.797 0.783 0.853 0.874 0.924 0.898 0.892 0.879 0.891 0.84510 0.466 0.480 0.505 0.505 0.488 0.480 0.909 0.906 0.759 0.749 0.821 0.827 0.896 0.892 0.884 0.871 0.876 0.844

6658L
Liu
etal
Table 7. Absorbed dose per unit air kerma D/Ka (Gy/Gy) free-in air for CAM from mono-energetic photon exposures—adrenals, gallbladder and the heart.
Energy Adrenals Gall-bladder (wall) Heart (with blood)
(MeV) AP PA LLAT RLAT ROT ISO AP PA LLAT RLAT ROT ISO AP PA LLAT RLAT ROT ISO
0.01 0.000 0.000 0.000 0.000 0.000 0.000 0.000 0.000 0.000 0.000 0.000 0.000 0.000 0.000 0.000 0.000 0.000 0.0000.015 0.000 0.000 0.000 0.000 0.000 0.000 0.010 0.000 0.000 0.001 0.003 0.002 0.001 0.000 0.000 0.000 0.001 0.0000.02 0.000 0.001 0.000 0.000 0.001 0.000 0.068 0.000 0.000 0.018 0.023 0.017 0.025 0.001 0.009 0.003 0.011 0.0070.03 0.043 0.093 0.040 0.039 0.052 0.034 0.396 0.012 0.027 0.228 0.164 0.128 0.291 0.048 0.166 0.095 0.146 0.1050.04 0.230 0.368 0.179 0.183 0.220 0.161 0.831 0.098 0.143 0.588 0.403 0.306 0.737 0.233 0.468 0.318 0.409 0.3110.05 0.477 0.697 0.359 0.371 0.467 0.341 1.200 0.243 0.293 0.902 0.639 0.505 1.131 0.472 0.743 0.541 0.681 0.5400.06 0.685 0.940 0.506 0.526 0.644 0.482 1.423 0.378 0.418 1.103 0.800 0.640 1.370 0.658 0.917 0.696 0.870 0.6950.08 0.862 1.164 0.644 0.662 0.827 0.615 1.544 0.523 0.529 1.222 0.924 0.730 1.491 0.800 1.026 0.805 0.988 0.7940.1 0.888 1.180 0.669 0.687 0.846 0.643 1.488 0.560 0.554 1.201 0.918 0.734 1.426 0.819 1.011 0.812 0.972 0.7900.15 0.831 1.094 0.651 0.674 0.795 0.611 1.322 0.554 0.550 1.118 0.848 0.674 1.252 0.768 0.940 0.772 0.887 0.7190.2 0.797 1.035 0.641 0.663 0.766 0.594 1.243 0.551 0.557 1.064 0.808 0.652 1.148 0.738 0.912 0.765 0.846 0.6810.3 0.762 0.979 0.645 0.668 0.745 0.586 1.138 0.564 0.582 1.024 0.779 0.635 1.068 0.728 0.893 0.771 0.818 0.6670.4 0.756 0.956 0.659 0.681 0.739 0.591 1.097 0.582 0.606 1.006 0.780 0.635 1.034 0.735 0.892 0.782 0.806 0.6660.5 0.750 0.947 0.678 0.696 0.735 0.597 1.069 0.602 0.628 0.993 0.784 0.639 1.015 0.743 0.897 0.796 0.811 0.6690.6 0.756 0.935 0.695 0.711 0.743 0.607 1.044 0.621 0.647 0.993 0.786 0.651 1.001 0.751 0.903 0.809 0.811 0.6680.8 0.775 0.941 0.722 0.733 0.759 0.619 1.031 0.655 0.681 0.995 0.797 0.664 0.991 0.769 0.915 0.835 0.822 0.6931 0.780 0.933 0.743 0.763 0.768 0.652 1.020 0.675 0.707 0.991 0.798 0.682 0.982 0.785 0.923 0.847 0.834 0.7072 0.841 0.960 0.813 0.836 0.823 0.702 1.016 0.755 0.791 0.997 0.854 0.749 0.987 0.837 0.952 0.905 0.879 0.7764 0.875 0.965 0.876 0.891 0.877 0.795 1.011 0.822 0.857 1.006 0.898 0.814 1.001 0.883 0.975 0.940 0.919 0.8316 0.909 0.971 0.877 0.908 0.895 0.813 0.997 0.841 0.878 0.992 0.907 0.827 1.001 0.894 0.975 0.943 0.930 0.8598 0.905 0.963 0.891 0.891 0.906 0.819 0.967 0.846 0.879 0.962 0.898 0.822 0.986 0.892 0.963 0.937 0.925 0.85810 0.910 0.936 0.902 0.896 0.895 0.852 0.942 0.845 0.878 0.972 0.877 0.823 0.970 0.890 0.953 0.934 0.920 0.869
Organ
doseconversion
coefficientson
anIC
RP-based
CA
Mvoxelm
odel6659
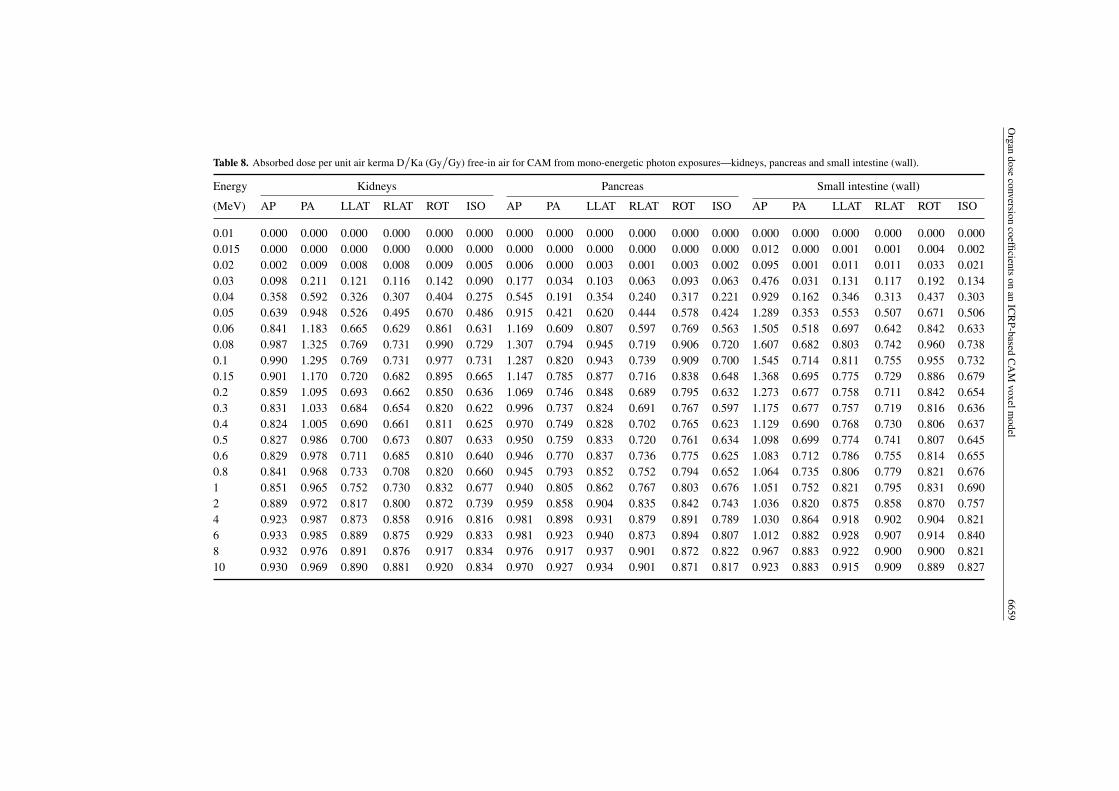
Table 8. Absorbed dose per unit air kerma D/Ka (Gy/Gy) free-in air for CAM from mono-energetic photon exposures—kidneys, pancreas and small intestine (wall).
Energy Kidneys Pancreas Small intestine (wall)
(MeV) AP PA LLAT RLAT ROT ISO AP PA LLAT RLAT ROT ISO AP PA LLAT RLAT ROT ISO
0.01 0.000 0.000 0.000 0.000 0.000 0.000 0.000 0.000 0.000 0.000 0.000 0.000 0.000 0.000 0.000 0.000 0.000 0.0000.015 0.000 0.000 0.000 0.000 0.000 0.000 0.000 0.000 0.000 0.000 0.000 0.000 0.012 0.000 0.001 0.001 0.004 0.0020.02 0.002 0.009 0.008 0.008 0.009 0.005 0.006 0.000 0.003 0.001 0.003 0.002 0.095 0.001 0.011 0.011 0.033 0.0210.03 0.098 0.211 0.121 0.116 0.142 0.090 0.177 0.034 0.103 0.063 0.093 0.063 0.476 0.031 0.131 0.117 0.192 0.1340.04 0.358 0.592 0.326 0.307 0.404 0.275 0.545 0.191 0.354 0.240 0.317 0.221 0.929 0.162 0.346 0.313 0.437 0.3030.05 0.639 0.948 0.526 0.495 0.670 0.486 0.915 0.421 0.620 0.444 0.578 0.424 1.289 0.353 0.553 0.507 0.671 0.5060.06 0.841 1.183 0.665 0.629 0.861 0.631 1.169 0.609 0.807 0.597 0.769 0.563 1.505 0.518 0.697 0.642 0.842 0.6330.08 0.987 1.325 0.769 0.731 0.990 0.729 1.307 0.794 0.945 0.719 0.906 0.720 1.607 0.682 0.803 0.742 0.960 0.7380.1 0.990 1.295 0.769 0.731 0.977 0.731 1.287 0.820 0.943 0.739 0.909 0.700 1.545 0.714 0.811 0.755 0.955 0.7320.15 0.901 1.170 0.720 0.682 0.895 0.665 1.147 0.785 0.877 0.716 0.838 0.648 1.368 0.695 0.775 0.729 0.886 0.6790.2 0.859 1.095 0.693 0.662 0.850 0.636 1.069 0.746 0.848 0.689 0.795 0.632 1.273 0.677 0.758 0.711 0.842 0.6540.3 0.831 1.033 0.684 0.654 0.820 0.622 0.996 0.737 0.824 0.691 0.767 0.597 1.175 0.677 0.757 0.719 0.816 0.6360.4 0.824 1.005 0.690 0.661 0.811 0.625 0.970 0.749 0.828 0.702 0.765 0.623 1.129 0.690 0.768 0.730 0.806 0.6370.5 0.827 0.986 0.700 0.673 0.807 0.633 0.950 0.759 0.833 0.720 0.761 0.634 1.098 0.699 0.774 0.741 0.807 0.6450.6 0.829 0.978 0.711 0.685 0.810 0.640 0.946 0.770 0.837 0.736 0.775 0.625 1.083 0.712 0.786 0.755 0.814 0.6550.8 0.841 0.968 0.733 0.708 0.820 0.660 0.945 0.793 0.852 0.752 0.794 0.652 1.064 0.735 0.806 0.779 0.821 0.6761 0.851 0.965 0.752 0.730 0.832 0.677 0.940 0.805 0.862 0.767 0.803 0.676 1.051 0.752 0.821 0.795 0.831 0.6902 0.889 0.972 0.817 0.800 0.872 0.739 0.959 0.858 0.904 0.835 0.842 0.743 1.036 0.820 0.875 0.858 0.870 0.7574 0.923 0.987 0.873 0.858 0.916 0.816 0.981 0.898 0.931 0.879 0.891 0.789 1.030 0.864 0.918 0.902 0.904 0.8216 0.933 0.985 0.889 0.875 0.929 0.833 0.981 0.923 0.940 0.873 0.894 0.807 1.012 0.882 0.928 0.907 0.914 0.8408 0.932 0.976 0.891 0.876 0.917 0.834 0.976 0.917 0.937 0.901 0.872 0.822 0.967 0.883 0.922 0.900 0.900 0.82110 0.930 0.969 0.890 0.881 0.920 0.834 0.970 0.927 0.934 0.901 0.871 0.817 0.923 0.883 0.915 0.909 0.889 0.827

6660L
Liu
etal
Table 9. Absorbed dose per unit air kerma D/Ka (Gy/Gy) free-in air for CAM from mono-energetic photon exposures—spleen, thymus and prostate.
Energy Spleen Thymus Prostate
(MeV) AP PA LLAT RLAT ROT ISO AP PA LLAT RLAT ROT ISO AP PA LLAT RLAT ROT ISO
0.01 0.000 0.000 0.000 0.000 0.000 0.000 0.000 0.000 0.000 0.000 0.000 0.000 0.000 0.000 0.000 0.000 0.000 0.0000.015 0.000 0.000 0.000 0.000 0.000 0.000 0.001 0.000 0.000 0.000 0.000 0.000 0.000 0.000 0.000 0.000 0.000 0.0000.02 0.001 0.005 0.020 0.000 0.007 0.004 0.029 0.000 0.002 0.001 0.010 0.008 0.000 0.003 0.000 0.000 0.001 0.0010.03 0.080 0.177 0.254 0.002 0.125 0.085 0.373 0.024 0.083 0.058 0.143 0.116 0.058 0.139 0.005 0.006 0.058 0.0470.04 0.328 0.554 0.632 0.031 0.372 0.275 0.845 0.152 0.278 0.219 0.382 0.316 0.294 0.460 0.050 0.059 0.233 0.1810.05 0.620 0.908 0.962 0.090 0.645 0.488 1.230 0.325 0.475 0.385 0.614 0.532 0.602 0.797 0.139 0.154 0.466 0.3680.06 0.820 1.155 1.157 0.156 0.832 0.643 1.457 0.470 0.614 0.512 0.783 0.683 0.844 1.029 0.235 0.253 0.629 0.5220.08 0.967 1.306 1.274 0.232 0.956 0.755 1.576 0.610 0.727 0.628 0.896 0.780 1.032 1.211 0.347 0.366 0.805 0.6390.1 0.952 1.283 1.228 0.255 0.940 0.736 1.510 0.637 0.749 0.649 0.905 0.793 1.056 1.215 0.379 0.393 0.828 0.6380.15 0.867 1.145 1.107 0.265 0.854 0.671 1.383 0.622 0.731 0.647 0.851 0.742 0.979 1.126 0.386 0.400 0.779 0.6350.2 0.819 1.071 1.045 0.274 0.802 0.643 1.297 0.620 0.727 0.646 0.825 0.733 0.948 1.068 0.392 0.396 0.748 0.5970.3 0.791 1.011 0.996 0.301 0.771 0.623 1.207 0.628 0.731 0.661 0.798 0.713 0.876 1.017 0.411 0.406 0.718 0.5990.4 0.785 0.982 0.975 0.328 0.759 0.628 1.162 0.639 0.745 0.682 0.799 0.727 0.857 0.990 0.438 0.430 0.727 0.5960.5 0.785 0.964 0.963 0.352 0.765 0.630 1.130 0.652 0.760 0.694 0.799 0.726 0.852 0.978 0.454 0.443 0.735 0.6120.6 0.785 0.960 0.959 0.376 0.772 0.643 1.114 0.672 0.771 0.710 0.804 0.740 0.848 0.966 0.474 0.466 0.737 0.6140.8 0.797 0.952 0.958 0.418 0.785 0.657 1.088 0.700 0.796 0.745 0.817 0.763 0.856 0.958 0.508 0.499 0.759 0.6511 0.803 0.948 0.961 0.455 0.792 0.673 1.080 0.718 0.815 0.761 0.830 0.768 0.859 0.958 0.539 0.524 0.772 0.6632 0.865 0.956 0.979 0.579 0.842 0.734 1.061 0.791 0.871 0.842 0.875 0.818 0.891 0.969 0.641 0.621 0.823 0.7434 0.909 0.975 0.993 0.681 0.881 0.805 1.052 0.846 0.908 0.892 0.906 0.866 0.930 0.979 0.736 0.725 0.880 0.8066 0.924 0.980 0.992 0.731 0.903 0.842 1.035 0.859 0.918 0.909 0.914 0.896 0.940 0.980 0.770 0.766 0.889 0.8198 0.912 0.974 0.988 0.736 0.896 0.844 1.036 0.863 0.920 0.911 0.908 0.880 0.920 0.972 0.772 0.805 0.882 0.85310 0.916 0.970 0.977 0.759 0.889 0.861 0.989 0.871 0.919 0.900 0.915 0.900 0.921 0.955 0.790 0.783 0.872 0.826
Organ
doseconversion
coefficientson
anIC
RP-based
CA
Mvoxelm
odel6661
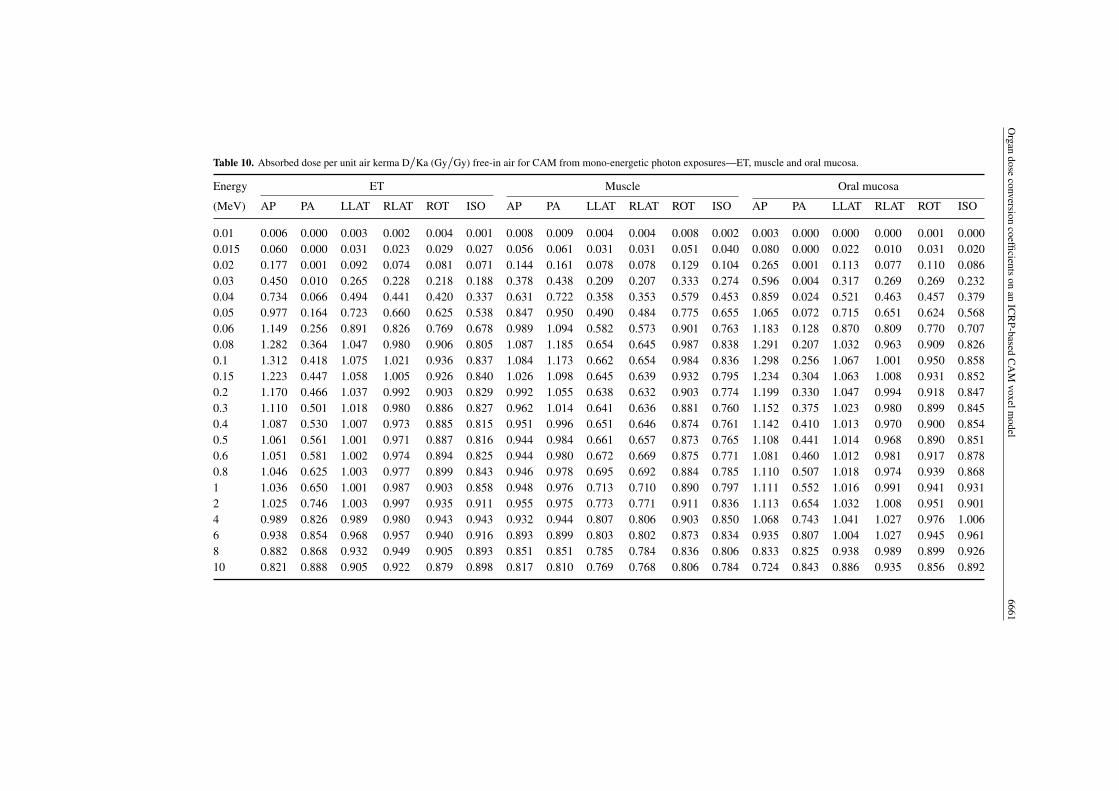
Table 10. Absorbed dose per unit air kerma D/Ka (Gy/Gy) free-in air for CAM from mono-energetic photon exposures—ET, muscle and oral mucosa.
Energy ET Muscle Oral mucosa
(MeV) AP PA LLAT RLAT ROT ISO AP PA LLAT RLAT ROT ISO AP PA LLAT RLAT ROT ISO
0.01 0.006 0.000 0.003 0.002 0.004 0.001 0.008 0.009 0.004 0.004 0.008 0.002 0.003 0.000 0.000 0.000 0.001 0.0000.015 0.060 0.000 0.031 0.023 0.029 0.027 0.056 0.061 0.031 0.031 0.051 0.040 0.080 0.000 0.022 0.010 0.031 0.0200.02 0.177 0.001 0.092 0.074 0.081 0.071 0.144 0.161 0.078 0.078 0.129 0.104 0.265 0.001 0.113 0.077 0.110 0.0860.03 0.450 0.010 0.265 0.228 0.218 0.188 0.378 0.438 0.209 0.207 0.333 0.274 0.596 0.004 0.317 0.269 0.269 0.2320.04 0.734 0.066 0.494 0.441 0.420 0.337 0.631 0.722 0.358 0.353 0.579 0.453 0.859 0.024 0.521 0.463 0.457 0.3790.05 0.977 0.164 0.723 0.660 0.625 0.538 0.847 0.950 0.490 0.484 0.775 0.655 1.065 0.072 0.715 0.651 0.624 0.5680.06 1.149 0.256 0.891 0.826 0.769 0.678 0.989 1.094 0.582 0.573 0.901 0.763 1.183 0.128 0.870 0.809 0.770 0.7070.08 1.282 0.364 1.047 0.980 0.906 0.805 1.087 1.185 0.654 0.645 0.987 0.838 1.291 0.207 1.032 0.963 0.909 0.8260.1 1.312 0.418 1.075 1.021 0.936 0.837 1.084 1.173 0.662 0.654 0.984 0.836 1.298 0.256 1.067 1.001 0.950 0.8580.15 1.223 0.447 1.058 1.005 0.926 0.840 1.026 1.098 0.645 0.639 0.932 0.795 1.234 0.304 1.063 1.008 0.931 0.8520.2 1.170 0.466 1.037 0.992 0.903 0.829 0.992 1.055 0.638 0.632 0.903 0.774 1.199 0.330 1.047 0.994 0.918 0.8470.3 1.110 0.501 1.018 0.980 0.886 0.827 0.962 1.014 0.641 0.636 0.881 0.760 1.152 0.375 1.023 0.980 0.899 0.8450.4 1.087 0.530 1.007 0.973 0.885 0.815 0.951 0.996 0.651 0.646 0.874 0.761 1.142 0.410 1.013 0.970 0.900 0.8540.5 1.061 0.561 1.001 0.971 0.887 0.816 0.944 0.984 0.661 0.657 0.873 0.765 1.108 0.441 1.014 0.968 0.890 0.8510.6 1.051 0.581 1.002 0.974 0.894 0.825 0.944 0.980 0.672 0.669 0.875 0.771 1.081 0.460 1.012 0.981 0.917 0.8780.8 1.046 0.625 1.003 0.977 0.899 0.843 0.946 0.978 0.695 0.692 0.884 0.785 1.110 0.507 1.018 0.974 0.939 0.8681 1.036 0.650 1.001 0.987 0.903 0.858 0.948 0.976 0.713 0.710 0.890 0.797 1.111 0.552 1.016 0.991 0.941 0.9312 1.025 0.746 1.003 0.997 0.935 0.911 0.955 0.975 0.773 0.771 0.911 0.836 1.113 0.654 1.032 1.008 0.951 0.9014 0.989 0.826 0.989 0.980 0.943 0.943 0.932 0.944 0.807 0.806 0.903 0.850 1.068 0.743 1.041 1.027 0.976 1.0066 0.938 0.854 0.968 0.957 0.940 0.916 0.893 0.899 0.803 0.802 0.873 0.834 0.935 0.807 1.004 1.027 0.945 0.9618 0.882 0.868 0.932 0.949 0.905 0.893 0.851 0.851 0.785 0.784 0.836 0.806 0.833 0.825 0.938 0.989 0.899 0.92610 0.821 0.888 0.905 0.922 0.879 0.898 0.817 0.810 0.769 0.768 0.806 0.784 0.724 0.843 0.886 0.935 0.856 0.892

6662L
Liu
etal
Table 11. Absorbed dose per unit air kerma D/Ka (Gy/Gy) free-in air for CAM from mono-energetic photon exposures—eye lens, ET1 and ET2.
Energy Eye lens ET1 ET2
(MeV) AP PA LLAT RLAT ROT ISO AP PA LLAT RLAT ROT ISO AP PA LLAT RLAT ROT ISO
0.01 0.016 0.000 0.000 0.000 0.005 0.001 0.037 0.000 0.021 0.014 0.021 0.007 0.001 0.000 0.000 0.000 0.000 0.0000.015 0.267 0.000 0.022 0.014 0.086 0.051 0.270 0.001 0.171 0.132 0.137 0.132 0.020 0.000 0.004 0.002 0.009 0.0070.02 0.596 0.002 0.123 0.101 0.213 0.148 0.568 0.002 0.414 0.345 0.287 0.281 0.102 0.000 0.031 0.022 0.041 0.0310.03 0.957 0.005 0.318 0.306 0.399 0.311 0.953 0.005 0.770 0.685 0.486 0.494 0.354 0.011 0.169 0.141 0.167 0.1290.04 1.186 0.018 0.489 0.466 0.554 0.404 1.171 0.024 0.965 0.883 0.674 0.631 0.650 0.075 0.404 0.357 0.371 0.2810.05 1.334 0.055 0.650 0.626 0.724 0.651 1.310 0.058 1.103 1.021 0.797 0.824 0.913 0.184 0.651 0.591 0.592 0.4830.06 1.458 0.114 0.756 0.736 0.823 0.750 1.389 0.096 1.183 1.116 0.869 0.890 1.103 0.287 0.835 0.770 0.750 0.6370.08 1.600 0.193 0.897 0.886 0.924 0.801 1.437 0.149 1.266 1.196 0.935 0.912 1.252 0.405 1.006 0.939 0.900 0.7030.1 1.511 0.214 0.938 0.889 0.918 0.890 1.422 0.189 1.274 1.225 0.940 0.979 1.291 0.462 1.037 0.982 0.935 0.8100.15 1.456 0.262 0.949 0.921 0.918 0.880 1.342 0.230 1.250 1.200 0.941 0.973 1.200 0.488 1.021 0.968 0.923 0.8140.2 1.299 0.294 0.936 0.923 0.861 0.851 1.254 0.256 1.232 1.184 0.922 0.944 1.154 0.506 0.999 0.956 0.900 0.8070.3 1.327 0.350 0.940 0.900 0.895 0.852 1.207 0.310 1.197 1.164 0.901 0.952 1.092 0.537 0.984 0.945 0.883 0.8020.4 1.254 0.401 0.946 0.921 0.934 0.855 1.184 0.356 1.186 1.163 0.915 0.939 1.069 0.564 0.973 0.936 0.880 0.7910.5 1.267 0.434 0.930 0.960 0.913 0.865 1.151 0.411 1.180 1.151 0.900 0.938 1.044 0.590 0.967 0.937 0.884 0.7930.6 1.194 0.461 0.913 0.941 0.893 0.852 1.141 0.426 1.163 1.147 0.916 0.942 1.034 0.611 0.971 0.941 0.890 0.8030.8 1.153 0.516 0.934 0.935 0.888 0.867 1.137 0.491 1.157 1.135 0.927 0.956 1.029 0.650 0.973 0.946 0.893 0.8221 1.156 0.545 0.942 0.945 0.872 0.787 1.116 0.534 1.150 1.120 0.920 0.963 1.021 0.673 0.973 0.962 0.900 0.8372 1.100 0.611 0.982 0.959 0.898 1.061 1.046 0.643 1.078 1.079 0.906 0.961 1.021 0.766 0.989 0.981 0.941 0.9014 0.817 0.772 1.021 1.044 0.824 1.157 0.801 0.744 0.918 0.950 0.831 0.872 1.026 0.842 1.003 0.986 0.965 0.9566 0.604 0.781 0.945 0.961 0.761 0.845 0.604 0.762 0.778 0.821 0.740 0.781 1.002 0.871 1.004 0.983 0.978 0.9428 0.462 0.821 0.860 0.792 0.715 0.826 0.477 0.797 0.671 0.718 0.653 0.709 0.959 0.881 0.981 0.993 0.954 0.92810 0.351 0.895 0.864 0.859 0.647 0.706 0.386 0.800 0.577 0.639 0.613 0.653 0.905 0.905 0.968 0.976 0.930 0.944
Organ dose conversion coefficients on an ICRP-based CAM voxel model 6663
conversion coefficients in this energy range were very small, and usually reported with largeuncertainties in the above models. Therefore, dose conversion coefficients for photons withenergy below 30 keV were excluded in the following comparisons.
3.3.1. Comparison of individual organ dose. Generally, dose coefficients for most organsfrom CAM agreed with those reported from Rex. The difference for more than 70% of allorgan dose data between CAM and Rex is less than 10%, while the difference for more than80% of all dose data is within 20%. Considering the height and weight of Chinese are smallerthan that of Caucasian, the dose coefficients from CAM are thus expected to be higher thanthose from Rex, especially for low energy photons and the lateral irradiation geometries, whichwill be discussed in detail in the following paragraphs.
Lateral irradiation geometries. Dose coefficients for stomach in RLAT and for liver in LLATirradiation geometries are shown in figures 4(a) and (b), respectively.
Firstly, it can be seen that dose coefficients from mathematical phantoms, i.e. CMP andICRP 74, are fairly lower than those from the voxel-based models. In the low energy range of30–150 keV, the doses to stomach and liver from CMP and ICRP 74 are approximately 60%lower than those from CAM. It is mainly attributed to the unrealistic description of humanbody in mathematical phantoms (Zankl et al 2002). Considering that stomach and liver areasymmetry organs located superficially in the left and right regions of body trunk respectively,the dose coefficients for these two organs irradiated from reverse lateral direction, i.e. RLATfor stomach and LLAT for liver, should be more dependent on the lateral thickness of trunk.As shown in figure 5, the body trunk together with two arms is described as an ellipticalcylinder in mathematical phantoms, which leads to a larger lateral thickness compared withthe real human body. For instance, the largest lateral thickness of trunk in CMP is 37 cm,while it is 29 cm in CAM (not including two arms). In addition, it is also found that the realposition of two arms in the voxel model (figure 3) is more likely to be shifted back rather thanthe ‘center’ position as in mathematical phantoms (figure 5). Therefore, arms in real body donot serve as a shield for those organs that locate superficially in the front side of the trunk,such as liver and stomach.
Secondly, it can also be observed that dose coefficients for stomach and liver from Asianvoxel models (i.e. CAM, HDRK-man and VCH) are higher than those from Caucasian voxelmodels (i.e. Rex and VIP-man). As shown in figure 4, the dose coefficients from Rex are 45%and 55% lower than those from CAM for stomach and liver, respectively. This can be under-stood by noticing the fact that Caucasians have higher height and heavier weight than Asians,which results in larger lateral shielding thickness in Caucasian models than in Asian models.
Lungs are pair organs located symmetrically in both sides of human body. Comparisonsof dose coefficient for lungs in LAT irradiation geometry are given in figure 6. A differentphenomenon is observed for lungs from that for stomach and liver. The dose to lungs in LATgeometry from CAM, HDRK-man, CMP and ICRP 74 are approximate, but obviously largerthan those from Rex, VCH and VIP-man. This observation is different from that reported byLee et al (2006a) and Zankl et al (2002), where they were apt to conclude that dose coefficientsfor lungs in LAT geometry from mathematical models were usually higher than those fromvoxel models.
One slice of lungs in CMP and CAM models is shown in figure 7. It is clear that armsin the voxel model are larger than those in mathematical phantoms, thus the bottom partsof lungs are more shielded in voxel models than in mathematical phantoms. However, thiscan be compensated by the previously mentioned fact that the front parts of lungs are lessshielded in voxel models than in mathematical phantoms. Therefore, it is reasonable that the

6664 L Liu et al
(a)
(b)
Figure 4. Absorbed dose per unit air kerma (Gy/Gy) for the stomach in RLAT (a) and liver inLLAT (b) geometries, respectively.
dose to lungs from some voxel models (CAM and HDRK-man) is approximate to that frommathematical phantoms. For VCH and Rex, the lungs dose is fairly lower than those fromCAM and HDRK-man. This is attributed to the fact that the effect of arms shielding in VCHand Rex is greater than that in CAM and HDRK-man. It seems that the arms of VCH arelarger and placed not so ‘back’ as CAM and HDRK-man, if comparing the 3D view pictureof individual voxel models (Zhang et al 2008, Kim et al 2008). Therefore, it is difficult tomake a simple conclusion for the influence of arms shielding on the lungs dose due to the largevariability of arms positions and their dimensions among different individuals.

Organ dose conversion coefficients on an ICRP-based CAM voxel model 6665
Figure 5. Transversal slices at the centre of the liver in CMP (top) and CAM (bottom).
Figure 6. Comparison of absorbed dose per unit air kerma (Gy/Gy) for lungs in LAT geometry.
AP and PA irradiation geometries. Since most organs are located toward the front sideof the human body, the organ dose discrepancy among individual models in AP and PAirradiation geometries (without the influence of arms shielding) is smaller than that in lateralirradiation geometries. As shown in figure 7, the unrealistic description of the body trunk

6666 L Liu et al
Figure 7. Transversal slices at the center of the lung in the mathematical model CMP (top) andthe voxel model CAM (bottom).
in the mathematical phantoms leads to a shorter front-to-back distance compared with thevoxel models. Therefore, the dose coefficients in AP and PA geometries from mathematicalphantoms are to some extent higher than those from voxel models.
Figure 8 is the comparison of stomach dose in AP geometry among different models. Itcan be seen that the dose coefficients to stomach from CMP and ICRP 74 are higher thanthose from voxel models. Apart from the reason for the short front-to-back distance discussedabove, the deeper location of the stomach in voxel models also leads to a lower dose to stomach(figure 5).
ROT and ISO geometries. The ROT and ISO geometries are to some extent the combinations ofother four idealized geometries. In contrast to the large dose discrepancy in lateral geometries,smaller differences within 15% were usually observed for most organs in ROT and ISOgeometries between CAM and other models, though a relatively large discrepancy can beobserved for small and superficial organs. For example, the dose to thyroid in Rex is −25%lower than that in CAM for ROT geometry in the low energy range (30–150 keV).
3.3.2. Comparison of effective male dose. Although the concept of effective dose is definedfor the ICRP reference person (adult male and female), the old and new ‘effective male doses’

Organ dose conversion coefficients on an ICRP-based CAM voxel model 6667
Figure 8. Comparison of absorbed dose per unit air kerma (Gy/Gy) for the stomach in APgeometry.
of CAM and Rex were calculated for comparison purposes, by using the tissue weightingfactors from ICRP 60 and 103 Publications, respectively.
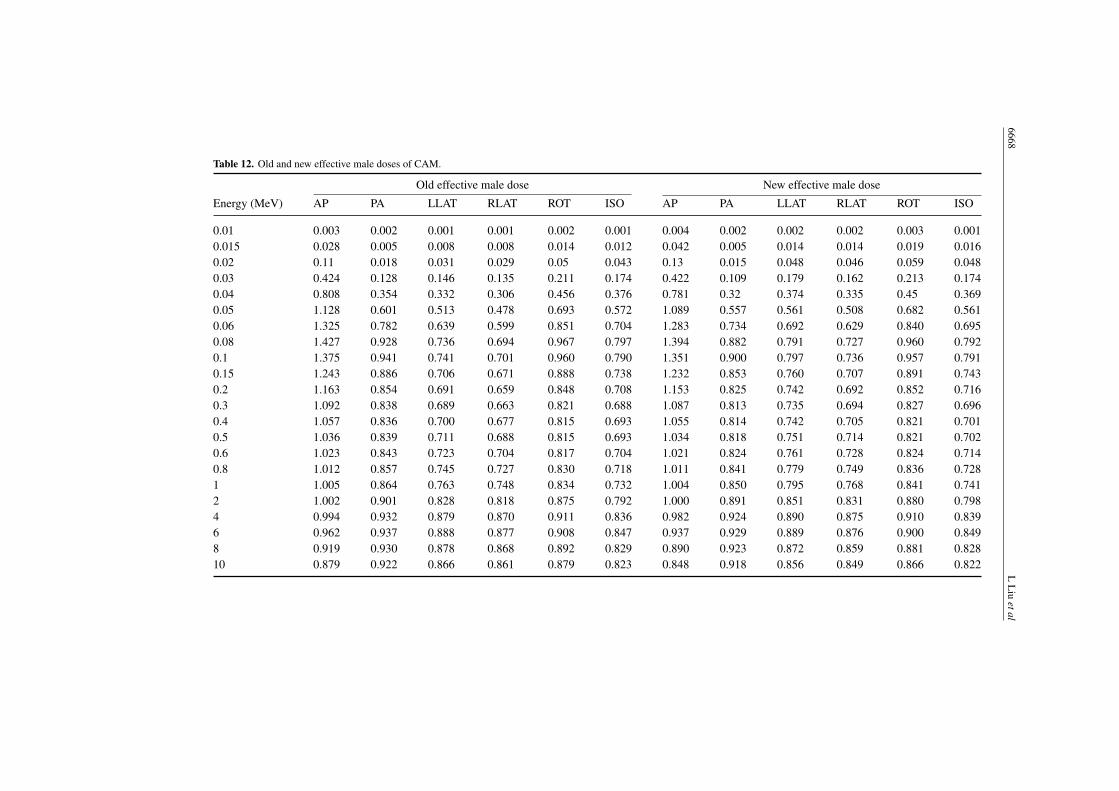
The old and new effective male dose coefficients of CAM are given in table 12 and showngraphically in figure 9. There is very small difference between old and new values for AP,ROT and ISO geometries. For PA geometry, new effective male dose is slightly lower thanthe old one. However, for lateral irradiation geometries, new effective male dose is obviouslyhigher than the old one. These phenomena can also be observed in Rex if comparing its oldand new effective male doses.
The effective male dose of Rex is almost identical to that of CAM for photons energiesabove 2 MeV in AP, PA, ROT and ISO geometries, where the difference is within 3%. Forlateral geometries, effective male dose of Rex is generally −5% lower that of CAM forphotons energies above 2 MeV (e.g. −8% at 2 MeV, −5% at 6 MeV, −2% at 10 MeVin LLAT geometry). The differences of effective male dose between Rex and CAM in themoderate energy range (200 keV–1 MeV) and low energy range (30–150 keV) are shown infigure 10. In the moderate energy range, the difference of new male effective dose between Rexand CAM is negletable in AP (equal), PA (−2%), ROT (−3%) and ISO (−3%) geometries.Larger discrepancy can be observed in LLAT (−13%) and RLAT (−17%) geometries. In thelow energy range, new effective male dose of Rex is almost identical to that of CAM in APgeometry (within 1%), but slightly lower than that of CAM in PA (−8%), ROT (−5%) andISO (−6%) geometries. A relatively large discrepancy is shown in lateral geometries, wherethe differences are −17% (e.g. −15% at 30 keV, −18% at 60 keV, −16% at 150 keV) forLLAT and −23% (e.g. −24% at 30 keV, −24% at 60 keV, −21% at 150 keV) for RLAT,respectively.
In addition, smaller differences between CAM and Rex can be observed in the low energyrange for the new effective male dose than that for the old one (figure 10(a)). This maybe attributed to the fact that tissue weighting factors for some small organs are reduced in
6668L
Liu
etal
Table 12. Old and new effective male doses of CAM.
Old effective male dose New effective male dose
Energy (MeV) AP PA LLAT RLAT ROT ISO AP PA LLAT RLAT ROT ISO
0.01 0.003 0.002 0.001 0.001 0.002 0.001 0.004 0.002 0.002 0.002 0.003 0.0010.015 0.028 0.005 0.008 0.008 0.014 0.012 0.042 0.005 0.014 0.014 0.019 0.0160.02 0.11 0.018 0.031 0.029 0.05 0.043 0.13 0.015 0.048 0.046 0.059 0.0480.03 0.424 0.128 0.146 0.135 0.211 0.174 0.422 0.109 0.179 0.162 0.213 0.1740.04 0.808 0.354 0.332 0.306 0.456 0.376 0.781 0.32 0.374 0.335 0.45 0.3690.05 1.128 0.601 0.513 0.478 0.693 0.572 1.089 0.557 0.561 0.508 0.682 0.5610.06 1.325 0.782 0.639 0.599 0.851 0.704 1.283 0.734 0.692 0.629 0.840 0.6950.08 1.427 0.928 0.736 0.694 0.967 0.797 1.394 0.882 0.791 0.727 0.960 0.7920.1 1.375 0.941 0.741 0.701 0.960 0.790 1.351 0.900 0.797 0.736 0.957 0.7910.15 1.243 0.886 0.706 0.671 0.888 0.738 1.232 0.853 0.760 0.707 0.891 0.7430.2 1.163 0.854 0.691 0.659 0.848 0.708 1.153 0.825 0.742 0.692 0.852 0.7160.3 1.092 0.838 0.689 0.663 0.821 0.688 1.087 0.813 0.735 0.694 0.827 0.6960.4 1.057 0.836 0.700 0.677 0.815 0.693 1.055 0.814 0.742 0.705 0.821 0.7010.5 1.036 0.839 0.711 0.688 0.815 0.693 1.034 0.818 0.751 0.714 0.821 0.7020.6 1.023 0.843 0.723 0.704 0.817 0.704 1.021 0.824 0.761 0.728 0.824 0.7140.8 1.012 0.857 0.745 0.727 0.830 0.718 1.011 0.841 0.779 0.749 0.836 0.7281 1.005 0.864 0.763 0.748 0.834 0.732 1.004 0.850 0.795 0.768 0.841 0.7412 1.002 0.901 0.828 0.818 0.875 0.792 1.000 0.891 0.851 0.831 0.880 0.7984 0.994 0.932 0.879 0.870 0.911 0.836 0.982 0.924 0.890 0.875 0.910 0.8396 0.962 0.937 0.888 0.877 0.908 0.847 0.937 0.929 0.889 0.876 0.900 0.8498 0.919 0.930 0.878 0.868 0.892 0.829 0.890 0.923 0.872 0.859 0.881 0.82810 0.879 0.922 0.866 0.861 0.879 0.823 0.848 0.918 0.856 0.849 0.866 0.822

Organ dose conversion coefficients on an ICRP-based CAM voxel model 6669
Figure 9. Comparisons of new and old effective male dose in CAM.
(a) (b)
Figure 10. Differences of effective male dose between CAM and Rex in the low energy range of30–150 keV (a) and the moderate energy range of 200 keV–1 MeV (b).
ICRP 103 compared with those in ICRP 60 Publication. For instance, the tissue weightingfactor is reduced from 0.2 to 0.08 for testes, for which large discrepancy of dose coefficientsis usually presented among individual models.
4. Conclusions
In this study, a high-resolution whole-body voxel model called CAM, representing CAM, hasbeen constructed based on a previous Chinese individual voxel model. The CAM model hasa height of 170 cm and a weight of 60.6 kg with more than 80 organs and tissues. Massesof almost all organs in CAM are consistent with the Chinese reference data within 6%. Dose

6670 L Liu et al
coefficients for various organs in CAM were calculated by using Monte Carlo simulation, andwere then compared with those from other models, i.e. CMP, ICRP 74, Rex, VCH, HDRKmanand VIP-man.
In conclusion, the study can be summarized as the following points.
(1) With respect to the dosimetric difference between mathematical and voxel models, a largediscrepancy of organ dose can be observed in lateral irradiation geometries. It is mainlyattributed to the unrealistic description of body trunk and wrong ‘center’ position ofarms in mathematical phantoms. Generally, for these organs that are located superficiallytoward the front side of real human body and not shielded by arms, such as stomachand liver, the dose coefficients from mathematical models are obviously lower than thosefrom voxel models. However, it is difficult to make a simple conclusion for lungs dosediscrepancy between mathematical and voxel models, because lungs are partly shieldedby arms in real human body as that in mathematical models.
(2) With regard to the difference in organ doses between Asian and Caucasian models, sincethe height and weight of Asians are smaller than of Caucasians, it is expected to be foundthat dose coefficients from Asian models are usually higher than those from Caucasians,especially in the lateral irradiation geometries.
(3) Comparison of old and new effective male doses of CAM shows that the new dose is nearto the old one for AP, ROT and ISO geometries. For PA geometry, the new effective maledose is slightly lower than the old one. However, for lateral irradiation geometries, neweffective male dose of CAM is obviously higher than the old one.
(4) The new effective male dose of CAM is almost identical to that of Rex in AP, PA, ROTand ISO geometries for photon energies above 200 keV. In low energy from 30 keV to 150keV, the new effective male dose of Rex is slightly lower than that of CAM in PA (−8%),ROT (−5%) and ISO (−6%) geometries, and large discrepancy of −17% and −23% canbe observed in LLAT and RLAT geometries, respectively. Moreover, it is also found thatthe difference between CAM and Rex is smaller for the new effective male dose than forthe old one.
Acknowledgment
This work was supported by the Chinese National Science Foundation Project (10775084).
References
Becker J, Zankl M and Petoussi-Henss N 2007 A software tool for modification of human voxel models used forapplication in radiation protection Phys. Med. Biol. 52 N195–205
Biju K and Nagarajan P S 2000 Computed normalized effective doses to an Indian adult in conventional diagnosticx ray chest examinations Radiat. Prot. Dosim. 88 119–28
Bouchet L G, Bolch W E, Blanco H P, Wessels B W, Siegel J A, Rajon D A, Clairand I and Sgouros G 2003 MIRDpamphlet no 19: absorbed fractions and radionuclide S values for six age-dependent multi region models of thekidney J. Nucl. Med. 44 1113–47
Cristy M and Eckerman K F 1987 Specific Absorbed Fractions of Energy at Various Ages from Internal PhotonSources: I. Methods Report No ORNL/TM-8381/VI (Oak Ridge, TN: Oak Ridge National Laboratory)
Deloar H, Watabe H, Nakamura T, Narita Y, Yamadera A, Fujiwara T and Itoh M 1997 Internal dose estimationincluding the nasal cavity and major airway for continuous inhalation of C15O2
15O2 and C15O using thethermoluminescent dosimeter method J. Nucl. Med. 38 1603–13
Dimbylow P J 1995 The development of realistic voxel phantoms for electromagnetic field dosimetry Proc. Int.Workshop on Voxel Phantom Development (Chilton, UK)

Organ dose conversion coefficients on an ICRP-based CAM voxel model 6671
Dimbylow P J 1997 FDTD calculations of the whole-body averaged SAR in an anatomically realistic voxel model ofthe human body from 1 MHz to 1 GHz Phys. Med. Biol. 42 479–90
Dimbylow P J 2005 Development of the female voxel phantom, NAOMI, and its application to calculations ofinduced current densities and electric fields from applied low frequency magnetic and electric fields Phys. Med.Biol 50 1047–70
Fan J J 2002 Study on the dose assessment for internal radiation during nuclear imaging Master Thesis TsinghuaUniversity, Beijing, People’s Republic of China (in Chinese)
GBZ 2007 Reference Individuals for Use in Radiation Protection: Part 2. Masses of Main Organs and Tissues GBZ/T200.2-2007 (Beijing: People’s Medical Publishing House) (in Chinese)
Gibbs S J, Pujol A, Chen T S and Malcolm A W 1984 Computer-simulation of patient dose from dental radiographyJ. Dental Res. 63 209
IAEA 1998 Compilation of Anatomical, Physiological and Metabolic Characteristics for a Reference Asian ManVolume 1: Data Summary and Conclusions IAEA-TECDOC-1005 (Vienna: International Atomic EnergyAgency)
ICRP 1995 Basic Anatomical and Physiological Data for Use in Radiological Protection: the Skeleton ICRPPublication 70 (Oxford: Pergamon)
ICRP 1996 Conversion Coefficients for Use in Radiological Protection Against External Radiation ICRP Publication74 (Oxford: Pergamon)
ICRP 2002 Basic Anatomical and Physiological Data for Use in Radiological Protection: Reference Values ICRPPublication 89 (Oxford: Pergamon)
ICRP 2007 The 2007 Recommendations of the International Commission on Radiological Protection ICRPPublication 103 (Oxford: Pergamon)
ICRU 1992 Photon, Electron, Proton and Neutron Interaction Data for Body Tissues ICRU Report 46 (Bethesda,MD: International Commission on Radiation Units and Measurements)
Kim C H, Choi S H, Jeong J H, Lee C and Chung M S 2008 HDRK-Man: a whole-body voxel model based onhigh-resolution color slice images of a Korean adult male cadaver Phys. Med. Biol. 53 4093–106
Kramer R, Khoury H J and Vieira J W 2005 Comparison between effective doses for voxel-based and stylizedexposure models from photon and electron irradiation Phys. Med. Biol. 50 5105–26
Kramer R, Khoury H J, Vieira J W and Kawrakow I 2006a Skeletal dosimetry in the MAX06 and the FAX06 phantomsfor external exposure to photons based on vertebral 3D-microCT images Phys. Med. Biol. 51 6265–89
Kramer R, Khoury H J, Vieira J W and Kawrkow I 2007 Skeletal dosimetry for external exposure to photons basedon μCT images of spongiosa from different bone sites Phys. Med. Biol. 52 6697–716
Kramer R, Khoury H J, Vieira J W and Lima V J M 2006b MAX06 and FAX06: Update of two adult human phantomsfor radiation protection dosimetry Phys. Med. Biol. 51 3331–46
Kramer R, Khoury H J, Vieira J W, Loureiro E C M, Lima V J M, Lima F R A and Hoff G 2004a All aboutFAX: a female adult voxel phantom for Monte Carlo calculation in radiation protection dosimetry Phys. Med.Biol. 49 5203–16
Kramer R, Vieira J W, Khoury H J and Lima F R A 2004b MAX meets ADAM: a dosimetric comparison between avoxel-based and a mathematical model for external exposures to photons Phys. Med. Biol. 49 887–910
Kramer R, Vieira J W, Khoury H J, Lima F R A and Fuelle D 2003 All about MAX: a male adult voxel phantom forMonte Carlo calculations in radiation protection dosimetry Phys. Med. Biol. 48 1239–62
Kramer R, Zankl M, Williams G and Drexler G 1982 The Calculation of Dose from External Photon Exposures usingReference Human Phantoms and Monte-Carlo Methods: Part I. The Male (ADAM) and Female (EVA) AdultMathematical Phantoms GSF-Bericht S-885 (Neuherberg: GSF-National Research Center for Environment andHealth)
Lee C, Lee C and Lee J K 2006a On the need to revise the arm structure in stylized anthropomorphic phantoms inlateral photon irradiation geometry Phys. Med. Biol. 51 N393–402
Lee C, Lee C, Park S and Lee J 2006b Development of the two Korean adult tomographic computational phantomsfor organ dosimetry Med. Phys. 33 380–90
Lee C, Lee J and Lee C 2004 Korean adult male voxel model KORMAN segmented from magnetic resonance imagesMed. Phys. 31 1017–22
Lee C and Lee J K 2006 Computational anthropomorphic phantoms for radiation protection dosimetry: evolution andprospects Nucl. Eng. Technol. 38 239–50
Liu L Y, Zeng Z, Li J L, Zhang B Q, Qiu R and Ma J Z 2009 An ICRP-based Chinese adult male voxel model andits absorbed dose for idealized photon exposures—the skeleton Phys. Med. Biol. 54 6675–90
Nagaoka T, Watanabe S, Sakurai K, Kunieda E, Watanabe S, Taki M and Yamanaka Y 2004 Development of realistichigh-resolution whole-body voxel models of Japanese adult males and females of average height and weight,and application of models to radio-frequency electromagnetic field dosimetry Phys. Med. Biol. 49 1–15

6672 L Liu et al
Paganetti H 2004 Four-dimensional Monte Carlo simulation of time dependent geometries Phys. Med.Biol. 49 N75–81
Park S, Lee J and Lee C 2006 Development of a Korean adult male computational phantom for internal dosimetrycalculation Radiat. Prot. Dosim. 121 257–64
Park S, Lee J K, Lee C and Lee C 2008 Dosimetry calculations for internal electron sources using a Korean referenceadult stylised phantom Radiat. Prot. Dosim. 130 186–205
Petoussi-Henss N, Zankl M, Fill U and Regulla D 2002 The GSF family of voxel phantoms Phys. Med. Biol. 47 89–106Poston J W, Kodimer K A and Bolch W E 1996 A revised model for the calculation of absorbed energy in the
gastrointestinal tract Health Phys. 71 307–14Qiu R, Li J L, Zhang Z, Liu L Y, Bi L and Ren L 2009 Dose conversion coefficients based on the Chinese mathematical
phantom and MCNP code for external photon irradiation Radiat. Prot. Dosim 134 3–12Qiu R, Li J L, Zhang Z, Wu Z, Zeng Z and Fan J J 2008 Photon SAF calculation based on the chinese mathematical
phantom and comparison with the ORNL phantoms Health Phys. 95 716–25Saito K, Wittmann A, Koga S, Ida Y, Kamei T, Funabiki J and Zankl M 2001 Construction of a computed tomographic
phantom for a Japanese male adult and dose calculation system Radiat. Environ. Biophys. 40 69–76Sato K, Noguchi H, Emoto Y, Koga S and Saito K 2007 Japanese adult male voxel phantom constructed on the basis
of CT images Radiat. Prot. Dosim. 123 337–44Schlattl H, Zankl M and Petoussi-Henss N 2007 Organ dose conversion coefficients for voxel models of the reference
male and female from idealized photon exposures Phys. Med. Biol. 52 2123–45Segars W P 2001 Development and application of the new dynamic NURBS-based cardiac torso (NCAT) phantom
PhD Thesis University of North Carolina, Chapel HillSegars W P, Tsui B M, Frey E C, Johnson G A and Berr S S 2004 Development of a 4-D digital mouse phantom for
molecular imaging research Mol. Imaging Biol. 6 149–59Shi C Y and Xu X G 2004 Development of a 30-week-pregnant female tomographic model from computed tomography
(CT) images for Monte Carlo organ dose calculations Med. Phys. 31 2491–7Snyder W S, Ford M R and Warner G G 1978 Estimates of Specific Absorbed Fractions for Photon Sources Uniformly
Distributed in Various Organs of a Heterogeneous Phantom. MIRD Pamphlet No 5 (revised) (New York: TheSociety of Nuclear Medicine)
Snyder W S, Ford M R, Warner G G and Fisher H L 1969 Estimates of absorbed fractions for monoenergetic photonsources uniformly distributed in various organs of a heterogeneous phantom J. Nucl. Med. 10 (Suppl. 3) 5–52
Tanaka G, Kawamura H, Griffith R V, Cristy M and Eckerman K F 1998 Reference man models for males and femalesof six age groups of Asian populations Radiat. Prot. Dosim. 79 383–6
Wang J X, Chen R S, Zhu H D, Zhou Y Z and Ma R W 1998 Data of Anatomical Physiological and MetabolicCharacteristics for Chinese Reference Man (Beijing: Atomic Energy Press) (in Chinese)
Xu X G, Chao T C and Bozkurt A 2000 VIP-Man: an image-based whole-body adult male model constructedfrom color photographs of the Visible Human Project for multi-particle Monte Carlo calculations HealthPhys. 78 476–86
Zaidi H and Xu X G 2007 Computational anthropomorphic models of the human anatomy: the path to realistic MonteCarlo modeling in radiological sciences Annu. Rev. Biomed. Eng. 9 1.1–1.30
Zankl M, Drexler G, Petoussi-Henss N and Saito K 1997 The Calculation of Dose from External Photon ExposuresUsing Reference Human Phantoms and Monte Carlo Methods: Part VII. Organ Doses due to Parallel andEnvironmental Exposure Geometries GSF-Bericht 8/79 (Neuherberg: GSF-National Research Center forEnvironment and Health)
Zankl M, Fill U, Petoussi-Henss N and Regulla D 2002 Organ dose conversion coefficients for external photonirradiation of male and female voxel models Phys. Med. Biol. 47 2367–85
Zankl M, Veit R, Williams G, Schneider K, Fendel H, Petoussi N and Drexler G 1988 The construction ofcomputer tomographic phantoms and their application in radiology and radiation protection Radiat. Environ.Biophys. 27 153–64
Zankl M and Wittmann A 2001 The adult male voxel model ‘Golem’ segmented from whole-body CT patient dataRadiat. Environ. Biophys. 40 153–62
Zeng Z, Li J L, Qiu R and Jia X H 2006 Dose assessment for space radiation using a proton differential dose spectrumJ. Tsinghua Univ. (Sci. Technol.) 46 374–76 (in Chinese)
Zhang B Q, Ma J Z and Liu L Y 2005 Conversion coefficients for external radiation in a Chinese voxel phantomcalculated using Monte Carlo method Proc. of the 3rd Int. Symp. on Radiation Safety and Detection Technology(Taiyuan, China)

Organ dose conversion coefficients on an ICRP-based CAM voxel model 6673
Zhang B Q, Ma J Z, Liu L Y and Cheng J P 2007a CNMAN: a Chinese adult male voxel phantom constructed fromcolor photographs of a visible anatomical data set Radiat. Prot. Dosim. 124 130–6
Zhang G Z, LIU Q and LUO Q M 2007b Monte Carlo simulations for external neutron dosimetry based on the visibleChinese human phantom Phys. Med. Biol. 52 7367–83
Zhang G Z, LUO Q M, Zeng S Q and Liu Q 2008 The development and application of the visible Chinese humanmodel for Monte Carlo dose calculations Health Phys. 94 118–25
Zubal I G, Harrell C R, Smith E O, Rattner Z, Gindi G and Hoffer P B 1994 Computerized 3-dimensional segmentedhuman anatomy Med. Phys. 21 299–302
Copyright © 2022 FDOKUMEN