Optimisation of Reaction Conditions for the Synthesis of Single–Walled Carbon Nanotubes Using...
17
Optimisation of Reaction Conditions for the Synthesis of Single–Walled Carbon Nanotubes Using Response Surface Methodology Wei-Wen Liu, 1 Azizan Aziz, 1 * Siang-Piao Chai, 2 Abdul Rahman Mohamed 3 and Ching-Thian Tye 3 1. School of Materials and Mineral Resources Engineering, Engineering Campus, Universiti Sains Malaysia, 14300 Nibong Tebal, Seberang Perai Selatan, P. Pinang Malaysia 2. School of Engineering, Monash University, Jalan Lagoon Selatan, 46150 Bandar Sunway, Selangor, Malaysia 3. School of Chemical Engineering, Engineering Campus, Universiti Sains Malaysia, 14300 Nibong Tebal, Seberang Perai Selatan, P. Pinang, Malaysia The effects of three preparation variables, i.e. reaction temperature, reaction time and reaction gas (methane/nitrogen) flow rate, on the ratio of the intensity of the Raman D band to the intensity of the G band (I D /I G ), carbon mass and the presence of radial breathing mode (RBM) peaks were investigated by using a central composite design to develop two linear models. The most influential factor in each experimental design- response was identified using the analysis of variance. The predicted I D /I G ratio, carbon mass and presence of RBM peaks determined during the process optimisation were found to agree satisfactorily with the experimental values. The optimum conditions for synthesising single-walled carbon nanotubes were determined to be a reaction temperature of 900 ◦ C, a reaction time of 59 min and a reaction gas flow rate of 54 mL/min. Keywords: central composite design, optimisation, electron microscopy, carbon nanotubes, response surface methodology INTRODUCTION C arbon nanotubes (CNTs) are a new type of carbon nanoma- terials which have been studied by many researchers and attracted much interest due to their unique chemical and physical properties (Iijima, 1991; Popov, 2004; Terrones, 2004) making them excellent materials for future application in elec- tronic, material science and medicine (Baughman et al., 2002; Robertson, 2004). The chemical vapour deposition (CVD) method has been regarded as one of the most promising methods for large- scale production of CNTs with a high degree of structure and property control due to its low cost (Guo et al., 1995) compared to the arc discharge (Iijima, 1991) and laser ablation (Cheng et al., 1998) methods. For this reason, CVD has been used in this work. Methane, which has a simple composition and is chemically sta- ble than the other gases that have been used in the process, was found to be favourable for the production of highly crystalline CNTs (Grujicic et al., 2002); worldwide, this gas is readily avail- able and widely used, making CVD the preferred method for the production of CNTs. Several parameters may influence the yield and properties of the CNTs, such as the type of active metal catalyst or carbon precursor, reaction temperature, gas flow rate, gas pressure, reaction time or hydrogen gas concentration. Both theoretical (Grujicic et al., 2002; Singh et al., 2003) and experimental (Venegoni et al., 2002; Singh et al., 2003; Escobar et al., 2007; Romero et al., 2007; Veziri et al., 2008) studies were carried out extensively to understand the effect of some of these parameters on the morphology of the CNTs. Previous studies have been focused on parameters such as reaction temperature (Grujicic et al., 2002; Das et al., 2006; Finnie et al., 2006; Porro et al., 2007; Cui et al., 2008; Patole et al., 2008; Veziri et al., 2008; See et al., 2009; Terrado et al., 2009), reaction time (Veziri et al., 2008; Terrado et al., 2009) and reaction gases flow rate (Porro et al., 2007; Veziri et al., 2008). In these works, conventional techniques have been used to study the influence of ∗ Author to whom correspondence may be addressed. E-mail address: [email protected] Can. J. Chem. Eng. 90:489–505, 2012 © 2011 Canadian Society for Chemical Engineering DOI 10.1002/cjce.20561 Published online 19 May 2011 in Wiley Online Library (wileyonlinelibrary.com). | VOLUME 90, APRIL 2012 | | THE CANADIAN JOURNAL OF CHEMICAL ENGINEERING | 489 |
Transcript of Optimisation of Reaction Conditions for the Synthesis of Single–Walled Carbon Nanotubes Using...

Optimisation of Reaction Conditions for theSynthesis of Single–Walled Carbon NanotubesUsing Response Surface MethodologyWei-Wen Liu,1 Azizan Aziz,1* Siang-Piao Chai,2 Abdul Rahman Mohamed3 andChing-Thian Tye3
1. School of Materials and Mineral Resources Engineering, Engineering Campus, Universiti Sains Malaysia, 14300 NibongTebal, Seberang Perai Selatan, P. Pinang Malaysia
2. School of Engineering, Monash University, Jalan Lagoon Selatan, 46150 Bandar Sunway, Selangor, Malaysia
3. School of Chemical Engineering, Engineering Campus, Universiti Sains Malaysia, 14300 Nibong Tebal, Seberang PeraiSelatan, P. Pinang, Malaysia
The effects of three preparation variables, i.e. reaction temperature, reaction time and reaction gas (methane/nitrogen) flow rate, on the ratio ofthe intensity of the Raman D band to the intensity of the G band (ID/IG), carbon mass and the presence of radial breathing mode (RBM) peakswere investigated by using a central composite design to develop two linear models. The most influential factor in each experimental design-response was identified using the analysis of variance. The predicted ID/IG ratio, carbon mass and presence of RBM peaks determined duringthe process optimisation were found to agree satisfactorily with the experimental values. The optimum conditions for synthesising single-walledcarbon nanotubes were determined to be a reaction temperature of 900◦C, a reaction time of 59 min and a reaction gas flow rate of 54 mL/min.
Keywords: central composite design, optimisation, electron microscopy, carbon nanotubes, response surface methodology
INTRODUCTION
Carbon nanotubes (CNTs) are a new type of carbon nanoma-terials which have been studied by many researchers andattracted much interest due to their unique chemical and
physical properties (Iijima, 1991; Popov, 2004; Terrones, 2004)making them excellent materials for future application in elec-tronic, material science and medicine (Baughman et al., 2002;Robertson, 2004). The chemical vapour deposition (CVD) methodhas been regarded as one of the most promising methods for large-scale production of CNTs with a high degree of structure andproperty control due to its low cost (Guo et al., 1995) compared tothe arc discharge (Iijima, 1991) and laser ablation (Cheng et al.,1998) methods. For this reason, CVD has been used in this work.Methane, which has a simple composition and is chemically sta-ble than the other gases that have been used in the process, wasfound to be favourable for the production of highly crystallineCNTs (Grujicic et al., 2002); worldwide, this gas is readily avail-able and widely used, making CVD the preferred method for theproduction of CNTs.
Several parameters may influence the yield and properties of theCNTs, such as the type of active metal catalyst or carbon precursor,
reaction temperature, gas flow rate, gas pressure, reaction timeor hydrogen gas concentration. Both theoretical (Grujicic et al.,2002; Singh et al., 2003) and experimental (Venegoni et al., 2002;Singh et al., 2003; Escobar et al., 2007; Romero et al., 2007; Veziriet al., 2008) studies were carried out extensively to understandthe effect of some of these parameters on the morphology of theCNTs.
Previous studies have been focused on parameters such asreaction temperature (Grujicic et al., 2002; Das et al., 2006; Finnieet al., 2006; Porro et al., 2007; Cui et al., 2008; Patole et al., 2008;Veziri et al., 2008; See et al., 2009; Terrado et al., 2009), reactiontime (Veziri et al., 2008; Terrado et al., 2009) and reaction gasesflow rate (Porro et al., 2007; Veziri et al., 2008). In these works,conventional techniques have been used to study the influence of
∗Author to whom correspondence may be addressed.E-mail address: [email protected]. J. Chem. Eng. 90:489–505, 2012© 2011 Canadian Society for Chemical EngineeringDOI 10.1002/cjce.20561Published online 19 May 2011 in Wiley Online Library(wileyonlinelibrary.com).
| VOLUME 90, APRIL 2012 | | THE CANADIAN JOURNAL OF CHEMICAL ENGINEERING | 489 |

these parameters on the growth of CNTs by varying one parameterwhile keeping other parameters constant. This method of studyhas several disadvantages. For example, this technique ignores theinteraction effects between the parameters, leading to inaccuratepredictions of the optimal conditions. In addition, these methodsrequire a large number of experiments and are time-consuming.These problems can be eliminated by studying the effect of all theparameters simultaneously, using the response surface methodol-ogy (RSM) (Box et al., 1978; Montgomery, 2001), which has beenfound to be a useful tool to study the interactions of two or morevariables (See et al., 2009). Optimisation of experimental condi-tions using RSM has been widely applied in various processes;however, its application to the production of single-walled carbonnanotubes (SWCNTs) is rare. The procedure has been appliedto optimisation of CNT, although not specifically SWCNTs, byDas et al. (2006); and Kukovecz et al. (2005). The Box–Behnkendesign was used by Kukovecz et al. (2005) to optimise SWCNTsynthesis by catalytic CVD on an FeMo/MgO catalyst, usingacetylene as carbon source. Das et al. (2006) optimised theproduction of high purity of multi-walled carbon nanotubes(MWCNTs) successfully using the RSM method. In addition,Jarrah (2009) reported the main and interaction effects oftemperature, H2 flow rate and C2H2 flow rate on the yield andproperties of carbon nanofibers, using factorial design. Few, ifany, studies of the optimisation of SWCNT production have beenperformed using the RSM approach.
Therefore, the focus of this research was to optimise the produc-tion conditions to obtain SWCNTs with a low ratio of the intensityof the Raman D-band to the intensity of the G-band (ID/IG), max-imum carbon mass and presence of radial breathing mode (RBM)peaks. A standard RSM design called a central composite design(CCD) was selected to simultaneously study the effects of reactiontemperature, reaction time and reaction gas (methane/nitrogen)flow rate, on the ID/IG ratio, carbon mass and presence of RBMpeaks. Empirical models correlating these preparation variables(reaction temperature, reaction time and reaction gas flow rate)to the three responses (ID/IG ratio, carbon mass and presence ofRBM peaks) were then developed.
MATERIALS AND METHODS
Catalyst PreparationFeCl2 + 2FeCl3 + 8NaOH → Fe3O4 + 4H2O + 8NaCl (1)
To prepare Fe3O4 nanoparticles that are homogeneous in sizeand composition, the above reaction must be performed in anaqueous solution with a molar ratio of Fe(II)/Fe(III) of 0.5 and apH of 11–12. Volumes of 4 mL of 0.2 M HCl and 25 mL of purified,deoxygenated water, which had been degassed by bubbling nitro-gen gas for 30 min through it were combined, and 0.69 g of FeCl3and 0.25 g of FeCl2 were successively dissolved in the solutionwith stirring. Next, 250 mL of a 1.2 M NaOH solution was addedquickly to the resulting solution under vigorous stirring. Thisstep instantly generated a black precipitate which was isolatedby centrifuging at 12,000 rpm, and removing the supernatantfrom the precipitate by decantation. Purified deoxygenated waterwas added to the precipitate and the solution was decantedafter centrifugation at 12,000 rpm. After repeating the last stepthree times, 500 mL of a 0.01 M HCl solution was added to theprecipitate, with stirring to neutralise the anionic charges on thenanoparticles. A sample was removed and then dried in the ovenso that the solid content could be determined. The solid content
was then used to calculate how much of the Fe3O4 nanoparticledispersion should be added to the support to prepare the desiredcatalyst.
Catalysts were prepared by dispersing the support MgOnanopowder (Fluka, United States) in water with sonication andthen adding the required volume of the Fe3O4 nanoparticle disper-sion. The catalysts were then sonicated for 10 min, and the waterwas removed using rotary evaporation (Buchi, Switzerland). Thedried catalyst was ground with a pestle and mortar to break upagglomerates, resulting in a very fine powder.
CNT Preparation and CharacterisationSWCNTs were synthesised at atmospheric pressure in a quartzreactor (diameter = 20 mm and length = 700 mm) using an experi-mental setup that has been previously reported (Chai et al., 2006).The SWCNT synthesis was carried out under reaction conditionsaccording to the experimental design listed in Table 1. In thisprocess, 0.2 g of the catalyst was placed in the middle part ofthe reactor, and the furnace was turned on to heat the reactor todesired temperature. Nitrogen (99.999% purity, Sitt Tatt Indus-trial Gases Sdn. Bhd., Malaysia) and methane (99.999% purity,Malaysian Oxygen Bhd., Malaysia) mixed at ratio of 1:1 (v/v),were subsequently passed through the quartz tube once the tem-perature had stabilised. The reaction was carried out for differentperiod of time, after which time the furnace was switched off, butthe nitrogen was kept flowing into the reactor.
The residence times (t) of methane in the quartz reactor wascalculated from Equation (2):
t = Vquartz × 60�methene
(2)
where t is the residence times, Vquartz is volume of quartz reactor,�methane is methane volumetric flow rate.
The carbon samples, in black powder form, were collectedfrom the quartz reactor for characterisation. The morphologyof the nanotubes was investigated using transmission electronmicroscopy (TEM; Philips CM12, Netherlands) and scanningelectron microscopy (SEM; Supra 35VP, United States). Energydispersive X-ray spectroscopy (EDX) was used to determine thecarbon content in the samples. One carbon sample was char-acterised using high resolution (HRTEM; JEM 1011). Ramanspectrum measurements were performed on the carbon samplesusing a Raman spectroscopy (inVia Renishaw, United Kingdom)at a wavelength of 633 nm. The carbon mass of the samples wasdetermined by thermogravimetric analysis (TGA; TA InstrumentSDTQ600, United States). In this analysis, the samples were heatedin flowing air (100 mL/min) from 35 to 900◦C with a heating rateof 10◦C/min. All the TGA plots showed a mass decrease due tothe oxidation of carbon from the sample between 350 and 700◦C.The % of carbon mass was calculated as:
Carbon mass(%) = 100 × m1−m2
m2, (3)
where m1 and m2 are the mass of the sample before and after thecarbon mass loss, respectively.
Design of ExperimentThe parameters for producing the CNTs were studied with a RSMdesign called a CCD. RSM is a collection of mathematical andstatistical techniques that are useful for modelling and analysingproblems in which a response of interest is influenced by several
| 490 | THE CANADIAN JOURNAL OF CHEMICAL ENGINEERING | | VOLUME 90, APRIL 2012 |
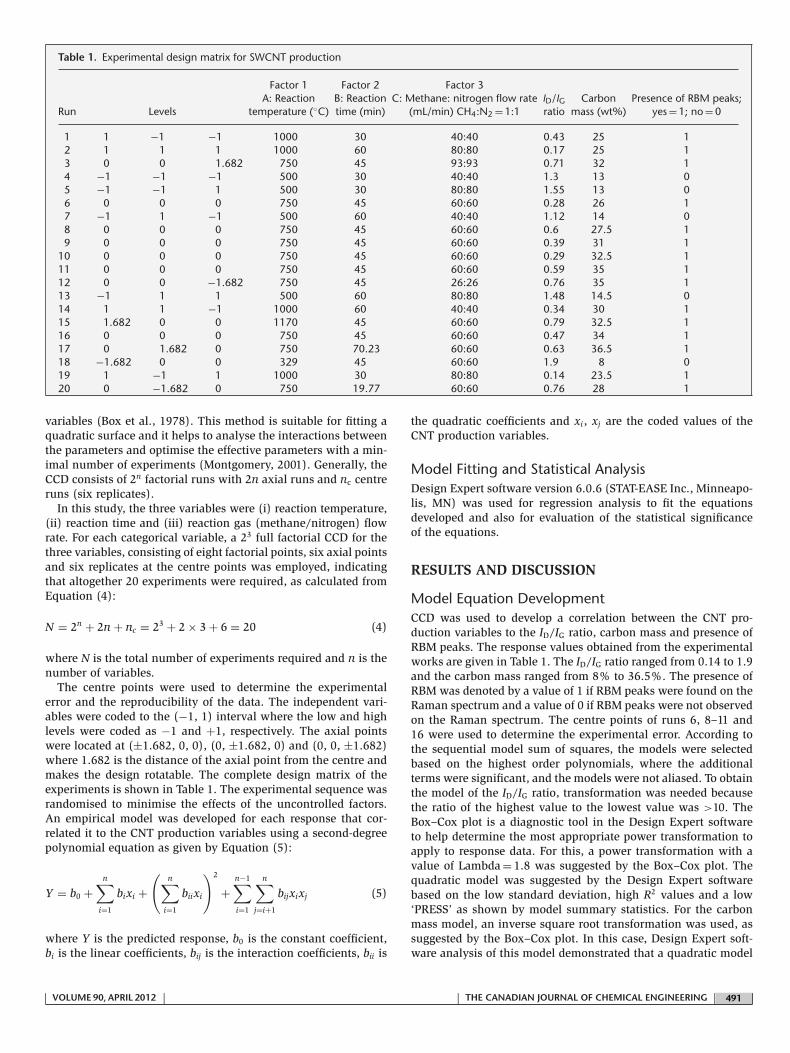
Table 1. Experimental design matrix for SWCNT production
Factor 1 Factor 2 Factor 3A: Reaction B: Reaction C: Methane: nitrogen flow rate ID/IG Carbon Presence of RBM peaks;
Run Levels temperature (◦C) time (min) (mL/min) CH4:N2 = 1:1 ratio mass (wt%) yes = 1; no = 0
1 1 −1 −1 1000 30 40:40 0.43 25 12 1 1 1 1000 60 80:80 0.17 25 13 0 0 1.682 750 45 93:93 0.71 32 14 −1 −1 −1 500 30 40:40 1.3 13 05 −1 −1 1 500 30 80:80 1.55 13 06 0 0 0 750 45 60:60 0.28 26 17 −1 1 −1 500 60 40:40 1.12 14 08 0 0 0 750 45 60:60 0.6 27.5 19 0 0 0 750 45 60:60 0.39 31 1
10 0 0 0 750 45 60:60 0.29 32.5 111 0 0 0 750 45 60:60 0.59 35 112 0 0 −1.682 750 45 26:26 0.76 35 113 −1 1 1 500 60 80:80 1.48 14.5 014 1 1 −1 1000 60 40:40 0.34 30 115 1.682 0 0 1170 45 60:60 0.79 32.5 116 0 0 0 750 45 60:60 0.47 34 117 0 1.682 0 750 70.23 60:60 0.63 36.5 118 −1.682 0 0 329 45 60:60 1.9 8 019 1 −1 1 1000 30 80:80 0.14 23.5 120 0 −1.682 0 750 19.77 60:60 0.76 28 1
variables (Box et al., 1978). This method is suitable for fitting aquadratic surface and it helps to analyse the interactions betweenthe parameters and optimise the effective parameters with a min-imal number of experiments (Montgomery, 2001). Generally, theCCD consists of 2n factorial runs with 2n axial runs and nc centreruns (six replicates).
In this study, the three variables were (i) reaction temperature,(ii) reaction time and (iii) reaction gas (methane/nitrogen) flowrate. For each categorical variable, a 23 full factorial CCD for thethree variables, consisting of eight factorial points, six axial pointsand six replicates at the centre points was employed, indicatingthat altogether 20 experiments were required, as calculated fromEquation (4):
N = 2n + 2n + nc = 23 + 2 × 3 + 6 = 20 (4)
where N is the total number of experiments required and n is thenumber of variables.
The centre points were used to determine the experimentalerror and the reproducibility of the data. The independent vari-ables were coded to the (−1, 1) interval where the low and highlevels were coded as −1 and +1, respectively. The axial pointswere located at (±1.682, 0, 0), (0, ±1.682, 0) and (0, 0, ±1.682)where 1.682 is the distance of the axial point from the centre andmakes the design rotatable. The complete design matrix of theexperiments is shown in Table 1. The experimental sequence wasrandomised to minimise the effects of the uncontrolled factors.An empirical model was developed for each response that cor-related it to the CNT production variables using a second-degreepolynomial equation as given by Equation (5):
Y = b0 +n∑
i=1
bixi +(
n∑i=1
biixi
)2
+n−1∑i=1
n∑j=i+1
bijxixj (5)
where Y is the predicted response, b0 is the constant coefficient,bi is the linear coefficients, bij is the interaction coefficients, bii is
the quadratic coefficients and xi, xj are the coded values of theCNT production variables.
Model Fitting and Statistical AnalysisDesign Expert software version 6.0.6 (STAT-EASE Inc., Minneapo-lis, MN) was used for regression analysis to fit the equationsdeveloped and also for evaluation of the statistical significanceof the equations.
RESULTS AND DISCUSSION
Model Equation DevelopmentCCD was used to develop a correlation between the CNT pro-duction variables to the ID/IG ratio, carbon mass and presence ofRBM peaks. The response values obtained from the experimentalworks are given in Table 1. The ID/IG ratio ranged from 0.14 to 1.9and the carbon mass ranged from 8% to 36.5%. The presence ofRBM was denoted by a value of 1 if RBM peaks were found on theRaman spectrum and a value of 0 if RBM peaks were not observedon the Raman spectrum. The centre points of runs 6, 8–11 and16 were used to determine the experimental error. According tothe sequential model sum of squares, the models were selectedbased on the highest order polynomials, where the additionalterms were significant, and the models were not aliased. To obtainthe model of the ID/IG ratio, transformation was needed becausethe ratio of the highest value to the lowest value was >10. TheBox–Cox plot is a diagnostic tool in the Design Expert softwareto help determine the most appropriate power transformation toapply to response data. For this, a power transformation with avalue of Lambda = 1.8 was suggested by the Box–Cox plot. Thequadratic model was suggested by the Design Expert softwarebased on the low standard deviation, high R2 values and a low‘PRESS’ as shown by model summary statistics. For the carbonmass model, an inverse square root transformation was used, assuggested by the Box–Cox plot. In this case, Design Expert soft-ware analysis of this model demonstrated that a quadratic model
| VOLUME 90, APRIL 2012 | | THE CANADIAN JOURNAL OF CHEMICAL ENGINEERING | 491 |

Table 2. Analysis of ANOVA for response surface quadratic model for ID/IG
Source Sum of squares Degree of freedom Mean square F-value Prob >F
Model 13.850 9 1.540 65.010 <0.0001A 8.640 1 8.640 365.110 <0.0001B 0.061 1 0.061 2.560 0.1404C 0.071 1 0.071 3.010 0.1136A2 4.650 1 4.650 196.610 <0.0001B2 0.083 1 0.083 3.530 0.0898C2 0.130 1 0.130 5.450 0.0418AB 0.030 1 0.030 1.270 0.2867AC 0.360 1 0.360 15.060 0.0031BC 0.010 1 0.010 0.440 0.5212
Table 3. Analysis of ANOVA for response surface quadratic model for carbon mass
Source Sum of squares Degree of freedom Mean square F-value Prob >F
Model 0.045 9 4.999 × 10⁻³ 12.690 0.0002A 0.026 1 0.026 65.870 <0.0001B 5.669 × 10⁻⁴ 1 5.669 × 10⁻⁴ 1.440 0.2579C 7.540 × 10⁻⁵ 1 7.540 × 10⁻⁵ 0.190 0.6711A2 0.018 1 0.018 46.360 <0.0001B2 3.264 × 10⁻⁴ 1 3.264 × 10⁻⁴ 0.830 0.3841C2 1.496 × 10⁻⁴ 1 1.496 × 10⁻⁴ 0.380 0.5515AB 1.557 × 10⁻⁷ 1 1.557 × 10⁻⁷ 3.952 × 10⁻⁴ 0.9845AC 1.005 × 10⁻⁴ 1 1.005 × 10⁻⁴ 0.260 0.6244BC 5.270 × 10⁻⁶ 1 5.270 × 10⁻⁶ 0.013 0.9102
was required because the low standard deviation, high R2 valuesand a low ‘PRESS’. Finally, to develop the model of the presence ofRBM peaks, no transformation was needed, and the linear modelwas chosen because the predicted value of R2 was in reasonableagreement with the adjusted R2. The final empirical models of thethree responses, in terms of the coded factors after excluding theinsignificant terms, are shown in Equations (6)–(8):
(ID/IG)1.8 = 0.24−0.80A−0.067B + 0.072C + 0.57A2 + 0.076B2
+0.095C2 + 0.061AB−0.21AC + 0.036BC (6)
1.0/sqrt(mass carbon) = 0.18−0.044A−6.44 × 10⁻³B
+2.35 × 10⁻³C + 0.036A2 + 4.76B2
+3.22 × 10⁻³C2 + 1.40 × 10⁻⁴AB
+3.55 × 10⁻³AC + 8.12 × 10⁻⁴BC (7)
Presence of RBM peaks = 1.01 + 0.42A−0.24A2
−0.068B2−0.068C2 (8)
where A is the coded value of the reaction temperature, B is thecoded value of the reaction time and C is the coded value of thereaction gas flow rate. A positive sign in front of the terms indi-cates a synergistic effect, whereas a negative sign indicates anantagonistic effect.
Model EvaluationThe quality of the model was evaluated based on the correlationcoefficient value, R2, and the standard deviation values betweenthe experimental and predicted values. The R2 values for Equa-
tions (6)–(8) were 98.3%, 92.0% and 87.0% of the total variationin the ID/IG ratio, carbon mass and presence of RBM peaks, respec-tively, was attributed to the experimental variables studied. Thestandard deviations for the three models (Equations (6)–(8)) were0.15, 0.02 and 0.22, respectively. Those R2 values obtained wereconsidered as relatively high, as the R2 values were >0.9 exceptthe R2 value of 0.875. This indicates that the predicted values forID/IG ratio and carbon mass would be in greater agreement withtheir experimental values, compared to the predicted presence ofRBM peaks, which will be in less agreement.
The adequacy of the models was further justified through anal-ysis of variance (ANOVA). The ANOVA results for the quadraticmodels of the ID/IG ratio and carbon mass are listed in Tables2 and 3, respectively and the ANOVA for the linear model ofthe presence of RBM peaks is listed in Table 4. The model F-values for the ID/IG ratio and carbon mass were 65.01 and 12.69,respectively, implying that both models were significant. In bothcases, the reaction temperature (A) and its interaction terms (A2)were significant model terms, whereas reaction time (B), reac-tion gas flow rate (C) and their interaction terms (B2, C2, AB, AC,BC) were all insignificant to the response. The F-value for thepresence of RBM peaks was 7.76, which is significant as well. In
Table 4. Analysis of ANOVA for response surface linear model forpresence of RBM peaks
Sum of Degree of MeanSource squares freedom square F-value Prob >F
Model 2.36 3 0.79 9.10 0.0010A 2.36 1 2.36 27.29 <0.0001
| 492 | THE CANADIAN JOURNAL OF CHEMICAL ENGINEERING | | VOLUME 90, APRIL 2012 |

this case, reaction temperature (A) and its interaction terms (A2)were significant model terms, whereas reaction time (B) and reac-tion gases flow rate (C) and their interaction terms (B2, C2, AB,AC and BC) were insignificant model terms.
Residual AnalysisThe adequacy of the underlying model was examined before anyconclusions were made from the ANOVA analysis. The violationof basic assumptions and model adequacy is investigated by the
Figure 1. Normal plot of residuals and residuals versus predicted plot for (a),(b) ID/IG, (c),(d) carbon mass and (e), (f) presence of RBM peaks. [Colorfigure can be seen in the online version of this article, available at http://onlinelibrary.wiley.com/journal/10.1002/(ISSN) 1939-019X]
| VOLUME 90, APRIL 2012 | | THE CANADIAN JOURNAL OF CHEMICAL ENGINEERING | 493 |

examination of the residuals. Figure 1 presents the normal plot ofresiduals and residual versus predicted plot for ID/IG ratio, carbonmass and presence of RBM peaks.
The normal probability plots show how the residuals follow anormal distribution. A straight line means residuals follow a nor-mal distribution, in which actual and predicted response valuesare close. Some small scatters of data are expected even with nor-mal data. The plot show that no severe sign of non-normality forID/IG ratio and carbon mass. However, some data are slightly scat-tered from the straight line for presence of RBM peaks. Therefore,further examination was carried out on the plot of residual versuspredicted response for ID/IG ratio, carbon mass and presence ofRBM peaks. This plot should be a random scatter with almost arange of residuals across the graph. In Figure 1b,d,f, the residualversus predicted plot for ID/IG ratio, carbon mass and presence ofRBM peaks show that the equality of variance does not seem tobe violated.
The appearance of any different pattern in either of the residualplot shown earlier will signify the need of transformation on theresponse for better analysis. In this case, Box–Cox plot will beused to diagnostic all the models. The models were diagnosed andthe Box–Cox plots show that the most suitable transformationsfor the ID/IG and carbon mass responses were power (Lambdaof 1.8) and inverse square root (Lambda of -0.5), respectively.No transformation was needed for the presence of RBM peaksresponses. After the transformations were made, the models were
considered acceptable in capturing the correlation between theSWCNT production variables to the ID/IG ratio, carbon mass andpresence of RBM peaks.
Effect of Reaction Temperature, Reaction Time andReaction Gas (Methane/Nitrogen) Flow Rate on theID/IG Ratio
Effect of reaction temperatureBased on the F-values from the ANOVA analysis (Table 2), bothreaction temperature and reaction time were found to have signif-icant effects on the ID/IG ratio, and the reaction gas flow rate hadthe least effect. Figure 2a shows the one-factor plot of reaction tem-perature and three-dimensional response surfaces, which showthe effects of the SWCNT production variables (reaction temper-ature and reaction time) on the ID/IG ratio. The reaction gas flowrate was fixed at zero level. As can be seen from Figure 2a,b, theID/IG ratio decreased with increasing reaction temperature. Theseresults are in agreement with the works of Finnie et al. (2006);and Maschmann et al. (2006), which demonstrated that effect ofreaction temperature on the ID/IG ratio was significant.
It is demonstrated that the growth of SWCNTs is enhanced if thecatalyst is being in a liquid phase (Harutyunyana et al., 2005). Inthis work, at 329 and 500◦C, the catalyst particles are believed tobe in the solid form and therefore unable to form any SWCNTs.
Figure 2. (a) One-factor plot of reaction temperature. (b) Three-dimensional response surface plot showing the effect of reaction temperature andreaction time on ID/IG. (c) Carbon sample reacted at 329◦C. (d) Carbon sample reacted at 500◦C. [Color figure can be seen in the online version of thisarticle, available at http://onlinelibrary.wiley.com/journal/10.1002/(ISSN) 1939-019X]
| 494 | THE CANADIAN JOURNAL OF CHEMICAL ENGINEERING | | VOLUME 90, APRIL 2012 |

No CNT growth was observed, only bare catalysts were observedby SEM in the carbon samples at reaction temperatures of 329 and500◦C, as shown in Figure 2c,d.
In Table 1, the lowest ID/IG was 0.14 at a reaction temperature of1000◦C, and therefore the highest quality SWCNTs were producedat this temperature. Although the ID/IG ratio tends to decreasewith increasing temperatures, this ratio is higher for SWCNTs pro-duced at 1170◦C than for those produced at 1000◦C, as shownin Table 1. At this temperature, SEM (Figure 3a) showed thatlarge-diameter tubes were visible on the catalyst, which suggeststhat the MWCNT grown at this temperature. These large-diametertubes were not visible on the catalyst at reaction temperaturesof 750 and 1000◦C, as shown in Figure 3b,c, respectively. TheSEM results were supported by the Raman spectrum as shown inFigure 4. The results at very high temperature such as at 1170◦Ccan be explained by fast-catalytic reactions, which would causedecreased graphitisation and form large-diameter nanotubes (Teoet al., 2003; Andrews, 2006). At the catalyst, the increased decom-position rate due to the high reaction temperature forces too muchcarbon to be precipitated, which could produce defective MWCNTsor terminate the growth of the tubes. At very high temperature, therate of etching by the reaction gas on the nanotubes may also beincreased, causing defects on the wall structure (Andrews, 2006).Each of these effects results in the formation of lower-qualityCNTs, as quantified by the ID/IG ratio and observed by SEM.
Effect of reaction timeThe ID/IG ratio decreases slightly with reaction time, as shown inFigure 5a,b; this decrease suggests that primarily well-graphitisedSWCNTs, rather than carbon impurities such as MWCNTs, wereproduced for these longer reaction times. The presence of SWC-NTs was confirmed by the presence of RBM peaks in the Ramanspectra except for runs 4, 5, 7, 13 and 18, as shown in Figure 4.The Raman spectrum of the carbon sample produced during theshortest reaction time (19.77 min) shows a high ID/IG ratio of 0.76indicating that low amount and poorly graphitised SWCNTs wereproduced (Figure 5c). The decrease in the ID/IG ratio with reac-tion time suggests that longer reaction time, such as 70.23 min,provoked the growth of well-graphitised SWCNTs (Figure 5d).
The growth mechanism of CNTs in CVD has been extensivelystudied, and it is generally accepted that CNTs in CVD are formedby carbon atoms dissolving, diffusing through or over the surfaceof the catalytic particles and precipitating in the form of CNTswith diameters directly related to the size of the catalytic particlesthemselves (Wagner and Ellis, 1964; Baker et al., 1972; Baker,1989; Tibbetts, 1984; Andrews, 2006). It is important to notethat the dissolving, diffusion and precipitation rates of the car-bon atoms are affected by the carbon atom concentration (Bakeret al., 1972; Tibbetts, 1984; Dupuis, 2005), which is relevant herefor the discussion of our results. To nucleate CNT, accumulatedcarbon atom must reach a critical concentration inside the cata-lyst particles (Kouravelou and Sotirchos, 2005). Therefore, at theshortest reaction time (19.77 min), the carbon atom concentrationinside the catalyst was low due to time the insufficient time forcarbon atoms diffusion. In Figure 6, EDX analysis shows that car-bon concentration increased as the reaction time increased from19.77 to 70.23 min. Because of the lowest ID/IG ratio achieved at45 min, we propose 45 min as the optimum time to reach criticalcarbon concentration. Beyond a critical concentration, too muchcarbon was accumulated on the catalyst surface, thus leading tomore defective CNTs. Below a critical concentration, CNTs werenot grown completely and thus, many defects were created on
Figure 3. (a) Large low-graphitisation nanotubes were observedgrowing over the catalyst at 1170◦C. (b) Growth of nanotubes at 750◦C.(c) The sample showing a dense growth of highly graphitised nanotubesover its surface at 1000◦C.
the wall of CNTs which supported by our Raman results. Thisresult was in agreement with the work done by Qian et al. (2003)which reported that the CNTs produced at short reaction time havea low thermal stability and show high ID/IG ratio compared to thefully grown CNTs produced at longer reaction time. Niu and Fang(2006) also found the same observation where reaction time didshow effect on the ID/IG ratio. The strong dependence of the ID/IGratio on reaction temperature and reaction time demonstrates theimportance of these factors on the quality of the SWCNTs that areproduced.
| VOLUME 90, APRIL 2012 | | THE CANADIAN JOURNAL OF CHEMICAL ENGINEERING | 495 |

Figure 4. (a–d) Raman spectra of the CNTs for 20 runs.
Effect of reaction gas (methane/nitrogen) flow rateThe gases used during the CVD are very important to the qualityof the synthesised CNTs. The purpose of the nitrogen in the CVDwas to dilute the carbon-containing gas (methane) that forms theCNTs. To understand the growth of the tubes, the reaction gasflow rate for each of the nitrogen and methane mixed at ratio of1:1 (v/v) were varied, and the results are presented in Figure 7.Table 5 shows that as the reaction gas flow rate increased, theID/IG ratio decreased when reaction temperature of 1000◦C wasused. As discussed previously, 1000◦C is the best reaction tem-perature to form SWCNTs with a low ID/IG ratio. The reactiongas (methane/nitrogen) at a flow rate of 80 mL/min has a shorterresidence time as compared to that at 40 mL/min, thus reduc-ing the formation of amorphous carbon (Li et al., 2002; Valleset al., 2009) but favouring the formation of SWCNT with low ID/IGratio. The residence times of methane for different flow rates in thequartz reactor were calculated. In Table 5, the residence times ofmethane decreased with increasing the methane flow rate from 40to 80 mL/min. In Figure 7c, very few CNTs were observed on thesample reacted at 40 mL/min as compared to that at 80 mL/min(Figure 7d).
However, higher ID/IG ratios were obtained at the flow rates of93.64 and 26.36 mL/min when a reaction temperature of 750◦Cwas used (Table 5). At run 12 with the lowest reaction gas flowrate, the amount of CNTs formed was very low as observed inthe SEM image shown in Figure 8a. According to the growthmechanism proposed by Gohier et al. (2008), after the carbon
is deposited on the catalyst, it diffuses to the rear site where itprecipitates out as nanotubes. However, at a lower reaction gasflow rate, the diffusion was believed to have occurred at a lowerrate due to the lower carbon concentration gradient at this lowerflow rate. Consequently, the rate of SWCNT production was lowat a reaction gas flow rate of 26.36 mL/min. Most of the depositedcarbon that remained after the reaction was amorphous carbonaccumulated on the catalyst.
In addition, it is known that the diameter of the Fe3O4 nanopar-ticles influences the size of the CNTs that grows from them(Moisala et al., 2003; Dupuis, 2005). During a reaction with thelowest reaction gas flow rate, the nanoparticles will spend a longertime being reduced by methane as the low methane concentra-tion. It is possible that the longer reduction time for nanoparticlesmight sinter the nanoparticles into larger-sized particles. Oncethe formation of nanotubes has started, it is assumed that thenanoparticles are protected from sintering by forming nanotube(Li et al., 2004).
When the reaction gas flow rate was further increased to93.64 mL/min, a tremendous amount of carbon was deposited onthe catalyst and precipitated out as CNTs. Figure 8b shows thatthe yield of CNTs was much higher at this reaction gas flow ratecompared to that produced at the lower reaction gas flow rateof 26.36 mL/min. However, the ID/IG ratio for both reaction gasflow rate was almost the same. If the low reaction gas flow ratereduced the reduction rate, the high reaction gas flow rate musttherefore increase the reduction rate. It is known that hydrogen
| 496 | THE CANADIAN JOURNAL OF CHEMICAL ENGINEERING | | VOLUME 90, APRIL 2012 |

Figure 5. (a) One-factor of reaction time. (b) Three-dimensional response surface plots showing the effect of reaction time and reaction temperatureon the ID/IG ratio. Morphology of CNTs grown at (c) 19.77 min and (d) 70.23 min. [Color figure can be seen in the online version of this article,available at http://onlinelibrary.wiley.com/journal/10.1002/(ISSN) 1939-019X]
Figure 6. EDX analysis for nanotubes samples produced at (a) 19.77 min. (b) 45 min. (c) 70.23 min. [Color figure can be seen in the online version ofthis article, available at http://onlinelibrary.wiley.com/journal/10.1002/(ISSN) 1939-019X]
atoms liberated from the methane decomposition on the cata-lyst surface are able to reduce the metal oxide into pure metal(Kumar and Ando, 2010). Therefore, at this high reaction gasflow rate (93.64 mL/min), Fe3O4 nanoparticles were quicklyreduced to the active metal Fe, after methane was intro-duced. This made the catalyst more active to decompose
methane and form CNTs in a larger amount. However, whenthe rate of methane decomposition was too fast, it mightterminate the catalytic activity rapidly due to catalyst deac-tivation. Therefore, under this condition, amorphous carbondominates the reaction and thus contributing to increases the ID/IGratio.
| VOLUME 90, APRIL 2012 | | THE CANADIAN JOURNAL OF CHEMICAL ENGINEERING | 497 |

Figure 7. (a) One-factor plot of reaction gases flow rate. (b) Three-dimensional response surface plot showing the effect of reaction temperature andreaction gas flow rate on the ID/IG ratio. CNTs produced at 1000◦C at 30 min with the flow rate of (c) 40 mL/min and (d) 80 mL/min. [Color figure canbe seen in the online version of this article, available at http://onlinelibrary.wiley.com/journal/10.1002/(ISSN) 1939-019X]
Interaction between parameters (reactiontemperature and reaction gas flow rate)
As shown in Tables 2–4, amongst all the interaction terms, onlythe term AC is significant at the 95% confidence level. This meansthat only the interaction between reaction temperature (A) andreaction gas flow rate (C) affects the ID/IG ratio significantly. Thetwo-dimensional plot for the interaction between reaction tem-
perature and reaction gas flow rate is shown in Figure 8c. It canbe seen that when the reaction gas flow rate is set at a lowervalue (40 mL/min), there is only a marginal decrease in the ID/IGratio with higher reaction temperature. However, when the reac-tion gas flow rate is set at a higher value (80 mL/min), the ID/IGratios decrease more significantly with higher reaction temper-ature. This finding further strengthens our claim that reaction
Table 5. Different reaction gas flow rate resulted in different ID/IG ratio and methane residence times
Factor 1 Factor 2 Factor 3A: Reaction B: Reaction C: Methane nitrogen flow rate ID/IG Methane residence
Run temperature (◦C) time (min) (mL/min) CH4:N2 = 1:1: ratio time (s)
1 1000 30 40 0.43 33019 1000 30 80 0.14 16514 1000 60 40 0.34 3302 1000 60 80 0.17 1656 750 45 60 0.28 2208 750 45 60 0.6 2209 750 45 60 0.39 220
10 750 45 60 0.29 22011 750 45 60 0.59 22016 750 45 60 0.47 2203 750 45 93.64 0.71 141
12 750 45 26.36 0.76 501
| 498 | THE CANADIAN JOURNAL OF CHEMICAL ENGINEERING | | VOLUME 90, APRIL 2012 |

Figure 8. (a) A low concentration of methane produced a low yield ofSWCNTs. (b) A high concentration of methane produced a high yield ofSWCNTs. (c) Interaction effects between parameters of reactiontemperature and gas flow rate. [Color figure can be seen in the onlineversion of this article, available at http://onlinelibrary.wiley.com/journal/10.1002/(ISSN) 1939-019X]
temperature is a more prominent process parameter that influ-ences the ID/IG ratio as compared to reaction gas flow rate (higherF-value for reaction temperature compared to reaction gas flowrate as shown in Table 2). This can be justified as SWCNTproduction is a temperature-dependent reaction (Harutyunyana
Figure 9. (a) One-factor plot reaction temperature. (b)Three-dimensional response surface plot showing the effect of reactiontemperature and reaction time on the carbon mass. (c) A large amountof MWCNTs was formed at a reaction temperature of 1170◦C. [Colorfigure can be seen in the online version of this article, available athttp://onlinelibrary.wiley.com/journal/10.1002/(ISSN) 1939-019X]
et al., 2005), in which the SWCNT growth can proceed well evenat a low reaction gas flow rate. The importance of the presence ofreaction temperature is that it helps the methane decompositionand carbon diffusion through the catalyst nanoparticles so that theSWCNT production can proceed at lower reaction gas flow rate.
| VOLUME 90, APRIL 2012 | | THE CANADIAN JOURNAL OF CHEMICAL ENGINEERING | 499 |

Figure 10. (a) One-factor plot of reaction time. (b) Three-dimensional response surface plot showing the effect of reaction time and reactiontemperature on the carbon mass. (c) For the sample grown at a reaction time of 70.23 min, many large nanotubes were observed on the surface. (d) Asample produced with a short reaction time of 19.77 min. [Color figure can be seen in the online version of this article, available athttp://onlinelibrary.wiley.com/journal/10.1002/(ISSN) 1939-019X]
However, if the reaction temperature is too low, the SWCNT for-mation rate would be slow even at high reaction gas flow rate(Harutyunyana et al., 2005; Sharma et al., 2007).
Effect of Reaction Temperature, Reaction Time andReaction Gas (Methane/Nitrogen) Flow Rate on theCarbon Mass
Effect of reaction temperatureThe reaction temperature was found to have a great effect onthe carbon mass, with the F-value (Table 3) of 65.87, whilereaction time and reaction gas flow rate showed less significanteffects on it, with F-values of 1.44 and 0.19, respectively. Figure9a,b shows the one-factor plot of reaction temperature and three-dimensional response surface plot, respectively, which show theeffect of reaction time and reaction temperatures on the carbonmass. The carbon mass was found to increase with increasingreaction temperature. High temperatures can accelerate the cat-alytic decomposition of methane molecules and the diffusion rateof carbon in the nanoparticles. However, increasing the tempera-ture cause also increases the amount of self-pyrolysis of methane,resulting in accumulation of amorphous carbon on the catalyst
and deactivation the catalyst due to catalyst poisoning (Moisalaet al., 2003). In addition, nanoparticles may sinter and agglom-erate to form larger particles at high temperature (Moisala et al.,2003). As a result, larger tubes, such as MWCNTs, were dominantat high reaction temperature, as observed in Figure 9c.
Effect of reaction timeIf the mixture of gases in the reactor is constant over time, thegrowth rate of nanotubes should be proportional to the amount ofnanoparticles actively growing nanotubes. As stated earlier, it wasnot possible to differentiate between the types of carbon present(i.e. SWCNTs, MWCNTs or amorphous carbon) in the samples.The carbon mass appears to increase in an approximately linearmanner with reaction time as shown in Figure 10a,b. Assumingthe carbon mass depends on the number of active nanoparti-cles, this indicates that the amount of active nanoparticles alsoincreases linearly with reaction time. In the most widely acceptedmodel of CNT growth, the catalyst nanoparticles must be reducedto the metallic state before the CNT production can take place (Liet al., 2004). During the long reaction time of 70.23 min, more cat-alyst nanoparticles were reduced to active metal and subsequentlyincreased the deposition rate of carbon. Also, a substantial amount
| 500 | THE CANADIAN JOURNAL OF CHEMICAL ENGINEERING | | VOLUME 90, APRIL 2012 |

Figure 11. (a) One-factor plot of reaction gas flow rate. (b) Three-dimensional response surface plot showing the effect of reaction time and reactiongas flow rate on carbon mass. (c) CNTs produced with a reaction gas flow rate of 93.64 mL/min. (d) CNTs produced with a reaction gas flow rate of26.36 mL/min. [Color figure can be seen in the online version of this article, available at http://onlinelibrary.wiley.com/journal/10.1002/(ISSN)1939-019X]
of carbon was available to form long nanotubes which increasedthe carbon mass.
Effect of reaction gas (methane/nitrogen) flow rateThe effect of reaction gas flow rate shows least significant effecton the carbon mass, with F-value of 0.19. As the reaction gasflow rate increased, carbon mass increased. Figure 11a,b showsthe one-factor plot of effect of reaction gas flow rate and three-dimensional response surface plot of the effect reaction time andflow rate on the carbon mass. Figure 11c,d shows that the yieldof CNTs was much greater with a high reaction gas flow rate(93.64 mL/min) compared to the yield synthesised with a lowreaction gas flow rate (26.36 mL/min). At this very low reactiongas flow rate (26.36 mL/min), a very small amount of carbon wasdeposited because the concentration of methane was very low, butwhen the very high reaction gas flow rate (93.64 mL/min) wasused in the CVD, the concentration of methane was high. Thedecomposition of methane releases hydrogen which is a reduc-tion agent. The hydrogen was present in large concentrations atthe high reaction gas flow rate, and it was able to reduce theFe3O4 nanoparticles to active metal (Fe) in a short time. There-fore, at this high reaction gas flow rate, the catalyst became more
active in methane decomposition and CNTs were formed in a largeamount on the catalyst, compared to the low reaction gas flowrate.
Effect of Reaction Temperature, Reaction Time andReaction Gas (Methane/Nitrogen) Flow Rate on thePresence of RBM Peaks
Effect of reaction temperatureThe presence of RBM peaks is evidence that a sample containsSWCNTs. The F-value for the presence of RBM peaks is 50.32and shows that reaction temperature has a significant effect onthe RBM peaks compared to reaction time and reaction gas flowrate. Figure 12a shows the one-factor plot of reaction tempera-ture on the presence of RBM peaks. Parameter of reaction timeand reaction gas flow rate show insignificant on the presence ofRBM peaks (Figure 12b,c). Therefore, both process parameters areomitted from the model. Figure 12d shows the three-dimensionalresponse surface plot, which shows the effect of reaction timeand reaction temperatures on the presence of RBM peaks. Theseresults support the idea that a high temperature is needed to formSWCNTs.
| VOLUME 90, APRIL 2012 | | THE CANADIAN JOURNAL OF CHEMICAL ENGINEERING | 501 |
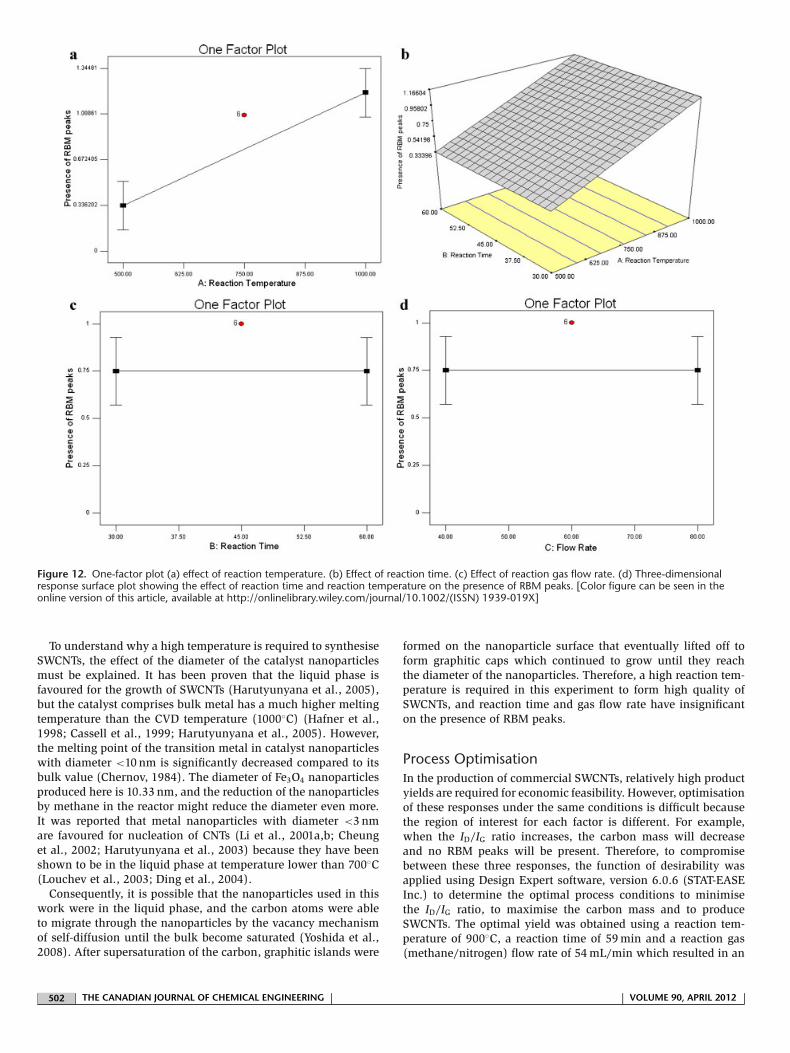
Figure 12. One-factor plot (a) effect of reaction temperature. (b) Effect of reaction time. (c) Effect of reaction gas flow rate. (d) Three-dimensionalresponse surface plot showing the effect of reaction time and reaction temperature on the presence of RBM peaks. [Color figure can be seen in theonline version of this article, available at http://onlinelibrary.wiley.com/journal/10.1002/(ISSN) 1939-019X]
To understand why a high temperature is required to synthesiseSWCNTs, the effect of the diameter of the catalyst nanoparticlesmust be explained. It has been proven that the liquid phase isfavoured for the growth of SWCNTs (Harutyunyana et al., 2005),but the catalyst comprises bulk metal has a much higher meltingtemperature than the CVD temperature (1000◦C) (Hafner et al.,1998; Cassell et al., 1999; Harutyunyana et al., 2005). However,the melting point of the transition metal in catalyst nanoparticleswith diameter <10 nm is significantly decreased compared to itsbulk value (Chernov, 1984). The diameter of Fe3O4 nanoparticlesproduced here is 10.33 nm, and the reduction of the nanoparticlesby methane in the reactor might reduce the diameter even more.It was reported that metal nanoparticles with diameter <3 nmare favoured for nucleation of CNTs (Li et al., 2001a,b; Cheunget al., 2002; Harutyunyana et al., 2003) because they have beenshown to be in the liquid phase at temperature lower than 700◦C(Louchev et al., 2003; Ding et al., 2004).
Consequently, it is possible that the nanoparticles used in thiswork were in the liquid phase, and the carbon atoms were ableto migrate through the nanoparticles by the vacancy mechanismof self-diffusion until the bulk become saturated (Yoshida et al.,2008). After supersaturation of the carbon, graphitic islands were
formed on the nanoparticle surface that eventually lifted off toform graphitic caps which continued to grow until they reachthe diameter of the nanoparticles. Therefore, a high reaction tem-perature is required in this experiment to form high quality ofSWCNTs, and reaction time and gas flow rate have insignificanton the presence of RBM peaks.
Process OptimisationIn the production of commercial SWCNTs, relatively high productyields are required for economic feasibility. However, optimisationof these responses under the same conditions is difficult becausethe region of interest for each factor is different. For example,when the ID/IG ratio increases, the carbon mass will decreaseand no RBM peaks will be present. Therefore, to compromisebetween these three responses, the function of desirability wasapplied using Design Expert software, version 6.0.6 (STAT-EASEInc.) to determine the optimal process conditions to minimisethe ID/IG ratio, to maximise the carbon mass and to produceSWCNTs. The optimal yield was obtained using a reaction tem-perature of 900◦C, a reaction time of 59 min and a reaction gas(methane/nitrogen) flow rate of 54 mL/min which resulted in an
| 502 | THE CANADIAN JOURNAL OF CHEMICAL ENGINEERING | | VOLUME 90, APRIL 2012 |

Table 6. Model predicted and experimental values of ID/IG ratio, carbon mass and presence of RBM peaks for optimised process conditions(reaction temperature, reaction time and reaction gas flow rate)
Presence of RBM peaks;ID/IG ratio Carbon mass (wt%) yes = 1; no = 0
A: Reaction B: Reaction C: Methane: nitrogentemperature, (◦C) time, (min) (mL/min) CH4:N2 = 1:1 Predicted Experimental Predicted Experimental Predicted Experimental
900 59 54 0.12 0.12 38 46 1 1
Figure 13. SWCNTs prepared under optimal conditions (a) SEM image. (b) HRTEM image showing SWCNT bundle. (c) Thermal analysis of the carbonsample. (d) Raman spectrum. [Color figure can be seen in the online version of this article, available at http://onlinelibrary.wiley.com/journal/10.1002/(ISSN) 1939-019X]
ID/IG ratio of 0.12, a carbon mass of 46 wt% and the presenceof RBM peaks in the Raman spectrum. The SWCNT synthesiswas conducted three times to check the reproducibility of thisoptimal scenario. The values of ID/IG ratio obtained were 0.117,0.123 and 0.115. RBM peaks were observed in all Raman spec-trums. The carbon masses for these three runs were 46.1, 45.7and 46.3 wt%. The mean predicted and experimental values forthe three responses obtained are presented in Table 6. It wasobserved that the experimental values were in good agreementwith the values predicted from the models, with relatively smalldeviation errors between the predicted and the actual values. This
indicates that the models developed in this work are suitableand sufficient to predict the responses from the fixed operatingvariables.
Characterisation of SWCNT Under OptimumConditionsFigure 13a shows the SEM image of the SWCNTs produced usingthe optimum conditions. Nearly uniform diameters and a densegrowth of SWCNTs were clearly observed. In Figure 13b, theHRTEM image shows a broad bundle of SWCNTs produced using
| VOLUME 90, APRIL 2012 | | THE CANADIAN JOURNAL OF CHEMICAL ENGINEERING | 503 |

the optimum conditions. The carbon mass was roughly 46% asseen by TGA in Figure 13c. RBM peaks were appeared in theRaman spectrum, and the D band was much lower than the Gband which suggests that well graphitised SWCNTs were syn-thesised (Figure 13d). The results obtained in this study are inagreement with the work of Kukovecz et al. (2005), who reportedthat a high quality and high yield of SWCNTs was achieved afteroptimisation.
CONCLUSIONSA CCD was conducted to study the effects of three SWCNT produc-tion variables: reaction temperature, reaction time and reactiongas (methane/nitrogen) flow rate on the ID/IG ratio, carbon massand presence of RBM peaks of the prepared SWCNTs. The optimalconditions for producing a high yield of SWCNTs was determinedto be a reaction temperature of 900◦C, a reaction time of 59 minand a reaction gas (methane/nitrogen) flow rate of 54 mL/min.These conditions resulted in an ID/IG ratio of 0.12, a carbon massof 46 wt% of and the presence of RBM peaks in the Raman spec-trum. The experimental values obtained for the ID/IG ratio, carbonmass and presence of RBM peaks were found to agree satisfactorilywith the values predicted by the models. The SWCNTs preparedunder these optimal conditions were found by SEM to have nearlyuniform diameters and a dense growth of tubes. The Raman spec-trum showed a high intensity of RBM peaks and a very low ID/IGratio, which revealed that highly graphitised SWCNTs were syn-thesised after optimisation.
ACKNOWLEDGEMENTSThe authors gratefully acknowledge the financial supportprovided by the Universiti Sains Malaysia (USM) under a Fun-damental Research Grant Scheme (FRGS) (Project: A/C No.6071002), a Research University Grant (RU) (Project: A/C No.814004), Skim Penyelidikan Siswazah Universiti Penyelidikan(USM-RU-PRGS) and a USM Fellowship.
REFERENCESAndrews, R., “Carbon Nanotube: Synthesis and
Functionalization,” PhD in Chemistry. The University ofEdinburgh, UK (2006).
Baker, R. T. K., “Catalytic Growth of Carbon Filaments,” Carbon27, 315–323 (1989).
Baker, R. T. K., M. A. Barber, P. S. Harris, F. S. Feates and R. J.Waite, “Nucleation and Growth of Carbon Deposits From theNickel Catalysed Decomposition of Acetylene,” J. Catal. 26,51–62 (1972).
Baughman, R. H., A. A. Zakhidov and W. A. de Heer, “CarbonNanotubes – The Route Toward Applications,” Science 297,787–792 (2002).
Box, G. E. P., W. G. Hunter and J. S. Hunter, “Statistics forExperiments – An Introduction to Design, Data Analysis andModel Building,” John Wiley & Sons, Inc., New York (1978).
Cassell, A. M., J. A. Raymakers, J. Kong and H. Dai, “LargeScale CVD Synthesis of Single-Walled Carbon Nanotubes,” J.Phys. Chem. B 103, 6484–6492 (1999).
Chai, S. P., S. H. S. Zein and A. R. Mohamed, “Preparation ofCarbon Nanotubes Over Cobalt-Containing Catalysts ViaCatalytic Decomposition of Methane,” Chem. Phys. Lett. 426,345–350 (2006).
Cheng, H. M., F. Li, G. Su, H. Y. Pan, L. L. He, X. Sun and M. S.Dresselhaus, “Large-Scale and Low-Cost Synthesis ofSingle-Walled Carbon Nanotubes by the Catalytic Pyrolysis ofHydrocarbons,” Appl. Phys. Lett. 72, 3282–3284 (1998).
Chernov, A. A., “Modern Crystallography,” Springer, Berlin,Germany (1984).
Cheung, C. L., A. Kurtz, H. Park and C. M. Lieber,“Diameter-Controlled Synthesis of Carbon Nanotubes,” J.Phys. Chem. B 106, 2429–2433 (2002).
Cui, Y. B., X. F. Wu, H. Wu, Y. J. Tian and Y. F. Chen,“Optimization of Synthesis for Carbon Nanotubes byChemical Vapor Deposition on Fe-Ni-Mo/MgO Catalyst,”Mater. Lett. 62, 3878–3880 (2008).
Das, N., A. Dalai, J. S. Soltan Mohammadzadeh and J. Adjaye,“The Effect of Feedstock and Process Conditions on theSynthesis of High Purity CNTs From AromaticHydrocarbons,” Carbon 44, 2236–2245 (2006).
Ding, F., A. Rosen and K. Bolton, “Molecular Dynamics Study ofthe Catalyst Particle Size Dependence on Carbon NanotubeGrowth,” J. Chem. Phys. 121, 2775–2779 (2004).
Dupuis, A. C., “The Catalyst in the CCVD of Carbon Nanotubes –A Review,” Prog. Mater. Sci. 50, 929–961 (2005).
Escobar, M., M. S. Moreno, R. J. Candal, M. C. Marchi, A. Caso,P. I. Polosecki, G. H. Rubiolo and S. Goyanes, “Synthesis ofCarbon Nanotubes by CVD: Effect of Acetylene Pressure onNanotubes Characteristics,” Appl. Surf. Sci. 254, 251–256(2007).
Finnie, P., A. Li-Pook-Than, J. Lefebvre and D. G. Austing,“Optimization of Methane Cold Wall Chemical VaporDeposition for the Production of Single Walled CarbonNanotubes and Devices,” Carbon 44, 3199–3206(2006).
Gohier, A., C. P. Ewels, T. M. Minea and M. A. Djouadi, “CarbonNanotube Growth Mechanism Switches From Tip toBase-Growth With Decreasing Catalyst Particle Size,” Carbon46, 1331–1338 (2008).
Grujicic, M., G. Cao and B. Gersten, “Optimization of theChemical Vapor Deposition Process for Carbon NanotubesFabrication,” Appl. Surf. Sci. 199, 90–106 (2002).
Guo, T., P. Nikolaev, A. Thess, D. T. Colbert and R. E. Smalley,“Catalytic Growth of Single-Walled Nanotubes by LaserVaporization,” Chem. Phys. Lett. 243, 49–54 (1995).
Hafner, J. H., M. J. Bronikowski, B. R. Azamian, P. Nikolaev, A.G. Rinzler, D. T. Colbert, K. A. Smith and R. E. Smalley,“Catalytic Growth of Single-Wall Carbon Nanotubes FromMetal Particles,” Chem. Phys. Lett. 296, 195–202 (1998).
Harutyunyana, A. R., G. Chen and P. C. Eklund, “Self-AssembledGrowth of Single-Walled Carbon Nanotubes by Pyrolysis ofMetal Organic Precursor,” Appl. Phys. Lett. 82, 4794–4796(2003).
Harutyunyana, A. R., T. Tokune and E. Mora, “Liquid as aRequired Catalyst Phase for Carbon Single-Walled NanotubeGrowth,” Appl. Phys. Lett. 87, 051919–051921 (2005).
Iijima, S., “Helical Microtubules of Graphitic Carbon,” Nature354, 56–58 (1991).
Jarrah, N. A., “Studying the Influence of Process Parameters onthe Catalytic Carbon Nanofibers Formation Using FactorialDesign,” Chem. Eng. J. 151, 367–371 (2009).
Kouravelou, K. B. and S. V. Sotirchos, “Dynamic Study of CarbonNanotubes Production by Chemical Vapor Deposition ofAlcohols,” Rev. Adv. Mater. Sci. 10, 243–248 (2005).
Kukovecz, A., D. Mehn, E. Nemes-Nagy, R. Szabo and I. Kiricsi,“Optimization of CCVD Synthesis Conditions for Single-Wall
| 504 | THE CANADIAN JOURNAL OF CHEMICAL ENGINEERING | | VOLUME 90, APRIL 2012 |

Carbon Nanotubes by Statistical Design of Experiments(DoE),” Carbon 43, 2842–2849 (2005).
Kumar, M. and Y. Ando, “Chemical Vapor Deposition of CarbonNanotubes: A Review on Growth Mechanism and MassProduction,” J. Nanosci. Nanotechnol. 10, 3739–3758(2010).
Li, Y., W. Kim, Y. Zhang, M. Rolandi, D. Wang and H. Dai,“Growth of Single-Walled Carbon Nanotubes From DiscreteCatalytic Nanoparticles of Various Sizes,” J. Phys. Chem. B105, 11424–11431 (2001a).
Li, Y., J. Liu, Y. Q. Wang and Z. L. Wang, “Preparation ofMonodispersed Fe-Mo Nanoparticles as the Catalyst for CVDSynthesis of Carbon Nanotubes,” Chem. Mater. 13, 1008–1014(2001b).
Li, Q. W., H. Yan, Y. Cheng, J. Zhang and Z. F. Liu, “A ScalableCVD Synthesis of High-Purity Single-Walled CarbonNanotubes With Porous MgO as Support Material,” J. Mater.Chem. 12, 1179–1183 (2002).
Li, Y. L., I. A. Kinloch, M. S. P. Shaffer, C. Singh, J. Geng, B. F. G.Johnson and A. H. Windle, “Growth of Single-Walled CarbonNanotubes by the Rapid Heating of a Supported Catalyst,”Chem. Mater. 16, 5637–5643 (2004).
Louchev, O. A., T. Laude, Y. Sato and H. Kanda,“Diffusion-Controlled Kinetics of Carbon Nanotube ForestGrowth by Chemical Vapor Deposition,” J. Chem. Phys. 118,7622–7634 (2003).
Maschmann, M. R., P. B. Amana, A. Goyal, Z. Iqbal, R. Gat andT. S. Fisher, “Parametric Study of Synthesis Conditions inPlasma-Enhanced CVD of High-Quality Single-Walled CarbonNanotubes,” Carbon 44, 10–18 (2006).
Moisala, A., A. G. Nasibulin and E. I. Kauppinen, “The Role ofMetal Nanoparticles in the Catalytic Production ofSingle-Walled Carbon Nanotubes – A Review,” J. Phys.Condens. Matter. 15, S3011–S3035 (2003).
Montgomery, D. C., “Design and Analysis of Experiments,” JohnWiley & Sons, Inc., New York (2001).
Niu, Z. Q. and Y. Fang, “Effects of Synthesis Time forSynthesizing Single-Walled Carbon Nanotubes OverMo-Fe-MgO Catalyst and Suggested Growth Mechanism,” J.Cryst. Growth 297, 228–233 (2006).
Patole, S. P., P. S. Alegaonkar, H. C. Lee and J. B. Yoo,“Optimization of Water Assisted Chemical Vapor DepositionParameters for Super Growth of Carbon Nanotubes,” Carbon46, 1987–1993 (2008).
Popov, V. N., “Carbon Nanotubes: Properties and Application,”Mat. Sci. Eng. R. Rep. 43, 61–102 (2004).
Porro, S., S. Musso, M. Giorcelli, A. Chiodoni and A. Tagliaferro,“Optimization of a Thermal-CVD System for CarbonNanotube Growth,” Physica E 37, 16–20 (2007).
Qian, W. Z., T. Liu, F. Wei, Z. W. Wang, G. H. Luo, H. Yu and Z.F. Li, “The Evaluation of the Gross Defects of CarbonNanotubes in a Continuous CVD Process,” Carbon 41,2613–2617 (2003).
Robertson, J., “Realistic Application of CNTs,” Mater. Today 7,46–52 (2004).
Romero, A., A. Garrido, A. Nieto-Marquez, A. R. De la Osa, A.De Lucas and J. L. Valverde, “The Influence of OperatingConditions on the Growth of Carbon Nanofibers on CarbonNanofibers-Supported Nickel Catalysts,” Appl. Catal. A Gen.319, 246–258 (2007).
See, C. H., K. J. MacKenzie, O. M. Dunens and A. T. Harris,“Multi-Parameter Optimisation of Carbon Nanotube Synthesisin Fluidised-Beds,” Chem. Eng. J. 64, 3614–3621 (2009).
Sharma, R., P. Rez, M. Brown, G. Du and M. M. J. Treacy,“Dynamic Observations of the Effect of Pressure andTemperature Conditions on the Selective Synthesis of CarbonNanotubes,” Nanotechnol. 18, 125602–125610 (2007).
Singh, C., M. Shaffer and A. Windle, “Production of ControlledArchitectures of Aligned Carbon Nanotubes by an InjectionChemical Vapour Deposition Method,” Carbon 41, 359–368(2003).
Teo, K. B. K., C. Singh, M. Chhowalla and W. I. Milne, “CatalyticSynthesis of Carbon Nanotubes and Nanofibers,” AmericanScientific Publishers, New York (2003).
Terrado, E., I. Tacchini, A. M. Benito, W. K. Maser and M. T.Martınez, “Optimizing Catalyst Nanoparticle Distribution toProduce Densely-Packed Carbon Nanotube Growth,” Carbon47, 1989–2001 (2009).
Terrones, M., “Carbon Nanotubes: Synthesis and Properties,Electronic Devices and Other Emerging Applications,” Int.Mater. Rev. 49, 325–377 (2004).
Tibbetts, G. G., “Why are Carbon Filaments Tubular?” J. Cryst.Growth 66, 632–638 (1984).
Valles, C., M. Perez-Mendoza, W. K. Maser, M. T. Martınez, L.Alvarez, J. L. Sauvajol and A. M. Benito, “Effects of Partialand Total Methane Flows on the Yield and StructuralCharacteristics of MWCNTs Produced by CVD,” Carbon 47,998–1004 (2009).
Venegoni, D., P. Serp, R. Feurer, Y. Kihn, C. Vahlas and P. Kalck,“Parametric Study for the Growth of Carbon Nanotubes byCatalytic Chemical Vapor Deposition in a Fluidized BedReactor,” Carbon 40, 1799–1807 (2002).
Veziri, C. M., G. Pilatos, G. N. Karanikolos, A. Labropoulos, K.Kordatos, V. Kasselouri-Rigopoulou and N. K. Kanellopoulos,“Growth and Optimization of Carbon Nanotubes in ActivatedCarbon by Catalytic Chemical Vapor Deposition,” Micropor.Mesopor. Mat. 110, 41–50 (2008).
Wagner, R. S. and W. C. Ellis, “Vapor–Liquid–Solid Mechanismof Single Crystal Growth,” Appl. Phys. Lett. 4, 89–90 (1964).
Yoshida, H., S. Takeda, T. Uchiyama, H. Kohno and Y. Homma,“Atomic-Scale In-Situ Observation of Carbon NanotubeGrowth From Solid State Iron Carbide Nanoparticles,” NanoLett. 8, 2082–2086 (2008).
Manuscript received September 23, 2010; revised manuscriptreceived November 9, 2010; accepted for publication December 9,2010.
| VOLUME 90, APRIL 2012 | | THE CANADIAN JOURNAL OF CHEMICAL ENGINEERING | 505 |