Optimal selection of distributed generating units and its ...
15
ELECTRICAL ENGINEERING Optimal selection of distributed generating units and its placement for voltage stability enhancement and energy loss minimization Pankita Mehta a , Praghnesh Bhatt a, * , Vivek Pandya b a Department of Electrical Engineering, C.S. Patel Institute of Technology, CHARUSAT, Changa, Gujarat, India b Department of Electrical Engineering, School of Technology, PDPU, Gandhinagar, Gujarat, India Received 31 July 2015; revised 24 October 2015; accepted 31 October 2015 KEYWORDS Continuation power flow (CPF); Distributed generation (DG); Eigenvalue; Modal analysis; Participation factor Abstract The integration of distributed generation (DG) in distribution network may significantly affect its performance. Transmission networks are no longer accountable solely for voltage security issues in distribution networks with penetration of DGs. The reactive power support from the DG sources greatly varies with the type of DG units and may potentially distress the larger portion of the network from the voltage stability aspects. This paper presents the analysis for the selection of the best type of DG unit among different categories and its optimal location that can enhance the voltage stability of distribution network with simultaneous improvement in voltage profile. Voltage sensitivity index and bus participation factors derived from continuation power flow and Modal Analysis, respectively, are used together for voltage stability assessment and placement of DGs. Changes in mode shapes and participation factors with the placement of DGs are comprehensively analyzed for 33 and 136 nodes radial distribution network. Ó 2015 Faculty of Engineering, Ain Shams University. Production and hosting by Elsevier B.V. This is an open access article under the CC BY-NC-ND license (http://creativecommons.org/licenses/by-nc-nd/4.0/). 1. Introduction The integration of DG is expected to play an increasingly important role in the electric power system infrastructure plan- ning and market operations. The integration of DG at the dis- tribution network results in operating situations that do not occur in a conventional system without generation directly connected at the distribution level [1]. Attention must be paid to effectively eliminate the potentially adverse impacts that DG penetration could impress on the electric delivery system. Inappropriate DG placement and sizing may increase system losses and network capital and operating costs. Hence, system- atic studies and planning are required to locate and operate the DGs at the distribution level in order to improve voltage pro- file, to reduce system losses, and to enhance the stability [1–3]. Power systems are expected to become more heavily loaded in the forthcoming years as the demand for electric power rises sharply. The economic and environmental concerns limit the construction of new transmission and generation capacity. This may result in deficit of local reactive power support in * Corresponding author. Tel.: +91 7567513461. E-mail address: [email protected] (P. Bhatt). Peer review under responsibility of Ain Shams University. Production and hosting by Elsevier Ain Shams Engineering Journal (2015) xxx, xxx–xxx Ain Shams University Ain Shams Engineering Journal www.elsevier.com/locate/asej www.sciencedirect.com http://dx.doi.org/10.1016/j.asej.2015.10.009 2090-4479 Ó 2015 Faculty of Engineering, Ain Shams University. Production and hosting by Elsevier B.V. This is an open access article under the CC BY-NC-ND license (http://creativecommons.org/licenses/by-nc-nd/4.0/). Please cite this article in press as: Mehta P et al., Optimal selection of distributed generating units and its placement for voltage stability enhancement and energy loss minimization, Ain Shams Eng J (2015), http://dx.doi.org/10.1016/j.asej.2015.10.009
-
Upload
khangminh22 -
Category
Documents
-
view
1 -
download
0
Transcript of Optimal selection of distributed generating units and its ...
Ain Shams Engineering Journal (2015) xxx, xxx–xxx
Ain Shams University
Ain Shams Engineering Journal
www.elsevier.com/locate/asejwww.sciencedirect.com
ELECTRICAL ENGINEERING
Optimal selection of distributed generating units
and its placement for voltage stability enhancement
and energy loss minimization
* Corresponding author. Tel.: +91 7567513461.
E-mail address: [email protected] (P. Bhatt).
Peer review under responsibility of Ain Shams University.
Production and hosting by Elsevier
http://dx.doi.org/10.1016/j.asej.2015.10.0092090-4479 � 2015 Faculty of Engineering, Ain Shams University. Production and hosting by Elsevier B.V.This is an open access article under the CC BY-NC-ND license (http://creativecommons.org/licenses/by-nc-nd/4.0/).
Please cite this article in press as: Mehta P et al., Optimal selection of distributed generating units and its placement for voltage stability enhancement and enminimization, Ain Shams Eng J (2015), http://dx.doi.org/10.1016/j.asej.2015.10.009
Pankita Mehtaa, Praghnesh Bhatt
a,*, Vivek Pandyab
aDepartment of Electrical Engineering, C.S. Patel Institute of Technology, CHARUSAT, Changa, Gujarat, IndiabDepartment of Electrical Engineering, School of Technology, PDPU, Gandhinagar, Gujarat, India
Received 31 July 2015; revised 24 October 2015; accepted 31 October 2015
KEYWORDS
Continuation power flow
(CPF);
Distributed generation (DG);
Eigenvalue;
Modal analysis;
Participation factor
Abstract The integration of distributed generation (DG) in distribution network may significantly
affect its performance. Transmission networks are no longer accountable solely for voltage security
issues in distribution networks with penetration of DGs. The reactive power support from the DG
sources greatly varies with the type of DG units and may potentially distress the larger portion of
the network from the voltage stability aspects. This paper presents the analysis for the selection of
the best type of DG unit among different categories and its optimal location that can enhance the
voltage stability of distribution network with simultaneous improvement in voltage profile. Voltage
sensitivity index and bus participation factors derived from continuation power flow and Modal
Analysis, respectively, are used together for voltage stability assessment and placement of DGs.
Changes in mode shapes and participation factors with the placement of DGs are comprehensively
analyzed for 33 and 136 nodes radial distribution network.� 2015 Faculty of Engineering, Ain Shams University. Production and hosting by Elsevier B.V. This is an
open access article under the CC BY-NC-ND license (http://creativecommons.org/licenses/by-nc-nd/4.0/).
1. Introduction
The integration of DG is expected to play an increasinglyimportant role in the electric power system infrastructure plan-ning and market operations. The integration of DG at the dis-
tribution network results in operating situations that do not
occur in a conventional system without generation directly
connected at the distribution level [1]. Attention must be paidto effectively eliminate the potentially adverse impacts thatDG penetration could impress on the electric delivery system.
Inappropriate DG placement and sizing may increase systemlosses and network capital and operating costs. Hence, system-atic studies and planning are required to locate and operate theDGs at the distribution level in order to improve voltage pro-
file, to reduce system losses, and to enhance the stability [1–3].Power systems are expected to become more heavily loaded
in the forthcoming years as the demand for electric power rises
sharply. The economic and environmental concerns limit theconstruction of new transmission and generation capacity.This may result in deficit of local reactive power support in
ergy loss
2 P. Mehta et al.
heavily loaded system which in turn causes the progressivevoltage decline [4–6]. The decline in voltage level is one ofimportant factors which restrict the increase of load served
by distribution companies. Therefore, it is necessary to con-sider voltage stability constraints for planning and operationof distribution systems. The shortage of reactive power can
be compensated by an increased share of DGs in distributionsystems to improve voltage stability. These DG sources possessdifferent reactive power generation capability and their impact
on the voltage stability should be studied distinctly. However,these types of studies are least reported in the literature.
The reactive power support using capacitor is one of themethods to reduce the power losses [7]; it is also shown that
placement of many capacitors at the incorrect positions willfurther increase line losses. The minimization of losses doesnot give any assurance of the maximization of benefits unless
the problem is well formulated [7–9]. However, the activepower support from the capacitors cannot be possible whichhave significant impact on system performance. Like capacitors
placement, higher penetration of the DG at the suboptimallocation may increase losses in distribution lines. Hence, it issignificantly essential to decide the size, location and type of
DG unit to be placed. Authors in [10,11] revealed that subopti-mal location for DG placement and improper sizing, wouldlead to higher losses as compared to the system without DG.
The issue of loss minimization in the distribution network is
reported in [12] where an analytical expression and the method-ology based on the exact loss formula are being used for theestimation of the optimal size and location of DG for reducing
the total power losses in primary distribution systems. How-ever, the proposed methodology is limited to DG type whichis capable of delivering real power only. Multiple DG units
placement using an improved analytical (IA) method to iden-tify the best location for DG for high loss reduction in large-scale primary distribution network is given in [13]. The tradi-
tional problem of minimizing losses in distribution networkshas been investigated using a single, deterministic demand levelwith the help of OPF in [14]. A new long term scheduling foroptimal allocation and sizing of different types of DG units
in the distribution networks in order to minimize power lossesare presented in [15]. In [16], author discussed the iterativesearch method for optimal sizing and siting of single DG for
minimization of cost and loss. The issue of voltage stability indistribution networks and the impact of DG units on it drawattention in recent period. A meta-heuristic technique based
on backtracking search optimization algorithm (BSOA) is pre-sented in [17] with objectives to reduce power loss and improvevoltage profile in RDN considering the DG type which caninject active and reactive power both. In [18], BSOA and set
of fuzzy expert roles using loss sensitivities factors and bus volt-ages are used to identify the DG locations. The Optimal sizeand location of multiple DGs are determined with particle
swarm optimization using constriction factor approach in [19]considering predetermines annual load growth with voltageregulation as constraint. Simultaneous placement of DG and
fixed capacitor in radial distribution network with time varyingload in order to decrease reactive power loss, energy and powerloss reduction, improvement of voltage profile and voltage sta-
bility has been discussed in [20].A new voltage stability index is introduced in [21] by
simplified load flow equations to seek the most sensitive buses
Please cite this article in press as: Mehta P et al., Optimal selection of distributed genminimization, Ain Shams Eng J (2015), http://dx.doi.org/10.1016/j.asej.2015.10.009
to voltage collapse in radial networks. A method for DGplacement in radial distribution network based on Voltagesecurity margin (VSM) enhancement and loss reduction is
presented in [22], which use CPF to identify the most sensitivebus to voltage collapse. The work in [23] is suggested thatvoltage magnitude is not a suitable indicator for the proximity
to voltage collapse. Author [24] has described a technique forselection of buses in a subtransmission system for location ofDG and determination of their optimum capacities by
minimizing transmission losses and improvement in voltageprofile.
A method is presented for locating and sizing of DGs toenhance voltage stability and to reduce network losses simulta-
neously in [25], where Modal analysis and continuous powerflow are used for DG placement in the event of reactive powerdeficit. The enhancement of voltage profile, loadability with
simultaneous reduction distribution losses considering voltagerelated constraint is discussed in [26].
Based on the literature review discussed above, it has been
observed that the different issues in the field of distributed gen-eration are covered which are based on optimal location andsizing of DG, loss minimization, voltage stability enhancement
and reconfiguration of distribution network after the integra-tion of DG resources. This paper is mainly focused on voltagestability analysis with different types of distributed generatingunits which were not addressed earlier in the literature. The
impact of DG operating in a voltage regulation mode withvarying reactive power support has been analyzed for the volt-age stability enhancement. Further, the optimal location of
DG is ascertained at the weakest bus which is determined byCPF and modal analysis. The variation in mode shapes withthe variation in DG types and its locations have been compre-
hensively studied for the analysis of voltage stability. Themode shapes and participation factors are used to identifythe weakest region where placement of DG may have the ben-
eficiary effect to enhance the voltage stability. The objectivesof this paper are as follows:
(1) To perform power flow analysis on a Test systems (33-
nodes radial distribution network [18] and 136-nodesradial distribution [35]) without considering any DGunits. These systems are considered as base case test
system.(2) To identify the weakest bus for the base case test systems
by performing continuation power flow and Modal
analysis.(3) To determine and rank the buses which are more prone
to voltage instability based on the mode shapes partici-pation factors obtained through the Modal analysis.
(4) To ascertain the type of DG units and its placementmethodology in a system to enhance voltage stabilitymargin.
(5) To compare the impact of different types of DG units toimprove the performance of distribution system.
2. DG technologies and their impact on voltage stability
DG technologies are classified based on their capability ofinjecting real and/or reactive power in the system. Accord-ingly, DG technologies are grouped in the following manner.
erating units and its placement for voltage stability enhancement and energy loss
Optimal selection of generating units and its placement 3
2.1. Type 1: DG capable of injecting both active power (P) andreactive power (Q)
DG units that are based on synchronous machine for smallhydro, geothermal, and combined cycles fall in Type 1 cate-
gory. The DG with the synchronous generators may be mod-eled either with constant terminal voltage control (voltagecontrol mode) or with constant power factor control (powerfactor control). The DGs with the voltage control mode are
considered as PV nodes and DGs with the power factor con-trol mode are considered as PQ nodes [27]. In this work, theDG with synchronous generator of Type 1 category is modeled
as PV nodes.
2.2. Type 2: DG capable of injecting active power (P) only
Photovoltaic (PV), micro turbines, fuel cells, which are inte-grated to the main grid with the help of converters/inverters[28,29] are the examples of Type 2 category. In this work, it
is assumed that DG units in this category neither absorb nordeliver reactive power to system and operate with unity powerfactor only.
2.3. Type 3: DG capable of injecting reactive power (Q) only
The DG units equipped with synchronous compensator areconsidered as Type 3 category.
2.4. Type 4: DG capable of injecting active power (P), but
consuming reactive power (Q)
Fixed speed squirrel cage induction generator (SQIG) used forwind turbine generating (WTG) system falls under this cate-gory. SQIG in super-synchronous mode is capable of injecting
real power in the system whereas it demands reactive powerfrom the system.
Thus, it is worthwhile to note that the type of DG technol-ogy adopted will have a significant bearing on the performance
of distribution network. The installation of synchronousmachine-based DG units that are close to the loads can leadto beneficial impact on system voltage stability margin; on
another end, the case with an induction generator may havedetrimental impact on the system stability margin. Therefore,it is an utmost requirement to analyse the effect of different
types of DG technologies on the voltage stability to enjoythe system wide benefits.
3. Modal analysis and continuation power flow for voltage
stability analysis
The penetration of different types of DGs at the distribution
network greatly affects the voltage profile and voltage stabilitylimits due to their different reactive power generation capabil-ity. While integrating DGs in the system, it is not only impor-tant to maintain acceptable voltage magnitudes, but it is also
crucial to ensure that the steady-state loading should not reachthe critical state at which voltage collapse may occur.
Modal analysis is a static approach that captures the snap-
shots of the system conditions at various time frames along thetime domain trajectories. It gives the voltage stability related
Please cite this article in press as: Mehta P et al., Optimal selection of distributed geneminimization, Ain Shams Eng J (2015), http://dx.doi.org/10.1016/j.asej.2015.10.009
information from a system wide perspective and clearly identi-fies the areas that are prone to voltage instability. In addition,it gives the information about the voltage instability character-
istic, what are the key factors influencing the voltage instabilityand which measures are the most effective to enhance the volt-age stability [30–32].
Continuation power flow (CPF) is a tool for steady statevoltage stability analysis which reformulates the conventionalpower flow equations so that they remain well-conditioned at
all possible loading conditions. The CPF can successfullydetermine a distance from an operating point to a voltage col-lapse which may be measured in terms of physical quantitiessuch as load level, active power flow and reactive power gener-
ation/absorption capability of network [33].
3.1. Modal analysis
Incremental voltage of the buses from voltage stability view
point is of great importance, and also useful to identify thebuses for addition of DG. The incremental power flow equa-tions are used for obtaining incremental voltage sensitivities
[30,34] as given in (1) where elements of Jacobian matrix givesthe sensitivity between power flow bus voltage changes.
DP
DQ
� �¼ JPh JPV
JQh JQV
� �Dh
DV
� �ð1Þ
where DP = incremental change in bus real power;DQ = incremental change in bus reactive power injection;Dh = incremental change in bus voltage angle; DV= incre-
mental change in bus voltage magnitude. JPh ¼ @P@h, JPV ¼ @P
@V,
JQh ¼ @Q@h and JQV ¼ @Q
@Vare the elements of Jacobian. Voltage
stability of system is affected by both active and reactive
power. However at each operating point active power P is keptconstant and voltage stability is evaluated by considering theincremental relationship between reactive power Q and busvoltage magnitude V.
Considering, DP ¼ 0; the incremental relationship betweenreactive power Q and bus voltage magnitude V is given as (2):
DV ¼ J�1R DQ ð2Þ
where the reduced Jacobian Matrix ðJRÞ is given by (3):
JR ¼ ½JQV � JQhJ�1PhJPV� ð3Þ
Let,
JR ¼ nKg ð4Þwhere n and g are right and left eigenvector matrices of JR,respectively. K is diagonal eigenvalue matrix of JR; Inverting(4) yields
J�1R ¼ nK�1g ð5Þ
and substituting (5) in (2) results in
DV ¼ nK�1gDQ ð6Þ
DV ¼Xi
nigiki
DQ ð7Þ
where gi is the ith row of the left eigenvector of JR, and ni isthe ith column of the right eigenvector. The ith mode of theQ–V response is defined by the ith eigenvalue ki and the corre-sponding left and right eigenvectors gi&ni.
rating units and its placement for voltage stability enhancement and energy loss
4 P. Mehta et al.
Since, n�1 ¼ g, equation (6) may be written as follows:
gDV ¼ K�1gDQ ð8ÞDefine v ¼ gDV as the vector of modal voltage variations
and q ¼ gDQ as the vector of modal reactive power variations,
so (8) can be written as follows:
v ¼ K�1q ð9Þ
Thus for the ith mode, the vector for the modal voltagevariations can be written as
vi ¼ 1
kiqi ð10Þ
The magnitude of ki determines the degree of stability of
the ith modal voltage. The smaller the magnitude of positiveki, ith modal voltage is much closer to be unstable. The relativecontribution of the power at bus k in mode i is given by the bus
participation factor:
Pki ¼ nkigki ð11ÞPki indicates the contribution of the ith eigenvalue to the V-Qsensitivity at bus k. The participation factors determine the
most critical areas which lead the system to instability.
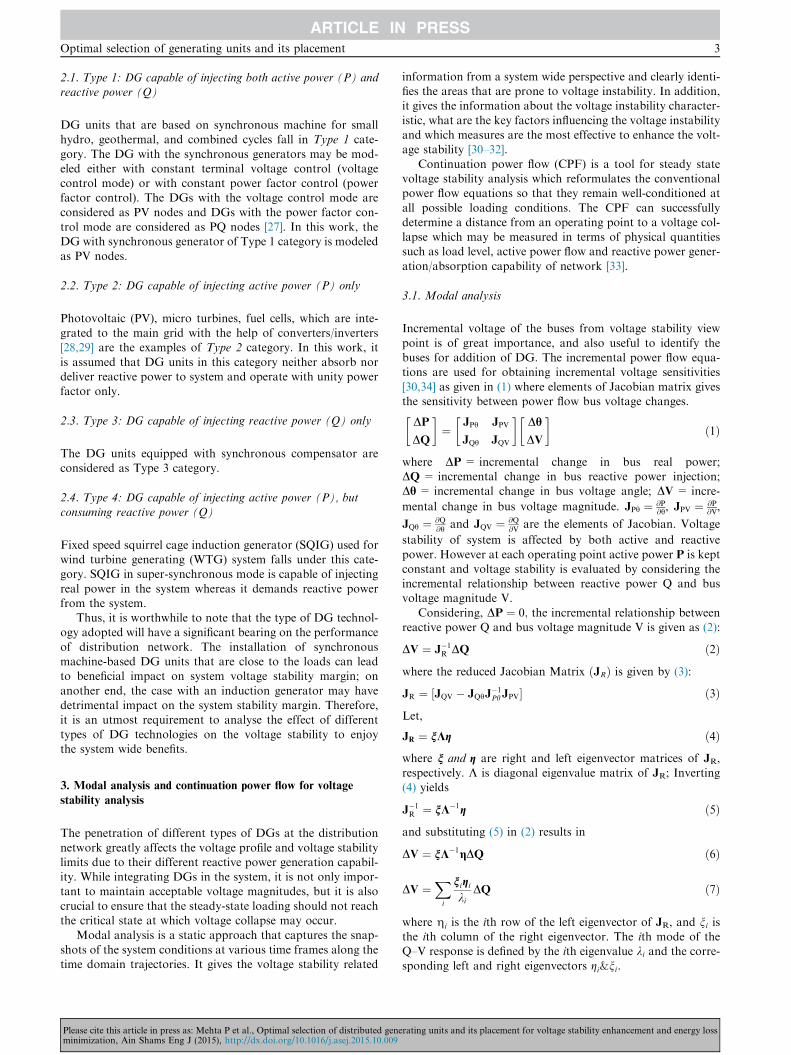
3.2. Continuation power flow
The continuation power flow is an iterative process that
employs a predictor–corrector scheme as shown in Fig. 1a tofind a solution path of a set of power flow equations that havebeen reformulated to include a load parameter [33,34]. The
process starts from a known solution (i.e. from Point A corre-sponding to base case loading kk) and uses a tangent predictorto estimate a subsequent solution corresponding to a different
value of the load parameter (i.e. point B). This estimate is thencorrected using a conventional power flow method with a sys-tem load assumed to be fixed (i.e. Point C). The CPF method
stresses the system up to kcriticalk which corresponds to critical
loading in the system where the voltage instability occurs. In
this paper, the increase in active and reactive load takes theform as given in (12) and (13):
Predictor
Corrector
Critical Point
Exact Solution
Bus
Vol
tage
Loading, λ
A
EDC
B
FG
Figure 1a Sequence of calculations in CPF [5].
Please cite this article in press as: Mehta P et al., Optimal selection of distributed genminimization, Ain Shams Eng J (2015), http://dx.doi.org/10.1016/j.asej.2015.10.009
PL ¼ kPL0 ð12Þ
QL ¼ kQL0 ð13Þwhere k is the loading parameter which ranges from
0 6 k 6 kcriticalk . PL0 and QL0 are active and reactive loads,
respectively, in the base case. The generated active power
(PG) by the generators is also increased simultaneously withthe same scaling factor to cater the increased load demandand it is given by (14):
PG ¼ kPG0 ð14Þ
4. Optimal placement of DG units based on voltage stability
enhancement
The 33- and 136-node radial distribution systems given in[18,35], respectively, are used for the power flow analysis andto propose a methodology for placement of the different typesof DG units with the objectives to reduce power losses,
improve voltage profile and enhance the voltage stability mar-gin of the system. The total active and reactive loads for 33-node RDN are 3715 kW and 2300 kvar, respectively. For
136-node RDN, the active and reactive loads are 18214 kWand 7933 kvar, respectively.
4.1. Steps for DG placement
The placement of different types of DG in distribution net-work greatly affects the voltage profile at the different busesand power flow in feeders, thus alters the active and reactive
power losses in a system. The variation in voltage profile andlosses in a system also varies with the different types of DGtechnologies discussed in Section 2. Hence, the attention must
be paid not only to decide the location for DG placement butthe types of DG technologies need to be considered. In thiswork, voltage stability enhancement is considered to be the
major criteria for the DG placement to ensure the stable oper-ation of the system with acceptable voltage levels at the con-sumer nodes. The procedure adopted to find out the optimal
locations for DG placement along with selection of different
Critical PointBus
Vol
tage
Loading, λ
A
C
B
Base Case Loading
Stressed Loading
Figure 1b Typical PV curve.
erating units and its placement for voltage stability enhancement and energy loss
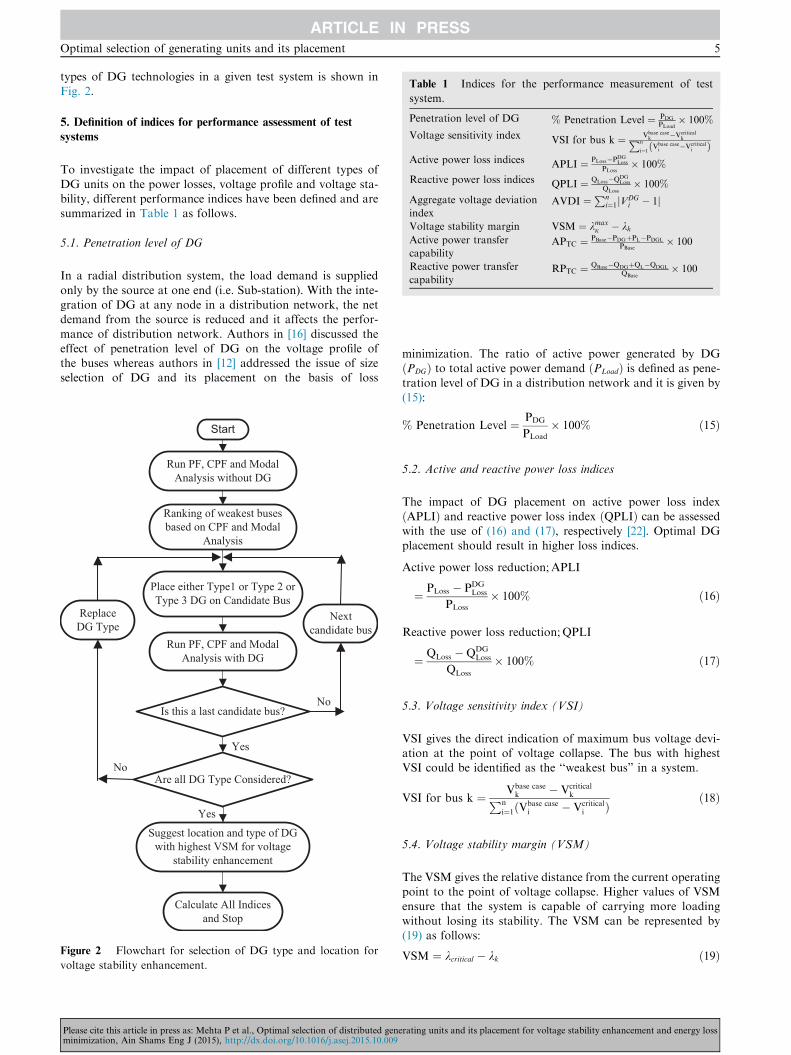
Table 1 Indices for the performance measurement of test
system.
Penetration level of DG % Penetration Level ¼ PDG
PLoad� 100%
Voltage sensitivity index VSI for bus k ¼ Vbase casek �Vcritical
kPn
i¼1Vbase casei �Vcritical
ið ÞActive power loss indices APLI ¼ PLoss�PDG
Loss
PLoss� 100%
Reactive power loss indices QPLI ¼ QLoss�QDGLoss
QLoss� 100%
Aggregate voltage deviation
indexAVDI ¼ Pn
i¼1jVDGi � 1j
Voltage stability margin VSM ¼ kmaxj � kk
Active power transfer
capabilityAPTC ¼ PBase�PDGþPL�PDGL
PBase� 100
Reactive power transfer
capabilityRPTC ¼ QBase�QDGþQL�QDGL
QBase� 100
Optimal selection of generating units and its placement 5
types of DG technologies in a given test system is shown inFig. 2.
5. Definition of indices for performance assessment of test
systems
To investigate the impact of placement of different types of
DG units on the power losses, voltage profile and voltage sta-bility, different performance indices have been defined and aresummarized in Table 1 as follows.
5.1. Penetration level of DG
In a radial distribution system, the load demand is supplied
only by the source at one end (i.e. Sub-station). With the inte-gration of DG at any node in a distribution network, the netdemand from the source is reduced and it affects the perfor-
mance of distribution network. Authors in [16] discussed theeffect of penetration level of DG on the voltage profile ofthe buses whereas authors in [12] addressed the issue of sizeselection of DG and its placement on the basis of loss
Is this a last candidate bus?
Run PF, CPF and Modal Analysis without DG
Start
Ranking of weakest buses based on CPF and Modal
Analysis
Place either Type1 or Type 2 or Type 3 DG on Candidate Bus
Run PF, CPF and Modal Analysis with DG
Are all DG Type Considered?
Calculate All Indices and Stop
Next candidate bus
ReplaceDG Type
Yes
No
Yes
No
Suggest location and type of DG with highest VSM for voltage
stability enhancement
Figure 2 Flowchart for selection of DG type and location for
voltage stability enhancement.
Please cite this article in press as: Mehta P et al., Optimal selection of distributed geneminimization, Ain Shams Eng J (2015), http://dx.doi.org/10.1016/j.asej.2015.10.009
minimization. The ratio of active power generated by DGðPDGÞ to total active power demand ðPLoadÞ is defined as pene-
tration level of DG in a distribution network and it is given by(15):
% Penetration Level ¼ PDG
PLoad
� 100% ð15Þ
5.2. Active and reactive power loss indices
The impact of DG placement on active power loss indexðAPLIÞ and reactive power loss index ðQPLIÞ can be assessedwith the use of (16) and (17), respectively [22]. Optimal DGplacement should result in higher loss indices.
Active power loss reduction;APLI
¼ PLoss � PDGLoss
PLoss
� 100% ð16Þ
Reactive power loss reduction; QPLI
¼ QLoss �QDGLoss
QLoss
� 100% ð17Þ
5.3. Voltage sensitivity index (VSI)
VSI gives the direct indication of maximum bus voltage devi-ation at the point of voltage collapse. The bus with highestVSI could be identified as the ‘‘weakest bus” in a system.
VSI for bus k ¼ Vbase casek � Vcritical
kPni¼1ðVbase case
i � Vcriticali Þ ð18Þ
5.4. Voltage stability margin (VSM)
The VSM gives the relative distance from the current operatingpoint to the point of voltage collapse. Higher values of VSMensure that the system is capable of carrying more loading
without losing its stability. The VSM can be represented by(19) as follows:
VSM ¼ kcritical � kk ð19Þ
rating units and its placement for voltage stability enhancement and energy loss
6 P. Mehta et al.
Here, kk is the reference loading, which is assumed to bezero. kcritical is the loading at the point of voltage instability.
5.5. Aggregate voltage deviation index (AVDI)
AVDI gives the aggregate bus voltage deviation after the opti-mal DG placement in test system. The lowest value of AVDI
indicates more improvement in bus voltage profile at all thebuses after the placement of DG as compared to base case.AVDI is given by (20):
AVDI ¼Xn
i¼1
jVDGi � 1j ð20Þ
5.6. Power transfer capacity (PTC) of distribution network
The increase in electric demand requires to enhance the powertransfer capability of the existing distribution network tomaintain reliability and continuity of supply. Otherwise the
new construction of distribution lines is required, which isnot a practical solution always. Distributed generation canonly provide the alternatives to strengthen the existing distri-
bution network without addition of new lines. The powertransfer capacity of distribution network with the placementof DG units can be assessed as follows [22]. The active andreactive power transfer capacities are given by (21) and (22),
respectively:
APTC ¼ PBase � PDG þ PLoss � PDG;Loss
PBase
� 100 ð21Þ
RPTC ¼ QBase �QDG þQLoss �QDG;Loss
QBase
� 100 ð22Þ
where PBase, QBase are active and reactive power of the slack busin base case, respectively; PDG, QDG are active and reactivepower of the slack bus with DG unit, respectively; PLoss,
QLoss are active and reactive power losses in the distributionlines in base case, respectively; PDG;Loss, QDG;Loss are active
and reactive power losses in distribution lines with DG units,respectively.
6. Results and discussions
In this work, placements of different types of DG discussed inSection 2 are considered for the analysis. Power flow, continu-
ation power flow and Modal analysis are performed to selectthe best type among different DG units and to ensure itsoptimal location that can enhance the voltage stability. The
penetration level of 26% is considered for both test systems.i.e. 33-nodes and 136-nodes RDNs.
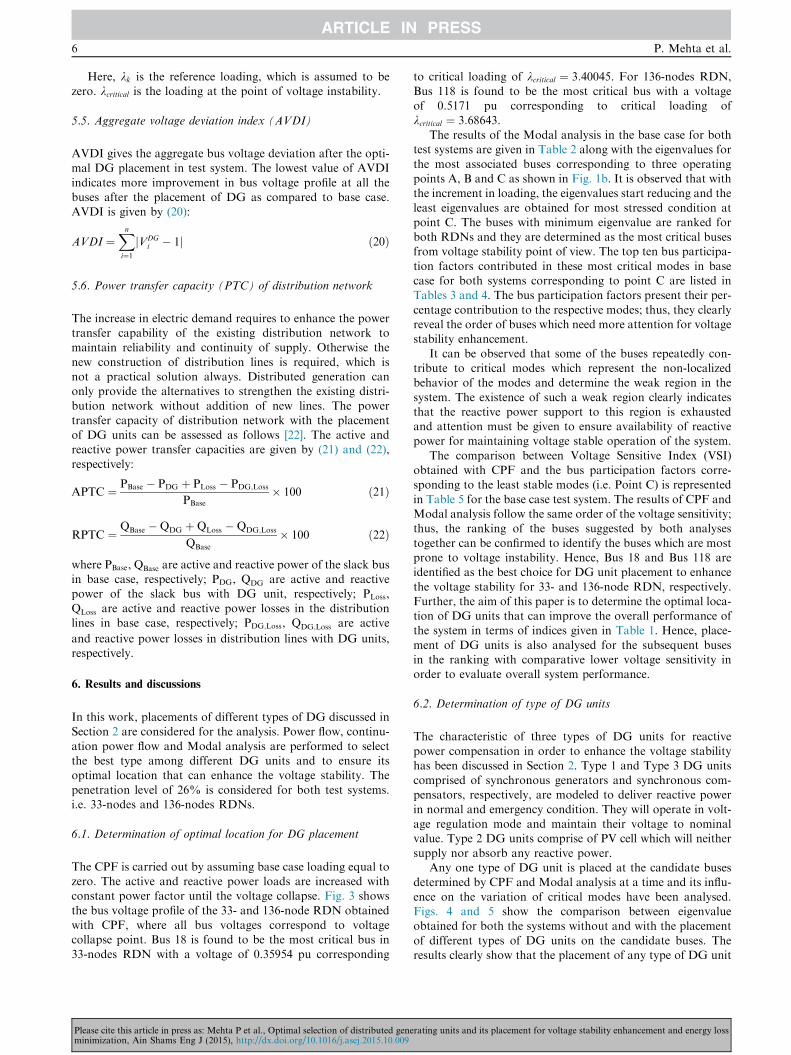
6.1. Determination of optimal location for DG placement
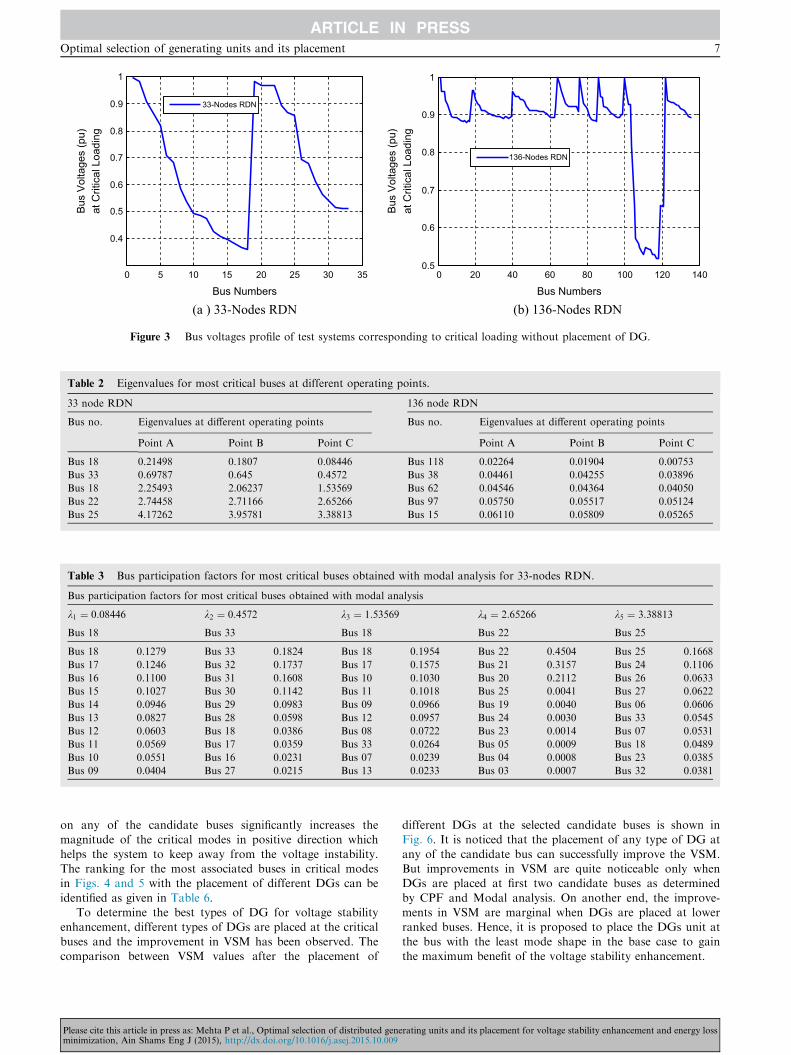
The CPF is carried out by assuming base case loading equal tozero. The active and reactive power loads are increased withconstant power factor until the voltage collapse. Fig. 3 shows
the bus voltage profile of the 33- and 136-node RDN obtainedwith CPF, where all bus voltages correspond to voltagecollapse point. Bus 18 is found to be the most critical bus in
33-nodes RDN with a voltage of 0.35954 pu corresponding
Please cite this article in press as: Mehta P et al., Optimal selection of distributed genminimization, Ain Shams Eng J (2015), http://dx.doi.org/10.1016/j.asej.2015.10.009
to critical loading of kcritical ¼ 3:40045. For 136-nodes RDN,Bus 118 is found to be the most critical bus with a voltageof 0.5171 pu corresponding to critical loading of
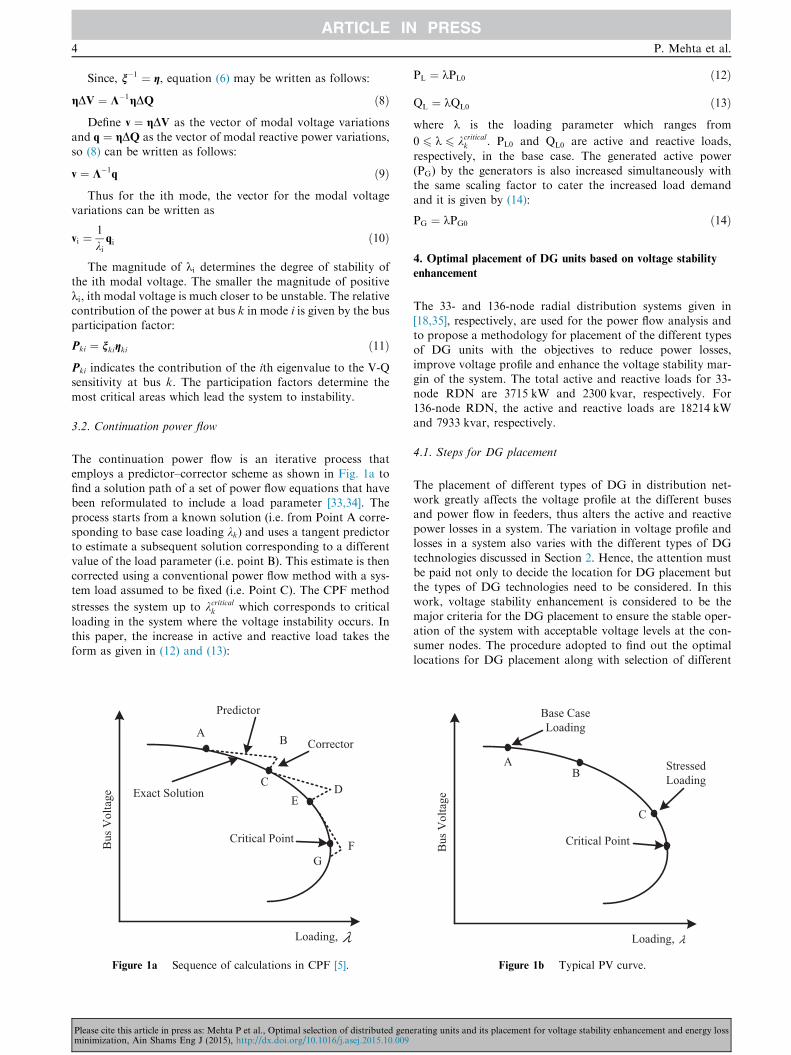
kcritical ¼ 3:68643.The results of the Modal analysis in the base case for both
test systems are given in Table 2 along with the eigenvalues for
the most associated buses corresponding to three operatingpoints A, B and C as shown in Fig. 1b. It is observed that withthe increment in loading, the eigenvalues start reducing and the
least eigenvalues are obtained for most stressed condition atpoint C. The buses with minimum eigenvalue are ranked forboth RDNs and they are determined as the most critical busesfrom voltage stability point of view. The top ten bus participa-
tion factors contributed in these most critical modes in basecase for both systems corresponding to point C are listed inTables 3 and 4. The bus participation factors present their per-
centage contribution to the respective modes; thus, they clearlyreveal the order of buses which need more attention for voltagestability enhancement.
It can be observed that some of the buses repeatedly con-tribute to critical modes which represent the non-localizedbehavior of the modes and determine the weak region in the
system. The existence of such a weak region clearly indicatesthat the reactive power support to this region is exhaustedand attention must be given to ensure availability of reactivepower for maintaining voltage stable operation of the system.
The comparison between Voltage Sensitive Index (VSI)obtained with CPF and the bus participation factors corre-sponding to the least stable modes (i.e. Point C) is represented
in Table 5 for the base case test system. The results of CPF andModal analysis follow the same order of the voltage sensitivity;thus, the ranking of the buses suggested by both analyses
together can be confirmed to identify the buses which are mostprone to voltage instability. Hence, Bus 18 and Bus 118 areidentified as the best choice for DG unit placement to enhance
the voltage stability for 33- and 136-node RDN, respectively.Further, the aim of this paper is to determine the optimal loca-tion of DG units that can improve the overall performance ofthe system in terms of indices given in Table 1. Hence, place-
ment of DG units is also analysed for the subsequent busesin the ranking with comparative lower voltage sensitivity inorder to evaluate overall system performance.
6.2. Determination of type of DG units
The characteristic of three types of DG units for reactive
power compensation in order to enhance the voltage stabilityhas been discussed in Section 2. Type 1 and Type 3 DG unitscomprised of synchronous generators and synchronous com-pensators, respectively, are modeled to deliver reactive power
in normal and emergency condition. They will operate in volt-age regulation mode and maintain their voltage to nominalvalue. Type 2 DG units comprise of PV cell which will neither
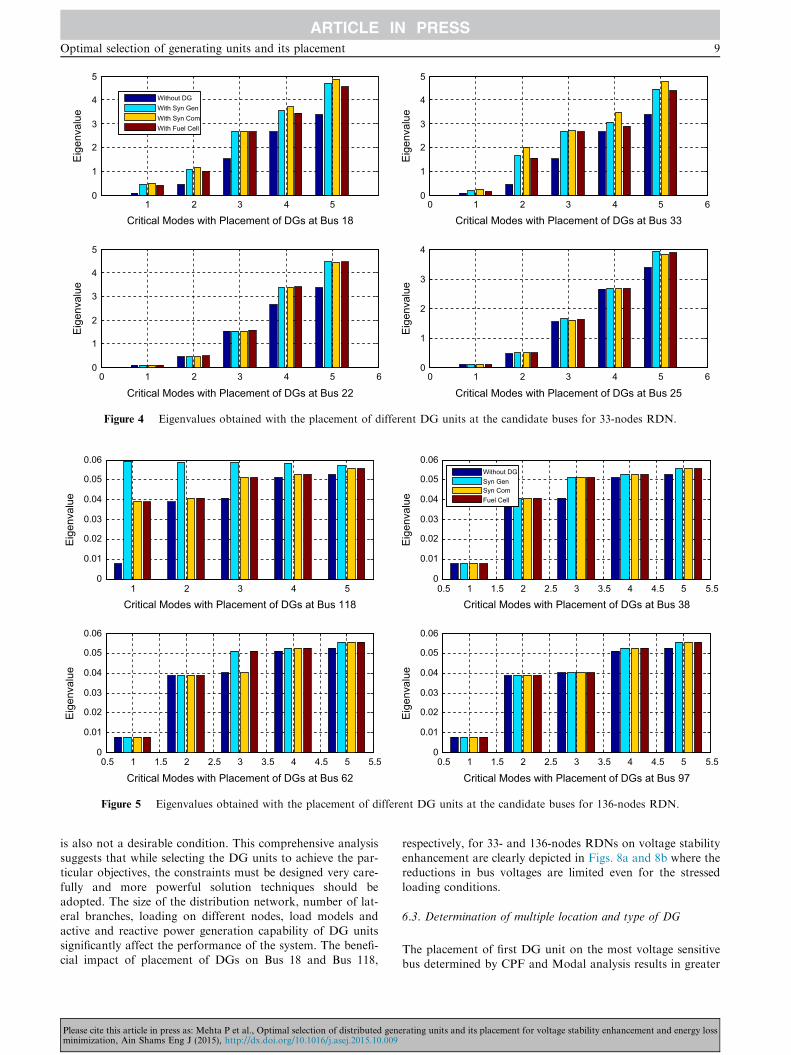
supply nor absorb any reactive power.Any one type of DG unit is placed at the candidate buses
determined by CPF and Modal analysis at a time and its influ-
ence on the variation of critical modes have been analysed.Figs. 4 and 5 show the comparison between eigenvalueobtained for both the systems without and with the placement
of different types of DG units on the candidate buses. Theresults clearly show that the placement of any type of DG unit
erating units and its placement for voltage stability enhancement and energy loss
(a ) 33-Nodes RDN (b) 136-Nodes RDN
0 5 10 15 20 25 30 35
0.4
0.5
0.6
0.7
0.8
0.9
1
Bus Numbers
Bus
Vol
tage
s (p
u)at
Crit
ical
Loa
ding
0 20 40 60 80 100 120 1400.5
0.6
0.7
0.8
0.9
1
Bus Numbers
Bus
Vol
tage
s (p
u)at
Crit
ical
Loa
ding
33-Nodes RDN
136-Nodes RDN
Figure 3 Bus voltages profile of test systems corresponding to critical loading without placement of DG.
Table 2 Eigenvalues for most critical buses at different operating points.
33 node RDN 136 node RDN
Bus no. Eigenvalues at different operating points Bus no. Eigenvalues at different operating points
Point A Point B Point C Point A Point B Point C
Bus 18 0.21498 0.1807 0.08446 Bus 118 0.02264 0.01904 0.00753
Bus 33 0.69787 0.645 0.4572 Bus 38 0.04461 0.04255 0.03896
Bus 18 2.25493 2.06237 1.53569 Bus 62 0.04546 0.04364 0.04050
Bus 22 2.74458 2.71166 2.65266 Bus 97 0.05750 0.05517 0.05124
Bus 25 4.17262 3.95781 3.38813 Bus 15 0.06110 0.05809 0.05265
Table 3 Bus participation factors for most critical buses obtained with modal analysis for 33-nodes RDN.
Bus participation factors for most critical buses obtained with modal analysis
k1 ¼ 0:08446 k2 ¼ 0:4572 k3 ¼ 1:53569 k4 ¼ 2:65266 k5 ¼ 3:38813
Bus 18 Bus 33 Bus 18 Bus 22 Bus 25
Bus 18 0.1279 Bus 33 0.1824 Bus 18 0.1954 Bus 22 0.4504 Bus 25 0.1668
Bus 17 0.1246 Bus 32 0.1737 Bus 17 0.1575 Bus 21 0.3157 Bus 24 0.1106
Bus 16 0.1100 Bus 31 0.1608 Bus 10 0.1030 Bus 20 0.2112 Bus 26 0.0633
Bus 15 0.1027 Bus 30 0.1142 Bus 11 0.1018 Bus 25 0.0041 Bus 27 0.0622
Bus 14 0.0946 Bus 29 0.0983 Bus 09 0.0966 Bus 19 0.0040 Bus 06 0.0606
Bus 13 0.0827 Bus 28 0.0598 Bus 12 0.0957 Bus 24 0.0030 Bus 33 0.0545
Bus 12 0.0603 Bus 18 0.0386 Bus 08 0.0722 Bus 23 0.0014 Bus 07 0.0531
Bus 11 0.0569 Bus 17 0.0359 Bus 33 0.0264 Bus 05 0.0009 Bus 18 0.0489
Bus 10 0.0551 Bus 16 0.0231 Bus 07 0.0239 Bus 04 0.0008 Bus 23 0.0385
Bus 09 0.0404 Bus 27 0.0215 Bus 13 0.0233 Bus 03 0.0007 Bus 32 0.0381
Optimal selection of generating units and its placement 7
on any of the candidate buses significantly increases themagnitude of the critical modes in positive direction which
helps the system to keep away from the voltage instability.The ranking for the most associated buses in critical modesin Figs. 4 and 5 with the placement of different DGs can be
identified as given in Table 6.To determine the best types of DG for voltage stability
enhancement, different types of DGs are placed at the critical
buses and the improvement in VSM has been observed. Thecomparison between VSM values after the placement of
Please cite this article in press as: Mehta P et al., Optimal selection of distributed geneminimization, Ain Shams Eng J (2015), http://dx.doi.org/10.1016/j.asej.2015.10.009
different DGs at the selected candidate buses is shown inFig. 6. It is noticed that the placement of any type of DG at
any of the candidate bus can successfully improve the VSM.But improvements in VSM are quite noticeable only whenDGs are placed at first two candidate buses as determined
by CPF and Modal analysis. On another end, the improve-ments in VSM are marginal when DGs are placed at lowerranked buses. Hence, it is proposed to place the DGs unit at
the bus with the least mode shape in the base case to gainthe maximum benefit of the voltage stability enhancement.
rating units and its placement for voltage stability enhancement and energy loss
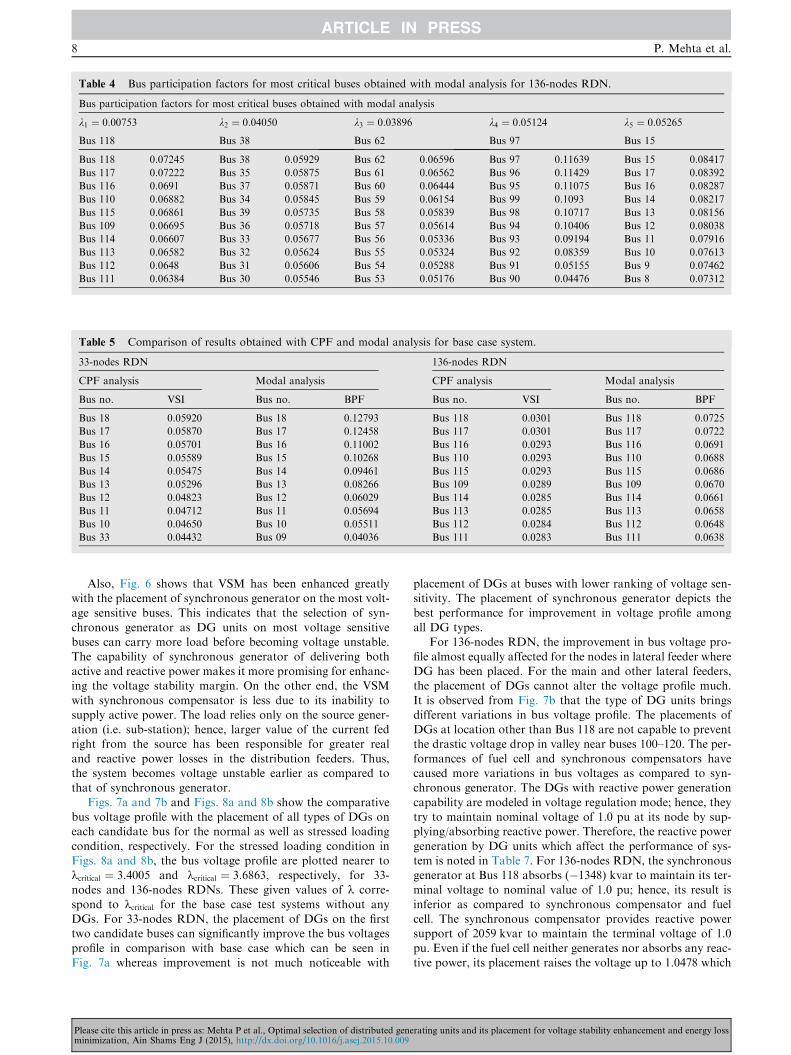
Table 4 Bus participation factors for most critical buses obtained with modal analysis for 136-nodes RDN.
Bus participation factors for most critical buses obtained with modal analysis
k1 ¼ 0:00753 k2 ¼ 0:04050 k3 ¼ 0:03896 k4 ¼ 0:05124 k5 ¼ 0:05265
Bus 118 Bus 38 Bus 62 Bus 97 Bus 15
Bus 118 0.07245 Bus 38 0.05929 Bus 62 0.06596 Bus 97 0.11639 Bus 15 0.08417
Bus 117 0.07222 Bus 35 0.05875 Bus 61 0.06562 Bus 96 0.11429 Bus 17 0.08392
Bus 116 0.0691 Bus 37 0.05871 Bus 60 0.06444 Bus 95 0.11075 Bus 16 0.08287
Bus 110 0.06882 Bus 34 0.05845 Bus 59 0.06154 Bus 99 0.1093 Bus 14 0.08217
Bus 115 0.06861 Bus 39 0.05735 Bus 58 0.05839 Bus 98 0.10717 Bus 13 0.08156
Bus 109 0.06695 Bus 36 0.05718 Bus 57 0.05614 Bus 94 0.10406 Bus 12 0.08038
Bus 114 0.06607 Bus 33 0.05677 Bus 56 0.05336 Bus 93 0.09194 Bus 11 0.07916
Bus 113 0.06582 Bus 32 0.05624 Bus 55 0.05324 Bus 92 0.08359 Bus 10 0.07613
Bus 112 0.0648 Bus 31 0.05606 Bus 54 0.05288 Bus 91 0.05155 Bus 9 0.07462
Bus 111 0.06384 Bus 30 0.05546 Bus 53 0.05176 Bus 90 0.04476 Bus 8 0.07312
Table 5 Comparison of results obtained with CPF and modal analysis for base case system.
33-nodes RDN 136-nodes RDN
CPF analysis Modal analysis CPF analysis Modal analysis
Bus no. VSI Bus no. BPF Bus no. VSI Bus no. BPF
Bus 18 0.05920 Bus 18 0.12793 Bus 118 0.0301 Bus 118 0.0725
Bus 17 0.05870 Bus 17 0.12458 Bus 117 0.0301 Bus 117 0.0722
Bus 16 0.05701 Bus 16 0.11002 Bus 116 0.0293 Bus 116 0.0691
Bus 15 0.05589 Bus 15 0.10268 Bus 110 0.0293 Bus 110 0.0688
Bus 14 0.05475 Bus 14 0.09461 Bus 115 0.0293 Bus 115 0.0686
Bus 13 0.05296 Bus 13 0.08266 Bus 109 0.0289 Bus 109 0.0670
Bus 12 0.04823 Bus 12 0.06029 Bus 114 0.0285 Bus 114 0.0661
Bus 11 0.04712 Bus 11 0.05694 Bus 113 0.0285 Bus 113 0.0658
Bus 10 0.04650 Bus 10 0.05511 Bus 112 0.0284 Bus 112 0.0648
Bus 33 0.04432 Bus 09 0.04036 Bus 111 0.0283 Bus 111 0.0638
8 P. Mehta et al.
Also, Fig. 6 shows that VSM has been enhanced greatlywith the placement of synchronous generator on the most volt-
age sensitive buses. This indicates that the selection of syn-chronous generator as DG units on most voltage sensitivebuses can carry more load before becoming voltage unstable.
The capability of synchronous generator of delivering bothactive and reactive power makes it more promising for enhanc-ing the voltage stability margin. On the other end, the VSM
with synchronous compensator is less due to its inability tosupply active power. The load relies only on the source gener-ation (i.e. sub-station); hence, larger value of the current fedright from the source has been responsible for greater real
and reactive power losses in the distribution feeders. Thus,the system becomes voltage unstable earlier as compared tothat of synchronous generator.
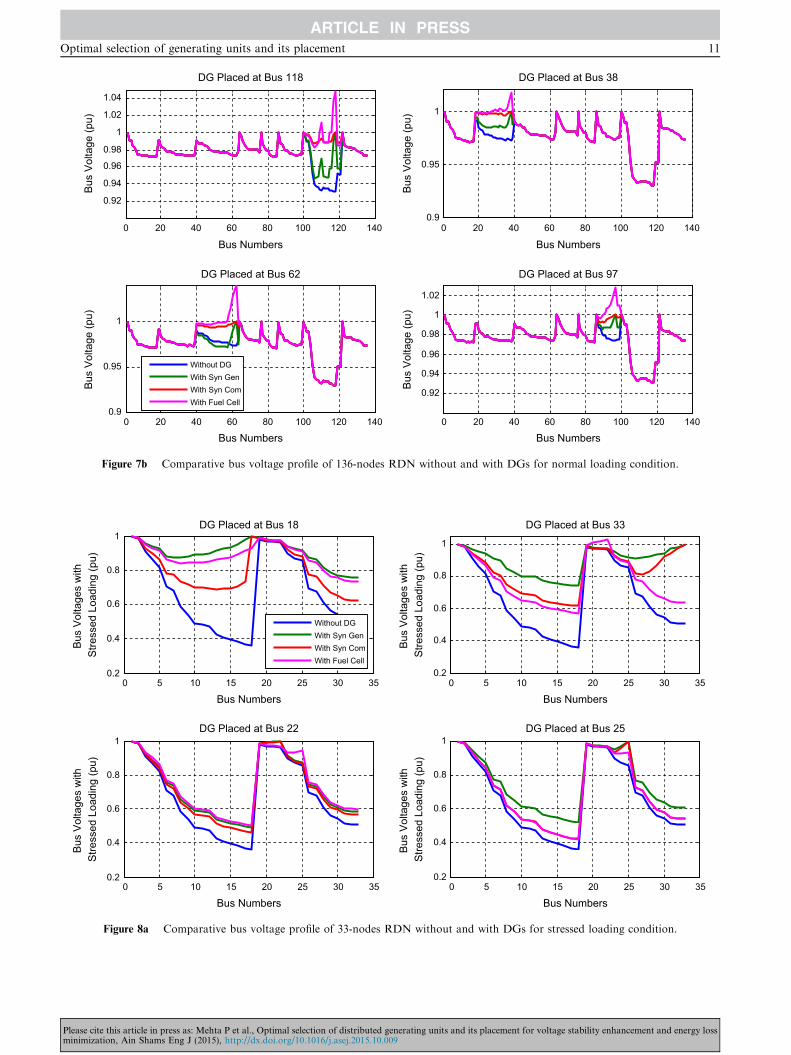
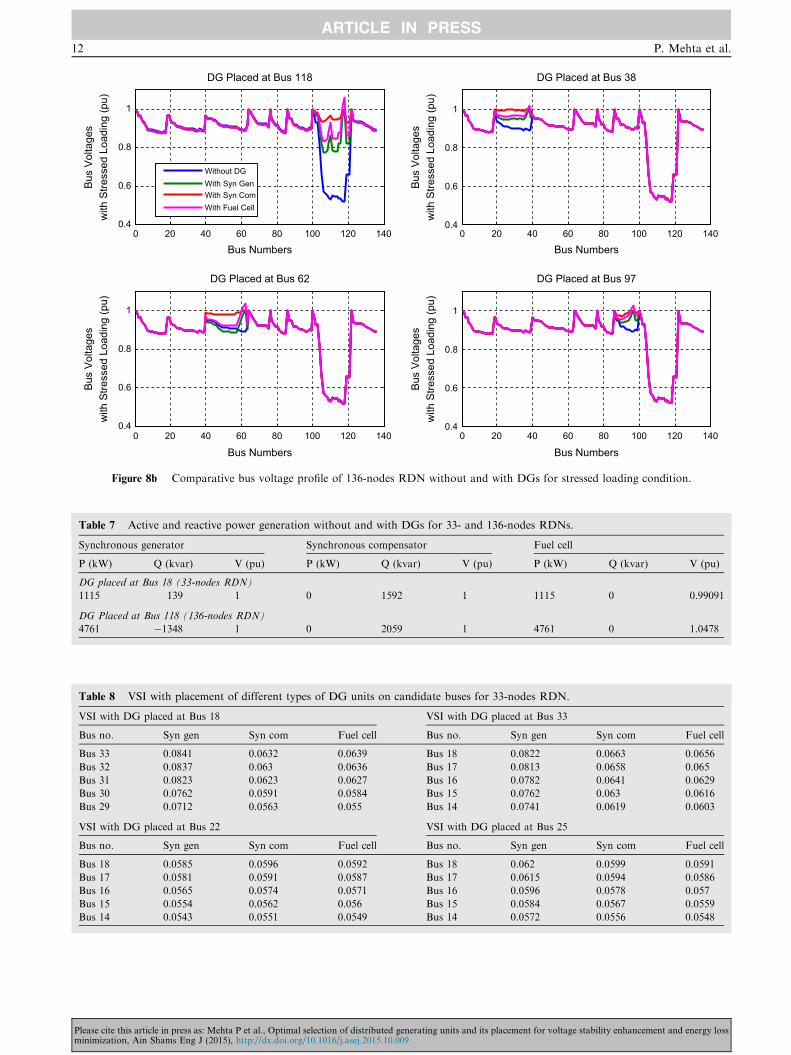
Figs. 7a and 7b and Figs. 8a and 8b show the comparativebus voltage profile with the placement of all types of DGs oneach candidate bus for the normal as well as stressed loading
condition, respectively. For the stressed loading condition inFigs. 8a and 8b, the bus voltage profile are plotted nearer tokcritical ¼ 3:4005 and kcritical ¼ 3:6863, respectively, for 33-nodes and 136-nodes RDNs. These given values of k corre-
spond to kcritical for the base case test systems without anyDGs. For 33-nodes RDN, the placement of DGs on the firsttwo candidate buses can significantly improve the bus voltages
profile in comparison with base case which can be seen inFig. 7a whereas improvement is not much noticeable with
Please cite this article in press as: Mehta P et al., Optimal selection of distributed genminimization, Ain Shams Eng J (2015), http://dx.doi.org/10.1016/j.asej.2015.10.009
placement of DGs at buses with lower ranking of voltage sen-sitivity. The placement of synchronous generator depicts the
best performance for improvement in voltage profile amongall DG types.
For 136-nodes RDN, the improvement in bus voltage pro-
file almost equally affected for the nodes in lateral feeder whereDG has been placed. For the main and other lateral feeders,the placement of DGs cannot alter the voltage profile much.
It is observed from Fig. 7b that the type of DG units bringsdifferent variations in bus voltage profile. The placements ofDGs at location other than Bus 118 are not capable to preventthe drastic voltage drop in valley near buses 100–120. The per-
formances of fuel cell and synchronous compensators havecaused more variations in bus voltages as compared to syn-chronous generator. The DGs with reactive power generation
capability are modeled in voltage regulation mode; hence, theytry to maintain nominal voltage of 1.0 pu at its node by sup-plying/absorbing reactive power. Therefore, the reactive power
generation by DG units which affect the performance of sys-tem is noted in Table 7. For 136-nodes RDN, the synchronousgenerator at Bus 118 absorbs (�1348) kvar to maintain its ter-minal voltage to nominal value of 1.0 pu; hence, its result is
inferior as compared to synchronous compensator and fuelcell. The synchronous compensator provides reactive powersupport of 2059 kvar to maintain the terminal voltage of 1.0
pu. Even if the fuel cell neither generates nor absorbs any reac-tive power, its placement raises the voltage up to 1.0478 which
erating units and its placement for voltage stability enhancement and energy loss
1 2 3 4 50
1
2
3
4
5
Critical Modes with Placement of DGs at Bus 18
Eig
enva
lue
0 1 2 3 4 5 60
1
2
3
4
5
Critical Modes with Placement of DGs at Bus 33
Eig
enva
lue
0 1 2 3 4 5 60
1
2
3
4
5
Critical Modes with Placement of DGs at Bus 22
Eig
enva
lue
0 1 2 3 4 5 60
1
2
3
4
Critical Modes with Placement of DGs at Bus 25E
igen
valu
e
Without DGWith Syn GenWith Syn ComWith Fuel Cell
Figure 4 Eigenvalues obtained with the placement of different DG units at the candidate buses for 33-nodes RDN.
1 2 3 4 50
0.01
0.02
0.03
0.04
0.05
0.06
Critical Modes with Placement of DGs at Bus 118
Eig
enva
lue
0.5 1 1.5 2 2.5 3 3.5 4 4.5 5 5.50
0.01
0.02
0.03
0.04
0.05
0.06
Critical Modes with Placement of DGs at Bus 38
Eig
enva
lue
0.5 1 1.5 2 2.5 3 3.5 4 4.5 5 5.50
0.01
0.02
0.03
0.04
0.05
0.06
Critical Modes with Placement of DGs at Bus 62
Eig
enva
lue
0.5 1 1.5 2 2.5 3 3.5 4 4.5 5 5.50
0.01
0.02
0.03
0.04
0.05
0.06
Critical Modes with Placement of DGs at Bus 97
Eig
enva
lue
Without DGSyn GenSyn ComFuel Cell
Figure 5 Eigenvalues obtained with the placement of different DG units at the candidate buses for 136-nodes RDN.
Optimal selection of generating units and its placement 9
is also not a desirable condition. This comprehensive analysissuggests that while selecting the DG units to achieve the par-ticular objectives, the constraints must be designed very care-
fully and more powerful solution techniques should beadopted. The size of the distribution network, number of lat-eral branches, loading on different nodes, load models and
active and reactive power generation capability of DG unitssignificantly affect the performance of the system. The benefi-cial impact of placement of DGs on Bus 18 and Bus 118,
Please cite this article in press as: Mehta P et al., Optimal selection of distributed geneminimization, Ain Shams Eng J (2015), http://dx.doi.org/10.1016/j.asej.2015.10.009
respectively, for 33- and 136-nodes RDNs on voltage stabilityenhancement are clearly depicted in Figs. 8a and 8b where thereductions in bus voltages are limited even for the stressed
loading conditions.
6.3. Determination of multiple location and type of DG
The placement of first DG unit on the most voltage sensitivebus determined by CPF and Modal analysis results in greater
rating units and its placement for voltage stability enhancement and energy loss
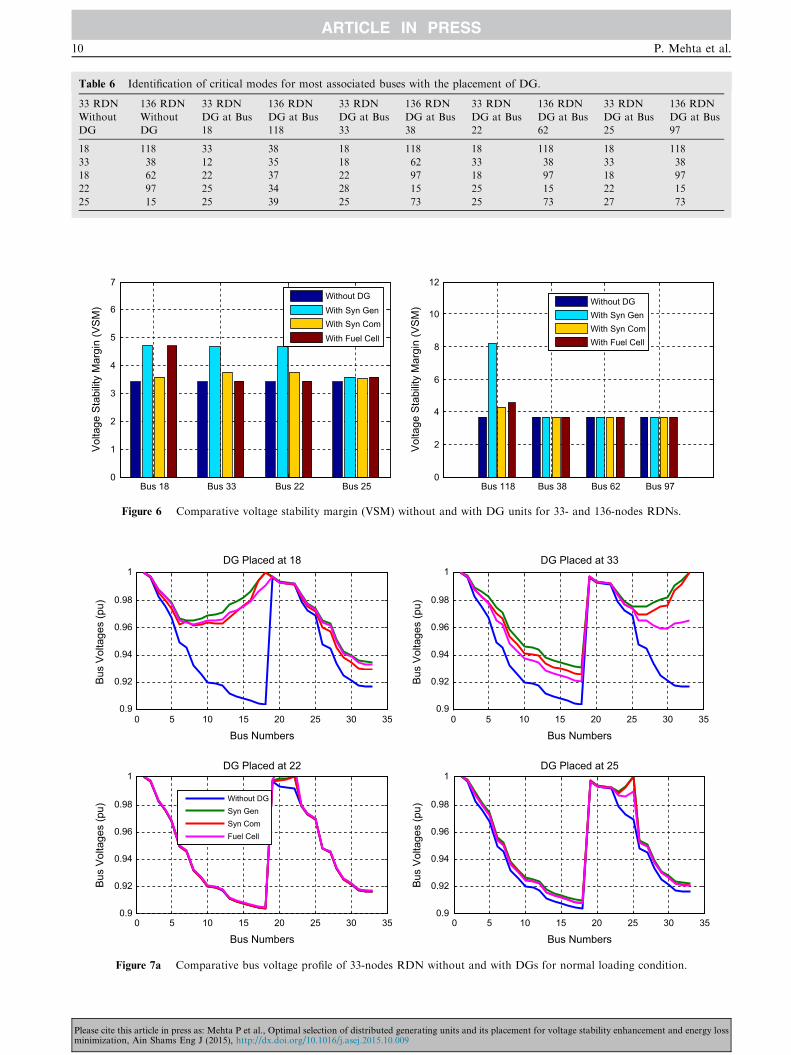
Table 6 Identification of critical modes for most associated buses with the placement of DG.
33 RDN 136 RDN 33 RDN 136 RDN 33 RDN 136 RDN 33 RDN 136 RDN 33 RDN 136 RDN
Without
DG
Without
DG
DG at Bus
18
DG at Bus
118
DG at Bus
33
DG at Bus
38
DG at Bus
22
DG at Bus
62
DG at Bus
25
DG at Bus
97
18 118 33 38 18 118 18 118 18 118
33 38 12 35 18 62 33 38 33 38
18 62 22 37 22 97 18 97 18 97
22 97 25 34 28 15 25 15 22 15
25 15 25 39 25 73 25 73 27 73
Bus 18 Bus 33 Bus 22 Bus 250
1
2
3
4
5
6
7
Vol
tage
Sta
bilit
y M
argi
n (V
SM
)
Bus 118 Bus 38 Bus 62 Bus 970
2
4
6
8
10
12
Vol
tage
Sta
bilit
y M
argi
n (V
SM
)
Without DG
With Syn GenWith Syn Com
With Fuel Cell
Without DGWith Syn GenWith Syn ComWith Fuel Cell
Figure 6 Comparative voltage stability margin (VSM) without and with DG units for 33- and 136-nodes RDNs.
0 5 10 15 20 25 30 350.9
0.92
0.94
0.96
0.98
1
Bus Numbers
Bus
Vol
tage
s (p
u)
DG Placed at 18
0 5 10 15 20 25 30 350.9
0.92
0.94
0.96
0.98
1
Bus Numbers
Bus
Vol
tage
s (p
u)
DG Placed at 33
0 5 10 15 20 25 30 350.9
0.92
0.94
0.96
0.98
1
Bus Numbers
Bus
Vol
tage
s (p
u)
DG Placed at 22
0 5 10 15 20 25 30 350.9
0.92
0.94
0.96
0.98
1
Bus Numbers
Bus
Vol
tage
s (p
u)
DG Placed at 25
Without DGSyn GenSyn ComFuel Cell
Figure 7a Comparative bus voltage profile of 33-nodes RDN without and with DGs for normal loading condition.
10 P. Mehta et al.
Please cite this article in press as: Mehta P et al., Optimal selection of distributed generating units and its placement for voltage stability enhancement and energy lossminimization, Ain Shams Eng J (2015), http://dx.doi.org/10.1016/j.asej.2015.10.009
0 20 40 60 80 100 120 140
0.92
0.94
0.96
0.98
1
1.02
1.04
Bus Numbers
Bus
Vol
tage
(pu)
DG Placed at Bus 118
0 20 40 60 80 100 120 1400.9
0.95
1
Bus Numbers
Bus
Vol
tage
(pu)
DG Placed at Bus 38
0 20 40 60 80 100 120 1400.9
0.95
1
Bus Numbers
Bus
Vol
tage
(pu)
DG Placed at Bus 62
0 20 40 60 80 100 120 140
0.92
0.94
0.96
0.98
1
1.02
Bus Numbers
Bus
Vol
tage
(pu)
DG Placed at Bus 97
Without DGWith Syn GenWith Syn ComWith Fuel Cell
Figure 7b Comparative bus voltage profile of 136-nodes RDN without and with DGs for normal loading condition.
0 5 10 15 20 25 30 350.2
0.4
0.6
0.8
1
Bus Numbers
Bus
Vol
tage
s w
ithS
tress
ed L
oadi
ng (p
u)
DG Placed at Bus 18
0 5 10 15 20 25 30 350.2
0.4
0.6
0.8
1
Bus Numbers
Bus
Vol
tage
s w
ithS
tress
ed L
oadi
ng (p
u)
DG Placed at Bus 33
0 5 10 15 20 25 30 350.2
0.4
0.6
0.8
1
Bus Numbers
Bus
Vol
tage
s w
ithS
tress
ed L
oadi
ng (p
u)
DG Placed at Bus 22
0 5 10 15 20 25 30 350.2
0.4
0.6
0.8
1
Bus Numbers
Bus
Vol
tage
s w
ithS
tress
ed L
oadi
ng (p
u)
DG Placed at Bus 25
Without DGWith Syn GenWith Syn ComWith Fuel Cell
Figure 8a Comparative bus voltage profile of 33-nodes RDN without and with DGs for stressed loading condition.
Optimal selection of generating units and its placement 11
Please cite this article in press as: Mehta P et al., Optimal selection of distributed generating units and its placement for voltage stability enhancement and energy lossminimization, Ain Shams Eng J (2015), http://dx.doi.org/10.1016/j.asej.2015.10.009
0 20 40 60 80 100 120 1400.4
0.6
0.8
1
Bus Numbers
Bus
Vol
tage
sw
ith S
tress
ed L
oadi
ng (p
u)
DG Placed at Bus 118
0 20 40 60 80 100 120 1400.4
0.6
0.8
1
Bus Numbers
Bus
Vol
tage
sw
ith S
tress
ed L
oadi
ng (p
u)
DG Placed at Bus 38
0 20 40 60 80 100 120 1400.4
0.6
0.8
1
Bus Numbers
Bus
Vol
tage
sw
ith S
tress
ed L
oadi
ng (p
u)
DG Placed at Bus 62
0 20 40 60 80 100 120 1400.4
0.6
0.8
1
Bus Numbers
Bus
Vol
tage
sw
ith S
tress
ed L
oadi
ng (p
u)
DG Placed at Bus 97
Without DGWith Syn GenWith Syn ComWith Fuel Cell
Figure 8b Comparative bus voltage profile of 136-nodes RDN without and with DGs for stressed loading condition.
Table 7 Active and reactive power generation without and with DGs for 33- and 136-nodes RDNs.
Synchronous generator Synchronous compensator Fuel cell
P (kW) Q (kvar) V (pu) P (kW) Q (kvar) V (pu) P (kW) Q (kvar) V (pu)
DG placed at Bus 18 (33-nodes RDN)
1115 139 1 0 1592 1 1115 0 0.99091
DG Placed at Bus 118 (136-nodes RDN)
4761 �1348 1 0 2059 1 4761 0 1.0478
Table 8 VSI with placement of different types of DG units on candidate buses for 33-nodes RDN.
VSI with DG placed at Bus 18 VSI with DG placed at Bus 33
Bus no. Syn gen Syn com Fuel cell Bus no. Syn gen Syn com Fuel cell
Bus 33 0.0841 0.0632 0.0639 Bus 18 0.0822 0.0663 0.0656
Bus 32 0.0837 0.063 0.0636 Bus 17 0.0813 0.0658 0.065
Bus 31 0.0823 0.0623 0.0627 Bus 16 0.0782 0.0641 0.0629
Bus 30 0.0762 0.0591 0.0584 Bus 15 0.0762 0.063 0.0616
Bus 29 0.0712 0.0563 0.055 Bus 14 0.0741 0.0619 0.0603
VSI with DG placed at Bus 22 VSI with DG placed at Bus 25
Bus no. Syn gen Syn com Fuel cell Bus no. Syn gen Syn com Fuel cell
Bus 18 0.0585 0.0596 0.0592 Bus 18 0.062 0.0599 0.0591
Bus 17 0.0581 0.0591 0.0587 Bus 17 0.0615 0.0594 0.0586
Bus 16 0.0565 0.0574 0.0571 Bus 16 0.0596 0.0578 0.057
Bus 15 0.0554 0.0562 0.056 Bus 15 0.0584 0.0567 0.0559
Bus 14 0.0543 0.0551 0.0549 Bus 14 0.0572 0.0556 0.0548
12 P. Mehta et al.
Please cite this article in press as: Mehta P et al., Optimal selection of distributed generating units and its placement for voltage stability enhancement and energy lossminimization, Ain Shams Eng J (2015), http://dx.doi.org/10.1016/j.asej.2015.10.009
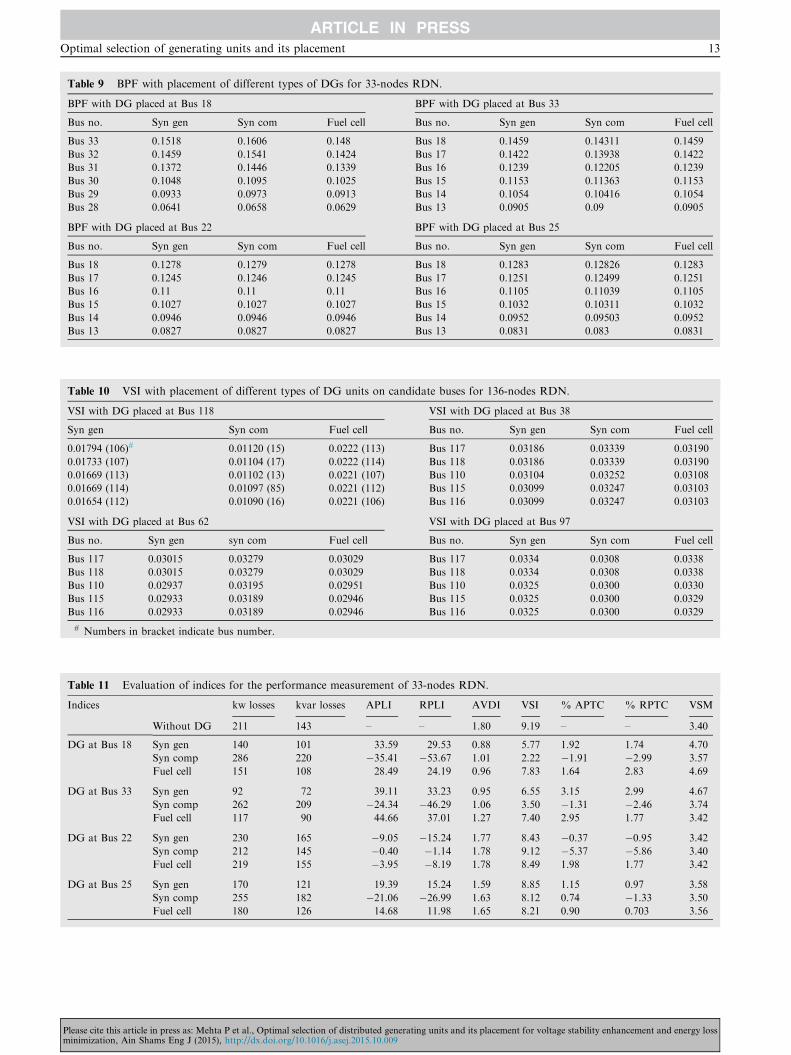
Table 9 BPF with placement of different types of DGs for 33-nodes RDN.
BPF with DG placed at Bus 18 BPF with DG placed at Bus 33
Bus no. Syn gen Syn com Fuel cell Bus no. Syn gen Syn com Fuel cell
Bus 33 0.1518 0.1606 0.148 Bus 18 0.1459 0.14311 0.1459
Bus 32 0.1459 0.1541 0.1424 Bus 17 0.1422 0.13938 0.1422
Bus 31 0.1372 0.1446 0.1339 Bus 16 0.1239 0.12205 0.1239
Bus 30 0.1048 0.1095 0.1025 Bus 15 0.1153 0.11363 0.1153
Bus 29 0.0933 0.0973 0.0913 Bus 14 0.1054 0.10416 0.1054
Bus 28 0.0641 0.0658 0.0629 Bus 13 0.0905 0.09 0.0905
BPF with DG placed at Bus 22 BPF with DG placed at Bus 25
Bus no. Syn gen Syn com Fuel cell Bus no. Syn gen Syn com Fuel cell
Bus 18 0.1278 0.1279 0.1278 Bus 18 0.1283 0.12826 0.1283
Bus 17 0.1245 0.1246 0.1245 Bus 17 0.1251 0.12499 0.1251
Bus 16 0.11 0.11 0.11 Bus 16 0.1105 0.11039 0.1105
Bus 15 0.1027 0.1027 0.1027 Bus 15 0.1032 0.10311 0.1032
Bus 14 0.0946 0.0946 0.0946 Bus 14 0.0952 0.09503 0.0952
Bus 13 0.0827 0.0827 0.0827 Bus 13 0.0831 0.083 0.0831
Table 10 VSI with placement of different types of DG units on candidate buses for 136-nodes RDN.
VSI with DG placed at Bus 118 VSI with DG placed at Bus 38
Syn gen Syn com Fuel cell Bus no. Syn gen Syn com Fuel cell
0.01794 (106)# 0.01120 (15) 0.0222 (113) Bus 117 0.03186 0.03339 0.03190
0.01733 (107) 0.01104 (17) 0.0222 (114) Bus 118 0.03186 0.03339 0.03190
0.01669 (113) 0.01102 (13) 0.0221 (107) Bus 110 0.03104 0.03252 0.03108
0.01669 (114) 0.01097 (85) 0.0221 (112) Bus 115 0.03099 0.03247 0.03103
0.01654 (112) 0.01090 (16) 0.0221 (106) Bus 116 0.03099 0.03247 0.03103
VSI with DG placed at Bus 62 VSI with DG placed at Bus 97
Bus no. Syn gen syn com Fuel cell Bus no. Syn gen Syn com Fuel cell
Bus 117 0.03015 0.03279 0.03029 Bus 117 0.0334 0.0308 0.0338
Bus 118 0.03015 0.03279 0.03029 Bus 118 0.0334 0.0308 0.0338
Bus 110 0.02937 0.03195 0.02951 Bus 110 0.0325 0.0300 0.0330
Bus 115 0.02933 0.03189 0.02946 Bus 115 0.0325 0.0300 0.0329
Bus 116 0.02933 0.03189 0.02946 Bus 116 0.0325 0.0300 0.0329
# Numbers in bracket indicate bus number.
Table 11 Evaluation of indices for the performance measurement of 33-nodes RDN.
Indices kw losses kvar losses APLI RPLI AVDI VSI % APTC % RPTC VSM
Without DG 211 143 – – 1.80 9.19 – – 3.40
DG at Bus 18 Syn gen 140 101 33.59 29.53 0.88 5.77 1.92 1.74 4.70
Syn comp 286 220 �35.41 �53.67 1.01 2.22 �1.91 �2.99 3.57
Fuel cell 151 108 28.49 24.19 0.96 7.83 1.64 2.83 4.69
DG at Bus 33 Syn gen 92 72 39.11 33.23 0.95 6.55 3.15 2.99 4.67
Syn comp 262 209 �24.34 �46.29 1.06 3.50 �1.31 �2.46 3.74
Fuel cell 117 90 44.66 37.01 1.27 7.40 2.95 1.77 3.42
DG at Bus 22 Syn gen 230 165 �9.05 �15.24 1.77 8.43 �0.37 �0.95 3.42
Syn comp 212 145 �0.40 �1.14 1.78 9.12 �5.37 �5.86 3.40
Fuel cell 219 155 �3.95 �8.19 1.78 8.49 1.98 1.77 3.42
DG at Bus 25 Syn gen 170 121 19.39 15.24 1.59 8.85 1.15 0.97 3.58
Syn comp 255 182 �21.06 �26.99 1.63 8.12 0.74 �1.33 3.50
Fuel cell 180 126 14.68 11.98 1.65 8.21 0.90 0.703 3.56
Optimal selection of generating units and its placement 13
Please cite this article in press as: Mehta P et al., Optimal selection of distributed generating units and its placement for voltage stability enhancement and energy lossminimization, Ain Shams Eng J (2015), http://dx.doi.org/10.1016/j.asej.2015.10.009
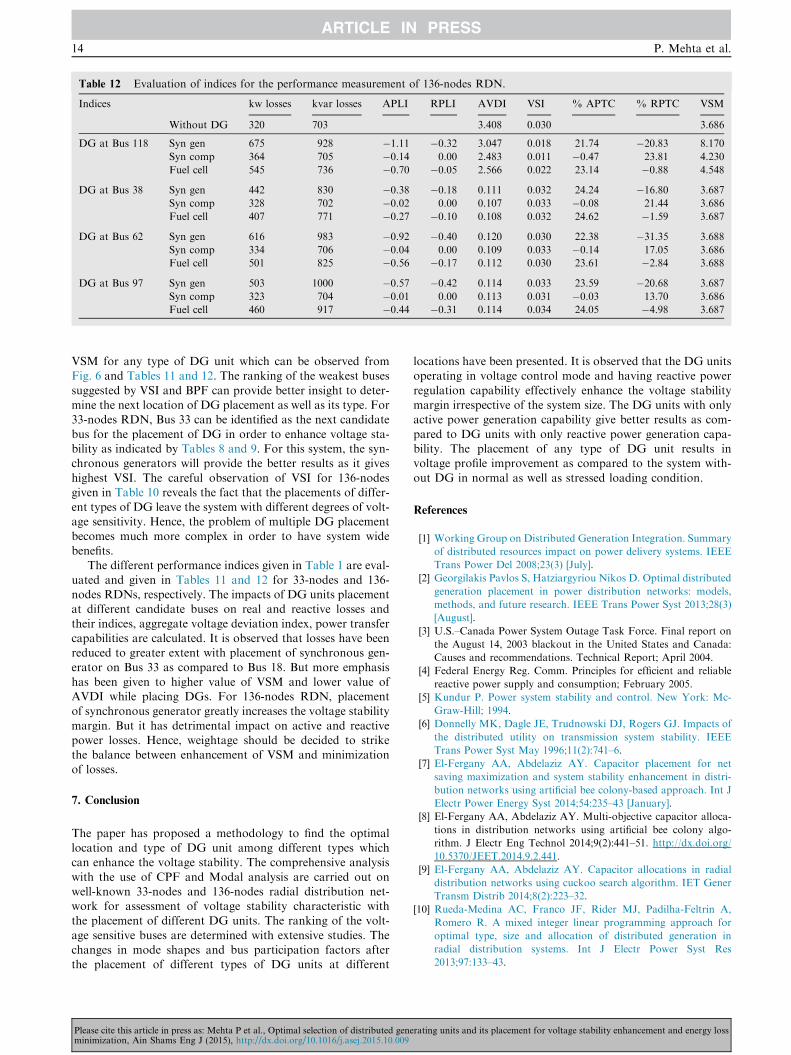
Table 12 Evaluation of indices for the performance measurement of 136-nodes RDN.
Indices kw losses kvar losses APLI RPLI AVDI VSI % APTC % RPTC VSM
Without DG 320 703 3.408 0.030 3.686
DG at Bus 118 Syn gen 675 928 �1.11 �0.32 3.047 0.018 21.74 �20.83 8.170
Syn comp 364 705 �0.14 0.00 2.483 0.011 �0.47 23.81 4.230
Fuel cell 545 736 �0.70 �0.05 2.566 0.022 23.14 �0.88 4.548
DG at Bus 38 Syn gen 442 830 �0.38 �0.18 0.111 0.032 24.24 �16.80 3.687
Syn comp 328 702 �0.02 0.00 0.107 0.033 �0.08 21.44 3.686
Fuel cell 407 771 �0.27 �0.10 0.108 0.032 24.62 �1.59 3.687
DG at Bus 62 Syn gen 616 983 �0.92 �0.40 0.120 0.030 22.38 �31.35 3.688
Syn comp 334 706 �0.04 0.00 0.109 0.033 �0.14 17.05 3.686
Fuel cell 501 825 �0.56 �0.17 0.112 0.030 23.61 �2.84 3.688
DG at Bus 97 Syn gen 503 1000 �0.57 �0.42 0.114 0.033 23.59 �20.68 3.687
Syn comp 323 704 �0.01 0.00 0.113 0.031 �0.03 13.70 3.686
Fuel cell 460 917 �0.44 �0.31 0.114 0.034 24.05 �4.98 3.687
14 P. Mehta et al.
VSM for any type of DG unit which can be observed fromFig. 6 and Tables 11 and 12. The ranking of the weakest buses
suggested by VSI and BPF can provide better insight to deter-mine the next location of DG placement as well as its type. For33-nodes RDN, Bus 33 can be identified as the next candidate
bus for the placement of DG in order to enhance voltage sta-bility as indicated by Tables 8 and 9. For this system, the syn-chronous generators will provide the better results as it gives
highest VSI. The careful observation of VSI for 136-nodesgiven in Table 10 reveals the fact that the placements of differ-ent types of DG leave the system with different degrees of volt-age sensitivity. Hence, the problem of multiple DG placement
becomes much more complex in order to have system widebenefits.
The different performance indices given in Table 1 are eval-
uated and given in Tables 11 and 12 for 33-nodes and 136-nodes RDNs, respectively. The impacts of DG units placementat different candidate buses on real and reactive losses and
their indices, aggregate voltage deviation index, power transfercapabilities are calculated. It is observed that losses have beenreduced to greater extent with placement of synchronous gen-erator on Bus 33 as compared to Bus 18. But more emphasis
has been given to higher value of VSM and lower value ofAVDI while placing DGs. For 136-nodes RDN, placementof synchronous generator greatly increases the voltage stability
margin. But it has detrimental impact on active and reactivepower losses. Hence, weightage should be decided to strikethe balance between enhancement of VSM and minimization
of losses.
7. Conclusion
The paper has proposed a methodology to find the optimallocation and type of DG unit among different types whichcan enhance the voltage stability. The comprehensive analysis
with the use of CPF and Modal analysis are carried out onwell-known 33-nodes and 136-nodes radial distribution net-work for assessment of voltage stability characteristic withthe placement of different DG units. The ranking of the volt-
age sensitive buses are determined with extensive studies. Thechanges in mode shapes and bus participation factors afterthe placement of different types of DG units at different
Please cite this article in press as: Mehta P et al., Optimal selection of distributed genminimization, Ain Shams Eng J (2015), http://dx.doi.org/10.1016/j.asej.2015.10.009
locations have been presented. It is observed that the DG unitsoperating in voltage control mode and having reactive power
regulation capability effectively enhance the voltage stabilitymargin irrespective of the system size. The DG units with onlyactive power generation capability give better results as com-
pared to DG units with only reactive power generation capa-bility. The placement of any type of DG unit results involtage profile improvement as compared to the system with-
out DG in normal as well as stressed loading condition.
References
[1] Working Group on Distributed Generation Integration. Summary
of distributed resources impact on power delivery systems. IEEE
Trans Power Del 2008;23(3) [July].
[2] Georgilakis Pavlos S, Hatziargyriou Nikos D. Optimal distributed
generation placement in power distribution networks: models,
methods, and future research. IEEE Trans Power Syst 2013;28(3)
[August].
[3] U.S.–Canada Power System Outage Task Force. Final report on
the August 14, 2003 blackout in the United States and Canada:
Causes and recommendations. Technical Report; April 2004.
[4] Federal Energy Reg. Comm. Principles for efficient and reliable
reactive power supply and consumption; February 2005.
[5] Kundur P. Power system stability and control. New York: Mc-
Graw-Hill; 1994.
[6] Donnelly MK, Dagle JE, Trudnowski DJ, Rogers GJ. Impacts of
the distributed utility on transmission system stability. IEEE
Trans Power Syst May 1996;11(2):741–6.
[7] El-Fergany AA, Abdelaziz AY. Capacitor placement for net
saving maximization and system stability enhancement in distri-
bution networks using artificial bee colony-based approach. Int J
Electr Power Energy Syst 2014;54:235–43 [January].
[8] El-Fergany AA, Abdelaziz AY. Multi-objective capacitor alloca-
tions in distribution networks using artificial bee colony algo-
rithm. J Electr Eng Technol 2014;9(2):441–51. http://dx.doi.org/
10.5370/JEET.2014.9.2.441.
[9] El-Fergany AA, Abdelaziz AY. Capacitor allocations in radial
distribution networks using cuckoo search algorithm. IET Gener
Transm Distrib 2014;8(2):223–32.
[10] Rueda-Medina AC, Franco JF, Rider MJ, Padilha-Feltrin A,
Romero R. A mixed integer linear programming approach for
optimal type, size and allocation of distributed generation in
radial distribution systems. Int J Electr Power Syst Res
2013;97:133–43.
erating units and its placement for voltage stability enhancement and energy loss
Optimal selection of generating units and its placement 15
[11] Gozel T, Eminoglu U, Hocaoglu MH. A tool for voltage stability
and optimization (VS&OP) in radial distribution systems using
MATLAB graphical user interface (GUI). Simulink Model
Practice Theory 2008;16(5):505–18.
[12] Hung Duong Quoc, Mithulananthan N, Bansal RC. Analytical
expressions for DG allocation in primary distribution networks.
IEEE Trans Energy Convers 2010;25(3) [September].
[13] Hung Duong Quoc, Mithulananthan N. Multiple distributed
generator placement in primary distribution networks for loss
reduction. IEEE Trans Industr Electron 2013;60(4).
[14] Ochoa LF, Dent CJ, Harrison GP. ‘‘Network distributed gener-
ation capacity analysis using OPF with voltage step constraints.
IEEE Trans Power Syst January 2010;25(1):296–304.
[15] Karimyan Peyman, Gharehpetian GB, Abedi M, Gavili A. Long
term scheduling for optimal allocation and sizing of DG unit
considering load variations and DG type. Int J Electr Power
Energy Syst 2014;54:277–87.
[16] Ghosh S, Ghoshal SP, Ghosh S. Optimal sizing and placement of
distributed generation in a network system. Int J Electr Power
Energy Syst 2010;32:849–56.
[17] El-Fergany Attia. Study impact of various load models on DG
placement and sizing using backtracking search algorithm. Appl
Soft Comput J 2015;30:803–11 [May].
[18] El-Fergany Attia. Optimal allocation of multi-type distributed
generators using backtracking search optimization algorithm. Int
J Electr Power Energy Syst Jan 2015;64:1197–205.
[19] Mistry Khyati D, Roy Ranjit. Enhancement of loading capacity
of distribution system through distributed generator placement
considering techno-economic benefits with load growth. Int J
Electr Power Energy Syst 2014;54:505–15.
[20] Sajjadi Sayyid Mohssen, Haghifam Mahmoud-Reza, Salehi
Javad. Simultaneous placement of distributed generation and
capacitors in distribution networks considering voltage stability
index. Int J Electr Power Energy Syst 2013;46:366–75.
[21] Chakravorty M, Das D. Voltage stability analysis of radial
distribution networks. Int J Electr Power Energy Syst 2001;23
(2):129–35.
[22] Hedayati H, Nabaviniaki SA, Akbarimajd A. A method for
placement of DG units in distribution networks. IEEE Trans
Power Del 2008;23(3):1620–8 [July].
[23] Hill DJ, Hiskens IA. Load recovery in voltage stability analysis
and control, presented at the National Science Foundation/ECC
Workshop Bulk Power System. Davos, Switzerland: Voltage
Phenomena III; 1994 [August].
[24] Arya LD, Koshti Atul, Choube SC. Distributed generation
planning using differential evolution accounting voltage stability
consideration. Int J Electr Power Energy Syst 2012;42:196–207.
[25] Ettehadi M, Ghasemi H, Vaez-Zadeh S. Voltage stability-based
DG placement in distribution networks. IEEE Trans Power Del
January 2013;28(1).
[26] Esmaili Masoud, Firozjaee Esmail Chaktan, Shayanfar Heidar
Ali. Optimal placement of distributed generations considering
voltage stability and power losses with observing voltage-related
constraints. Int J Appl Energy 2014;113:1252–60.
[27] Freitas Walmir, Vieira Jose CM, Morelato Andre. Influence of
excitation system control modes on the allowable penetration level
of distributed synchronous generators. IEEE Trans Energy
Convers 2005;20(2):474–80.
[28] Puttgen HB, MacGregor PR, Lambert FC. Distributed genera-
tion: semantic hype or the dawn of a new era? IEEE Trans Power
Energy Manage 2003;1(1):22–9.
Please cite this article in press as: Mehta P et al., Optimal selection of distributed geneminimization, Ain Shams Eng J (2015), http://dx.doi.org/10.1016/j.asej.2015.10.009
[29] Blaabjerg F, Teodorescu R, Liserre M, Timbus AV. Overview of
control and grid synchronization for distributed power generation
systems. IEEE Trans Ind Electron October 2006;53(5):1398–409.
[30] Gao B, Morison GK, Kundur P. Voltage stability evaluation
using modal analysis. IEEE Trans Power Syst 1992;7(4)
[November].
[31] C. A. Canizares, ‘‘Voltage stability assessment procedures and
guides”. Available: <http://www.power.uwaterloo.ca>.
[32] Canizares CA (Ed.), ‘‘Voltage stability assessment: concepts,
practices and tools”; August, 2002. Available: <http://www.
power.uwaterloo.ca>.
[33] Ajjarapu Venkataramana, Christy Colin. The continuation power
flow a tool for steady state voltage stability analysis. IEEE Trans
Power Syst 1992;7(1), February.
[34] Milano F. Power system analysis toolbox (PSAT), Version 1.3.4,
User Manual; 2005, Available <http://www.power.uwaterloo.ca/
fmilano>.
[35] Mantovani JRS, Casari F, Romero RA. Reconfigurac�ao de
sistemas dedistribuic� ao radiais utilizando o criterio de queda de
tensao. SBA Controle Autom 2000;11(2):150–9.
Pankita Mehta completed her BE degree in
Electrical Engineering in 2003, from
Saurashtra University, Rajkot, India, and her
M.E. degree in Electrical Power System in
2006 from Sardar Patel University of Vallabh
Vidhyanagar, India. Currently she is working
as Assistant Professor in Charotar University
of Science and Technology and pursuing PhD.
Her main research interests include Electrical
machines and power system.
Dr. Praghnesh Bhatt did his PhD from S V
National Institute of Technology, Surat, India
in 2012. He is working as Professor in
Department of Electrical Engineering at C S
Patel Institute of Technology, Charusat,
India. His research areas of interests are
Power System Analysis, Power system
Dynamics and Stability, Grid integration of
wind power generation, Power System Pro-
tection and Distributed Generation.
Dr. Vivek J. Pandya has completed his B.E.
(Electrical Engineering, Sardar Patel Univer-
sity), 1995, M.E. (Electrical Power Systems,
Sardar Patel University), 2003, and Ph.D.
(Power System Protection (Electrical Engi-
neering), from Maharaja Sayajirao Univer-
sity, Vadodara, India. His areas of interests
are Electrical Machines, Electrical power sys-
tem and Power system protection. He had
published several papers in reputed journals
and conferences. Currently he is working as Associate Professor at
PDPU, School of Technology, Raysan, India.
rating units and its placement for voltage stability enhancement and energy loss