Fractional optimal control of a 2-dimensional distributed system using eigenfunctions
Upload
khangminh22Category
view
0download
0
Optimal Scheduled Power Flow for the Distributed
Photovoltaic-Wind Turbine-Diesel Generator with
Battery Storage System
By
BOBONGO BOKABO
Dissertation submitted in fulfilment of the requirements for the degree:
Master of Engineering in Electrical Engineering
In the Department of Electrical, Electronic and Computer Engineering
Faculty of Engineering and Information Technology
Central University of Technology
Supervisor: Dr K. Kusakana
Bloemfontein 2016
© Central University of Technology, Free State

ii
Declaration
I, Bobongo Bokabo (student number ) do hereby declare that the dissertation
submitted for the degree of Master of Engineering in Electrical Engineering is my own
independent work and it complies with the Code of Academic integrity, as well as other
relevant policies, procedures, rules and regulations of Central University of Technology and
has not been previously submitted to any other institution of higher education for the fulfilment
of any qualification.
……………………………………
B. Bokabo, Date: 25-October-2016
© Central University of Technology, Free State

iii
Dedication
I dedicate this work to God, my Lord, my Saviour, my source of inspiration, knowledge, wisdom
and understanding.
© Central University of Technology, Free State

iv
Acknowledgements
First I would like to glorify God for giving me strength, knowledge and understanding to
do and complete this work, without Him I would not be able to fulfil this work. Days and
nights, He provided me with guidance and away forward to carry out all the necessary research
needed to complete this work.
With all my heart, I would like to thank Dr K Kusakana, for advising me to go back to
University and for all his advice, monitoring, guidance and contribution during the course of
this research. He was very helpful from the beginning up to the end of this work. His comments
through the research inspired me to carry out more research and to better understand my project.
My appreciation to him again for letting me conduct my research on optimal control, a subject
that I really enjoyed during the development of this work.
I would like to thank all the administrators of the Central University of Technology for
accepting my application for admission and also for approving my project proposal as well.
My sincere thanks to all my family members for their love, contribution and support.
I would like to thank a special couple, Mr. Johnny Mboyo Enyeka and his wife Mrs. Taty
Enyeka, for their contribution and support.
Many thanks to all my colleagues for their contribution and support in my life.
Finally, I would like to take this opportunity to thank my beloved wife Mado Mbembo
Nyamazoko. Her support, love, encouragement and patience were essential for me during the
course of this study. And also many thanks to my little boys Hugo Bokabo and Bob Bokabo
for allowing me to use their precious parent time to carry out research and my studies.
© Central University of Technology, Free State
v
Abstract
The high cost of the transportation of power from the grid to rural areas is a great concern
for most of the countries in the world and the above results in many remote areas not being
able to have electricity.
To overcome the challenges of electrification of rural areas, some generate their own energy
by continuous or prime power diesel generators (DGs) or by producing energy using different
small-scale renewable energy sources (Photovoltaic, Wind, hydroelectric and others).
Despite their advantages of being easy to transport, easy to install and of low initial cost,
diesel generators present many disadvantages when they are used as continuous or prime power
sources due to the high requirement of fuels and non-linearity of daily load demand profile.
Beside the cost, diesel generators are detrimental to the environment and cause global warming.
To overcome the issues of costs and global warming, diesel generators can be used in
combination with renewable energy such as photovoltaic as a backup to form a hybrid power
generation system.
The stand-alone photovoltaic (PV) and wind turbine (WT) power generators have
drawbacks as the power produced depends on the sun and wind, which means that if there is
no sun or wind, no electricity can be produced. The non-linearity of solar and wind resources
makes the stand-alone photovoltaic and wind operation non-reliable.
The combination of photovoltaic-wind turbine–diesel-battery power generation ensures that
the energy produced is reliable and efficient. The diesel generator is used as back up to the
system and is used only when the renewable energy sources are insufficient and the battery
banks are low.
© Central University of Technology, Free State

vi
The PV-WT-Diesel-Battery hybrid power system reduces the consumption of fuel hence
minimizes fuel costs. The system also presents the advantage of less pollution to the
environment due to the short running time of the generator, a low generator maintenance
requirement and long life expectancy of the generator.
As indicated above, the hybrid systems have the advantage of saving costs compare to a
standalone diesel generator operation, but the system requires proper control to minimize the
operation costs while ensuring optimum power flow considering the intermittent solar and wind
resources, the batteries state of charge and the fluctuating load demand.
The aim of this research is to develop two different control strategies to minimize the daily
operational cost of hybrid systems involving PV/WT/DG and batteries by finding the optimal
schedules for running the diesel generator while in the meantime responding to the power
required by the load. The two control strategies developed are “Continuous operational mode”
and “ON/OFF” operational mode. The developed mathematical models of the two control
strategies are simulated using MatLab functions, with “fmincon solver” for continuous
operational mode and “Intlinprog solver” for ON/OFF operational mode.
Keywords:
Optimal operation control, hybrid power generation system, cost minimization, optimization
system and optimization algorithm
© Central University of Technology, Free State

vii
Content
Declaration................................................................................................................................ ii
Dedication ............................................................................................................................... iii
Acknowledgements ................................................................................................................. iv
Abstract ..................................................................................................................................... v
Content .................................................................................................................................... vii
List of figures ........................................................................................................................... xi
List of Tables ........................................................................................................................ xiii
Acronyms and abbreviations ............................................................................................... xiv
Chapter I: Introduction ........................................................................................................... 1
1.1. Background………………………………………………………………………….. 1
1.2. Problem statement…………………………………………………………………... 2
1.3. Objective of the study……………………………………………………………….. 3
1.4. Delimitation of the study……………………………………………………………. 4
1.5. Expected outcome of the study……………………………………………………… 4
1.6. Project methodology………………………………………………………………… 4
1.7. Hypothesis…………………………………………………………………………... 5
1.8. Publications during the study……………………………………………………….. 5
1.9. Dissertation layout…………………………………………………………………... 6
Chapter II: Literature review ................................................................................................. 7
2.1 Introduction…………………………………………………………………………. 7
2.2 Literature related to optimal control of photovoltaic-wind turbine-diesel generator and
battery storage system. ………………………………………………………………… 7
2.3 Literature related to modelling of a hybrid power system………………………….11
© Central University of Technology, Free State

viii
2.4 Literature related to different control strategies used for a hybrid power system… 17
2.5 Summary…………………………………………………………………………… 28
Chapter III: Proposed hybrid system description .............................................................. 29
3.1. Introduction………………………………………………………………………... 29
3.2. Photovoltaic system………………………………………………………………... 29
3.2.1. Description of photovoltaic system ............................................................................... 29
3.2.2. Advantages of a photovoltaic power system ................................................................. 31
3.2.3. Disadvantages of a photovoltaic power system ............................................................ 31
3.2.4. Types of PV systems ..................................................................................................... 32
3.3. Wind energy system……………………………………………………………….. 34
3.3.1. Description of a wind energy system ............................................................................ 34
3.3.2. Operation of wind turbine in a hybrid system ............................................................... 35
3.4. Diesel generator……………………………………………………………………. 35
3.4.1. Description of a diesel generator................................................................................... 35
3.4.2. Operation of diesel generator in a hybrid system .......................................................... 37
3.5. Battery storage system……………………………………………………………... 38
3.5.1. Description of a battery storage system ........................................................................ 38
3.5.2. Advantages and disadvantages of batteries in renewable energy ................................. 38
3.5.3. Types of batteries commonly used in renewable energy systems ................................. 39
3.5.4. Operation of battery storage system in hybrid systems................................................. 41
3.6. Inverters and rectifiers……………………………………………………………... 41
3.6.1. Description of inverters and rectifiers ........................................................................... 41
3.6.2. Types of inverters.......................................................................................................... 42
3.7 Loads………………………………………………………………………………. 43
3.8 Stand-alone hybrid power system…………………………………………………..43
3.10. Summary…………………………………………………………………………… 44
© Central University of Technology, Free State

ix
Chapter IV: Proposed optimization using a continuous operation mode ...................... 45
4.1. Introduction………………………………………………………………………... 45
4.2. Model development………………………………………………………………... 45
4.2.1. Power flow layout and operation sequence ................................................................... 45
4.2.2. System modeling ........................................................................................................... 47
4.2.3. Objective function of the system................................................................................... 48
4.2.4. Constraints .................................................................................................................... 49
4.2.5. Proposed optimization solver and algorithm ................................................................. 51
4.2.6. Objective function definition in fmincon syntax .......................................................... 52
4.2.7. Constraints definition in fmincon syntax ...................................................................... 53
4.2.8. Final model of continuous operation mode ................................................................... 63
4.3. Simulation results and discussions………………………………………………… 63
4.3.1. General description ....................................................................................................... 63
4.3.2. Data presentation........................................................................................................... 64
4.3.3. Resources and load data of the household .................................................................... 64
4.3.4. Simulation and discussion results during winter ........................................................... 67
4.4. Summary…………………………………………………………………………… 76
Chapter V: Proposed optimization using ON/OFF operation mode................................. 77
5.1. Introduction………………………………………………………………………... 77
5.2. Model development………………………………………………………………... 77
5.2.1. Power flow layout ......................................................................................................... 77
5.2.2. System modeling ........................................................................................................... 79
5.2.3. Objective function of the system................................................................................... 80
5.2.4. Constraints .................................................................................................................... 81
5.2.5. Proposed optimization solver and algorithm ................................................................. 83
5.2.6. Objective function definition in Intlinprog syntax ........................................................ 84
© Central University of Technology, Free State

x
5.2.7. Constraints definition in Intlinprog syntax ................................................................... 85
5.2.8. Final model of ON/OFF operation mode ...................................................................... 93
5.3. Simulation results and discussions………………………………………………… 94
5.3.1. General description ....................................................................................................... 94
5.3.2. Simulation and discussion results during winter ........................................................... 94
5.4. Summary………………………………………………………………………….. 104
Chapter VI: Conclusion and recommendations................................................................ 105
6.1 Conclusion………………………………………………………………………... 105
6.2 Recommendations………………………………………………………………... 107
References ............................................................................................................................. 108
Appendixes............................................................................................................................ 118
Appendix A: Selected optimal operation control program using fmicon………………... 118
Appendix B: Continuous mode simulation results (summer)…………………………… 126
Appendix C: ON/OFF mode simulation results (summer)………………………………. 131
Appendix D: Optimal power flow results………………………………………………...135
© Central University of Technology, Free State

xi
List of figures
Figure 3.1: Typical layout indicating components of the proposed hybrid power system…..35
Figure 4.1: Continuous model power flow layout……………………………………………36
Figure 4.2: Household 24-hr load profile during winter…………………………………......53
Figure 4.3: Photovoltaic output power and power supplied to the load during winter………55
Figure 4.4: Wind turbine output power and power supplied to the load during winter……..55
Figure 4.5: Battery storage output power and power supplied to the load during winter……56
Figure 4.6: Diesel generator output power and power supplied to the load during winter…..56
Figure 4.7: Photovoltaic output power and power supplied to the battery during winter……57
Figure 4.8: Wind turbine output power and power supplied to the battery during winter…..58
Figure 4.9: Diesel generator output power and power supplied to the battery during winter..58
Figure 4.10: Battery SOC dynamic…………………………………………………………..59
Figure 4.11: Standalone diesel generator output power supplied to load during winter…….60
Figure 5.1: ON/OFF model power flow……………………………………………………...62
Figure 5.2: Household 24-hr load profile during winter……………………………………..76
Figure 5.3: PV output power & power supplied to the load during winter…………………..78
Figure 5.4: Wind turbine output power & power supplied to the load during winter………..78
Figure 5.5: Battery output power & power supplied to the load during winter……………...79
Figure 5.6: ON/OFF state of DG during winter……………………………………………...80
Figure 5.7: PV output power & power supplied to the battery during winter……………….81
Figure 5.8: WT output power & power supplied to the battery during winter………………82
Figure 5.9: Battery SOC dynamic……………………………………………………………83
Figure B1: Load profile during summer……………………………………………………104
Figure B2: PV output power and power supplied to the load during summer……………...104
© Central University of Technology, Free State

xii
Figure B3: WT output power and power supplied to the load during summer…………......105
Figure B4: Battery output power and power supplied to the load during summer…………105
Figure B5: DG output power and power supplied to the load during summer…………......106
Figure B6: PV output power and power supplied to the load battery during summer…......106
Figure B7: WT output power and power supplied to the load battery during summer…….107
Figure B8: DG output power and power supplied to the load battery during summer…….107
Figure B9: Battery state charge during summer…………………………………………....120
Figure C1: Load profile during summer……………………………………………………121
Figure C2: PV output power and power supplied to the load during summer……………...121
Figure C3: WT output power and power supplied to the load during summer………...…...122
Figure C4: Battery output power and power supplied to the load during summer…………122
Figure C5: On-Off state during summer……………………………………………………123
Figure C6: PV output power and power supplied to the battery during summer……...…...123
Figure C7: WT output power and power supplied to the battery during summer………….124
Figure C8: Battery state of charge during summer………………………………………...124
© Central University of Technology, Free State

xiii
List of Tables
Table 4.1: Household resources & load data……………………………………………....…51
Table 4.2: Simulation parameters…………………………………………………………….52
Table 4.3: Continuous mode fuel savings……………………………………………………61
Table 5.1: ON/OFF mode daily fuel cost savings……………………………………………84
Table 5.2: Winter daily fuel cost savings using different control strategies…………………85
Table 5.3: Summer daily fuel cost savings using different control strategies…………...…...85
Table D1: Continuous operation mode winter case power flow…………………................112
Table D2: Continuous operation mode summer case power flow………………………….113
Table D3: On-Off operation mode winter case power flow………………………….…......114
Table D4: On-Off operation mode summer case power flow………………………………115
© Central University of Technology, Free State
xiv
Acronyms and abbreviations
AC: Alternative current
ACS: Annualized cost of system
AE: Alternative energy
AGM: Sealed absorbed glass mat
ANN: Article neutral network
BESS: Battery energy storage system
BT: Battery
CO2: Carbone dioxide
DC: Direct current
DG: Diesel generator
DRC: Democratic Republic of Congo
FC: Fuel cost
FLC: Fuzzy logic controller
GA: Genetic algorithm
HOGA: Hybrid optimization by genetic algorithm
HOMER: Hybrid optimization model for energy renewable
HPWH: Heat pump water heaters
HRES: Hybrid renewable energy system
ISE: Integral square error
LCE: Levelized cost of energy
MATLAB: Matrix laboratory
MPP: Maximum power point
PEMFC: Proton exchange membrane fuel cell
© Central University of Technology, Free State

xv
PV: Photovoltaic
RBFN: Radial basis function network
RE: Renewable energy
SHEV: Series hybrid electric vehicles
SOC: State of charge
SOFC: Solid oxide fuel cell
TOU: Time-of-use
UC: Ultra-capacitor
WT: Wind turbine
© Central University of Technology, Free State

1
Chapter I: Introduction
1.1. Background
The lack of reliable electrical power supply, the high cost of AC grid extension and rough
topography are some of the severe challenges faced in the rural electrification of a good number
of developing countries. In most of the cases, loads in those rural areas are powered by small
Diesel Generators (DGs) running continuously (Kaabeche A, et al 2014). Compared to other
supply options such as renewable energy sources, DGs have low initial capital costs and
generate electricity on demand. They are easily transportable, modular, and have a high power-
to-weight ratio. DGs can also be integrated with other sources and energy storage in hybrid
system configurations, making it an ideal option for standalone power generation. However,
due to the long running times and the high non-linearity in the daily load demand profiles, DGs
are usually operated inefficiently resulting in the higher cost of energy produced.
Global warming, the ozone layer’s depletion and other environmental impacts from using DGs
(or other fossil fuels) have led to the use of renewable energy (RE) sources (Mahmoud M. et
al 2006).
RE generation is gaining consideration, due to advantages such as low operation and
maintenance, and easy deployment to meet growing energy needs (Tazvinga, et al 2014). Solar
photovoltaic (PV) and wind turbines (WT) are established clean ways of generating energy and
are currently used extensively to supply power in several stand-alone applications (Post HN. et
al 1988).
However, except for their high capital costs, the other main disadvantage of PV and WT
generation is the fact that their produced powers depends on solar and wind resources which
© Central University of Technology, Free State
2
are highly non-linear and vary with the hours of the day and the seasons of the year. Therefore,
they cannot always meet the load power demand.
Hybrid solar PV-WT-diesel-battery hybrid systems present a solution to the time correlation
of intermittent solar and wind sources as well as load demand fluctuations (Museli M. et al
1999). In this configuration, the DG is used to balance the deficit of the power supply from the
renewable sources and the battery system when the load demand is high. This combination
enhances the efficiency and the output capability of the entire system.
1.2. Problem statement
Hybrid Renewable Energy Systems have been accepted as a possible means of electrifying
rural outlying areas where it is too expensive to extend the grid to supply them. One of the
main problems identified with these systems which are not connected to the grid is that the
sources themselves are reliant on climatic conditions and therefore inherently intermittent.
In addition to this, the load to be supplied is also fluctuating and therefore it is even more
difficult to predict the load and supply together.
As these stand-alone systems run without any grid connection, they must be strategically
controlled to be reliable systems with only a small operational cost. In addition to this, as there
is generally limited funding for rural areas, the design of such systems must be cost-effective
as well.
When the PV-Wind-Diesel-Battery hybrid system is not optimally managed, there is high
operational cost mainly related to fuel. The problem that this research deals with is the
development of models that can optimally control the use of a diesel generator in the hybrid
© Central University of Technology, Free State

3
system to minimize fuel consumption. The high cost of diesel fuel makes the diesel generator
operation very expensive when running as a stand-alone power generation system.
The PV-Wind-Diesel-Battery hybrid systems have greater reliability and minimize the fuel cost
if strategically controlled.
1.3. Objective of the study
The present work looks at the optimization of the daily operational cost of hybrid
Photovoltaic-Wind-Diesel- battery systems from an energy efficiency point of view, as one of
the main attributes of energy efficiency is seeking for optimality. Energy efficiency can be
defined as the ratio of the output to the input energy and is characterized by the performance
efficiency, the operational efficiency, the equipment efficiency, and the technology efficiency
as main components (Xia X. et al 2011). Operational efficiency is a system-wide measure,
which is assessed by taking into consideration the optimal sizing and matching of all system
components, time control and human coordination. Operational efficiency can be enhanced
using mathematical optimization and optimal control techniques (Xia X. et al 2011).
Therefore, the present work focuses on the development of two models, namely the
“continuous” control strategy and “ON/OFF” control strategy to minimize the operation cost
of PV-wind-diesel-battery hybrid systems during a 24-hour period. Considering a short time
horizon, the battery, wind and PV’s operation costs are negligible, therefore only the fuel cost
of the DG is considered.
© Central University of Technology, Free State

4
1.4. Delimitation of the study
This research will be limited to:
Development of mathematical models to minimize the operational cost of the proposed
system
Computer simulation of the models through case studies
1.5. Expected outcome of the study
The expected outcome of this research is the development of models for two control
strategies involving “CONTINUOUS” and “ON/OFF” operational of the diesel generator in
the PV-WT-Diesel-battery hybrid power system to minimize the daily operation cost of the
system.
The research results will be documented as part of this master’ thesis as well as in
publications.
1.6. Project methodology
The following methodology will be used for this research:
Literature review: The literature related to photovoltaic, wind, diesel generator and
battery will be reviewed and also previous researches on different control strategies
used for photovoltaic-wind-diesel-battery hybrid systems. The review will help one to
© Central University of Technology, Free State

5
understand the previous studies in which the diesel generators were used and different
control strategies previously applied to optimize the system.
This will also include an in-depth study of all the components involved in the system.
System model development: After reviewing previous studies, the mathematical
models of the system will be developed (objective functions and constraints) as well as
implementation of the developed model in the MatLab.
Simulation of developed models: The mathematical models developed will be
simulated using Matlab tools.
Assessment and comparison of the results: The results of different control strategies
will be analysed and the results compared to a diesel generator stand-alone operation.
The results will be compared in terms of daily operation cost.
1.7. Hypothesis
The proposed models will contribute to the reduction of the system’s operation cost as
the system will help in reducing the prolonged use of the diesel generator, hence
reducing the fuel consumption.
1.8. Publications during the study
Paper presented:
B. Bokabo, K. Kusakana “Optimal scheduling of a grid-connected hydrokinetic-battery system
under Time of Use tariff”. International Conference on Industrial and Commercial Use of
Energy (ICUE 2017), pp. 286-291, Cape Town, South Africa August 15 - 17, 2016.
© Central University of Technology, Free State

6
1.9. Dissertation layout
This thesis has been structured in 6 chapters, with chapters IV and V reflecting the main
research in which the development, simulations and results are presented.
Chapter I presents the background of the research, the problems of the research and the
methodology and approach of the research.
Chapter II reviews previous researches done in hybrid systems and the different control
strategies used to control the use of diesel generators in hybrid power systems.
Chapter III presents the components of the proposed hybrid power systems discussed in this
research, their stand-alone operations and their operation in hybrid power systems
Chapter IV presents the proposed continuous operation model including a detail algorithm of
the optimization. Here the objective function and variables of the model are outlined, the
detailed algorithm is presented and simulated in Matlab and the results of the simulation are
discussed.
Chapter V presents the proposed on-off operation model including a detailed algorithm of the
optimization. Here the objective function and variables of the model are outlined; the detailed
algorithm is presented and simulated in Matlab and the results of the simulation are discussed.
Chapter 6 concludes the work and future studies are proposed.
© Central University of Technology, Free State

7
Chapter II: Literature review
2.1 Introduction
A hybrid power system consists of a combination of different renewable energy generation
systems. The combination of different renewable sources provides reliability to the output
power as the sources complement each other during the fluctuation of climatic conditions and
also improve the overall economy of the renewable power generation supplying a given load.
This section reviews the literature related to photovoltaic-wind turbine- diesel generator and
battery storage systems, different control strategies and optimal control used for the control of
the diesel generators in the hybrid systems.
2.2 Literature related to optimal control of photovoltaic-wind
turbine-diesel generator and battery storage system.
Effective operation of a hybrid system can be achieved only by suitable control of the
interaction in the operation of different devices (Ani Vincent, 2014).
Several authors have discussed the optimal operation control of hybrid RE-diesel-battery
systems for stand-alone power generation.
(Ani Vincent, 2014) presented a supervisory control system that monitors the operation of
PV-Wind-Diesel hybrid power generation system with energy storage. The controller was
developed in such way that it coordinates when power should be generated by renewable
energy (PV panels and wind turbine) and when it should be generated by the diesel generator,
and it is intended to maximize the use of a renewable energy system by limiting the use of a
© Central University of Technology, Free State

8
diesel generator. Diesel generation is allocated only when the demand cannot be met by the
renewable energy sources, including a battery bank. The developed control was used to study
the operations of a hybrid PV-Wind-Diesel power system for three hypothetical off-grid
remote health clinics at various clinic geographical locations in Nigeria. It was observed that a
hybrid controller allocates the sources optimally according to the demand availability. From
the control simulation they were able to check the performance of the system over the course
of year to see which mode(s) the system spends most time in, the power supplied by each of
the energy sources over a year, and the power required by the load during a year.
(Dufo-Lopez et al., 2004) developed the HOGA program (Hybrid Optimization by Genetic
Algorithms) used to design a PV-Diesel system (sizing and operation control of a PV-Diesel
system). The program has been developed in C++. Two algorithms are used in HOGA. The
main algorithm obtains the optimal configuration of the hybrid system, minimizing its Total
Net Present Cost. For each vector of the main algorithm, the optimal strategy is obtained
(minimizing the non-initial costs, including operation and maintenance costs) by means of the
secondary algorithm. In the paper, a PV-Diesel system optimized by HOGA is compared with
a stand-alone PV system that has been dimensioned using a classical design method based on
the available energy under worst-case conditions. HOGA is also compared with a commercial
program for optimization of hybrid systems such as the Hybrid Optimization Model for Energy
Renewable (HOMER) and HYBRID2.
In (Dufo-Lopez et al., 2008) presented another study of the influence of mathematical
models on the optimal design of PV-Diesel systems. For this purpose, HOGA was used. The
mathematical models of some hybrid system elements was improved in comparison to those
usually employed in hybrid systems’ design programs. Furthermore, a more complete general
© Central University of Technology, Free State

9
control strategy was developed, one that also takes into account more characteristics than those
usually considered in this kind of design.
(Nafeh A, 2009) developed and applied an operational control technique, based on using
the fuzzy logic controller (FLC) and the commonly used ON-OFF controller for a Photovoltaic-
Diesel-Battery hybrid energy system. This control technique aims to reliably satisfy the
system’s load, and at the same time to optimize the battery and diesel operation under all
working atmospheric conditions. The proposed hybrid energy system is modelled and
simulated using MATLAB/Simulink and FUZZY toolbox.
In (A. Brahma et al., 2000) reviewed the optimization of the instantaneous electrical
generation/electrical storage power split in series hybrid electric vehicles (SHEV). Optimal
energy management is related to the optimization of the instantaneous generation/storage
power split in SHEV. Previously, a power split type solution of the series hybrid energy
management problem was attempted using a rule-based approach. Their approach provides a
dynamic programming solution of the problem of determining the optimal power split between
both sources of energy, with realistic cost calculation for all considered power trajectories for
the combined APU/generator, electric machines and battery efficiencies, and a penalty function
formulation for the deviation of the ideal state-of-charge to be sustained over the length of time
considered. The discrete state formulation of this dynamic programming approach makes
computation very efficient. Results are obtained for series hybrids for the FUDS drive cycle.
(Kyoungsoo Ro and S. Rahman, 1998) presented the Two-loop controller for maximizing
performance of a grid-connected photovoltaic-fuel cell hybrid power plant. Their focus was to
maximize the performance of a grid-connected photovoltaic (PV)-fuel cell hybrid system by
using a two-loop controller. One loop is a neural network controller for maximum power point
tracking, which extracts maximum available solar power from PV arrays under varying
© Central University of Technology, Free State

10
conditions of insolation, temperature, and system load. A real/reactive power controller
(RRPC) is the other loop. The RRPC achieves the system's requirements for real and reactive
powers by controlling incoming fuel to fuel cell stacks as well as switching control signals to
a power conditioning subsystem. Results of time-domain simulations prove not only the
effectiveness of the proposed computer models of the two-loop controller but also its
applicability for use in the stability analysis of the hybrid power plant.
(S. Hedlund et al., 1999) reviewed method for optimal control of hybrid systems. An
inequality of the Bellman type is considered and every solution to this inequality gives a lower
bound on the optimal value function. A discretization of this “hybrid Bellman inequality” leads
to a convex optimization problem in terms of finite-dimensional linear programming. From the
solution of the discretized problem, a value function that preserves the lower bound property
can be constructed. An approximation of the optimal feedback control law was given and tried
on some examples.
(F. Thanaa et al., 2005) reviewed an energy system comprising three energy sources, namely
PV, wind and fuel cells. Each of the three energy sources is controlled so as to deliver energy
at optimum efficiency. Fuzzy logic control is employed to achieve maximum power tracking
for both PV and wind energies and to deliver this maximum power to a fixed dc voltage bus.
The fixed voltage bus supplies the load, while the excess power feeds the water electrolyzer
used to generate hydrogen for supplying the fuel cells. A management system is designed to
manage the power flow between the system components in order to satisfy the load
requirements throughout the whole day. A case study is done using practical data from the El-
Hammam site (40 km west of Alexandria, Egypt). The study defines the power generated by
the wind and PV systems, the generated hydrogen used and stored in tanks and the power
generated by the fuel cells to supply the deficiency in the load demand. Simulation results,
© Central University of Technology, Free State

11
done for two seasons, proved the accuracy of the fuzzy logic controllers. In addition, a complete
description of the management system was presented.
(R. Chedid et al., 1997) presented a study on the Unit sizing and control of hybrid wind-
solar power systems. The aim of the study was to provide the core of a CAD/CAA tool that
can help designers determine the optimal design of a hybrid wind-solar power system for either
autonomous or grid-linked applications. The proposed analysis employs linear programming
techniques to minimize the average production cost of electricity while meeting the load
requirements in a reliable manner, and takes environmental factors into consideration both in
the design and operation phases. While in autonomous systems, the environmental credit
gained as compared to diesel alternatives can be obtained through direct optimization, in grid-
linked systems emission is another variable to be minimized so that the use of renewable energy
can be justified. A controller that monitors the operation of the autonomous/grid-linked systems
is designed. Such a controller determines the energy available from each of the system
components and the environmental credit of the system. It then gives details related to cost,
unmet and spilled energies, and battery charge and discharge losses.
2.3 Literature related to modelling of a hybrid power system
(Tiryono R. et al., 2003) developed a mathematical model for the operation of a hybrid
power system consisting of a solar PV-renewable energy source (photovoltaic PV arrays), a
battery bank, an inverter and a generator. They considered the problem of controlling a given
hybrid power system in an optimal manner so that the overall operational cost is minimized
while the load requirements and various constraints are satisfied. They were interested in
determining the optimum running times and levels of operation of the diesel generators over a
© Central University of Technology, Free State

12
fixed time period. They assumed that the given generators can operate at a number of different
levels of power output. Alternatively, as the generators operate most efficiently at full capacity,
they chose the switching times between the various power output levels to optimize the overall
system performance. The objective function of their proposed model also contains a term which
takes into account the additional mechanical wear on the generators due to short periods of
operating in a particular mode. A third consideration in their object function was the cost which
can be attributed to the discharge/recharge cycles of the battery bank as deep cycles can
significantly shorten the usable lifetime of the battery bank.
In (Woon S.F et al., 2008) reviewed an optimal control approach used by Tiryono R. et al
to evaluate the differences in operating strategies and configurations during the design of a PV-
diesel-battery model. However, Tiryono R. et al did not capture all realistic aspects of the
hybrid power system. In this paper, the optimal control model was analysed and compared with
three different simulation and optimization programs. The authors proposed several
improvements to the current model to make it more representative to real systems.
(Ashari M. et al., 1999) presented the dispatch strategies for the operation of a PV-diesel–
battery hybrid power system using ‘set points’. This includes the determination of the optimum
set point values for the starting and stopping of the diesel generator in order to minimize the
overall system costs. A computer program for a typical dispatch strategy has been developed
to predict the long-term energy performance and the life cycle cost of the system. Currently,
the development of models for optimal scheduling and energy management of stand-alone or
grid connected renewable systems is gaining attention.
In (Tazvinga et al., 2013) developed a hybrid system model incorporating photovoltaic cells
and diesel generator in which the daily energy demand fluctuations for different seasonal
periods of the year were considered in order to evaluate the equivalent fuel costs as well as the
© Central University of Technology, Free State

13
operational efficiency of the system for a 24 hours period. The results show that the developed
model can give a more realistic estimate of the fuel costs reflecting fluctuations of power
consumption behavior patterns for any given hybrid system.
In (Tazvinga et al., 2009) presented an energy dispatch model that satisfies the load demand,
taking into account the intermittent nature of the solar and wind energy sources and variations
in load demand was presented for a solar photovoltaic-wind-diesel-battery hybrid power supply
system. The emphasis in this work is on the coordinated management of energy flow from the
battery, wind, photovoltaic and diesel generators when the system is subject to disturbances.
The results show that the advantages of the approach become apparent in its capability to
attenuate and its robustness against uncertainties and external disturbances.
(Wu Z. et al., 2015) presented a switching grid connected photovoltaic system for
simplifying system installation. An optimal switching control model was proposed to
sufficiently utilize the solar energy and to minimize electricity cost under the time-of-use
(TOU) program. The results showed that optimal scheduling of the PV system can achieve
promising cost savings.
In ( Sichilalu S.M et al.2015) developed an optimal control strategy for power dispatch of
the grid-tied photovoltaic PV-battery-diesel system to power heat pump water heaters
(HPWH). The objective function of the model is to minimize energy and fuel cost while
maximizing PV energy trade-off for incentives. The optimal control shows a great potential to
realize a practical net zero-energy building and demand side management. The optimal control
problem is solved using a mixed integer non-linear program and the results show how TOU
affects the power dispatch to the HPWH. The energy and cost savings are presented in this
paper.
© Central University of Technology, Free State

14
(Zhou Wei, 2007) presented the simulation and optimum design of a hybrid solar-wind and
solar-wind-diesel power generation system. The author developed an optimal sizing method to
find the global optimum configuration of stand-alone hybrid (both solar-wing and solar-wing-
diesel) power generation systems. By using a genetic algorithm (GA), the optimal sizing
method was developed to calculate the system’s optimum configuration which offers to
guarantee the lowest investment with full use of the PV array, wind turbine and battery bank.
For the hybrid solar-wind system, the optimal sizing method is developed based on the loss of
power supply probability (LPSP) and the annualized cost of system (ACS) concepts. The
optimization procedure aims to find the configuration that yields the best compromise between
the two considered objectives: LPSP and ACS. The decision variables, which need to be
optimized in the optimization process, are the PV module capacity, battery capacity, PV
module slope angle and wind turbine installation height. The hybrid solar-wind-diesel system,
minimization of the system is achieved not only by selecting an appropriate system
configuration, but also by finding a suitable control strategy (starting and stopping point) of
the diesel generator. The optimal sizing method was developed to find the system’s optimum
configuration and settings that can achieve the custom-required renewable energy fraction
(fRE) of the system with minimum annualized cost of system (ACS).
(Besem Idlbi, 2012) presented the dynamic simulation of a PV-Diesel-Battery hybrid plant
for off grid electricity supply. The author analysed different control strategies to improve the
operation of stand-alone PV-diesel generator-battery plants, and to reduce the operational cost
accordingly. Therefore, four control strategies were proposed according to primary and
secondary control of frequency. Each control strategy provides different loading patterns of the
diesel generators and storage system. Dynamic simulations of the plant operation are performed
according to each control strategy. The effects of the control strategy are analysed according
© Central University of Technology, Free State

15
to four criteria: the frequency deviations, fuel consumption, lifetime of the batteries and the
performance of the diesel generators. Finally, the cost of energy is calculated by considering
the difference in fuel consumption according to each control strategy. The simulation results
show that the control strategy, which covers the power fluctuations mainly from the battery
system, demonstrates more constant output power of diesel generators, lower frequency
deviations, less fuel consumption, better performance of diesel generators and less cost of
energy, but shorter expected lifetime of the batteries compared to the other analysed control
strategies. On the other hand, the control strategy, which covers the power fluctuations from
the diesel generators and battery system in parallel, demonstrates higher variation in output
power of the diesel generators, higher frequency deviations, higher fuel consumption, less
favourable performance of the diesel generators and higher cost of energy, but longer lifetime
of the battery compared to the other analysed control strategies.
In 2013 B. Ould Bilal et al presented a paper discussing the study of the influence of load
profile variation on the optimal sizing of a stand-alone hybrid PV/WIND/Battery/Diesel
system. The paper presented the methodology to size and to optimize a stand-alone hybrid
PV/Wind/ Diesel/ Battery bank minimizing the levelised cost of energy (LCE) and the CO2
emission using a multi-objective genetic algorithm approach. The main objective of the work
was to study the influence of the load profile variation on the optimal configuration. The
methodology developed was applied using solar radiation, temperature and wind speed
collected on the site of Gandon located in North-western Senegal. The results obtained showed
that, for the all load profiles, as the LCE increases the CO2 emission deceases.
(S. K. Kim et al., 2008) presented a paper discussing the dynamic modeling and control of
a grid connected hybrid generation system with versatile power transfer. They presented the
power control strategies of a grid-connected hybrid generation system with versatile power
© Central University of Technology, Free State

16
transfer. Versatile power transfer was defined as a multimode of operation, including normal
operation without the use of a battery, power dispatching, and power averaging, which enables
grid or user friendly operation. A supervisory control regulates power generation of the
individual components so as to enable the hybrid system to operate in the proposed modes of
operation. A simple technic using a low-pass filter was introduced for power averaging. A
modified hysteresis-control strategy was applied in the battery converter.
(M. Uzunoglo et al., 2008) presented the study on the modelling, control and simulation of
a PV/FC/UC based hybrid power generation system for stand-alone applications. The paper
focused on the integration of photovoltaic (PV), fuel cell (FC) and ultra-capacitor (UC) systems
for sustained power generation. In the proposed system, during adequate insolation, the PV
system feeds the electrolyzer to produce hydrogen for future use and transfers energy to the
load side if possible. Whenever the PV system cannot completely meet load demands, the FC
system provides power to meet the remaining load. If the rate of load demand increases the
outside limits of FC capability, the UC bank meets the load demand above that which is
provided by PV and FC systems. The main contribution of this work was the hybridization of
alternate energy sources with FC systems using long- and short-term storage strategies with
appropriate power controllers and control strategies to build an autonomous system, with a
pragmatic design and dynamic model proposed for a PV/FC/UC hybrid power generation
system. The model was developed and applied in the MATLAB®, Simulink® and
SimPowerSystems® environment, based on the mathematical and electrical models developed
for the proposed system.
(J.T. Bialasiewicz et al., 1998) presented a modular simulation system developed to study
the dynamics and to aid in the design of hybrid power systems with diesel and wind turbine
generation. The emphasis was placed on the representation of the dynamics of the elements of
© Central University of Technology, Free State

17
a real system and on the control aspects of the modules. Each module represents a component
of the hybrid power system, such as the diesel generator, wind turbine generator, village load,
etc. Various system configurations with different load and wind resource profiles can be
simulated. The tool can be used to study the transient and the steady-state interaction of the
various components of a hybrid system. It is especially useful when a new configuration of a
power system is to be analysed, a new load or wind speed profile has to be included, additional
modules have been installed in an existing power system, or an old control strategy is to be
replaced by a new one.
2.4 Literature related to different control strategies used for a
hybrid power system.
(Emad M. Natsheh and Alhussein Albarbar, 2013) presented a paper discussing the hybrid
power systems’ energy controller based on neural network and fuzzy logic. The paper
presented a novel adaptive scheme for energy management in stand-alone hybrid power
systems. The proposed management system was designed to manage the power flow between
the hybrid power system and energy storage elements in order to satisfy the load requirements
based on article neural network (ANN) and fuzzy logic controllers. The neural network
controller was employed to achieve the maximum power point (MPP) for different types of
photo-voltaic (PV) panels. The advance fuzzy logic controller was developed to distribute the
power throughout the hybrid system and to manage the charge current flow for performance
optimization. The developed management system performance was assessed using a hybrid
system comprising PV panels, wind turbines (WT), battery storage and a proton exchange
membrane fuel cell (PEMFC). To improve the generating performance of the PEMFC and
© Central University of Technology, Free State

18
prolong its life, stack temperature was controlled by a fuzzy logic controller. The dynamic
behaviour of the proposed model was examined under different operating conditions. Real-
time measured parameters were used as input for the developed system. The proposed model
and its control strategy offer a proper tool for optimal hybrid power system performance, such
as that used in smart-house applications.
(S.R. Vosen and J.O. Keller, 1999) presented a study discussing the hybrid energy storage
systems for the stand-alone electric power systems: optimization of system performance and
cost through control strategies. A time-dependent model of a stand-alone, solar powered,
battery-hydrogen hybrid energy storage system was developed to investigate energy storage
options for cases where supply and demand of energy are not well matched daily or seasonally.
Simulations were performed for residential use with measure solar fluxes and simulated hourly
loads for a site at Yuma, Arizona, USA, with a desert climate at 32.7 N latitude. Renewable-
based power not needed to satisfy the load was stored for later user. Two hybrid energy storage
algorithms were considered. The first was a conventional state-of-charge control system that
uses the current state of charge of the storage system control. The second control system
presumes knowledge of future demand through a feed-forward, neural- net or other intelligent
control systems.
Both algorithms use battery storage to provide much of the daily energy shifting and
hydrogen to provide seasonal energy shifting, thus using each storage technology to its best
advantage. The cost of storing energy with a hybrid energy-storage scheme was found to be
much less expensive than either single storage method, with a hybrid system storage costing
48% of the cost of a hydrogen-only system and only 9% of the cost of a conventional, battery-
only system. In addition, the neural-net control system was compared to a standard battery
state-of-charge control scheme, and it was shown that neural-net control systems better utilize
© Central University of Technology, Free State
19
expensive components and result in less expensive electric power than state-of-charge control
systems.
(G.C Seeling-Hochmuth, 1997) presented a combined optimization concept for the design
and operation strategy of hybrid-PV energy systems. The paper presented a method to jointly
determine the sizing and operation control of hybrid-PV systems. The outlined approach finds
an optimum operation strategy for a hybrid system by carrying out a search through possible
options for the system operation control. The search was conducted over a period using
estimated weather and demand data and long-term system component characteristics. The
costing of the operating strategies was evaluated and component sizes were changed by the
designed algorithm according to optimum search rules. As a result, an optimum system
configuration was chosen by the algorithm together with an optimum operation strategy for a
given site and application requirement.
(C. Dennis Barley and C. Byron Winn, 1996) presented the optimal strategy in remote
hybrid power systems. In this study, dispatch strategies were compared using (1) an analysis
of cost trade-offs, (2) a simple, quasi-steady-state time-series model, and finally (3) HYBRID2,
a more sophisticated stochastic time-series model. An idealized predictive dispatch strategy,
based on assumed perfect knowledge of future load and wind conditions was developed and
used as a benchmark in evaluating simple, non-predictive strategies. The results illustrate the
nature of the optimal strategy and indicate that one of two simple diesel dispatch strategies-
either load-following or full power for a minimum run time-can, in conjunction with the frugal
use of stored energy (the Frugal discharge strategy), be virtually as cost-effective as the Ideal
Predictive Strategy. The optimal choice of these two simple charging strategies is correlated to
three dimensionless parameters, yielding a generalized dispatch design chart for an important
class of systems.
© Central University of Technology, Free State

20
(T.S. Bhatti et al., 1997) presented a paper discussing the load frequency control of isolated
wind diesel hybrid power systems. In the study, a load frequency controller was designed for
isolated wind diesel hybrid power systems, and its effect on the transient performance of the
system is evaluated. The modelling of the system, consisting of a wind turbine induction
generator unit and a diesel engine synchronous alternator unit, is presented along with the
controller, both for continuous and discrete control cases. Optimum parameter values were
obtained for different hybrid power system examples with continuous and discrete load
frequency control and with and without blade pitch controllers, using the integral square error
criterion (ISE). It was shown that wind diesel or multi-wind diesel hybrid power systems, with
blade pitch control mechanism and with continuous load frequency control, have better
dynamic performance than any other configuration of the isolated wind diesel hybrid systems.
Finally, some of the transient responses of the systems were shown for optimum gain settings.
(K. Yoshimoto et al., 2006) developed the New Control Method for Regulating State-of-
Charge of a Battery in Hybrid Wind Power/Battery Energy Storage System. As an approach
for the output fluctuation, authors have done a research in smoothing out a short-term
fluctuation using a hybrid system of a battery energy storage system and a wind farm. In order
to operate the hybrid system, the charging level of the battery has to be regulated not to exceed
its operable range. The paper presented a control system called as "state-of-charge feedback
control" to keep the charging level of the battery within its proper range, while the battery
energy storage system smoothes out output fluctuation of a wind farm. Furthermore, the paper
clarifies fundamental characteristics of the control to show its effectiveness through a
theoretical study and numerical simulations.
(W.M. Lin et al, 2011) presented a paper discussing the Neural-Network-Based MPPT
Control of a Stand-Alone Hybrid Power Generation System. A stand-alone hybrid power
© Central University of Technology, Free State

21
system was proposed in the paper. The system consists of solar power, wind power, diesel
engine, and an intelligent power controller. MATLAB/Simulink was used to build the dynamic
model and simulate the system. To achieve a fast and stable response for the real power control,
the intelligent controller consists of a radial basis function network (RBFN) and an improved
Elman neural network (ENN) for maximum power point tracking (MPPT). The pitch angle of
the wind turbine is controlled by the ENN, and the solar system uses RBFN, where the output
signal is used to control the dc/dc boost converters to achieve the MPPT.
(Phatiphat Thounthong et al., 2005) examined the Control strategy of fuel
cell/supercapacitors hybrid power sources for an electric vehicle. They presented a control
principle for utilizing a PEM fuel cell as main power source and supercapacitors as auxiliary
power sources for electric vehicle applications. The strategy was based on dc link voltage
regulation, and the fuel cell is simply operating in almost steady state conditions in order to
minimize its mechanical stresses and to ensure a good synchronization between fuel flow and
fuel cell current. Supercapacitors are functioning during transient energy delivery or transient
energy recovery. To authenticate control algorithms, the system structure is realized by
analogical current loops and digital voltage loops (dSPACE). The experimental results with a
500 W PEM fuel cell point out the fuel cell starvation problem when operating with a dynamic
load, and also confirm that the supercapacitor can improve system performance for hybrid
power sources.
(M.H. Nehrir et al., 2011) reviewed the Hybrid Renewable/Alternative Energy Systems for
Electric Power Generation systems focusing on energy sustainability. They highlighted some
important issues and challenges in the design and energy management of hybrid RE/AE
systems. System configurations, generation unit sizing, storage needs, and energy management
and control are addressed. Statistics on the current status and future trend of renewable power
© Central University of Technology, Free State

22
generation, as well as some critical challenges facing the widespread deployment of RE/AE
power generation technologies and vision for future research in this area, are also presented.
In (F. Valenciaga et al., 2001) presented power control of a photovoltaic array in a hybrid
electric generation system using sliding mode techniques. The system comprises photovoltaic
and wind generation, a storage battery bank and a variable monophasic load. The control law
admits two modes of operation. The first takes place when the insolation regime is sufficient
to satisfy the power demand. The second mode of operation takes place under insufficient
insolation regimes. The latter leads the system operation at the maximum power operation point
to save as much stored energy as possible. A new method based on the IncCond algorithm was
developed. Sliding mode control techniques are used to design the control law. These
techniques provide a simple control law design framework and contribute with their well-
known robust properties. Finally, guidelines based on chattering considerations are given for
the design of the practical system
In (F. Valenciaga et al., 2005) developed the supervisor control for a stand-alone hybrid
generation system using wind and photovoltaic energy. The objectives of the supervisor control
were, primarily, to satisfy the load power demand and, second, to maintain the state of charge
of the battery bank to prevent blackout and to extend the life of the batteries. For these purposes,
the supervisor controller determines online the operational mode of both generation
subsystems, switching from power regulation to maximum power conversion. Decision criteria
for the supervisor based on measurable system variables are presented. Finally, the
performance of the supervisor controller is extensively assessed through computer simulation
using a comprehensive nonlinear model of the plant.
(A. M. O. Haruni et al., 2010) presented the dynamic operation and control strategies of a
hybrid wind-diesel-battery energy storage based power supply system for isolated
© Central University of Technology, Free State
23
communities. Control strategies for voltage and frequency stabilization and efficient power
flow among the hybrid system components were developed. The voltage and frequency of the
hybrid wind-diesel system is controlled either by a load side inverter or by diesel generation
depending on the wind conditions. During high penetration of wind, the wind turbine supplies
the required power to the load. A battery energy storage system is connected to the dc-link to
balance the power generated from the wind turbine and the power demanded by the load. Under
low wind conditions, a diesel generator is used with a wind energy conversion system to
generate the required power to the load. A power sharing technique has been developed to
allocate power generation for diesel generator in low wind conditions. Results show that the
control strategies work very well under dynamic and steady state conditions to supply power
to the load.
In (T. Zhou et al., 2010) presented the studies on the Energy Management and Power
Control of a Hybrid Active Wind Generator for Distributed Power Generation and Grid
Integration. A dc-coupled wind/hydrogen/supercapacitor hybrid power system was studied.
The purpose of the control system was to coordinate these different sources, particularly their
power exchange, in order to control the generated power. As a result, an active wind generator
can be built to provide some ancillary services to the grid. The control system should be adapted
to integrate the power management strategies. Two power management strategies are presented
and compared experimentally. It was found that the “source-following” strategy has a better
performance on the grid power regulation than the “grid-following” strategy.
(M. Datta et al., 2009) reviewed a Frequency-Control Approach by Photovoltaic Generator
in a PV–Diesel Hybrid Power System. A simple fuzzy-based frequency-control method was
proposed for the PV generator in a PV-diesel hybrid system without the smoothing of PV
output power fluctuations. By means of the proposed method, output power control of a PV
© Central University of Technology, Free State

24
generator considering the conditions of power utilities and the maximizing of energy capture,
are achieved. Fuzzy control was used to generate the PV output power command. This fuzzy
control has average insolation, change of insolation, and frequency deviation as inputs. The
proposed method was compared with a maximum power point tracking control-based method
and with an ESS-based conventional control method. The numerical simulation results showed
that the proposed method is effective in providing frequency control and also delivers power
near the maximum PV power level.
N.J. Schouten et al developed a fuzzy logic controller for hybrid vehicles with parallel
configuration. Using the driver command, the state of charge of the energy storage, and the
motor/generator speed, a set of rules has been developed, in a fuzzy controller, to effectively
determine the split between the two power plants: electric motor and internal combustion
engine. The underlying theme of the fuzzy rules is to optimize the operational efficiency of all
components, considered as one system. Simulation results were used to assess the performance
of the controller. A forward-looking hybrid vehicle model was used for implementation and
simulation of the controller. Potential fuel economy improvement is shown by using fuzzy
logic, relative to other controllers, which maximize only the efficiency of the engine.
In (Amin Hajizadeh et al., 2007) presented the intelligent power management strategy of a
hybrid distributed generation system. The study describes a novel control strategy for active
power flow in a hybrid fuel cell/battery distributed generation system. The method introduces
an on-line power management by a hierarchical hybrid controller between dual energy sources
that consist of a battery bank and a solid oxide fuel cell (SOFC). The proposed method includes
an advance supervisory controller in the first layer which captures all of the possible operation
modes. This layer has been developed by a state flow toolbox and prepares a proper supervisory
environment for this complex structure. In the second layer, an advanced fuzzy controller has
© Central University of Technology, Free State

25
been developed for power splitting between battery and fuel cell. With regards to the operation
modes, the upper layer makes a decision to choose the switching chain rules and corresponding
controller in the second layer. Finally, in the third layer, there are local controllers to regulate
the set points of each subsystem to reach the best performance and acceptable operational
indexes. Simulation results of a test system illustrate improvement in the operational efficiency
of the hybrid system and the battery state-of-charge has been maintained at a reasonable level.
(C. Wang et al., 2008) proposed an AC-linked hybrid wind/photovoltaic (PV)/fuel cell (FC)
alternative energy system for stand-alone applications. Wind and PV were the primary power
sources of the system, and an FC-electrolyzer combination was used as a backup and a long-
term storage system. An overall power management strategy was designed for the proposed
system to manage power flows among the different energy sources and the storage unit in the
system. A simulation model for the hybrid energy system has been developed using
MATLAB/Simulink. The system’s performance under different scenarios was verified by
carrying out simulation studies using a practical load demand profile and real weather data.
In (Jose L. Bernal-Augustin et al., 2008) presented the application of the strength Pareto
evolutionary algorithm to the multi-objective design of isolated hybrid systems, minimizing
both the total cost throughout the useful life of the installation and the unmet load. For this
task, a multi-objective evolutionary algorithm (MOEA) and a genetic algorithm (GA) have
been used in order to find the best combinations of components for the hybrid system and
control strategy. Also, a novel control strategy has been developed and it was expounded in the
article. As an example of application, a PV–wind–diesel system has been designed, obtaining
a set of possible solutions (Pareto set) from which the designer can choose those which he/she
prefers considering the costs and unmet load of each.
© Central University of Technology, Free State

26
In (Erkan Dursun et al., 2011) presented the different power management strategies of a
stand-alone hybrid power system. The system consisted of three power generation systems,
photovoltaic (PV) panels, a wind turbine and a proton exchange membrane fuel cell (PEMFC).
PV and wind turbine provide the main supply for the system, and the fuel cell performs as a
backup power source. Therefore, continuous energy supply needs energy storing devices. In
the proposed hybrid system, gel batteries were used. The state-of-charge (SOC), charge-
discharge currents were affecting the battery energy efficiency. The battery energy efficiency
was evaluated with three different power management strategies. The control algorithm was
using Matlab-Simulink.
In (T. Hirose et al., 2011) proposed a unique stand-alone hybrid power generation system,
applying advanced power control techniques, fed by four power sources: wind power, solar
power, storage battery, and diesel engine generator. Considerable effort was put into the
development of active-reactive power and dump power controls. The results of laboratory
experiments revealed that amplitudes and phases of ac output voltage were well regulated in
the proposed hybrid system. Different power sources can be interconnected anywhere on the
same power line, leading to flexible system expansion. It is anticipated that this hybrid power
generation system, into which natural energy is incorporated, will contribute to global
environmental protection on isolated islands and in rural locations without any dependence on
commercial power systems.
(Y. Rifonneau et al., 2011) presented an optimal power management mechanism for grid
connected photovoltaic (PV) systems with storage. The objective was to help intensive
penetration of PV production into the grid by proposing peak shaving service at the lowest cost.
The structure of a power supervisor based on an optimal predictive power scheduling algorithm
is proposed. Optimization was performed using Dynamic Programming and was compared
© Central University of Technology, Free State

27
with a simple ruled-based management. The particularity of this study remains firstly in the
consideration of batteries ageing into the optimization process and secondly in the “day-ahead”
approach of power management. Simulations and real conditions application are carried out
over one exemplary day. In simulation, it points out that peak shaving is realized with the
minimal cost, but especially that power fluctuations on the grid are reduced which fits in with
the initial objective of helping PV penetration into the grid. In real conditions, efficiency of the
predictive schedule depends on accuracy of the forecasts, which leads to future inputs about
optimal reactive power management.
In (Nabil A et al, 2008) reviewed the power fluctuations suppression of stand-alone hybrid
generation combining solar photovoltaic/wind turbine and fuel cell systems. A hybrid energy
system combining variable speed wind turbine, solar photovoltaic and fuel cell generation
systems was presented to supply continuous power to residential power applications as stand-
alone loads. The wind and photovoltaic systems are used as main energy sources while the fuel
cell was used as secondary or back-up energy source. Three individual dc–dc boost converters
were used to control the power flow to the load. A simple and cost effective control with dc–
dc converters was used for maximum power point tracking and hence maximum power
extracting from the wind turbine and the solar photovoltaic systems. The hybrid system was
sized to power a typical 2 kW/150 V dc load such as telecommunication power plants or ac
residential power applications in isolated islands, continuously throughout the year.
The results show that even when the sun and wind are not available, the system is reliable
and available and it can supply high-quality power to the load. The simulation results which
proved the accuracy of the proposed controllers are given to demonstrate the availability of the
proposed system in this paper. Also, a complete description of the management and control
system is presented.
© Central University of Technology, Free State

28
2.5 Summary
This chapter reviewed the previous works developed for the optimal operational control of
hybrid systems. Literature related to hybrid systems involving photovoltaic, wind turbine,
diesel generators and battery systems have been reviewed, including the different control
strategies used to control the use of diesel generators in the hybrid systems.
© Central University of Technology, Free State

29
Chapter III: Proposed hybrid system description
3.1. Introduction
This chapter describes the different components of the proposed hybrid system and their
utilization in the hybrid power systems. The proposed hybrid system model consists of a
combination of photovoltaic, wind turbine, diesel generator and battery system. In this chapter
all the components of the system will be described and their stand-alone operation and their
operation in a hybrid system will be elaborated on and the collected data for the specific
household used for the case study will be presented.
3.2. Photovoltaic system
3.2.1. Description of photovoltaic system
A solar panel consists of number of photovoltaic (PV) solar cells connected in series and
parallel. These cells are made up of at least two layers of semiconductor material (usually pure
silicon infused with boron and phosphorous). One layer has a positive charge; the other has a
negative charge. When sunlight strikes the solar panel, photons from the light are absorbed by
the semiconductor atoms, which then release electrons. The electrons, flowing from the
negative layer (n-type) of semiconductor, flow to the positive layer producing an electrical
current. Since the electric current flows in one direction (like a battery), the electricity
generated is DC (Shaika Tamanna et al., 2010).
© Central University of Technology, Free State

30
The solar cell is the basic unit of a PV system. An individual solar cell produces direct current
and power typically between 1 and 2W, hardly enough to power most applications. For actual
usage, the solar cells are interconnected in series/parallel combinations to form a PV module.
In the outdoor environment the magnitude of the current output from a PV module directly
depends on the solar irradiance and can be increased by connecting solar cells in parallel. The
voltage of a solar cell does not depend largely on solar irradiance, but depends primarily on the
cell temperature. PV modules can be designed to operate at different voltages by connecting
solar cells in series. Electrical parameters of a PV system are determined at standard test
conditions, i.e. 1000 W/m2 solar irradiance, 25°C cell temperature and AM1.5 solar radiation
(Miro Zeman, 2014).
The power output )( PVP of the PV module can be expressed as follows (Francisco Jose
Contreras Cordero, 2015):
PVPVPVPV IAP (3.1)
Where: PVA is the total area of the photovoltaic generator (m2);
PV is the module efficiency;
PVI is the hourly irradiance (kWh/m2).
The rated power of the PV is the maximum power that the panel can produce with 1,000
watts of sunlight per square metre at a module temperature of 25oC and air mass AM1.5. Actual
conditions will rarely match rated conditions and so actual power output will almost always be
less. PV modules with higher efficiency will have a higher ratio of watts to area. The higher
the efficiency, the smaller the area (i.e. fewer modules) will be required to achieve the same
© Central University of Technology, Free State

31
power output of an array. Installation and racking costs will be less with more efficient
modules, but this must be weighed against the higher cost of the modules (Miro Zeman, 2014).
3.2.2. Advantages of a photovoltaic power system
Photovoltaic presents distinct advantages such as zero pollution and the absence of the need
to transport fuel to the generating site, makes it attractive in many applications. Photovoltaic
facilities maybe located at the point of power consumption and do not require the purchase of
fuel, so this makes them economically feasible for remote applications because constructing
expensive distribution lines and high losses sustained by transmission of conventional power
do not apply (Tom Penick and Bill Louk, 1998).
PV systems that are well designed and properly installed require minimum maintenance and
have long service lifetimes (Gabrovska et al., 2004).
An important characteristic of photovoltaic power generation is that it does not require a
large scale installation to operate, as to conventional power generation stations. Power can be
installed in a distributed fashion, on each house or business, or school, using area that is already
developed, and allowing individual users to generate their own power quietly and safely (Zhou
Wei, 2007).
3.2.3. Disadvantages of a photovoltaic power system
The high cost of a photovoltaic power system makes it difficult to replace conventional
power generation. The stand-alone photovoltaic power system is not always reliable as the
energy produced depends on solar irradiation and requires the use of batteries or other storage.
© Central University of Technology, Free State

32
3.2.4. Types of PV systems
a) Stand-alone PV systems
Stand-alone systems rely on PV power only. These systems can comprise only PV modules
and a load or can include batteries for energy storage. PV system energy production depends
on the sun and if sun is not available no energy can be produced. When the PV system is
designed to supply a night load, the system needs to be combined with battery storage to store
the energy produced by the PV during the day for use at night or during cloudy weather. When
using batteries charge regulators are included, which switch off the PV modules when batteries
are fully charged, and switch off the load in case batteries become discharged below a certain
limit. The batteries must have enough capacity to store the energy produced during the day to
be used at night and during periods of poor weather.
The stand-alone PV systems are commonly used in rural areas where there is no grid or
other power stations and where the reliability of power is not a concern.
b) Grid-connected PV systems
Grid connected PV systems do not require batteries for storage, as the energy generated by
the PV systems is coupled to the grid by using inverters to convert the DC energy generated by
the PV to AC energy for compatibility with grid energy. The grid-connected PV systems have
© Central University of Technology, Free State

33
advantages of eliminating the need of energy storage and the cost associated to the substituting
and recycling of batteries for individual clients.
c) Hybrid operation of PV systems
The PV system can be combined with other sources of energy to form a hybrid power
configuration. Hybrid power systems have greater flexibility, high efficiency and lower cost
for the same quantity of energy production (M. Ashiri, 2001).
Hybrid systems consist of a combination of PV modules and a complementary means of
electricity generation such as a diesel, gas or wind generator. In order to optimize the operations
of the two generators, hybrid systems typically require more sophisticated controls than stand-
alone PV systems. For example, in the case of PV/diesel systems, the diesel engine must be
started when the battery reaches a given discharge level, and stopped again when the battery
reaches an adequate state of charge. The back-up generator can be used to recharge batteries
only or to supply the load as well.
A common problem with hybrid PV/diesel generators is inadequate control of the diesel
generator. If the batteries are maintained at too high a state-of-charge by the diesel generator,
then energy which could be produced by the PV generator is wasted. Conversely, if the batteries
are inadequately charged, then their operational life will be reduced. Such problems must be
expected if a PV generator is added to an existing diesel engine without installing an automatic
system for starting the engine and controlling its output (Miro Zeman et al., 2014).
© Central University of Technology, Free State

34
3.3. Wind energy system
3.3.1. Description of a wind energy system
A wind turbine is a machine for converting the kinetic energy in wind into mechanical
energy, which the mechanical energy produced from the wind is then converted to electric
energy via a generator. Wind turbines can be separated into two basic types based on the axis
around which the turbine rotates. Turbines that rotate around a horizontal axis are more
common. Vertical-axis turbines are less frequently used. Wind turbines can also be classified
by the location in which they are used such as onshore, offshore, and aerial wind turbines
(I.A. Adejumobi et al., 2011).
The power produced by the wind generators has AC voltage but has variable amplitude and
frequency. To maintain the frequency, the AC is converted to DC, stored in battery and then
converted back to AC.
The extractable power from the wind is given by:
3
,2
1vCAP W TpW TaW T (3.2)
Where: W TP is the output power of the wind turbine
a is the density of air (kg/m3);
pW TC is the coefficient of the wind turbine performance;
A is the wind turbine area (m2);
v is the wind velocity (m/s);
© Central University of Technology, Free State

35
The amount of power transferred to a wind turbine is directly proportional to the area swept
out by the rotor, to the density of the air, and the cube of the wind speed
The limitations on the extraction of energy from the wind include the practical size of wind
machines, their density, friction losses in the rotating machinery and efficiency of conversion
from rotational energy to electrical energy (Gagari deb et al., 2012).
A German physicist Albert Betz concluded in 1919 that no wind turbine can convert more than
16/27 (59.3%) of the kinetic energy of the wind into mechanical energy turning a rotor. To this
day, this is known as the Betz Limit or Betz' Law. The theoretical maximum power efficiency
of any design of wind turbine is 0.59 (Mohit Sigh and Surya Santoso, 2008)
3.3.2. Operation of wind turbine in a hybrid system
As seen in the section above, standalone wind energy systems generate highly fluctuating
and therefore unreliable energy due to the constant fluctuating wind speed. If the wind turbine
is used in combination with other sources in hybrid system configurations, the produced energy
can become more stable, increasing the system’s performance while reducing the size and the
overall cost of the system (K. Kusakana, 2014).
3.4. Diesel generator
3.4.1. Description of a diesel generator
A DG is a normal diesel engine coupled to an electrical generator. DGs are usually designed
in such a way that they always operate close to their power rating to achieve high efficiency;
© Central University of Technology, Free State

36
this condition can be used later as an operational constraint. With this operation strategy as
well as operational constraint, the DG is expected to run at high load factors, which will result
a decrease of the fuel consumption, a small carbon footprint and an increase in the DG lifespan.
The fuel cost (FC) calculated for a day is given by the quadratic non-linear function below:
N
j
jDGjDGf cbPaPC1
)(
2
)( )( (3.3)
Where: ,a b and c are the parameters related to any DG’s fuel consumption curve (available
from the manufacturer); fC is the price of one liter of diesel fuel; )( jDGP is the output power or
control variable from the DG in any sampling interval. It has to be highlighted that different
DGs of different sizes as well as from different manufacturers present different fuel
consumption curves and parameters.
3.4.2. Stand-alone Operation of diesel generator system
Electric power generators can be classified in one of three ways depending on their mode
of operation: continuous, prime, or standby. Continuous and prime power generators are very
similar as they function as the main source of power and are designed to operate continuously
or for extended periods of time. The major difference between the two is that continuous
generator sets are designed to operate continuously with a consistent load while prime
generators are designed to operate for long durations at variable load. The other type of
generator – standby/emergency – is to be run only when there is an outage to the utility grid or
the main source of power in a back-up situation. Continuous and prime generators are primarily
© Central University of Technology, Free State

37
used in remote locations where there is no access to the grid to supply electric power. These
are also used when the amount of electric power that can be drawn from the grid is limited. On
the other hand, the need for standby power arises when there is a temporary disruption to the
primary supply of electrical power, such as when the main grid is off.
Diesel generation power systems are the simplest generators that anyone can use to generate
energy in any location depending on the need. The system presents some advantages like: low
initial cost, easy to install, high power to weight ratio. However diesel generators, when used
as stand-alone, do present some disadvantages such as:
High operational and maintenance costs, pollution of the environment, noise pollution and also
the availability of fuels; if there is no fuel around no power can be produced.
3.4.3. Operation of diesel generator in a hybrid system
A diesel generator is used in a hybrid system as a back-up system to supply the deficit of
energy from other sources required by the load. The diesel generator is kept off and can only
run when the other sources are not able to produce energy at all or cannot produce enough
energy to satisfy the requirement of the load. The utilization of a diesel generator in the hybrid
systems increases the reliability of the energy system and minimizes the fuel consumption and
hence reduces the running cost of the diesel generation power system.
© Central University of Technology, Free State

38
3.5. Battery storage system
3.5.1. Description of a battery storage system
Battery energy storage systems (BESS) are the most common type of energy storage in
micro grids and are essential for efficiently utilizing the energy produced by intermittent energy
sources such as PV. Batteries convert electrical energy into chemical energy which is stored
and converted back into electrical energy when needed. There is currently a significant
development occurring in battery technology, but deep-cycle lead-acid batteries are still the
most common due to their low cost and high efficiency. A bidirectional DC-DC charge
controller controls the power flow to and from the battery. While deep-cycle batteries are
designed for deep discharges, the maximum discharge should still not exceed 75 % to avoid
damaging the batteries (Marte Wiig Lotveit, 2014).
3.5.2. Advantages and disadvantages of batteries in renewable energy
Advantages are:
Capability to provide energy for sunless or windless periods
Capability to meet momentary peak power demands
A stable voltage for the system
Capability to store energy produced by the PV or WT in excess of the instantaneous
demand, thereby reducing energy loss
One recent study showed that systems without batteries deliver an average of 2.5 hours per
day of rated output, whereas systems with batteries deliver 4.5 hours. Because batteries and the
© Central University of Technology, Free State

39
associated charge-rate regulator add to the number of parts in the system, certain disadvantages
accrue.
Batteries add to the system complexity;
Increase activity and maintenance costs for the system;
And frequently reduce the system’s reliability.
Despite these disadvantages, batteries are frequently worth including in the design, so
understanding their operation is important (H.L Macomber et al., 1981).
3.5.3. Types of batteries commonly used in renewable energy systems
Lead-Acid Batteries – Lead-acid batteries are most common in PV systems in general,
and sealed lead-acid batteries are most commonly used in grid-connected systems.
Sealed batteries are spill-proof and do not require periodic maintenance. Flooded lead-acid
batteries are usually the least expensive but require adding distilled water at least
monthly to replenish water lost during the normal charging process.
There are two types of sealed lead-acid batteries: sealed absorbent glass mat (AGM) and
gel cell. AGM lead-acid batteries have become the industry standard, as they are maintenance
free and particularly suited for grid-tied systems where batteries are typically kept at a full
state-of-charge. Gel-cell batteries, designed for freeze-resistance, are generally a poor choice
because any overcharging will permanently damage the battery.
Alkaline Batteries – Because of their relatively high cost, alkaline batteries are only
recommended where extremely cold temperatures (-50oF or less) are anticipated or for certain
commercial or industrial applications requiring their advantages over lead-acid
© Central University of Technology, Free State

40
batteries. These advantages include tolerance of freezing or high temperatures, low
maintenance requirements, and the ability to be fully discharged or overcharged without harm
(Carolyn Roos, 2005).
The number of batteries in series is dictated by the nominal voltage of the DC bus, which is
a constant. The instantaneous output power from the whole battery bank depends on variables
such as the type and the size of the battery used, and the number of battery strings in parallel
Bn .
The dynamics of the battery state of charge SOC can be expressed in discrete-time domain
by a first order difference equation as follows (K Kusakana, 2014). The battery dynamic
equation can be expressed as:
j
i
Bat
nom
Batsj iP
EtSOCSOC
1
)0()( )(
(3.4)
Where: SOC is the state of charge of the battery; Bat is the battery charging or discharging
efficiency; st is the sampling time (interval); nomE is the battery system nominal energy, and
BatP is the power flowing from the battery system.
The lifespan of the battery depends on many parameters related to the way it is operated and
to external conditions, in particular the ambient temperature. For instance, typical lead-acid
batteries designed for solar energy applications will lose between 15% to 20% of their lifespan
(the number of charge/discharge cycles they can perform) for each 5oC above the standard
temperature of 25oC. In addition, the deeper the battery is discharged at each cycle (depth of
discharge), the shorter its lifespan. This implies that to reach an optimal battery lifespan, a large
© Central University of Technology, Free State

41
enough battery needs to be installed to achieve a suitable depth of discharge (IEA-PVS T9-13:
2013).
3.5.4. Operation of battery storage system in hybrid systems
The battery storage system facilitates the storage of the energy generated by the renewable
sources during low peak periods and use the stored energy during peak demand periods. The
excess of energy generated by different sources not used by the load’ instead of being wasted,
is stored in the battery storage system. The battery storage system creates more reliability when
used in combination with renewable energy sources. Renewable energy system power
generations depend on the natural resources such as sunlight and wind, and if these resources
are not available no energy can be produced. The battery storage system facilitates the
continuity of power supply to the loads during these intermittent periods.
The utilization of batteries in the hybrid system extends the life span of the batteries as they
are not used permanently to supply the loads. The batteries operate only when the other sources
are not generating at all or are not generating sufficient energy as required by the load.
3.6. Inverters and rectifiers
3.6.1. Description of inverters and rectifiers
Most of the energy produced by different renewable energy sources requires transformation
before it can be utilized by the loads.
© Central University of Technology, Free State

42
Inverters and rectifiers are used in cases above to convert energy from one type to a different
type depending on the load requirement.
Inverters are used to transform DC current to AC current, while rectifiers convert AC current
to DC current for load use or battery charging.
3.6.2. Types of inverters
The inverters can be classified into three categories:
Stand-alone inverters and
Grid-tied inverters
Hybrid inverter
a) Stand-alone inverters
These inverters are meant to operate isolated from the electrical distribution networks and
require batteries for proper operation. The batteries provide constant voltage sources at the DC
input of the inverters.
b) Grid-tied inverters
Grid-tied inverters operate coupled to the electric distribution network and therefore must
be able to produce almost pert sinusoidal voltages and currents.
© Central University of Technology, Free State

43
b) Hybrid inverters (Grid-interactive)
A hybrid inverter is just one type of solar inverter used in a solar electricity system. Also known
as an on-grid solar with a battery storage system, this type of system combines a power inverter
with a battery. In a traditional solar power system, homeowners have to use the power as the
inverters convert it to usable electricity. Since many people work during the day away from the
home, they cannot use their solar power to the fullest extent. A hybrid inverter collects the
power and stores it in the battery so that people can take advantage of it at a later time.
3.7 Loads
The power demand of a household depends on the appliances in the relevant household and
the utilization and diversity factors. In most of rural households, the loads are:
Fluorescent and incandescent light,
Television sets,
Fridges,
Irons,
Stoves,
The power sources have to be designed to withstand the total power required by the load at
any given time and period.
3.8 Stand-alone hybrid power system
The combination of diesel generators with renewable energy and a battery storage system
presents the advantage of reliability of power generation when compared to stand-alone
© Central University of Technology, Free State

44
renewable energy sources and also presents a reduction of fuel consumption, as a stand-alone
diesel generator has to run continuously to supply a given load. The combination helps the
different sources integrated to compensate or supplement each other in case of non-generation
of any of the sources.
Renewable energy (RES) such as solar and wind provide sustainable and environmentally
friendly alternatives for power generation, however, some technical and economic challenges
have to be resolved before these sources can substitute the current power generation resources.
Firstly these renewable energies are intermittent, unpredictable, and uncontrollable. This
means they cannot be safely used to supply the load demand in reliable manner. In addition,
renewable energy generation technologies are generally more expensive than conventional
generators of comparable sizes, especially if used in conjunction of with battery storage devices
to enhance their reliability. As a result, they cannot supply energy at a competitive price. Lastly
their distribution nature and locational dependency cause difficulties with respect to their
integration into the centralized architecture of contemporary power generation and delivery
systems (Ahmed Saif, 2011).
3.10. Summary
In this chapter, the different components of the proposed hybrid system involving
PV-WT-DG and battery storage systems have been described, as well as their stand-alone
operations and their operation in hybrid systems.
© Central University of Technology, Free State

45
Chapter IV: Proposed optimization using a
continuous operation mode
4.1. Introduction
In this chapter the proposed continuous operation model is presented including a detailed
algorithm of the optimization. Here the objective function and variables of the model are to be
outlined, the detailed algorithm to be presented and simulated in Matlab and the results of the
simulation to be discussed.
4.2. Model development
4.2.1. Power flow layout and operation sequence
From figure 4.1 the following variable can be defined:
P1 is the control variable representing power flow from the PV to the load at any sampling
interval (j) (kW);
P2 is the control variable representing power flow from the WT to the load at any sampling
interval (j) (kW);
P4 is the control variable representing power flow from the DG to the load at any sampling
interval (j) (kW);
P3 is the control variable representing power flow from the battery to the load at any sampling
interval (j) (kW), and
© Central University of Technology, Free State

46
P5 is the control variable representing power flow from the PV to the Battery at any sampling
interval (j) (kW);
P6 is the control variable representing power flow from the WT to the Battery at any sampling
interval (j) (kW);
P7 is the control variable representing power flow from the DG to the Battery at any sampling
interval (j) (kW);
PL is the load demand at any sampling interval (j) (kW).
Figure 4.1: Continuous model power flow layout
The model proposed consists of the integration of different power sources. The model
includes: photovoltaic, wind turbine, diesel generator and battery storage system as shown in
figure 4.1 below. The load demand in the model is primarily met by the sum of the power from
© Central University of Technology, Free State

47
photovoltaic (P1) and wind turbine (P2) and the battery (P3) starts discharging within its
operating limits as soon as the (P1) and (P2) do not meet the demand. If the sum of the power
from the PV and WT is above the load demand, the excess power is used to recharge the battery
(P5 & P6) (a dump load can be used to dissipate this power in a case in which the RE generation
is more than the load and the required power to recharge the battery). Power from the DG (P4)
is used when the sum of P1, P2 and P3 cannot respond to the load requirements. The deficit of
power from the DG (P7) can be used to recharge the battery.
4.2.2. System modeling
The proposed optimization problem is to be simulated in a 24-hour period divided into equal
intervals “N” with sampling interval “∆t”.
The number of sampling intervals are to be limited to “N=2” for modelling purposes, then the
expression of the objective function and of the different constraints of the system can be
summarized into canonical forms required by the solver.
The variable “x” will be the only variable in the MatLab code to be developed. Therefore, the
output powers from different sources of the system have to be expressed in functions of the
variable “x”.
The following allocations on variable “x” have been made:
],[):1( 211 xxNxP (4.1)
],[)2:1( 432 xxNNxP (4.2)
© Central University of Technology, Free State

48
],[)3:12( 653 xxNNxP (4.3)
],[)4:13( 874 xxNNxP (4.4)
],[)5:14( 1095 xxNNxP (4.5)
],[)6:15( 12116 xxNNxP (4.6)
],[)7:16( 14137 xxNNxP (4.7)
4.2.3. Objective function of the system
The objective function of this mode of operation is to minimize the fuel consumption cost
of the diesel generator from the system during operation time, while in the meantime
responding to the power requirement of the load.
In the continuous operational mode, the DG is ON most of the time and its output power is
continuously controlled, depending on the demand, to minimize the fuel consumption, resulting
in operational cost. The DG is used as back-up to the system to supply the deficit of power
from other sources needed by the load.
The objective function is expressed as:
)}(){(min )(7
2
)(7
1
)(4
2
)(4 cbPaPcbPaPC jj
N
j
jjf
(4.8)
© Central University of Technology, Free State
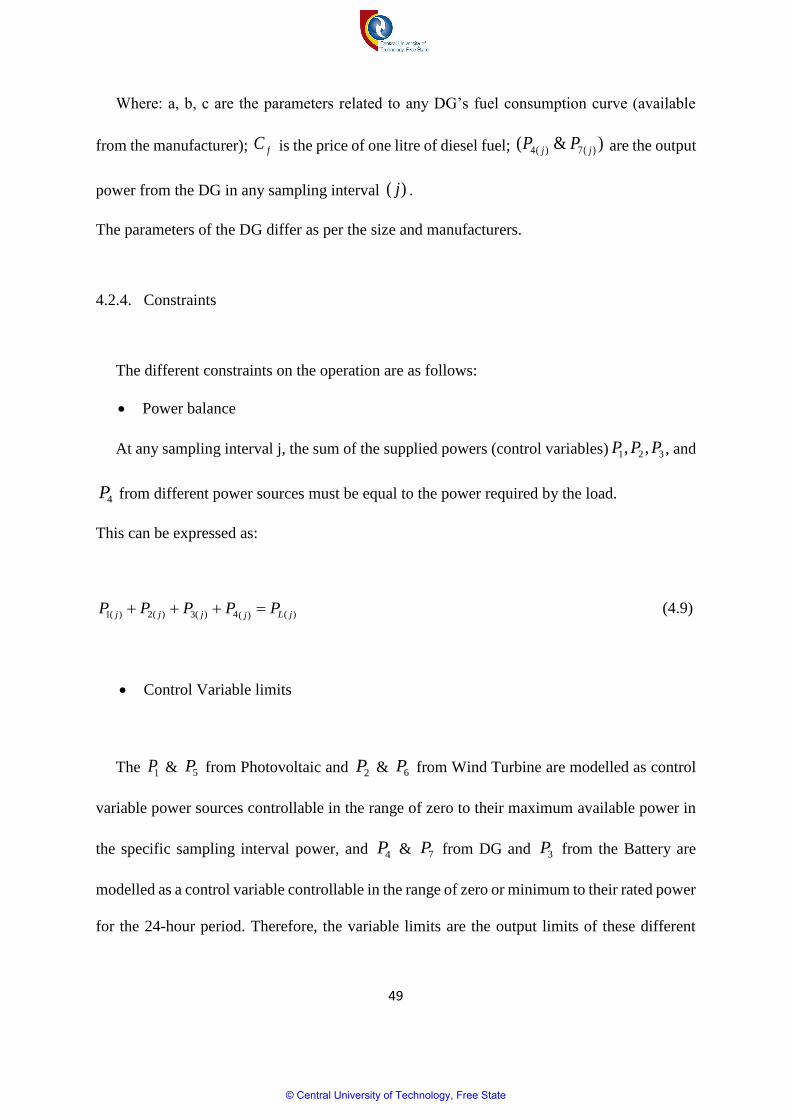
49
Where: a, b, c are the parameters related to any DG’s fuel consumption curve (available
from the manufacturer); fC is the price of one litre of diesel fuel; )&( )(7)(4 jj PP are the output
power from the DG in any sampling interval )( j .
The parameters of the DG differ as per the size and manufacturers.
4.2.4. Constraints
The different constraints on the operation are as follows:
Power balance
At any sampling interval j, the sum of the supplied powers (control variables) 321 ,, PPP , and
4P from different power sources must be equal to the power required by the load.
This can be expressed as:
)()(4)(3)(2)(1 jLjjjj PPPPP (4.9)
Control Variable limits
The 1P & 5P from Photovoltaic and 2P & 6P from Wind Turbine are modelled as control
variable power sources controllable in the range of zero to their maximum available power in
the specific sampling interval power, and 4P & 7P from DG and 3P from the Battery are
modelled as a control variable controllable in the range of zero or minimum to their rated power
for the 24-hour period. Therefore, the variable limits are the output limits of these different
© Central University of Technology, Free State

50
power sources as well as of the battery storage system at any sampling interval j . These
constraints depend on the characteristics of each power source and can be expressed as:
)1(0 max
1)(1 NjPP j (4.10)
)1(0 max
5)(2 NjPP j (4.11)
)1(0 2)(3 NjPP rated
j (4.12)
)1(0 6)(4 NjPP rated
j (4.13)
)1(0 max
5)(5 NjPP j (4.14
)1(0 max
6)(6 NjPP j (4.15)
(4.16)
Where: max
6
max
5
max
2
max
1 &,, PPPP is the maximum value of a given renewable power source at
any sampling interval (j) and
ratedrated PP 74 & and ratedP3 are the rated power of the DG and the battery system respectively.
)1(0 7)(7 NjPP rated
j
© Central University of Technology, Free State
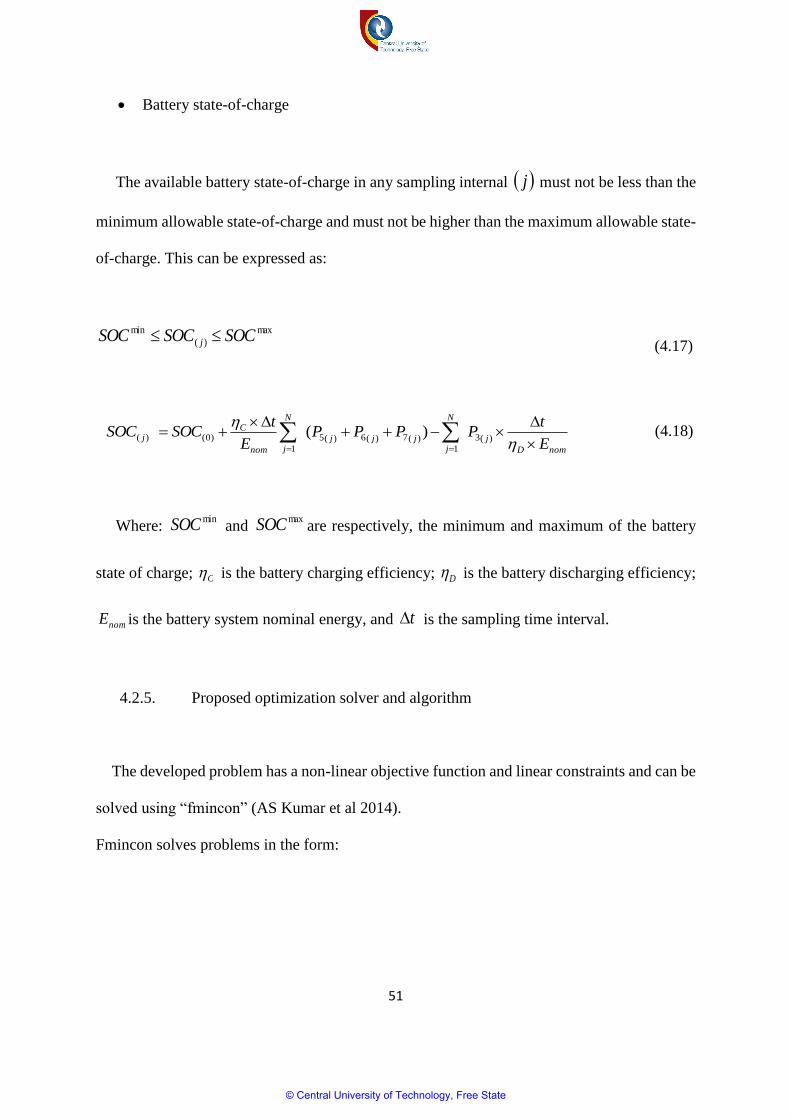
51
Battery state-of-charge
The available battery state-of-charge in any sampling internal j must not be less than the
minimum allowable state-of-charge and must not be higher than the maximum allowable state-
of-charge. This can be expressed as:
max
)(
min SOCSOCSOC j (4.17)
nomD
j
N
jjjj
N
jnom
Cj
E
tPPPP
E
tSOCSOC
)(3
1)(7)(6)(5
1
)0()( )( (4.18)
Where: minSOC and
maxSOC are respectively, the minimum and maximum of the battery
state of charge; C is the battery charging efficiency; D is the battery discharging efficiency;
nomE is the battery system nominal energy, and t is the sampling time interval.
4.2.5. Proposed optimization solver and algorithm
The developed problem has a non-linear objective function and linear constraints and can be
solved using “fmincon” (AS Kumar et al 2014).
Fmincon solves problems in the form:
© Central University of Technology, Free State

52
)(min xfx
Subject to:
bb
eqeq
eq
uxl
bxA
bxA
xc
xc
.
.
0)(
0)(
(4.19)
Where beq lbbx ,,, and bu are vectors; A and eqA are matrices; )(xc and )(xceq are
functions that return vectors; and )(xf is a function that returns a scalar, )(xf , )(xc , and
)(xceq are non-linear functions.
4.2.6. Objective function definition in fmincon syntax
The objective function is to minimize the fuel consumption costs of the DG during
operational time, and this can be expressed as follows:
)(...)()(min 2
7
2
74
2
4 cbPaPtcbPaPtcbPaPtFC DGNDGN (4.20)
)(){(min )(7
2
)(7
1
)(4
2
)(4 cbPaPcbPaPtFC jj
N
j
jj
(4.21)
)])*4:1*3(*)*4:1*3(*(
))*4:1*3(*)*4:1*3(*[(min
2
1
2
cNNxbNNxa
cNNxbNNxatN
j
(4.22)
Where: j is the sampling interval.
© Central University of Technology, Free State

53
4.2.7. Constraints definition in fmincon syntax
Power balance
The power balance at any thj sampling interval can be expressed as:
)()(4)(3)(2)(1 jLjjjj PPPPP (4.23)
As 2N , the power balance can be developed for these two sampling intervals as:
For 175311 LPxxxxj (4.24)
286422 LPxxxxj (4.25)
Taking the coefficient of the equations, the system can be rewritten in a matrix form as:
2
1
14
2
1
.
.
.
00000010101010
00000001010101
L
L
P
P
x
x
x
(4.26)
Using the canonical formulation of the linear equality constraints in fmincon, the power
balance can be finally expressed as:
)],(),,(),,(),,(),,(),,(),,([ NNzerosNNzerosNNzerosNNeyeNNeyeNNeyeNNeyeAeq (4.27)
© Central University of Technology, Free State

54
):1( NPb Leq (4.28)
Linear inequality
Linear inequality for battery bank
The available battery bank state-of-charge in any sampling internal must not be less than
the minimum allowable state-of-charge and must not be higher than the maximum allowable
state-of-charge. This can be expressed as
max
)(
min SOCSOCSOC j (4.29)
max
)(3
1)(7)(6)(5
1
)0(
min )( SOCE
tPPPP
E
tSOCSOC
nomD
j
N
jjjj
N
jnom
C
(4.30)
Where nomE is the nominal energy from the battery system, and C and D are the
efficiencies of the battery system (during charging and discharging).
This expression can be re-written as:
max
)(3
1)(7)(6)(5
1
)0(
min ( SOCePPPPdSOCSOCj
N
jjjj
N
j
(4.31)
Where:
nom
C
E
td
(4.32)
© Central University of Technology, Free State

55
nomD E
te
(4.33)
Dealing with maximum inequality )( maxSOC
For 1j
max
513119)0( )( SOCexxxxdSOC (4.34)
For 2j
max
6514131211109)0( )( SOCexexxxxxxxdSOC (4.35)
Then
)0(
max
513119 SOCSOCexdxdxdx (4.36)
)0(
max
6514131211109 ) SOCSOCexexdxdxdxdxdxdx (4.37)
Dealing with minimum inequality )( minSOC
For 1j
513119)0(
min )( exxxxdSOCSOC (4.38)
The above expression can also be written as:
© Central University of Technology, Free State

56
min
)0(513119 SOCSOCexdxdxdx (4.39)
For 2j
6514131211109)0(
min )( exexxxxxxxdSOCSOC (4.40)
The above expression can also be written as:
min
)0(6514131211109 SOCSOCexexdxdxdxdxdxdx (4.41)
Linear inequality for PV
max
)(5)(1 PVjj PPP (4.42)
For 1j
max
191 PVPxx (4.43)
For 2j
max
2102 PVPxx (4.44)
Linear inequality for WT
max
)(6)(2 WTjj PPP (4.45)
© Central University of Technology, Free State

57
For 1j
max
1113 WTPxx (4.46)
For 2j
max
2124 WTPxx (4.47)
Linear inequality for DG
rated
DGjj PPP )(7)(4 (4.48)
For 1j
rated
DGPxx 137 (4.49)
For 2j
rated
DGPxx 148 (4.50)
Taking the coefficient of the equations (4.36), (4.37), (4.39), (4.41), (4.43), (4.44), (4.47),
(4.48), (4.49) and (4.50) the system can be rewritten in a matrix form as:
© Central University of Technology, Free State

58
rated
DG
rated
DG
W T
W T
PV
PV
P
P
P
P
P
P
SOCSOC
SOCSOC
SOCSOC
SOCSOC
x
x
x
x
x
x
x
x
x
x
x
x
x
x
ddddddee
ddde
ddddddee
ddde
max
2
max
1
max
2
max
1
0
min
0
min
0
max
0
max
14
13
12
11
10
9
8
7
6
5
4
3
2
1
.
10000010000000
01000001000000
00100000001000
00010000000100
00001000000010
00000100000001
000000
0000000000
000000
0000000000
(4.51)
Using the canonical formulation of the linear inequality constraints in fmincon, this can be
finally expressed as:
)),((*)),,((*
)),,((*),,()),,((*),,(),,(1
NNonestrildNNonestrild
NNonestrildNNzerosNNonestrileNNzerosNNzerosA (4.52)
12 AA (4.53)
),(),,(),,(),,(),,(),,(),,(3 NNzerosNNzerosNNeyeNNzerosNNzerosNNzerosNNeyeA (4.54)
),(),,(),,(),,(),,(),,(),,(4 NNzerosNNeyeNNzerosNNzerosNNzerosNNeyeNNzerosA (4.55)
),(),,(),,(),,(),.,(),,(),,(5 NNeyeNNzerosNNzerosNNeyeNNzerosNNzerosNNzerosA (4.56)
© Central University of Technology, Free State

59
];;;;[ 54321 AAAAAA (4.57)
)1,(*)( 0
max
1 NonesSOCSOCb (4.58)
)1,(*)( min
02 NonesSOCSOCb (4.59)
):1(max
3 NPb PV (4.60)
):1(max
4 NPb WT (4.61)
)1:(*5 NonesPbrated
DG (4.62)
];;;;[ 54321 bbbbbb (4.63)
Variable boundaries
These boundaries represent the upper and lower limits of outputs from each power source
as well as of the battery storage system for each thj sampling time.
ubxlb (4.64)
With: lb : lower boundaries and ub : upper boundaries
© Central University of Technology, Free State

60
These can be expressed for each thj sampling interval as:
max
1)(10 PP j (4.65)
rated
j PP 2)(20 (4.66)
max
3)(3
min
3 PPP j (4.67)
rated
j PP 4)(40 (4.68)
max
5)(50 PP j (4.69)
max
6)(60 PP j (4.70)
rated
j PP 7)(70 (4.71)
Lower boundaries
The change of minimum values that each power source can produce in different time
intervals is “zero”; however, for the specific case of the battery system, this value “ratedP3 ” is
the maximum power entering the battery while charging. The system’s lower boundaries
change can be expressed in vector forms as follows:
© Central University of Technology, Free State

61
)1,(*min
11 NonesPlb (4.72)
)1,(*min
22 NonesPlb (4.73)
)1,(*max
33 NonesPlb (4.74)
)1,(*min
44 NonesPlb (4.75)
)1,(*min
55 NonesPlb (4.76)
)1,(*min
66 NonesPlb (4.77)
)1,(*min
77 NonesPlb (4.78)
];;;;;;[ 7654321 lblblblblblblblb (4.79
Upper boundaries
The change of maximum values that each renewable source can produce in different time
intervals is “max
)( jiP ”, which depends on the availability of the renewable resources. However,
for the specific case of the DG and the battery system, these values are their maximum rated
© Central University of Technology, Free State
62
values “ ,, 74
ratedrated PP ” and “ratedP3 ” respectively. The system’s lower bounds change can be
expressed in vector forms as follows:
):1(max
11 NPub (4.80)
):1(max
22 NPub (4.81)
)1:(*max
33 NonesPub (4.82)
)1:(*max
44 NonesPub (4.83)
):1(max
55 NPub (4.84)
):1(max
6 6NPub (4.85)
)1:(*max
77 NonesPub (4.86)
];;;;;;[ 7654321 ubububububububub (4.87)
© Central University of Technology, Free State

63
4.2.8. Final model of continuous operation mode
The final model of the continuous operation of the system will be a MatLab code that any
user can use by changing the technical input data. The user will be able to introduce his own
load profiles, the capacity of the diesel generator, the battery state of charge, and the profile of
photovoltaic and wind turbine. The final model developed will be able to optimize the operation
of the system by minimizing the consumption of the diesel generator, therefore minimizing the
cost.
4.3. Simulation results and discussions
4.3.1. General description
Here the continuous operation is simulated using MatLab function and the simulation results
are discussed. As indicated under the objective function, the aim of the simulation is to show
how the diesel’s generator fuel consumption can be minimized using the continuous control
strategy developed.
In this case the diesel generator is on most of the time and its output is continuously
controlled to minimize fuel consumption, while in the meantime responding to requirement of
the load. The simulation of the household is carried out during summer and winter to indicate
how climate change can influence the load demand, RE primary resources, and as result
influence the operation and cost of the hybrid systems.
© Central University of Technology, Free State

64
4.3.2. Data presentation
The solar radiation data used in this study are calculated from stochastically generated
values of hourly global and diffuse irradiation using the simplified tilted-plane mode. This is
calculated for a South African rural area close to Bloemfontein. Wind speed data measured at
10m height at the site over a period of two years is used in this work. Two typical summer and
winter load demand profiles for institutional applications based on an energy demand survey
carried out in rural communities in South Africa, are used.
The load and RE data for the selected summer and winter days are as shown in Table 6.1.
The two daily load profiles are used to analyse the benefit of the hybrid system operating under
the two control strategies compared with the DG used as stand-alone.
4.3.3. Resources and load data of the household
The Table 6.1 below indicates the detailed load profile taken from typical household for a
24-hour simulation period during summer and winter. The household has low consumption
appliances, such as TV, lights, kettle, iron, toaster, laptop, etc. The Table also indicates the
hourly profiles of solar irradiation and wind speed during summer and winter.
© Central University of Technology, Free State

65
Table 4.1: Household Resources & Load Data
Time Summer Winter
(h) Global
Solar
(kW/m2)
Wind speed
at rotor hub
(m/s)
Load (kW) Global
Solar
(kW/m2)
Wind speed
at rotor hub
(m/s)
Load
(kW)
00:00 0.000 0.821 0.3 0.000 0.871 0.3
01:00 0.000 1.665 0.2 0.000 0.381 0.2
02:00 0.000 0.998 0.1 0.000 0.947 0.1
03:00 0.000 0.956 0.0 0.000 1.425 0.0
04:00 0.000 2.549 0.3 0.000 1.575 0.3
05:00 0.000 2.558 0.0 0.000 1.463 0.0
06:00 0.000 2.775 2.4 0.000 0.932 3.0
07:00 0.002 3.754 0.6 0.000 1.560 0.7
08:00 0.141 2.948 4.3 0.145 1.337 8.0
09:00 0.417 2.828 5.6 0.244 1.761 5.6
10:00 0.687 2.870 3.2 0.306 2.611 2.6
11:00 0.940 2.522 1.6 0.512 3.542 3.0
12:00 1.062 1.766 0.3 0.611 3.956 0.5
13:00 1.061 2.576 2.0 0.614 4.698 3.4
14:00 0.978 2.017 0.4 0.568 4.898 0.7
15:00 0.846 2.282 0.8 0.428 4.089 1.3
16:00 0.679 3.116 3.9 0.460 5.544 1.4
17:00 0.464 2.626 1.8 0.266 4.404 1.5
18:00 0.208 3.427 1.7 0.000 4.547 3.8
© Central University of Technology, Free State

66
19:00 0.043 2.972 1.9 0.000 4.711 4.6
20:00 0.000 2.543 2.2 0.000 3.881 5.9
21:00 0.000 2.336 0.9 0.000 4.610 2.1
22:00 0.000 1.863 0.7 0.000 2.537 0.8
23:00 0.000 1.231 0.3 0.000 2.370 0.3
4.3.4. Components sizes & model parameters
The hybrid system is designed so that the load power demand is met at any given time. The
sizes of different components of the system have already been discussed in chapter 3. This
chapter focuses more on the simulation and discussion of the results.
This study also emphasizes mainly the optimal energy management of the given hybrid system.
The different parameters used in the simulations are given in Table 6.2.
(K Kusakana, 2015)
Table 4.2: Simulation Parameters
Item Figure
Sampling time 30min
Battery nominal capacity 5.6kWh
Battery maximum SOC 95%
Battery minimum SOC 40%
Battery charging efficiency 85%
Battery discharging efficiency 100%
© Central University of Technology, Free State

67
Diesel fuel price 1.4$/l
a 0.246
b 0.815
c 0.4333
4.3.5. Simulation and discussion results during winter
a) 24-Hour load Supplied by the hybrid system during winter
Load profile
Figure 4.1 indicates the load profile of the household during winter. From the figure it can
be seen that from 22:00 to 6:00 in the morning, the load demand is very minimum. The load
starts picking up after 6h in the morning and reaches its maximum demand between 8:00 and
9h, after 9h it starts decreasing up to 17:00 in the evening. The load is high again around 22:00.
Figure 4.2: Household 24-hr load profile during winter
0 5 10 15 20 250
1
2
3
4
5
6
7
8
PLO
AD
[kW
]
(A) Time [h]
PLOAD
© Central University of Technology, Free State
68
Power from different sources to the load
Figures 4.2 to 4.5 indicate the power flow from different power sources to the loads
During the midnight and early in the morning, the power requirement of the household is very
low, only the battery is used to respond to the load demand, and the diesel generator is off. The
renewable energy output powers are zeros as they are not able to generate at that time.
After 6:00, the load starts picking up as shown in figure 4.1 and in the meantime the
renewable energy sources start to generate and the household power requirement is met by the
combinations of output power from PV, WT and battery while the DG is still off.
From 8:00 to 9:00 in the morning, the load reaches its peak demand and the sum of the outputs
power from PV, WT and battery is able to respond to the high load demand, and the DG is still
off. The renewable energy sources generate more at energy this time and there is no need for
the DG to run.
From 9:00 to 10:00, the household load demand starts dropping, the PV power generation
increases, and the load requirement is met by the sum of the output power from PV, WT and
battery and there is no need to run the DG.
From 10:00 to 17:00, the load demand is low while the PV generates a lot of power. The
power generated is used to supply the load and the excess power is used to recharge the battery.
Between 17:00 and 20:00, the load demand starts picking up and the WT starts generating
again, but the sum of the out power from PV, WT and battery is not sufficient to respond to the
load requirement, so the diesel generator is switched on to back up the system.
Between 20:00 and 21:00, the household load demand again reaches its peak, and at this time
the renewable energy sources (PV and WT) are no longer generating any power, and the battery
itself also cannot respond to the requirement of the load, therefore the diesel generator is kept
© Central University of Technology, Free State

69
on to back up the system. The DG is continuously controlled to meet the deficit of power from
other sources required by the load.
Between 21:00 and midnight the renewable energy sources are no longer generating and the
load demand is met by the output power from the battery and the diesel generator.
From the simulation results, it can be noticed that the PV is the main component of the
system and is the one that mostly influences the running cost of the system. The PV also
contributes more in recharging the battery as during the day when the PV produces more output
power, the load demand is very minimum and the excess power produced is accumulated in
the battery.
Figure 4.3: Photovoltaic output power & power supplied to the load during winter
0 5 10 15 20 250
0.5
1
1.5
2
2.5
3
3.5
4
4.5
P1 [kW
]
(A) Time [h]
P1
max of P1
© Central University of Technology, Free State

70
Figure 4.4: Wind turbine output power & power supplied to the load during winter
Figure 4.5: Battery output power & power supplied to the load during winter
0 5 10 15 20 250
0.2
0.4
0.6
0.8
1
1.2
1.4
1.6
1.8
2
P2 [kW
]
(B) Time [h]
P2
max of P2
0 5 10 15 20 25-8
-6
-4
-2
0
2
4
P3[k
W]
(C) Time [h]
P3
max of P3
© Central University of Technology, Free State

71
Figure 4.6: Diesel generator output power & power supplied to the load during winter
Power from different sources to the battery system
Figures 4.6 to 4.8 indicate the power from PV, DG and WT used to recharge the battery
system.
From Figures 4.6 and 4.7, it can be seen that when power produced by the renewable energy
sources is more than the power required by the load, the excess is used to recharge the battery.
From Figure 4.6, it can be noticed that the PV is the source that contributes more to
recharging the battery than WT. As indicated in the figure 4.7, the WT contributes very little
to the recharging of the battery.
0 5 10 15 20 250
1
2
3
4
5
6
7
8
P4 [kW
]
(D) Time [h]
P4
max of P4
© Central University of Technology, Free State
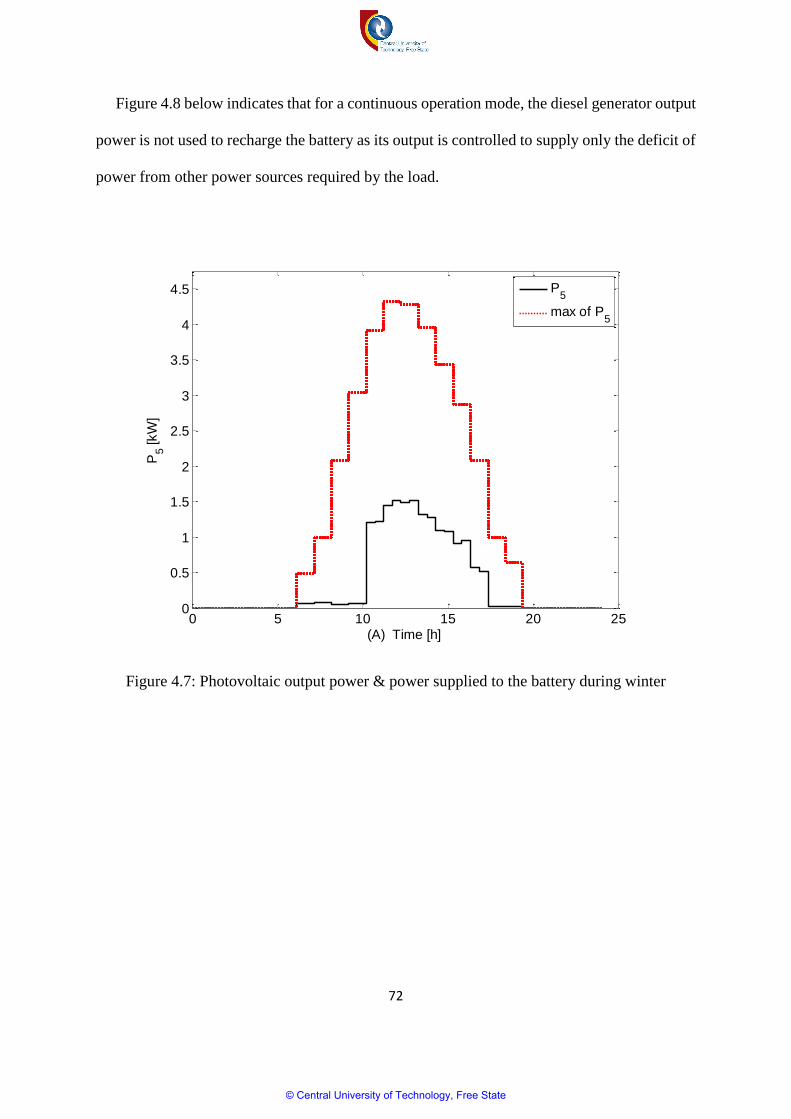
72
Figure 4.8 below indicates that for a continuous operation mode, the diesel generator output
power is not used to recharge the battery as its output is controlled to supply only the deficit of
power from other power sources required by the load.
Figure 4.7: Photovoltaic output power & power supplied to the battery during winter
0 5 10 15 20 250
0.5
1
1.5
2
2.5
3
3.5
4
4.5
P5 [kW
]
(A) Time [h]
P5
max of P5
© Central University of Technology, Free State

73
Figure 4.8: Wind turbine output power & power supplied to the battery during winter
Figure 4.9: Diesel generator output power & power supplied to the battery during winter
0 5 10 15 20 250
0.2
0.4
0.6
0.8
1
1.2
1.4
1.6
1.8
2
P6 [kW
]
(B) Time [h]
P6
max of P6
0 5 10 15 20 250
1
2
3
4
5
6
7
8
P7 [k
W]
(C) Time [h]
P7
max of P7
© Central University of Technology, Free State

74
Battery SOC dynamic
Figure 4.9 below shows that the battery state-of-charge operates within acceptable
boundaries with the minimum being 40% and the maximum being 95%.
Figure 4.10: Battery SOC dynamic
The simulation results show that during the winter the diesel generator runs for 7 hours and
the highest output power that it supplies to the load does not exceed 30% of its rated capacity,
therefore its fuel consumption is minimized.
0 5 10 15 20 250.2
0.3
0.4
0.5
0.6
0.7
0.8
0.9
SO
C [%
]
(D) Time [h]
SOC
max of SOC
© Central University of Technology, Free State

75
b) 24 Hourly load supplied by a stand-alone diesel generator only (Winter)
Figure 4.11: Standalone diesel generator output power supplied to load during winter
The Figure 4.10 above illustrates the output power supplied by the DG when used as a stand-
alone to supply the full load of the household during a 24-hour period. It can be seen that the
DG works almost 24 hours and during peak times, it has to generate the highest power load
required. This illustration of running the DG alone to supply the full load required by a
household will help in determining the cost required for such a household and this can be
compared with a case which the DG is used in combination with renewable sources.
c) Daily operational cost summary of the continuous operation mode
The table below reflects a comparison of costs of running a household with a stand-alone
diesel generator and running the same household with a hybrid power system in which the
0 5 10 15 20 250
1
2
3
4
5
6
7
8
PD
G to
LO
AD
[kW
]
(D) Time [h]
PDG
to
LOAD
max of PDG
to
LOAD
© Central University of Technology, Free State

76
diesel generator is used as back-up to the system and controlled using a continuous operation
strategy. The actual daily fuel expense can be determined by multiplying the diesel price ($/L)
by the amount of fuel used (L/day). The table below demonstrates that the fuel consumption is
directly proportional to the power supplied by the diesel generator and the running time of this
generator. The table indicates that more fuel can be saved by introducing a hybrid system
instead of running a stand-alone diesel generator to supply the load.
Table 4.1 below also indicates that more fuel is consumed during winter than summer; this
is due to the household’s summer power requirement being less than that required during
winter.
Table 4.3: Continuous mode fuel savings
Winter Summer
Consumption (L) Cost ($) Consumption (L) Cost ($)
DG only 28.26L 22.6$ 19.23L 15.39$
Hybrid system 3.55L 2.84$ 0.36L 0.29$
Savings 24.71L 19.78$ 18.87L 15$
Savings % 87.5% 87.5% 98% 98%
4.4. Summary
In this chapter, the mathematical models of continuous operation mode have been developed
and presented. The developed model has been simulated using fmicon syntax in Matlab. The
simulated results have been presented and discussed. The simulation results have indicated how
the cost can be minimized by controlling the use of the diesel generator in the hybrid systems
using continuous operation mode.
© Central University of Technology, Free State

77
Chapter V: Proposed optimization using ON/OFF
operation mode
5.1. Introduction
In this chapter the proposed ON/OFF operation model is presented including a detailed
algorithm of the optimization. Here the objective function and variables of the model will be
outlined, the detailed algorithm will be presented and simulated in Matlab, and the results of
the simulation will be discussed.
5.2. Model development
5.2.1. Power flow layout
From figure 5.1 the following variables can be explained:
P1 is the control variable representing power flow from the PV to the load at any sampling
interval (j) (kW);
P2 is the control variable representing power flow from the WT to the load at any sampling
interval (j) (kW);
P3 is the control variable representing power flow from the battery to the load at any sampling
interval (j) (kW);
P4 is the control variable representing power flow from the PV to the Bat at any sampling
interval (j) (kW);
© Central University of Technology, Free State

78
P5 is the control variable representing power flow from the WT to the Bat at any sampling
interval (j) (kW);
S is the control variable representing the switch that controls the state of the diesel generator;
S can take two values either “0” or “1”;
PDGmax is the rated power from the DG to the load or battery that depends on the state of the
switch;
PL is the load demand at any sampling interval (j) (kW).
Figure 5.1: System model power flow
The model proposed consists of the integration of different power sources. The model
includes: photovoltaic, wind turbine, diesel generator and battery storage systems as shown in
figure 5.1. The load demand in the model is primarily met by the sum of the power from
© Central University of Technology, Free State

79
photovoltaic (P1) and wind turbine (P2) and the battery (P3) starts discharging within its
operating limits as soon as the (P1) and (P2) do not meet the demand. If the sum of the power
from the PV and WT is above the load demand, the excess of power is used to recharge the
battery (P4 & P5) (a dump load can be used to dissipate this power in the case where the RE
generation exceeds the load and the required power to recharge the battery). When the sum of
the power from PV, WT and battery (P1, P2 & P3) cannot respond to the requirement of the
load, the generator is switched on and, when sum of P1, P2 and P3 is above the PL, the generator
is switched off. When the DG is on, it runs at its rated power and the excess power is used to
recharge the battery. The power of the DG can only take two values, either zero or rated power.
The switch “S” dictates the state of the DG that can be either on or off.
5.2.2. System modeling
The proposed optimization problem will be simulated in a 24-hour period divided into equal
intervals “N” with sampling interval “∆t”.
The number of sampling interval will be limited to “N=2” for modelling purposes, then the
expression of the objective function and of the different constraints of the system can be
summarized into canonical forms required by the solver.
The variable “x” will be the only variable in the MatLab code to be developed. Therefore,
the output power from different sources of the system have to be expressed in functions of the
variable “x”.
© Central University of Technology, Free State
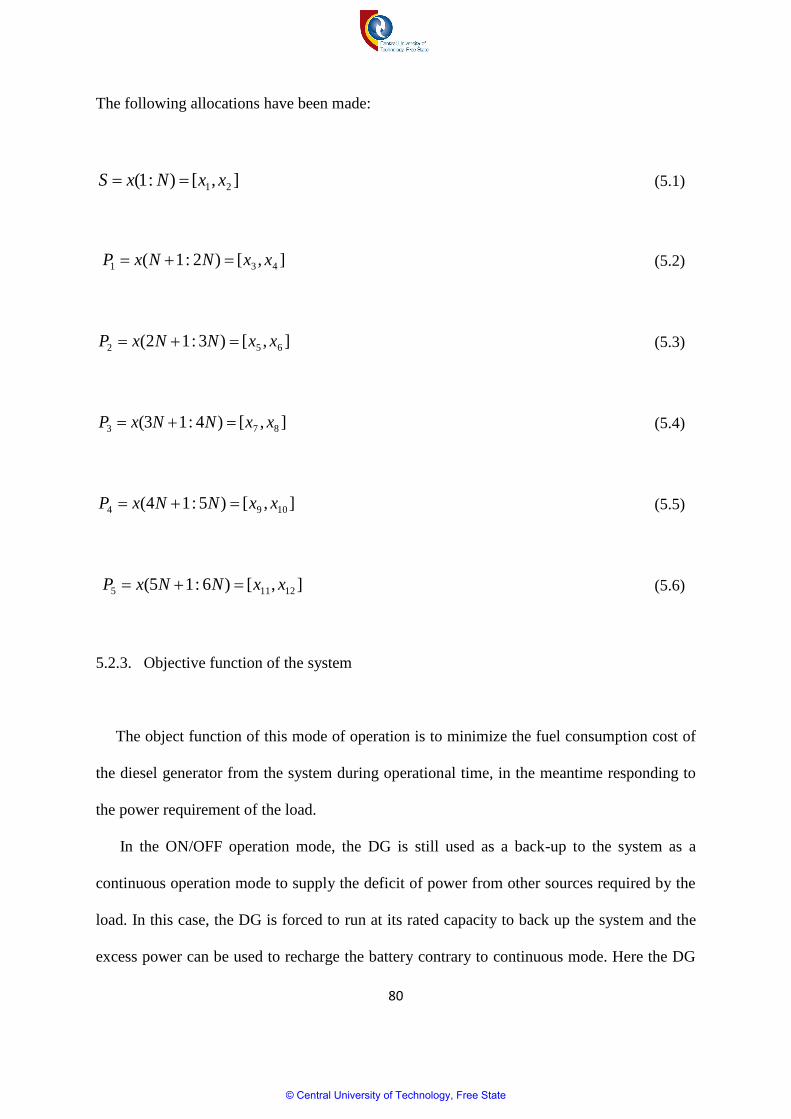
80
The following allocations have been made:
],[):1( 21 xxNxS (5.1)
],[)2:1( 431 xxNNxP (5.2)
],[)3:12( 652 xxNNxP (5.3)
],[)4:13( 873 xxNNxP (5.4)
],[)5:14( 1094 xxNNxP (5.5)
],[)6:15( 12115 xxNNxP (5.6)
5.2.3. Objective function of the system
The object function of this mode of operation is to minimize the fuel consumption cost of
the diesel generator from the system during operational time, in the meantime responding to
the power requirement of the load.
In the ON/OFF operation mode, the DG is still used as a back-up to the system as a
continuous operation mode to supply the deficit of power from other sources required by the
load. In this case, the DG is forced to run at its rated capacity to back up the system and the
excess power can be used to recharge the battery contrary to continuous mode. Here the DG
© Central University of Technology, Free State

81
can be either on or off. The main aim here is to establish the right time to switch DG either on
or off, without compromising the load requirement so that fuel consumption can be minimized.
The objective function is expressed as:
)(
1
maxmax2 )(min j
N
j
DGDGf ScbPaPC
(5.7)
Where: a, b, c are the parameters related to any DG’s fuel consumption curve (available
from the manufacturer); Cf is the price of one litre of diesel fuel; maxDGP is the rated power
from the DG, and )( jS is a discrete-switching function that takes the value of either 0 or 1.
0)( jS means that the DG is switched off during the thj sampling interval, while 1)( jS
means that the DG is switched on. The output power of the DG is therefore constant.
5.2.4. Constraints
The different constraints on the operation are as follows:
Power balance
At any sampling interval “j”, the sum of the supplied power (control variables) 1P , 2P , 3P and
)(max jDG SP from different power sources must be equal to the power required by the load.
This can be expressed as:
)()(3)(2)(1)(max jLjjjjDG PPPPSP (5.8)
Control Variable limits
© Central University of Technology, Free State

82
The )(4)(1 & jj PP from Photovoltaic and )(5)(2 & jj PP from Wind Turbine are modelled as
control variable power sources controllable in the range of zero to their maximum power, and
)( jS is a discrete-switching function that takes the value of either 0 or 1 and )(3 jP from the
battery is modelled as control variable controllable in the range of zero or minimum to its rated
power for the 24-hour period. Therefore, the variable limits are the output limits of these
different power sources as well as of the battery storage system at any sampling interval )( j .
These constraints depend on the characteristics of each power source and can be expressed as:
)1(0 max
1)(1 NjPP j (5.9)
)1(0 2)(2 NjPP rated
j (5.10)
)1(0 3)(3 NjPP rated
j (5.11)
)1(0 max
4)(4 NjPP j (5.12)
)1(0 max
5)(5 NjPP j (5.13)
Where: max
5
max
4
max
2
max
1 &,, PPPP is the maximum value of a given renewable power source at
any sampling interval )( j and
ratedP3 is the rated power of the battery system.
© Central University of Technology, Free State

83
Battery state of charge
The available battery state-of-charge in any sampling internal )( j must not be less than the
minimum allowable state-of-charge and must not be higher than the maximum allowable state-
of-charge. This can be expressed as:
max
)(
min SOCSOCSOC j (5.14)
nomD
j
N
j
jDGjj
N
jnom
Cj
E
tPSPPP
E
tSOCSOC
)(3
1
)(max)(5)(4
1
)0()( )( (5.15)
Where: minSOC and
maxSOC are respectively, the minimum and maximum of the battery state
of charge.
5.2.5. Proposed optimization solver and algorithm
The objective function has to be modelled as a function of the switch controlling the DG
and the variable battery output power. This mixed-integer optimization problem can be solved
using the “Intlinprog” function from MatLab Optimization toolbox.
© Central University of Technology, Free State

84
)(min xf T
x Subject to:
ubxl
bxA
bxA
ix
b
eqeq .
.
)ntcon(
(5.16)
Where f , x , ntconi ,b , eqb , bl and bu are vectors; A and eqA are matrices.
5.2.6. Objective function definition in Intlinprog syntax
The objective function is to minimize the fuel consumption cost of the DG during
operational time, and this can be expressed as follows:
N
j
jDGDG ScbPaPtFC1
)(max
2
max ){(min (5.17)
]):1(*)**[(min1
max
2
max
N
j
DGDG NxcPbPat (5.18)
]):1(*[min1
N
j
Nxkt (5.19)
Where cPbPak DGDG maxmax2 ** (5.20)
Where: j is the sampling interval.
© Central University of Technology, Free State

85
5.2.7. Constraints definition in Intlinprog syntax
Power balance
The power balance at any thj sampling interval can be expressed as:
)()(3)(2)(1)(max jLjjjjDG PPPPSP (5.21)
As 2N , the power balance can be developed for these two sampling intervals as:
For:
17531max1 LDG PxxxxPj (5.22)
28642max2 LDG PxxxxPj (5.23)
Taking the coefficient of the equations, the system can be rewritten in a matrix form as:
2
1
12
2
1
max
max
.
.
.
00001010100
00000101010
L
L
DG
DG
P
P
x
x
x
P
P (5.24)
Using the canonical formulation of the linear equality constraints in Intlinprog, the power
balance can be finally expressed as:
© Central University of Technology, Free State

86
)],(),,(),,(),,(),,(),,(*[ max NNzerosNNzerosNNeyeNNeyeNNeyeNNeyePAeq DG (5.25)
):1( NPb Leq (5.26)
Linear inequality
Linear inequality for battery bank
The available battery bank state-of-charge in any sampling internal must not be less than
the minimum allowable state-of-charge and must not be higher than the maximum allowable
state-of-charge. This can be expressed as
max
)(
min SOCSOCSOC j (5.27)
max
)(3
1)(5)(4)(max
1
)0(
min )( SOCE
tPPPSP
E
tSOCSOC
nomD
j
N
jjjjDG
N
jnom
C
(5.28)
Where nomE is the nominal energy from the battery system, and DC & the efficiencies
of the battery system (during charging and discharging).
This expression can be rewritten as:
max
)(3
1)(5)(4)(max
1
)0(
min )( SOCePPPSPdSOCSOCj
N
jjjjDG
N
j
(5.29)
© Central University of Technology, Free State

87
Where:
nom
C
E
td
(5.30)
nomD E
te
(5.31)
Dealing with maximum inequality )( maxSOC
For 1j
max
71191max)0( )( SOCexxxxPdSOC DG (5.32)
For 2j
max
8712111092max1max)0( )( SOCexexxxxxxPxPdSOC DGDG (5.33)
Then
)0(
max
71191max SOCSOCexdxdxxdPDG (5.34)
)0(
max
8712111092max1max SOCSOCexexdxdxdxdxdxPdxP DGDG (5.35)
Dealing with minimum inequality )( minSOC
For 1j
© Central University of Technology, Free State

88
71191max)0(
min )( exxxxPdSOCSOC DG (5.36)
The above expression can also be written as:
min
)0(71191max SOCSOCexdxdxxdPDG (5.37)
For 2j
8712111092max1max)0(
min )( exexxxxxxPxPdSOCSOC DGDG (5.38)
The above expression can also be written as:
min
)0(8712111092max1max SOCSOCexexdxdxdxdxdxPdxP DGDG (5.39)
Linear inequality for PV
max
)(4)(1 PVjj PPP (5.40)
For 1j
max
193 PVPxx (5.41)
© Central University of Technology, Free State

89
For 2j
max
2104 PVPxx (5.42)
Linear inequality for WT
max
)(11)(5 WTjj PPP (5.43)
For 1j
max
1126 WTPxx (5.44)
For 2j
max
2124 WTPxx (5.45)
Taking the coefficient of the equations, the system can be rewritten in a matrix form as:
max
2
max
1
max
2
max
1
min
0
min
0
0
max
0
max
12
11
10
9
8
7
6
5
4
3
2
1
maxmax
max
maxmax
max
100000100000
010000010000
001000001000
000100000100
0000
00000000
0000
00000000
W T
W T
PV
PV
DGDG
DG
DGDG
DG
P
P
P
P
SOCSOC
SOCSOC
SOCSOC
SOCSOC
x
x
x
x
x
x
x
x
x
x
x
x
ddddeedPdP
ddedP
ddddeedPdP
ddedP
(5.46)
© Central University of Technology, Free State

90
Using the canonical formulation of the linear inequality constraints in Intlingprog, this can be
finally expressed as:
)),((*)),,((*
)),,((*),,(),,()),,((** max
1NNonestrildNNonestrild
NNonestrileNNzerosNNzerosNNonestrilPdA
DG (5.47)
12 AA (5.48)
),(),,(),,(),,(),,(),,(3 NNzerosNNeyeNNzerosNNzerosNNeyeNNzerosA (5.49)
),(),,(),,(),,(),,(),,(4 NNeyeNNzerosNNzerosNNeyeNNzerosNNzerosA (5.50)
];;;[ 4321 AAAAA (5.51)
)1,(*)( 0
max
1 NonesSOCSOCb (5.52)
)1,(*)( min
02 NonesSOCSOCb (5.53)
):1(max
3 NPb PV (5.54)
):1(max
4 NPb WT (5.55)
];;;[ 4321 bbbbb (5.56)
© Central University of Technology, Free State

91
Variable boundaries
These boundaries represent the upper and lower limits of outputs from each power source
as well as of the battery storage system for each thj sampling time.
ubxlb (5.57)
These can be expressed for each thj sampling interval as:
max
1)(10 PP j (5.58)
rated
j PP 2)(20 (5.59)
max
3)(3
min
3 PPP j (5.60)
rated
jPP 4)(40 (5.61)
max
5)(50 PP j (5.62)
Lower boundaries
The change of minimum values that each power source can produce different time intervals
is “zero”; however, for the specific case of the battery system, this value “ratedP3 ” is the
© Central University of Technology, Free State

92
maximum power entering the battery while charging. The system’s lower boundaries change
can be expressed in vector forms as follows:
)1,(*min
11 NonesPlb (5.63)
)1,(*min
22 NonesPlb (5.64)
)1,(*max
33 NonesPlb (5.65)
)1,(*min
44 NonesPlb (5.66)
)1,(*min
55 NonesPlb (5.67)
];;;;[ 54321 lblblblblblb (5.68)
Upper boundaries
The change of maximum values that each renewable source can produce different time
intervals is “max
)( jiP ”, which depends on the availability of the renewable resources. However,
for the specific case of the battery system, this value is its maximum rated value “ratedP3 ”. The
system’s upper boundaries change can be expressed in vector forms as follows:
© Central University of Technology, Free State

93
):1(max
11 NPub (5.69)
):1(max
22 NPub (5.70)
)1:(*max
33 NonesPub (5.71)
):1(max
44 NPub (5.72)
):1(max
55 NPub (5.73)
];;;;[ 54321 ubububububub (5.74)
5.2.8. Final model of ON/OFF operation mode
The final model of the ON/OFF operation of the system will be a MatLab code that any user
can use by changing the technical input data. The user will be able to introduce his own load
profiles, the capacity of the diesel generator, the battery state-of-charge, the profile of the
photovoltaic and wind turbine. The final model developed will be able to optimize the operation
of the system by minimizing the consumption of the diesel generator, therefore minimizing the
cost.
© Central University of Technology, Free State

94
5.3. Simulation results and discussions
5.3.1. General description
At this point, the ON/OFF operation mode is simulated using MatLab function and the
simulation results are discussed. As indicated under the objective function, the aim of the
simulation is to show how the diesel generator’s fuel consumption can be minimized using the
ON/OFF control strategy developed.
5.3.2. Simulation and discussion results during winter
a) 24 Hour Load Supplied by the Hybrid System during winter
Load profile
Figure 5.2 indicates the load profile of the household during winter. From the figure it can
be seen that from 22:00 to 6:00 in the morning, the load demand is minimum. The load starts
picking up after 6:00 in the morning and reaches its maximum demand between 8:00 and 9:00,
after 9:00 it starts decreasing up to 17:00 in the evening. The load is high again around 22h at
night.
© Central University of Technology, Free State

95
Figure 5.2: Household 24-hr load profile during winter
Power from different sources to the load
Figures 5.3 to 5.5 indicate the power flow from different power sources to the loads
At midnight and early in the morning, the power requirement of the household is very low,
so only the battery is used to respond to the load demand, and the diesel generator is off. The
renewable energy output power figures are zeros as they are not able to generate at that time.
After 6:00, the load starts picking up as shown in figure 4.1, and in the meantime the
renewable energy sources start to generate and the household power requirement is met by the
combinations of output power from PV, WT and battery while the DG still off.
From 8:00 to 9:00 in the morning, the load reaches its peak demand and the sum of the outputs
power from PV, WT and battery is able to respond to the high load demand, while the DG is
0 5 10 15 20 250
1
2
3
4
5
6
7
8
PLO
AD
[kW
]
(A) Time [h]
PLOAD
© Central University of Technology, Free State

96
still off. The renewable energy sources generate more energy at this time and there is no need
for the DG to run.
From 9:00 to 10:00, the household load demand starts dropping, the PV power generation
increases, and the load requirement is met by the sum of the output power from PV, WT and
battery and there is no need to run the DG.
From 10:00 to 18:00, the load demand is low while the PV generates a lot of power. The
power generated is used to supply the load and the excess power is used to recharge the battery.
Between 18:00 and 20:00, the load demand starts picking up as it is likely that the WT starts
generating again. The sum of the output power from PV, WT and battery is sufficient to respond
to the load demand.
Between 20:00 and 21:00, the household load demand again reaches again its peak, and at
this time the renewable energy sources (PV and WT) are no longer generating any power, and
as the battery itself also cannot respond to the requirement of the high load demand, the
generator is switched on to back up the system. The DG is run at its rated power to supply the
load and the excess power from DG is used to recharge the battery.
Between 21:00 and midnight the load demand is low again, the renewable energy sources
are no longer generating power and the load demand is met by the output power from the
battery only and the diesel generator is switched off.
From the simulation results, it can be noticed that the PV is the main component of the
system and is the one that most influences the running costs of the system. The PV also
contributes more to recharging the battery as during the day when the PV produces more output
power, the load demand is at a minimum and the excess power produced is accumulated in the
battery.
© Central University of Technology, Free State

97
Figure 5.3: PV output power & power supplied to the load during winter
Figure 5.4: Wind turbine output power & power supplied to the load during winter
0 5 10 15 20 250
0.5
1
1.5
2
2.5
3
3.5
4
4.5
P1 [kW
]
(A) Time [h]
P1
max of P1
0 5 10 15 20 250
0.2
0.4
0.6
0.8
1
1.2
1.4
1.6
1.8
2
P2 [kW
]
(B) Time [h]
P2
max of P2
© Central University of Technology, Free State

98
Figure 5.5: Battery output power & power supplied to the load during winter
DG ON/OFF state
The Figure 5.6 below indicates the ON/OFF state of the DG during a 24hr period. From the
figure, it can be noticed that, the generator is off most of the time and it runs only for one hour
(between 20:00 and 21:00), when the PV and WT cannot generate any longer and the battery
is low. However, when the generator runs, it is forced to run at its rated capacity to respond to
the high requirement of the load.
0 5 10 15 20 25-8
-6
-4
-2
0
2
4
P3 [kW
]
(C) Time [h]
P3
max of P3
© Central University of Technology, Free State

99
Figure 5.6: ON/OFF state of DG during winter
Power from different sources to the battery system
Figures 5.7 and 5.8 indicate the power from the PV and WT used to recharge the battery system.
From Figures 5.7 and 5.8, it can be seen that when power produced by the renewable energy
sources is more than the power required by the load, the excess is used to recharge the battery.
From Figure 5.7, it can be noticed that the PV contributes more recharging the battery than the
WT. As indicated in the figure 5.8, the WT contribute very little to the recharging of the battery.
0 5 10 15 20 250
0.2
0.4
0.6
0.8
1o
n/o
ff s
tate
(C) Time [h]
© Central University of Technology, Free State

100
Figure 5.7: PV output power & power supplied to the battery during winter
Figure 5.8: WT output power & power supplied to the battery during winter
0 5 10 15 20 250
0.5
1
1.5
2
2.5
3
3.5
4
4.5
P4 [kW
]
(A) Time [h]
P4
max of P4
0 5 10 15 20 250
0.2
0.4
0.6
0.8
1
1.2
1.4
1.6
1.8
2
P5 [kW
]
(B) Time [h]
P5
max of P5
© Central University of Technology, Free State

101
Battery SOC dynamic
The Figure 5.9 below shows that the battery state-of-charge operates within the acceptable
boundaries, with the minimum being 40% and the maximum being 95%. It can also be noticed
that, between 20:00 and 21:00, the SOC is very high, which indicates that the excess power
from the DG is used to recharge the battery. At this time, the battery is not generating but is
accumulating excess power from the DG.
Figure 5.9: Battery SOC dynamic
0 5 10 15 20 250.2
0.3
0.4
0.5
0.6
0.7
0.8
0.9
SO
C [%
]
(D) Time [h]
SOC
max of SOC
© Central University of Technology, Free State

102
b) Daily operation cost summary of ON/OFF operation mode
The table below indicates the comparative cost between running a household with a stand-
alone diesel generator and running the same household with hybrid power system where in the
diesel generator is used as back-up to the system and controlled using ON/OFF operational
strategy. The actual daily fuel expense can be determined by multiplying the diesel price ($/L)
by the litres of fuel used (L/day). The table below demonstrates that the fuel consumption is
directly proportional to the power supplied by the generator and the running time of the diesel
generator. The table indicates that more fuel can be saved by introducing hybrid in the system
instead of running a stand-alone diesel generator to supply the load.
Table 5.1 below also indicates that more fuel is consumed during winter than in summer, which
is due to the household’s summer power requirement being less than that required during
winter.
Table 5.1: ON/OFF mode daily fuel cost savings
Winter Summer
Consumption (L) Cost ($) Consumption (L) Cost ($)
DG only 28.26L 22.6$ 19.23L 15.39$
Hybrid system 5.01L 4$ 2.5L 2$
Savings 23.25L 18.6$ 16.73L 13.35$
Savings % 82.2% 82.2% 87% 87%
© Central University of Technology, Free State
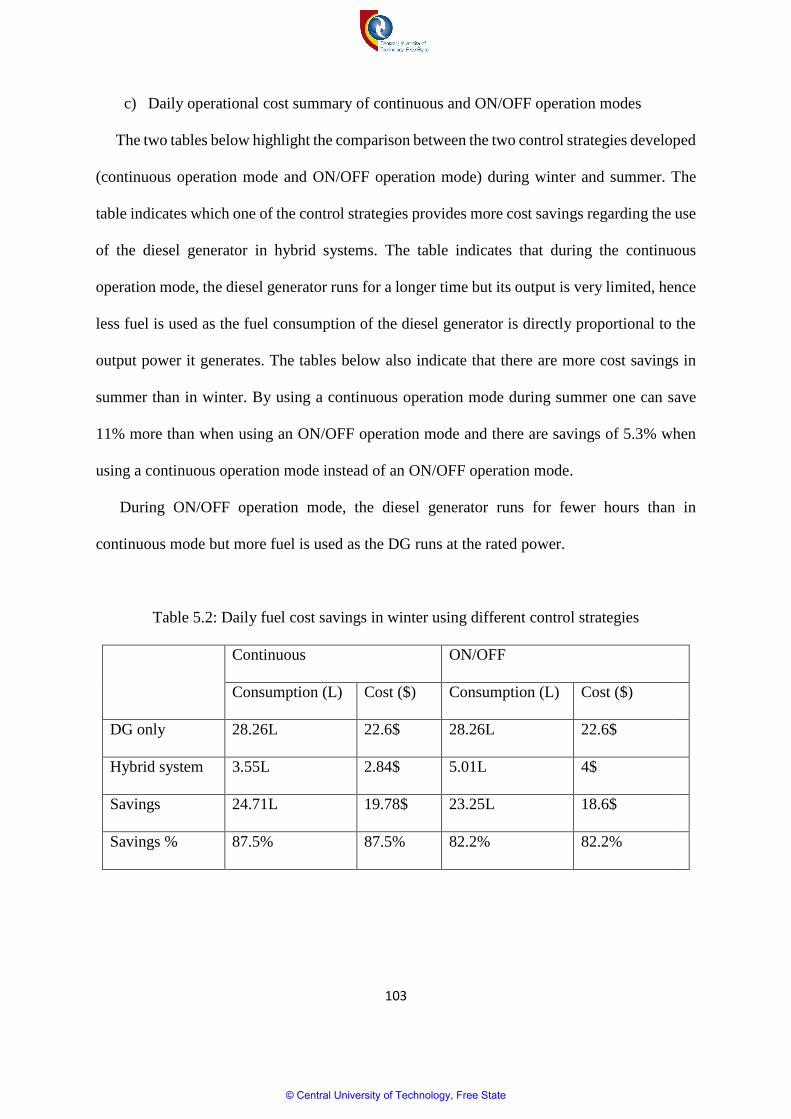
103
c) Daily operational cost summary of continuous and ON/OFF operation modes
The two tables below highlight the comparison between the two control strategies developed
(continuous operation mode and ON/OFF operation mode) during winter and summer. The
table indicates which one of the control strategies provides more cost savings regarding the use
of the diesel generator in hybrid systems. The table indicates that during the continuous
operation mode, the diesel generator runs for a longer time but its output is very limited, hence
less fuel is used as the fuel consumption of the diesel generator is directly proportional to the
output power it generates. The tables below also indicate that there are more cost savings in
summer than in winter. By using a continuous operation mode during summer one can save
11% more than when using an ON/OFF operation mode and there are savings of 5.3% when
using a continuous operation mode instead of an ON/OFF operation mode.
During ON/OFF operation mode, the diesel generator runs for fewer hours than in
continuous mode but more fuel is used as the DG runs at the rated power.
Table 5.2: Daily fuel cost savings in winter using different control strategies
Continuous ON/OFF
Consumption (L) Cost ($) Consumption (L) Cost ($)
DG only 28.26L 22.6$ 28.26L 22.6$
Hybrid system 3.55L 2.84$ 5.01L 4$
Savings 24.71L 19.78$ 23.25L 18.6$
Savings % 87.5% 87.5% 82.2% 82.2%
© Central University of Technology, Free State

104
Table 5.3: Daily fuel cost savings in summer using different control strategies
Continuous ON/OFF
Consumption (L) Cost ($) Consumption (L) Cost ($)
DG only 19.23L 15.4$ 19.23L 15.4$
Hybrid system 0.36L 0.29$ 2.5L 2$
Savings 18.87L 15.1$ 16.73L 13.4$
Savings % 98% 98% 87% 87%
5.4. Summary
In this chapter, the mathematical models of ON/OFF operation mode have been developed
and presented. The developed model has been simulated using Intlinprog syntax in Matlab. The
simulated results have been presented and discussed. The results indicate how costs can be
minimized by controlling the use of the diesel generator in hybrid systems using an ON/OFF
operation mode to respond to the requirement of the load.
© Central University of Technology, Free State

105
Chapter VI: Conclusion and recommendations
6.1 Conclusion
This chapter concludes the research done on the optimal control of hybrid power systems
using a photovoltaic system, wind turbine system, diesel generator system and battery storage
system.
There are high operational costs involved when running a diesel generator to supply a
specific load due to the high quantity of fuel required and operation issues due to long running
time.
To overcome the operational costs, the renewable energy can be introduced to a standalone
diesel generator to form a hybrid power generation system. However the complications caused
by the use of the diesel generator in the system, require careful control to ensure that there is a
benefit in combining the diesel generator with other systems of power generations. The above
issue of optimal operational control was the basis of this research aimed by developing control
strategies that can be utilized to control the use of diesel generators in hybrid systems to achieve
optimal operation of such systems by minimizing the fuel consumption of the diesel generator
hence minimizing the operational costs of the systems.
To achieve the aim of this study, the different components involved in the system developed
were described in chapter III to provide a background regarding their stand-alone use and their
operations when combined with various other sources of energy to form hybrid power
generation systems. Also in the same chapter, the data collected for the simulation of the system
were presented.
© Central University of Technology, Free State
106
In chapter IV, the continuous operation mode, which is one of the control strategies of the
procedure, was developed. The layout and mathematical approaches of the system were
developed. The objective function of the system was clearly presented and also all the
constraints and variables. The aim of this control strategy is to control the use of the diesel
generator in the hybrid system to minimize its fuel consumption and minimize the costs of the
operation for the system to be affordable for rural applications. A detailed algorithm of the
model was presented and simulated using a Fmincon Matlab solver. The results of the
simulations were presented and analysed as well. In chapter V, the second proposed control
strategy an ON/OFF operation mode was developed from mathematical to detailed algorithms
with its objective function, constraints and different variables. The aim of these control
strategies is similar to that of the continuous mode, in that optimal schedules for running the
diesel generator without compromising the requirements of the loads that would minimize the
fuel consumption and minimize the operational cost of the system were developed.
The results of the two control strategies were compared to the case in which a stand-alone
diesel generator is used to supply the same load, and in addition the two control strategies were
also compared to see which one of the two strategies produces highest cost savings.
The comparative tables showed that, by introducing hybrid system to a standalone diesel
generator, a household could save up to 98% on the operational cost. The table also indicated
that there is more cost saving when the system is controlled by using a continuous strategy
rather than ON/OFF strategies. The simulation results obtained indicate that more fuel is used
during winter than summer, due to the load requirement being higher in winter.
Only winter case results have been included in chapters IV and V. Results concerning
summer in respect of both strategies have been included in appendixes and also in the tables
indicating the power flows of the different power sources and different control strategies.
© Central University of Technology, Free State
107
6.2 Recommendations
This research was focused on developing control strategies that can be used to implement
the control of diesel generators in hybrid systems by focusing on the optimal control aspect of
the system and not detailed designs of the physical components and all other aspects. To
ensure proper implementation of the system, optimal design of the system needs to be
considered for the full system to be optimal from the design to the operation.
The model developed in this dissertation includes only photovoltaic and wind turbine as
renewable sources. Further studies should be conducted to include different additional sources
to those in this research to achieve more cost savings and to minimize the use of the diesel
generator almost to zero.
The aspect of running the diesel generator at loads of less than 50% of its rated capacity
should be investigated for continuous control strategies, as running the diesel generator
ineffectively can cause problems and reduce its lifespan.
For further research, the impacts of long running times as well as the impact of several starts
and stops of the diesel generator should be investigated to find out which of the two control
strategies will achieve the lowest lifecycle costs of hybrid systems.
© Central University of Technology, Free State

108
References
Ahmed, Saif., 2011, “Multi-Objective Optimization of Hybrid Solar-Wind-Battery Power
Generation System”. Msc Thesis, Masdar Institute of Science and Technology.
Amir, J. Majid., 2011, “A Labview Model for the Operation and Control Strategy of a hybrid
system”. International Journal of Engineering (IJE), 5 (1): 15-22.
Ani Vincent Anayochukwu., 2014, “Optimal Energy Management System for
PV/Wind/Diesel-Battery Power Systems for Rural Health Clinic”. Global Journal of
Researches in Engineering: General Engineering. 14 (1): 27-34.
Aparna Pachouri. & Payal Suhane., 2014, “Modeling and Simulation of
Photovoltaic/Wind/Diesel/Battery”. International journal of Electrical, Electronics and
Computer Engineering 3(1):122-125.
Ashari, M. & Nayar, C.V., 1999, “An optimum dispatch strategy using set points for a
photovoltaic (PV)-diesel-battery hybrid power system”. Solar Energy, 66(1): 1-9.
Beker, B., 2007, “Irradiation and PV array energy output, cost, and optimal positioning
estimation for South Africa”. Journal of Energy in Southern Africa • 18 (2) :16-25
Barley, CD. & Winn, SB., 1996, “Optimal dispatch strategy in remote hybrid power systems”.
Solar Energy, 58: 165-179.
Battisti, R. & Corrado, A., 2005, “Evaluation of technical improvements of photovoltaic
system through life cycle assessment methodology”. Energy, 30: 952-967.
Behave, AG., 1999, “Hybrid solar-wind domestic power generating system – a case study”.
Renewable Energy, 17: 355-358.
Belfkira, R., Zhang, L. & Barakat, G., 2011, “Optimal sizing study of hybrid wind/PV/diesel
power generation unit”. Solar Energy, 85:100-110.
© Central University of Technology, Free State

109
Collares-Pereira, M. & Rabl, A., 1979, “Derivation of method for predicting long term average
energy delivery of non-concentrating and concentrating solar collectors”. Solar Energy, 22 (2):
155-170.
Mejia, D., 2011, “Optimization of a stand-alone hybrid wind/solar generation system for
lifespan extension”. A thesis submitted to the University of Colorado Denver in partial
fulfillment of the requirements for the degree of Masters of Science Electrical Engineering
Electrical Engineering.
Datta, M., Senjyu, T., Yona, A., Funabashi, T. & Kim, C.H., 2014, “A coordinated control
method for leveling PV output power fluctuations of PV-diesel hybrid systems connected to
isolated power utility Energy Conversion”. IEEE Transactions, 24 (1) 153-162.
Dufo-Lopez, R. & Bernal-Agustin, J., L. 2009. “Multi-objective design and control of hybrid
systems minimizing costs and unmet load”. Electric Power Systems Research, 79:170-180.
Dufo-Lopez, R., Bernal-Agustin J. L. & Rivas-Ascaso, D.M., 2006, “Design of isolated hybrid
systems minimizing costs and pollutant emissions”. Renewable Energy 31: 2227-2244.
Dufo-Lopez, R. & Bernal-Agustin, J.L., 2008, “Multi-objective design of PV– wind– diesel–
hydrogen– battery systems”. Renewable Energy 33: 2559-2572.
Dufo-Lopez, R. & Bernal-Agustin, J. L., 2008, “Influence of mathematical models in design
of PV-Diesel systems”. Energy Conversion and Management, 49: 820-831.
Dufo-Lopez, R. & Bernal-Agustin, J.L., 2005, “Design and control strategies of PV-Diesel
systems using genetic algorithms”. Solar Energy, 79: 33-46.
Dursun, E. & Kilic, O., 2012, “Comparative evaluation of different power management
strategies of a standalone PV/Wind/PEMFC hybrid power system”. Electrical Power and
Energy Systems, 34: 81-89.
© Central University of Technology, Free State

110
Elizondo, J., Martinez, J. & Probst, O., 2009, “Experimental study of a small wind turbine for
low- and medium-wind regimes”. International Journal of Energy Research, 33:309-26.
Engelbrecht, A.P., 2007, “Computational Intelligence”: An Introduction (Second ed.).
Chichester, England: John Wiley & Sons, Ltd. 1-597
Engin, M., 2013, “Sizing and simulation of PV-wind hybrid power system”. International
Journal of Photoenergy. 2013: 1-10 pages.
Erdinc, O. & Uzunoglu, M., 2012, “Optimum design of hybrid renewable energy systems:
Overview of different approaches”. Renewable and Sustainable Energy Reviews, 16:1412-
1425.
Hocaoglu, F.O., 2012, “A Review of Wind-PV Sizing Algorithms and a Case Study”. Journal
of Engineering Science and Technology, 5(4):2429
Fancisco Jose Contrras Cordero., 2015, “Optimization of Hybrid Renewable Energy Systems”.
Thesis for master of applied science, University of science, 1-49.
Fernandez, I.J., Carvillo, C.F., Sanchez-Miralles, A. & Boal J., 2013, “Capacity fade and aging
models for electric batteries and optimal charging strategy for electric vehicles”. Energy,
60:35-43.
Fraenkel, P., 2000, “Marine currents - a promising large clean energy resource”. IMechE
Seminar Publication Power Generation by Renewables, 221-233. Bury St Edmunds, UK.
Frost, A., 2014, “Considering Wake Effects in a Mixed Integer Linear Programming Model for
Optimizing Wind Farm Layout”. Master's Thesis in Sustainable Energy Systems. Department
of Applied Mechanics, Chalmers University of Technology.
Fulzele, J.B. & Dutt, S., 2012, “Optimum Planning of Hybrid Renewable Energy System Using
HOMER”. International Journal of Electrical and Computer Engineering (IJECE), 2(1):68-74.
© Central University of Technology, Free State
111
Ghedamsi, K. & Aouzellag, D., 2010, “Improvement of the performances for wind energy
conversions systems”. International Journal of Electrical Power & Energy Systems, 32:936-45.
Ghosh, G.C., Emonts, B. & Stolen, D., 2003, “Comparison of hydrogen storage with diesel
generator system in a PV-WEC hybrid system”. Solar Energy, 75:187-98.
Giannakoudis, G., Papadopoulos, A. I., Seferlis, P. & Voutetakis, S., 2010, “Optimum design
and operation under uncertainty of power systems using renewable energy sources and
hydrogen storage”. International journal of hydrogen energy, 35:872-891.
Goedeckeb, M., Therdthianwong, S. & Gheewala, S.H., 2007, “Life cycle cost analysis of
alternative vehicles and fuels in Thailand”. Energy Policy, 35(6):3236-46.
Gregoire Lena., 2013, “Rural Electrification with PV Hybrid Systems”. international energy
agency photovoltaic power systems programme club of african national agencies and structures
in charge of rural electrification (club-er), 1-52.
Güney, M.S. & Kaygusuz, K., 2010, “Hydrokinetic energy conversion systems: A technology
status review”. Renewable and Sustainable Energy Reviews, 14(9):2996-3004.
Gupta, A., Saini, R.P. & Sharma, M.P., 2008a, “Computerized Modelling of Hybrid Energy
System-Part II: Combined Dispatch Strategies and Solution Algorithm”. In 5th International
Conference on Electrical and Computer Engineering (ICECE), 13-18. Dhaka, Bangladesh.
Gupta, A., Saini, R.P. & Sharma, M.P., 2008b, “Computerized Modelling of Hybrid Energy
System - Part I: Problem Formulation and Model Development”. In 5th International
Conference on Electrical and Computer Engineering (ICECE), 1:7-12
Hai Lan., Shuli Wen., Ying-Yi Hong., David C. Yu. & Lijun Zhang., 2015, “Optimal sizing of
hybrid PV/diesel/battery in ship power system”. Applied Energy 158: 26–34.
© Central University of Technology, Free State

112
Hassanzadehfard, H., Moghaddas-Tafresh, S.M. & Hakimi, S.M., 2011, “Optimal Sizing of an
Islanded Micro-grid for an area in north-west Iran Using Particle Swarm Optimization Based
on Reliability Concept”. World Renewable Energy Congress, 2969-2976.
Hepbasli, A., 2008, “A key review on exergetic analysis and assessment of renewable energy
resources for a sustainable future”. Renewable and Sustainable Energy Reviews, 12(3):593-
661.
Hong, Y.Y. & Lian, R.C., 2012, “Optimal sizing of hybrid wind/PV/diesel generation in a
stand-alone power system using Markov-based genetic algorithm”. Power Delivery. IEEE
Transactions, 27 (2): 640-647.
Hu, K. & Wang, B., 2012, “Comparison of several types of methods for solving constrained
function optimization problems”. IEEE Symposium on Robotics and Applications (ISRA).
821-824.
Hu, Y. & Solana, P., 2013, “Optimization of a hybrid diesel-wind generation plant with
operational options”. Renewable Energy, 51:364-372.
Ibrahim, H., Lefebvre, J., Methot, J. F. & Deschenes, J. S. 2011. “Numerical Modeling Wind-
Diesel Hybrid System: Overview of the Requirements, Models and Software Tools”. In IEEE
Electrical Power and Energy Conference. 33-35.
Ibtihal Islam Ahmed Abdel-Motteleb Zahran., 2012., “Investigating the Effect of Adding a PV
System to the Reliability of a Large Power System”. Msc Thesis, Arab Academy for science.
Jalilzadeh, S., Kord, H. & Rohani, A., 2010, “Optimization and Techno-Economic Analysis of
Autonomous Photovoltaic/Fuel Cell Energy System”. ECTI Transactions on Electrical
Engineering, Electronics, and Communications, 8(1):118-125.
© Central University of Technology, Free State

113
Jansen, B., Roos, C. & Terlaky T., 1993, “Interior point methodology for linear programming:
duality, sensitivity analysis and computational aspects, Optimisation in Planning and Operation
of Electric Power Systems”. Physica-Verlag, Heidelberg, 57-123
Jennings, S., 1996, “Development and Application of a Computerized Design Tool for Remote
Area Power Supply Systems”. PhD Thesis at Murdoch University, Department of Electrical
Engineering.
Kusakana, K., 2014, “Optimal operation control of hybrid renewable energy systems”, D.Tech
thesis, Electrical Engineering, Central University of Technology.
Kaabeche, A. & Ibtiouen, R., 2014, “Techno-economic optimization of hybrid
photovoltaic/wind/diesel/battery generation in a stand-alone power system”. Solar Energy,
103: 171-182.
Kamaruzzaman Sopian1., Azami Zaharim., Yusoff Ali. & Zulkifli Mohd Nopiah., 2008,
“Optimal Operational Strategy for Hybrid Renewable Energy System Using Genetic
Algorithms”. Solar Energy Research Institute, 7(4): 130-140.
Kaviani, A.K., Riahy, G.H. & Kouhsari, S.H.M., 2009, “Optimal design of a reliable hydrogen-
based stand-alone wind/PV generation system”. In Proceeding of 11th international conference
on optimization of electrical and electronic equipment. Renewable energy, 34(11): 2380-2390.
Kaviani, A.K., Riahy G.H. & Kouhsari, S.H.M., 2009, “Optimal design of a reliable hydrogen-
based stand-alone wind/PV generating system, considering component outages”. Renewable
Energy, 34:2380–2390.
Khaburi, D.A. & Nazempour, A., 2012, “Design and simulation of a PWM rectifier connected
to a PM generator of micro turbine unit”. Scientia Iranica D, 19(3):820-828.
© Central University of Technology, Free State

114
Kirthiga, M.V. & Daniel, S.A., 2010, “Optimal Sizing of Hybrid Generators for Autonomous
Operation of a Micro-grid”. In the IEEE 26th Convention of Electrical and Electronics
Engineers, 864-868.
Krieger, E.M., Cannarella, J. & Arnold, C.B., 2013, “A comparison of lead-acid and lithium-
based battery behavior and capacity fade in off-grid renewable charging applications”. Energy,
60:492-500.
Kumar, A.S. & Munda, J.L., 2014, “Optimization of voltage and frequency regulation in an
isolated wind-driven six-phase self-excited induction generator”. Journal of the Energy
Institute, 87: 235-245.
Kusakana, K. & Vermaak, H.J., 2011, “Hybrid Photovoltaic-Wind system as power solution
for network operators in the D.R.Congo”. IEEE International Conference on Clean Electrical
Power (ICCEP), 703-708, Ischia, Italy.
Kusakana, K. & Vermaak, H.J., 2013, “A survey of Particle Swarm Optimization Applications
for Sizing Hybrid Renewable Power Systems”. Advanced Science Letters, 19(8):2463-2467.
Kusakana, K. & Vermaak, H.J., 2013a. “Hybrid diesel generator-battery systems for off-grid
rural applications”. IEEE International Conference on Industrial Technology (ICIT 2013), 839-
844, Cape Town, South Africa.
Kusakana, K. & Vermaak, H.J., 2013b, “Hybrid renewable power systems for mobile
telephony base station in developing countries”. Renewable Energy, 51:419-425.
Kusakana, K. & Vermaak, H.J., 2013c, “Hydrokinetic power generation for rural electricity
supply: Case of South Africa”. Renewable Energy, 55:467-473.
Kusakana, K., Vermaak., H.J. & Numbi, B.P., 2012, “Optimal sizing of a hybrid renewable
energy plant using linear programming”. In IEEE PES Conference and Exposition
(PowerAfrica). 1-5. Johannesburg, South Africa.
© Central University of Technology, Free State

115
Kusakana. K., 2014, “Techno-economic analysis of off-grid hydrokinetic-based hybrid energy
systems for onshore/remote area in South Africa”. Energy 68: 947-957.
Shawon, M.J., Lamont, L.A. & Chaar, L.EL., 2014, “Modeling and Power Management of a
Remote Stand Alone PV-Wind Hybrid System”. International Journal of Recent Development
in Engineering and Technology, 2(4): 111-123
Mahmoud, M. & Ibrik, I.H., 2006, “Techno-economic feasibility of energy supply of remote
villages in Palestine by PV-systems, diesel generators and electric grid”. Renewable and
Sustainable Energy Reviews, 10: 128-138.
Muselli, M., Notton, G. & Louche., A.1999, “Design of hybrid-photovoltaic power generator,
with optimization of energy management”. Solar Energy, 65(3):143-157.
Nafeh, A. 2009 “Fuzzy Logic Operation Control for PV-Diesel-Battery Hybrid Energy
System”. The Open Renewable Energy Journal, 70-78.
Abdel Satar, O.H., Saad.M.A.EID., Saad, E.M. & Darwish, R.R., 2012, “Adaptive and Reliable
Control Algorithm for Hybrid System Architecture”. IJCSI International Journal of Computer
Science Issues, Vol. 9, Issue 1, No 2, January 2012. ISSN (Online): 1694-0814.
Post, H.N. & Thomas, M.G. 1988 ‘Photovoltaic systems for current and future applications’.
Solar Energy, 41(5): 465-473.
Razykov, T.M., Ferekides C.S., Morel D., “Stefanakos E., Ullal H.S. & Upadhyaya H.M.,
2011, ‘Solar photovoltaic electricity: Current status and future prospects”. Solar Energy,
85:1580-1608.
Ronald Clark., Willem Cronje. & Michael Antonie Van Wyk., 2014, “Design Optimization of
a Hybrid Energy System Through Fast Convex Programming”. 2014 Fifth International
Conference on Intelligent Systems, Modelling and Simulation, 423-428.
© Central University of Technology, Free State

116
Abdelkader, S., 2015. “Techno-Economic Design of a Stand-Alone Renewable Energy
System”. International Conference of Renewable Energies and Power Quality,1(13): 680-685.
Singh, S.N., Vandana Neha Tigga. & Snehlata Mishra., 2010, “Rural home energy
management by soft computing fuzzy control models for a photovoltaic system in India”. 2 (3):
262-268.
Sechilariu, M., Wang B. C. & Locment F., 2014,” Supervision control for optimal energy cost
management in DC microgrid: Design and simulation”. Electrical Power and Energy Systems,
58: 140-149.
Shaahid, S.M. & Elhadidy, M.A., 2008, “Economic analysis of hybrid photovoltaic-diesel-
battery power systems for residential loads in hot regions - A step to clean future”. Renewable
and Sustainable Energy Reviews, 12: 488-503.
Shafiqur Rehman. & Al-Hadhrami Luai, M., 2010, “Study of a solar PV-diesel-battery hybrid
power system for a remotely located population near Rafha, Saudi Arabia”. Energy 35:4986-
4995.
Sichilalu, S.M. & Xia X., 2015, “Optimal energy control of grid tied PV-diesel-battery hybrid
system powering heat pump water heater”. Solar Energy, 115: 243-254.
Siew Fang Woon., Volker Rehbock. & Ahmad Agus Setiawan., 2008, “Modeling A PV-Diesel-
Battery Power System: An Optimal Control Approach”. Proceedings of the World Congress
on Engineering and Computer Science. 1-6.
Tazvinga, H., Xia, X. & Zhang, J., 2013, “Minimum cost solution of photovoltaic-diesel-
battery hybrid power systems for remote consumers”. Solar Energy, 96: 292-299.
Tazvinga, H., Xia X. & Zhu, B., 2014, “Optimal energy management strategy for distributed
energy resources”. Energy Procedia, 61: 1331-1334.
© Central University of Technology, Free State

117
Tazvinga, H., Zhu, B. & Xia, X., 2014, “Energy dispatch strategy for a photovoltaic-wind-
diesel-battery hybrid power system”. Solar Energy, 108: 412-420.
R, Ruby., Rehbock, V. & Lawrence, W. B., 2003, “Optimal control of hybrid power systems”.
Dynamics of Continuous, Discrete and Impulsive Systems Series B: Applications &
Algorithm. 10: 429-439.
Wu, Z. & Xia, X., 2015, “Optimal switching renewable energy system for demand side
management”. Solar Energy, 114: 278-288.
Xia, X. & Zhang, J., 2011, “Modelling and control of heavy-haul trains”. IEEE Control
Systems Magazine, 31 (4): 18-31.
Xia, X., Zhang, J. & Cass, W., 2012, “Energy management of commercial buildings – a case
study from a POET perspective of energy efficiency”. Journal of Energy in Southern Africa,
23 (1): 23-31.
Yang, HX., Zhou, W., Lu, L. & Fang, ZH., 2008, “Optimal sizing method for stand-alone
hybrid solar–wind system with LPSP technology by using genetic algorithm”. Solar Energy,
82(4): 54-67
Zhou, W., 2007, “Simulation and Optimal Design of Hybrid Solar-Wind and Solar-Diesel
Power Generation Systems”. PhD. Department of Building Services Engineering, Hong Kong
Polytechnic University
Zou, W., Lou, C., Li Z., Lu, L. & Yang, HX., 2009, “Current status of research on optimum
sizing of stand-alone hybrid solar–wind power generation systems”. Applied Energy, 87:380-
389.
© Central University of Technology, Free State

118
Appendixes
Appendix A: Selected optimal operation control program using
fmicon
a) Main Code
deltaT=30;
hours=24;
N=hours*60/deltaT;
soc_max=0.95;
Soc_min=0.40;
soc0=0.95;
Eff_c=0.85;
Eff_d=0.95;
En=1000;
d=(deltaT*Eff_c)/En;
e=deltaT/(En*Eff_d);
PPV_max=[0*ones(1,N/24),0*ones(1,N/24),0*ones(1,N/24),0*ones(1,N/24),0*ones(1,N/24),
0*ones(1,N/24),0.48*ones(1,N/24),1*ones(1,N/24),2.08*ones(1,N/24),3.04*ones(1,N/24),3.9
2*ones(1,N/24),4.32*ones(1,N/24),4.28*ones(1,N/24),3.96*ones(1,N/24),3.44*ones(1,N/24),
2.88*ones(1,N/24),2.08*ones(1,N/24),1*ones(1,N/24),0.64*ones(1,N/24),0*ones(1,N/24),0*
ones(1,N/24),0*ones(1,N/24),0*ones(1,N/24),0*ones(1,N/24)]';
© Central University of Technology, Free State

119
PWT_max=8*[0*ones(1,N/24), 0*ones(1,N/24), 0*ones(1,N/24), 0*ones(1,N/24),
0*ones(1,N/24), 0*ones(1,N/24), 0.03*ones(1,N/24), 0.24*ones(1,N/24), 0.06*ones(1,N/24),
0.04*ones(1,N/24), 0.05*ones(1,N/24), 0*ones(1,N/24), 0*ones(1,N/24), 0*ones(1,N/24),
0*ones(1,N/24), 0*ones(1,N/24), 0*ones(1,N/24), 0*ones(1,N/24), 0.17*ones(1,N/24),
0.07*ones(1,N/24), 0*ones(1,N/24), 0*ones(1,N/24), 0*ones(1,N/24), 0*ones(1,N/24)]';
PL=[0.3*ones(1,N/24), 0.2*ones(1,N/24), 0.1*ones(1,N/24), 0.0*ones(1,N/24),
0.3*ones(1,N/24), 0.0*ones(1,N/24), 3*ones(1,N/24), 0.7*ones(1,N/24), 8*ones(1,N/24),
5.6*ones(1,N/24), 2.6*ones(1,N/24), 3*ones(1,N/24), 0.5*ones(1,N/24), 3.4*ones(1,N/24),
0.7*ones(1,N/24), 1.3*ones(1,N/24), 1.4*ones(1,N/24), 1.5*ones(1,N/24), 3.8*ones(1,N/24),
4.6*ones(1,N/24), 5.9*ones(1,N/24), 2.1*ones(1,N/24), 0.8*ones(1,N/24), 0.3 *ones(1,N/24)];
PDG_max=8;
P1_max=[0*ones(1,N/24),0*ones(1,N/24),0*ones(1,N/24),0*ones(1,N/24),0*ones(1,N/24),0
*ones(1,N/24),0.48*ones(1,N/24),1*ones(1,N/24),2.08*ones(1,N/24),3.04*ones(1,N/24),3.92
*ones(1,N/24),4.32*ones(1,N/24),4.28*ones(1,N/24),3.96*ones(1,N/24),3.44*ones(1,N/24),2
.88*ones(1,N/24),2.08*ones(1,N/24),1*ones(1,N/24),0.64*ones(1,N/24),0*ones(1,N/24),0*o
nes(1,N/24),0*ones(1,N/24),0*ones(1,N/24),0*ones(1,N/24)]';
P2_max=8*[0*ones(1,N/24), 0*ones(1,N/24), 0*ones(1,N/24), 0*ones(1,N/24),
0*ones(1,N/24), 0*ones(1,N/24), 0.03*ones(1,N/24), 0.24*ones(1,N/24), 0.06*ones(1,N/24),
0.04*ones(1,N/24), 0.05*ones(1,N/24), 0*ones(1,N/24), 0*ones(1,N/24), 0*ones(1,N/24),
0*ones(1,N/24), 0*ones(1,N/24), 0*ones(1,N/24), 0*ones(1,N/24), 0.17*ones(1,N/24),
0.07*ones(1,N/24), 0*ones(1,N/24), 0*ones(1,N/24), 0*ones(1,N/24), 0*ones(1,N/24)]';
© Central University of Technology, Free State

120
P3_max=5.6; P4_max=8;
P5_max=[0*ones(1,N/24),0*ones(1,N/24),0*ones(1,N/24),0*ones(1,N/24),0*ones(1,N/24),0
*ones(1,N/24),0.48*ones(1,N/24),1*ones(1,N/24),2.08*ones(1,N/24),3.04*ones(1,N/24),3.92
*ones(1,N/24),4.32*ones(1,N/24),4.28*ones(1,N/24),3.96*ones(1,N/24),3.44*ones(1,N/24),2
.88*ones(1,N/24),2.08*ones(1,N/24),1*ones(1,N/24),0.64*ones(1,N/24),0*ones(1,N/24),0*o
nes(1,N/24),0*ones(1,N/24),0*ones(1,N/24),0*ones(1,N/24)]';
P6_max=8*[0*ones(1,N/24), 0*ones(1,N/24), 0*ones(1,N/24), 0*ones(1,N/24),
0*ones(1,N/24), 0*ones(1,N/24), 0.03*ones(1,N/24), 0.24*ones(1,N/24), 0.06*ones(1,N/24),
0.04*ones(1,N/24), 0.05*ones(1,N/24), 0*ones(1,N/24), 0*ones(1,N/24), 0*ones(1,N/24),
0*ones(1,N/24), 0*ones(1,N/24), 0*ones(1,N/24), 0*ones(1,N/24), 0.17*ones(1,N/24),
0.07*ones(1,N/24), 0*ones(1,N/24), 0*ones(1,N/24), 0*ones(1,N/24), 0*ones(1,N/24)]';
P7_max=8;
P1_min=0; P2_min=0; P3_min=-P3_max; P4_min=0;P5_min=0;P6_min=0;P7_min=0;
A1=[zeros(N,N),zeros(N,N),-
e*tril(ones(N,N)),zeros(N,N),d*tril(ones(N,N)),d*tril(ones(N,N)),d*tril(ones(N,N))];
A2=-A1;
A3= [eye(N,N),zeros(N,N),zeros(N,N),zeros(N,N),eye(N,N),zeros(N,N),zeros(N,N)];
A4= [zeros(N,N),eye(N,N),zeros(N,N),zeros(N,N),zeros(N,N),eye(N,N),zeros(N,N)];
A5= [zeros(N,N),zeros(N,N),zeros(N,N),eye(N,N),zeros(N,N),zeros(N,N),eye(N,N)];
A=[A1;A2;A3;A4;A5];
b=[(soc_max-soc0)*ones(N,1);(soc0-
Soc_min)*ones(N,1);PPV_max(1:N);PWT_max(1:N);PDG_max*ones(N,1)];
© Central University of Technology, Free State

121
Aeq =[eye(N,N),eye(N,N),eye(N,N),eye(N,N),zeros(N,N),zeros(N,N),zeros(N,N)];
beq=PL(1:N);
lb=[P1_min*ones(N,1);P2_min*ones(N,1);P3_min*ones(N,1);P4_min*ones(N,1);P5_min*o
nes(N,1);P6_min*ones(N,1);P7_min*ones(N,1)];
ub=[P1_max(1:N);P2_max(1:N);P3_max*ones(N,1);P4_max*ones(N,1);P5_max(1:N);P6_m
ax(1:N);P7_max*ones(N,1)];
x0=ub;
options=optimset('Algorithm','interior-point');
optnew=optimset(options,'MaxFunEvals',90000,'Tolx',1e-8);
[x,fuel] = fmincon(@obj_moriceWinterX,x0,A,b,Aeq,beq,lb,ub,[],optnew);
%exctract different variable vectors
P_1=x(1:N);
P_2=x(N+1:2*N);
P_3=x(2*N+1:3*N);
P_4=x(3*N+1:4*N);
P_5=x(4*N+1:5*N);
P_6=x(5*N+1:6*N);
P_7=x(6*N+1:7*N);
for i=1:N
soc(i)=soc0+d*(P_5(i)+P_6(i)+P_7(i))-e*(P_3(i));
© Central University of Technology, Free State

122
soc0=soc(i);
end
soc1=soc(1:N);
figure (1)
stairs(linspace(0,hours,N),PL(1:N),'k','linewidth',1.5)
ylabel('P_L_O_A_D [kW]')
axis([0 hours+1 0 1.05*max(PL)]);
xlabel('(A) Time [h]')
legend('P_L_O_A_D')
figure (2)
stairs(linspace(0,hours,N),P_1(1:N),'k','linewidth',1.5)
hold on
stairs(linspace(0,hours,N),PPV_max*ones(1,N),':r','linewidth',1.5)
ylabel('P_1 [kW]')
xlabel('(A) Time [h]')
legend('P_1,'max of P_1')
axis([0 hours+1 0 1.1*max(P1_max)]);
figure (3)
stairs(linspace(0,hours,N),P_2(1:N),'k','linewidth',1.5)
hold on
stairs(linspace(0,hours,N),PWT_max*ones(1,N),':r','linewidth',1.5)
© Central University of Technology, Free State

123
ylabel('P_2 [kW]')
xlabel('(B) Time [h]')
legend('P_2','max of P_2')
axis([0 hours+1 0 1.1*max(P2_max)]);
figure (4)
stairs(linspace(0,hours,N),P_3(1:N),'k','linewidth',1.5)
hold on
stairs(linspace(0,hours,N),P3_max*ones(1,N),':r','linewidth',1.5)
ylabel('P_3 [kW]')
xlabel('(C) Time [h]')
legend('P_3','max of P_3')
axis([0 hours+1 -8 1.05*max(P3_max)]);
figure (5)
stairs(linspace(0,hours,N),P_4(1:N),'k','linewidth',1.5)
hold on
stairs(linspace(0,hours,N),P4_max*ones(1,N),':r','linewidth',1.5)
ylabel('P_4 [kW]')
xlabel('(D) Time [h]')
legend('P_4','max of P_4')
axis([0 hours+1 0 1.05*max(P4_max)]);
figure (6)
stairs(linspace(0,hours,N),P_5(1:N),'k','linewidth',1.5)
© Central University of Technology, Free State

124
hold on
stairs(linspace(0,hours,N),PPV_max*ones(1,N),':r','linewidth',1.5)
ylabel('P_5 [kW]')
xlabel('(A) Time [h]')
legend('P_5','max of P_P_5')
axis([0 hours+1 0 1.1*max(P5_max)]);
figure (7)
stairs(linspace(0,hours,N),P_6(1:N),'k','linewidth',1.5)
hold on
stairs(linspace(0,hours,N),PWT_max*ones(1,N),':r','linewidth',1.5)
ylabel('P_6 [kW]')
xlabel('(B) Time [h]')
legend('P_6','max of P_6')
axis([0 hours+1 0 1.1*max(P6_max)]);
figure (8)
stairs(linspace(0,hours,N),P_7(1:N),'k','linewidth',1.5)
hold on
stairs(linspace(0,hours,N),P7_max*ones(1,N),':r','linewidth',1.5)
ylabel('P_7 [kW]')
xlabel('(C) Time [h]')
legend('P_7','max of P_7')
axis([0 hours+1 0 1.05*max(P7_max)]);
© Central University of Technology, Free State

125
figure (9)
stairs(linspace(0,hours,N),soc1(1:N),'k','linewidth',1.5)
hold on
stairs(linspace(0,hours,N),soc_max*ones(1,N),':r','linewidth',1.5)
hold on
stairs(linspace(0,hours,N),Soc_min*ones(1,N),':k','linewidth',1.5)
ylabel('SOC [%]')
axis([0 hours+1 0.19 1.05*max(soc_max)]);
xlabel('(D) Time [h]')
legend('SOC','max of SOC')
b) Objective function
function f=obj_moriceWinterX(x)
deltaT=30; %sampling time in minute
hours=24;
N=hours*60/deltaT;
fc=14;
a=0.008415;
b=0.246;
f=
sum((a*(x(3*N+1:4*N).^2)+b*x(3*N+1:4*N))+(a*(x(6*N+1:7*N).^2)+b*x(6*N+1:7*N)));
end
© Central University of Technology, Free State

126
Appendix B: Continuous mode simulation results (summer)
Figure B1: Load profile during summer
Figure B2: PV output power and power supplied to the load during summer
0 5 10 15 20 250
1
2
3
4
5P
LO
AD
[kW
]
(A) Time [h]
PLOAD
0 5 10 15 20 250
0.5
1
1.5
2
2.5
3
3.5
4
4.5
P1 [kW
]
(A) Time [h]
P1
max of P1
© Central University of Technology, Free State

127
Figure B3: WT output power and power supplied to the load during summer
Figure B4: Battery output power and power supplied to the load during summer
0 5 10 15 20 250
0.05
0.1
0.15
0.2
0.25
P2 [kW
]
(B) Time [h]
P2
max of P2
0 5 10 15 20 250
0.05
0.1
0.15
0.2
0.25
P2 [kW
]
(B) Time [h]
P2
max of P2
© Central University of Technology, Free State

128
Figure B5: DG output power and power supplied to the load during summer
Figure B6: PV output power and power supplied to the load Battery during summer
0 5 10 15 20 250
1
2
3
4
5
6
7
8
P4 [kW
]
(D) Time [h]
P4
max of P4
0 5 10 15 20 250
0.5
1
1.5
2
2.5
3
3.5
4
4.5
P5 [kW
]
(A) Time [h]
P5
max of P5
© Central University of Technology, Free State

129
Figure B7: WT output power and power supplied to the load battery during summer
Figure B8: DG output power and power supplied to the load battery during summer
0 5 10 15 20 250
0.05
0.1
0.15
0.2
0.25
P6 [kW
]
(B) Time [h]
P6
max of P6
0 5 10 15 20 250
1
2
3
4
5
6
7
8
P7 [k
W]
(C) Time [h]
P7
max of P7
© Central University of Technology, Free State

130
Figure B9: Battery state charge during summer
0 5 10 15 20 250.2
0.3
0.4
0.5
0.6
0.7
0.8
0.9S
OC
[%
]
(D) Time [h]
SOC
max of SOC
© Central University of Technology, Free State

131
Appendix C: ON/OFF mode simulation results (summer)
Figure C1: Load profile during summer
Figure C2: PV output power and power supplied to the load during summer
0 5 10 15 20 250
1
2
3
4
5P
LO
AD
[kW
]
(A) Time [h]
PLOAD
0 5 10 15 20 250
0.5
1
1.5
2
2.5
3
3.5
4
4.5
P1 [kW
]
(A) Time [h]
P1
max of P1
© Central University of Technology, Free State

132
Figure C3: WT output power and power supplied to the load during summer
Figure C4: Battery output power and power supplied to the load during summer
0 5 10 15 20 250
0.05
0.1
0.15
0.2
0.25
P2 [kW
]
(B) Time [h]
P2
max of P2
0 5 10 15 20 25-8
-6
-4
-2
0
2
4
P3 [kW
]
(C) Time [h]
P3
max of P3
© Central University of Technology, Free State

133
Figure C5: On-Off state during summer
Figure C6: PV output power and power supplied to the battery during summer
0 5 10 15 20 250
0.2
0.4
0.6
0.8
1
on
/off s
tate
(C) Time [h]
0 5 10 15 20 250
0.5
1
1.5
2
2.5
3
3.5
4
4.5
P4 [kW
]
(A) Time [h]
P4
max of P4
© Central University of Technology, Free State

134
Figure C7: WT output power and power supplied to the battery during summer
Figure C8: Battery state of charge during summer
0 5 10 15 20 250
0.05
0.1
0.15
0.2
0.25P
5 [kW
]
(B) Time [h]
P5
max of P5
0 5 10 15 20 250.2
0.3
0.4
0.5
0.6
0.7
0.8
0.9
SO
C [%
]
(D) Time [h]
SOC
max of SOC
© Central University of Technology, Free State

135
Appendix D: Optimal power flow results
Table D1: Continuous operation mode winter case power flow
N P_1
P_2
P_3
P_4
P_5 P_6 P_7 PL
1 0 0 0.2948 0.0052 0 0 0.0047 0.3000
2 0 0 0.2947 0.0053 0 0 0.0047 0.3000
3 0 0 0.1947 0.0053 0 0 0.0048 0.2000
4 0 0 0.1946 0.0054 0 0 0.0048 0.2000
5 0 0 0.0739 0.0054 0 0 0.0048 0.1000
6 0 0 0.0946 0.0054 0 0 0.0048 0.1000
7 0 0 -0.0055 0.0055 0 0 0.0048 0
8 0 0 -0.0055 0.0055 0 0 0.0048 0
9 0 0 0.2945 0.0055 0 0 0.0049 0.3000
10 0 0 0.2945 0.0055 0 0 0.0049 0.3000
11 0 0 -0.0055 0.0055 0 0 0.0049 0
12 0 0 -0.0055 0.0055 0 0 0.0049 0
13 0.4076 0.1815 2.4053 0.0056 0.0638 0.0500 0.0049 3.0000
14 0.4076 0.1815 2.4053 0.0056 0.0638 0.0500 0.0049 3.0000
15 0.9154 1.8365 -2.0575 0.0056 0.0760 0.0749 0.0049 0.7000
16 0.9162 1.8380 -2.0597 0.0056 0.0753 0.0735 0.0049 0.7000
17 2.0277 0.4305 5.5357 0.0061 0.0444 0.0416 0.0049 8.0000
18 2.0273 0.4304 5.5362 0.0061 0.0448 0.0417 0.0049 8.0000
© Central University of Technology, Free State

136
19 2.9613 0.2544 2.3787 0.0056 0.0702 0.0572 0.0049 5.6000
20 2.9617 0.2546 2.3781 0.0056 0.0698 0.0569 0.0049 5.6000
21 2.4949 0.1440 -0.0422 0.0033 1.2064 0.1297 0.0033 2.6000
22 2.4446 0.1385 0.0136 0.0033 1.2160 0.1270 0.0033 2.6000
23 2.5498 0 0.4470 0.0033 1.4508 0 0.0033 3.0000
24 2.4567 0 0.5400 0.0033 1.5176 0 0.0033 3.0000
25 2.4363 0 -1.9395 0.0033 1.4933 0 0.0033 0.5000
26 2.4108 0 -1.9140 0.0033 1.5176 0 0.0033 0.5000
27 2.3184 0 1.0783 0.0033 1.3147 0 0.0033 3.4000
28 2.3598 0 1.0369 0.0033 1.2775 0 0.0033 3.4000
29 2.0285 0 -1.3318 0.0033 1.0894 0 0.0033 0.7000
30 2.0539 0 -1.3572 0.0033 1.0732 0 0.0033 0.7000
31 1.6779 0 -0.3812 0.0033 0.9180 0 0.0033 1.3000
32 1.6753 0 -0.3786 0.0033 0.9410 0 0.0033 1.3000
33 1.3015 0 0.0952 0.0033 0.5757 0 0.0033 1.4000
34 1.4120 0 -0.0154 0.0033 0.5227 0 0.0033 1.4000
35 0.9663 0 0.1937 0.3400 0.0302 0 0.0174 1.5000
36 0.9663 0 -0.0524 0.5861 0.0303 0 0.0196 1.5000
37 0.6079 1.3277 0.7151 1.1493 0.0288 0.0290 0.0249 3.8000
38 0.6082 1.3279 0.6166 1.2472 0.0285 0.0288 0.0257 3.8000
39 0 0.5290 2.7444 1.3266 0 0.0277 0.0262 4.6000
40 0 0.5291 2.7329 1.3380 0 0.0277 0.0263 4.6000
41 0 0 4.5089 1.3911 0 0 0.0261 5.9000
© Central University of Technology, Free State

137
42 0 0 4.5301 1.3699 0 0 0.0260 5.9000
43 0 0 0.7946 1.3054 0 0 0.0260 2.1000
44 0 0 0.9030 1.1970 0 0 0.0256 2.1000
45 0 0 -0.0832 0.8832 0 0 0.0218 0.8000
46 0 0 0.1159 0.6841 0 0 0.0200 0.8000
47 0 0 -0.0217 0.3217 0 0 0.0175 0.3000
48 0 0 0.1560 0.1440 0 0 0.0160 0.3000
Table D2: Continuous operation mode summer case power flow
N P_1
P_2
P_3
P_4
P_5 P_6 P_7 PL
1 0 0 0.3000 0.0000 0 0 0.0000 0.3000
2 0 0 0.3000 0.0000 0 0 0.0000 0.3000
3 0 0 0.2000 0.0000 0 0 0.0000 0.2000
4 0 0 0.2000 0.0000 0 0 0.0000 0.2000
5 0 0 0.1000 0.0000 0 0 0.0000 0.1000
6 0 0 0.1000 0.0000 0 0 0.0000 0.1000
7 0 0 -0.0000 0.0000 0 0 0.0000 0
0.8 0 0 -0.0000 0.0000 0 0 0.0000 0
9 0 0 0.3000 0.0000 0 0 0.0000 0.3000
10 0 0 0.3000 0.0000 0 0 0.0000 0.3000
11 0 0 -0.0000 0.0000 0 0 0.0000 0
© Central University of Technology, Free State

138
12 0 0 -0.0000 0.0000 0 0 0.0000 0
13 0.1748 0.0086 2.2166 0.0000 0.1559 0.0083 0.0000 2.4000
14 0.1764 0.0086 2.2150 0.0000 0.1553 0.0083 0.0000 2.4000
15 0.4373 0.0779 0.0847 0.0000 0.3470 0.0726 0.0000 0.6000
16 0.4421 0.0789 0.0789 0.0000 0.3463 0.0724 0.0000 0.6000
17 1.2131 0.0178 3.0691 0.0000 0.6327 0.0169 0.0000 4.3000
18 1.2082 0.0178 3.0740 0.0000 0.6392 0.0169 0.0000 4.3000
19 1.8914 0.0115 3.6971 0.0000 0.8972 0.0112 0.0000 5.6000
20 1.8777 0.0115 3.7108 0.0000 0.8999 0.0112 0.0000 5.6000
21 1.9739 0.0140 1.2121 0.0000 1.6005 0.0140 0.0000 3.2000
22 1.8947 0.0139 1.2914 0.0000 1.5665 0.0139 0.0000 3.2000
23 1.8576 0 -0.2576 0.0000 1.7774 0 0.0000 1.6000
24 1.7666 0 -0.1667 0.0000 1.6847 0 0.0000 1.6000
25 1.6590 0 -1.3590 0.0000 1.5960 0 0.0000 0.3000
26 1.6469 0 -1.3470 0.0000 1.5683 0 0.0000 0.3000
27 1.5875 0 0.4125 0.0000 1.4019 0 0.0000 2.0000
28 1.6010 0 0.3989 0.0000 1.4159 0 0.0000 2.0000
29 1.3199 0 -0.9199 0.0000 1.2299 0 0.0000 0.4000
30 1.3426 0 -0.9426 0.0000 1.2716 0 0.0000 0.4000
31 1.2031 0 -0.4031 0.0000 1.0032 0 0.0000 0.8000
32 1.3119 0 -0.5119 0.0000 1.0535 0 0.0000 0.8000
33 2.0796 0 1.7220 0.0984 0.0003 0 0.0001 3.9000
34 2.0796 0 1.7231 0.0972 0.0003 0 0.0001 3.9000
© Central University of Technology, Free State

139
35 0.9996 0 0.7117 0.0887 0.0003 0 0.0001 1.8000
36 0.9996 0 0.7112 0.0892 0.0003 0 0.0001 1.8000
37 0.6396 0.1696 0.7936 0.0972 0.0003 0.0003 0.0001 1.7000
38 0.6396 0.1696 0.7934 0.0973 0.0003 0.0003 0.0001 1.7000
39 0 0.0696 1.7418 0.0886 0 0.0003 0.0001 1.9000
40 0 0.0696 1.7417 0.0887 0 0.0003 0.0001 1.9000
41 0 0 2.1064 0.0936 0 0 0.0001 2.2000
42 0 0 2.1066 0.0934 0 0 0.0001 2.2000
43 0 0 0.8067 0.0933 0 0 0.0001 0.9000
44 0 0 0.8079 0.0921 0 0 0.0001 0.9000
45 0 0 0.6098 0.0902 0 0 0.0001 0.7000
46 0 0 0.6126 0.0874 0 0 0.0001 0.7000
47 0 0 0.2166 0.0834 0 0 0.0001 0.3000
48 0 0 0.2164 0.0836 0 0 0.0001 0.3000
Table D3: On-Off operation mode winter case power flow
N S
P_1
P_2
P_3
P_4 P_5 PL
1 0 0 0 0.3000 0 0 0.3000
2 0 0 0 0.3000 0 0 0.3000
3 0 0 0 0.2000 0 0 0.2000
4 0 0 0 0.2000 0 0 0.2000
5 0 0 0 0.1000 0 0 0.1000
© Central University of Technology, Free State

140
6 0 0 0 0.1000 0 0 0.1000
7 0 0 0 0 0 0 0
8 0 0 0 0 0 0 0
9 0 0 0 0.3000 0 0 0.3000
10 0 0 0 0.3000 0 0 0.3000
11 0 0 0 0 0 0 0
12 0 0 0 0 0 0 0
13 0 0.4800 0.2400 2.2800 0 0 3.0000
14 0 0.4800 0.2400 2.2800 0 0 3.0000
15 0 1.0000 1.9200 -2.2200 0 0 0.7000
16 0 1.0000 1.9200 -2.2200 0 0 0.7000
17 0 2.0800 0.4800 5.4400 0 0 8.0000
18 0 2.0800 0.4800 5.4400 0 0 8.0000
19 0 3.0400 0.3200 2.2400 0 0 5.6000
20 0 2.6500 0 2.9500 0.3900 0.3200 5.6000
21 0 0 0 2.6000 3.9200 0.4000 2.6000
22 0 0 0 2.6000 3.9200 0.4000 2.6000
23 0 0 0 3.0000 4.3200 0 3.0000
24 0 0 0 3.0000 4.3200 0 3.0000
25 0 2.1387 0 -1.6387 0 0 0.5000
26 0 0 0 0.5000 4.2800 0 0.5000
27 0 0 0 3.4000 3.9600 0 3.4000
28 0 0 0 3.4000 3.9600 0 3.4000
© Central University of Technology, Free State

141
29 0 0 0 0.7000 3.4400 0 0.7000
30 0 0 0 0.7000 3.4400 0 0.7000
31 0 0 0 1.3000 2.8800 0 1.3000
32 0 2.8800 0 -1.5800 0 0 1.3000
33 0 2.0800 0 -0.6800 0 0 1.4000
34 0 2.0800 0 -0.6800 0 0 1.4000
35 0 1.0000 0 0.5000 0 0 1.5000
36 0 1.0000 0 0.5000 0 0 1.5000
37 0 0 0 3.8000 0 0 3.8000
38 0 0 0 3.8000 0.6400 1.3600 3.8000
39 0 0 0.5600 4.0400 0 0 4.6000
40 0 0 0.5600 4.0400 0 0 4.6000
41 1 0 0 -2.1000 0 0 5.9000
42 1 0 0 -2.1000 0 0 5.9000
43 0 0 0 2.1000 0 0 2.1000
44 0 0 0 2.1000 0 0 2.1000
45 0 0 0 0.8000 0 0 0.8000
46 0 0 0 0.8000 0 0 0.8000
47 0 0 0 0.3000 0 0 0.3000
48 0 0 0 0.3000 0 0
0.3000
© Central University of Technology, Free State

142
Table D4: On-Off operation mode summer case power flow
N S P_1 P_2 P_3 P_4 P_5 PL
1 0 0 0 0.3000 0 0 0.3000
2 0 0 0 0.3000 0 0 0.3000
3 0 0 0 0.2000 0 0 0.2000
4 0 0 0 0.2000 0 0 0.2000
5 0 0 0 0.1000 0 0 0.1000
6 0 0 0 0.1000 0 0 0.1000
7 0 0 0 0 0 0 0
0.8 0 0 0 0 0 0 0
9 0 0 0 0.3000 0 0 0.3000
10 0 0 0 0.3000 0 0 0.3000
11 0 0 0 0 0 0 0
12 0 0 0 0 0 0 0
13 0 0 0.0300 2.3700 0 0 2.4000
14 0 0 0 2.4000 0.4800 0 2.4000
15 0 0 0 0.6000 0 0 0.6000
16 0 0 0 0.6000 1.0000 0 0.6000
17 0 0 0 4.3000 2.0800 0.0600 4.3000
18 0 0 0 4.3000 2.0800 0.0600 4.3000
19 0 3.0400 0.0400 2.5200 0 0 5.6000
20 0 3.0400 0.0400 2.5200 0 0 5.6000
21 0 0 0 3.2000 3.9200 0.0500 3.2000
© Central University of Technology, Free State

143
22 0 0 0 3.2000 3.1410 0 3.2000
23 0 0.0000 0 1.6000 4.3200 0 1.6000
24 0 0.0000 0 1.6000 4.3200 0 1.6000
25 0 0.0000 0 0.3000 0 0 0.3000
26 0 0.0000 0 0.3000 0 0 0.3000
27 0 3.9600 0 -1.9600 0 0 2.0000
28 0 3.9600 0 -1.9600 0 0 2.0000
29 0 0 0 0.4000 3.4400 0 0.4000
30 0 0 0 0.4000 0 0 0.4000
31 0 0.0000 0 0.8000 2.8800 0 0.8000
32 0 0.0000 0 0.8000 0.4951 0 0.8000
33 0 0 0 3.9000 0 0 3.9000
34 1.0000 0 0 -4.1000 0 0 3.9000
35 0 1.0000 0 0.8000 0 0 1.8000
36 0 1.0000 0 0.8000 0 0 1.8000
37 0 0 0 1.7000 0 0 1.7000
38 0 0 0 1.7000 0 0 1.7000
39 0 0 0.0700 1.8300 0 0 1.9000
40 0 0 0.0700 1.8300 0 0 1.9000
41 0 0 0 2.2000 0 0 2.2000
42 0 0 0 2.2000 0 0 2.2000
43 0 0 0 0.9000 0 0 0.9000
44 0 0 0 0.9000 0 0 0.9000
© Central University of Technology, Free State

144
45 0 0 0 0.7000 0 0 0.7000
46 0 0 0 0.7000 0 0 0.7000
47 0 0 0 0.3000 0 0 0.3000
48 0 0 0 0.3000 0 0 0.3000
© Central University of Technology, Free State
Copyright © 2022 FDOKUMEN