Optimal receptor-cluster size determined by intrinsic and extrinsic noise
15
Optimal receptor-cluster size determined by intrinsic and extrinsic noise Gerardo Aquino, Diana Clausznitzer, Sylvain Tollis, Robert G. Endres Division of Molecular Biosciences, Imperial College London, London SW7 2AZ, United Kingdom Centre for Integrative Systems Biology at Imperial College, Imperial College London, London SW7 2AZ, United Kingdom (Dated: January 14, 2011) Biological cells sense external chemical stimuli in their environment using cell-surface receptors. To increase the sensitivity of sensing, receptors often cluster. This process occurs most noticeably in bacterial chemotaxis, a paradigm for sensing and signaling in general. While amplification of weak stimuli is useful in the absence of noise, its usefulness is less clear in the presence of extrinsic input noise and intrinsic signaling noise. Here, exemplified in a bacterial chemotaxis system, we combine the allosteric Monod-Wyman-Changeux model for signal amplification by receptor complexes with calculations of noise to study their interconnectedness. Importantly, we calculate the signal-to- noise ratio, describing the balance of beneficial and detrimental effects of clustering for the cell. Interestingly, we find that there is no advantage for the cell to build receptor complexes for noisy input stimuli in the absence of intrinsic signaling noise. However, with intrinsic noise, an optimal complex size arises in line with estimates of the size of chemoreceptor complexes in bacteria and protein aggregates in lipid rafts of eukaryotic cells. I. INTRODUCTION Biological cells can sense and respond to various chem- icals in their environment. However, the precision with which a cell can measure and internally evaluate the con- centration of a specific ligand molecule is negatively af- fected by many sources of noise [1, 2]. There is external input noise (extrinsic noise) from the random arrival of ligand molecules at the cell-surface receptors by diffusion [3–5], as well as various sources of intracellular signal- ing noise (intrinsic noise) due, e.g., to receptor dynam- ics, adaptation, and signal transduction [6], all relying on random chemical events. Nonetheless several biologi- cal examples exist in which measurements are performed with surprisingly high sensitivity. In bacterial chemo- taxis, for instance, the bacterium Escherichia coli can respond to changes in concentration as low as 3.2 nM [7], corresponding to only three molecules in the cell vol- ume. High sensitivity is observed also in spatial sensing by single cell eukaryotic organisms, such as during aggre- gation of the social amoeba Dictyostelium discoideum [8] and during mating of Saccharomyces cerevisiae (budding yeast) [9]. Furthermore, axon growth cones of neurons re- spond to an estimated change in concentration of about one molecule in the volume of the growth cone [10], and T cells of our immune system respond to a single peptide- major histocompatibility complex on a target cell [11]. How can this sensitivity be understood despite the vari- ous sources of noise? The best characterized signal-transduction pathway is the bacterial chemotaxis pathway, allowing cells to swim to sources of nutrients such as sugars and amino acids, and away from toxins [12]. Cells are equipped with dif- ferent receptor types with Tar among the most abun- dant receptors (hundreds to thousands of copies per cell). Tar specifically binds aspartate (or its non-metabolizable analogue MeAsp). An increase in ligand concentration, as occurring, e.g., when the cell swims towards the source of an attractant, inhibits receptor signaling activity and keeps the cell on course. In contrast, a decrease in at- tractant concentration, as occurring, e.g., when the cell swims in the wrong direction, increases receptor signal- ing activity. This enhances the probability for the cell to randomly find a new and hopefully better direction of swimming. Cells are further equipped with an adaptation mechanism, which allows them to sense changes in ligand concentration over a wide range of background concen- tration. Specifically, cells adapt their signaling activity by receptor methylation and demethylation. Methylation by enzyme CheR increases the receptor signaling activity, while demethylation by enzyme CheB decreases receptor activity. Receptor clustering is well documented in bacterial chemotaxis [13] and is known to amplify tiny changes in ligand concentration similar to an antenna. Exper- imental evidence for clustering is based on structural approaches [14], imaging by fluorescence microscopy [15], including photo-activated localization microscopy (PALM) [16], as well as cryo-electron microscopy [17, 18]. Receptor clusters form predominantly at the cell poles as illustrated in Fig. 1, possibly due to the increased membrane curvature [19]. At a smaller scale, receptor clusters are composed of smaller signaling complexes. The notion of receptor complexes is supported by high- resolution imaging with PALM [16], as well as by the ex- tracted sensitivity and cooperativity from dose-response curves (activity changes in response to ligand stimuli) measured by in vivo fluorescence resonance energy trans- fer (FRET). As an example, Fig. 2a shows previously published dose-response curves of the receptor activity from in vivo FRET experiments (see figure caption and [20] for details). Briefly, cells were genetically engineered to only express the Tar receptor. Different curves corre- spond to different modification (adaptation) states of the receptors. To explain the dose-response data, the Monod- arXiv:1101.2581v1 [physics.bio-ph] 13 Jan 2011
-
Upload
independent -
Category
Documents
-
view
0 -
download
0
Transcript of Optimal receptor-cluster size determined by intrinsic and extrinsic noise
Optimal receptor-cluster size determined by intrinsic and extrinsic noise
Gerardo Aquino, Diana Clausznitzer, Sylvain Tollis, Robert G. EndresDivision of Molecular Biosciences, Imperial College London, London SW7 2AZ, United Kingdom
Centre for Integrative Systems Biology at Imperial College,Imperial College London, London SW7 2AZ, United Kingdom
(Dated: January 14, 2011)
Biological cells sense external chemical stimuli in their environment using cell-surface receptors.To increase the sensitivity of sensing, receptors often cluster. This process occurs most noticeably inbacterial chemotaxis, a paradigm for sensing and signaling in general. While amplification of weakstimuli is useful in the absence of noise, its usefulness is less clear in the presence of extrinsic inputnoise and intrinsic signaling noise. Here, exemplified in a bacterial chemotaxis system, we combinethe allosteric Monod-Wyman-Changeux model for signal amplification by receptor complexes withcalculations of noise to study their interconnectedness. Importantly, we calculate the signal-to-noise ratio, describing the balance of beneficial and detrimental effects of clustering for the cell.Interestingly, we find that there is no advantage for the cell to build receptor complexes for noisyinput stimuli in the absence of intrinsic signaling noise. However, with intrinsic noise, an optimalcomplex size arises in line with estimates of the size of chemoreceptor complexes in bacteria andprotein aggregates in lipid rafts of eukaryotic cells.
I. INTRODUCTION
Biological cells can sense and respond to various chem-icals in their environment. However, the precision withwhich a cell can measure and internally evaluate the con-centration of a specific ligand molecule is negatively af-fected by many sources of noise [1, 2]. There is externalinput noise (extrinsic noise) from the random arrival ofligand molecules at the cell-surface receptors by diffusion[3–5], as well as various sources of intracellular signal-ing noise (intrinsic noise) due, e.g., to receptor dynam-ics, adaptation, and signal transduction [6], all relyingon random chemical events. Nonetheless several biologi-cal examples exist in which measurements are performedwith surprisingly high sensitivity. In bacterial chemo-taxis, for instance, the bacterium Escherichia coli canrespond to changes in concentration as low as 3.2 nM[7], corresponding to only three molecules in the cell vol-ume. High sensitivity is observed also in spatial sensingby single cell eukaryotic organisms, such as during aggre-gation of the social amoeba Dictyostelium discoideum [8]and during mating of Saccharomyces cerevisiae (buddingyeast) [9]. Furthermore, axon growth cones of neurons re-spond to an estimated change in concentration of aboutone molecule in the volume of the growth cone [10], and Tcells of our immune system respond to a single peptide-major histocompatibility complex on a target cell [11].How can this sensitivity be understood despite the vari-ous sources of noise?
The best characterized signal-transduction pathway isthe bacterial chemotaxis pathway, allowing cells to swimto sources of nutrients such as sugars and amino acids,and away from toxins [12]. Cells are equipped with dif-ferent receptor types with Tar among the most abun-dant receptors (hundreds to thousands of copies per cell).Tar specifically binds aspartate (or its non-metabolizableanalogue MeAsp). An increase in ligand concentration,as occurring, e.g., when the cell swims towards the source
of an attractant, inhibits receptor signaling activity andkeeps the cell on course. In contrast, a decrease in at-tractant concentration, as occurring, e.g., when the cellswims in the wrong direction, increases receptor signal-ing activity. This enhances the probability for the cellto randomly find a new and hopefully better direction ofswimming. Cells are further equipped with an adaptationmechanism, which allows them to sense changes in ligandconcentration over a wide range of background concen-tration. Specifically, cells adapt their signaling activityby receptor methylation and demethylation. Methylationby enzyme CheR increases the receptor signaling activity,while demethylation by enzyme CheB decreases receptoractivity.
Receptor clustering is well documented in bacterialchemotaxis [13] and is known to amplify tiny changesin ligand concentration similar to an antenna. Exper-imental evidence for clustering is based on structuralapproaches [14], imaging by fluorescence microscopy[15], including photo-activated localization microscopy(PALM) [16], as well as cryo-electron microscopy [17, 18].Receptor clusters form predominantly at the cell polesas illustrated in Fig. 1, possibly due to the increasedmembrane curvature [19]. At a smaller scale, receptorclusters are composed of smaller signaling complexes.The notion of receptor complexes is supported by high-resolution imaging with PALM [16], as well as by the ex-tracted sensitivity and cooperativity from dose-responsecurves (activity changes in response to ligand stimuli)measured by in vivo fluorescence resonance energy trans-fer (FRET). As an example, Fig. 2a shows previouslypublished dose-response curves of the receptor activityfrom in vivo FRET experiments (see figure caption and[20] for details). Briefly, cells were genetically engineeredto only express the Tar receptor. Different curves corre-spond to different modification (adaptation) states of thereceptors.
To explain the dose-response data, the Monod-
arX
iv:1
101.
2581
v1 [
phys
ics.
bio-
ph]
13
Jan
2011
2
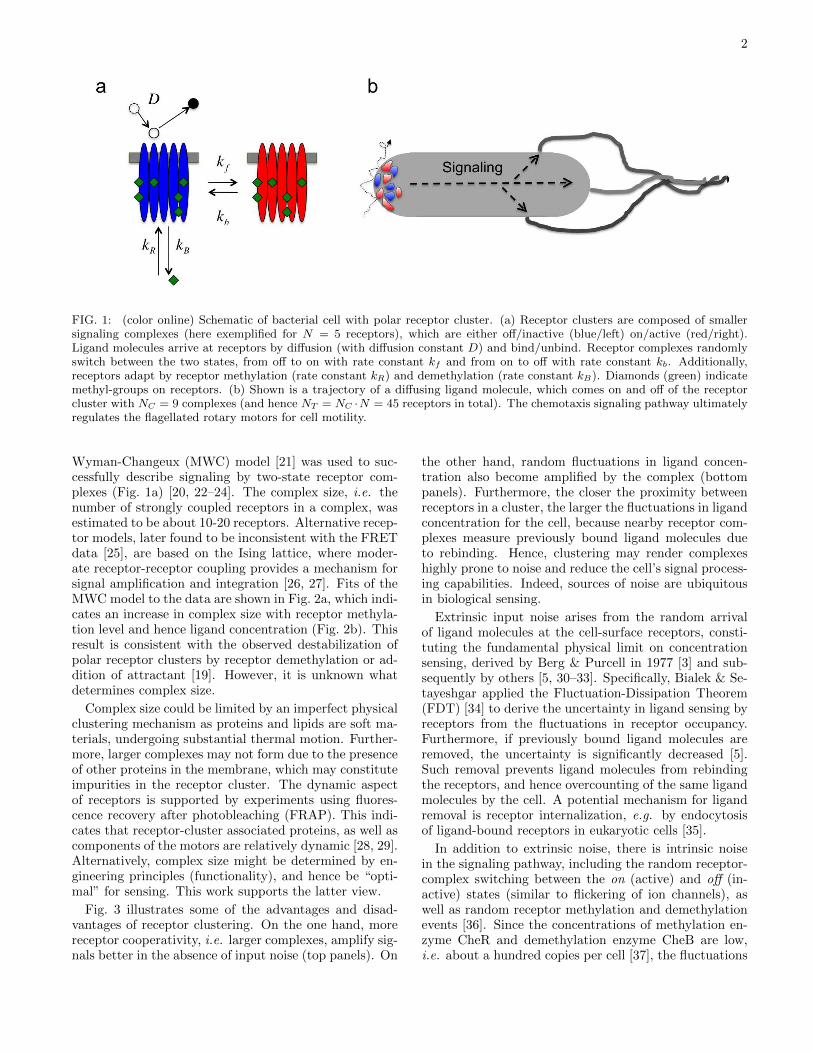
FIG. 1: (color online) Schematic of bacterial cell with polar receptor cluster. (a) Receptor clusters are composed of smallersignaling complexes (here exemplified for N = 5 receptors), which are either off/inactive (blue/left) on/active (red/right).Ligand molecules arrive at receptors by diffusion (with diffusion constant D) and bind/unbind. Receptor complexes randomlyswitch between the two states, from off to on with rate constant kf and from on to off with rate constant kb. Additionally,receptors adapt by receptor methylation (rate constant kR) and demethylation (rate constant kB). Diamonds (green) indicatemethyl-groups on receptors. (b) Shown is a trajectory of a diffusing ligand molecule, which comes on and off of the receptorcluster with NC = 9 complexes (and hence NT = NC ·N = 45 receptors in total). The chemotaxis signaling pathway ultimatelyregulates the flagellated rotary motors for cell motility.
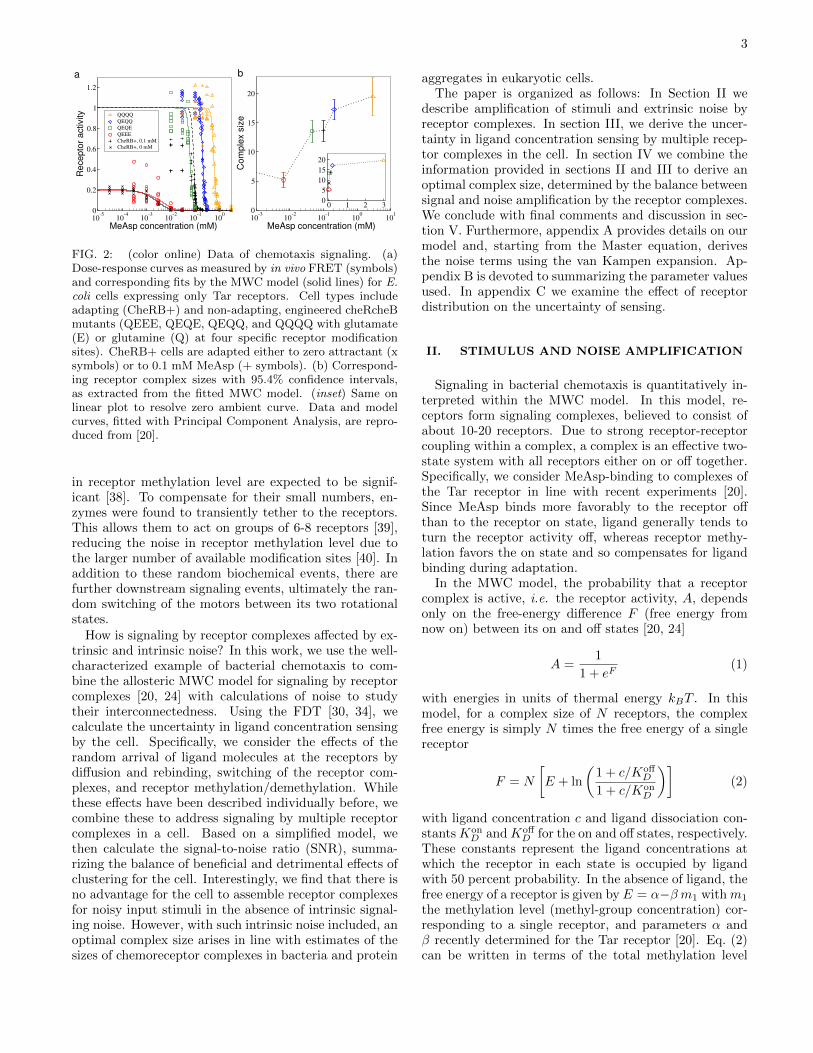
Wyman-Changeux (MWC) model [21] was used to suc-cessfully describe signaling by two-state receptor com-plexes (Fig. 1a) [20, 22–24]. The complex size, i.e. thenumber of strongly coupled receptors in a complex, wasestimated to be about 10-20 receptors. Alternative recep-tor models, later found to be inconsistent with the FRETdata [25], are based on the Ising lattice, where moder-ate receptor-receptor coupling provides a mechanism forsignal amplification and integration [26, 27]. Fits of theMWC model to the data are shown in Fig. 2a, which indi-cates an increase in complex size with receptor methyla-tion level and hence ligand concentration (Fig. 2b). Thisresult is consistent with the observed destabilization ofpolar receptor clusters by receptor demethylation or ad-dition of attractant [19]. However, it is unknown whatdetermines complex size.
Complex size could be limited by an imperfect physicalclustering mechanism as proteins and lipids are soft ma-terials, undergoing substantial thermal motion. Further-more, larger complexes may not form due to the presenceof other proteins in the membrane, which may constituteimpurities in the receptor cluster. The dynamic aspectof receptors is supported by experiments using fluores-cence recovery after photobleaching (FRAP). This indi-cates that receptor-cluster associated proteins, as well ascomponents of the motors are relatively dynamic [28, 29].Alternatively, complex size might be determined by en-gineering principles (functionality), and hence be “opti-mal” for sensing. This work supports the latter view.
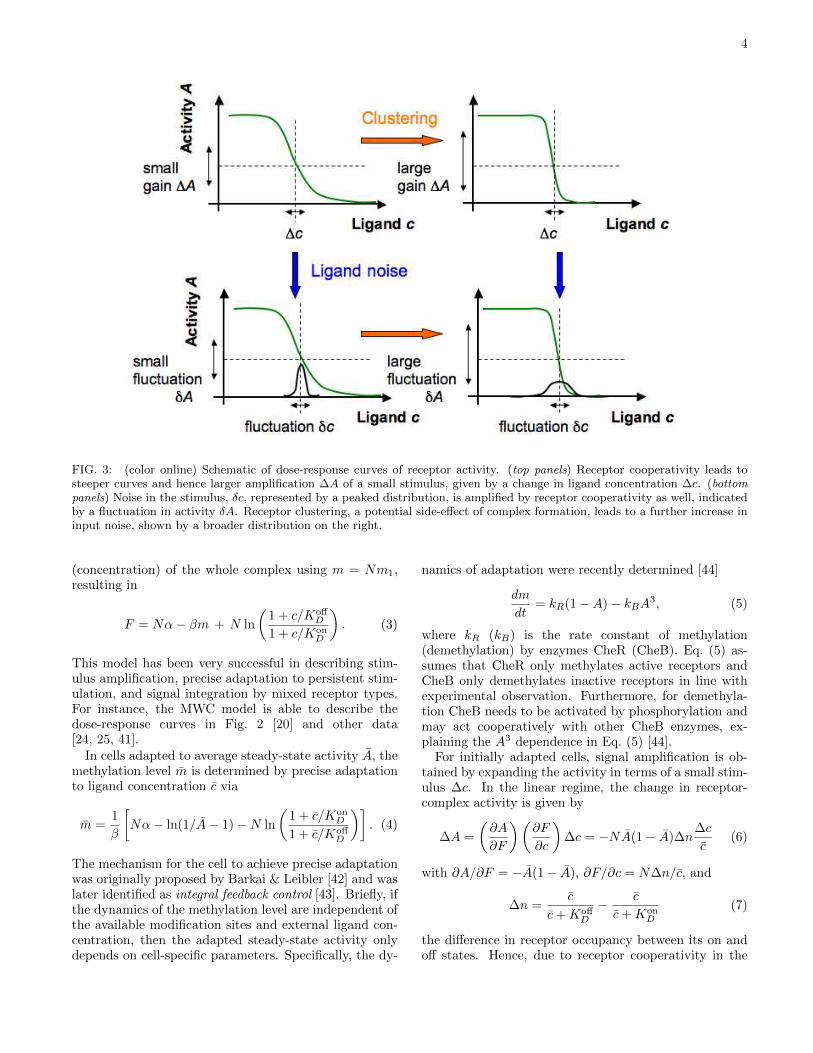
Fig. 3 illustrates some of the advantages and disad-vantages of receptor clustering. On the one hand, morereceptor cooperativity, i.e. larger complexes, amplify sig-nals better in the absence of input noise (top panels). On
the other hand, random fluctuations in ligand concen-tration also become amplified by the complex (bottompanels). Furthermore, the closer the proximity betweenreceptors in a cluster, the larger the fluctuations in ligandconcentration for the cell, because nearby receptor com-plexes measure previously bound ligand molecules dueto rebinding. Hence, clustering may render complexeshighly prone to noise and reduce the cell’s signal process-ing capabilities. Indeed, sources of noise are ubiquitousin biological sensing.
Extrinsic input noise arises from the random arrivalof ligand molecules at the cell-surface receptors, consti-tuting the fundamental physical limit on concentrationsensing, derived by Berg & Purcell in 1977 [3] and sub-sequently by others [5, 30–33]. Specifically, Bialek & Se-tayeshgar applied the Fluctuation-Dissipation Theorem(FDT) [34] to derive the uncertainty in ligand sensing byreceptors from the fluctuations in receptor occupancy.Furthermore, if previously bound ligand molecules areremoved, the uncertainty is significantly decreased [5].Such removal prevents ligand molecules from rebindingthe receptors, and hence overcounting of the same ligandmolecules by the cell. A potential mechanism for ligandremoval is receptor internalization, e.g. by endocytosisof ligand-bound receptors in eukaryotic cells [35].
In addition to extrinsic noise, there is intrinsic noisein the signaling pathway, including the random receptor-complex switching between the on (active) and off (in-active) states (similar to flickering of ion channels), aswell as random receptor methylation and demethylationevents [36]. Since the concentrations of methylation en-zyme CheR and demethylation enzyme CheB are low,i.e. about a hundred copies per cell [37], the fluctuations
3
FIG. 2: (color online) Data of chemotaxis signaling. (a)Dose-response curves as measured by in vivo FRET (symbols)and corresponding fits by the MWC model (solid lines) for E.coli cells expressing only Tar receptors. Cell types includeadapting (CheRB+) and non-adapting, engineered cheRcheBmutants (QEEE, QEQE, QEQQ, and QQQQ with glutamate(E) or glutamine (Q) at four specific receptor modificationsites). CheRB+ cells are adapted either to zero attractant (xsymbols) or to 0.1 mM MeAsp (+ symbols). (b) Correspond-ing receptor complex sizes with 95.4% confidence intervals,as extracted from the fitted MWC model. (inset) Same onlinear plot to resolve zero ambient curve. Data and modelcurves, fitted with Principal Component Analysis, are repro-duced from [20].
in receptor methylation level are expected to be signif-icant [38]. To compensate for their small numbers, en-zymes were found to transiently tether to the receptors.This allows them to act on groups of 6-8 receptors [39],reducing the noise in receptor methylation level due tothe larger number of available modification sites [40]. Inaddition to these random biochemical events, there arefurther downstream signaling events, ultimately the ran-dom switching of the motors between its two rotationalstates.
How is signaling by receptor complexes affected by ex-trinsic and intrinsic noise? In this work, we use the well-characterized example of bacterial chemotaxis to com-bine the allosteric MWC model for signaling by receptorcomplexes [20, 24] with calculations of noise to studytheir interconnectedness. Using the FDT [30, 34], wecalculate the uncertainty in ligand concentration sensingby the cell. Specifically, we consider the effects of therandom arrival of ligand molecules at the receptors bydiffusion and rebinding, switching of the receptor com-plexes, and receptor methylation/demethylation. Whilethese effects have been described individually before, wecombine these to address signaling by multiple receptorcomplexes in a cell. Based on a simplified model, wethen calculate the signal-to-noise ratio (SNR), summa-rizing the balance of beneficial and detrimental effects ofclustering for the cell. Interestingly, we find that there isno advantage for the cell to assemble receptor complexesfor noisy input stimuli in the absence of intrinsic signal-ing noise. However, with such intrinsic noise included, anoptimal complex size arises in line with estimates of thesizes of chemoreceptor complexes in bacteria and protein
aggregates in eukaryotic cells.The paper is organized as follows: In Section II we
describe amplification of stimuli and extrinsic noise byreceptor complexes. In section III, we derive the uncer-tainty in ligand concentration sensing by multiple recep-tor complexes in the cell. In section IV we combine theinformation provided in sections II and III to derive anoptimal complex size, determined by the balance betweensignal and noise amplification by the receptor complexes.We conclude with final comments and discussion in sec-tion V. Furthermore, appendix A provides details on ourmodel and, starting from the Master equation, derivesthe noise terms using the van Kampen expansion. Ap-pendix B is devoted to summarizing the parameter valuesused. In appendix C we examine the effect of receptordistribution on the uncertainty of sensing.
II. STIMULUS AND NOISE AMPLIFICATION
Signaling in bacterial chemotaxis is quantitatively in-terpreted within the MWC model. In this model, re-ceptors form signaling complexes, believed to consist ofabout 10-20 receptors. Due to strong receptor-receptorcoupling within a complex, a complex is an effective two-state system with all receptors either on or off together.Specifically, we consider MeAsp-binding to complexes ofthe Tar receptor in line with recent experiments [20].Since MeAsp binds more favorably to the receptor offthan to the receptor on state, ligand generally tends toturn the receptor activity off, whereas receptor methy-lation favors the on state and so compensates for ligandbinding during adaptation.
In the MWC model, the probability that a receptorcomplex is active, i.e. the receptor activity, A, dependsonly on the free-energy difference F (free energy fromnow on) between its on and off states [20, 24]
A =1
1 + eF(1)
with energies in units of thermal energy kBT . In thismodel, for a complex size of N receptors, the complexfree energy is simply N times the free energy of a singlereceptor
F = N
[E + ln
(1 + c/Koff
D
1 + c/KonD
)](2)
with ligand concentration c and ligand dissociation con-stantsKon
D andKoffD for the on and off states, respectively.
These constants represent the ligand concentrations atwhich the receptor in each state is occupied by ligandwith 50 percent probability. In the absence of ligand, thefree energy of a receptor is given by E = α−β m1 withm1
the methylation level (methyl-group concentration) cor-responding to a single receptor, and parameters α andβ recently determined for the Tar receptor [20]. Eq. (2)can be written in terms of the total methylation level
4
FIG. 3: (color online) Schematic of dose-response curves of receptor activity. (top panels) Receptor cooperativity leads tosteeper curves and hence larger amplification ∆A of a small stimulus, given by a change in ligand concentration ∆c. (bottompanels) Noise in the stimulus, δc, represented by a peaked distribution, is amplified by receptor cooperativity as well, indicatedby a fluctuation in activity δA. Receptor clustering, a potential side-effect of complex formation, leads to a further increase ininput noise, shown by a broader distribution on the right.
(concentration) of the whole complex using m = Nm1,resulting in
F = Nα− βm + N ln
(1 + c/Koff
D
1 + c/KonD
). (3)
This model has been very successful in describing stim-ulus amplification, precise adaptation to persistent stim-ulation, and signal integration by mixed receptor types.For instance, the MWC model is able to describe thedose-response curves in Fig. 2 [20] and other data[24, 25, 41].
In cells adapted to average steady-state activity A, themethylation level m is determined by precise adaptationto ligand concentration c via
m =1
β
[Nα− ln(1/A− 1)−N ln
(1 + c/Kon
D
1 + c/KoffD
)]. (4)
The mechanism for the cell to achieve precise adaptationwas originally proposed by Barkai & Leibler [42] and waslater identified as integral feedback control [43]. Briefly, ifthe dynamics of the methylation level are independent ofthe available modification sites and external ligand con-centration, then the adapted steady-state activity onlydepends on cell-specific parameters. Specifically, the dy-
namics of adaptation were recently determined [44]
dm
dt= kR(1−A)− kBA3, (5)
where kR (kB) is the rate constant of methylation(demethylation) by enzymes CheR (CheB). Eq. (5) as-sumes that CheR only methylates active receptors andCheB only demethylates inactive receptors in line withexperimental observation. Furthermore, for demethyla-tion CheB needs to be activated by phosphorylation andmay act cooperatively with other CheB enzymes, ex-plaining the A3 dependence in Eq. (5) [44].
For initially adapted cells, signal amplification is ob-tained by expanding the activity in terms of a small stim-ulus ∆c. In the linear regime, the change in receptor-complex activity is given by
∆A =
(∂A
∂F
)(∂F
∂c
)∆c = −NA(1− A)∆n
∆c
c(6)
with ∂A/∂F = −A(1− A), ∂F/∂c = N∆n/c, and
∆n =c
c+KoffD
− c
c+KonD
(7)
the difference in receptor occupancy between its on andoff states. Hence, due to receptor cooperativity in the
5
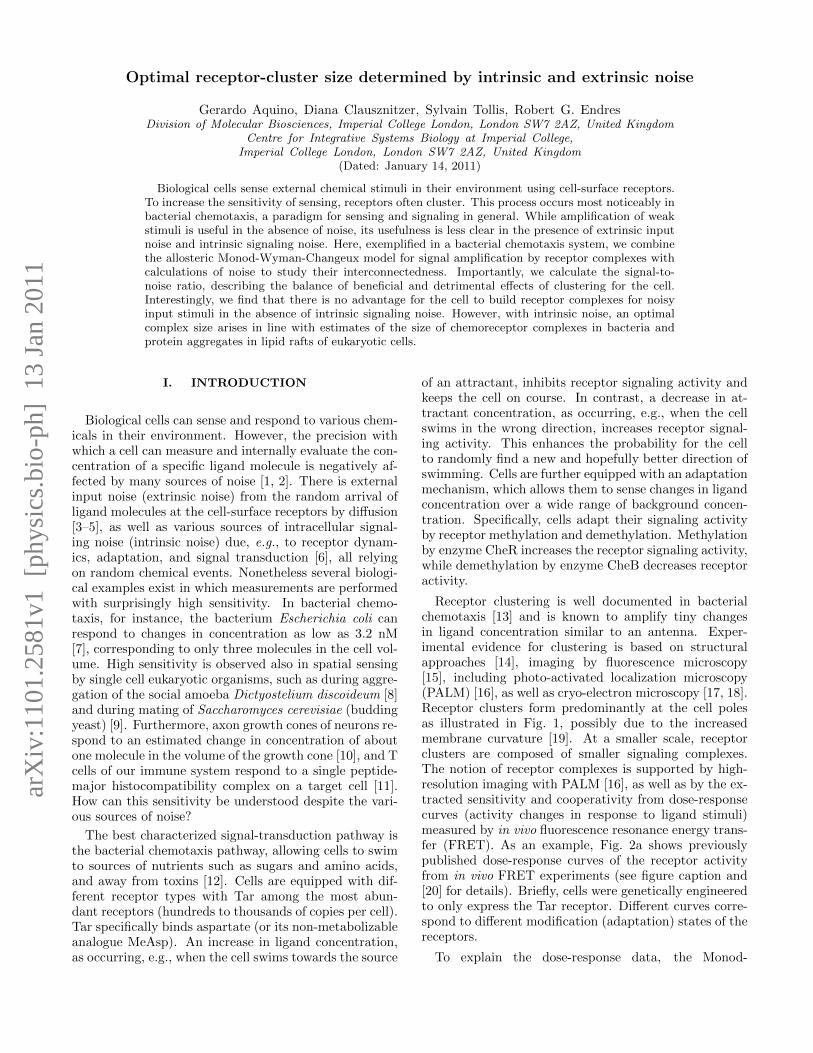
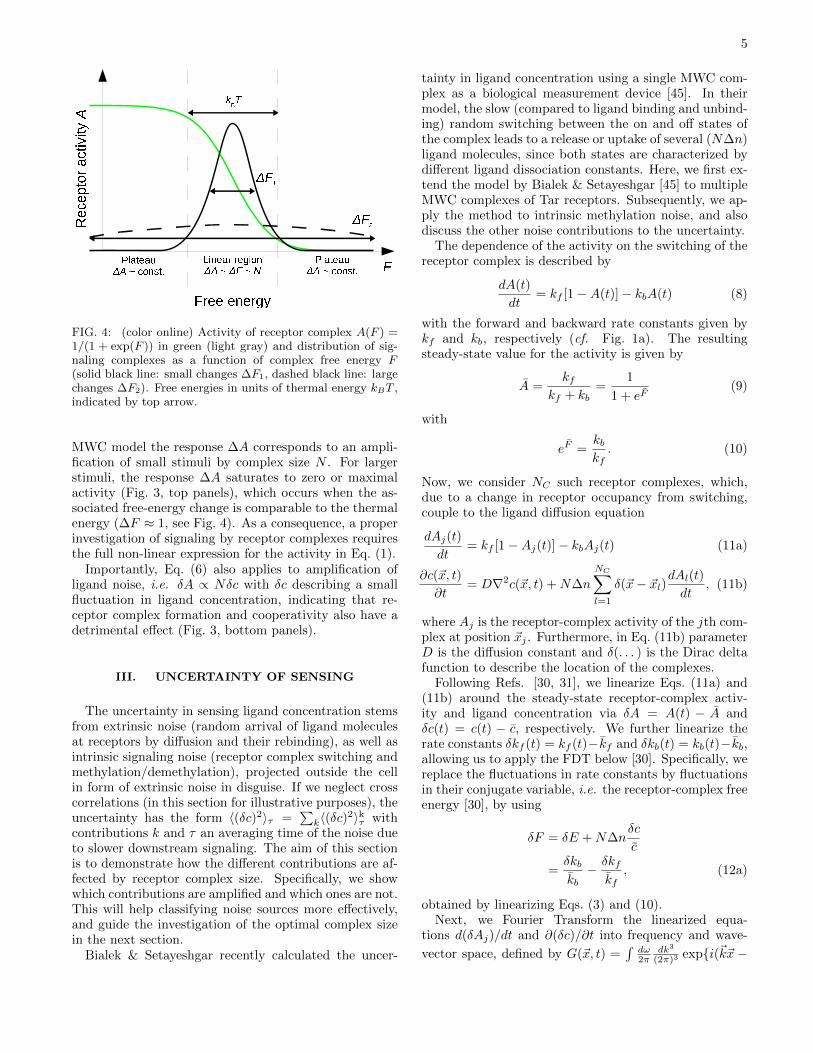
FIG. 4: (color online) Activity of receptor complex A(F ) =1/(1 + exp(F )) in green (light gray) and distribution of sig-naling complexes as a function of complex free energy F(solid black line: small changes ∆F1, dashed black line: largechanges ∆F2). Free energies in units of thermal energy kBT ,indicated by top arrow.
MWC model the response ∆A corresponds to an ampli-fication of small stimuli by complex size N . For largerstimuli, the response ∆A saturates to zero or maximalactivity (Fig. 3, top panels), which occurs when the as-sociated free-energy change is comparable to the thermalenergy (∆F ≈ 1, see Fig. 4). As a consequence, a properinvestigation of signaling by receptor complexes requiresthe full non-linear expression for the activity in Eq. (1).
Importantly, Eq. (6) also applies to amplification ofligand noise, i.e. δA ∝ Nδc with δc describing a smallfluctuation in ligand concentration, indicating that re-ceptor complex formation and cooperativity also have adetrimental effect (Fig. 3, bottom panels).
III. UNCERTAINTY OF SENSING
The uncertainty in sensing ligand concentration stemsfrom extrinsic noise (random arrival of ligand moleculesat receptors by diffusion and their rebinding), as well asintrinsic signaling noise (receptor complex switching andmethylation/demethylation), projected outside the cellin form of extrinsic noise in disguise. If we neglect crosscorrelations (in this section for illustrative purposes), theuncertainty has the form 〈(δc)2〉τ =
∑k〈(δc)2〉kτ with
contributions k and τ an averaging time of the noise dueto slower downstream signaling. The aim of this sectionis to demonstrate how the different contributions are af-fected by receptor complex size. Specifically, we showwhich contributions are amplified and which ones are not.This will help classifying noise sources more effectively,and guide the investigation of the optimal complex sizein the next section.
Bialek & Setayeshgar recently calculated the uncer-
tainty in ligand concentration using a single MWC com-plex as a biological measurement device [45]. In theirmodel, the slow (compared to ligand binding and unbind-ing) random switching between the on and off states ofthe complex leads to a release or uptake of several (N∆n)ligand molecules, since both states are characterized bydifferent ligand dissociation constants. Here, we first ex-tend the model by Bialek & Setayeshgar [45] to multipleMWC complexes of Tar receptors. Subsequently, we ap-ply the method to intrinsic methylation noise, and alsodiscuss the other noise contributions to the uncertainty.
The dependence of the activity on the switching of thereceptor complex is described by
dA(t)
dt= kf [1−A(t)]− kbA(t) (8)
with the forward and backward rate constants given bykf and kb, respectively (cf. Fig. 1a). The resultingsteady-state value for the activity is given by
A =kf
kf + kb=
1
1 + eF(9)
with
eF =kbkf. (10)
Now, we consider NC such receptor complexes, which,due to a change in receptor occupancy from switching,couple to the ligand diffusion equation
dAj(t)
dt= kf [1−Aj(t)]− kbAj(t) (11a)
∂c(~x, t)
∂t= D∇2c(~x, t) +N∆n
NC∑l=1
δ(~x− ~xl)dAl(t)
dt, (11b)
where Aj is the receptor-complex activity of the jth com-plex at position ~xj . Furthermore, in Eq. (11b) parameterD is the diffusion constant and δ(. . . ) is the Dirac deltafunction to describe the location of the complexes.
Following Refs. [30, 31], we linearize Eqs. (11a) and(11b) around the steady-state receptor-complex activ-ity and ligand concentration via δA = A(t) − A andδc(t) = c(t) − c, respectively. We further linearize therate constants δkf (t) = kf (t)−kf and δkb(t) = kb(t)−kb,allowing us to apply the FDT below [30]. Specifically, wereplace the fluctuations in rate constants by fluctuationsin their conjugate variable, i.e. the receptor-complex freeenergy [30], by using
δF = δE +N∆nδc
c
=δkbkb− δkf
kf, (12a)
obtained by linearizing Eqs. (3) and (10).Next, we Fourier Transform the linearized equa-
tions d(δAj)/dt and ∂(δc)/∂t into frequency and wave-
vector space, defined by G(~x, t) =∫dω2π
dk3
(2π)3 expi(~k~x −
6
ωt)G(ω,~k) for any integrable function G. This resultsin an equation for frequency-dependent fluctuations inthe activity of the j-th complex
(kf + kb − iω)δAj(ω)
= −kbAj[δEj +N∆n
δc(~xj , ω)
c
], (13)
and the wavevector and fequency-dependent variation inligand concentration
δc(~k, ω) =−iωN∆n
(Dk2 − iω)
NC∑l=1
e−i~k~xlδAl. (14)
To remove the ~x dependence in Eq. (13), we invert thespatial Fourier Transform in Eq. (14), resulting in
δc(~xj , ω) =−iωN∆n
π2D
1
2aδAj(ω) +
π
4
NC∑l 6=j
δAl(ω)
|~xj − ~xl|
,(15)
where the receptor complex dimension a was introducedto regularize an integral. Eq. (15) is valid for low fre-quencies ω << D/a2, i.e. we assume the time to read outthe receptor free energy to be long compared to the cor-relation time between receptor-complex switching events[45]. Inserting this equation into Eq. (13), we obtain[
kf + kb − iω(
1 + kbAN2∆n2
2πDac
)]δAj(ω)
= iωkbAN2∆n2
4πDc
NC∑l 6=j
δAl(ω)
|~xj − ~xl|− kbAδEj(ω). (16)
Next, we sum over all receptor complexes using NCδA =∑NCj=1 δAj and δE =
∑NCj=1 δEj to obtain the total re-
ceptor activity and free energy. Furthermore, we intro-
duce the geometric structure factor Φ =∑NCj 6=1
1|~x1−~xj | ,
valid for receptor complex distributions for which eachreceptor complex is equivalent to all the other receptorcomplexes (ring or sphere of receptors) [30]. With thesequantities introduced, we obtain
NC
kf + kb − iω
[1 +
kbAN2∆n2
2πDc
(1
a+
Φ
2
)]δA
= −kbAδE. (17)
Using the FDT, we calculate the noise power spectrum ofthe receptor-complex activity, defined by 〈δA(ω)δA∗(ω)〉,from the deterministic linear response to a small pertur-bation in the receptor-complex free energy
SA(ω) =2
ωIm
[− δAδE
](18a)
=2kf (1− A)(1 + Σ)
NC [(kf + kb)2 + ω2(1 + Σ)2](18b)
ω→0−→ 2kf (1− A)(1 + Σ)
NC(kf + kb)2(18c)
with Σ = kbAN2∆n2
2πDc (1/a+Φ/2) and Eq. (18c) valid in thezero-frequency limit. Note the minus sign in Eq. (18a) is
introduced since a positive δE leads to a negative δA [45].From δA = −NA(1−A)∆n δcc (cf. Eq. (6)), we obtain forthe time-averaged variance of the ligand concentration
〈(δc)2〉τ =
[c
N∆nA(1− A)
]2SA(0)
τ(19)
with τ the averaging time determined by slow, down-stream signaling, and finally for the relative uncertaintyin sensing
〈(δc)2〉SRτ
c2=
2
NCN2∆n2kf (1− A)τ
+1
NCπDcτ
(1
a+
Φ
2
). (20)
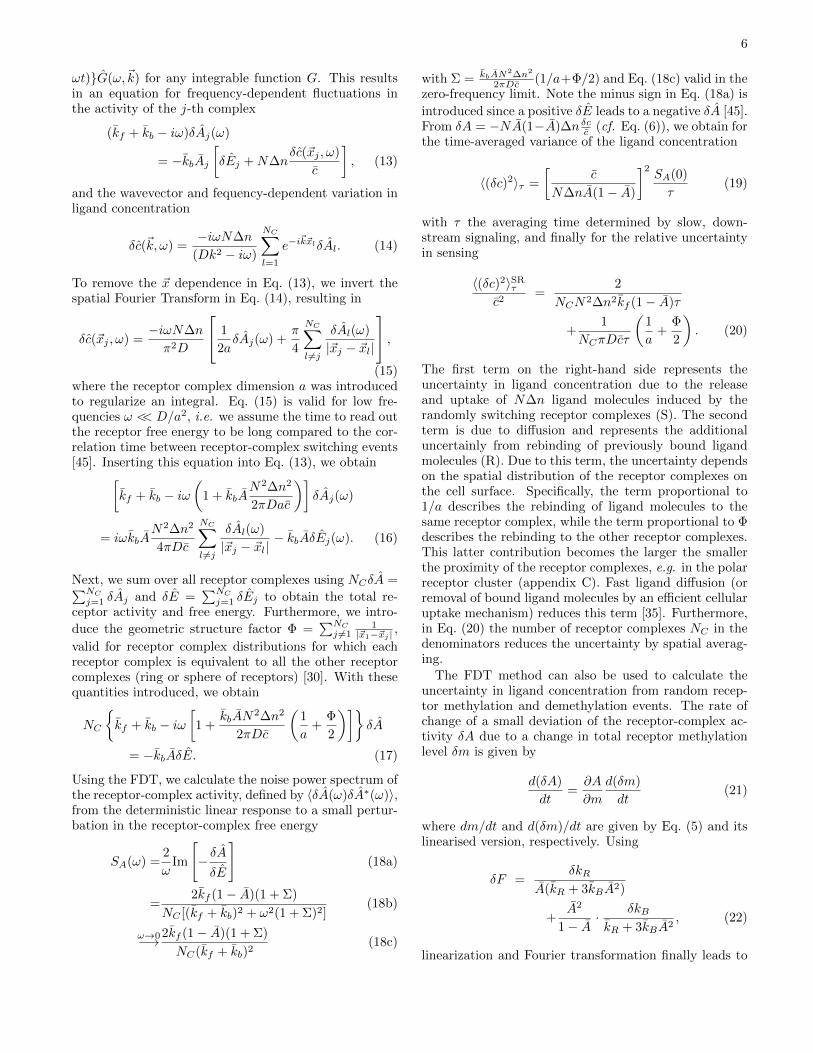
The first term on the right-hand side represents theuncertainty in ligand concentration due to the releaseand uptake of N∆n ligand molecules induced by therandomly switching receptor complexes (S). The secondterm is due to diffusion and represents the additionaluncertainly from rebinding of previously bound ligandmolecules (R). Due to this term, the uncertainty dependson the spatial distribution of the receptor complexes onthe cell surface. Specifically, the term proportional to1/a describes the rebinding of ligand molecules to thesame receptor complex, while the term proportional to Φdescribes the rebinding to the other receptor complexes.This latter contribution becomes the larger the smallerthe proximity of the receptor complexes, e.g. in the polarreceptor cluster (appendix C). Fast ligand diffusion (orremoval of bound ligand molecules by an efficient cellularuptake mechanism) reduces this term [35]. Furthermore,in Eq. (20) the number of receptor complexes NC in thedenominators reduces the uncertainty by spatial averag-ing.
The FDT method can also be used to calculate theuncertainty in ligand concentration from random recep-tor methylation and demethylation events. The rate ofchange of a small deviation of the receptor-complex ac-tivity δA due to a change in total receptor methylationlevel δm is given by
d(δA)
dt=∂A
∂m
d(δm)
dt(21)
where dm/dt and d(δm)/dt are given by Eq. (5) and itslinearised version, respectively. Using
δF =δkR
A(kR + 3kBA2)
+A2
1− A· δkBkR + 3kBA2
, (22)
linearization and Fourier transformation finally leads to
7
the relative uncertainty in ligand concentration
〈(δc)2〉MRτ
c2=
2
NCU2∆n2kR(1− A)τ
+1
NCπDcτ
(1
a+
Φ
2
), (23)
where the first term on the right hand side describesthe contribution from random receptor methylation anddemethylation events (M), respectively leading to a re-lease and take-up of ligand molecules. This term is in-versely proportial to N2, and hence, is not amplified byreceptor cooperativity (cf. Eq. (6)) in analogy to theintrinsic ligand noise arising from random switching ofthe receptor complex in Eq. (20). The second term inEq. (23) is idential to Eq. (20) and describes the con-tribution from diffusion (R), as released and taken upligand molecules lead to additional uncertainty in ligandconcentration.
So far the contribution to the uncertainty from ran-dom binding and unbinding of ligand molecules (L) tothe receptor complex is still missing. To avoid the com-plexity of different rates for the on and off states, weassume diffusion-limited binding to the receptor clusterand write for the additional uncertainty [31, 35]
〈(δc)2〉Lτc2
=1
4πDRscτ, (24)
calculated from Poisson statistics and the diffusive fluxto an absorbing sphere of radius Rs, which represents thedimension of the receptor cluster. Eq. (24) is consideredthe fundamental physical limit of sensing as it cannot bereduced by any intracellular sensing mechanism. Thisextrinsic noise is amplified due to the absence of a N2
factor in the denominator.In summary, intrinsic and extrinsic noise affect the
uncertainty of sensing differently, i.e. only extrinsic
noise is amplified. In the next section, we consider anintegrative model of extrinsic ligand noise and intrinsicnoise from receptor methylation/demethylation noise.The receptor-complex switching noise is much smallerdue to the large switching rates and hence is assumedto be averaged out. By using the receptor activityof the whole cell as a read-out of signaling, we areable to compare the properties of stimulus and noisetransmission.
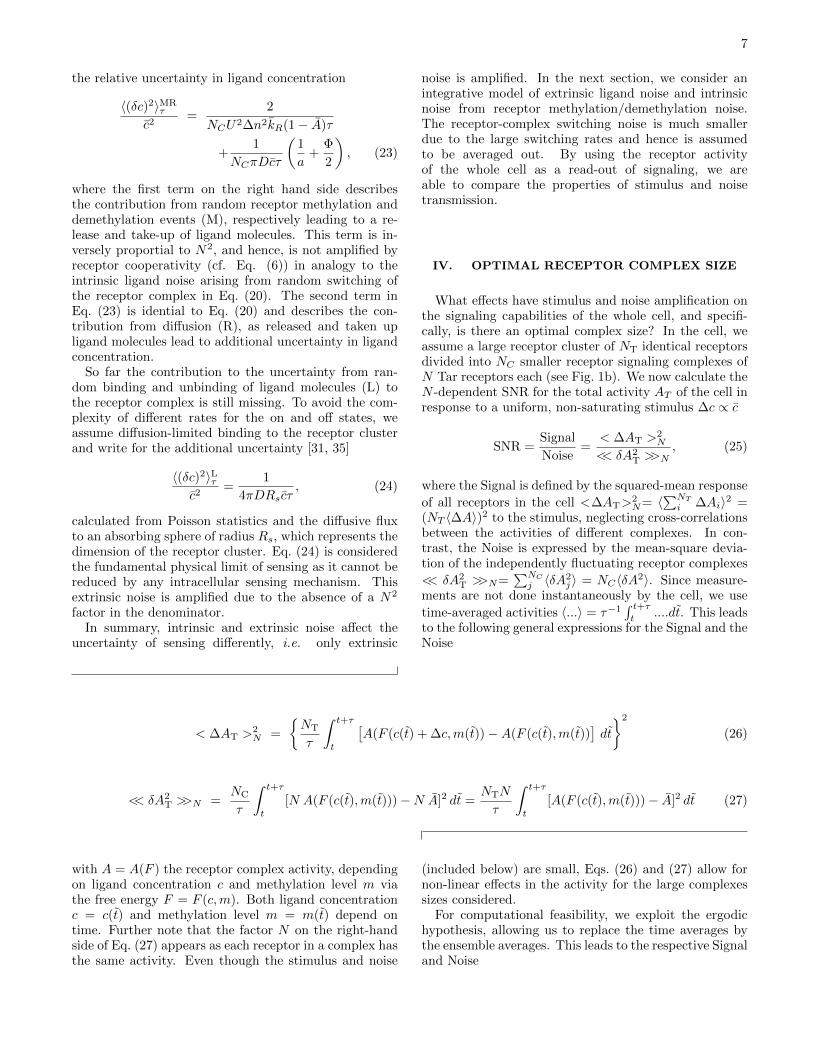
IV. OPTIMAL RECEPTOR COMPLEX SIZE
What effects have stimulus and noise amplification onthe signaling capabilities of the whole cell, and specifi-cally, is there an optimal complex size? In the cell, weassume a large receptor cluster of NT identical receptorsdivided into NC smaller receptor signaling complexes ofN Tar receptors each (see Fig. 1b). We now calculate theN -dependent SNR for the total activity AT of the cell inresponse to a uniform, non-saturating stimulus ∆c ∝ c
SNR =Signal
Noise=
< ∆AT >2N
<< δA2T >>N
, (25)
where the Signal is defined by the squared-mean response
of all receptors in the cell <∆AT>2N= 〈
∑NTi ∆Ai〉2 =
(NT 〈∆A〉)2 to the stimulus, neglecting cross-correlationsbetween the activities of different complexes. In con-trast, the Noise is expressed by the mean-square devia-tion of the independently fluctuating receptor complexes
<< δA2T >>N=
∑NCj 〈δA2
j 〉 = NC〈δA2〉. Since measure-ments are not done instantaneously by the cell, we use
time-averaged activities 〈...〉 = τ−1∫ t+τt
....dt. This leadsto the following general expressions for the Signal and theNoise
< ∆AT >2N =
NT
τ
∫ t+τ
t
[A(F (c(t) + ∆c,m(t))−A(F (c(t),m(t))
]dt
2
(26)
<< δA2T >>N =
NC
τ
∫ t+τ
t
[N A(F (c(t),m(t)))−N A]2 dt =NTN
τ
∫ t+τ
t
[A(F (c(t),m(t)))− A]2 dt (27)
with A = A(F ) the receptor complex activity, dependingon ligand concentration c and methylation level m viathe free energy F = F (c,m). Both ligand concentrationc = c(t) and methylation level m = m(t) depend ontime. Further note that the factor N on the right-handside of Eq. (27) appears as each receptor in a complex hasthe same activity. Even though the stimulus and noise
(included below) are small, Eqs. (26) and (27) allow fornon-linear effects in the activity for the large complexessizes considered.
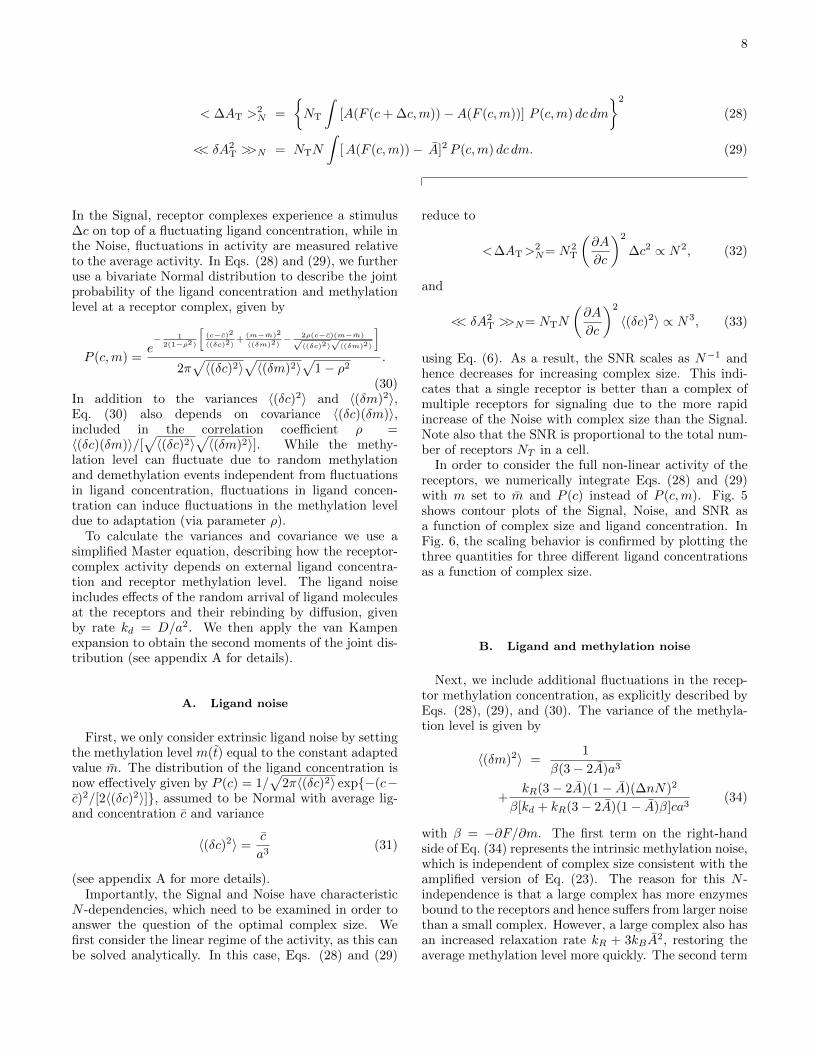
For computational feasibility, we exploit the ergodichypothesis, allowing us to replace the time averages bythe ensemble averages. This leads to the respective Signaland Noise
8
< ∆AT >2N =
NT
∫[A(F (c+ ∆c,m))−A(F (c,m))] P (c,m) dc dm
2
(28)
<< δA2T >>N = NTN
∫[A(F (c,m))− A]2 P (c,m) dc dm. (29)
In the Signal, receptor complexes experience a stimulus∆c on top of a fluctuating ligand concentration, while inthe Noise, fluctuations in activity are measured relativeto the average activity. In Eqs. (28) and (29), we furtheruse a bivariate Normal distribution to describe the jointprobability of the ligand concentration and methylationlevel at a receptor complex, given by
P (c,m) =e− 1
2(1−ρ2)
[(c−c)2
〈(δc)2〉+
(m−m)2
〈(δm)2〉− 2ρ(c−c)(m−m)√
〈(δc)2〉√〈(δm)2〉
]
2π√〈(δc)2〉
√〈(δm)2〉
√1− ρ2
.
(30)In addition to the variances 〈(δc)2〉 and 〈(δm)2〉,Eq. (30) also depends on covariance 〈(δc)(δm)〉,included in the correlation coefficient ρ =〈(δc)(δm)〉/[
√〈(δc)2〉
√〈(δm)2〉]. While the methy-
lation level can fluctuate due to random methylationand demethylation events independent from fluctuationsin ligand concentration, fluctuations in ligand concen-tration can induce fluctuations in the methylation leveldue to adaptation (via parameter ρ).
To calculate the variances and covariance we use asimplified Master equation, describing how the receptor-complex activity depends on external ligand concentra-tion and receptor methylation level. The ligand noiseincludes effects of the random arrival of ligand moleculesat the receptors and their rebinding by diffusion, givenby rate kd = D/a2. We then apply the van Kampenexpansion to obtain the second moments of the joint dis-tribution (see appendix A for details).
A. Ligand noise
First, we only consider extrinsic ligand noise by settingthe methylation level m(t) equal to the constant adaptedvalue m. The distribution of the ligand concentration isnow effectively given by P (c) = 1/
√2π〈(δc)2〉 exp−(c−
c)2/[2〈(δc)2〉], assumed to be Normal with average lig-and concentration c and variance
〈(δc)2〉 =c
a3(31)
(see appendix A for more details).Importantly, the Signal and Noise have characteristic
N -dependencies, which need to be examined in order toanswer the question of the optimal complex size. Wefirst consider the linear regime of the activity, as this canbe solved analytically. In this case, Eqs. (28) and (29)
reduce to
<∆AT>2N= N2
T
(∂A
∂c
)2
∆c2 ∝ N2, (32)
and
<< δA2T >>N= NTN
(∂A
∂c
)2
〈(δc)2〉 ∝ N3, (33)
using Eq. (6). As a result, the SNR scales as N−1 andhence decreases for increasing complex size. This indi-cates that a single receptor is better than a complex ofmultiple receptors for signaling due to the more rapidincrease of the Noise with complex size than the Signal.Note also that the SNR is proportional to the total num-ber of receptors NT in a cell.
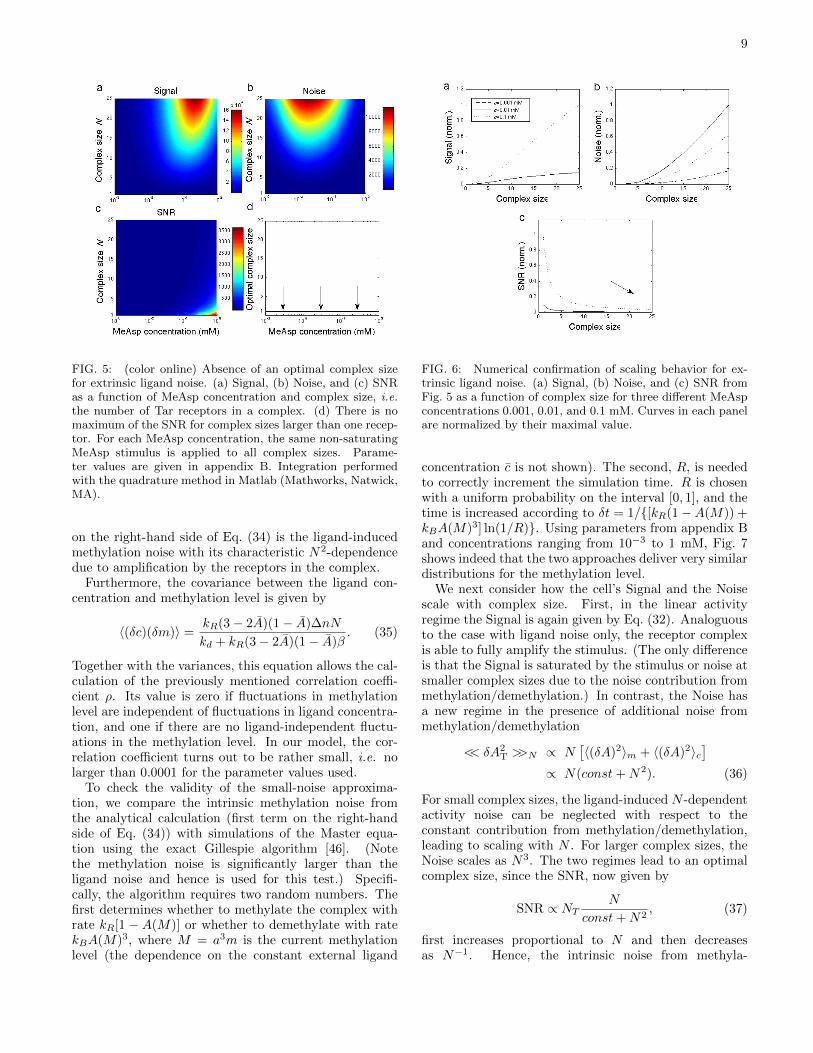
In order to consider the full non-linear activity of thereceptors, we numerically integrate Eqs. (28) and (29)with m set to m and P (c) instead of P (c,m). Fig. 5shows contour plots of the Signal, Noise, and SNR asa function of complex size and ligand concentration. InFig. 6, the scaling behavior is confirmed by plotting thethree quantities for three different ligand concentrationsas a function of complex size.
B. Ligand and methylation noise
Next, we include additional fluctuations in the recep-tor methylation concentration, as explicitly described byEqs. (28), (29), and (30). The variance of the methyla-tion level is given by
〈(δm)2〉 =1
β(3− 2A)a3
+kR(3− 2A)(1− A)(∆nN)2
β[kd + kR(3− 2A)(1− A)β]ca3(34)
with β = −∂F/∂m. The first term on the right-handside of Eq. (34) represents the intrinsic methylation noise,which is independent of complex size consistent with theamplified version of Eq. (23). The reason for this N -independence is that a large complex has more enzymesbound to the receptors and hence suffers from larger noisethan a small complex. However, a large complex also hasan increased relaxation rate kR + 3kBA
2, restoring theaverage methylation level more quickly. The second term
9
FIG. 5: (color online) Absence of an optimal complex sizefor extrinsic ligand noise. (a) Signal, (b) Noise, and (c) SNRas a function of MeAsp concentration and complex size, i.e.the number of Tar receptors in a complex. (d) There is nomaximum of the SNR for complex sizes larger than one recep-tor. For each MeAsp concentration, the same non-saturatingMeAsp stimulus is applied to all complex sizes. Parame-ter values are given in appendix B. Integration performedwith the quadrature method in Matlab (Mathworks, Natwick,MA).
on the right-hand side of Eq. (34) is the ligand-inducedmethylation noise with its characteristic N2-dependencedue to amplification by the receptors in the complex.
Furthermore, the covariance between the ligand con-centration and methylation level is given by
〈(δc)(δm)〉 =kR(3− 2A)(1− A)∆nN
kd + kR(3− 2A)(1− A)β. (35)
Together with the variances, this equation allows the cal-culation of the previously mentioned correlation coeffi-cient ρ. Its value is zero if fluctuations in methylationlevel are independent of fluctuations in ligand concentra-tion, and one if there are no ligand-independent fluctu-ations in the methylation level. In our model, the cor-relation coefficient turns out to be rather small, i.e. nolarger than 0.0001 for the parameter values used.
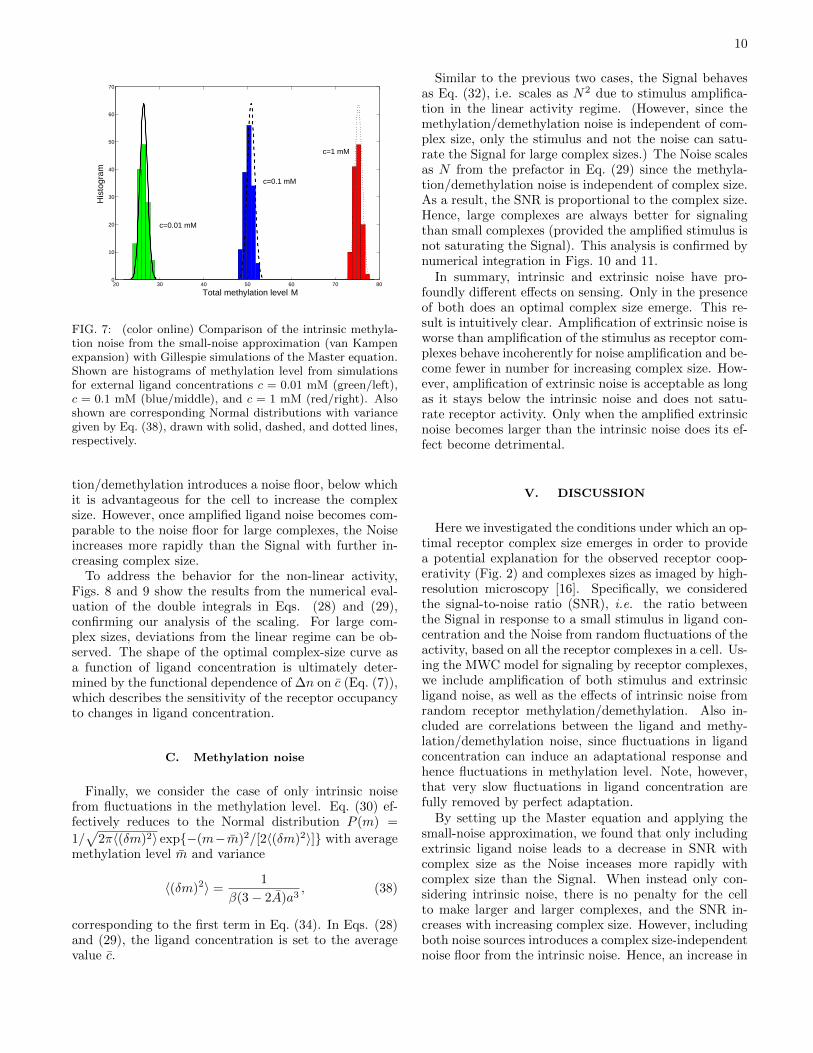
To check the validity of the small-noise approxima-tion, we compare the intrinsic methylation noise fromthe analytical calculation (first term on the right-handside of Eq. (34)) with simulations of the Master equa-tion using the exact Gillespie algorithm [46]. (Notethe methylation noise is significantly larger than theligand noise and hence is used for this test.) Specifi-cally, the algorithm requires two random numbers. Thefirst determines whether to methylate the complex withrate kR[1 − A(M)] or whether to demethylate with ratekBA(M)3, where M = a3m is the current methylationlevel (the dependence on the constant external ligand
FIG. 6: Numerical confirmation of scaling behavior for ex-trinsic ligand noise. (a) Signal, (b) Noise, and (c) SNR fromFig. 5 as a function of complex size for three different MeAspconcentrations 0.001, 0.01, and 0.1 mM. Curves in each panelare normalized by their maximal value.
concentration c is not shown). The second, R, is neededto correctly increment the simulation time. R is chosenwith a uniform probability on the interval [0, 1], and thetime is increased according to δt = 1/[kR(1−A(M)) +kBA(M)3] ln(1/R). Using parameters from appendix Band concentrations ranging from 10−3 to 1 mM, Fig. 7shows indeed that the two approaches deliver very similardistributions for the methylation level.
We next consider how the cell’s Signal and the Noisescale with complex size. First, in the linear activityregime the Signal is again given by Eq. (32). Analoguousto the case with ligand noise only, the receptor complexis able to fully amplify the stimulus. (The only differenceis that the Signal is saturated by the stimulus or noise atsmaller complex sizes due to the noise contribution frommethylation/demethylation.) In contrast, the Noise hasa new regime in the presence of additional noise frommethylation/demethylation
<< δA2T >>N ∝ N
[〈(δA)2〉m + 〈(δA)2〉c
]∝ N(const+N2). (36)
For small complex sizes, the ligand-induced N -dependentactivity noise can be neglected with respect to theconstant contribution from methylation/demethylation,leading to scaling with N . For larger complex sizes, theNoise scales as N3. The two regimes lead to an optimalcomplex size, since the SNR, now given by
SNR ∝ NTN
const+N2, (37)
first increases proportional to N and then decreasesas N−1. Hence, the intrinsic noise from methyla-
10
20 30 40 50 60 70 800
10
20
30
40
50
60
70
Total methylation level M
His
togr
am
c=1 mM
c=0.01 mM
c=0.1 mM
FIG. 7: (color online) Comparison of the intrinsic methyla-tion noise from the small-noise approximation (van Kampenexpansion) with Gillespie simulations of the Master equation.Shown are histograms of methylation level from simulationsfor external ligand concentrations c = 0.01 mM (green/left),c = 0.1 mM (blue/middle), and c = 1 mM (red/right). Alsoshown are corresponding Normal distributions with variancegiven by Eq. (38), drawn with solid, dashed, and dotted lines,respectively.
tion/demethylation introduces a noise floor, below whichit is advantageous for the cell to increase the complexsize. However, once amplified ligand noise becomes com-parable to the noise floor for large complexes, the Noiseincreases more rapidly than the Signal with further in-creasing complex size.
To address the behavior for the non-linear activity,Figs. 8 and 9 show the results from the numerical eval-uation of the double integrals in Eqs. (28) and (29),confirming our analysis of the scaling. For large com-plex sizes, deviations from the linear regime can be ob-served. The shape of the optimal complex-size curve asa function of ligand concentration is ultimately deter-mined by the functional dependence of ∆n on c (Eq. (7)),which describes the sensitivity of the receptor occupancyto changes in ligand concentration.
C. Methylation noise
Finally, we consider the case of only intrinsic noisefrom fluctuations in the methylation level. Eq. (30) ef-fectively reduces to the Normal distribution P (m) =
1/√
2π〈(δm)2〉 exp−(m−m)2/[2〈(δm)2〉] with averagemethylation level m and variance
〈(δm)2〉 =1
β(3− 2A)a3, (38)
corresponding to the first term in Eq. (34). In Eqs. (28)and (29), the ligand concentration is set to the averagevalue c.
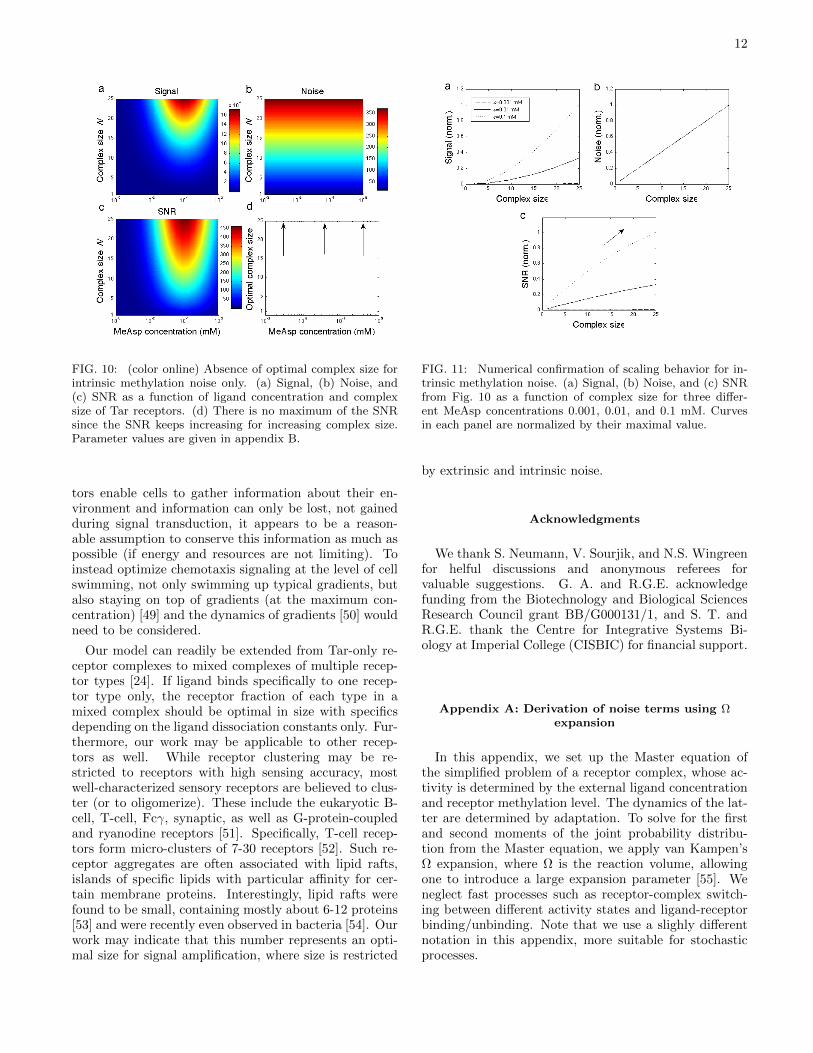
Similar to the previous two cases, the Signal behavesas Eq. (32), i.e. scales as N2 due to stimulus amplifica-tion in the linear activity regime. (However, since themethylation/demethylation noise is independent of com-plex size, only the stimulus and not the noise can satu-rate the Signal for large complex sizes.) The Noise scalesas N from the prefactor in Eq. (29) since the methyla-tion/demethylation noise is independent of complex size.As a result, the SNR is proportional to the complex size.Hence, large complexes are always better for signalingthan small complexes (provided the amplified stimulus isnot saturating the Signal). This analysis is confirmed bynumerical integration in Figs. 10 and 11.
In summary, intrinsic and extrinsic noise have pro-foundly different effects on sensing. Only in the presenceof both does an optimal complex size emerge. This re-sult is intuitively clear. Amplification of extrinsic noise isworse than amplification of the stimulus as receptor com-plexes behave incoherently for noise amplification and be-come fewer in number for increasing complex size. How-ever, amplification of extrinsic noise is acceptable as longas it stays below the intrinsic noise and does not satu-rate receptor activity. Only when the amplified extrinsicnoise becomes larger than the intrinsic noise does its ef-fect become detrimental.
V. DISCUSSION
Here we investigated the conditions under which an op-timal receptor complex size emerges in order to providea potential explanation for the observed receptor coop-erativity (Fig. 2) and complexes sizes as imaged by high-resolution microscopy [16]. Specifically, we consideredthe signal-to-noise ratio (SNR), i.e. the ratio betweenthe Signal in response to a small stimulus in ligand con-centration and the Noise from random fluctuations of theactivity, based on all the receptor complexes in a cell. Us-ing the MWC model for signaling by receptor complexes,we include amplification of both stimulus and extrinsicligand noise, as well as the effects of intrinsic noise fromrandom receptor methylation/demethylation. Also in-cluded are correlations between the ligand and methy-lation/demethylation noise, since fluctuations in ligandconcentration can induce an adaptational response andhence fluctuations in methylation level. Note, however,that very slow fluctuations in ligand concentration arefully removed by perfect adaptation.
By setting up the Master equation and applying thesmall-noise approximation, we found that only includingextrinsic ligand noise leads to a decrease in SNR withcomplex size as the Noise inceases more rapidly withcomplex size than the Signal. When instead only con-sidering intrinsic noise, there is no penalty for the cellto make larger and larger complexes, and the SNR in-creases with increasing complex size. However, includingboth noise sources introduces a complex size-independentnoise floor from the intrinsic noise. Hence, an increase in
11
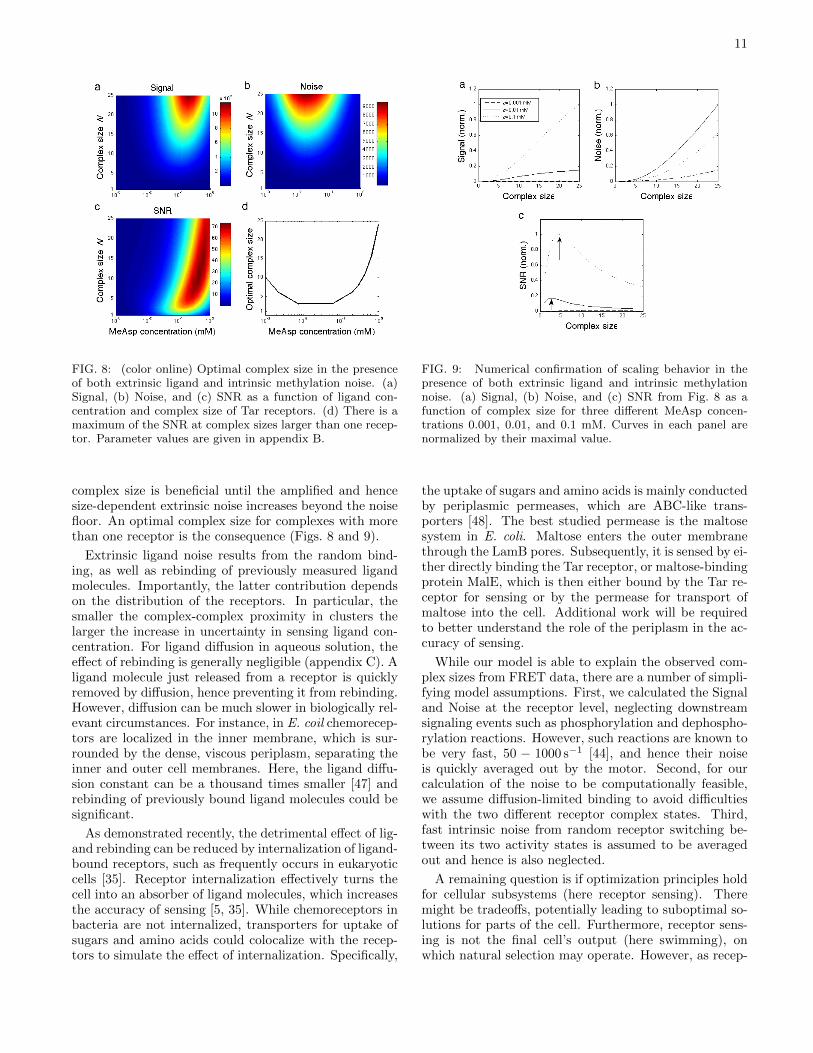
FIG. 8: (color online) Optimal complex size in the presenceof both extrinsic ligand and intrinsic methylation noise. (a)Signal, (b) Noise, and (c) SNR as a function of ligand con-centration and complex size of Tar receptors. (d) There is amaximum of the SNR at complex sizes larger than one recep-tor. Parameter values are given in appendix B.
complex size is beneficial until the amplified and hencesize-dependent extrinsic noise increases beyond the noisefloor. An optimal complex size for complexes with morethan one receptor is the consequence (Figs. 8 and 9).
Extrinsic ligand noise results from the random bind-ing, as well as rebinding of previously measured ligandmolecules. Importantly, the latter contribution dependson the distribution of the receptors. In particular, thesmaller the complex-complex proximity in clusters thelarger the increase in uncertainty in sensing ligand con-centration. For ligand diffusion in aqueous solution, theeffect of rebinding is generally negligible (appendix C). Aligand molecule just released from a receptor is quicklyremoved by diffusion, hence preventing it from rebinding.However, diffusion can be much slower in biologically rel-evant circumstances. For instance, in E. coil chemorecep-tors are localized in the inner membrane, which is sur-rounded by the dense, viscous periplasm, separating theinner and outer cell membranes. Here, the ligand diffu-sion constant can be a thousand times smaller [47] andrebinding of previously bound ligand molecules could besignificant.
As demonstrated recently, the detrimental effect of lig-and rebinding can be reduced by internalization of ligand-bound receptors, such as frequently occurs in eukaryoticcells [35]. Receptor internalization effectively turns thecell into an absorber of ligand molecules, which increasesthe accuracy of sensing [5, 35]. While chemoreceptors inbacteria are not internalized, transporters for uptake ofsugars and amino acids could colocalize with the recep-tors to simulate the effect of internalization. Specifically,
FIG. 9: Numerical confirmation of scaling behavior in thepresence of both extrinsic ligand and intrinsic methylationnoise. (a) Signal, (b) Noise, and (c) SNR from Fig. 8 as afunction of complex size for three different MeAsp concen-trations 0.001, 0.01, and 0.1 mM. Curves in each panel arenormalized by their maximal value.
the uptake of sugars and amino acids is mainly conductedby periplasmic permeases, which are ABC-like trans-porters [48]. The best studied permease is the maltosesystem in E. coli. Maltose enters the outer membranethrough the LamB pores. Subsequently, it is sensed by ei-ther directly binding the Tar receptor, or maltose-bindingprotein MalE, which is then either bound by the Tar re-ceptor for sensing or by the permease for transport ofmaltose into the cell. Additional work will be requiredto better understand the role of the periplasm in the ac-curacy of sensing.
While our model is able to explain the observed com-plex sizes from FRET data, there are a number of simpli-fying model assumptions. First, we calculated the Signaland Noise at the receptor level, neglecting downstreamsignaling events such as phosphorylation and dephospho-rylation reactions. However, such reactions are known tobe very fast, 50 − 1000 s−1 [44], and hence their noiseis quickly averaged out by the motor. Second, for ourcalculation of the noise to be computationally feasible,we assume diffusion-limited binding to avoid difficultieswith the two different receptor complex states. Third,fast intrinsic noise from random receptor switching be-tween its two activity states is assumed to be averagedout and hence is also neglected.
A remaining question is if optimization principles holdfor cellular subsystems (here receptor sensing). Theremight be tradeoffs, potentially leading to suboptimal so-lutions for parts of the cell. Furthermore, receptor sens-ing is not the final cell’s output (here swimming), onwhich natural selection may operate. However, as recep-
12
FIG. 10: (color online) Absence of optimal complex size forintrinsic methylation noise only. (a) Signal, (b) Noise, and(c) SNR as a function of ligand concentration and complexsize of Tar receptors. (d) There is no maximum of the SNRsince the SNR keeps increasing for increasing complex size.Parameter values are given in appendix B.
tors enable cells to gather information about their en-vironment and information can only be lost, not gainedduring signal transduction, it appears to be a reason-able assumption to conserve this information as much aspossible (if energy and resources are not limiting). Toinstead optimize chemotaxis signaling at the level of cellswimming, not only swimming up typical gradients, butalso staying on top of gradients (at the maximum con-centration) [49] and the dynamics of gradients [50] wouldneed to be considered.
Our model can readily be extended from Tar-only re-ceptor complexes to mixed complexes of multiple recep-tor types [24]. If ligand binds specifically to one recep-tor type only, the receptor fraction of each type in amixed complex should be optimal in size with specificsdepending on the ligand dissociation constants only. Fur-thermore, our work may be applicable to other recep-tors as well. While receptor clustering may be re-stricted to receptors with high sensing accuracy, mostwell-characterized sensory receptors are believed to clus-ter (or to oligomerize). These include the eukaryotic B-cell, T-cell, Fcγ, synaptic, as well as G-protein-coupledand ryanodine receptors [51]. Specifically, T-cell recep-tors form micro-clusters of 7-30 receptors [52]. Such re-ceptor aggregates are often associated with lipid rafts,islands of specific lipids with particular affinity for cer-tain membrane proteins. Interestingly, lipid rafts werefound to be small, containing mostly about 6-12 proteins[53] and were recently even observed in bacteria [54]. Ourwork may indicate that this number represents an opti-mal size for signal amplification, where size is restricted
FIG. 11: Numerical confirmation of scaling behavior for in-trinsic methylation noise. (a) Signal, (b) Noise, and (c) SNRfrom Fig. 10 as a function of complex size for three differ-ent MeAsp concentrations 0.001, 0.01, and 0.1 mM. Curvesin each panel are normalized by their maximal value.
by extrinsic and intrinsic noise.
Acknowledgments
We thank S. Neumann, V. Sourjik, and N.S. Wingreenfor helful discussions and anonymous referees forvaluable suggestions. G. A. and R.G.E. acknowledgefunding from the Biotechnology and Biological SciencesResearch Council grant BB/G000131/1, and S. T. andR.G.E. thank the Centre for Integrative Systems Bi-ology at Imperial College (CISBIC) for financial support.
Appendix A: Derivation of noise terms using Ωexpansion
In this appendix, we set up the Master equation ofthe simplified problem of a receptor complex, whose ac-tivity is determined by the external ligand concentrationand receptor methylation level. The dynamics of the lat-ter are determined by adaptation. To solve for the firstand second moments of the joint probability distribu-tion from the Master equation, we apply van Kampen’sΩ expansion, where Ω is the reaction volume, allowingone to introduce a large expansion parameter [55]. Weneglect fast processes such as receptor-complex switch-ing between different activity states and ligand-receptorbinding/unbinding. Note that we use a slighly differentnotation in this appendix, more suitable for stochasticprocesses.
13
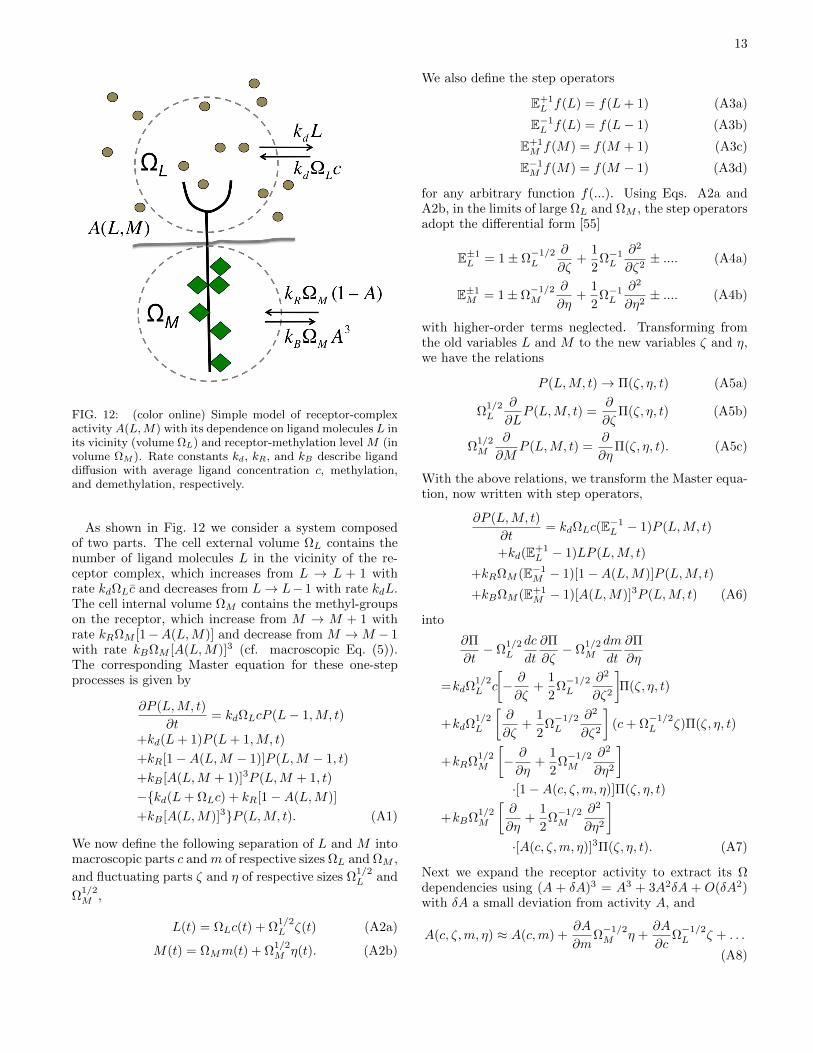
FIG. 12: (color online) Simple model of receptor-complexactivity A(L,M) with its dependence on ligand molecules L inits vicinity (volume ΩL) and receptor-methylation level M (involume ΩM ). Rate constants kd, kR, and kB describe liganddiffusion with average ligand concentration c, methylation,and demethylation, respectively.
As shown in Fig. 12 we consider a system composedof two parts. The cell external volume ΩL contains thenumber of ligand molecules L in the vicinity of the re-ceptor complex, which increases from L → L + 1 withrate kdΩLc and decreases from L→ L−1 with rate kdL.The cell internal volume ΩM contains the methyl-groupson the receptor, which increase from M → M + 1 withrate kRΩM [1−A(L,M)] and decrease from M →M − 1with rate kBΩM [A(L,M)]3 (cf. macroscopic Eq. (5)).The corresponding Master equation for these one-stepprocesses is given by
∂P (L,M, t)
∂t= kdΩLcP (L− 1,M, t)
+kd(L+ 1)P (L+ 1,M, t)
+kR[1−A(L,M − 1)]P (L,M − 1, t)
+kB [A(L,M + 1)]3P (L,M + 1, t)
−kd(L+ ΩLc) + kR[1−A(L,M)]
+kB [A(L,M)]3P (L,M, t). (A1)
We now define the following separation of L and M intomacroscopic parts c andm of respective sizes ΩL and ΩM ,
and fluctuating parts ζ and η of respective sizes Ω1/2L and
Ω1/2M ,
L(t) = ΩLc(t) + Ω1/2L ζ(t) (A2a)
M(t) = ΩMm(t) + Ω1/2M η(t). (A2b)
We also define the step operators
E+1L f(L) = f(L+ 1) (A3a)
E−1L f(L) = f(L− 1) (A3b)
E+1M f(M) = f(M + 1) (A3c)
E−1M f(M) = f(M − 1) (A3d)
for any arbitrary function f(...). Using Eqs. A2a andA2b, in the limits of large ΩL and ΩM , the step operatorsadopt the differential form [55]
E±1L = 1± Ω
−1/2L
∂
∂ζ+
1
2Ω−1L
∂2
∂ζ2± .... (A4a)
E±1M = 1± Ω
−1/2M
∂
∂η+
1
2Ω−1L
∂2
∂η2± .... (A4b)
with higher-order terms neglected. Transforming fromthe old variables L and M to the new variables ζ and η,we have the relations
P (L,M, t)→ Π(ζ, η, t) (A5a)
Ω1/2L
∂
∂LP (L,M, t) =
∂
∂ζΠ(ζ, η, t) (A5b)
Ω1/2M
∂
∂MP (L,M, t) =
∂
∂ηΠ(ζ, η, t). (A5c)
With the above relations, we transform the Master equa-tion, now written with step operators,
∂P (L,M, t)
∂t= kdΩLc(E−1
L − 1)P (L,M, t)
+kd(E+1L − 1)LP (L,M, t)
+kRΩM (E−1M − 1)[1−A(L,M)]P (L,M, t)
+kBΩM (E+1M − 1)[A(L,M)]3P (L,M, t) (A6)
into
∂Π
∂t− Ω
1/2L
dc
dt
∂Π
∂ζ− Ω
1/2M
dm
dt
∂Π
∂η
=kdΩ1/2L c
[− ∂
∂ζ+
1
2Ω−1/2L
∂2
∂ζ2
]Π(ζ, η, t)
+kdΩ1/2L
[∂
∂ζ+
1
2Ω−1/2L
∂2
∂ζ2
](c+ Ω
−1/2L ζ)Π(ζ, η, t)
+kRΩ1/2M
[− ∂
∂η+
1
2Ω−1/2M
∂2
∂η2
]·[1−A(c, ζ,m, η)]Π(ζ, η, t)
+kBΩ1/2M
[∂
∂η+
1
2Ω−1/2M
∂2
∂η2
]·[A(c, ζ,m, η)]3Π(ζ, η, t). (A7)
Next we expand the receptor activity to extract its Ωdependencies using (A + δA)3 = A3 + 3A2δA + O(δA2)with δA a small deviation from activity A, and
A(c, ζ,m, η) ≈ A(c,m) +∂A
∂mΩ−1/2M η +
∂A
∂cΩ−1/2L ζ + . . .
(A8)
14
Putting everything together, the terms proportional to
Ω1/2L produce the macroscopic equation dc/dt = 0, which
indicates that the ligand concentration c is already at
steady state, and the terms proportional to Ω1/2M produce
dm/dt = kR(1−A)− kBA3 (cf. Eq. (5)).Importantly, from Eq. (A7) it is possible to derive
equations for the mean value of the fluctuations as wellas for the correlations of these fluctuations. AssumingΩL = ΩM = Ω, we first collect all the terms proportionalto Ω0 in Eq. (A7), which yields
∂Π
∂t= kd
[c∂2
∂ζ2+
∂
∂ζζ
]Π
+1
2
kR[1−A(c,m)] + kB [A(c,m)]3
∂2Π
∂η2
+kR
∂A
∂m+
[∂A
∂cζ +
∂A
∂mη
]∂
∂η
Π
+3kB [A(c,m)]2∂A
∂m+
[∂A
∂cζ +
∂A
∂mη
]∂
∂η
Π. (A9)
Next, multiplying by ζ and integrating over ζ and η (us-ing intergation by parts), produces
∂〈ζ〉∂t
= −kd〈ζ〉. (A10)
The analoguous procedure for η produces
∂〈η〉∂t
= −(kR + 3kBA2)
[∂A
∂m〈η〉+
∂A
∂c〈ζ〉]. (A11)
Furthermore, multiplying Eq. (A9) by ζ2, η2, and ζη withsubsequent integration yields, respectively,
∂〈ζ2〉∂t
= −2kd〈ζ2〉+ 2kdc (A12)
∂〈η2〉∂t
= kR(1−A) + kBA3
−2(kR + 3kBA
2) ∂A∂m〈η2〉
−2(kR + 3kBA2)∂A
∂c〈ζη〉 (A13)
∂〈ζη〉∂t
= −[kd +
(kR + 3kBA
2) ∂A∂m
]〈ζη〉
−(kR + 3kBA2)∂A
∂c〈ζ2〉. (A14)
At steady state, we finally obtain
〈ζ2〉s = c (A15)
〈η2〉s =1
β(3− 2A)
+kR(3− 2A)(1− A)(∆nN)2
[kd + kR(3− 2A)(1− A)β]cβ(A16)
〈ζη〉s =kR(3− 2A)(1− A)∆nN
kd + kR(3− 2A)(1− A)β(A17)
with their characteristic N -dependencies, A the adaptedsteady-state activity, and ∆n and β defined in Sec. II.The corresponding quantities expressed in the originalvariables, i.e. 〈(δL)2〉, 〈(δM)2〉, and 〈(δL)(δM)〉 areproduced by multiplication of Eqs. A15-A17 with Ω.For instance, 〈(δL)2〉 = 〈L〉, or 〈(δc)2〉 = c/Ω ∼ c/(a3)with a the dimension of volume Ω, is indicative of asimple Poisson process and describes the instantaneous,total fluctuations in ligand concentration.
Appendix B: Parameter values
Here we provide the parameter values used for the re-sults from section IV, presented in Figs. 5-11: a = 100nm(dimension of receptor complex) [17, 18], β = a3/2 (en-ergy contribution per methyl group to receptor freeenergy) [20], kRa
3 = 0.1 s−1 and kBa3 = 2.2 s−1
(methylation and demethylation rates) [40, 44], A = 1/3(resulting adapted complex activity), kf = 103 s−1 andkb = 2 · 103 s−1 (rates for complex switching) [56],D = 300µm2/s (diffusion constant for molecules inaqueous solution)[5], NT = 3000 (number of receptorsper cell) [57], Kon
D = 0.5mM and KoffD = 0.02mM (MeAsp
dissociation constants for Tar in the on and off states)[24].
Appendix C: Effect of receptor distribution onuncertainty
To estimate the magnitude of the structure factor Φ inEqs. (20) and (23), and hence the importance of ligandrebinding to the uncertainty of sensing ligand concen-tration, we apply the following algorithm for uniformelydistributing NC points (complexes) on a sphere. The al-gorithm divides the sphere in NC parallels and places apoint on each parallel at positions given by the followingequations in spherical coordinates [58]
hk = −1 + 2(k − 1)/(NC − 1) 1 ≤ k ≤ NC (C1a)
θk = arccoshk (C1b)
φk =
(φk−1 +
3.6√NC
1√1− hk
)(mod 2π). (C1c)
The number 3.6 in the algorithm can, in principle, be ad-justed appropriately for the application at hand but de-rives essentially from best packing algorithms. The sim-ple algorithm adopted here distributes the points spirallyaround the sphere and gives a good results in accordancewith more sophisticated algorithms based on energy min-imization between point charges on the sphere or bestpacking criteria, as long as NC > 100 and NC < 12000.
To represent the polar receptor cluster, we choose asmall sphere of radius RS = 75nm [18]. As a result,the structure factor for the small sphere is given by
15
ΦS = 4.77 · 109m−1. In contrast, to represent recep-tor complexes evenly distributed over the cell surface, weuse a large sphere of radius RL = 1.2µm, which leads toa smaller structure factor given by ΦL = 5.73 · 108m−1.Compared to rebinding to the same receptor, which is
proportional to 1/a = 107m−1 in Eq. (20), the polar re-ceptor cluster can significantly worsen the uncertainty ofsensing. However, for fast ligand diffusion in aqueoussolution, the rebinding terms are negligible compared tothe other contributions to the uncertainty.
[1] A. Raj and A. van Oudenaarden, Cell 135, 216 (2008).[2] V. Shahrezaei and P.S. Swain, Curr. Opin. Biotech. 19,
369 (2008).[3] H.C. Berg and E.M. Purcell EM, Biophys. J. 20, 193
(1977).[4] G. Tkacik, T. Gregor, and W. Bialek, PLoS One 3, e2774
(2008).[5] R.G. Endres, N.S. Wingreen, Proc. Natl. Acad. Sci. USA
105, 15749 (2008).[6] R. C. Yu et al., Nature 456, 755 (2008).[7] H. Mao, P.S. Cremer, M.D. Manson, Proc. Natl. Acad.
Sci. USA 100, 5449 (2003).[8] P.J.M. van Haastert, M. Postma, Biophys. J. 93, 1787
(2007).[9] C.L. Manahan, P.A. Iglesias, Y. Long, and P.N. De-
vreotes, Annu. Rev. Cell. Dev. Biol. 20, 223 (2004).[10] D. Mortimer et al. Proc. Natl. Acad. Sci. USA 106, 10296
(2009).[11] Y. Sykulev et al. Immunity 4, 565 (1996).[12] H.C. Berg, Physics Today 53, 24 (1999).[13] V. Sourjik V, Trends Microbiol. 12, 569 (2004).[14] P. Ames, C.A. Studdert, R.H. Reiser, and J.S. Parkinson,
Proc. Natl. Acad. Sci. USA. 99, 7060 (2002).[15] S. Thiem, D. Kentner and V. Sourjik, EMBO J. 26, 1615
(2007).[16] D. Greenfield, A.L. McEvoy, H. Shroff, G.E. Crooks, N.S.
Wingreen, E. Betzig, and J. Liphardt, PLoS Biol. 7,e1000137 (2009).
[17] A. Briegel, H.J. Ding, Z. Li, J. Werner, Z. Gitai, D.P.Dias, R.B. Jensen, and G. Jensen, Mol. Microbiol. 69,30 (2008).
[18] C.M. Khursigara, X. Wu, and S. Subramaniam, J. Bac-teriol. 190, 6805 (2008).
[19] R.G. Endres, Biophys. J. 96, 453 (2009).[20] R.G. Endres, O. Oleksiuk, C.H. Hansen, Y. Meir, V.
Sourjik, and N.S. Wingreen, Mol. Syst. Biol. 4, 211(2008).
[21] J. Monod, J. Wyman, J.P. Changeux, J. Mol. Biol. 12,88 (1965).
[22] V. Sourjik and H.C. Berg, Nature 428, 437 (2004).[23] B.A. Mello and Y. Tu, Proc. Natl. Acad. Sci. USA 102,
17354 (2005).[24] J.E. Keymer, R.G. Endres, M. Skoge, Y. Meir, and N.S.
Wingreen, Proc. Natl. Acad. Sci. USA 103, 1786 (2006).[25] M.L. Skoge, R.G. Endres, N.S. Wingreen, Biophys. J. 90,
4317 (2006).[26] T.A.J. Duke and D. Bray, Proc. Natl. Acad. Sci. USA
96, 10104 (1999).[27] B.A. Mello and Y. Tu, Proc. Natl. Acad. Sci. USA 100,
8223 (2003).[28] S. Schulmeister, M. Ruttorf, S. Thiem, D. Kentner, D.
Lebiedz, V. Sourjik, Proc. Natl. Acad. Sci. USA 105,6403 (2008).
[29] N. Delalez, J. Armitage, Mol. Microbiol. 71, 807 (2009).[30] W. Bialek and S. Setayeshgar, Proc. Natl. Acad. Sci. USA
102, 10040 (2005).[31] R.G. Endres and N.S. Wingreen, Prog. Biophys. Mol.
Biol. 100, 33 (2009).[32] R.G. Endres and N.S. Wingreen, Phys. Rev. Lett. 103,
158101.[33] W. Rappel and H. Levine, Phys. Rev. Lett. 100, 228101
(2008).[34] R. Kubo, Rep. Prog. Phys. 29, 255 (1966).[35] G. Aquino and R.G. Endres, Phys. Rev. E. 81, 021909
(2010).[36] M. Nishikawa and T. Shibata, PLoS One 5, e11224
(2010).[37] M. Li and G.L. Hazelbauer, J. Bacteriol. 186, 3687
(2004).[38] E. Korobkova, T. Emonet, J.M. Vilar, T.S. Shimizu, and
P. Cluzel, Nature 428, 574 (2004).[39] M. Li and G.L. Hazelbauer, Mol. Microbiol. 56, 1617
(2005).[40] R.G. Endres and N.S. Wingreen, Proc. Natl. Acad. Sci.
USA 103, 13040 (2006).[41] R.G. Endres, J.J. Falke, and N.S. Wingreen, PLoS Com-
put. Biol. 3, e150 (2007).[42] N. Barkai and S. Leibler, Nature 387, 913 (1997).[43] T. Yi, Y. Huang, M.I. Simon, and J. Doyle, Proc. Natl.
Acad. Sci. USA 97, 4649 (2000).[44] D. Clausznitzer, L. Lovdok, O. Oleksiuk, V. Sourjik, and
R.G. Endres, PLoS Comp.Biol. 6: e1000784.[45] W. Bialek, S. Setayeshgar, Phys. Rev. Lett. 100, 258101
(2008).[46] D. T. Gillespie, J. Phys. Chem. 81, 2340 (1977).[47] J.M. Brass et al., J. Bacteriol. 165, 787 (1986).[48] M.A. Hediger, J. Exp. Biol. 196, 15 (1994).[49] D.A. Clark and L.C. Grant, Proc. Natl. Acad. Sci. USA
102, 9150 (2005).[50] A. Celani and M. Vergassola, Proc. Natl. Acad. Sci. USA
107, 1391 (2010).[51] M. Cebecauer, M. Spitaler, A. Serge, and A.I. Magee, J.
Cell Sci. 123, 309 (2010).[52] B.F. Lillemeier, M.A. Mortelmaier, M.B. Forstner, J.B.
Huppa, J.T. Groves, M.M. Davis, Nat. Immunol. 11, 90(2010).
[53] T. Gurry, O. Kahramanoullari, R.G. Endres, PLoS One4, e6148 (2009).
[54] D. Lopez and R. Kolter, Genes Dev. 24, 1893 (2010).[55] N.G. van Kampen, Stochastic processes in physics and
chemistry (Elsevier, Amsterdam, 3rd edition, 2007).[56] P. Sharma P, R. Varma, R.C. Sarasij, Ira, K. Gousset,
G. Krishnamoorthy, M. Rao, S. Mayor, Cell 116, 577(2004).
[57] G.L. Hazelbauer, J.J. Falke, J.S. Parkinson, TrendsBiochem. Sci. 33, 9 (2008).
[58] E. B. Saff and A. B. J. Kuijlaars, Math. Intell. 19, 5(1997).