Optimal placement of TCSC for congestion management and ...
16
University of Windsor University of Windsor Scholarship at UWindsor Scholarship at UWindsor Electrical and Computer Engineering Publications Department of Electrical and Computer Engineering 4-1-2020 Optimal placement of TCSC for congestion management and Optimal placement of TCSC for congestion management and power loss reduction using multi-objective genetic algorithm power loss reduction using multi-objective genetic algorithm Thang Trung Nguyen Ton-Duc-Thang University Fazel Mohammadi University of Windsor Follow this and additional works at: https://scholar.uwindsor.ca/electricalengpub Part of the Electrical and Computer Engineering Commons Recommended Citation Recommended Citation Nguyen, Thang Trung and Mohammadi, Fazel. (2020). Optimal placement of TCSC for congestion management and power loss reduction using multi-objective genetic algorithm. Sustainability (Switzerland), 12 (7), 1-15. https://scholar.uwindsor.ca/electricalengpub/17 This Article is brought to you for free and open access by the Department of Electrical and Computer Engineering at Scholarship at UWindsor. It has been accepted for inclusion in Electrical and Computer Engineering Publications by an authorized administrator of Scholarship at UWindsor. For more information, please contact [email protected].
-
Upload
khangminh22 -
Category
Documents
-
view
0 -
download
0
Transcript of Optimal placement of TCSC for congestion management and ...

University of Windsor University of Windsor
Scholarship at UWindsor Scholarship at UWindsor
Electrical and Computer Engineering Publications
Department of Electrical and Computer Engineering
4-1-2020
Optimal placement of TCSC for congestion management and Optimal placement of TCSC for congestion management and
power loss reduction using multi-objective genetic algorithm power loss reduction using multi-objective genetic algorithm
Thang Trung Nguyen Ton-Duc-Thang University
Fazel Mohammadi University of Windsor
Follow this and additional works at: https://scholar.uwindsor.ca/electricalengpub
Part of the Electrical and Computer Engineering Commons
Recommended Citation Recommended Citation Nguyen, Thang Trung and Mohammadi, Fazel. (2020). Optimal placement of TCSC for congestion management and power loss reduction using multi-objective genetic algorithm. Sustainability (Switzerland), 12 (7), 1-15. https://scholar.uwindsor.ca/electricalengpub/17
This Article is brought to you for free and open access by the Department of Electrical and Computer Engineering at Scholarship at UWindsor. It has been accepted for inclusion in Electrical and Computer Engineering Publications by an authorized administrator of Scholarship at UWindsor. For more information, please contact [email protected].

sustainability
Article
Optimal Placement of TCSC for CongestionManagement and Power Loss Reduction UsingMulti-Objective Genetic Algorithm
Thang Trung Nguyen 1 and Fazel Mohammadi 2,*1 Power System Optimization Research Group, Faculty of Electrical and Electronics Engineering,
Ton Duc Thang University, Ho Chi Minh City 700000, Vietnam; [email protected] Electrical and Computer Engineering (ECE) Department, University of Windsor,
Windsor, ON N9B 1K3, Canada* Correspondence: [email protected] or [email protected]
Received: 20 February 2020; Accepted: 1 April 2020; Published: 2 April 2020�����������������
Abstract: Electricity demand has been growing due to the increase in the world populationand higher energy usage per capita as compared to the past. As a result, various methods havebeen proposed to increase the efficiency of power systems in terms of mitigating congestion andminimizing power losses. Power grids operating limitations result in congestion that specifies thefinal capacity of the system, which decreases the conventional power capabilities between coverageareas. Flexible AC Transmission Systems (FACTS) can help to decrease flows in heavily loadedlines and lead to lines loadability improvements and cost reduction. In this paper, total powerloss reduction and line congestion improvement are assessed by determining the optimal locationsand compensation rates of Thyristor-Controlled Series Compensator (TCSC) devices using theMulti-Objective Genetic Algorithm (MOGA). The results of applying the proposed method on theIEEE 30-bus test system confirmed the efficiency of the proposed procedure. In addition, to check theperformance, applicability, and effectiveness of the proposed method, different heuristic algorithms,such as the multi-objective Particle Swarm Optimization (PSO) algorithm, Differential Evolution (DE)algorithm, and Mixed-Integer Non-Linear Program (MINLP) technique, are used for comparison.The obtained results show the accuracy and fast convergence of the proposed method over the otherheuristic techniques.
Keywords: Congestion Management; FACTS devices; Multi-Objective Genetic Algorithm (MOGA);Power Loss Reduction; Thyristor-Controlled Series Compensator (TCSC)
1. Introduction
Electric power consumption growth and an open accessible energy market have caused powersystems to operate close to their nominal capacities. Also, the extension and development limits ofpower grids from things, such as installation issues, operating costs, and environmental concerns, havecaused many power systems to operate in overload conditions. In addition, power flow in differentparts of the grid is restricted by stability and reliability constraints. Therefore, the growth of line powerflow exceeding the allowable limits may cause power systems to collapse by random faults [1,2].
These concepts are investigated and studied through the power flow and congestion managementtopics [3,4]. Transmission lines congestion is a severe problem in power systems operation. The powergrid is called congested when some transmission lines operate outside of allowable limits, and asa result, generators may become inactive [5]. Various methods and equipment such as FlexibleAlternative Current Transmission Systems (FACTS) devices are reported to manage the active power
Sustainability 2020, 12, 2813; doi:10.3390/su12072813 www.mdpi.com/journal/sustainability

Sustainability 2020, 12, 2813 2 of 15
flow [6]. FACTS devices control the line power flow without any changes in the grid topology, leadingto improved performance, increased power transmission capacity, and reduced power grid congestion.Due to the considerable costs of FACTS devices and the maximum usage of their capabilities, theoptimal location of such devices should be determined accurately [7–10].
One of the technical challenges in deregulated power systems is congestion management.In [11], the operation of a Thyristor-Controlled Series Compensator (TCSC) for the optimization oftransmission lines and transmission line congestion is studied, by developing an algorithm to optimizethe performance index for contingency analysis and the location and control of TCSC. The optimalplacement of TCSC for improving power transmission efficiency and steady-state stability limits,and maintaining the voltage stability of power systems, is reported in [12]. A method to deal withcongestion management by controlling the DC power flow using TCSC is also reported in [13]. In [14],a TCSC is utilized to improve transient stability and congestion management in power systems. In [15],an approach to optimize the location and size of TCSC and, accordingly, reduce the congestion inpower systems is investigated. In [16], an approach to find the optimal location and size of a TCSC forcongestion management and for enhancing the power transfer capability of power transmission lines,by considering a variable reactance model of the TCSC at the steady-state condition, is investigated.In [17], TCSC location is formulated as the Mixed-Integer Non-Linear Program (MINLP), and anapproach for the optimal location and size of TCSC is proposed. In [18], TCSC placement is consideredto improve the power transmission line loading parameter, reduce power losses, and improve thevoltage stability of power systems. Additionally, the obtained results are compared with allocatingthe Static VAR Compensator (SVC) for congestion management. The optimal placement and size ofTCSC in power systems to reduce the risks in power grid operation is discussed in [19]. The optimalallocation of TCSCs for congestion management is also studied in [20–23] for different applications.
Moreover, total power loss reduction is another important criterion, which should be taken intoconsideration along with congestion management. In [24], the aim is to reduce power system losses,including switching losses, through economic TCSC installation. Considering short-circuit level andpower loss reduction as the two objective functions of the Particle Swarm Optimization (PSO) algorithm,the allocation of TCSC is studied in [25]. In [26], the objective is to provide adequate compensation toreduce the power system losses and improve the voltage profile by finding the optimal location ofFACTS devices, including TCSC. As in [26], the optimal allocation of TCSC by checking the sensitivityindices for power loss reduction and voltage profile improvement is investigated in [27].
Congestion management is a systematic approach to schedule and balance the generation andload levels, considering transmission line constraints. Therefore, congestion management in powersystems should be continuously investigated due to the fact that changing the generation and loadlevels can change the location of TCSC. As a result, congestion management requires a fast convergencetechnique that can obtain optimal solutions. Hence, having a long convergence criterion (number ofiterations or computation time) is one of the main drawbacks of other research studies. In addition,obtaining a locally optimal solution instead of a globally optimal one is another issue in this regard.Neglecting non-linear relationships between the parameters of power systems is another issue in otherresearch studies.
To address the above-mentioned issues, this paper aims to optimally allocate TCSCs and theirsusceptance values, considering power loss reduction, congestion management, and the determinationof the power lines compensation rates. The main contributions of this work are (1) to consider thestructure of TCSC and the AC characteristics of power systems, formulate a nonlinear problem, andsolve it using a heuristic algorithm, and (2) determine the optimal allocation and rating of TCSC throughan optimization procedure. The Jacobian sensitivity approach and AC load flow are used for linecongestion evaluations. The Multi-Objective Genetic Algorithm (MOGA) is used as an optimizationmethod to determine the optimal locations and susceptance values of TCSCs. To the best of the authors’knowledge, the consideration of power loss reduction, congestion management, and the determinationof the power line compensation rates have never been used to optimally allocate TCSCs and their
Sustainability 2020, 12, 2813 3 of 15
susceptance values. The proposed method is deployed on the IEEE 30-bus test system, and the resultsare investigated to illustrate the applicability and effectiveness of the proposed method. In addition,the obtained results are compared with those from different algorithms, such as the multi-objectivePSO algorithm, Differential Evolution (DE) algorithm, and MINLP technique. The obtained resultsshow the superiorities of the proposed method, in terms of fast convergence and high accuracy, overthe other heuristic methods.
The rest of this paper is organized as follows. Section 2 presents the structure and model of TCSCs.The calculations of the power congestion indices of transmission lines are presented in Section 3.Section 4 describes the proposed Multi-Objective Genetic Algorithm (MOGA) and variable codingprocedures. The simulation results and discussions are presented in Section 5. Finally, the conclusionsare summarized in Section 6.
2. Structure and Model of the TCSC
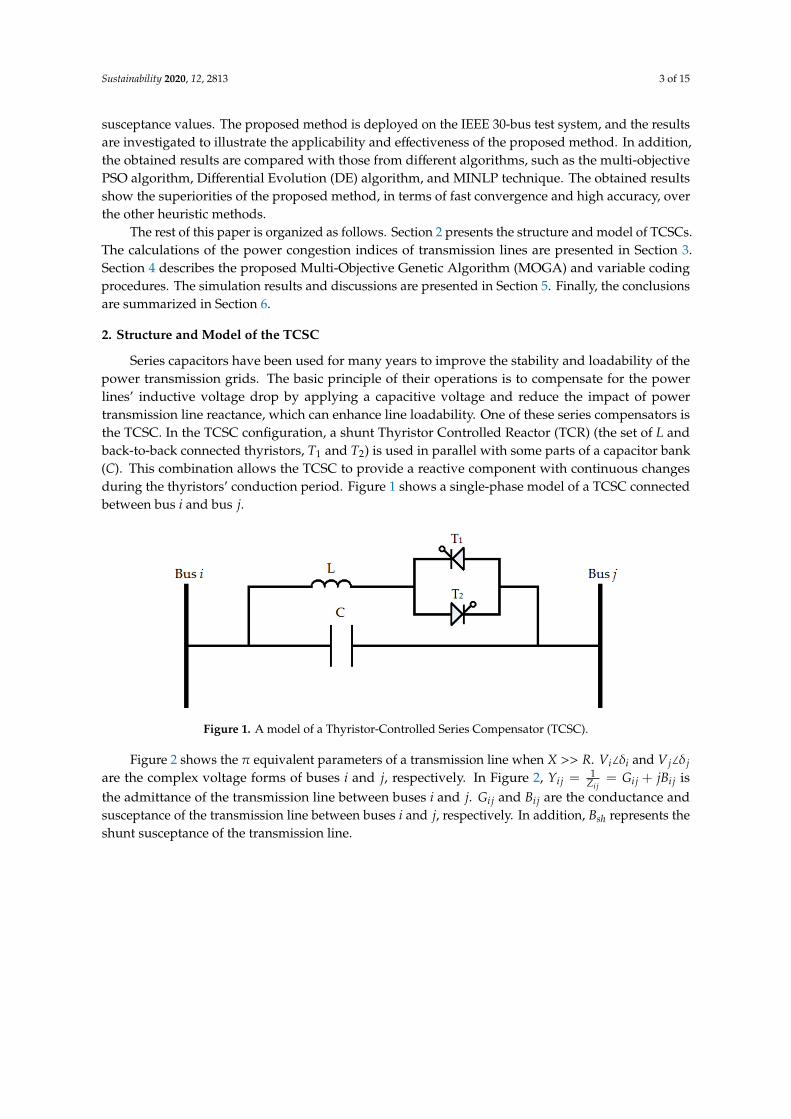
Series capacitors have been used for many years to improve the stability and loadability of thepower transmission grids. The basic principle of their operations is to compensate for the powerlines’ inductive voltage drop by applying a capacitive voltage and reduce the impact of powertransmission line reactance, which can enhance line loadability. One of these series compensators isthe TCSC. In the TCSC configuration, a shunt Thyristor Controlled Reactor (TCR) (the set of L andback-to-back connected thyristors, T1 and T2) is used in parallel with some parts of a capacitor bank(C). This combination allows the TCSC to provide a reactive component with continuous changesduring the thyristors’ conduction period. Figure 1 shows a single-phase model of a TCSC connectedbetween bus i and bus j.
Sustainability 2020, 12, x FOR PEER REVIEW 3 of 17
and the determination of the power line compensation rates have never been used to optimally allocate TCSCs and their susceptance values. The proposed method is deployed on the IEEE 30-bus test system, and the results are investigated to illustrate the applicability and effectiveness of the proposed method. In addition, the obtained results are compared with those from different algorithms, such as the multi-objective PSO algorithm, Differential Evolution (DE) algorithm, and MINLP technique. The obtained results show the superiorities of the proposed method, in terms of fast convergence and high accuracy, over the other heuristic methods.
The rest of this paper is organized as follows. Section 2 presents the structure and model of TCSCs. The calculations of the power congestion indices of transmission lines are presented in Section 3. Section 4 describes the proposed Multi-Objective Genetic Algorithm (MOGA) and variable coding procedures. The simulation results and discussions are presented in Section 5. Finally, the conclusions are summarized in Section 6.
2. Structure and Model of the TCSC
Series capacitors have been used for many years to improve the stability and loadability of the power transmission grids. The basic principle of their operations is to compensate for the power lines’ inductive voltage drop by applying a capacitive voltage and reduce the impact of power transmission line reactance, which can enhance line loadability. One of these series compensators is the TCSC. In the TCSC configuration, a shunt Thyristor Controlled Reactor (TCR) (the set of and back-to-back connected thyristors, and ) is used in parallel with some parts of a capacitor bank ( ). This combination allows the TCSC to provide a reactive component with continuous changes during the thyristors’ conduction period. Figure 1 shows a single-phase model of a TCSC connected between bus and bus .
Figure 1. A model of a Thyristor-Controlled Series Compensator (TCSC).
Figure 2 shows the equivalent parameters of a transmission line when . ∠ and ∠ are the complex voltage forms of buses and , respectively. In Figure 2, = = +
is the admittance of the transmission line between buses and . and are the conductance and susceptance of the transmission line between buses and , respectively. In addition, represents the shunt susceptance of the transmission line.
Figure 1. A model of a Thyristor-Controlled Series Compensator (TCSC).
Figure 2 shows the π equivalent parameters of a transmission line when X >> R. Vi∠δi and V j∠δ jare the complex voltage forms of buses i and j, respectively. In Figure 2, Yi j =
1Zi j
= Gi j + jBi j isthe admittance of the transmission line between buses i and j. Gi j and Bi j are the conductance andsusceptance of the transmission line between buses i and j, respectively. In addition, Bsh represents theshunt susceptance of the transmission line.

Sustainability 2020, 12, 2813 4 of 15Sustainability 2020, 12, x FOR PEER REVIEW 4 of 17
Figure 2. The equivalent circuit of a transmission line
The active and reactive power flow equations between bus and bus ( and ) can be determined as follows [28–33]: = − ( cos + sin ) (1) = − ( + ) − ( sin − cos ) (2)
where = − is the phase angle difference between the voltage at bus and bus . The transmission line model after the installation of the TCSC between bus and bus is
shown in Figure 3. In Figure 3, = + is the impedance of the transmission line between buses and . and are the resistance and reactance of the transmission line between buses and , respectively. At the steady-state, the TCSC can be considered as a static reactance of − .
Figure 3. The equivalent circuit of a transmission line after TSCS installation.
Equations (3) to (6) show the active and reactive power flow equations in the presence of a TCSC between bus and bus ( and ) and vice versa ( and ). = − ( cos + sin ) (3) = − + − ( sin − cos ) (4) = − ( cos − sin ) (5) = − + + ( sin + cos ) (6)
Active and reactive power losses ( and ) can be determined as follows:
Figure 2. The π equivalent circuit of a transmission line.
The active and reactive power flow equations between bus i and bus j (Pi j and Qi j) can bedetermined as follows [28–33]:
Pi j = V2i Gi j −ViV j
(Gi j cos δi j + Bi j sin δi j
)(1)
Qi j = −Vi2(Bi j + Bsh
)−ViV j
(Gi j sin δi j − Bi j cos δi j
)(2)
where δi j = δi − δ j is the phase angle difference between the voltage at bus i and bus j.The transmission line model after the installation of the TCSC between bus i and bus j is shown in
Figure 3. In Figure 3, zi j = ri j + jxi j is the impedance of the transmission line between buses i and j.ri j and xi j are the resistance and reactance of the transmission line between buses i and j, respectively.At the steady-state, the TCSC can be considered as a static reactance of − jxc.
Sustainability 2020, 12, x FOR PEER REVIEW 4 of 17
Figure 2. The equivalent circuit of a transmission line
The active and reactive power flow equations between bus and bus ( and ) can be determined as follows [28–33]: = − ( cos + sin ) (1) = − ( + ) − ( sin − cos ) (2)
where = − is the phase angle difference between the voltage at bus and bus . The transmission line model after the installation of the TCSC between bus and bus is
shown in Figure 3. In Figure 3, = + is the impedance of the transmission line between buses and . and are the resistance and reactance of the transmission line between buses and , respectively. At the steady-state, the TCSC can be considered as a static reactance of − .
Figure 3. The equivalent circuit of a transmission line after TSCS installation.
Equations (3) to (6) show the active and reactive power flow equations in the presence of a TCSC between bus and bus ( and ) and vice versa ( and ). = − ( cos + sin ) (3) = − + − ( sin − cos ) (4) = − ( cos − sin ) (5) = − + + ( sin + cos ) (6)
Active and reactive power losses ( and ) can be determined as follows:
Figure 3. The π equivalent circuit of a transmission line after TSCS installation.
Equations (3) to (6) show the active and reactive power flow equations in the presence of a TCSCbetween bus i and bus j (Pc
i j and Qci j) and vice versa (Pc
ji and Qcji).
Pci j = V2
i G′i j −ViV j(G′i j cos δi j + B′i j sin δi j
)(3)
Qci j = −V2
i
(B′i j + Bsh
)−ViV j
(G′i j sin δi j − B′i j cos δi j
)(4)
Pcji = V2
j G′i j −ViV j(G′i j cos δi j − B′i j sin δi j
)(5)
Qcji = −V2
j
(B′i j + Bsh
)+ ViV j
(G′i j sin δi j + B′i j cos δi j
)(6)

Sustainability 2020, 12, 2813 5 of 15
Active and reactive power losses (Pl and Ql) can be determined as follows:
Pl = Pi j + P ji = G′i j
(V2
i + V2j
)−
(2ViV jG′i j cos δi j
)(7)
Ql = Qi j + Q ji = −(V2
i + V2j
)(Bi j′ + Bsh
)+
(2ViV jB′i j cos δi j
)(8)
where
B′i j =−
(xi j − xc
)r2
i j +(xi j − xc
)2 (9)
G′i j =ri j
r2i j +
(xi j − xc
)2 (10)
Any changes in the line flow due to the series capacitance can be represented as a line withoutseries capacitance, with power injected at the receiving and sending ends of the line, as shown inFigure 4. Sic and S jc in Figure 4 are the injection power at bus i and bus j, respectively. Details of theactive and reactive injection power equations in the presence of a TCSC are expressed in [1–10,27].
Sustainability 2020, 12, x FOR PEER REVIEW 5 of 17
= + = + − (2 cos ) (7) = + = − + + + 2 cos (8)
where = − −+ − (9)
= + − (10)
Any changes in the line flow due to the series capacitance can be represented as a line without series capacitance, with power injected at the receiving and sending ends of the line, as shown in Figure 4. and in Figure 4 are the injection power at bus and bus , respectively. Details of the active and reactive injection power equations in the presence of a TCSC are expressed in [1–10,27].
Figure 4. An equivalent injection model of a transmission line after TCSC installation.
3. Power Congestion Index of Transmission Lines
The Transmission Congestion Distribution Factor (TCDF), as proposed in Equation (11), is based on the sensitivity of AC power flow of the lines to changes in the injected power at different buses, as follows [1]: ( , ) = (11)
where ( , ) represents the variations of active power flow ( ) in transmission line between buses and due to the changes in the injected power at bus ( ). In fact, the index points to changes in the transmission line power, when the injected power in a bus is changed. There are several methods to determine the TCDF, one of which is presented in this paper.
The power flow equation from bus to bus can be expressed as follows [31–33]: = + − − cos (12)
where and and and are the voltage magnitudes and voltage angles at bus and bus , respectively. and are the magnitude and phase angle of the admittance of the - th element of -bus matrix. Using the Taylor series, and ignoring the second- and higher-order terms due to their less impacts, Equations (13) and (14) can be derived as follows: = + + + (13)
= + + + (14)
The unknown coefficients in Equation (14) are calculated by deriving Equations (15)-(18).
Figure 4. An equivalent injection model of a transmission line after TCSC installation.
3. Power Congestion Index of Transmission Lines
The Transmission Congestion Distribution Factor (TCDF), as proposed in Equation (11), is basedon the sensitivity of AC power flow of the lines to changes in the injected power at different buses,as follows [1]:
TCDF(i, k) =∆Pi j
∆Pi(11)
where TCDF(i, k) represents the variations of active power flow (∆Pi j) in transmission line k betweenbuses i and j due to the changes in the injected power at bus i (∆Pi). In fact, the TCDF index points tochanges in the transmission line power, when the injected power in a bus is changed. There are severalmethods to determine the TCDF, one of which is presented in this paper.
The power flow equation from bus i to bus j can be expressed as follows [31–33]:
Pi j = ViV jYi j cos(θi j + δ j − δi
)−V2
i Yi j cosθi j (12)
where Vi and V j and δi and δ j are the voltage magnitudes and voltage angles at bus i and bus j,respectively. Yi j and θi j are the magnitude and phase angle of the admittance of the i- jth element ofY-bus matrix. Using the Taylor series, and ignoring the second- and higher-order terms due to theirless impacts, Equations (13) and (14) can be derived as follows:
∆Pi j =∂Pi j
∂δi∆δi +
∂Pi j
∂δ j∆δ j +
∂Pi j
∂Vi∆Vi +
∂Pi j
∂V j∆V j (13)
∆Pi j = ai j∆δi + bi j∆δ j + ci j∆Vi + di j∆V j (14)

Sustainability 2020, 12, 2813 6 of 15
The unknown coefficients in Equation (14) are calculated by deriving Equations (15)–(18).
ai j = ViV jYi j sin(θi j + δ j − δi
)(15)
bi j = −ViV jYi j sin(θi j + δ j − δi
)(16)
ci j = V jYi j cos(θi j + δ j − δi
)− 2ViYi j cosθi j (17)
di j = ViYi j cos(θi j + δ j − δi
)(18)
Therefore, the Jacobian matrix can be formed as follows:(∆P∆Q
)= ( j)
(∆δ∆V
)=
(j11 j12
j21 j22
)(∆δ∆V
)(19)
Voltage magnitude changes on the line power flow are ignored due to their negligibleimpacts. Hence,
∆P = ( j11)∆δ (20)
∆Q = ( j22)∆V (21)
∆δ = ( j11)−1∆P = (M)∆P (22)
Equation (22) can be generally stated as follows:
∆δ =n∑
l=0
mil∆Pl, i = 1, 2, . . . , n, i , s (23)
where n denotes the number of buses, s is slack bus, and mil represents members of matrix M.In accordance with the above-mentioned subject, ci j and di j are ignored, and Equation (14) can berewritten as follows:
∆Pi j = ai j∆δi + bi j∆δ j (24)
Considering Equations (23) and (24), Equations (25) and (26) can be derived as follows:
∆Pi j = ai j
n∑l=1
mil∆Pl + bi j
n∑l=1
m jl∆Pl (25)
∆Pi j = TCDF(1, k)∆P1 + TCDF(2, k)∆P2 + . . .+ TCDF(n, k)∆Pn (26)
where TCDF(n, k) indicates the congestion index of bus n and line k (connection line between bus i andbus j), and it is given as follows:
TCDF(n, k) = ai jmin + bi jm jn (27)
4. Proposed Multi-Objective Genetic Algorithm (MOGA)
Genetic Algorithm (GA) is a search technique derived from the natural evolutionary mechanism,in which each individual specification of a person is defined by the nature of their chromosomes.There are various applications of the GA, of which multi-objective optimization is one. In fact, theoptimization calculations of the GA are performed on variables that form chromosomes using thecontinuous generation of the population until a predetermined iteration number. On the other hand, theoptimization is started with a random generation of the initial population. In the next step, crossoveraction is performed on chromosomes that are randomly selected. There are several methods forcrossover operation, of which the analytical and break methods are two [28–30]. After that, mutationoperation is randomly performed on chromosomes. The selection operation is the other most important

Sustainability 2020, 12, 2813 7 of 15
step in the GA. In this step, by sorting the chromosomes based on their optimum calculated valuesin the objective function, a defined number of chromosomes, which optimizes the objective functionmore than the others, will be selected. There are various methods for the chromosome selection, andgoing to the next step, the Roulette Wheel Algorithm is one of them.
The overall objective function in this problem is composed of the power loss reduction index,congestion improvement indicator (TCDF), and TCSC compensation rate. The control (optimization)variables contain the susceptance values of TCSCs (b1, . . . , bi) and locations of TCSCs (B1, . . . , Bi) inpower grids, which are discrete numbers between 1 and the maximum line numbers. Figure 5 showsthe coding of the problem variables.
Sustainability 2020, 12, x FOR PEER REVIEW 7 of 17
objective function more than the others, will be selected. There are various methods for the chromosome selection, and going to the next step, the Roulette Wheel Algorithm is one of them.
The overall objective function in this problem is composed of the power loss reduction index, congestion improvement indicator ( ), and TCSC compensation rate. The control (optimization) variables contain the susceptance values of TCSCs ( , … , ) and locations of TCSCs ( , … , ) in power grids, which are discrete numbers between 1 and the maximum line numbers. Figure 5 shows the coding of the problem variables.
Figure 5. The coding of the objective function variables.
The length of a chromosome is determined according to the number of TCSCs. If one or two TCSCs are utilized, the length of a chromosome is two or four, respectively. Various operational constraints, including the bus voltage, the line maximum power, and also the active and reactive power of generation units are considered in the optimization process [34]. Therefore, the objective function is subjected to the following constraints:
• Bus voltage constraint: (28)
• Transmission line capacity limitations: (29)
• Generator active power limitations: (30)
• Generator reactive power limitations: (31)
To handle the inequality constraints, the penalty function is defined as follows:
( ) = ( − ) , − , 0, (32)
where ( ) is the penalty function of variable . and are the lower and upper limits of variable .
The two objective functions ( and ) are presented as follows:
= (33)
= 1 × 100 (34)
Figure 5. The coding of the objective function variables.
The length of a chromosome is determined according to the number of TCSCs. If one or twoTCSCs are utilized, the length of a chromosome is two or four, respectively. Various operationalconstraints, including the bus voltage, the line maximum power, and also the active and reactive powerof generation units are considered in the optimization process [34]. Therefore, the objective function issubjected to the following constraints:
• Bus voltage constraint:Vmin
i ≤ Vi ≤ Vmaxi (28)
• Transmission line capacity limitations:
SLi ≤ SmaxLi
(29)
• Generator active power limitations:
PminGi≤ PGi ≤ Pmax
Gi(30)
• Generator reactive power limitations:
QminGi≤ QGi ≤ Qmax
Gi(31)
To handle the inequality constraints, the penalty function is defined as follows:
P(Xi) =
(Xi −Xmax
i
)2, Xi > Xmax
i(Xmin
i −Xi)2
, Xi < Xmini
0, Xmini < Xi < Xmax
i
(32)
where P(Xi) is the penalty function of variable Xi. Xmini and Xmax
i are the lower and upper limits ofvariable Xi.
The two objective functions ( f1 and f2) are presented as follows:
f1 =
NL∑i=1
Plossi (33)

Sustainability 2020, 12, 2813 8 of 15
f2 =1
NL
NL∑i=1
SLi
SmaxLi
× 100 (34)
where Plossi is the active power loss in line i, NL is the total number of transmission lines, SLi is theaperient power of line i, and Smax
Lidenotes the maximum allowable aperient power of line i. It should be
noted that in this paper, the average percentage of loadability of the lines is considered as an objectivefunction for congestion minimization.
In addition, the third objective function ( f3) is defined as follows:
f3 = XL = Xi j + XTCSC (35)
where XL is the reactance of the transmission line, Xi j is the reactance of the transmission line beforecompensation, and XTCSC is the added reactance to the transmission line after installation of the TCSC.Also, XTCSC = rTCSC ×Xi j, where rTCSC is the compensation coefficient and has a value between −0.7and 0.2.
As a result, the overall objective function can be written as follows:
minF =M∑
i=1
wi fi (36)
where M shows the number of objectives. Also, wi is the weight factor associated with the ith objectivefunction. It should be noted that
∑Ki=1 wi = 1. Lastly, fi is the ith objective function (normalized).
5. Simulation Results and Discussions
5.1. Simulation Results
The proposed method is implemented and evaluated on the IEEE 30-bus test system [35], as shownin Figure 6, for determining the optimal locations of one and two TCSCs. It should be noted that thecase-study has 41 transmission lines. MATPOWER is used for power flow analysis [36]. The simulationswere accomplished in the MATLAB software using a laptop with the Intel Core i7-8550U processor at1.80 GHz clock speed and 12 GB of RAM.
Sustainability 2020, 12, x FOR PEER REVIEW 8 of 17
where is the active power loss in line , is the total number of transmission lines, is the aperient power of line , and denotes the maximum allowable aperient power of line . It should be noted that in this paper, the average percentage of loadability of the lines is considered as an objective function for congestion minimization.
In addition, the third objective function ( ) is defined as follows: = = + (35)
where is the reactance of the transmission line, is the reactance of the transmission line before compensation, and is the added reactance to the transmission line after installation of the TCSC. Also, = × , where is the compensation coefficient and has a value between -0.7 and 0.2.
As a result, the overall objective function can be written as follows:
min = (36)
where shows the number of objectives. Also, is the weight factor associated with the objective function. It should be noted that ∑ = 1 . Lastly, is the objective function (normalized).
5. Simulation Results and Discussions
5.1. Simulation Results
The proposed method is implemented and evaluated on the IEEE 30-bus test system [35], as shown in Figure 6, for determining the optimal locations of one and two TCSCs. It should be noted that the case-study has 41 transmission lines. MATPOWER is used for power flow analysis [36]. The simulations were accomplished in the MATLAB software using a laptop with the Intel Core i7-8550U processor at 1.80 GHz clock speed and 12 GB of RAM.
Figure 6. The single-line diagram of the IEEE 30-bus test system.
5.1.1. Installation of One TCSC
In the first scenario, the optimal location of one TCSC and the compensation rate of the corresponding line for power loss reduction are calculated using the MOGA. After 600 iterations, line
Figure 6. The single-line diagram of the IEEE 30-bus test system.

Sustainability 2020, 12, 2813 9 of 15
5.1.1. Installation of One TCSC
In the first scenario, the optimal location of one TCSC and the compensation rate of thecorresponding line for power loss reduction are calculated using the MOGA. After 600 iterations,line 36 (the connection line between bus 27 and bus 28) with 59.4% compensation rate of the linereactance is selected as the best location for TCSC installation. Figure 7 demonstrates the voltageimprovement at all buses and the voltage drop reduction after the installation of one TCSC.
Sustainability 2020, 12, x FOR PEER REVIEW 9 of 17
36 (the connection line between bus 27 and bus 28) with 59.4% compensation rate of the line reactance is selected as the best location for TCSC installation. Figure 7 demonstrates the voltage improvement at all buses and the voltage drop reduction after the installation of one TCSC.
Figure 7. The voltage at different buses before and after the installation of one TCSC.
5.1.2. Installation of Two TCSCs
In the second scenario, the optimization of the objective function is carried out for two TCSCs. After 1000 iterations, lines 36 (the connection line between bus 27 and bus 28) and 16 (the connection line between bus 12 and bus 13), with 59.58% and 56.74% compensation rates of the lines reactance, are chosen as the two optimum TCSC locations. As shown in Figure 8, the total power losses in this case with two TCSCs are expectedly less than the power loss in the last case with one TCSC. It should be noted that the line compensation rate is limited to 60% of the line reactance.
Figure 8. Comparison of the total power losses for different cases.
0.94
0.95
0.96
0.97
0.98
0.99
1
1.01
1 2 3 4 5 6 7 8 9 10 11 12 13 14 15 16 17 18 19 20 21 22 23 24 25 26 27 28 29 30
Vol
tage
(p.u
.)
Bus Number
Without TCSC After Installing One TCSC
2.2
2.25
2.3
2.35
2.4
2.45
2.5
Case 1 Case 2 Case 3
Tota
l Pow
er L
osse
s (M
W)
Without TCSC After Installing One TCSC After Installing Two TCSCs
Figure 7. The voltage at different buses before and after the installation of one TCSC.
5.1.2. Installation of Two TCSCs
In the second scenario, the optimization of the objective function is carried out for two TCSCs.After 1000 iterations, lines 36 (the connection line between bus 27 and bus 28) and 16 (the connectionline between bus 12 and bus 13), with 59.58% and 56.74% compensation rates of the lines reactance, arechosen as the two optimum TCSC locations. As shown in Figure 8, the total power losses in this casewith two TCSCs are expectedly less than the power loss in the last case with one TCSC. It should benoted that the line compensation rate is limited to 60% of the line reactance.
Sustainability 2020, 12, x FOR PEER REVIEW 9 of 17
36 (the connection line between bus 27 and bus 28) with 59.4% compensation rate of the line reactance is selected as the best location for TCSC installation. Figure 7 demonstrates the voltage improvement at all buses and the voltage drop reduction after the installation of one TCSC.
Figure 7. The voltage at different buses before and after the installation of one TCSC.
5.1.2. Installation of Two TCSCs
In the second scenario, the optimization of the objective function is carried out for two TCSCs. After 1000 iterations, lines 36 (the connection line between bus 27 and bus 28) and 16 (the connection line between bus 12 and bus 13), with 59.58% and 56.74% compensation rates of the lines reactance, are chosen as the two optimum TCSC locations. As shown in Figure 8, the total power losses in this case with two TCSCs are expectedly less than the power loss in the last case with one TCSC. It should be noted that the line compensation rate is limited to 60% of the line reactance.
Figure 8. Comparison of the total power losses for different cases.
0.94
0.95
0.96
0.97
0.98
0.99
1
1.01
1 2 3 4 5 6 7 8 9 10 11 12 13 14 15 16 17 18 19 20 21 22 23 24 25 26 27 28 29 30
Vol
tage
(p.u
.)
Bus Number
Without TCSC After Installing One TCSC
2.2
2.25
2.3
2.35
2.4
2.45
2.5
Case 1 Case 2 Case 3
Tota
l Pow
er L
osse
s (M
W)
Without TCSC After Installing One TCSC After Installing Two TCSCs
Figure 8. Comparison of the total power losses for different cases.
5.1.3. Optimizing the Congestion Index with One TCSC
In the next scenario, the optimal location and compensation rate of the line, with the aim ofoptimizing the congestion index using the MOGA, are obtained. For the minimum congestion index(objective function), it is defined that the congestion index should be greater than 2. Therefore, after

Sustainability 2020, 12, 2813 10 of 15
600 iterations, line 36 (the connection line between bus 27 and bus 28) is obtained as the optimallocation of the TCSC, with 60% compensation rate of the line reactance. Figure 9 shows the congestionindex before and after the installation of one TCSC after 600 iterations. In fact, as the congestion indexis smaller and closer to zero, the possibility of the overload condition of the lines due to probablevariations is less. Therefore, the power flow through the lines can be smoother.
Sustainability 2020, 12, x FOR PEER REVIEW 10 of 17
5.1.3. Optimizing the Congestion Index with One TCSC
In the next scenario, the optimal location and compensation rate of the line, with the aim of optimizing the congestion index using the MOGA, are obtained. For the minimum congestion index (objective function), it is defined that the congestion index should be greater than 2. Therefore, after 600 iterations, line 36 (the connection line between bus 27 and bus 28) is obtained as the optimal location of the TCSC, with 60% compensation rate of the line reactance. Figure 9 shows the congestion index before and after the installation of one TCSC after 600 iterations. In fact, as the congestion index is smaller and closer to zero, the possibility of the overload condition of the lines due to probable variations is less. Therefore, the power flow through the lines can be smoother.
Figure 9. The congestion index before and after installation of one TCSC.
5.1.4. Optimizing the Congestion Index with Two TCSCs
The impact of installing two TCSCs on the system congestion reduction is investigated. After 1000 iterations, it is observed that the best result is obtained by placing TCSCs in lines 36 (the connection line between bus 27 and bus 28) and 12 (the connection line between bus 6 and bus 10) with 59.8% and 55.8% compensation rates of the lines reactance, respectively. Figure 10 shows the obtained congestion index before and after the installation of two TCSCs. It is also observed that the congestion index is reduced in this case.
-8
-6
-4
-2
0
2
4
6
8
10
0 100 200 300 400 500 600
Con
gest
ion
Inde
x
Number of Iterations
Without TCSC After Installing One TCSC
Figure 9. The congestion index before and after installation of one TCSC.
5.1.4. Optimizing the Congestion Index with Two TCSCs
The impact of installing two TCSCs on the system congestion reduction is investigated.After 1000 iterations, it is observed that the best result is obtained by placing TCSCs in lines 36(the connection line between bus 27 and bus 28) and 12 (the connection line between bus 6 and bus10) with 59.8% and 55.8% compensation rates of the lines reactance, respectively. Figure 10 shows theobtained congestion index before and after the installation of two TCSCs. It is also observed that thecongestion index is reduced in this case.
Sustainability 2020, 12, x FOR PEER REVIEW 11 of 17
Figure 10. The congestion index before and after installation of two TCSCs.
5.1.5. Comparison of the Impact of TCSC Installation on the Congestion Index
In order to compare the impact of TCSC installation on the congestion index, some of the obtained values for different states of the case-study are given in Table 1. This table shows that the congestion index is reduced slightly after the installation of two TCSCs rather than one. However, some of the congestion indices are increased, the installation of two TCSCs can cause a reduction in the congestion index.
Table 1. Congestion index comparison in three different scenarios.
Without TCSC With Installing One TCSC With Installing Two TCSCs 5.6782 5.5209 5.4876 3.4496 3.4496 2.9298 −6.1228 −3.5560 −3.5882 4.5056 1.9668 1.9282 −2.0359 −2.0359 −1.9552 −2.0222 −2.0222 −1.8619 3.0062 3.0062 1.4983 −2.1218 −2.1218 −2.2608 3.2135 3.2135 2.6835 −3.6272 −1.6807 −1.8361 3.0220 1.4799 1.4364 3.4788 1.7925 1.7634 −2.7393 −5.0217 −5.0954 −6.2709 −3.6420 −3.0750 4.1085 2.1043 1.9749 4.6944 2.3643 2.3378
-8
-6
-4
-2
0
2
4
6
8
10
0 100 200 300 400 500 600 700 800 900 1000
Con
gest
ion
Inde
x
Number of Iterations
Without TCSC After Installing of Two TCSCs
Figure 10. The congestion index before and after installation of two TCSCs.
5.1.5. Comparison of the Impact of TCSC Installation on the Congestion Index
In order to compare the impact of TCSC installation on the congestion index, some of the obtainedvalues for different states of the case-study are given in Table 1. This table shows that the congestion

Sustainability 2020, 12, 2813 11 of 15
index is reduced slightly after the installation of two TCSCs rather than one. However, some ofthe congestion indices are increased, the installation of two TCSCs can cause a reduction in thecongestion index.
Table 1. Congestion index comparison in three different scenarios.
Without TCSC With Installing One TCSC With Installing Two TCSCs
5.6782 5.5209 5.48763.4496 3.4496 2.9298−6.1228 −3.5560 −3.58824.5056 1.9668 1.9282−2.0359 −2.0359 −1.9552−2.0222 −2.0222 −1.86193.0062 3.0062 1.4983−2.1218 −2.1218 −2.26083.2135 3.2135 2.6835−3.6272 −1.6807 −1.83613.0220 1.4799 1.43643.4788 1.7925 1.7634−2.7393 −5.0217 −5.0954−6.2709 −3.6420 −3.07504.1085 2.1043 1.97494.6944 2.3643 2.3378
5.2. Performance Evaluation Using Different Heuristic TechniquesTo check the performance, applicability, and effectiveness of the proposed method, different
heuristic algorithms, such as the multi-objective PSO algorithm, Differential Evolution (DE) algorithm,and MINLP technique are used for comparison, subject to the same conditions (the same populationsize, same number of iterations, same number of runs, etc.) and on the same machine. The initialpopulation size for each technique is considered as 1000. It should be noted that finite-time and fastconvergence is an important capability of any algorithm in practical tests [37–39]. Figures 11–14 showa summary of the comparisons among the proposed method and the multi-objective PSO, DE, andMINLP methods.
Figure 11 shows the voltage improvement at all buses after the installation of one TCSC usingdifferent techniques. However, after 600 iterations, line 36 (the connection line between bus 27 and bus28) is determined as the optimal location of the TCSC using different algorithms, the PSO algorithmshows overall higher compensation rates at all of the busses.
Sustainability 2020, 12, x FOR PEER REVIEW 12 of 17
5.2. Performance Evaluation Using Different Heuristic Techniques
To check the performance, applicability, and effectiveness of the proposed method, different heuristic algorithms, such as the multi-objective PSO algorithm, Differential Evolution (DE) algorithm, and MINLP technique are used for comparison, subject to the same conditions (the same population size, same number of iterations, same number of runs, etc.) and on the same machine. The initial population size for each technique is considered as 1000. It should be noted that finite-time and fast convergence is an important capability of any algorithm in practical tests [37–39]. Figures 11–14 show a summary of the comparisons among the proposed method and the multi-objective PSO, DE, and MINLP methods.
Figure 11 shows the voltage improvement at all buses after the installation of one TCSC using different techniques. However, after 600 iterations, line 36 (the connection line between bus 27 and bus 28) is determined as the optimal location of the TCSC using different algorithms, the PSO algorithm shows overall higher compensation rates at all of the busses.
Figure 11. Comparison of the voltage at different buses after the installation of one TCSC using different techniques.
The impact of installing two TCSCs on total power losses using different techniques is shown in Figure 12. As shown in this figure, the MOGA determines the lowest total power losses in all three cases (without TCSC, after installing one TCSC, and after installing two TCSCs).
0.94
0.95
0.96
0.97
0.98
0.99
1
1.01
1 2 3 4 5 6 7 8 9 10 11 12 13 14 15 16 17 18 19 20 21 22 23 24 25 26 27 28 29 30
Vol
tage
(p.u
.)
Bus Number
Proposed Method PSO DE MINLP
Figure 11. Comparison of the voltage at different buses after the installation of one TCSC usingdifferent techniques.

Sustainability 2020, 12, 2813 12 of 15
The impact of installing two TCSCs on total power losses using different techniques is shown inFigure 12. As shown in this figure, the MOGA determines the lowest total power losses in all threecases (without TCSC, after installing one TCSC, and after installing two TCSCs).Sustainability 2020, 12, x FOR PEER REVIEW 13 of 17
Figure 12. Comparison of the total power losses for different cases using different techniques.
Figure 13 shows the congestion index after the installation of one TCSC using different techniques. As Figure 13 illustrates, the MOGA is highly capable of determining the optimum congestion index after the installation of one TCSC.
Figure 13. The congestion index after the installation of one TCSC using different techniques.
Figure 14 demonstrates the congestion index after the installation of two TCSCs using different techniques. As shown in this figure, (1) compared to in Figure 14, the congestion index is slightly reduced, and (2) the MOGA is a superior technique to determine the optimum congestion index after the installation of one TCSC.
2.2
2.25
2.3
2.35
2.4
2.45
2.5
Case 1Without TCSC
Case 2After Installing One TCSC
Case 3After Installing Two TCSCs
Tota
l Pow
er L
osse
s (M
W)
Proposed Method PSO DE MINLP
-8
-6
-4
-2
0
2
4
6
8
0 100 200 300 400 500 600
Con
gest
ion
Inde
x
Number of Iterations
Proposed Method PSO DE MINLP
Figure 12. Comparison of the total power losses for different cases using different techniques.
Figure 13 shows the congestion index after the installation of one TCSC using different techniques.As Figure 13 illustrates, the MOGA is highly capable of determining the optimum congestion indexafter the installation of one TCSC.
Sustainability 2020, 12, x FOR PEER REVIEW 13 of 17
Figure 12. Comparison of the total power losses for different cases using different techniques.
Figure 13 shows the congestion index after the installation of one TCSC using different techniques. As Figure 13 illustrates, the MOGA is highly capable of determining the optimum congestion index after the installation of one TCSC.
Figure 13. The congestion index after the installation of one TCSC using different techniques.
Figure 14 demonstrates the congestion index after the installation of two TCSCs using different techniques. As shown in this figure, (1) compared to in Figure 14, the congestion index is slightly reduced, and (2) the MOGA is a superior technique to determine the optimum congestion index after the installation of one TCSC.
2.2
2.25
2.3
2.35
2.4
2.45
2.5
Case 1Without TCSC
Case 2After Installing One TCSC
Case 3After Installing Two TCSCs
Tota
l Pow
er L
osse
s (M
W)
Proposed Method PSO DE MINLP
-8
-6
-4
-2
0
2
4
6
8
0 100 200 300 400 500 600
Con
gest
ion
Inde
x
Number of Iterations
Proposed Method PSO DE MINLP
Figure 13. The congestion index after the installation of one TCSC using different techniques.
Figure 14 demonstrates the congestion index after the installation of two TCSCs using differenttechniques. As shown in this figure, (1) compared to in Figure 14, the congestion index is slightlyreduced, and (2) the MOGA is a superior technique to determine the optimum congestion index afterthe installation of one TCSC.

Sustainability 2020, 12, 2813 13 of 15Sustainability 2020, 12, x FOR PEER REVIEW 14 of 17
Figure 14. The congestion index after the installation of two TCSCs using different techniques.
6. Conclusions
Congestion management is one of the main challenges of power system optimization. Flexible AC Transmission System (FACTS) devices, such as TCSCs, can be used to manage line congestion with controlling the power flow of the grids. On the other hand, due to the high investment costs of FACTS device installation, determining their optimal locations is very important. In this paper, for the first time, power loss reduction, congestion management, and determination of the power line compensation rates are considered, to optimally allocate TCSCs and their susceptance values. The Jacobian sensitivity approach and AC load flow are used for line congestion evaluations. Then, the Multi-Objective Genetic Algorithm (MOGA) was applied to determine the optimal locations and susceptance values of TCSCs. The obtained results show that the optimal allocation and compensation rate of one TCSC can improve power loss and congestion indices. Additionally, the optimal allocation and compensation rates of two TCSCs show that increasing the number of TCSCs results in a slight power loss reduction and an improvement of the congestion index. Meanwhile, the obtained results are compared with those from different algorithms, such as the multi-objective Particle Swarm Optimization (PSO) algorithm, Differential Evolution (DE) algorithm, and Mixed-Integer Non-Linear Program (MINLP) technique, to evaluate the superiority of the proposed method—in terms of fast convergence and high accuracy—over the other heuristic methods. It is noted that the proposed method is a fast and accurate method that can be used for power system operation and planning studies.
Author Contributions: F.M. was responsible for methodology, collecting resources, data analysis, writing—original draft preparation, supervision, and writing—review and editing. T.-T.N. was responsible for writing—review and editing. All authors have read and agreed to the published version of the manuscript.
Funding: This research received no external funding.
Conflicts of Interest: The authors declare no conflict of interest.
References
1. Besharat, H.; Taher, S.A. Congestion management by determining optimal location of TCSC in deregulated power systems. Int. J. Electr. Power Energy Syst. 2008, 30, doi:10.1016/j.ijepes.2008.08.007.
-8
-6
-4
-2
0
2
4
6
8
0 100 200 300 400 500 600 700 800 900 1000
Con
gest
ion
Inde
x
Number of Iterations
Proposed Method PSO DE MINLP
Figure 14. The congestion index after the installation of two TCSCs using different techniques.
6. Conclusions
Congestion management is one of the main challenges of power system optimization. FlexibleAC Transmission System (FACTS) devices, such as TCSCs, can be used to manage line congestion withcontrolling the power flow of the grids. On the other hand, due to the high investment costs of FACTSdevice installation, determining their optimal locations is very important. In this paper, for the first time,power loss reduction, congestion management, and determination of the power line compensationrates are considered, to optimally allocate TCSCs and their susceptance values. The Jacobian sensitivityapproach and AC load flow are used for line congestion evaluations. Then, the Multi-Objective GeneticAlgorithm (MOGA) was applied to determine the optimal locations and susceptance values of TCSCs.The obtained results show that the optimal allocation and compensation rate of one TCSC can improvepower loss and congestion indices. Additionally, the optimal allocation and compensation rates oftwo TCSCs show that increasing the number of TCSCs results in a slight power loss reduction andan improvement of the congestion index. Meanwhile, the obtained results are compared with thosefrom different algorithms, such as the multi-objective Particle Swarm Optimization (PSO) algorithm,Differential Evolution (DE) algorithm, and Mixed-Integer Non-Linear Program (MINLP) technique, toevaluate the superiority of the proposed method—in terms of fast convergence and high accuracy—overthe other heuristic methods. It is noted that the proposed method is a fast and accurate method thatcan be used for power system operation and planning studies.
Author Contributions: F.M. was responsible for methodology, collecting resources, data analysis, writing—originaldraft preparation, supervision, and writing—review and editing. T.-T.N. was responsible for writing—review andediting. All authors have read and agreed to the published version of the manuscript.
Funding: This research received no external funding.
Conflicts of Interest: The authors declare no conflict of interest.
References
1. Besharat, H.; Taher, S.A. Congestion management by determining optimal location of TCSC in deregulatedpower systems. Int. J. Electr. Power Energy Syst. 2008, 30. [CrossRef]
2. Rajderkar, V.P.; Chandrakar, V.K. Comparison of series FACTS devices via optimal location in a power systemfor congestion management. In Proceedings of the Asia-Pacific Power and Energy Engineering Conference,Wuhan, China, 27–31 March 2009.

Sustainability 2020, 12, 2813 14 of 15
3. Mandala, M.; Gupta, C.P. Congestion management by optimal placement of facts device. In Proceedings ofthe Joint International Conference on Power Electronics, Drives and Energy Systems and 2010 Power India,New Delhi, India, 20–23 December 2010.
4. Hosseinipoor, N.; Nabavi, S.M.H. Optimal locating and sizing of TCSC using genetic algorithm forcongestion management in deregualted power markets. In Proceedings of the 9th International Conferenceon Environment and Electrical Engineering, Prague, Czech Republic, 16–19 May 2010.
5. Yousefi, A.; Nguyan, T.T.; Zareipour, H.; Malik, O.P. Congestion management using demand response andFACTS devices. Int. J. Electr. Power Energy Syst. 2012, 37. [CrossRef]
6. Kumar, A.; Srivastava, S.C.; Singh, S.N. A zonal congestion management approach using AC transmissioncongestion distribution factors. Electr. Power Syst. Res. 2004. [CrossRef]
7. Mori, H.; Goto, Y. A parallel tabu search based method for determining optimal allocation of FACTS in powersystems. In Proceedings of the International Conference on Power System Technology, Perth, Australia,4–7 December 2000.
8. Singh, S.N.; David, A.K. Congestion management by optimising FACTS device location. In Proceedings ofthe International Conference on Electric Utility Deregulation and Restructuring and Power Technologies,London, UK, 4–7 April 2000.
9. Gerbex, S.; Cherkaoui, R.; Germond, A.J. Optimal location of multi-type FACTS devices in a power systemby means of genetic algorithms. IEEE Trans. Power Syst. 2001, 16. [CrossRef]
10. Kumar, A.; Sekhar, C. Congestion management with FACTS devices in deregulated electricity marketsensuring loadability limit. Int. J. Electr. Power Energy Syst. 2013. [CrossRef]
11. Vetrivel, K.; Mohan, G.; Rao, K.U.; Bhat, S.H. Optimal placement and control of TCSC for transmissioncongestion management. In Proceedings of the International Conference on Computation of Power, Energy,Information and Communication (ICCPEIC), Chennai, India, 16–17 April 2014.
12. Choudekar, P.; Sinha, S.K.; Siddiqui, A. Transmission line efficiency improvement and congestion managementunder critical contingency condition by optimal placement of TCSC. In Proceedings of the 7th IndiaInternational Conference on Power Electronics (IICPE), Patiala, India, 17–19 November 2016.
13. Surya, R.; Janarthanan, N.; Balamurugan, S. A novel technique for congestion management in transmissionsystem by real power flow control. In Proceedings of the International Conference on Intelligent Computing,Instrumentation and Control Technologies (ICICICT), Kannur, India, 6–7 July 2017.
14. Retnamony, R.; Raglend, I.J. Congestion management is to enhance the transient stability in aderegulated power system using FACTS devices. In Proceedings of the International Conference onControl, Instrumentation, Communication and Computational Technologies (ICCICCT), Kumaracoil, India,18–19 December 2015.
15. Dawn, S.; Tiwari, P.K.; Gope, S.; Goswami, A.K.; Kumar, P. An active power spot price based approach forcongestion management by optimal allocation of TCSC in competitive power market. In Proceedings of theIEEE Region 10 Conference (TENCON), Singapore, Singapore, 22–25 November 2016.
16. Kulkarni, P.P.; Ghawghawe, N.D. Optimal placement and parameter setting of tcsc in power transmissionsystem to increase the power transfer capability. In Proceedings of the International Conference on EnergySystems and Applications, Pune, India, 30 October–1 November 2015.
17. Ziaee, O.; Choobineh, F.F. Optimal location-allocation of TCSC devices on a transmission network. IEEETrans. Power Syst. 2017, 32. [CrossRef]
18. Khatavkar, V.; Namjoshi, M.; Dharme, A. Congestion management in deregulated electricity market usingFACTS and multi-objective optimization. In Proceedings of the Indian Control Conference (ICC), Hyderabad,India, 4–6 January 2016.
19. Shchetinin, D.; Hug, G. Optimal TCSC allocation in a power system for risk minimization. In Proceedings ofthe North American Power Symposium (NAPS), Pullman, WA, USA, 7–9 September 2014.
20. Siddiqui, A.S.; Khan, M.T.; Iqbal, F. A novel approach to determine optimal location of TCSC for congestionmanagement. In Proceedings of the 6th IEEE Power India International Conference (PIICON), Delhi, India,5–7 December 2014.
21. Tang, W.; Pan, W.; Zhang, K.; Liu, C. Study of the location of TCSC for improving ATC considering N-1security constraints. In Proceedings of the 26th Chinese Control and Decision Conference (CCDC), Changsha,China, 31 May–2 June 2014.

Sustainability 2020, 12, 2813 15 of 15
22. Sarwar, M.; Khan, M.T.; Siddiqui, A.S.; Quadri, I.A. An approach to locate TCSC optimally for congestionmanagement in deregulated electricity market. In Proceedings of the 7th India International Conference onPower Electronics (IICPE), Patiala, India, 17–19 November 2016.
23. Sharma, A.; Jain, S. Locating series FACTS devices for managing transmission congestion in deregulatedpower market. In Proceedings of the 7th India International Conference on Power Electronics (IICPE), Patiala,India, 17–19 November 2016.
24. Gitizadeh, M.; Khalilnezhad, H. Power system loss reduction through TCSC economic installation consideringswitching loss. In Proceedings of the 45th International Universities Power Engineering Conference (UPEC),Cardiff, Wales, UK, 31 August–3 September 2010.
25. Baghaee, H.R.; Kaviani, A.K.; Mirsalim, M.; Gharehpetian, G.B. Short circuit level and loss reduction byallocating TCSC and UPFC using particle swarm optimization. In Proceedings of the 19th Iranian Conferenceon Electrical Engineering, Tehran, Iran, 17–19 May 2011.
26. Hridya, K.R.; Mini, V.; Visakhan, R.; Kurian, A.A. Analysis of voltage stability enhancement of a grid andloss reduction using series FACTS controllers. In Proceedings of the International Conference on Power,Instrumentation, Control and Computing (PICC), Thrissur, India, 9–11 December 2015.
27. Manganuri, Y.; Choudekar, P.; Abhishek; Asija, D.; Ruchira. Optimal location of TCSC using sensitivityand stability indices for reduction in losses and improving the voltage profile. In Proceedings of the 1stInternational Conference on Power Electronics, Intelligent Control and Energy Systems (ICPEICES), Delhi,India, 4–6 July 2016.
28. Moslemi, R.; Shayanfar, H.A. Optimal location for series FACTS devices to transient stability constrainedcongestion management. In Proceedings of the 10th International Conference on Environment and ElectricalEngineering, Rome, Italy, 8–11 May 2011.
29. Reddy, S.S.; Kumari, M.S.; Sydulu, M. Congestion management in deregulated power system by optimalchoice and allocation of FACTS controllers using multi-objective genetic algorithm. IEEE PES 2010. [CrossRef]
30. Abou-Ghazala, A. Optimal capacitor placement in distribution systems feeding nonlinear loads. In Proceedingsof the IEEE Bologna Power Tech Conference Proceedings, Bologna, Italy, 23–26 June 2003.
31. Mohammadi, F.; Zheng, C. Stability analysis of electric power system. In Proceedings of the 4th NationalConference on Technology in Electrical and Computer Engineering, Tehran, Iran, 27 December 2018.
32. Mohammadi, F.; Nazri, G.-A.; Saif, M. A bidirectional power charging control strategy for plug-in hybridelectric vehicles. Sustainability 2019, 11, 4317. [CrossRef]
33. Mohammadi, F.; Nazri, G.-A.; Saif, M. An improved mixed AC/DC power flow algorithm in hybrid AC/DCgrids with MT-HVDC systems. Appl. Sci. 2020, 10, 297. [CrossRef]
34. Khanabadi, M.; Ghasemi, H. Transmission congestion management through optimal transmission switching.In Proceedings of the IEEE Power and Energy Society General Meeting, Detroit, MI, USA, 24–28 July 2011.
35. Christie, R. Power Systems Test Case Archive; UW Power Systems Test Case Archive: Seattle, WA, USA, 1993.36. Zimmerman, R.D.; Murillo-Sanchez, C.E.; Thomas, R.J. MATPOWER: Steady-state operations, planning and
analysis tools for power systems research and education. IEEE Trans. Power Syst. 2011, 26. [CrossRef]37. Mohammadi, F.; Nazri, G.-A.; Saif, M. A fast fault detection and identification approach in power distribution
systems. In Proceedings of the 5th International Conference on Power Generation Systems and RenewableEnergy Technologies (PGSRET 2019), Istanbul, Turkey, 26–27 August 2019.
38. Karimi, H.; Ghasemi, R.; Mohammadi, F. Adaptive neural observer-based nonsingular terminal sliding modecontroller design for a class of nonlinear systems. In Proceedings of the 6th International Conference onControl, Instrumentation, and Automation (ICCIA 2019), Kordestan, Iran, 30–31 October 2019.
39. Tavoosi, J.; Mohammadi, F. Design a new intelligent control for a class of nonlinear systems. In Proceedingsof the 6th International Conference on Control, Instrumentation, and Automation (ICCIA 2019), Kordestan,Iran, 30–31 October 2019.
© 2020 by the authors. Licensee MDPI, Basel, Switzerland. This article is an open accessarticle distributed under the terms and conditions of the Creative Commons Attribution(CC BY) license (http://creativecommons.org/licenses/by/4.0/).