
Ultrafast charge dynamics in CuInS2 nanocrystal quantum dots

Optical tomographic image reconstruction fromultrafast time-sliced transmission measurements
W. Cai, S. K. Gayen, M. Xu, M. Zevallos, M. Alrubaiee, M. Lax, and R. R. Alfano
Optical imaging and localization of objects inside a highly scattering medium, such as a tumor in thebreast, is a challenging problem with many practical applications. Conventional imaging methodsgenerally provide only two-dimensional ~2-D! images of limited spatial resolution with little diagnosticability. Here we present an inversion algorithm that uses time-resolved transillumination measure-ments in the form of a sequence of picosecond-duration intensity patterns of transmitted ultrashort lightpulses to reconstruct three-dimensional ~3-D! images of an absorbing object located inside a slab of ahighly scattering medium. The experimental arrangement used a 3-mm-diameter collimated beam of800-nm, 150-fs, 1-kHz repetition rate light pulses from a Ti:sapphire laser and amplifier system toilluminate one side of the slab sample. An ultrafast gated intensified camera system that provides aminimum FWHM gate width of 80 ps recorded the 2-D intensity patterns of the light transmitted throughthe opposite side of the slab. The gate position was varied in steps of 100 ps over a 5-ns range to obtaina sequence of 2-D transmitted light intensity patterns of both less-scattered and multiple-scattered lightfor image reconstruction. The inversion algorithm is based on the diffusion approximation of theradiative transfer theory for photon transport in a turbid medium. It uses a Green’s function pertur-bative approach under the Rytov approximation and combines a 2-D matrix inversion with a one-dimensional Fourier-transform inversion to achieve speedy 3-D image reconstruction. In addition to thelateral position, the method provides information about the axial position of the object as well, whereasthe 2-D reconstruction methods yield only lateral position. © 1999 Optical Society of America
OCIS codes: 100.3190, 170.3010, 170.3880, 170.6920, 290.7050.
1. Introduction
The past decade has witnessed a rapid growth ofresearch activities in optical imaging of objects lo-cated inside turbid media.1–12 This interest derivesfrom potential practical applications of optical imag-ing in such diverse areas as detection of tumors in thehuman body, monitoring of aerosols and hydromete-ors in the atmosphere, and tracking of fuel droplets inthe front nozzle of jet engines. Among these areas,biomedical applications have attracted the most at-tention because safe, noninvasive, and affordable im-aging modalities with diagnostic ability can bedeveloped using near-infrared light.2 An intensely
The authors are with the Institute for Ultrafast Spectroscopyand Lasers, New York State Center of Advanced Technology forUltrafast Photonic Materials and Applications, Departments ofPhysics and Electrical Engineering, The City College and Gradu-ate Center of City University of New York, New York, New York10031.
Received 12 November 1998; revised manuscript received 11March 1999.
0003-6935y99y194237-10$15.00y0© 1999 Optical Society of America
pursued area is optical mammography in which near-infrared light is used to screen for breast cancer, amajor and increasing health problem that affects oneout of every eight women in the United States.13
X-ray mammography, the most commonly usedbreast imaging modality, is not suitable for imagingyoung dense breasts, may not distinguish betweenmalignant and benign tumors, and frequent exposureto ionizing x rays could be harmful if used for routinescreening. The impetus for developing optical mam-mography is to overcome some of these limitations ofx-ray mammography and to achieve diagnostic abil-ity by exploiting potential spectroscopic differenc-es14,15 between the tumor and the surroundingtissues.
In its simplest form, optical imaging involves illumi-nating an object with light of appropriate wavelengthand looking for its shadow in the transmitted light.Some difference in optical properties between the ob-ject and the surrounding medium is necessary for theformation of a shadow image. However, strong scat-tering of light by biological tissues severely degradesthe image quality, and for sufficiently thick tissues,completely buries it in the background noise. Time-
1 July 1999 y Vol. 38, No. 19 y APPLIED OPTICS 4237
3,5,6,11,12 7,8
astc
Flt
mtaottotbow
4
resolved, and continuous-wave ~cw! methodshave been developed to sort out image-bearing ballisticand snake photons from the image-blurring multiple-scattered photons.16 These methods improve the im-ge quality to different extents, but suffer from lowignal-to-noise ratio when used for imaging throughhick, highly scattering samples. Inverse image re-onstruction ~IIR! methods make use of the measured
scattered light intensity around the object, knowledge~or estimate! of optical properties of the turbid mediumand the object inside it, and mathematical models toconstruct images of the object.4,9,12,17–24 An IIRmethod requires extensive measurement of light in-tensities around the object and a long computationtime for obtaining an image. Continuous-wave orfrequency-modulated light, as well as ultrashort light,pulses may be used to accumulate data for IIR.
In this paper we report on a novel IIR approach thatmakes use of experimentally measured time-slicedtwo-dimensional ~2-D! transmitted light intensity dis-tribution, I~x, y, ti!, to reconstruct three-dimensional~3-D! images. Time-sliced imaging is an extension ofthe idea of time-resolved early-light imaging exceptthat picoseconds-duration temporal slices of the trans-mitted light covering both early-arriving less-scatteredand late-arriving multiple-scattered photons are usedto obtain a sequence of 2-D intensity patterns I~x, y, ti!.Transmission measurements are carried out using agated image intensifier that provides an approxi-mately 80-ps duration time gate whose temporal posi-tion can be varied over a 20-ns range to collect asequence of 2-D transmitted light intensity distribu-tion I~x, y, ti!. The inversion algorithm uses a 2-Dmatrix inversion with a one-dimensional ~1-D!
ourier-transform inversion based on symmetry in cy-indrical coordinates that greatly reduces computationime compared with direct 3-D inversion.
Our approach is a significant advance in optical to-ographic imaging of turbid media. First, use of
ime-resolved data enables reconstruction of 3-D im-ges that provide considerable information aboutbject location in three dimensions. Depth informa-ion may not be available from direct transillumina-ion methods, or even x-ray mammography that yieldsnly 2-D images. It has been demonstrated recentlyhat IIR approaches using cw measurements may note adequate for a unique reconstruction of the internalptical characteristics of a scattering medium evenhen multiple sources and detectors are used.25
Shifting of the positions of the source detector pairsmay lead to 3-D image information, but it would makedata acquisition highly time-consuming. Second,time-sliced data provide a wealth of information over abroad frequency range that is essential for 3-D imagereconstruction as compared with frequency-domainschemes that commonly use several discrete frequen-cies. Frequency-domain methods may, in principle,scan over a broad continuous range of frequencies togenerate data that are equivalent to time-domainmethods. However, accumulation and processing ofdata over such a broad frequency range ~several giga-hertz! would be extremely time-consuming. More-
238 APPLIED OPTICS y Vol. 38, No. 19 y 1 July 1999
over, currently available sources cannot provideadequate power at such high frequencies. Use oftime-resolved measurements is an effective way to col-lect data with adequate information content for 3-Dimage reconstruction.18 Another advantage of thepresent scheme that makes use of time-sliced 2-D lightintensity patterns over earlier time-domain IIRschemes17,18 is speedy data acquisition. Those earlierschemes involving measurement of time-resolved pro-files using multiple fibers and single-element detectorswere time-consuming, expensive, and required compli-cated synchronization schemes. In the presentscheme using a gated charge-coupled device ~CCD!camera for detection, each pixel of the 384 3 288 pixelssensing element can be considered to be equivalent toa detector in the multidetector configuration men-tioned above, and a 2-D spatial distribution of trans-mitted light intensity is obtained in every framerecorded by the camera. Use of only the transmittedlight measured with a single CCD camera makes dataacquisition simpler and faster than data acquisitionthat requires measurements of light intensity aroundthe object using multiple detectors. Finally, use of a2-D matrix inversion with a 1-D Fourier-transforminversion in the algorithm, together with fast time-gated data acquisition, enables reconstruction of 3-Dimages within a short time, a key requirement forreal-time clinical applications. Although the linearperturbative approach has been used before, this use ofa 2-D matrix inversion with a 1-D Fourier-transforminversion for speedy image reconstruction is a newsalient feature of our approach.
As a proof of concept, we used the method to recon-struct images of an absorbing object placed inside atissue-simulating model turbid medium. We obtaingood localization of the object in the lateral dimen-sions. Spatial resolution along the axial direction ispromising, but needs improvement. The remainderof this paper is organized as follows. Section 2 de-tails the experimental arrangement, sample charac-teristics, and data-acquisition scheme. The IIRalgorithm is presented in Subsection 3.A. Becausethe inversion problem is ill-posed, some form of reg-ularization is needed to extract useful image infor-mation. The degree of regularization is typicallycontrolled by parameters that are usually chosen em-pirically. The L-curve method26 that we use to se-lect optimal regularization parameters is described inSubsection 3.B. The formalism is used to recon-struct images of an absorbing object inside a turbidmedium and the results are presented in Section 4.The results of reconstruction using simulated datapresented in Subsection 4.A is compared with thatobtained using experimental data presented in Sub-section 4.B. Implications of these results for obtain-ing tomographic images of biological tissues and thescope of this IIR approach are discussed in Section 5.
2. Experimental Method and Materials
The experimental arrangement for picosecond-duration time-sliced measurement of transmittedlight intensity is displayed schematically in Fig. 1~a!.

3
awdf
~
fcwuTtptmaTpptltttit
is
ia
w
uGraaTit
The detail of the cylindrical sample cell geometry ispresented in Fig. 1~b!. The location of the object ona plane parallel to and 15 mm toward the source fromthe exit plane ~45 mm from the input plane! is shownin Fig. 1~c!. The scattering medium was a suspen-sion of Intralipid-10% ~Kabi Pharmacia Inc., Clayton,North Carolina! in water. Intralipid-10% is a fatemulsion used clinically as a nutrient and in researchas a phantom to investigate light propagation in tis-sues. The concentration of Intralipid-10% suspen-sion was adjusted to provide an estimated reducedscattering coefficient ms9 of 0.4 mm21 and an absorp-tion coefficient ma of 0.02 mm21 at 800 nm.27 TheIntralipid suspension was held in a 60-mm-long and200-mm-diameter cylindrical Plexiglas cell. Thecell thickness was chosen to be equivalent to that ofan average breast under the extent of compressioncommonly used in x-ray mammography.
Fig. 1. ~a! Schematic diagram of the experimental arrangementsed for time-sliced transmitted intensity measurements. ~b!eometric arrangement used to describe the reconstruction algo-
ithm showing the object and image planes and the object in anrbitrary position in cylindrical coordinates. ~c! Object location inlateral plane parallel to and 15 mm away from the exit plane.he 10-mm side of the sample was inclined at an angle of approx-
mately 15° with the vertical ~x axis!. This is the object positionhat was used in the experiment.
The object to be imaged was a 3 3 3 3 10 mmrectangular parallelepiped made of aluminum andpainted black. It was suspended on axis at a dis-tance of 15 mm ~z 5 45 mm! from the exit plane andbsorbed most of the light incident on it. The cellas illuminated through the input plane with 150-fsuration, 1-kHz repetition rate pulses of 800-nm lightrom a Ti:sapphire laser and amplifier system.28
The 3-mm-diameter collimated laser beam with anaverage power of approximately 100 mW was inci-dent along the axis ~z axis! onto one of the flat facesinput plane! of the cylindrical cell.
The 2-D intensity distribution of light emergentrom the opposite endface of the cell ~exit plane! wasollected by a 24-mm focal-length fy2.8 camera lensith a 84° angle of view and was recorded by theltrafast gated intensified camera system ~UGICS!.he UGICS is a compact gated image intensifier unithat is fiber optically coupled to a CCD camera. Itrovides an electronic time gate whose FWHM dura-ion could be adjusted to a minimum of approxi-ately 80 ps. The gate position could be varied over20-ns range with a minimum step size of 25 ps.
he signal recorded by the system at a particular gateosition is a convolution of the transmitted lightulse with the gate pulse centered on the gate posi-ion. The collection optics was adjusted to captureight transmitted through the exit plane, and no at-empt was made to use the scattered light emergenthrough the curved surface of the cell. The datahen consisted of a sequence of time-resolved 2-Dntensity distribution integrated over the gate dura-ion at different gate positions, I~x, y, ti!. Because
I~x, y, ti! is the 2-D spatial intensity distributionntegrated over a 80-ps slice of time for the gate po-ition ti, we refer to it as a time-sliced intensity pat-
tern ~or intensity distribution!. These time-slicedntensity patterns were recorded by the CCD camerand displayed on a personal computer.In the experiment reported here, the gate widthas adjusted to 80 ps and I~x, y, ti! were recorded
over a 5-ns range by varying the gate pulse position insteps of 100 ps. The zero time was taken to be theinstant when the incident light pulse entered thefront surface of the cell. I~x, y, ti! provided the ex-perimental data for IIR.
Experimentally recorded typical 2-D intensity pat-terns of transmitted light with the object inside themedium are shown in Figs. 2~a! and 2~b! for gatepositions of 700 ps and 1500 ps, respectively. The1500-ps pattern is spatially more spread out than the700-ps pattern because the electronic time gate col-lects light that is more diffuse and hence spatiallyspread out at the 1500-ps position than that at the700-ps position. Intensity patterns recorded withlater gate positions spread out even further. Be-cause the temporal profile of the transmitted lightintensity peaks around 2 ns, the intensity at the cen-ter of the 1500-ps pattern is higher than that of the700-ps pattern. No shadow image of the object wasapparent in either of the intensity patterns. All theintensity patterns measured over the 5-ns range were
1 July 1999 y Vol. 38, No. 19 y APPLIED OPTICS 4239

e
lt
4
transferred to a Silicon Graphics Origin-2000 com-puter for use as experimental data for 3-D IIR. Thecomputer has four parallel 195-MHz CPU’s, but onlyone was used in this research.
3. Reconstruction Formalism
A. Algorithm
The time-sliced IIR formalism presented here isbased on the diffusion approximation of the radiativetransport theory for photon migration in a scatteringmedium.9 The diffusion equation in a turbid me-dium is given by
H ]
]t1 ma~r!c 2 ¹@D~r!c¹#JI~r, t! 5 S~r, t!, (1)
where I is the photon density ~photonsycm3!, S is thesource strength @photonsy~cm3zs!#, ma is the absorp-tion coefficient, D 5 1y$3@ma 1 ~1 2 g!ms#% is thediffusion coefficient, ms is the scattering coefficient, gis the scattering anisotropy factor, and c is the speedof light in the medium. We are interested in the
Fig. 2. Experimentally measured 2-D intensity distribution oflight transmitted through the scattering medium with the objectfor a gate position of ~a! 700 ps and ~b! 1500 ps. ~c! The object wasocated approximately on the axis of the cylindrical cell at a dis-ance of 15 mm from the exit plane.
240 APPLIED OPTICS y Vol. 38, No. 19 y 1 July 1999
following problem: Given the time-sliced intensitypattern transmitted through the media with the ob-ject I~x, y, ti!, and without the object I0~x, y, ti!, wewant to reconstruct a map of the change in opticalparameters, the absorption coefficient in this case.The medium without the object is referred to as thereference medium.
The formulation of the forward problem uses a slabgeometry ~0, z0! formed by cylindrical coordinates ~r,w, z!, as shown schematically in Fig. 1~b!. A pointsource ~or a w-symmetric finite source! is assumed tobe located ~or is centered! at ~0, 0, 0!. The detectorsystem is located on the z0 plane and is mapped ontothe CCD camera by a lens. The r boundary is as-sumed to be at infinity. However, it can be replacedby a finite boundary using a more complex Green’sfunction. We use a Green’s function perturbativeapproach under the Rytov approximation4,29 to pro-duce a linear inverse algorithm.9,17 The Rytov ap-proximation is used because it has been shown toprovide a more accurate reconstruction of the absorp-tive properties than the Born approximation.29 Thereference medium, i.e., the medium without the ob-ject, is assumed to be uniform. Our formulation re-quires only the surrounding medium and not theobject to be cylindrically symmetric, a condition thatcan be arranged in an experiment. For example, inthe case of breast imaging the breast may be placed ina cylindrical cell containing an index-matching liquidwith optical properties that are similar to the averagevalues of optical properties of a real breast. The aimof the reconstruction process would then be to obtaina spatial map of the difference in optical propertiesfrom those average values. Thus the assumption ofcylindrical symmetry for the surrounding medium isnot a serious limitation for the applicability of theformalism.
The forward problem can be represented in matrixform as
Y 5 WX, (2)
where Y is a vector represented by a column matrixwhose elements are measured changes in transmit-ted intensity, X is a vector whose elements are opticalparameter ~absorption or scattering coefficient!changes that are due to the presence of the object, andW is the weight function,9 which, in the linear inver-sion case, is related only to the reference medium.The vector Y has M elements, determined from theexperimental data as Yi 5 2log~IiyIoi!, where Ii andIoi are the measured intensities with and without theobject, respectively, and M 5 ~nt 3 nr 3 nf! where ntis the number of time slices and nr and nf are thenumbers of radial and angular sections, respectively,that the detector plane is divided into. X has Nlements, Xj 5 cDma~rj! or cDD~rj!, where N is the
number of voxels that the sample cell is divided into.W is an M 3 N matrix that, under the assumptions ofa cylindrical boundary and a uniform reference me-dium, satisfies the w-rotation invariance, i.e., it is afunction of w 2 wd, where wd is the angle coordinate of
l
t
sz
io
pstrtc
Gsfsv
a point on the detector plane and w is the angle co-ordinate of a voxel. It should be pointed out that thereference medium ~not the object! needs to be cylin-drically symmetric. For time-resolved absorptiontomography, W is written as
W3-D~rd, r, z, w 2 wd t! 5DV
Gr0~rd , t!Gz
0~z0, 0, t!
3 *0
dt1
4pDc~t 2 t!
3 expF2r2 2 rd2 1 2rrd cos~w 2 wd!
4Dc~t 2 t! G3 Gz
0~z, z0 , t 2 t!Gr0~r, t!Gz
0~z, 0, t!. (3)
In Eq. ~3!, Gz0~z, 0, t! is a 1-D slab Green’s function for
the reference medium with source at z 5 0 and iswritten as
Gz0~z, 0, t! 5 ~4pDct!21y2 exp~2z2y4Dct!
1 (i
~4pDct!21y2 exp@2~z 2 zi!2y4Dct#,
where i denotes the ith image source that is due to theslab geometry.
Gr0~r, t! is a 2-D Green’s function with the source
ocated ~or centered! at r 5 0. For a point source, itis of the form
Gr0~r, t! 5
14pDct
expS 2r2
4DctD , (4)
and for a finite-size spot source, it is written as
Gr0~r, t! 5
12Dct * f ~rs!expS2
r2 1 rs2
4Dct DI0S2rrs
4DctDrsdrs,
(5)
where I0 is the zeroth-order modified Bessel functionand f ~rs! is the intensity distribution of the incidentlight spot.
After making a 1-D Fourier transform of W3-D overw 2 wd, we obtain K-independent 2-D matrices,W2-D~k! parameterized by k, with K the number ofgrid points in the Fourier k space. The indices of w 2wd in the 3-D real space correspond to indices of k inhe Fourier space. W2-D~k! is an M9 3 N9 matrix,
with M9 5 ~number of rd division! 3 ~number of timelices!, and N9 5 ~number of r division! 3 ~number ofdivision!. The normal form W2-D~k!TW2-D~k! is an
N9 3 N9 matrix. We separately calculate the K in-verse matrices @W2-D~k!TW2-D~k! 1 L~k!#21, k 5 1,2, . . . , K, where L~k! is a matrix for regularization.The computational complexity now is K times that ofnverting a W2-D matrix, which is much less than thatf inverting a W3-D matrix.Having experimental data Y~rd, wd, t!, we make a
Fourier transform over wd to obtain Y~rd, k, t!, k 5 1,2, . . . , K. The technique for fast discrete Fourier
convolution is used. We then use simple matrixmultiplication to obtain the image in the k space:
X~k! 5 Y~k!TW2-D~k!@W2-D~k!TW2-D~k! 1 L~k!#21,
k 5 1, 2, . . . K. (6)
After X~k!, k 5 1, 2, . . . K, is obtained, the inverse 1-DFourier transform over k reproduces the X as a func-tion of w and gives the 3-D distribution of the changesin absorption ~or scattering! coefficients X~r, w, z!.
B. Regularization
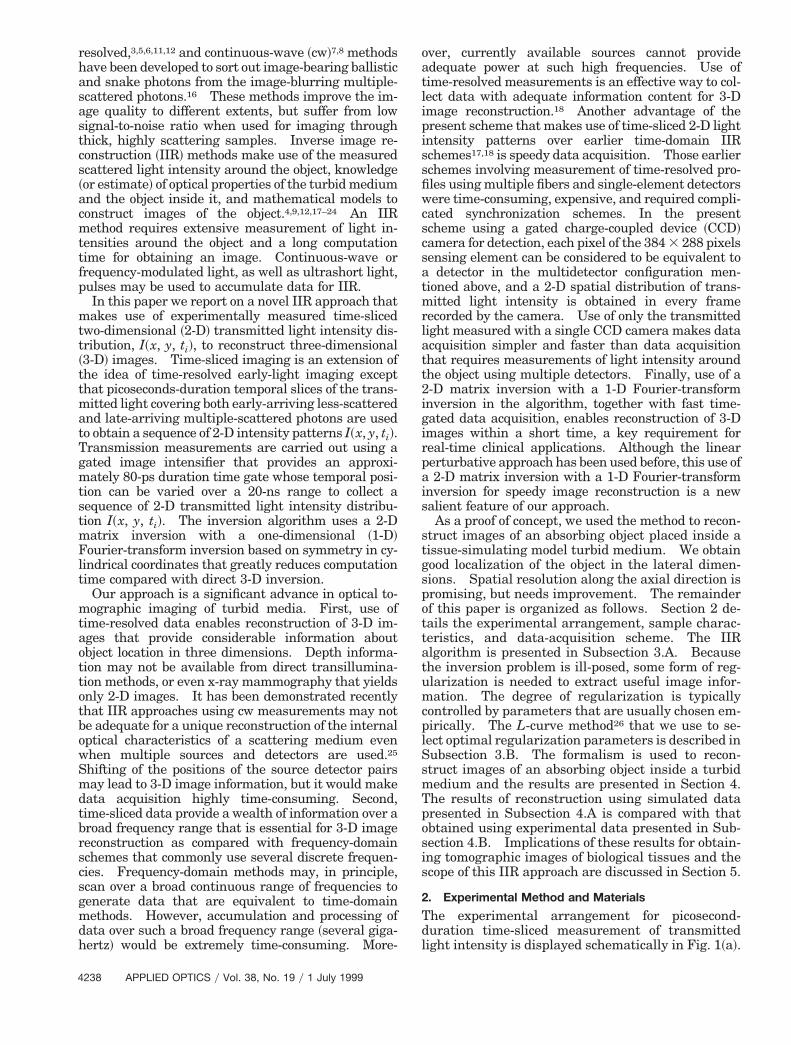
The inversion problem is ill-posed with a huge con-dition number, hence a regularization procedure isnecessary to obtain a unique solution. We use adiagonal form of a regularization matrix L~k! 5l~k!dij. A convenient way to understand the effect ofregularization and to choose the suitable regulariza-tion parameter is to use the L curve,26 which showsthe properties of the regularized solution Xl that varywith l. Two properties of the Xl are the norm iXliand the norm of the corresponding residual vectoriWXl 2 Yi. iXli indicates the stability of the solu-tion and it decreases with an increase of l. iWXl 2Yi indicates the error that is due to the introductionof regularization and it increases with an increase ofl. As proved in Ref. 26, if iXli versus iWXl 2 Yi is
lotted with different values of l, a curve similar inhape to the capital letter L is obtained. It suggestshat a good regularization parameter is one that cor-esponds to a regularized solution near the corner ofhe L curve because in this region there is a goodompromise that keeps both iXli and iWXl 2 Yi rel-
atively small. Figure 3 shows an L curve that weobtained for one of our simulation tests, which corre-sponded to W2-D~k 5 1!. The simulation assumed a
aussian-distributed noise level with a root-mean-quare deviation of 5% ~for brevity henceforth re-erred to simply as 5% Gaussian noise! in eachimulated value of Y. The range of the values of laries from 1028 to 108. The values of l correspond-
ing to positions near the corner of the L curve areapproximately 0.5–1.0. Choice of a value of l be-
Fig. 3. L curve used for choosing the regularization parametersfor IIR with simulated data. The object was located at a distanceof 15 mm from the exit plane.
1 July 1999 y Vol. 38, No. 19 y APPLIED OPTICS 4241
w
R
0
w
o
pvr
4
tween 0.5–1.0 in our inversion calculation led to astable image of the object with the 5% Gaussiannoise.
4. Results
A. Three-Dimensional Image from Simulated Data
In the simulation, the thickness of the slab was takento be z0 5 60 mm. A point light source was assumed.The detector system was taken to be a circle with aradius Rd 5 30 mm. To choose grids of equal area,the angle 2p was uniformly divided into 36 parts,
hereas the radius Rd was divided into 30 partsscaled such that the outer radius of the jth disk was
j 5 ~Rd2jyJ!1y2, where j 5 1, 2, 3, . . . , J, with J 5
30. In each simulated temporal profile, intensitiesat 30 time slices uniformly distributed from 450 to1900 ps were taken. The number of sampling datawas M 5 30 3 36 3 30. Data both with and withoutthe object were used to obtain Yi 5 2log~IiyIo!, afteradding the 5% Gaussian noise. The sample cell wasdivided into N 5 10 3 36 3 20 voxels, with 20 divi-sions along the z direction and 10 divisions along ther direction in a 30-mm range in a way similar to thatused for detector division.
Elements of W were calculated using Eq. ~3! with abackground-reduced scattering coefficient ms9
0 of 0.4mm21 and an absorption coefficient ma
0 of 0.02 mm21.Corresponding parameters of the object were ms9 5.4 mm21 and ma 5 0.4 mm21. The regularization
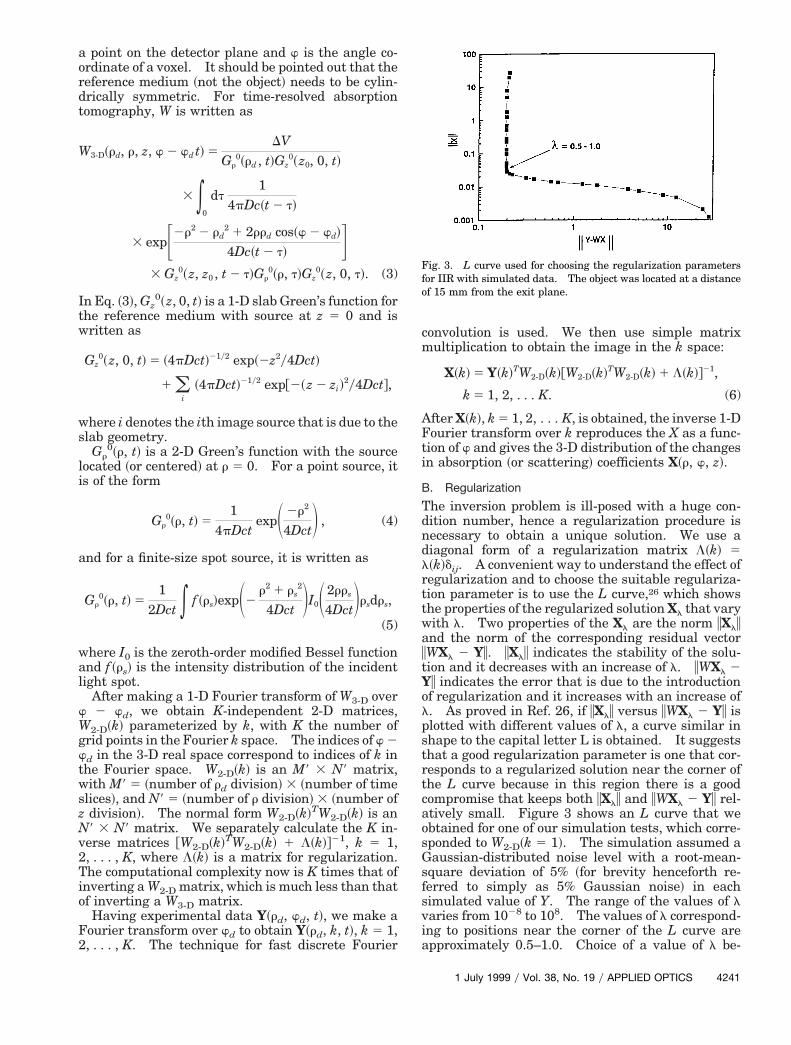
parameter l was taken to be 1.0 based on the L-curveanalysis. Image of the absorbing object obtained us-ing Eq. ~6! and the 1-D Fourier transform is shown inFig. 3. The 20 consecutive circles in Fig. 4 representthe images at 3-mm intervals along the cylinder axis~z axis! from the input plane to the exit plane. Agray scale is used to display the spatial distribution ofchanges in the absorption coefficient, with black rep-resenting the maximum value. For simulation theobject of 3-mm linear dimension was placed in a voxellocated in the 15th division along the z axis ~z 5 45mm! that was approximately 15 mm away from theexit plane.
The reconstructed image locates the object in theneighborhood of where it was placed, as can be seenfrom the concentration of black around the 15th cir-cle. The image @Dma~r! distribution# appears to bespread out both in the lateral and in the axial direc-tions, a consequence of the scattering and the diffu-sion approximation used for reconstruction. TheFWHM of the image is approximately 6 mm in thelateral plane and approximately 12 mm in the axialdirection.
B. Three-Dimensional Image from Experimental Data
In the IIR using experimental data, we approximatedthe laser beam to be a point source located at thecenter of the z0 5 0-mm plane. The r boundary ofthe container was assumed to be at infinity. Thetime-resolved 384 3 288 pixels image from the CCDcamera, with and without the object, were trans-formed to provide 30 3 36 3 30 pieces of Y data, as
242 APPLIED OPTICS y Vol. 38, No. 19 y 1 July 1999
as done in simulation. The plot of iXli versusiWXl 2 Yi for computing the regularization param-eter l showed only a small kink on the curve insteadf a clear L shape. The norm of the residual vector
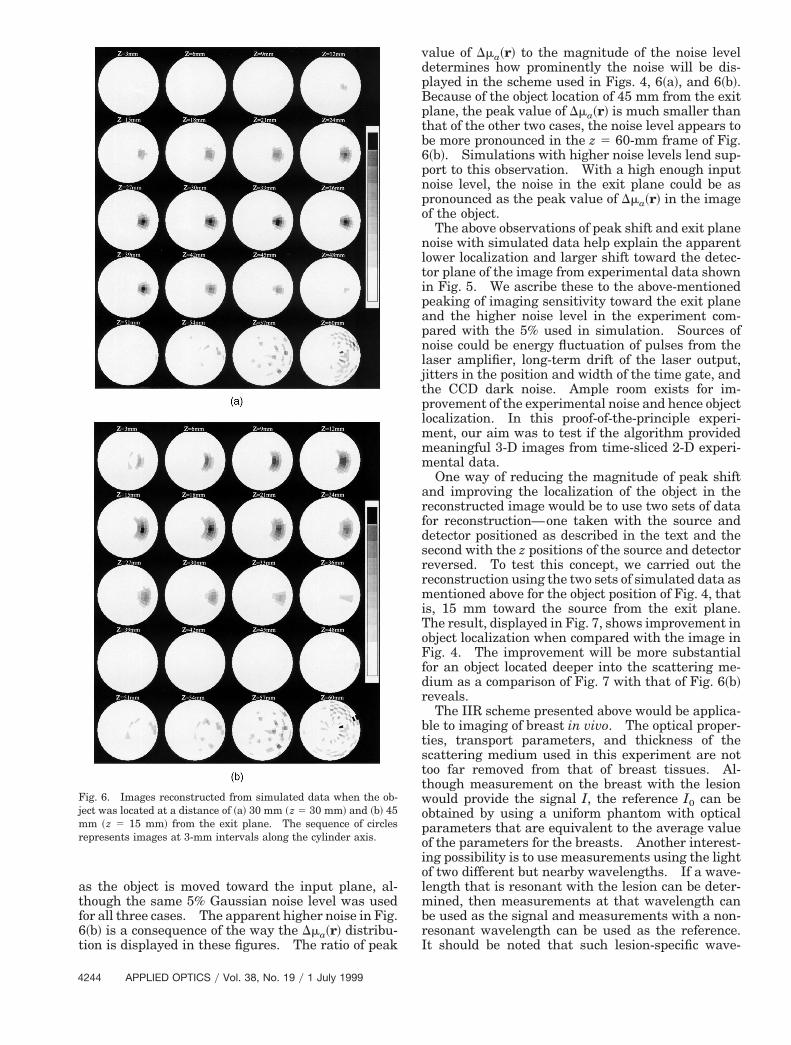
iWXl 2 Yi at kink position was approximately 2 or-ders of magnitude larger than that in the simulatedcase. This difference may be due to the deviation ofthe experimental conditions from the assumptions ofthe theoretical forward model or because of a highernoise level in the experiment than that used in thesimulation. Based on our simulation results assum-ing higher noise levels, we believe that the differencebetween the simulated and the experimental resultsmainly comes from higher experimental noise. Pos-sible sources of experimental noise are pulse-to-pulseenergy fluctuation in the laser beam and timing jitterin the gate position. Because we arrange a smallobject at the distance far enough from the source andthe detectors, use of the diffusion equation with theRytov approximation seems reasonable. Figure 5shows a 3-D image of the object as a sequence offrames at 3-mm intervals along the axial directionreconstructed using experimental data. The lateralposition of the object is reconstructed to be near thecylinder axis in the image map, as one would expect.However, the image is spread out with a half-width ofapproximately 20 mm along the axial direction. Theabsorption coefficient distribution appears to bepeaked more toward the detector end than the actualobject position.
Fig. 4. Images reconstructed from simulated data when the ob-ject was located at a distance of 15 mm ~z 5 45 mm! from the exit
lane. The sequence of circles represents images at 3-mm inter-als along the cylinder axis. The linear intensity scale spans theange 0–20. The maximum value of Dma~r! is 0.04 mm21 and the
size of the object is 3 3 3 3 3 mm3.

rOaTPas
emcisiuT
dso~6aftstqtetitsedswt
D
tigFoo
rn
One of the edges of the object was placed on the axisfor experimental simplicity only and should not beconsidered a limitation of the present IIR approach.Reconstruction using simulated data produced a sta-ble solution even when the object was located closerto the cylinder boundary than to the cylinder axis.
5. Discussion
Results of this study indicate that the time-slicedtransmission measurements along with the diffusiontomographic IIR method can provide a 3-D map of thelocation of the object inside a biological tissue-simulating turbid medium. A salient feature of theapproach is how short a time it takes for inversereconstruction. Our estimate shows that a 3-D im-age of 10 3 36 3 20 voxels can be obtained with aunning time of less than 1 min on a Silicon Graphicsrigin-2000 computer when only one of its four par-llel 195-MHz CPU’s is used in the computation.he speed is comparable with that of a 200-MHzentium CPU. Combined with a fast data-cquisition scheme that we developed, this algorithmhows the potential for near-real-time IIR.The reconstructed image of the object has the lat-
ral position that one would expect from the experi-ental arrangement. The axial position is less
ertain, as the change in absorption coefficient Dma~r!s more spread out in the axial direction. Compari-on with image reconstructed from simulated datandicates that better axial localization is obtainedsing simulated data than that from the experiment.he position of the object in the reconstructed image
Fig. 5. Images reconstructed from experimental data with theobject located at a distance of 15 mm ~z 5 45 mm! from the exitplane. The sequence of circles represents images at 3-mm inter-vals along the cylinder axis.
gets shifted toward the detector plane for both thesimulated and the experimental data. The shift ismore pronounced for the image reconstructed usingexperimental data.
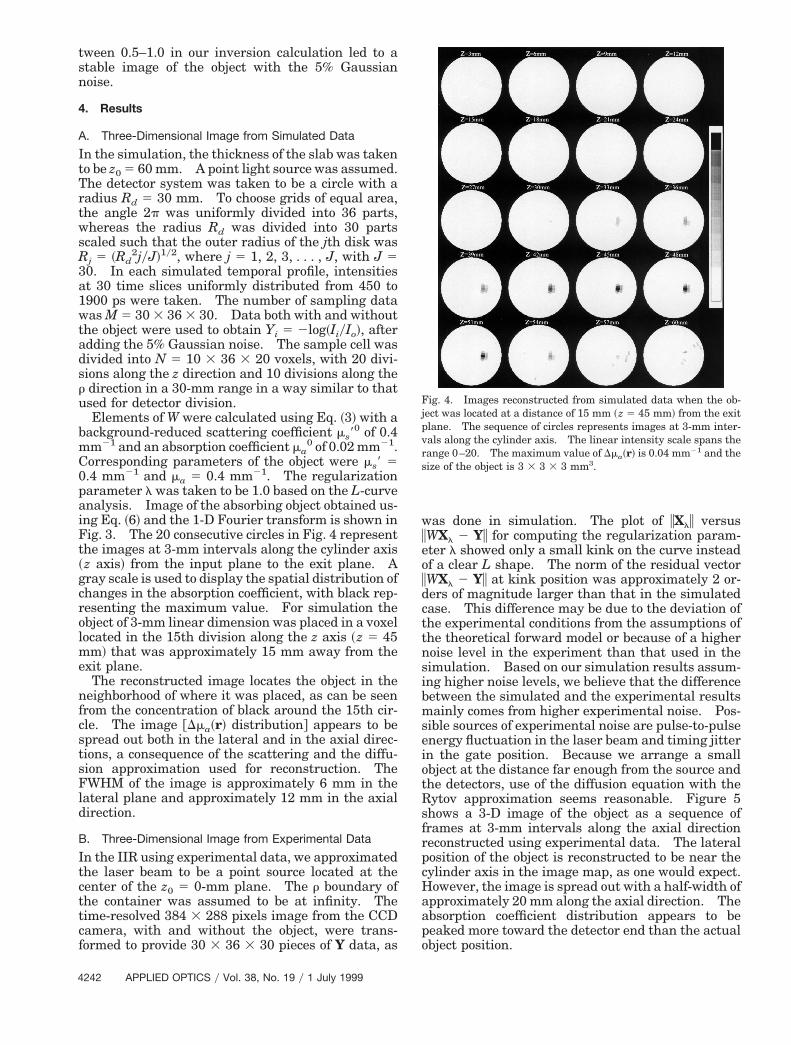
To further investigate this apparent shift in thepeak position and the extent of localization, we car-ried out inverse reconstruction with simulated data~a! for different axial positions of the object and ~b! for
ifferent noise levels. Reconstructed images usingimulated data with a 5% Gaussian noise level forbject locations of 30 mm ~z 5 30 mm! and 45 mmz 5 15 mm! from the exit plane are shown in Figs.~a! and 6~b!, respectively. Figures 6~a! and 6~b!long with Fig. 4 indicate that, as the object is movedurther away from the detector end, its localization inhe reconstructed images becomes poorer. The ab-orption coefficient change Dma~r! spreads out both inhe axial and in the lateral directions with a conse-uent decrease in its peak value as the object dis-ance from the exit plane increases. The result isxpected because the further away the object is fromhe exit plane the higher is the probability for themage-bearing light to spread out and multiply scat-ered light to encroach into the region of a geometrichadow cast by the absorbing object. The overallffect is a smearing out of the shadow image. Theiffusion approximation-based model used here isensitive to that spreading and reconstructs imageshose size and sharpness depend on the object loca-
ion.The shift in the peak position of reconstructed
ma~r! distribution toward the exit plane was ob-served for all three positions of the object. A quali-tative explanation for this shift can be given in termsof the dependence of imaging sensitivity on the objectlocation. It is a common observation that for diffuselight imaging, if the object is located on the exit planeit is imaged with minimal distortion and optimalsharpness. Image sharpness decreases and distor-tion increases as the object is moved further into thescattering medium. Imaging sensitivity is then afunction that peaks on the exit plane and graduallydecreases toward the input plane. The Dma~r! dis-tribution in the reconstructed image would be pro-portional to a convolution of this function with Dma~r!distribution of the object and would be shifted towardthe exit plane.
The spreading out of the Dma~r! distribution leadso a decrease in its amplitude in the reconstructedmage as well because the magnitude of the inhomo-eneity gets distributed over a larger region of space.or a small object in three dimensions, the spreadingf its image can dramatically decrease the amplitudef imaged optical parameters, in this case Dma~r!.
This accounts for the peak amplitude of 0.04 mm21 inthe reconstructed image of Fig. 4, although the inputvalue of the inhomogeneity was 0.4 mm21.
Another consequence of the imaging sensitivity be-ing peaked on the exit plane is the observed highernoise level in the z 5 60-mm frame ~exit plane! of theeconstructed images of Figs. 4, 6~a!, and 6~b!. Theoise in the exit plane seems to be more pronounced
1 July 1999 y Vol. 38, No. 19 y APPLIED OPTICS 4243
Bptb6pnp
opoiolmbrI
4
as the object is moved toward the input plane, al-though the same 5% Gaussian noise level was usedfor all three cases. The apparent higher noise in Fig.6~b! is a consequence of the way the Dma~r! distribu-tion is displayed in these figures. The ratio of peak
Fig. 6. Images reconstructed from simulated data when the ob-ject was located at a distance of ~a! 30 mm ~z 5 30 mm! and ~b! 45mm ~z 5 15 mm! from the exit plane. The sequence of circlesrepresents images at 3-mm intervals along the cylinder axis.
244 APPLIED OPTICS y Vol. 38, No. 19 y 1 July 1999
value of Dma~r! to the magnitude of the noise leveldetermines how prominently the noise will be dis-played in the scheme used in Figs. 4, 6~a!, and 6~b!.
ecause of the object location of 45 mm from the exitlane, the peak value of Dma~r! is much smaller thanhat of the other two cases, the noise level appears toe more pronounced in the z 5 60-mm frame of Fig.~b!. Simulations with higher noise levels lend sup-ort to this observation. With a high enough inputoise level, the noise in the exit plane could be asronounced as the peak value of Dma~r! in the image
of the object.The above observations of peak shift and exit plane
noise with simulated data help explain the apparentlower localization and larger shift toward the detec-tor plane of the image from experimental data shownin Fig. 5. We ascribe these to the above-mentionedpeaking of imaging sensitivity toward the exit planeand the higher noise level in the experiment com-pared with the 5% used in simulation. Sources ofnoise could be energy fluctuation of pulses from thelaser amplifier, long-term drift of the laser output,jitters in the position and width of the time gate, andthe CCD dark noise. Ample room exists for im-provement of the experimental noise and hence objectlocalization. In this proof-of-the-principle experi-ment, our aim was to test if the algorithm providedmeaningful 3-D images from time-sliced 2-D experi-mental data.
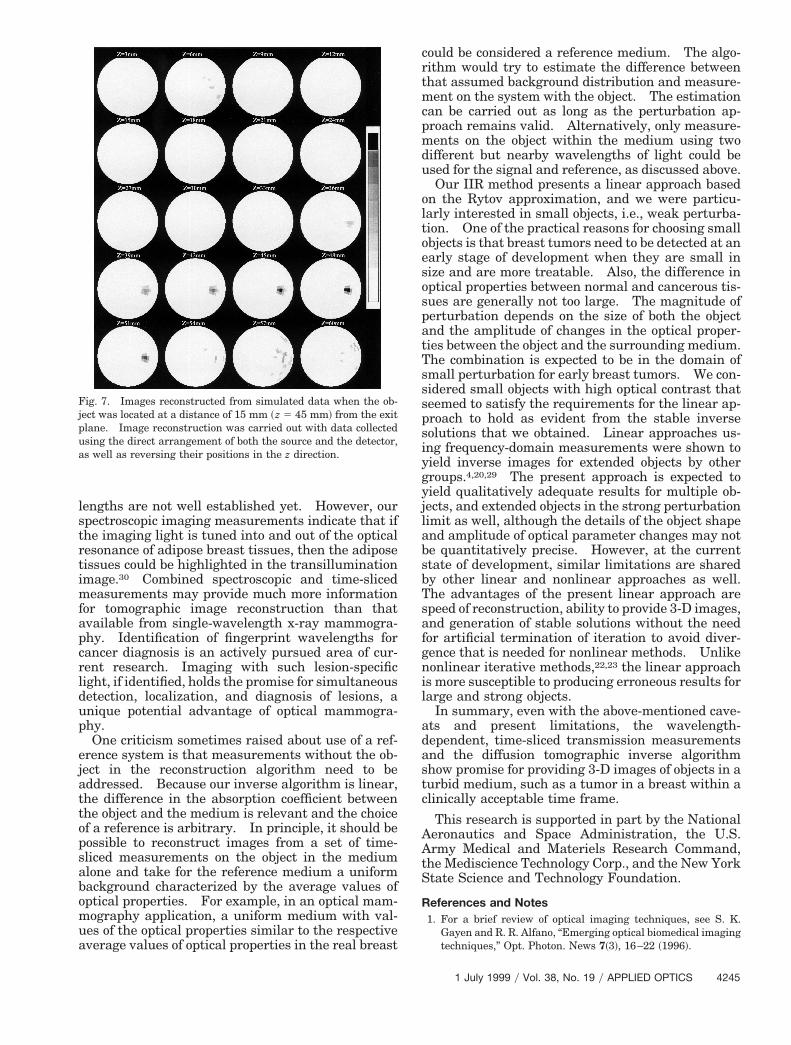
One way of reducing the magnitude of peak shiftand improving the localization of the object in thereconstructed image would be to use two sets of datafor reconstruction—one taken with the source anddetector positioned as described in the text and thesecond with the z positions of the source and detectorreversed. To test this concept, we carried out thereconstruction using the two sets of simulated data asmentioned above for the object position of Fig. 4, thatis, 15 mm toward the source from the exit plane.The result, displayed in Fig. 7, shows improvement inobject localization when compared with the image inFig. 4. The improvement will be more substantialfor an object located deeper into the scattering me-dium as a comparison of Fig. 7 with that of Fig. 6~b!reveals.
The IIR scheme presented above would be applica-ble to imaging of breast in vivo. The optical proper-ties, transport parameters, and thickness of thescattering medium used in this experiment are nottoo far removed from that of breast tissues. Al-though measurement on the breast with the lesionwould provide the signal I, the reference I0 can bebtained by using a uniform phantom with opticalarameters that are equivalent to the average valuef the parameters for the breasts. Another interest-ng possibility is to use measurements using the lightf two different but nearby wavelengths. If a wave-ength that is resonant with the lesion can be deter-
ined, then measurements at that wavelength cane used as the signal and measurements with a non-esonant wavelength can be used as the reference.t should be noted that such lesion-specific wave-
mfapcrldup
pua
lengths are not well established yet. However, ourspectroscopic imaging measurements indicate that ifthe imaging light is tuned into and out of the opticalresonance of adipose breast tissues, then the adiposetissues could be highlighted in the transilluminationimage.30 Combined spectroscopic and time-sliced
easurements may provide much more informationor tomographic image reconstruction than thatvailable from single-wavelength x-ray mammogra-hy. Identification of fingerprint wavelengths forancer diagnosis is an actively pursued area of cur-ent research. Imaging with such lesion-specificight, if identified, holds the promise for simultaneousetection, localization, and diagnosis of lesions, anique potential advantage of optical mammogra-hy.One criticism sometimes raised about use of a ref-
erence system is that measurements without the ob-ject in the reconstruction algorithm need to beaddressed. Because our inverse algorithm is linear,the difference in the absorption coefficient betweenthe object and the medium is relevant and the choiceof a reference is arbitrary. In principle, it should bepossible to reconstruct images from a set of time-sliced measurements on the object in the mediumalone and take for the reference medium a uniformbackground characterized by the average values ofoptical properties. For example, in an optical mam-mography application, a uniform medium with val-ues of the optical properties similar to the respectiveaverage values of optical properties in the real breast
Fig. 7. Images reconstructed from simulated data when the ob-ject was located at a distance of 15 mm ~z 5 45 mm! from the exit
lane. Image reconstruction was carried out with data collectedsing the direct arrangement of both the source and the detector,s well as reversing their positions in the z direction.
could be considered a reference medium. The algo-rithm would try to estimate the difference betweenthat assumed background distribution and measure-ment on the system with the object. The estimationcan be carried out as long as the perturbation ap-proach remains valid. Alternatively, only measure-ments on the object within the medium using twodifferent but nearby wavelengths of light could beused for the signal and reference, as discussed above.
Our IIR method presents a linear approach basedon the Rytov approximation, and we were particu-larly interested in small objects, i.e., weak perturba-tion. One of the practical reasons for choosing smallobjects is that breast tumors need to be detected at anearly stage of development when they are small insize and are more treatable. Also, the difference inoptical properties between normal and cancerous tis-sues are generally not too large. The magnitude ofperturbation depends on the size of both the objectand the amplitude of changes in the optical proper-ties between the object and the surrounding medium.The combination is expected to be in the domain ofsmall perturbation for early breast tumors. We con-sidered small objects with high optical contrast thatseemed to satisfy the requirements for the linear ap-proach to hold as evident from the stable inversesolutions that we obtained. Linear approaches us-ing frequency-domain measurements were shown toyield inverse images for extended objects by othergroups.4,20,29 The present approach is expected toyield qualitatively adequate results for multiple ob-jects, and extended objects in the strong perturbationlimit as well, although the details of the object shapeand amplitude of optical parameter changes may notbe quantitatively precise. However, at the currentstate of development, similar limitations are sharedby other linear and nonlinear approaches as well.The advantages of the present linear approach arespeed of reconstruction, ability to provide 3-D images,and generation of stable solutions without the needfor artificial termination of iteration to avoid diver-gence that is needed for nonlinear methods. Unlikenonlinear iterative methods,22,23 the linear approachis more susceptible to producing erroneous results forlarge and strong objects.
In summary, even with the above-mentioned cave-ats and present limitations, the wavelength-dependent, time-sliced transmission measurementsand the diffusion tomographic inverse algorithmshow promise for providing 3-D images of objects in aturbid medium, such as a tumor in a breast within aclinically acceptable time frame.
This research is supported in part by the NationalAeronautics and Space Administration, the U.S.Army Medical and Materiels Research Command,the Mediscience Technology Corp., and the New YorkState Science and Technology Foundation.
References and Notes1. For a brief review of optical imaging techniques, see S. K.
Gayen and R. R. Alfano, “Emerging optical biomedical imagingtechniques,” Opt. Photon. News 7~3!, 16–22 ~1996!.
1 July 1999 y Vol. 38, No. 19 y APPLIED OPTICS 4245
2. G. J. Muller, R. R. Alfano, S. R. Arridge, J. Beuthan, E. Grat- 18. W. Cai, B. B. Das, F. Liu, Fan An Zeng, M. Lax, and R. R.
4
ton, M. Kaschke, B. R. Masters, S. Svanberg, and P. van derZeeet, eds., Medical Optical Tomography: Functional Imag-ing and Monitoring, Vol. IS 11 of SPIE Institute Series ~SPIE,Bellingham, Wash., 1993!.
3. L. Wang, P. P. Ho, C. Liu, G. Zhang, and R. R. Alfano, “Ballistic2-D imaging through scattering wall using an ultrafast Kerrgate,” Science 253, 769–771 ~1991!.
4. M. A. O’Leary, D. A. Boas, B. Chance, and A. G. Yodh, “Ex-perimental images of heterogeneous turbid media byfrequency-domain diffusing-photon tomography,” Opt. Lett.20, 426–428 ~1995!, and relevant references therein.
5. R. R. Alfano, X. Liang, L. Wang, and P. P. Ho, “Time-resolvedimaging of translucent droplets in highly scattering turbidmedia,” Science 264, 1913–1915 ~1994!.
6. M. R. Hee, J. Izzat, J. Jacobson, J. G. Fujimoto, and E. A.Swanson, “Femtosecond transillumination optical coherencetomography,” Opt. Lett. 18, 950–952 ~1993!.
7. M. Cutler, “Transillumination as an aid in the diagnosis ofbreast lesion,” Surg. Gynecol. Obstet. 48, 721–730 ~1929!.
8. A. O. Wist, P. P. Fatouros, and S. L. Herr, “Increased spatialresolution in transillumination using collimated light,” IEEETrans. Med. Imaging 12, 751–757 ~1993!.
9. S. R. Arridge, “The forward and inverse problems in time-resolved infrared imaging,” in Medical Optical Tomography:Functional Imaging and Monitoring, Vol. IS 11 of SPIE Insti-tute Series ~SPIE, Bellingham, Wash., 1993!.
10. E. Gratton, W. Mantolin, M. vande Ven, J. Fishkin, M. Maris,and B. Chance, “A novel approach to optical tomography,”Bioimaging 1, 40–46 ~1993!, pp. 35–64.
11. E. B. de Haller, “Time-resolved transillumination and opticaltomography,” J. Biomed. Opt. 1, 7–17 ~1996!.
12. J. C. Hebden, S. R. Arridge, and D. T. Deply, “Optical imagingin medicine: I. Experimental techniques,” Phys. Med. Biol.42, 825–840 ~1997!; S. R. Arridge and J. C. Hebden, “Opticalimaging in medicine: II. Modelling and reconstruction,”Phys. Med. Biol. 42, 841–853 ~1997!.
13. E. Marshall, “Search for a killer: focus shifts from fat tohormones in a special report on breast cancer,” Science 259,618–621 ~1993!.
14. R. R. Alfano, A. Pradhan, G. C. Tang, and S. J. Wahl, “Opticalspectroscopic diagnosis of cancer and normal breast tissues,” J.Opt. Soc. Am. B 6, 1015–1023 ~1989!.
15. M. S. Feld, R. Manoharan, J. Salenius, J. Ornstein-Carndona,T. J. Romer, J. F. Brennan III, R. R. Dasari, and Y. Wang,“Detection and characterization of human tissue lesions withnear-infrared Raman spectroscopy,” in Advances in Fluores-cence Sensing Technology II, J. R. Lakowicz, ed., Proc. SPIE2388, 99–104 ~1995!.
16. K. M. Yoo and R. R. Alfano, “Time-resolved coherent and in-coherent components of forward light scattering in randommedia,” Opt. Lett. 15, 320–322 ~1990!. For a discussion of thecharacteristics of photons transmitted through a turbid me-dium, see Refs. 1 and 12 and relevant references in thosepapers.
17. W. Cai, B. B. Das, F. Liu, M. Zevallos, M. Lax, and R. R. Alfano,“Time-resolved optical diffusion tomographic image recon-struction in highly scattering turbid media,” Proc. Natl. Acad.Sci. USA 93, 13561–13564 ~1996!.
246 APPLIED OPTICS y Vol. 38, No. 19 y 1 July 1999
Alfano, “Three-dimensional image reconstruction in highlyscattering turbid media,” in Proceedings of Optical Tomogra-phy and Spectroscopy of Tissue: Theory, Instrumentation,Model, and Human Studies II, B. Chance and R. R. Alfano,eds., Proc. SPIE 2979, 241–248 ~1997!.
19. J. Singer, F. Grunbaum, P. Kohn, and J. Zubelli, “Image re-construction of the interior of the bodies that diffuse radia-tion,” Science 248, 990–992 ~1990!.
20. H. Jiang, K. D. Paulsen, U. L. Osterberg, B. W. Pogue, andM. S. Patterson, “Optical image reconstruction usingfrequency-domain data: simulations and experiments,” J.Opt. Soc. Am. A 13, 253–266 ~1996!.
21. S. B. Colak, D. G. Papaioannou, G. W. ’t Hooft, M. B. van derMark, H. Schomberg, J. C. J. Paasschens, J. B. M. Melissen,and N. A. A. J. van Asten, “Tomographic image reconstructionfrom optical projections in light-diffusing media,” Appl. Opt.36, 180–213 ~1997!.
22. A. H. Hielscher, A. Klose, D. Catarious, Jr., and K. Hanson,“Tomographic imaging of biological tissue by time-resolvedmodel-based iterative image reconstruction,” in Advances inOptical Imaging and Photon Migration, J. G. Fujimoto andM. S. Patterson, eds., Vol. 21 of 1998 OSA Trends in Optics andPhotonics ~1998!, pp. 156–161.
23. H. Jiang “Three-dimensional optical image reconstruction:finite element approach,” in Advances in Optical Imaging andPhoton Migration, J. G. Fujimoto and M. S. Patterson, eds.,Vol. 21 of 1998 OSA Trends in Optics and Photonics ~1998!, pp.168–170.
24. C. L. Matson, N. Clark, L. McMackin, and J. S. Fender,“Three-dimensional tumor localization in thick tissue withthe use of diffuse photon-density waves,” Appl. Opt. 36, 214–220 ~1997!.
25. S. R. Arridge and W. R. B. Lionheart, “Nonuniqueness indiffusion-based optical tomography,” Opt. Lett. 23, 882–884~1998!.
26. P. C. Hansen, “Analysis of discrete ill-posed problems bymeans of the L curve,” SIAM ~Soc. Ind. Appl. Math.! Rev. 34,561–580 ~1992!.
27. H. J. van Staveren, C. J. M. Moes, J. van Marle, S. A. Prahl,and M. J. van Gemert, “Light scattering in Intralipid-10% inthe wavelength range of 400–1100 nm,” Appl. Opt. 30, 4507–4514 ~1991!.
28. Q. Fu, F. Seier, S. K. Gayen, and R. R. Alfano, “High-average-power, kilohertz-repetition-rate, sub-100-fs Ti:sapphire ampli-fier system,” Opt. Lett. 22, 712–714 ~1997!.
29. M. A. O’Leary, D. A. Boas, B. Chance, and A. G. Yodh, “Simul-taneous scattering and absorption images of heterogeneousmedia using diffusive waves within the Rytov approximation,”in Proceedings of Optical Tomography and Spectroscopy ofTissue: Theory, Instrumentation, Model, and Human StudiesII, B. Chance and R. R. Alfano, eds., Proc. SPIE 2979, 320–327~1997!.
30. S. K. Gayen, M. E. Zevallos, M. Alrubaiee, J. M. Evans, andR. R. Alfano, “Two-dimensional near-infrared transillumina-tion imaging of biomedical media with a chromium-doped for-sterite laser,” Appl. Opt. 37, 5327–5336 ~1998!.
Copyright © 2022 FDOKUMEN