Optical Fibre-Based Sensors for Oil and Gas Applications - MDPI
33
sensors Review Optical Fibre-Based Sensors for Oil and Gas Applications Jincy Johny 1 , Solomon Amos 2 and Radhakrishna Prabhu 1, * Citation: Johny, J.; Amos, S.; Prabhu, R. Optical Fibre-Based Sensors for Oil and Gas Applications. Sensors 2021, 21, 6047. https://doi.org/10.3390/ s21186047 Academic Editors: Ki-Nam Joo, Felipe Guzman and Young-Jin Kim Received: 17 June 2021 Accepted: 25 August 2021 Published: 9 September 2021 Publisher’s Note: MDPI stays neutral with regard to jurisdictional claims in published maps and institutional affil- iations. Copyright: © 2021 by the authors. Licensee MDPI, Basel, Switzerland. This article is an open access article distributed under the terms and conditions of the Creative Commons Attribution (CC BY) license (https:// creativecommons.org/licenses/by/ 4.0/). 1 School of Engineering, Robert Gordon University, Aberdeen AB10 7GJ, UK; [email protected] 2 Department of Computer Science, Deramore Lane, University of York, Heslington, York YO10 5GH, UK; [email protected] * Correspondence: [email protected] Abstract: Oil and gas (O&G) explorations moving into deeper zones for enhanced oil and gas recovery are causing serious safety concerns across the world. The sensing of critical multiple parameters like high pressure, high temperature (HPHT), chemicals, etc., are required at longer distances in real-time. Traditional electrical sensors operate less effectively under these extreme environmental conditions and are susceptible to electromagnetic interference (EMI). Hence, there is a growing demand for improved sensors with enhanced measurement capabilities and also sensors that generates reliable data for enhanced oil and gas production. In addition to enhanced oil and gas recovery, the sensing technology should also be capable of monitoring the well bore integrity and safety. The sensing requirements of the O&G industry for improved sensing in deeper zones include increased transmission length, improved spatial coverage and integration of multiple sensors with multimodal sensing capability. This imposes problems like signal attenuation, crosstalks and cross sensitivities. Optical fibre-based sensors are expected to provide superior sensing capabilities compared to electrical sensors. This review paper covers a detailed review of different fibre-optic sensing technologies to identify a feasible sensing solution for the O&G industry. Keywords: optical fibre; oil and gas; sensor 1. Introduction In recent years, the recovery of hydrocarbons has become more and more difficult and challenging as exploration and production operations tend to seek new fronts into deep and ultra-deep harsh environments. As the energy demand continues to rise, there is a need for efficient management and optimization for production operations and systems to make this growing energy demand sustainable. This requires real-time monitoring of long and deep oil wells. Sensors and sensing data are vital elements in the oil and gas (O&G) industry. O&G exploration and production have been moving into unconventional depths (more than 3 km) in order to meet the growing demand for energy [1]. This results in harsh and extreme operating conditions, which are reflected by critical parameters like temperature, pressure, strain, etc. Therefore, reliable sensors which are able to continuously monitor current down-hole conditions have become very important in managing O&G reservoirs and wells [2]. For efficient O&G resource management and enhanced oil and gas recovery, real-time and dynamic monitoring technologies are required [3,4]. In order to satisfy this need, multi-point or distributed and multimodal simultaneous measurements will be advantageous for drilling and O&G production monitoring. Exploration and production process monitoring helps to prevent or detect health and safety issues and to significantly enhance O&G production [5]. Detecting and forecasting the conditions of the well at earlier stages have a considerable impact on Health, Safety and Environment (HSE), risk management, well control and cost-control strategies [6]. It enables the oil well technicians and managers to take correct decisions in a timely manner [7]. Continuous sensing and monitoring of unstable parameters like high temperature, pressure, Sensors 2021, 21, 6047. https://doi.org/10.3390/s21186047 https://www.mdpi.com/journal/sensors
-
Upload
khangminh22 -
Category
Documents
-
view
1 -
download
0
Transcript of Optical Fibre-Based Sensors for Oil and Gas Applications - MDPI

sensors
Review
Optical Fibre-Based Sensors for Oil and Gas Applications
Jincy Johny 1 , Solomon Amos 2 and Radhakrishna Prabhu 1,*
�����������������
Citation: Johny, J.; Amos, S.; Prabhu,
R. Optical Fibre-Based Sensors for Oil
and Gas Applications. Sensors 2021,
21, 6047. https://doi.org/10.3390/
s21186047
Academic Editors: Ki-Nam Joo,
Felipe Guzman and Young-Jin Kim
Received: 17 June 2021
Accepted: 25 August 2021
Published: 9 September 2021
Publisher’s Note: MDPI stays neutral
with regard to jurisdictional claims in
published maps and institutional affil-
iations.
Copyright: © 2021 by the authors.
Licensee MDPI, Basel, Switzerland.
This article is an open access article
distributed under the terms and
conditions of the Creative Commons
Attribution (CC BY) license (https://
creativecommons.org/licenses/by/
4.0/).
1 School of Engineering, Robert Gordon University, Aberdeen AB10 7GJ, UK; [email protected] Department of Computer Science, Deramore Lane, University of York, Heslington, York YO10 5GH, UK;
[email protected]* Correspondence: [email protected]
Abstract: Oil and gas (O&G) explorations moving into deeper zones for enhanced oil and gasrecovery are causing serious safety concerns across the world. The sensing of critical multipleparameters like high pressure, high temperature (HPHT), chemicals, etc., are required at longerdistances in real-time. Traditional electrical sensors operate less effectively under these extremeenvironmental conditions and are susceptible to electromagnetic interference (EMI). Hence, there is agrowing demand for improved sensors with enhanced measurement capabilities and also sensorsthat generates reliable data for enhanced oil and gas production. In addition to enhanced oil andgas recovery, the sensing technology should also be capable of monitoring the well bore integrityand safety. The sensing requirements of the O&G industry for improved sensing in deeper zonesinclude increased transmission length, improved spatial coverage and integration of multiple sensorswith multimodal sensing capability. This imposes problems like signal attenuation, crosstalks andcross sensitivities. Optical fibre-based sensors are expected to provide superior sensing capabilitiescompared to electrical sensors. This review paper covers a detailed review of different fibre-opticsensing technologies to identify a feasible sensing solution for the O&G industry.
Keywords: optical fibre; oil and gas; sensor
1. Introduction
In recent years, the recovery of hydrocarbons has become more and more difficult andchallenging as exploration and production operations tend to seek new fronts into deepand ultra-deep harsh environments. As the energy demand continues to rise, there is aneed for efficient management and optimization for production operations and systems tomake this growing energy demand sustainable. This requires real-time monitoring of longand deep oil wells.
Sensors and sensing data are vital elements in the oil and gas (O&G) industry. O&Gexploration and production have been moving into unconventional depths (more than3 km) in order to meet the growing demand for energy [1]. This results in harsh andextreme operating conditions, which are reflected by critical parameters like temperature,pressure, strain, etc. Therefore, reliable sensors which are able to continuously monitorcurrent down-hole conditions have become very important in managing O&G reservoirsand wells [2]. For efficient O&G resource management and enhanced oil and gas recovery,real-time and dynamic monitoring technologies are required [3,4]. In order to satisfy thisneed, multi-point or distributed and multimodal simultaneous measurements will beadvantageous for drilling and O&G production monitoring.
Exploration and production process monitoring helps to prevent or detect health andsafety issues and to significantly enhance O&G production [5]. Detecting and forecastingthe conditions of the well at earlier stages have a considerable impact on Health, Safety andEnvironment (HSE), risk management, well control and cost-control strategies [6]. It enablesthe oil well technicians and managers to take correct decisions in a timely manner [7].Continuous sensing and monitoring of unstable parameters like high temperature, pressure,
Sensors 2021, 21, 6047. https://doi.org/10.3390/s21186047 https://www.mdpi.com/journal/sensors
Sensors 2021, 21, 6047 2 of 33
strain, etc., are required in the O&G sector in order to protect and safeguard their valuableassets operating in the harshest and most challenging environments.
Current O&G sensing techniques are mainly based on electrical sensors, which havemany constraints when used in adverse environmental conditions [8]. These electrical sensorsoffer limited performance down-hole and are less reliable for real-time remote monitoring andcontrol. Unfortunately, O&G reservoirs exhibit some of the harshest and least accessible envi-ronments on Earth [9,10]. Increasing exploration depth results in High-Pressure High Tem-perature (HPHT) field conditions, which corresponds to temperatures above 205 ◦C/400 ◦Fand pressures more than 138 MPa/20,000 psi [11,12]. In such hostile habitats, conventionalsensors either experience failure or operate poorly. This occurs mainly due to their inability towithstand high temperature and pressure, as well as corrosive and erosive environmental con-ditions, found within the oil wells. Other limitations of traditional electrical gauges includelimited sensing range, single-point sensing capability and their inability to give continuousmonitoring which makes them unsuitable for oil well real-time monitoring applications. Inaddition, their poor Signal to Noise Ratio (SNR) due to electromagnetic interference (EMI)and their considerable size makes them highly undesirable for in-well applications [13]. Onthis account, improved technologies are to be developed to retrieve well information, in orderto safely maximize oil productivity and reduce exploration and production cost, especially inthe present situation of reduced crude oil prices.
Fibre-optic sensing technology can overcome the aforementioned limitations of theirelectrical counterparts, mainly due to their small size, electrical isolation, corrosion re-sistance, immunity to EMI and capability to operate in extreme environmental condi-tions [14,15]. The small size of fibre-optic sensors facilitates them to be safely employed overlonger distances with little or no future maintenance [16]. Moreover, they have a reducedrisk of failure when exposed to water or other reservoir and pipeline fluids and, also, theydo not have any electrical power requirements at the sensor head [17,18]. Another importantadvantage of fibre sensors is that the same optical fibre can handle dual functions. It canact as the sensing element for physical parameter measurement as well as the transmissionmedium for the sensed signal. This feature helps in the monitoring and sensing of differentO&G critical parameters from remote locations [19]. Furthermore, by exploiting the wave-length multiplexing capability of optical fibre, multi-point or distributed and multi-modalsimultaneous measurements can be easily accomplished on the same fibre [20]. Consideringall these advantages, optical fibre sensing technology offers an attractive alternative totraditional electrical sensing technology for permanent monitoring of oil well reservoirs.
The goal of this review is to explore optical fibre-based sensing technologies that cansignificantly boost the performance and withstand extreme conditions prevalent in offshoreO&G environments. Sensing in the O&G sector involves the measurement of differentparameters like pressure, temperature, vibration, flow and acoustics. Sensing should becarried out throughout all stages of O&G production, which means that the sensor should beactive on the surface, along the pipeline and even in the down-hole. The measurements are tobe taken throughout the well, from the surface to the total depth of the oil well reservoir [2].Figure 1 shows the various stages where sensors are required in the O&G industry.
The elemental part of optical sensor design is the identification of the key technol-ogy which best suits the needs of the O&G industry. There are different optical sensingmethodologies, but the selection needs to be carried out considering the environmentalconditions, application (downhole, on the surface or along the pipelines), level of sensitivityand accuracy required in physical parameter measurements.
With the worldwide decrease in oil reserves, exploitation of challenging reservoirs hasrapidly started. In comparison to standard wells, the overall production of such reservoirsentails high and complex performance instrumentation, for example, fibre-optic distributedpressure, distributed strain monitoring, distributed temperature monitoring, etc. Thedevelopment of fibre-optic sensory technology with regards to the oil and gas industry iscurrently on the rise and represents the future of well monitoring. Monitoring and datatransmission via the utilization of fibre-optic sensors and standard optical fibre in cabling

Sensors 2021, 21, 6047 3 of 33
is currently common in the refining of natural gas and standard crude oil throughoutthe world. With the trend of hydrocarbon consumption outpacing its given discovery,techniques in Enhanced Oil Recovery (EOR) are being deployed worldwide so as to increasethe apparent recoverable assets in the known reservoirs. Fibre-optic Monitoring representsan opportunity for the current oil and gas industry to manage and subsequently optimizeits resources in a more effective manner and provide real-time data in a continuous waywithout interrupting production and reducing well intervention. Visiongain had forecastedthat the expected expenditure on Fibre-Optic Monitoring by the gas and oil industry will beincreasing globally [21]. The rise of relatively expensive multi- lateral hydraulic fracturing,the continued strength of the given capital expenditure for EOR and the intense focus onimproving oil recovery make provision for the main markets for the uptake of Fibre-opticMonitoring over the next 10 years [21]. Although this exquisite technology has been aroundfor a significant period, researchers are still investigating relatively new ways that thistechnology can withstand relatively higher temperatures and significant pressures withlittle disruption. Furthermore, the application opportunities within the current oil and gasindustry for fibre-optic monitoring are poised to enable a considerable growth in spendingon fibre-optic monitoring equipment. Increased digitization in the oil and gas industry hasled to an increase in the use of fibre-optics sensing systems for production and pipelinemonitoring. The global DAS market is projected to reach USD 792 million by 2025 fromUSD 513 million in 2019, which is considered to be an impact of COVID-19 [22].
Sensors 2021, 21, x FOR PEER REVIEW 3 of 34
Figure 1. Sensor requirements in the O&G industry.
The elemental part of optical sensor design is the identification of the key technology which best suits the needs of the O&G industry. There are different optical sensing meth-odologies, but the selection needs to be carried out considering the environmental condi-tions, application (downhole, on the surface or along the pipelines), level of sensitivity and accuracy required in physical parameter measurements.
With the worldwide decrease in oil reserves, exploitation of challenging reservoirs has rapidly started. In comparison to standard wells, the overall production of such res-ervoirs entails high and complex performance instrumentation, for example, fibre-optic distributed pressure, distributed strain monitoring, distributed temperature monitoring, etc. The development of fibre-optic sensory technology with regards to the oil and gas industry is currently on the rise and represents the future of well monitoring. Monitoring and data transmission via the utilization of fibre-optic sensors and standard optical fibre in cabling is currently common in the refining of natural gas and standard crude oil throughout the world. With the trend of hydrocarbon consumption outpacing its given discovery, techniques in Enhanced Oil Recovery (EOR) are being deployed worldwide so as to increase the apparent recoverable assets in the known reservoirs. Fibre-optic Moni-toring represents an opportunity for the current oil and gas industry to manage and sub-sequently optimize its resources in a more effective manner and provide real-time data in a continuous way without interrupting production and reducing well intervention. Vi-siongain had forecasted that the expected expenditure on Fibre-Optic Monitoring by the gas and oil industry will be increasing globally [21]. The rise of relatively expensive multi- lateral hydraulic fracturing, the continued strength of the given capital expenditure for EOR and the intense focus on improving oil recovery make provision for the main markets for the uptake of Fibre-optic Monitoring over the next 10 years [21]. Although this exquis-ite technology has been around for a significant period, researchers are still investigating relatively new ways that this technology can withstand relatively higher temperatures and significant pressures with little disruption. Furthermore, the application opportuni-ties within the current oil and gas industry for fibre-optic monitoring are poised to enable a considerable growth in spending on fibre-optic monitoring equipment. Increased digit-ization in the oil and gas industry has led to an increase in the use of fibre-optics sensing systems for production and pipeline monitoring. The global DAS market is projected to reach USD 792 million by 2025 from USD 513 million in 2019, which is considered to be an impact of COVID-19 [22].
This review paper mainly aims to cover sensors for oil and gas downhole applica-tions. The following Section 2 will introduce basic elements of a fibre-optic sensor system,
Figure 1. Sensor requirements in the O&G industry.
This review paper mainly aims to cover sensors for oil and gas downhole applications.The following Section 2 will introduce basic elements of a fibre-optic sensor system, classifi-cation based on sensing methodologies (spectral-based, phase-based and polarisation-based)and their comparison. Section 3 describes different types of distributed fibre-optic sensorsused in oil and gas applications and Section 4 further explains distributed temperaturesensors (DTS) used for oil and gas well monitoring and their different configurations.
2. Optical Fibre-Based Sensors
An optical fibre sensor is composed of an optical fibre, transducer or a sensing element,detector and a light source [23]. Optical fibre is the medium through which light canpropagate and the underlying principle is total internal reflection.
Fibre-optic sensing technology has several inherent advantages which makes themvery attractive for a wide range of industrial sensing applications. The optical fibre istypically made up of a cylindrical waveguide that consists of a thin core with a refractiveindex covered by a cladding layer with a refractive index usually lower than that of thecore for a single-mode fibre (SMF).

Sensors 2021, 21, 6047 4 of 33
An SMF is made up of the core and cladding layers which are usually from fusedsilica. Light is propagated through the core of the fibre by total internal reflection (Snell’slaw) [24] and to achieve a high refractive index, the core of the fibre is usually doped withgermanium. To allow for the light energy to be maintained within the core, the refractiveindex of the core must be greater than that of the cladding. Multimode fibre has a largercore diameter that allows multiple modes of light to propagate. Photonic Crystal Fibres(PCFs), also known as microstructured fibres, represent another class of optical fibre thathas a specialised geometrical structure (core-air hole cladding) and unique properties likeguiding mechanisms and modal characteristics, making them an interesting candidate fora range of applications. To analyse polarisation effects, special fibres with modified core orcladding structures are needed. Polarisation fibres guide only one polarisation direction,thus polarising light is propagated through the fibre.
Standard telecom fibres are protected by coatings/buffer which protects the opticalfibres from mechanical and environmental stresses. The primary coatings are applied onsingle or dual layers. The buffer material provides an additional layer of protection. Forindustrial applications like oil and gas, with harsh environments/HPHT (High-PressureHigh Temperature) field conditions, special polymer coatings like polyamide [25–27]and acrylate [28] coatings are used which considerably increases the sensor sensitivitiesto temperature and strain. Standard coatings on the other side are not specified forenvironmental parameters, which can differ from the conditions in a downhole [29].
Figure 2 illustrates the light propagation through an optical fibre. If the angle ofincidence of the incident ray is greater than the critical angle (θc) then the light ray getsreflected and confined within the core, else it is refracted. The critical angle is defined bySnell’s law and is given by:
sin θc =n2
n1
where n1 and n2 corresponds to the core and cladding refractive indices, respectively.
Sensors 2021, 21, x FOR PEER REVIEW 5 of 34
Figure 2. Schematic of light propagation through an optical fibre.
PCFs are a special class of optical fibres with a complex refractive index profile that employs a microstructured arrangement of low-index material in a background material of higher refractive index [30]. Normally the background material used in PCFs are pure or undoped silica and the low index cladding region consists of many air voids, also known as air holes [31]. Typically, photonic crystals are periodic optical (micro or nano) structures running axially along the length of the optical fibre, which affect the propaga-tion characteristics of the electromagnetic waves travelling through its core [32].
Figure 3a,b show the cross-sectional view of the structural difference between a standard step-index SMF and a solid core PCF with microstructured cladding. The geo-metrical parameters of PCF comprise: pitch (Ʌ) which is the cladding hole centre to cen-tre distance and the diameter of the cladding air hole (d).
Figure 3. Cross-section of: (a) step-index SMF and (b) solid core PCF.
Optical fibres can be used as sensors for sensing various physical parameters like temperature, pressure, strain, etc., wherein the parameter to be sensed modulates various properties of light. From the basic principle of light propagation through an optical fibre, the light propagation changes when subjected to varying environmental conditions such as temperature and strain. By analysing the changes of the light properties through the fibre, the environmental conditions themselves can be determined. Fibre-optic sensors have been designed and developed to measure a wide range of physical parameters such as pressure [33], temperature [34], position [35], etc. Light propagated through an optical fibre can be characterized by parameters such as intensity, phase, wavelength and polar-isation. The detection of the changes of these parameters as the optical fibre interacts with
Figure 2. Schematic of light propagation through an optical fibre.
PCFs are a special class of optical fibres with a complex refractive index profile thatemploys a microstructured arrangement of low-index material in a background materialof higher refractive index [30]. Normally the background material used in PCFs are pureor undoped silica and the low index cladding region consists of many air voids, alsoknown as air holes [31]. Typically, photonic crystals are periodic optical (micro or nano)structures running axially along the length of the optical fibre, which affect the propagationcharacteristics of the electromagnetic waves travelling through its core [32].
Figure 3a,b show the cross-sectional view of the structural difference between a stan-dard step-index SMF and a solid core PCF with microstructured cladding. The geometricalparameters of PCF comprise: pitch (Λ) which is the cladding hole centre to centre distanceand the diameter of the cladding air hole (d).
Optical fibres can be used as sensors for sensing various physical parameters liketemperature, pressure, strain, etc., wherein the parameter to be sensed modulates variousproperties of light. From the basic principle of light propagation through an optical fibre,

Sensors 2021, 21, 6047 5 of 33
the light propagation changes when subjected to varying environmental conditions such astemperature and strain. By analysing the changes of the light properties through the fibre,the environmental conditions themselves can be determined. Fibre-optic sensors havebeen designed and developed to measure a wide range of physical parameters such aspressure [33], temperature [34], position [35], etc. Light propagated through an optical fibrecan be characterized by parameters such as intensity, phase, wavelength and polarisation.The detection of the changes of these parameters as the optical fibre interacts with externalperturbations can lead to the design of optical sensors capable of measuring a variety ofphysical parameters. As a result, fibre-optic sensors can be based on intensity measurement,phase (interferometric) measurement, spectral (wavelength), polarisation modulation andalso the physical quantity they measure and their effect on the electric field of the opticalsignal. Existing optical fibre sensing technologies are categorised based on the effectsused to measure physical phenomena and also the light modulation techniques used. Inoptical fibre sensors information is conveyed as a variation in intensity, frequency, phase,polarisation, wavelength or their combination of light [36]. Optical fibre sensing techniqueslike Raman [37], interferometry (Fabry-Perot, Michelson) [38–40], fibre Bragg gratings(FBG) [41], Brillouin [42], etc., are proficient to monitor different physical parameters suchas pressure, temperature, strain, chemical concentration, flow, etc. Extensive research intothe advancement of optical fibre technology for variety of applications have been ongoingfor the past 30 years which have laid the technical background for the various categoriesand their applications are expanding rapidly.
Sensors 2021, 21, x FOR PEER REVIEW 5 of 34
Figure 2. Schematic of light propagation through an optical fibre.
PCFs are a special class of optical fibres with a complex refractive index profile that employs a microstructured arrangement of low-index material in a background material of higher refractive index [30]. Normally the background material used in PCFs are pure or undoped silica and the low index cladding region consists of many air voids, also known as air holes [31]. Typically, photonic crystals are periodic optical (micro or nano) structures running axially along the length of the optical fibre, which affect the propaga-tion characteristics of the electromagnetic waves travelling through its core [32].
Figure 3a,b show the cross-sectional view of the structural difference between a standard step-index SMF and a solid core PCF with microstructured cladding. The geo-metrical parameters of PCF comprise: pitch (Ʌ) which is the cladding hole centre to cen-tre distance and the diameter of the cladding air hole (d).
Figure 3. Cross-section of: (a) step-index SMF and (b) solid core PCF.
Optical fibres can be used as sensors for sensing various physical parameters like temperature, pressure, strain, etc., wherein the parameter to be sensed modulates various properties of light. From the basic principle of light propagation through an optical fibre, the light propagation changes when subjected to varying environmental conditions such as temperature and strain. By analysing the changes of the light properties through the fibre, the environmental conditions themselves can be determined. Fibre-optic sensors have been designed and developed to measure a wide range of physical parameters such as pressure [33], temperature [34], position [35], etc. Light propagated through an optical fibre can be characterized by parameters such as intensity, phase, wavelength and polar-isation. The detection of the changes of these parameters as the optical fibre interacts with
Figure 3. Cross-section of: (a) step-index SMF and (b) solid core PCF.
Fibre-optic sensors are further divided into two subcategories: intrinsic and extrinsicsensors. For intrinsic sensors, the light is confined within the optical fibre in which thephysical quantity acts on. The performance of intrinsic sensors is largely dependent onfibre materials. While for extrinsic sensors, the light exits the fibre, get modulated by theexternal perturbation and is relaunched back into the fibre. The performance, in this case,is largely independent of the fibre material but on the sensing element.
Figure 4 shows the comparison between different optical fibre sensing technolo-gies [38–44]. The various sensors compared in Figure 4 are all intrinsic type fibre-opticsensors. Figure 4 compares the most widely used fibre-optics sensors, however, there areother categories like polarisation-based sensors, Distributed Chemical Sensors. Distributedfibre-optic sensor (Figure 5a) enables continuous measurements along the entire length ofthe sensing fibre, whereas quasi distributed or multi-point sensors (Figure 5b) carries outsensing along specific points of the fibre sensors. Multimodal fibre-optic sensors are capableof sensing multiple sensing modalities like phase, wavelength, polarisation, etc., which can

Sensors 2021, 21, 6047 6 of 33
be utilised for multi-parameter sensing. Multi-parameter sensing involves sensing multipleparameters, which can be physical parameters like temperature, pressure, vibration, etc.,or chemical parameters.
Sensors 2021, 21, x FOR PEER REVIEW 6 of 34
external perturbations can lead to the design of optical sensors capable of measuring a variety of physical parameters. As a result, fibre-optic sensors can be based on intensity measurement, phase (interferometric) measurement, spectral (wavelength), polarisation modulation and also the physical quantity they measure and their effect on the electric field of the optical signal. Existing optical fibre sensing technologies are categorised based on the effects used to measure physical phenomena and also the light modulation tech-niques used. In optical fibre sensors information is conveyed as a variation in intensity, frequency, phase, polarisation, wavelength or their combination of light [36]. Optical fibre sensing techniques like Raman [37], interferometry (Fabry-Perot, Michelson) [38–40], fibre Bragg gratings (FBG) [41], Brillouin [42], etc., are proficient to monitor different physical parameters such as pressure, temperature, strain, chemical concentration, flow, etc. Ex-tensive research into the advancement of optical fibre technology for variety of applica-tions have been ongoing for the past 30 years which have laid the technical background for the various categories and their applications are expanding rapidly.
Fibre-optic sensors are further divided into two subcategories: intrinsic and extrinsic sensors. For intrinsic sensors, the light is confined within the optical fibre in which the physical quantity acts on. The performance of intrinsic sensors is largely dependent on fibre materials. While for extrinsic sensors, the light exits the fibre, get modulated by the external perturbation and is relaunched back into the fibre. The performance, in this case, is largely independent of the fibre material but on the sensing element.
Figure 4 shows the comparison between different optical fibre sensing technologies [38–44]. The various sensors compared in Figure 4 are all intrinsic type fibre-optic sensors. Figure 4 compares the most widely used fibre-optics sensors, however, there are other categories like polarisation-based sensors, Distributed Chemical Sensors. Distributed fi-bre-optic sensor (Figure 5a) enables continuous measurements along the entire length of the sensing fibre, whereas quasi distributed or multi-point sensors (Figure 5b) carries out sensing along specific points of the fibre sensors. Multimodal fibre-optic sensors are capa-ble of sensing multiple sensing modalities like phase, wavelength, polarisation, etc., which can be utilised for multi-parameter sensing. Multi-parameter sensing involves sensing multiple parameters, which can be physical parameters like temperature, pressure, vibra-tion, etc., or chemical parameters.
Figure 4. Comparison of fibre-optic sensing technologies. Figure 4. Comparison of fibre-optic sensing technologies.
Sensors 2021, 21, x FOR PEER REVIEW 7 of 34
Figure 5. (a) Distributed fibre-optic sensor and (b) quasi-distributed fibre-optic sensor.
Propagation of light through the fibre is usually used to determine measurement in-formation by spectral characterisation (wavelength/frequency and intensity), phase char-acterisation (interferometry) and polarisation. In the following sections, operation princi-ples based on various techniques stated above are reviewed in detail.
2.1. Wavelength Modulation-Based Sensing Wavelength modulation-based optical sensing is one of the spectral techniques
which measures physical parameters by detecting a change in wavelength when the opti-cal fibre interacts with the measurand. The most common type of wavelength modulated optical sensing is fibre grating-based sensing. A grating can be produced when the core of the fibre is exposed to an intense UV laser light and was first discovered in 1978 by Hill [45]. The fibre Bragg grating sensors and long periodic grating sensors have since been developed based on this technique and have found many applications in measuring tem-perature, pressure and strain [46]. Fibre Bragg grating-based sensor was developed to measure hydrostatic pressure with a typical resolution of 0.5% by specially coating the grating region with different materials [28,47,48]. A side hole fibre Bragg grating (FBG)-based pressure sensor offers superior pressure sensitivity and lower temperature sensi-tivity allowing straightforward temperature compensation techniques to be used to form a practical downhole distributed pressure measurement system [49]. The reflectivity from the FBG sensor can be enhanced by optimising the grating parameters like grating length, effective refractive index and grating strength which is beneficial for long-distance oil and gas remote sensing applications [50]. The multiplexing capability and the zero optical power loss of the fibre grating-based sensors have led to more research in this technology. However, the long term stability and reliability of this technology have been a major chal-lenge due to the degradation of its mechanical strength and optical properties when ex-posed to harsh environments [51]. Additionally, despite the many opportunities these sensors have been slow in replacing the conventional electronic sensors over other tech-nologies, many concerns still exist. The issue of cross-sensitivity limits the scale of this technology when used in harsh environments. For fibre grating-based sensors to be used in real applications, these issues and challenges have to be minimised. FBG sensors are described more in detail in Section 2.5.
2.2. Intensity Modulation-Based Sensing Intensity modulation-based sensing is another spectral technique that measures
physical quantities based on the principle of direct detection of the change in optical power in either reflection or transmission. They are inherently simple devices where light from an optical source is propagated through the fibre and the intensity is altered at the transducer which is then returned to an optical detector. The light intensity detected by the detector is a function of the physical quantity measured. There are three different clas-ses of intensity modulation-based sensing as shown in Figure 6. They are transmission intensity, reflection intensity and micro bending intensity.
Figure 5. (a) Distributed fibre-optic sensor and (b) quasi-distributed fibre-optic sensor.
Propagation of light through the fibre is usually used to determine measurementinformation by spectral characterisation (wavelength/frequency and intensity), phasecharacterisation (interferometry) and polarisation. In the following sections, operationprinciples based on various techniques stated above are reviewed in detail.
2.1. Wavelength Modulation-Based Sensing
Wavelength modulation-based optical sensing is one of the spectral techniques whichmeasures physical parameters by detecting a change in wavelength when the opticalfibre interacts with the measurand. The most common type of wavelength modulatedoptical sensing is fibre grating-based sensing. A grating can be produced when the coreof the fibre is exposed to an intense UV laser light and was first discovered in 1978 byHill [45]. The fibre Bragg grating sensors and long periodic grating sensors have sincebeen developed based on this technique and have found many applications in measuringtemperature, pressure and strain [46]. Fibre Bragg grating-based sensor was developedto measure hydrostatic pressure with a typical resolution of 0.5% by specially coatingthe grating region with different materials [28,47,48]. A side hole fibre Bragg grating(FBG)-based pressure sensor offers superior pressure sensitivity and lower temperaturesensitivity allowing straightforward temperature compensation techniques to be used toform a practical downhole distributed pressure measurement system [49]. The reflectivityfrom the FBG sensor can be enhanced by optimising the grating parameters like grating
Sensors 2021, 21, 6047 7 of 33
length, effective refractive index and grating strength which is beneficial for long-distanceoil and gas remote sensing applications [50]. The multiplexing capability and the zerooptical power loss of the fibre grating-based sensors have led to more research in thistechnology. However, the long term stability and reliability of this technology have been amajor challenge due to the degradation of its mechanical strength and optical propertieswhen exposed to harsh environments [51]. Additionally, despite the many opportunitiesthese sensors have been slow in replacing the conventional electronic sensors over othertechnologies, many concerns still exist. The issue of cross-sensitivity limits the scale of thistechnology when used in harsh environments. For fibre grating-based sensors to be usedin real applications, these issues and challenges have to be minimised. FBG sensors aredescribed more in detail in Section 2.5.
2.2. Intensity Modulation-Based Sensing
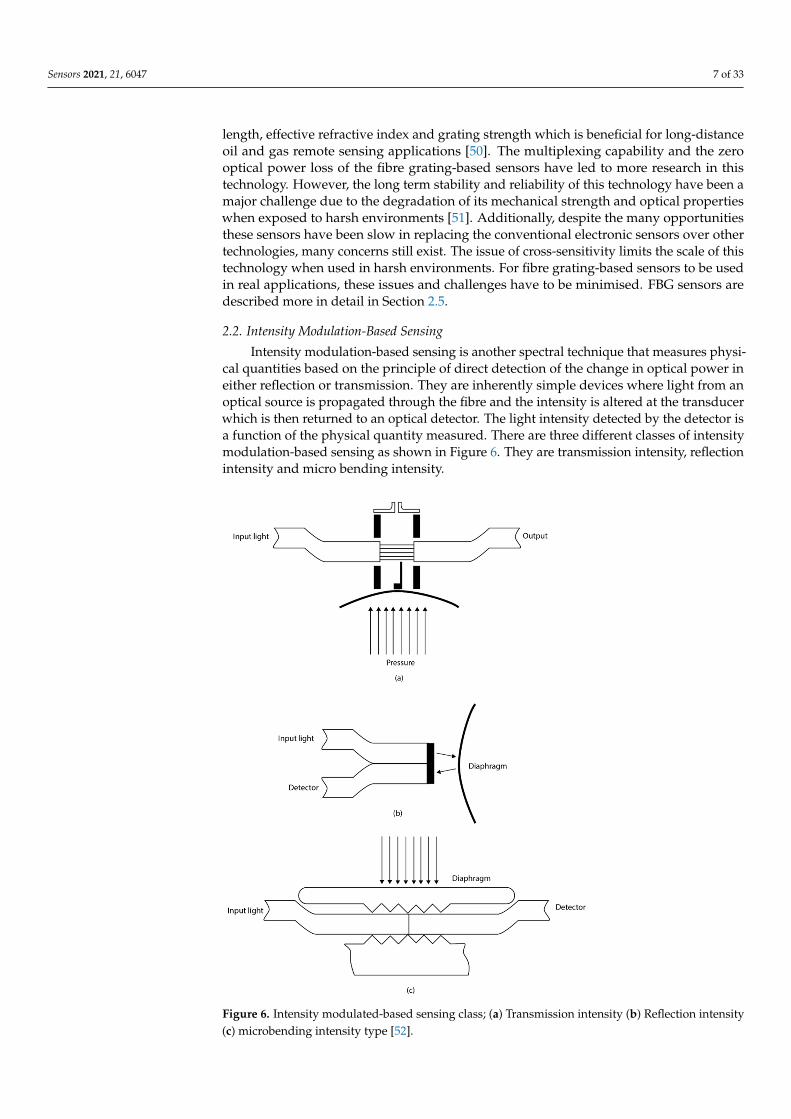
Intensity modulation-based sensing is another spectral technique that measures physi-cal quantities based on the principle of direct detection of the change in optical power ineither reflection or transmission. They are inherently simple devices where light from anoptical source is propagated through the fibre and the intensity is altered at the transducerwhich is then returned to an optical detector. The light intensity detected by the detector isa function of the physical quantity measured. There are three different classes of intensitymodulation-based sensing as shown in Figure 6. They are transmission intensity, reflectionintensity and micro bending intensity.
Sensors 2021, 21, x FOR PEER REVIEW 8 of 34
Figure 6. Intensity modulated-based sensing class; (a) Transmission intensity (b) Reflection intensity (c) microbending intensity type [52].
The transmission coupling-based sensor consists of two fibres with a small gap be-tween them, wherein the amount of light coupled to the second fibre depends on the fibre acceptance angle and the distance between the fibres. One of the fibres can move in re-sponse to vibration or pressure thereby changing the distance between the fibres and hence the coupling loss [53]. The reflection-based sensor operates in a similar fashion, where light is reflected from a flexible diaphragm back into a collecting fibre. The reflected light intensity changes as the diaphragm is flexed. Once the coupling relationship between the input fibre, diaphragm and collecting fibre is known, intensity changes can be related to the applied displacement or pressure [53]. These fibre-optic sensors can effectively measure displacement or dynamic pressure.
Intensity modulation-based sensors made with multimode fibre-optic micro bend have successfully been commercialized. It is based on the operating principle in which the mechanical periodic micro bend coupled the energy of both the radiation and guided modes thereby resulting in the attenuation of the transmitted light. Sensor configuration can be designed and constructed in such a way that the mechanical mirobending device transfers the applied perturbation to the optical intensity change. The micro bend modu-lated sensors have been reported to have good performance characteristics like good res-olution [54], however, the fluctuation of the light source and large hysteresis posed a limit to their accuracy [55]. Moreover, the large size of the microbending device makes it very difficult to be applied in many sensing applications. Raman distributed temperature sen-sors (DTS) are based on intensity modulation techniques and can be efficiently used for real-time downhole monitoring [56]. Raman DTS is described in the upcoming Section 2.6.
Figure 6. Intensity modulated-based sensing class; (a) Transmission intensity (b) Reflection intensity(c) microbending intensity type [52].
Sensors 2021, 21, 6047 8 of 33
The transmission coupling-based sensor consists of two fibres with a small gap be-tween them, wherein the amount of light coupled to the second fibre depends on thefibre acceptance angle and the distance between the fibres. One of the fibres can move inresponse to vibration or pressure thereby changing the distance between the fibres andhence the coupling loss [53]. The reflection-based sensor operates in a similar fashion,where light is reflected from a flexible diaphragm back into a collecting fibre. The reflectedlight intensity changes as the diaphragm is flexed. Once the coupling relationship betweenthe input fibre, diaphragm and collecting fibre is known, intensity changes can be related tothe applied displacement or pressure [53]. These fibre-optic sensors can effectively measuredisplacement or dynamic pressure.
Intensity modulation-based sensors made with multimode fibre-optic micro bendhave successfully been commercialized. It is based on the operating principle in which themechanical periodic micro bend coupled the energy of both the radiation and guided modesthereby resulting in the attenuation of the transmitted light. Sensor configuration can bedesigned and constructed in such a way that the mechanical mirobending device transfersthe applied perturbation to the optical intensity change. The micro bend modulated sensorshave been reported to have good performance characteristics like good resolution [54],however, the fluctuation of the light source and large hysteresis posed a limit to theiraccuracy [55]. Moreover, the large size of the microbending device makes it very difficultto be applied in many sensing applications. Raman distributed temperature sensors (DTS)are based on intensity modulation techniques and can be efficiently used for real-timedownhole monitoring [56]. Raman DTS is described in the upcoming Section 2.6.
2.3. Interferometry-Based Sensing
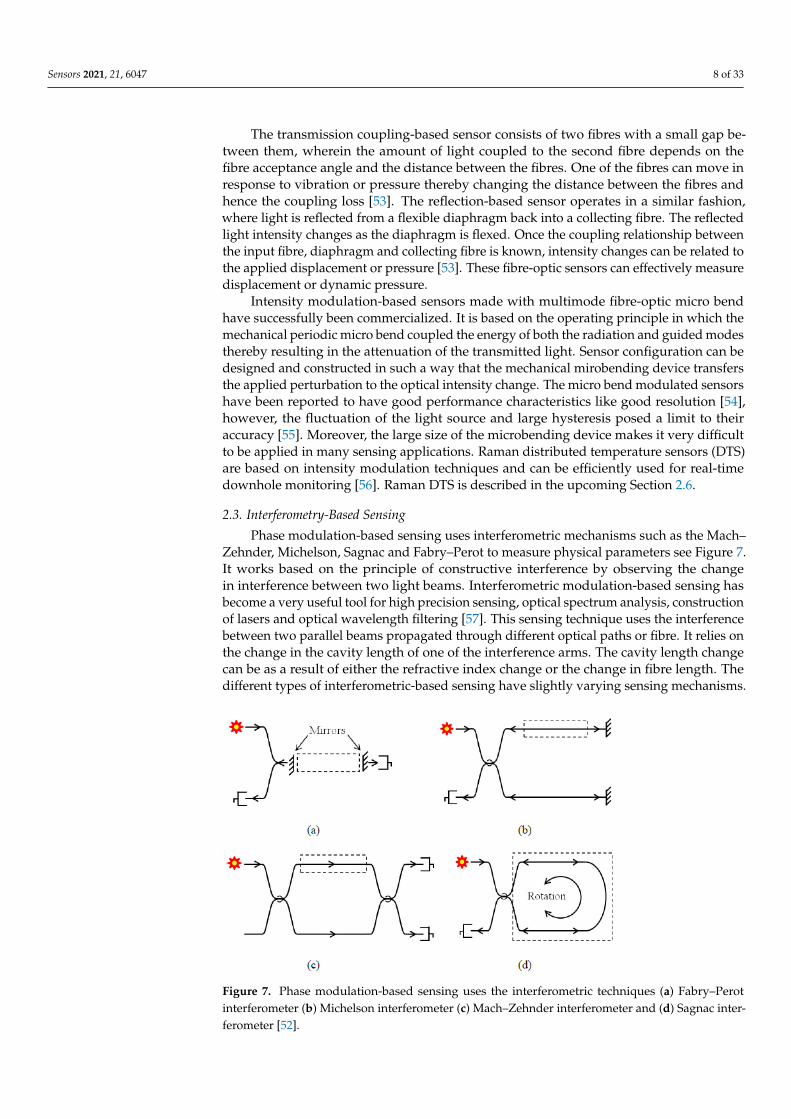
Phase modulation-based sensing uses interferometric mechanisms such as the Mach–Zehnder, Michelson, Sagnac and Fabry–Perot to measure physical parameters see Figure 7.It works based on the principle of constructive interference by observing the changein interference between two light beams. Interferometric modulation-based sensing hasbecome a very useful tool for high precision sensing, optical spectrum analysis, constructionof lasers and optical wavelength filtering [57]. This sensing technique uses the interferencebetween two parallel beams propagated through different optical paths or fibre. It relies onthe change in the cavity length of one of the interference arms. The cavity length changecan be as a result of either the refractive index change or the change in fibre length. Thedifferent types of interferometric-based sensing have slightly varying sensing mechanisms.
Sensors 2021, 21, x FOR PEER REVIEW 9 of 34
2.3. Interferometry-Based Sensing Phase modulation-based sensing uses interferometric mechanisms such as the Mach–
Zehnder, Michelson, Sagnac and Fabry–Perot to measure physical parameters see Figure 7. It works based on the principle of constructive interference by observing the change in interference between two light beams. Interferometric modulation-based sensing has be-come a very useful tool for high precision sensing, optical spectrum analysis, construction of lasers and optical wavelength filtering [57]. This sensing technique uses the interference between two parallel beams propagated through different optical paths or fibre. It relies on the change in the cavity length of one of the interference arms. The cavity length change can be as a result of either the refractive index change or the change in fibre length. The different types of interferometric-based sensing have slightly varying sensing mecha-nisms.
Figure 7. Phase modulation-based sensing uses the interferometric techniques (a) Fabry–Perot interferometer (b) Michelson interferometer (c) Mach–Zehnder interferometer and (d) Sagnac interferometer [52].
Fabry–Perot interferometer is generally designed to measure physical parameters through the formation of a cavity with two parallel reflective surfaces. When light is prop-agated through the Fabry–Perot cavity, multiple interferences of light are formed caused by the multiple reflections between the two reflective surfaces. The Fabry–Perot interfer-ometer is subdivided into two categories, intrinsic Fabry–Perot interferometer (IFPI) and extrinsic Fabry–Perot interferometer (EFPI). In IFPI, the light is confined and modulated within the fibre. The cavity length and modulation are from within the confine of the fibre. In EFPI, the light exits the fibre and is modulated before being relaunched back into the fibre. The cavity length is formed outside of the fibre and the fibre serves as the medium for transmitting light into and out of the Fabry–Perot cavity. Different configurations for FP have been proposed and developed. One configuration is to place a different fibre aligned to the first one which forms a cavity between them and is then packaged using a glass or silica, see Figure 8. An alternative method is the use of a diaphragm at the oppo-site side of the fibre end forming a cavity. Any change in the cavity length due to the deformation of the diaphragm would result in changes in interference [58].
Figure 7. Phase modulation-based sensing uses the interferometric techniques (a) Fabry–Perotinterferometer (b) Michelson interferometer (c) Mach–Zehnder interferometer and (d) Sagnac inter-ferometer [52].

Sensors 2021, 21, 6047 9 of 33
Fabry–Perot interferometer is generally designed to measure physical parametersthrough the formation of a cavity with two parallel reflective surfaces. When light ispropagated through the Fabry–Perot cavity, multiple interferences of light are formedcaused by the multiple reflections between the two reflective surfaces. The Fabry–Perotinterferometer is subdivided into two categories, intrinsic Fabry–Perot interferometer (IFPI)and extrinsic Fabry–Perot interferometer (EFPI). In IFPI, the light is confined and modulatedwithin the fibre. The cavity length and modulation are from within the confine of the fibre.In EFPI, the light exits the fibre and is modulated before being relaunched back into thefibre. The cavity length is formed outside of the fibre and the fibre serves as the mediumfor transmitting light into and out of the Fabry–Perot cavity. Different configurations for FPhave been proposed and developed. One configuration is to place a different fibre alignedto the first one which forms a cavity between them and is then packaged using a glass orsilica, see Figure 8. An alternative method is the use of a diaphragm at the opposite side ofthe fibre end forming a cavity. Any change in the cavity length due to the deformation ofthe diaphragm would result in changes in interference [58].
Sensors 2021, 21, x FOR PEER REVIEW 10 of 34
Figure 8. Different Fabry–Perot configurations (a) Illustration of IFPI formed with a single optical fibre (b) Arrangement of an EFPI formed using two optical fibres and (c) Schematic of an FP cavity formed using an optical fibre as the lead-in fibre and a deformable diaphragm [52].
The IFPI is usually fabricated by splicing a special fibre and coating the two end-faces with a reflective film. The output signal is generated by the superposition of the multiple reflections at the end-faces of the special fibre. These reflections are a result of the reflec-tance of the coating, the cavity and the refractive index of the fibre. Whenever there is a change in the cavity length or the refractive index, the interference output can be tracked thereby being able to measure any physical quantity that caused the changes of the optical properties [59].
In EFPI, the performance of the sensor depends only on the sensing element which gives it the flexibility to adapt to various sensing applications. An EFPI cavity is formed by placing an input fibre side by side to a reflecting fibre. As light is propagated through the input fibre, a fraction of it is reflected back as R1, approximately 4% and all others are transmitted into the cavity space to the reflected fibre end-face. Part of the transmitted light is also reflected back as R2 at the end-face of the reflected fibre which is then re-coupled into the input fibre. Fibre-optic interferometric acoustic sensor array has estab-lished itself as a potential alternative to the conventional sonar array based on electro-ceramic transducers for underwater or subsea applications [59]. A metal-coated hybrid sensing system based on FBG and Extrinsic Fabry–Perot Interferometer (EFPI) cavity for high-pressure high temperature (HPHT) measurement has been reported for subsea un-derwater applications wherein the FBG and EFPI are used to measure temperature and pressure, respectively [60].
Figure 8. Different Fabry–Perot configurations (a) Illustration of IFPI formed with a single opticalfibre (b) Arrangement of an EFPI formed using two optical fibres and (c) Schematic of an FP cavityformed using an optical fibre as the lead-in fibre and a deformable diaphragm [52].
The IFPI is usually fabricated by splicing a special fibre and coating the two end-faces with a reflective film. The output signal is generated by the superposition of themultiple reflections at the end-faces of the special fibre. These reflections are a result of the
Sensors 2021, 21, 6047 10 of 33
reflectance of the coating, the cavity and the refractive index of the fibre. Whenever there isa change in the cavity length or the refractive index, the interference output can be trackedthereby being able to measure any physical quantity that caused the changes of the opticalproperties [59].
In EFPI, the performance of the sensor depends only on the sensing element whichgives it the flexibility to adapt to various sensing applications. An EFPI cavity is formedby placing an input fibre side by side to a reflecting fibre. As light is propagated throughthe input fibre, a fraction of it is reflected back as R1, approximately 4% and all others aretransmitted into the cavity space to the reflected fibre end-face. Part of the transmitted lightis also reflected back as R2 at the end-face of the reflected fibre which is then recoupled intothe input fibre. Fibre-optic interferometric acoustic sensor array has established itself as apotential alternative to the conventional sonar array based on electro-ceramic transducersfor underwater or subsea applications [59]. A metal-coated hybrid sensing system basedon FBG and Extrinsic Fabry–Perot Interferometer (EFPI) cavity for high-pressure hightemperature (HPHT) measurement has been reported for subsea underwater applicationswherein the FBG and EFPI are used to measure temperature and pressure, respectively [60].
EFPI sensors have been developed and commercially available. The EFPI sensorshave many advantages over the Mach–Zehnder and Michelson sensors such as their highsensitivity, small size, good flexibility, and their simple structures. These make them veryattractive for various sensing applications. However, the EFPI have the potential of havinglow coupling efficiency due to the usual misalignment of the reflecting fibre.
Liao et al. reported a high temperature (Up to 950 ºC) sensor based on micro taperin-line fibre Mach–Zehnder interferometer, which has got wide application prospect inthe fields of high-temperature hot gas flow, as well as oil and gas field development [61].Zhao et al. introduced an ultrasensitive temperature sensor with Vernier effect-improvedfibre Michelson interferometer which is suitable for various applications that need highprecision temperature measurement [62]. A sensitive fibre-optic vibration sensor based onmixed Sagnac/Mach–Zehnder interferometers has been reported for urban gas pipelineleak detection [63].
2.4. Polarisation Modulation-Based Sensing
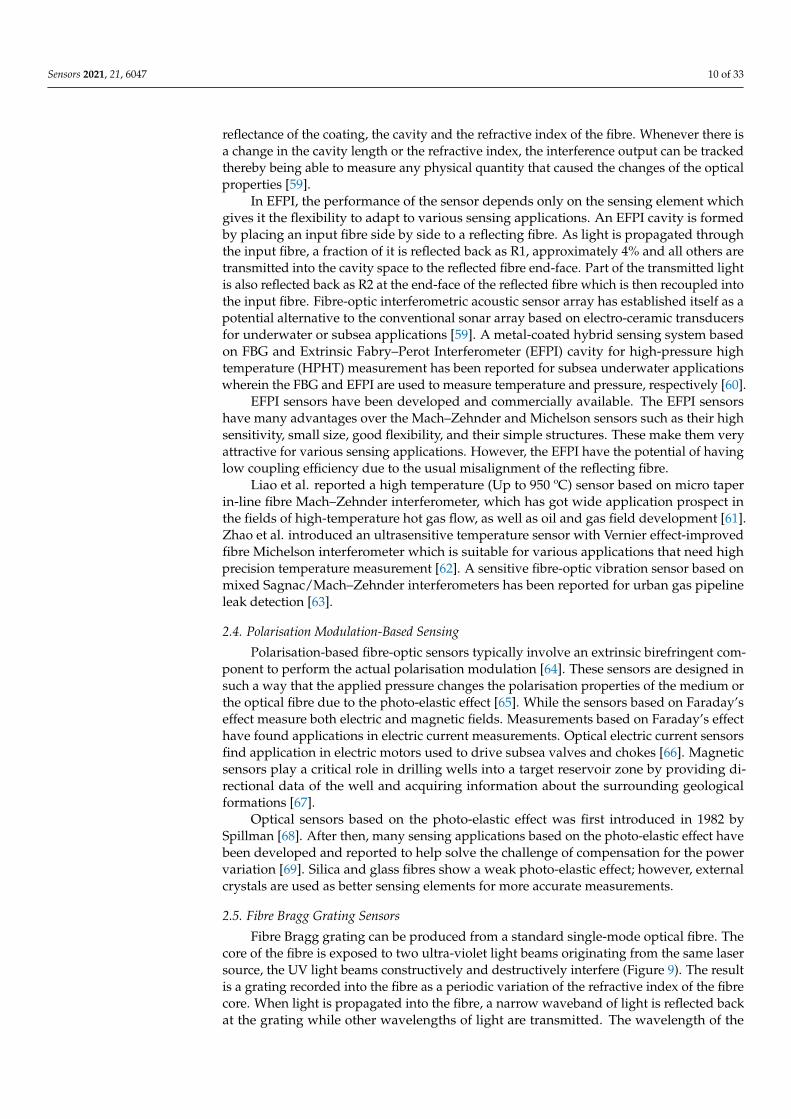
Polarisation-based fibre-optic sensors typically involve an extrinsic birefringent com-ponent to perform the actual polarisation modulation [64]. These sensors are designed insuch a way that the applied pressure changes the polarisation properties of the medium orthe optical fibre due to the photo-elastic effect [65]. While the sensors based on Faraday’seffect measure both electric and magnetic fields. Measurements based on Faraday’s effecthave found applications in electric current measurements. Optical electric current sensorsfind application in electric motors used to drive subsea valves and chokes [66]. Magneticsensors play a critical role in drilling wells into a target reservoir zone by providing di-rectional data of the well and acquiring information about the surrounding geologicalformations [67].
Optical sensors based on the photo-elastic effect was first introduced in 1982 bySpillman [68]. After then, many sensing applications based on the photo-elastic effect havebeen developed and reported to help solve the challenge of compensation for the powervariation [69]. Silica and glass fibres show a weak photo-elastic effect; however, externalcrystals are used as better sensing elements for more accurate measurements.
2.5. Fibre Bragg Grating Sensors
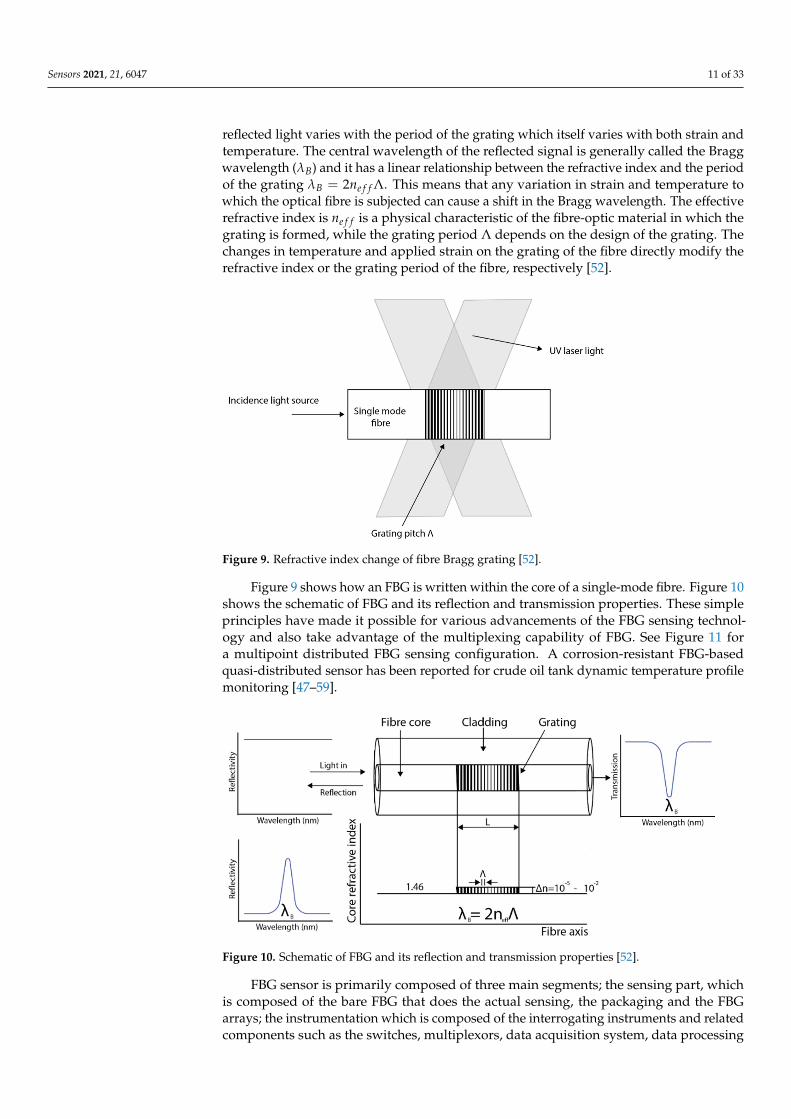
Fibre Bragg grating can be produced from a standard single-mode optical fibre. Thecore of the fibre is exposed to two ultra-violet light beams originating from the same lasersource, the UV light beams constructively and destructively interfere (Figure 9). The resultis a grating recorded into the fibre as a periodic variation of the refractive index of the fibrecore. When light is propagated into the fibre, a narrow waveband of light is reflected backat the grating while other wavelengths of light are transmitted. The wavelength of the
Sensors 2021, 21, 6047 11 of 33
reflected light varies with the period of the grating which itself varies with both strain andtemperature. The central wavelength of the reflected signal is generally called the Braggwavelength (λB) and it has a linear relationship between the refractive index and the periodof the grating λB = 2ne f f Λ. This means that any variation in strain and temperature towhich the optical fibre is subjected can cause a shift in the Bragg wavelength. The effectiverefractive index is ne f f is a physical characteristic of the fibre-optic material in which thegrating is formed, while the grating period Λ depends on the design of the grating. Thechanges in temperature and applied strain on the grating of the fibre directly modify therefractive index or the grating period of the fibre, respectively [52].
Sensors 2021, 21, x FOR PEER REVIEW 12 of 34
Figure 9. Refractive index change of fibre Bragg grating [52].
Figure 9 shows how an FBG is written within the core of a single-mode fibre. Figure 10 shows the schematic of FBG and its reflection and transmission properties. These sim-ple principles have made it possible for various advancements of the FBG sensing tech-nology and also take advantage of the multiplexing capability of FBG. See Figure 11 for a multipoint distributed FBG sensing configuration. A corrosion-resistant FBG-based quasi-distributed sensor has been reported for crude oil tank dynamic temperature profile mon-itoring [47–59].
Figure 10. Schematic of FBG and its reflection and transmission properties [52].
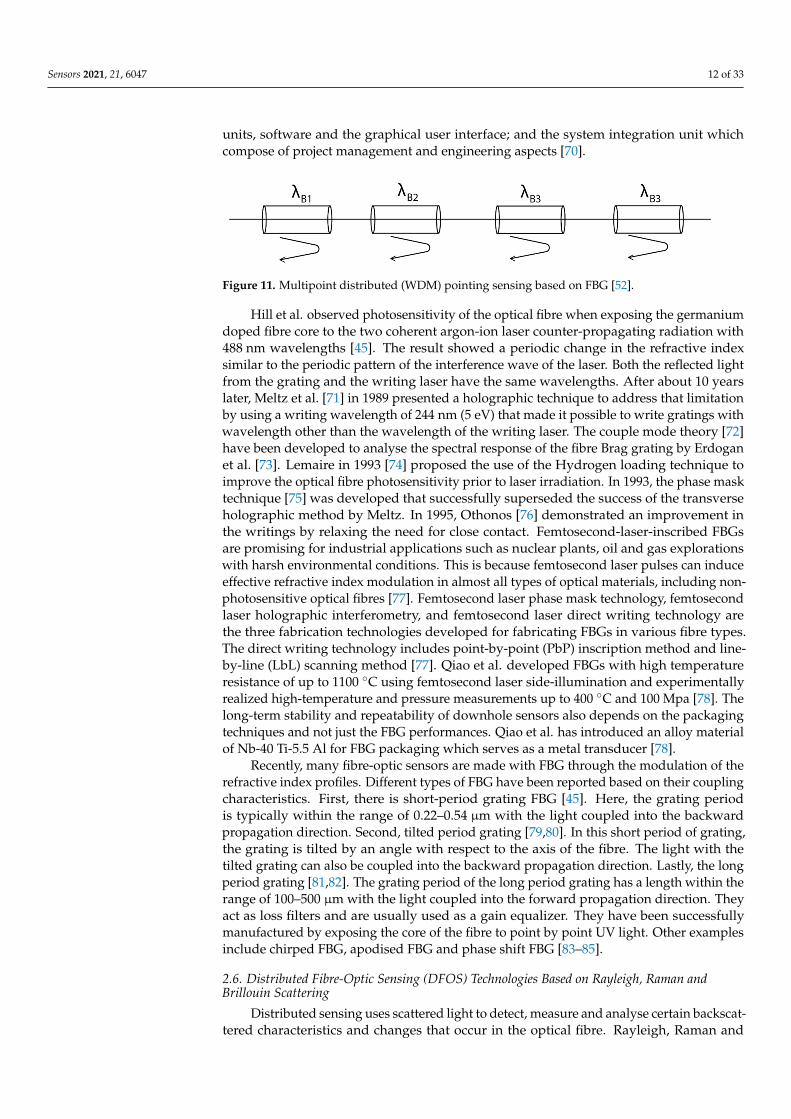
Figure 11. Multipoint distributed (WDM) pointing sensing based on FBG [52].
FBG sensor is primarily composed of three main segments; the sensing part, which is composed of the bare FBG that does the actual sensing, the packaging and the FBG arrays; the instrumentation which is composed of the interrogating instruments and re-lated components such as the switches, multiplexors, data acquisition system, data pro-cessing units, software and the graphical user interface; and the system integration unit which compose of project management and engineering aspects [70].
Figure 9. Refractive index change of fibre Bragg grating [52].
Figure 9 shows how an FBG is written within the core of a single-mode fibre. Figure 10shows the schematic of FBG and its reflection and transmission properties. These simpleprinciples have made it possible for various advancements of the FBG sensing technol-ogy and also take advantage of the multiplexing capability of FBG. See Figure 11 fora multipoint distributed FBG sensing configuration. A corrosion-resistant FBG-basedquasi-distributed sensor has been reported for crude oil tank dynamic temperature profilemonitoring [47–59].
Sensors 2021, 21, x FOR PEER REVIEW 12 of 34
Figure 9. Refractive index change of fibre Bragg grating [52].
Figure 9 shows how an FBG is written within the core of a single-mode fibre. Figure 10 shows the schematic of FBG and its reflection and transmission properties. These sim-ple principles have made it possible for various advancements of the FBG sensing tech-nology and also take advantage of the multiplexing capability of FBG. See Figure 11 for a multipoint distributed FBG sensing configuration. A corrosion-resistant FBG-based quasi-distributed sensor has been reported for crude oil tank dynamic temperature profile mon-itoring [47–59].
Figure 10. Schematic of FBG and its reflection and transmission properties [52].
Figure 11. Multipoint distributed (WDM) pointing sensing based on FBG [52].
FBG sensor is primarily composed of three main segments; the sensing part, which is composed of the bare FBG that does the actual sensing, the packaging and the FBG arrays; the instrumentation which is composed of the interrogating instruments and re-lated components such as the switches, multiplexors, data acquisition system, data pro-cessing units, software and the graphical user interface; and the system integration unit which compose of project management and engineering aspects [70].
Figure 10. Schematic of FBG and its reflection and transmission properties [52].
FBG sensor is primarily composed of three main segments; the sensing part, whichis composed of the bare FBG that does the actual sensing, the packaging and the FBGarrays; the instrumentation which is composed of the interrogating instruments and relatedcomponents such as the switches, multiplexors, data acquisition system, data processing
Sensors 2021, 21, 6047 12 of 33
units, software and the graphical user interface; and the system integration unit whichcompose of project management and engineering aspects [70].
Sensors 2021, 21, x FOR PEER REVIEW 12 of 34
Figure 9. Refractive index change of fibre Bragg grating [52].
Figure 9 shows how an FBG is written within the core of a single-mode fibre. Figure 10 shows the schematic of FBG and its reflection and transmission properties. These sim-ple principles have made it possible for various advancements of the FBG sensing tech-nology and also take advantage of the multiplexing capability of FBG. See Figure 11 for a multipoint distributed FBG sensing configuration. A corrosion-resistant FBG-based quasi-distributed sensor has been reported for crude oil tank dynamic temperature profile mon-itoring [47–59].
Figure 10. Schematic of FBG and its reflection and transmission properties [52].
Figure 11. Multipoint distributed (WDM) pointing sensing based on FBG [52].
FBG sensor is primarily composed of three main segments; the sensing part, which is composed of the bare FBG that does the actual sensing, the packaging and the FBG arrays; the instrumentation which is composed of the interrogating instruments and re-lated components such as the switches, multiplexors, data acquisition system, data pro-cessing units, software and the graphical user interface; and the system integration unit which compose of project management and engineering aspects [70].
Figure 11. Multipoint distributed (WDM) pointing sensing based on FBG [52].
Hill et al. observed photosensitivity of the optical fibre when exposing the germaniumdoped fibre core to the two coherent argon-ion laser counter-propagating radiation with488 nm wavelengths [45]. The result showed a periodic change in the refractive indexsimilar to the periodic pattern of the interference wave of the laser. Both the reflected lightfrom the grating and the writing laser have the same wavelengths. After about 10 yearslater, Meltz et al. [71] in 1989 presented a holographic technique to address that limitationby using a writing wavelength of 244 nm (5 eV) that made it possible to write gratings withwavelength other than the wavelength of the writing laser. The couple mode theory [72]have been developed to analyse the spectral response of the fibre Brag grating by Erdoganet al. [73]. Lemaire in 1993 [74] proposed the use of the Hydrogen loading technique toimprove the optical fibre photosensitivity prior to laser irradiation. In 1993, the phase masktechnique [75] was developed that successfully superseded the success of the transverseholographic method by Meltz. In 1995, Othonos [76] demonstrated an improvement inthe writings by relaxing the need for close contact. Femtosecond-laser-inscribed FBGsare promising for industrial applications such as nuclear plants, oil and gas explorationswith harsh environmental conditions. This is because femtosecond laser pulses can induceeffective refractive index modulation in almost all types of optical materials, including non-photosensitive optical fibres [77]. Femtosecond laser phase mask technology, femtosecondlaser holographic interferometry, and femtosecond laser direct writing technology arethe three fabrication technologies developed for fabricating FBGs in various fibre types.The direct writing technology includes point-by-point (PbP) inscription method and line-by-line (LbL) scanning method [77]. Qiao et al. developed FBGs with high temperatureresistance of up to 1100 ◦C using femtosecond laser side-illumination and experimentallyrealized high-temperature and pressure measurements up to 400 ◦C and 100 Mpa [78]. Thelong-term stability and repeatability of downhole sensors also depends on the packagingtechniques and not just the FBG performances. Qiao et al. has introduced an alloy materialof Nb-40 Ti-5.5 Al for FBG packaging which serves as a metal transducer [78].
Recently, many fibre-optic sensors are made with FBG through the modulation of therefractive index profiles. Different types of FBG have been reported based on their couplingcharacteristics. First, there is short-period grating FBG [45]. Here, the grating periodis typically within the range of 0.22–0.54 µm with the light coupled into the backwardpropagation direction. Second, tilted period grating [79,80]. In this short period of grating,the grating is tilted by an angle with respect to the axis of the fibre. The light with thetilted grating can also be coupled into the backward propagation direction. Lastly, the longperiod grating [81,82]. The grating period of the long period grating has a length within therange of 100–500 µm with the light coupled into the forward propagation direction. Theyact as loss filters and are usually used as a gain equalizer. They have been successfullymanufactured by exposing the core of the fibre to point by point UV light. Other examplesinclude chirped FBG, apodised FBG and phase shift FBG [83–85].
2.6. Distributed Fibre-Optic Sensing (DFOS) Technologies Based on Rayleigh, Raman andBrillouin Scattering
Distributed sensing uses scattered light to detect, measure and analyse certain backscat-tered characteristics and changes that occur in the optical fibre. Rayleigh, Raman and
Sensors 2021, 21, 6047 13 of 33
Brillouin type scattering are used in order to measure those changes. Distributed systemsare based on two main techniques: optical time-domain reflectometry (OTDR) and opticalfrequency domain reflectometry (OFDR) with the purpose of measuring the optical loss dis-tribution along a fibre in order to evaluate along the fibre its condition and to detect, locateand quantify the losses and defects all along. In this principle, a pulse of light is launchedthrough the fibre and the optical properties of the backscattered light are measured [86].
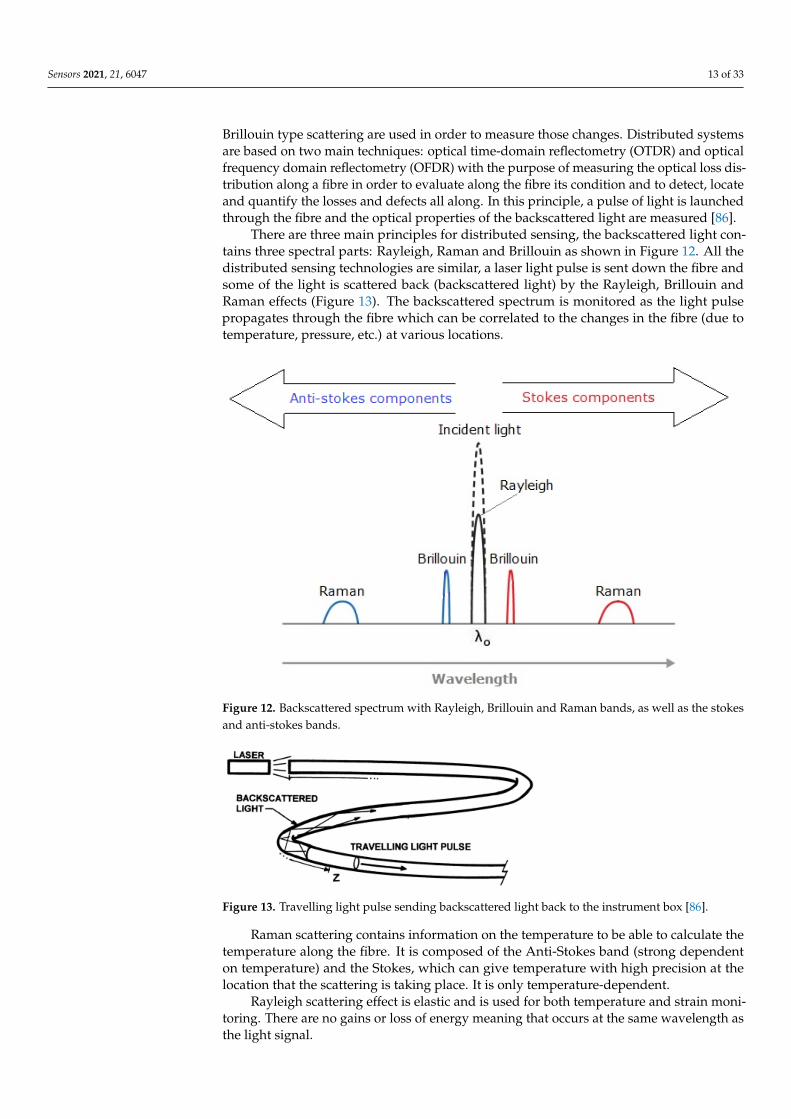
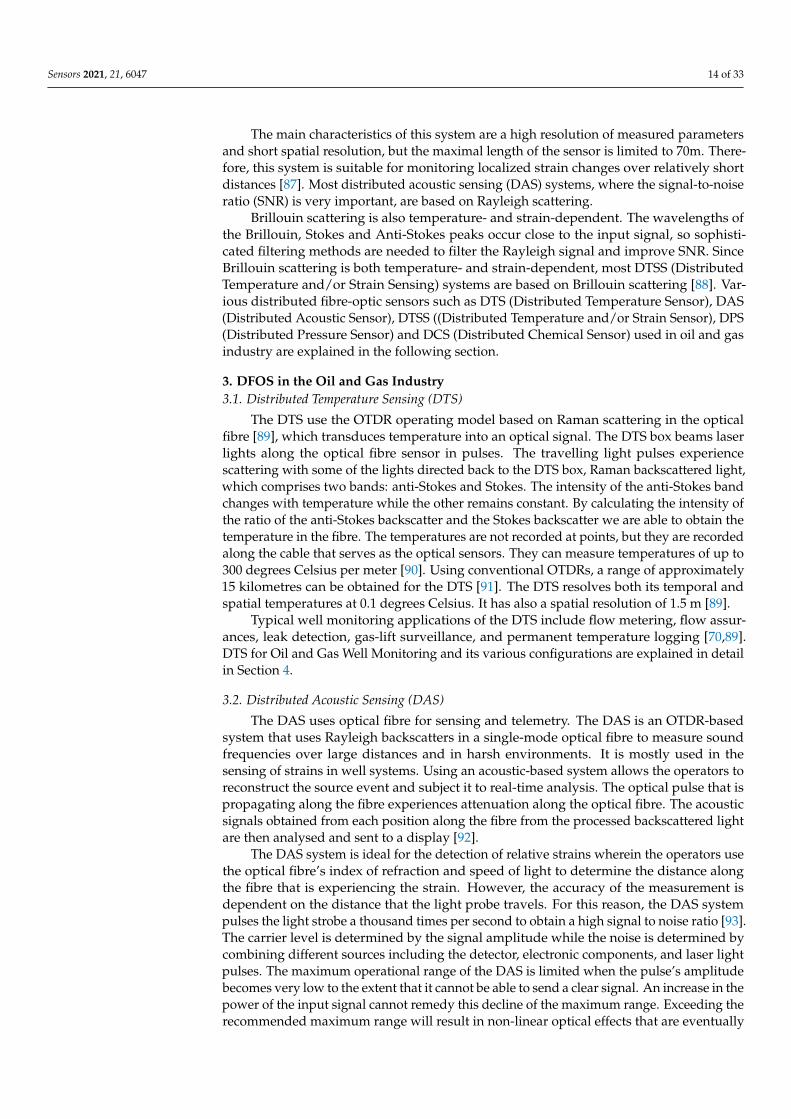
There are three main principles for distributed sensing, the backscattered light con-tains three spectral parts: Rayleigh, Raman and Brillouin as shown in Figure 12. All thedistributed sensing technologies are similar, a laser light pulse is sent down the fibre andsome of the light is scattered back (backscattered light) by the Rayleigh, Brillouin andRaman effects (Figure 13). The backscattered spectrum is monitored as the light pulsepropagates through the fibre which can be correlated to the changes in the fibre (due totemperature, pressure, etc.) at various locations.
Sensors 2021, 21, x FOR PEER REVIEW 14 of 34
distributed sensing technologies are similar, a laser light pulse is sent down the fibre and some of the light is scattered back (backscattered light) by the Rayleigh, Brillouin and Ra-man effects (Figure 13). The backscattered spectrum is monitored as the light pulse prop-agates through the fibre which can be correlated to the changes in the fibre (due to tem-perature, pressure, etc.) at various locations.
Figure 12. Backscattered spectrum with Rayleigh, Brillouin and Raman bands, as well as the stokes and anti-stokes bands.
Figure 13. Travelling light pulse sending backscattered light back to the instrument box [86].
Raman scattering contains information on the temperature to be able to calculate the temperature along the fibre. It is composed of the Anti-Stokes band (strong dependent on temperature) and the Stokes, which can give temperature with high precision at the loca-tion that the scattering is taking place. It is only temperature-dependent.
Rayleigh scattering effect is elastic and is used for both temperature and strain mon-itoring. There are no gains or loss of energy meaning that occurs at the same wavelength as the light signal.
The main characteristics of this system are a high resolution of measured parameters and short spatial resolution, but the maximal length of the sensor is limited to 70m. There-fore, this system is suitable for monitoring localized strain changes over relatively short distances [87]. Most distributed acoustic sensing (DAS) systems, where the signal-to-noise ratio (SNR) is very important, are based on Rayleigh scattering.
Brillouin scattering is also temperature- and strain-dependent. The wavelengths of the Brillouin, Stokes and Anti-Stokes peaks occur close to the input signal, so sophisticated
Figure 12. Backscattered spectrum with Rayleigh, Brillouin and Raman bands, as well as the stokesand anti-stokes bands.
Sensors 2021, 21, x FOR PEER REVIEW 14 of 34
distributed sensing technologies are similar, a laser light pulse is sent down the fibre and some of the light is scattered back (backscattered light) by the Rayleigh, Brillouin and Ra-man effects (Figure 13). The backscattered spectrum is monitored as the light pulse prop-agates through the fibre which can be correlated to the changes in the fibre (due to tem-perature, pressure, etc.) at various locations.
Figure 12. Backscattered spectrum with Rayleigh, Brillouin and Raman bands, as well as the stokes and anti-stokes bands.
Figure 13. Travelling light pulse sending backscattered light back to the instrument box [86].
Raman scattering contains information on the temperature to be able to calculate the temperature along the fibre. It is composed of the Anti-Stokes band (strong dependent on temperature) and the Stokes, which can give temperature with high precision at the loca-tion that the scattering is taking place. It is only temperature-dependent.
Rayleigh scattering effect is elastic and is used for both temperature and strain mon-itoring. There are no gains or loss of energy meaning that occurs at the same wavelength as the light signal.
The main characteristics of this system are a high resolution of measured parameters and short spatial resolution, but the maximal length of the sensor is limited to 70m. There-fore, this system is suitable for monitoring localized strain changes over relatively short distances [87]. Most distributed acoustic sensing (DAS) systems, where the signal-to-noise ratio (SNR) is very important, are based on Rayleigh scattering.
Brillouin scattering is also temperature- and strain-dependent. The wavelengths of the Brillouin, Stokes and Anti-Stokes peaks occur close to the input signal, so sophisticated
Figure 13. Travelling light pulse sending backscattered light back to the instrument box [86].
Raman scattering contains information on the temperature to be able to calculate thetemperature along the fibre. It is composed of the Anti-Stokes band (strong dependenton temperature) and the Stokes, which can give temperature with high precision at thelocation that the scattering is taking place. It is only temperature-dependent.
Rayleigh scattering effect is elastic and is used for both temperature and strain moni-toring. There are no gains or loss of energy meaning that occurs at the same wavelength asthe light signal.
Sensors 2021, 21, 6047 14 of 33
The main characteristics of this system are a high resolution of measured parametersand short spatial resolution, but the maximal length of the sensor is limited to 70m. There-fore, this system is suitable for monitoring localized strain changes over relatively shortdistances [87]. Most distributed acoustic sensing (DAS) systems, where the signal-to-noiseratio (SNR) is very important, are based on Rayleigh scattering.
Brillouin scattering is also temperature- and strain-dependent. The wavelengths ofthe Brillouin, Stokes and Anti-Stokes peaks occur close to the input signal, so sophisti-cated filtering methods are needed to filter the Rayleigh signal and improve SNR. SinceBrillouin scattering is both temperature- and strain-dependent, most DTSS (DistributedTemperature and/or Strain Sensing) systems are based on Brillouin scattering [88]. Var-ious distributed fibre-optic sensors such as DTS (Distributed Temperature Sensor), DAS(Distributed Acoustic Sensor), DTSS ((Distributed Temperature and/or Strain Sensor), DPS(Distributed Pressure Sensor) and DCS (Distributed Chemical Sensor) used in oil and gasindustry are explained in the following section.
3. DFOS in the Oil and Gas Industry3.1. Distributed Temperature Sensing (DTS)
The DTS use the OTDR operating model based on Raman scattering in the opticalfibre [89], which transduces temperature into an optical signal. The DTS box beams laserlights along the optical fibre sensor in pulses. The travelling light pulses experiencescattering with some of the lights directed back to the DTS box, Raman backscattered light,which comprises two bands: anti-Stokes and Stokes. The intensity of the anti-Stokes bandchanges with temperature while the other remains constant. By calculating the intensity ofthe ratio of the anti-Stokes backscatter and the Stokes backscatter we are able to obtain thetemperature in the fibre. The temperatures are not recorded at points, but they are recordedalong the cable that serves as the optical sensors. They can measure temperatures of up to300 degrees Celsius per meter [90]. Using conventional OTDRs, a range of approximately15 kilometres can be obtained for the DTS [91]. The DTS resolves both its temporal andspatial temperatures at 0.1 degrees Celsius. It has also a spatial resolution of 1.5 m [89].
Typical well monitoring applications of the DTS include flow metering, flow assur-ances, leak detection, gas-lift surveillance, and permanent temperature logging [70,89].DTS for Oil and Gas Well Monitoring and its various configurations are explained in detailin Section 4.
3.2. Distributed Acoustic Sensing (DAS)
The DAS uses optical fibre for sensing and telemetry. The DAS is an OTDR-basedsystem that uses Rayleigh backscatters in a single-mode optical fibre to measure soundfrequencies over large distances and in harsh environments. It is mostly used in thesensing of strains in well systems. Using an acoustic-based system allows the operators toreconstruct the source event and subject it to real-time analysis. The optical pulse that ispropagating along the fibre experiences attenuation along the optical fibre. The acousticsignals obtained from each position along the fibre from the processed backscattered lightare then analysed and sent to a display [92].
The DAS system is ideal for the detection of relative strains wherein the operators usethe optical fibre’s index of refraction and speed of light to determine the distance alongthe fibre that is experiencing the strain. However, the accuracy of the measurement isdependent on the distance that the light probe travels. For this reason, the DAS systempulses the light strobe a thousand times per second to obtain a high signal to noise ratio [93].The carrier level is determined by the signal amplitude while the noise is determined bycombining different sources including the detector, electronic components, and laser lightpulses. The maximum operational range of the DAS is limited when the pulse’s amplitudebecomes very low to the extent that it cannot be able to send a clear signal. An increase in thepower of the input signal cannot remedy this decline of the maximum range. Exceeding therecommended maximum range will result in non-linear optical effects that are eventually
Sensors 2021, 21, 6047 15 of 33
disruptive to the entire optical fibre system. The DAS system’s effective fibre length is10 km. The spatial down sampling is equal or less than 1 m while the frequency range isup to 10 kHz [94].
DAS is preferable in wellbore diagnostics to monitor various factors. It can be used todetermine the location of a leak flow caused by pressure bleeding. It can differentiate asingle-phase flow from a two-phase flow. The peak noise can estimate the rate of leaking.The system can also distinguish between the matrix flow, borehole flow, fracture flow, andchannelling [93]. The appropriateness of the DAS system in these operations is due to thefollowing factors. First, the low acoustic frequencies enable the DAS system to provide acontinuous full wellbore coverage [95]. Second, the acquisition of operational data from anentire well takes only minutes. Third, the costs of deployment are low. Fourth, the DASsystem is safer because one is not required to rig up for logging.
3.3. Distributed Temperature and/or Strain Sensing (DTSS)
The DTSS is based on the Brillouin scattering mechanism that employs the OTDRsystem. The system analyses both the thermal and strain effects of the target object by com-bining both the DTS and the DSS system. The DTS measures temperature properties whilethe DSS provides measurements that are used to the location and severity of deformationin well casing. The DSS also provides insightful data that estimate the stresses inherentat perforations during oil output stimulations. Most DTSS systems are based on the tech-nology that combines the Brillouin Optical Time Domain Reflectometer (BOTDR) with theBrillouin optical time-domain analysis (BOTDA). The BOTDA preceded the BOTDR insensor detection. It used two lasers that counter-propagate by exploiting the benefits ofBrillouin amplification. However, the system was limited to a temperature accuracy of3 degrees Celsius and a spatial resolution of 100 m over a sensing length of 1.2 km. TheBOTDR was introduced because it could monitor the system from the opposite end [96].As a result, the 1.2 km limitation in the temperature measurement range was increased toapproximately 11 km without a change in the temperature accuracy or spatial resolution.An optimally tuned DTSS system can have a maximum temperature measurement rangeof over 50 km.
The DTSS system is ideal because it can use loop or single end measurements [97]. Forthat reason, the failure of the BOTDA part of the system is not a worry because the systemswitches to the more stable BOTDR system. Second, the system is affordable because it usesa low-cost telecoms fibre that is capable of detecting both temperature and strain. Third,the system has a high spatial resolution and range. Fourth, the combination of the BOTDAand the BOTDR system enables the operator to monitor a well using multiple channels.These features make the DTSS system ideal for the monitoring of a leakage in a well fordistances of up to 140 km.
3.4. Distributed Pressure Sensing (DPS)
The core principle of DPS is the conversion of hydrostatic pressure acting along acoated optical fibre, into a distributed mechanical strain [98]. Measurements of distributedpressure can be thus inferred by converting the applied hydrostatic pressure into distributedmechanical strain acting on the fibre, and measuring the strain changes by the Brillouinscattering frequency shifts they experience [99].
The DPS is preferable because it does not require expensive optical devices. A lightsource and a light detector are the main elements that are needed in this technology.However, the DPS has some inefficiencies based on the intrinsic nature of the measurements.For example, the intensity of light often depends on quite a number of factors that cannotbe controlled easily or cannot be controlled at all. The light source’s intensity of light isoften subject to fluctuations because of certain factors such as temperature changes andageing [100]. Oxidation can also affect the efficiency of the reflectivity of the diaphragmmirror. The aspect of fibre bending with the objective of increasing power input can alsoaffect the intensity of the light that is being emitted. This disadvantage is always corrected
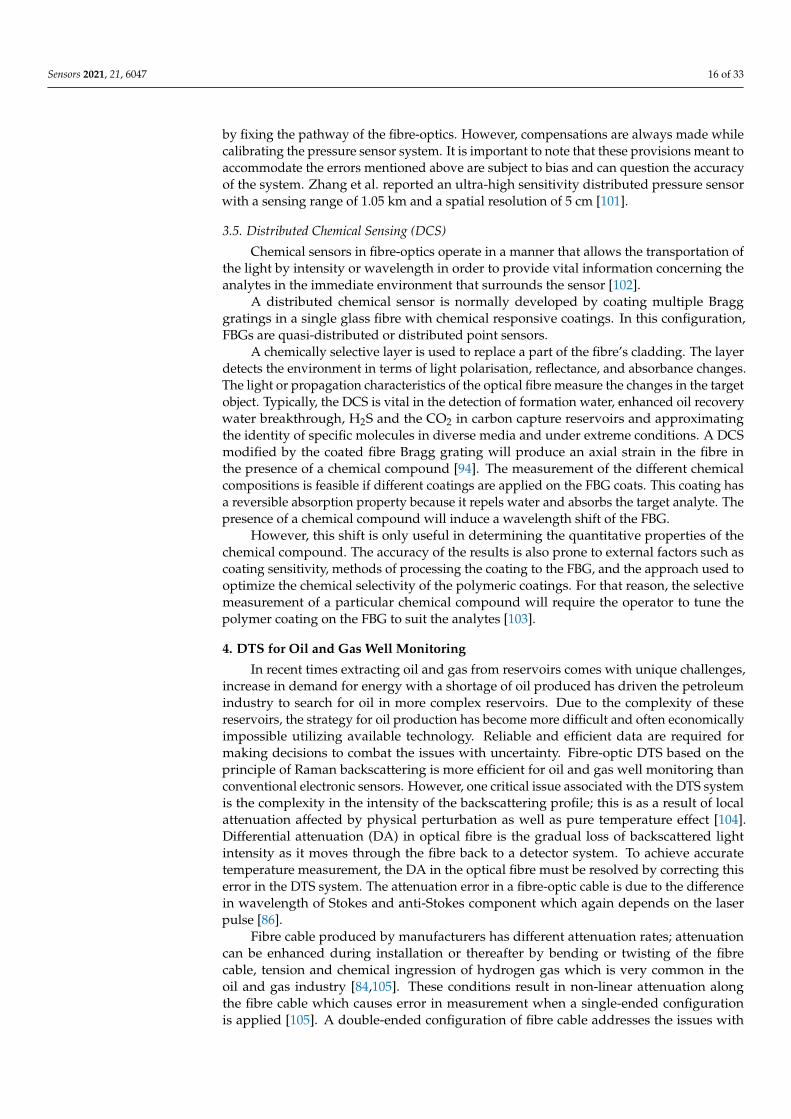
Sensors 2021, 21, 6047 16 of 33
by fixing the pathway of the fibre-optics. However, compensations are always made whilecalibrating the pressure sensor system. It is important to note that these provisions meant toaccommodate the errors mentioned above are subject to bias and can question the accuracyof the system. Zhang et al. reported an ultra-high sensitivity distributed pressure sensorwith a sensing range of 1.05 km and a spatial resolution of 5 cm [101].
3.5. Distributed Chemical Sensing (DCS)
Chemical sensors in fibre-optics operate in a manner that allows the transportation ofthe light by intensity or wavelength in order to provide vital information concerning theanalytes in the immediate environment that surrounds the sensor [102].
A distributed chemical sensor is normally developed by coating multiple Bragggratings in a single glass fibre with chemical responsive coatings. In this configuration,FBGs are quasi-distributed or distributed point sensors.
A chemically selective layer is used to replace a part of the fibre’s cladding. The layerdetects the environment in terms of light polarisation, reflectance, and absorbance changes.The light or propagation characteristics of the optical fibre measure the changes in the targetobject. Typically, the DCS is vital in the detection of formation water, enhanced oil recoverywater breakthrough, H2S and the CO2 in carbon capture reservoirs and approximatingthe identity of specific molecules in diverse media and under extreme conditions. A DCSmodified by the coated fibre Bragg grating will produce an axial strain in the fibre inthe presence of a chemical compound [94]. The measurement of the different chemicalcompositions is feasible if different coatings are applied on the FBG coats. This coating hasa reversible absorption property because it repels water and absorbs the target analyte. Thepresence of a chemical compound will induce a wavelength shift of the FBG.
However, this shift is only useful in determining the quantitative properties of thechemical compound. The accuracy of the results is also prone to external factors such ascoating sensitivity, methods of processing the coating to the FBG, and the approach used tooptimize the chemical selectivity of the polymeric coatings. For that reason, the selectivemeasurement of a particular chemical compound will require the operator to tune thepolymer coating on the FBG to suit the analytes [103].
4. DTS for Oil and Gas Well Monitoring
In recent times extracting oil and gas from reservoirs comes with unique challenges,increase in demand for energy with a shortage of oil produced has driven the petroleumindustry to search for oil in more complex reservoirs. Due to the complexity of thesereservoirs, the strategy for oil production has become more difficult and often economicallyimpossible utilizing available technology. Reliable and efficient data are required formaking decisions to combat the issues with uncertainty. Fibre-optic DTS based on theprinciple of Raman backscattering is more efficient for oil and gas well monitoring thanconventional electronic sensors. However, one critical issue associated with the DTS systemis the complexity in the intensity of the backscattering profile; this is as a result of localattenuation affected by physical perturbation as well as pure temperature effect [104].Differential attenuation (DA) in optical fibre is the gradual loss of backscattered lightintensity as it moves through the fibre back to a detector system. To achieve accuratetemperature measurement, the DA in the optical fibre must be resolved by correcting thiserror in the DTS system. The attenuation error in a fibre-optic cable is due to the differencein wavelength of Stokes and anti-Stokes component which again depends on the laserpulse [86].
Fibre cable produced by manufacturers has different attenuation rates; attenuationcan be enhanced during installation or thereafter by bending or twisting of the fibrecable, tension and chemical ingression of hydrogen gas which is very common in theoil and gas industry [84,105]. These conditions result in non-linear attenuation alongthe fibre cable which causes error in measurement when a single-ended configurationis applied [105]. A double-ended configuration of fibre cable addresses the issues with

Sensors 2021, 21, 6047 17 of 33
nonlinear attenuation by looping the cable across an area of consideration and connectingboth ends of the loop to a DTS system. The result of the experiment conducted showedsimilar accuracy when compared with single-ended configuration with linear attenuation.However, twice the length of fibre cable is needed for this system (as compared to thesingle-ended configuration) when applied in an oil or gas well [105].
Furthermore, in the event of hydrogen darkening optical transmission capability ofthe fibre is limited. Space limitation can also pose a huge problem. Hence this methodcannot be applied in all wells. Increased noise in temperature trace is prominent in thedouble-ended system due to the long length of fibre cable and consequently requires moretime for data acquisition during measurement to reduce the noise level.
Another typical way in which this problem could be resolved is by sectioning outareas in the optical fibre cable known to have nonlinear attenuation and applying theDifferential Attenuation Factor (DAF) for each section [106]. The issue with this methodis that fibre condition changes over time and the attenuation rate of these sections willchange as well hence it will require sectioning the fibre and making a correction on theDAF constantly.
This method may not be practical in cases where the attenuation rate changes continu-ously in wells. In instances where the fibre is installed in a well, acquiring the correct valuefor DAF will be difficult or impossible in most cases because the temperature at the endpoint of the fibre is required to obtain the DAF using this method [86].
The possible alternative to resolving these issues is the deployment of a single-endedoptical cable configuration which can achieve the same accuracy as the double-endedconfiguration. DTS system works with the principle of Raman scattering for temperaturemeasurement. The Raman signal has two bands, namely Stokes and anti-Stokes bands. Tocarry out this correction using a single-ended system, an extra light source is needed witha wavelength chosen in which the Stokes wavelength of the secondary sources (correctionlight source) coincides with the backscattered anti-Stokes wavelength of the primary source(measurement light source). The Stokes and anti-Stokes signals filtered from the two lightsources produce the same attenuation rate during backscattering. This technique cancelsout the DA automatically ensuring temperature measurements are accurate.
4.1. DTS Fibre Configuration in Oil Well
Fibre cable can be set up in oil and gas wells using three methods of configurations:single-ended, duplexed single-ended and double-ended configuration [105]. The methodemployed in the field can be a factor of cost, quality of information required and objectiveof installation.
All the configuration method applies the same principle of acquiring temperaturedata. The respective power level of the anti-Stokes and Stokes signals Stokes ratio) at eachpoint of measurement along the length of the fibre in the well are compiled by the DTSsystem to generate the distributed temperature measurement. Temperature change acrossthe fibre length at any given point will affect the Stokes ratio at the location of that point.The Stokes ratios of the entire length of the fibre are collected and interpreted by the DTSsystem [107]. Misleading values may be obtained due to the attenuation property of anoptical fibre cable.
4.1.1. Single-Ended Configuration
The single-ended installation is a straightforward system configuration of the fibre-optic cable in the well with one end connected to the DTS instrument and the other endran into the well for measurement over the area of consideration. This system assumesuniform differential attenuation along the entire length of the cable for calibration purposes.However, damage in the fibre cable or connector points and fusion splices can affect theattenuation rate; this phenomenon is known as step losses [108]. This type of system config-uration cannot be calibrated accurately which means that the absolute temperature cannotbe known although its spatial resolution (ability to spot a small change in temperature) is
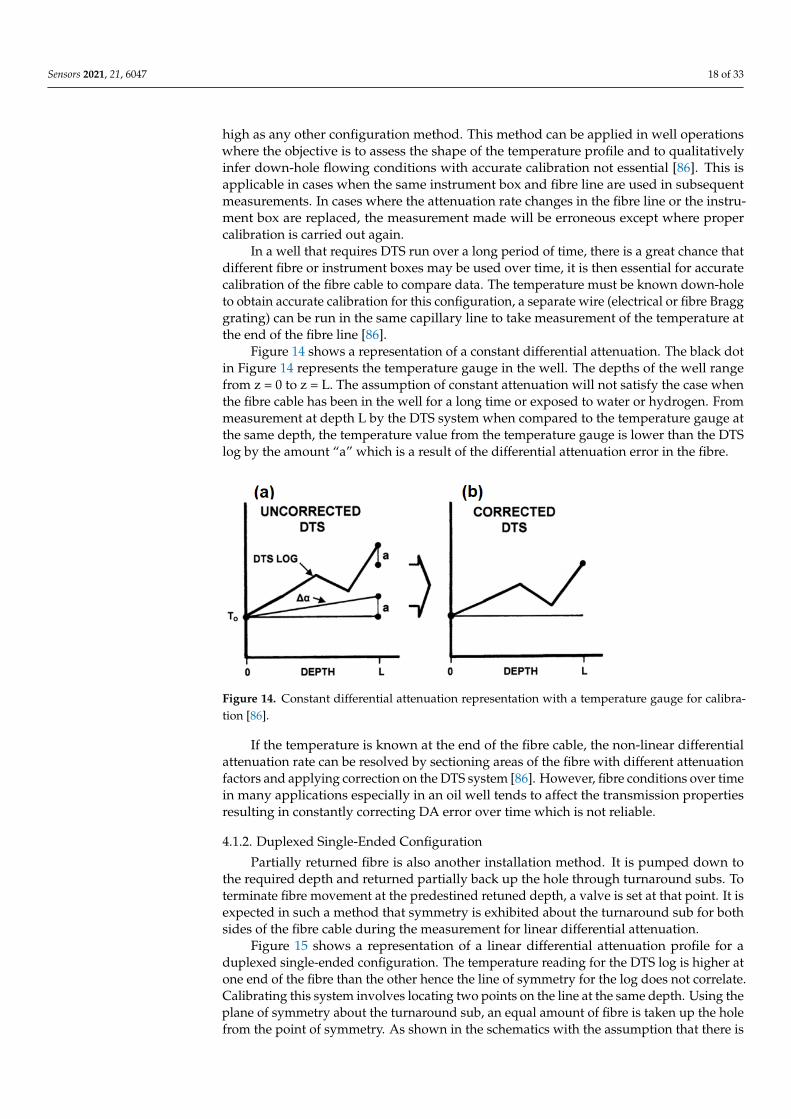
Sensors 2021, 21, 6047 18 of 33
high as any other configuration method. This method can be applied in well operationswhere the objective is to assess the shape of the temperature profile and to qualitativelyinfer down-hole flowing conditions with accurate calibration not essential [86]. This isapplicable in cases when the same instrument box and fibre line are used in subsequentmeasurements. In cases where the attenuation rate changes in the fibre line or the instru-ment box are replaced, the measurement made will be erroneous except where propercalibration is carried out again.
In a well that requires DTS run over a long period of time, there is a great chance thatdifferent fibre or instrument boxes may be used over time, it is then essential for accuratecalibration of the fibre cable to compare data. The temperature must be known down-holeto obtain accurate calibration for this configuration, a separate wire (electrical or fibre Bragggrating) can be run in the same capillary line to take measurement of the temperature atthe end of the fibre line [86].
Figure 14 shows a representation of a constant differential attenuation. The black dotin Figure 14 represents the temperature gauge in the well. The depths of the well rangefrom z = 0 to z = L. The assumption of constant attenuation will not satisfy the case whenthe fibre cable has been in the well for a long time or exposed to water or hydrogen. Frommeasurement at depth L by the DTS system when compared to the temperature gauge atthe same depth, the temperature value from the temperature gauge is lower than the DTSlog by the amount “a” which is a result of the differential attenuation error in the fibre.
Sensors 2021, 21, x FOR PEER REVIEW 19 of 34
ature) is high as any other configuration method. This method can be applied in well op-erations where the objective is to assess the shape of the temperature profile and to qual-itatively infer down-hole flowing conditions with accurate calibration not essential [86]. This is applicable in cases when the same instrument box and fibre line are used in subse-quent measurements. In cases where the attenuation rate changes in the fibre line or the instrument box are replaced, the measurement made will be erroneous except where proper calibration is carried out again.
In a well that requires DTS run over a long period of time, there is a great chance that different fibre or instrument boxes may be used over time, it is then essential for accurate calibration of the fibre cable to compare data. The temperature must be known down-hole to obtain accurate calibration for this configuration, a separate wire (electrical or fibre Bragg grating) can be run in the same capillary line to take measurement of the tempera-ture at the end of the fibre line [86].
Figure 14 shows a representation of a constant differential attenuation. The black dot in Figure 14 represents the temperature gauge in the well. The depths of the well range from z = 0 to z = L. The assumption of constant attenuation will not satisfy the case when the fibre cable has been in the well for a long time or exposed to water or hydrogen. From measurement at depth L by the DTS system when compared to the temperature gauge at the same depth, the temperature value from the temperature gauge is lower than the DTS log by the amount “a” which is a result of the differential attenuation error in the fibre.
Figure 14. Constant differential attenuation representation with a temperature gauge for calibration [86].
If the temperature is known at the end of the fibre cable, the non-linear differential attenuation rate can be resolved by sectioning areas of the fibre with different attenuation factors and applying correction on the DTS system [86]. However, fibre conditions over time in many applications especially in an oil well tends to affect the transmission prop-erties resulting in constantly correcting DA error over time which is not reliable.
4.1.2. Duplexed Single-Ended Configuration Partially returned fibre is also another installation method. It is pumped down to the
required depth and returned partially back up the hole through turnaround subs. To ter-minate fibre movement at the predestined retuned depth, a valve is set at that point. It is expected in such a method that symmetry is exhibited about the turnaround sub for both sides of the fibre cable during the measurement for linear differential attenuation.
Figure 15 shows a representation of a linear differential attenuation profile for a du-plexed single-ended configuration. The temperature reading for the DTS log is higher at one end of the fibre than the other hence the line of symmetry for the log does not corre-late. Calibrating this system involves locating two points on the line at the same depth. Using the plane of symmetry about the turnaround sub, an equal amount of fibre is taken up the hole from the point of symmetry. As shown in the schematics with the assumption
Figure 14. Constant differential attenuation representation with a temperature gauge for calibra-tion [86].
If the temperature is known at the end of the fibre cable, the non-linear differentialattenuation rate can be resolved by sectioning areas of the fibre with different attenuationfactors and applying correction on the DTS system [86]. However, fibre conditions over timein many applications especially in an oil well tends to affect the transmission propertiesresulting in constantly correcting DA error over time which is not reliable.
4.1.2. Duplexed Single-Ended Configuration
Partially returned fibre is also another installation method. It is pumped down tothe required depth and returned partially back up the hole through turnaround subs. Toterminate fibre movement at the predestined retuned depth, a valve is set at that point. It isexpected in such a method that symmetry is exhibited about the turnaround sub for bothsides of the fibre cable during the measurement for linear differential attenuation.
Figure 15 shows a representation of a linear differential attenuation profile for aduplexed single-ended configuration. The temperature reading for the DTS log is higher atone end of the fibre than the other hence the line of symmetry for the log does not correlate.Calibrating this system involves locating two points on the line at the same depth. Using theplane of symmetry about the turnaround sub, an equal amount of fibre is taken up the holefrom the point of symmetry. As shown in the schematics with the assumption that there is

Sensors 2021, 21, 6047 19 of 33
no overstuff (excess fibre length over tube length) and the distances “I” to the black dot asshown in Figure 15a and “J” to the same dot are both equal from the point of symmetry [86].The points where the attenuation line intercepts the DTS log at I and J is used as a reference.At the same depth, the upgoing fibre has greater temperature than downgoing fibre andthe slope can be acquired from b/2I which is the differential attenuation correction factor.The amount “b” in Figure 15 is the difference between the fibre temperatures at the tworeference points. A true DTS log can be reconstructed when the calculated slope is correctedon the DTS instrument. This computation is under the assumption of linear attenuationover the entire fibre length. This method is a step improvement from the single-endedconfiguration considering that an additional sensor is not needed down-hole to calibrate thesystem for accurate temperature measurement. However, the flaw with this configurationis that this is mainly based on the assumption that attenuation is always linear and cannotbe applied in fibre cable with nonlinear differential attenuation.
Sensors 2021, 21, x FOR PEER REVIEW 20 of 34
that there is no overstuff (excess fibre length over tube length) and the distances “I” to the black dot as shown in Figure 15a and “J” to the same dot are both equal from the point of symmetry [86]. The points where the attenuation line intercepts the DTS log at I and J is used as a reference. At the same depth, the upgoing fibre has greater temperature than downgoing fibre and the slope can be acquired from b/2I which is the differential attenu-ation correction factor. The amount “b” in Figure 15 is the difference between the fibre temperatures at the two reference points. A true DTS log can be reconstructed when the calculated slope is corrected on the DTS instrument. This computation is under the as-sumption of linear attenuation over the entire fibre length. This method is a step improve-ment from the single-ended configuration considering that an additional sensor is not needed down-hole to calibrate the system for accurate temperature measurement. How-ever, the flaw with this configuration is that this is mainly based on the assumption that attenuation is always linear and cannot be applied in fibre cable with nonlinear differen-tial attenuation.
Figure 15. Calibration for a Linear Differential Attenuation Duplexed Single Ended System [86].
4.1.3. Double Ended Configuration Double-ended fibre installation is similar to the duplex single-ended configuration
other than the fact that the returning fibre cable from the turnaround sub terminates at the surface and is connected to the DTS instrument box. Here the instrument box makes observation from both ends of the fibre cable. This method offers the possibility of cali-bration for accurate survey in the presence of nonlinear differential attenuation along the length of the fibre cable hence unlike the single-ended, in a duplexed configuration, the entire length can be considered for correction [105]. The double-ended system can effec-tively cancel out losses and anomalies from data trace by interrogating the fibre from both ends and removing automatically the attenuation error along the total length of the fibre.
Figure 16 is a representation of two ended duplex configurations with a linear differ-ential attenuation. In calibrating this system the turnaround sub line as shown in the fig-ure below is located at the centre of the DTS survey. Represented by the black dot is the base line indicating the temperature at each end of the fibre cable connected to the DTS system at which the survey is initiated at depth zero. The average of the two curves for the differential attenuation is the correction factor for the DTS survey.
Figure 15. Calibration for a Linear Differential Attenuation Duplexed Single Ended System [86].
4.1.3. Double Ended Configuration
Double-ended fibre installation is similar to the duplex single-ended configurationother than the fact that the returning fibre cable from the turnaround sub terminates atthe surface and is connected to the DTS instrument box. Here the instrument box makesobservation from both ends of the fibre cable. This method offers the possibility of calibrationfor accurate survey in the presence of nonlinear differential attenuation along the lengthof the fibre cable hence unlike the single-ended, in a duplexed configuration, the entirelength can be considered for correction [105]. The double-ended system can effectivelycancel out losses and anomalies from data trace by interrogating the fibre from both endsand removing automatically the attenuation error along the total length of the fibre.
Figure 16 is a representation of two ended duplex configurations with a linear dif-ferential attenuation. In calibrating this system the turnaround sub line as shown in thefigure below is located at the centre of the DTS survey. Represented by the black dot is thebase line indicating the temperature at each end of the fibre cable connected to the DTSsystem at which the survey is initiated at depth zero. The average of the two curves for thedifferential attenuation is the correction factor for the DTS survey.
In the event of a non-linear differential attenuation condition, the double-ended systemcan effectively handle this issue. From Figure 17, the attenuation rate for the double-endedconfiguration is non-linear; the temperature is observed to have risen from one end of thefibre to the other. Hence, the average of the curve created by the DTS measurement on thefibre from the reference temperature to the temperature at the returning end of the fibre isthe resultant corrected curve. The installation in the well is more complicated with addedalgorithm complexity and often noisier signal close to the DTS system [105].
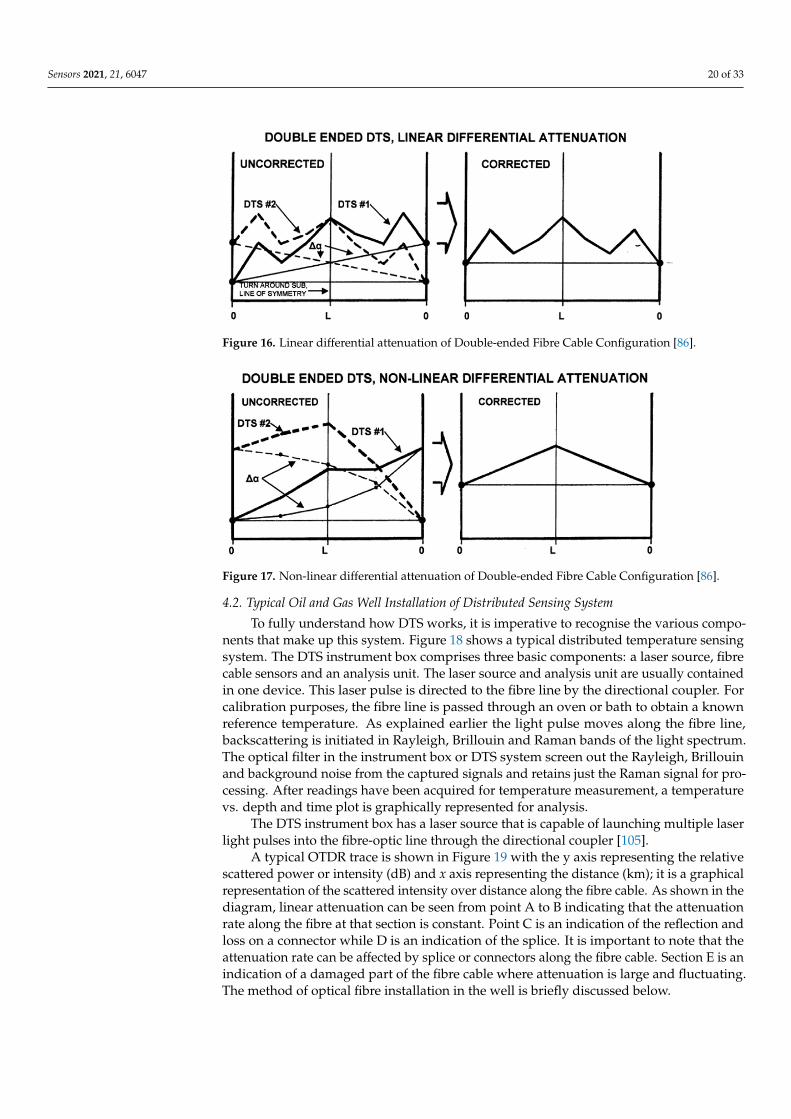
Sensors 2021, 21, 6047 20 of 33Sensors 2021, 21, x FOR PEER REVIEW 21 of 34
Figure 16. Linear differential attenuation of Double-ended Fibre Cable Configuration [86].
In the event of a non-linear differential attenuation condition, the double-ended sys-tem can effectively handle this issue. From Figure 17, the attenuation rate for the double-ended configuration is non-linear; the temperature is observed to have risen from one end of the fibre to the other. Hence, the average of the curve created by the DTS measurement on the fibre from the reference temperature to the temperature at the returning end of the fibre is the resultant corrected curve. The installation in the well is more complicated with added algorithm complexity and often noisier signal close to the DTS system [105].
Figure 17. Non-linear differential attenuation of Double-ended Fibre Cable Configuration [86].
4.2. Typical Oil and Gas Well Installation of Distributed Sensing System To fully understand how DTS works, it is imperative to recognise the various com-
ponents that make up this system. Figure 18 shows a typical distributed temperature sens-ing system. The DTS instrument box comprises three basic components: a laser source, fibre cable sensors and an analysis unit. The laser source and analysis unit are usually contained in one device. This laser pulse is directed to the fibre line by the directional coupler. For calibration purposes, the fibre line is passed through an oven or bath to obtain a known reference temperature. As explained earlier the light pulse moves along the fibre line, backscattering is initiated in Rayleigh, Brillouin and Raman bands of the light spec-trum. The optical filter in the instrument box or DTS system screen out the Rayleigh, Bril-louin and background noise from the captured signals and retains just the Raman signal for processing. After readings have been acquired for temperature measurement, a tem-perature vs. depth and time plot is graphically represented for analysis.
Figure 16. Linear differential attenuation of Double-ended Fibre Cable Configuration [86].
Sensors 2021, 21, x FOR PEER REVIEW 21 of 34
Figure 16. Linear differential attenuation of Double-ended Fibre Cable Configuration [86].
In the event of a non-linear differential attenuation condition, the double-ended sys-tem can effectively handle this issue. From Figure 17, the attenuation rate for the double-ended configuration is non-linear; the temperature is observed to have risen from one end of the fibre to the other. Hence, the average of the curve created by the DTS measurement on the fibre from the reference temperature to the temperature at the returning end of the fibre is the resultant corrected curve. The installation in the well is more complicated with added algorithm complexity and often noisier signal close to the DTS system [105].
Figure 17. Non-linear differential attenuation of Double-ended Fibre Cable Configuration [86].
4.2. Typical Oil and Gas Well Installation of Distributed Sensing System To fully understand how DTS works, it is imperative to recognise the various com-
ponents that make up this system. Figure 18 shows a typical distributed temperature sens-ing system. The DTS instrument box comprises three basic components: a laser source, fibre cable sensors and an analysis unit. The laser source and analysis unit are usually contained in one device. This laser pulse is directed to the fibre line by the directional coupler. For calibration purposes, the fibre line is passed through an oven or bath to obtain a known reference temperature. As explained earlier the light pulse moves along the fibre line, backscattering is initiated in Rayleigh, Brillouin and Raman bands of the light spec-trum. The optical filter in the instrument box or DTS system screen out the Rayleigh, Bril-louin and background noise from the captured signals and retains just the Raman signal for processing. After readings have been acquired for temperature measurement, a tem-perature vs. depth and time plot is graphically represented for analysis.
Figure 17. Non-linear differential attenuation of Double-ended Fibre Cable Configuration [86].
4.2. Typical Oil and Gas Well Installation of Distributed Sensing System
To fully understand how DTS works, it is imperative to recognise the various compo-nents that make up this system. Figure 18 shows a typical distributed temperature sensingsystem. The DTS instrument box comprises three basic components: a laser source, fibrecable sensors and an analysis unit. The laser source and analysis unit are usually containedin one device. This laser pulse is directed to the fibre line by the directional coupler. Forcalibration purposes, the fibre line is passed through an oven or bath to obtain a knownreference temperature. As explained earlier the light pulse moves along the fibre line,backscattering is initiated in Rayleigh, Brillouin and Raman bands of the light spectrum.The optical filter in the instrument box or DTS system screen out the Rayleigh, Brillouinand background noise from the captured signals and retains just the Raman signal for pro-cessing. After readings have been acquired for temperature measurement, a temperaturevs. depth and time plot is graphically represented for analysis.
The DTS instrument box has a laser source that is capable of launching multiple laserlight pulses into the fibre-optic line through the directional coupler [105].
A typical OTDR trace is shown in Figure 19 with the y axis representing the relativescattered power or intensity (dB) and x axis representing the distance (km); it is a graphicalrepresentation of the scattered intensity over distance along the fibre cable. As shown in thediagram, linear attenuation can be seen from point A to B indicating that the attenuationrate along the fibre at that section is constant. Point C is an indication of the reflection andloss on a connector while D is an indication of the splice. It is important to note that theattenuation rate can be affected by splice or connectors along the fibre cable. Section E is anindication of a damaged part of the fibre cable where attenuation is large and fluctuating.The method of optical fibre installation in the well is briefly discussed below.
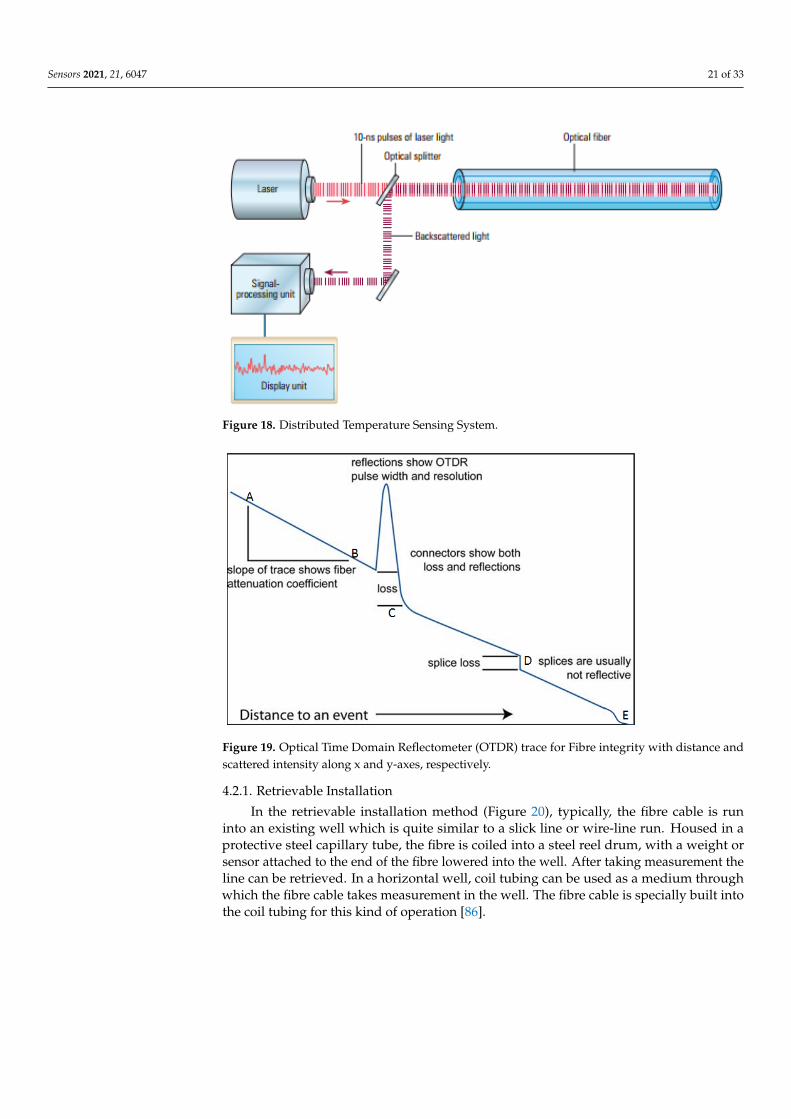
Sensors 2021, 21, 6047 21 of 33Sensors 2021, 21, x FOR PEER REVIEW 22 of 34
Figure 18. Distributed Temperature Sensing System.
The DTS instrument box has a laser source that is capable of launching multiple laser light pulses into the fibre-optic line through the directional coupler [105].
A typical OTDR trace is shown in Figure 19 with the y axis representing the relative scattered power or intensity (dB) and x axis representing the distance (km); it is a graphical representation of the scattered intensity over distance along the fibre cable. As shown in the diagram, linear attenuation can be seen from point A to B indicating that the attenua-tion rate along the fibre at that section is constant. Point C is an indication of the reflection and loss on a connector while D is an indication of the splice. It is important to note that the attenuation rate can be affected by splice or connectors along the fibre cable. Section E is an indication of a damaged part of the fibre cable where attenuation is large and fluctu-ating. The method of optical fibre installation in the well is briefly discussed below.
Figure 19. Optical Time Domain Reflectometer (OTDR) trace for Fibre integrity with distance and scattered intensity along x and y-axes, respectively.
4.2.1. Retrievable Installation In the retrievable installation method (Figure 20), typically, the fibre cable is run into
an existing well which is quite similar to a slick line or wire-line run. Housed in a protec-tive steel capillary tube, the fibre is coiled into a steel reel drum, with a weight or sensor attached to the end of the fibre lowered into the well. After taking measurement the line
Figure 18. Distributed Temperature Sensing System.
Sensors 2021, 21, x FOR PEER REVIEW 22 of 34
Figure 18. Distributed Temperature Sensing System.
The DTS instrument box has a laser source that is capable of launching multiple laser light pulses into the fibre-optic line through the directional coupler [105].
A typical OTDR trace is shown in Figure 19 with the y axis representing the relative scattered power or intensity (dB) and x axis representing the distance (km); it is a graphical representation of the scattered intensity over distance along the fibre cable. As shown in the diagram, linear attenuation can be seen from point A to B indicating that the attenua-tion rate along the fibre at that section is constant. Point C is an indication of the reflection and loss on a connector while D is an indication of the splice. It is important to note that the attenuation rate can be affected by splice or connectors along the fibre cable. Section E is an indication of a damaged part of the fibre cable where attenuation is large and fluctu-ating. The method of optical fibre installation in the well is briefly discussed below.
Figure 19. Optical Time Domain Reflectometer (OTDR) trace for Fibre integrity with distance and scattered intensity along x and y-axes, respectively.
4.2.1. Retrievable Installation In the retrievable installation method (Figure 20), typically, the fibre cable is run into
an existing well which is quite similar to a slick line or wire-line run. Housed in a protec-tive steel capillary tube, the fibre is coiled into a steel reel drum, with a weight or sensor attached to the end of the fibre lowered into the well. After taking measurement the line
Figure 19. Optical Time Domain Reflectometer (OTDR) trace for Fibre integrity with distance andscattered intensity along x and y-axes, respectively.
4.2.1. Retrievable Installation
In the retrievable installation method (Figure 20), typically, the fibre cable is runinto an existing well which is quite similar to a slick line or wire-line run. Housed in aprotective steel capillary tube, the fibre is coiled into a steel reel drum, with a weight orsensor attached to the end of the fibre lowered into the well. After taking measurement theline can be retrieved. In a horizontal well, coil tubing can be used as a medium throughwhich the fibre cable takes measurement in the well. The fibre cable is specially built intothe coil tubing for this kind of operation [86].

Sensors 2021, 21, 6047 22 of 33
Sensors 2021, 21, x FOR PEER REVIEW 23 of 34
can be retrieved. In a horizontal well, coil tubing can be used as a medium through which the fibre cable takes measurement in the well. The fibre cable is specially built into the coil tubing for this kind of operation [86].
Figure 20. Retrievable fibre cable installation [86].
4.2.2. Semi-Permanent Installation In semi-permanent installation (Figure 21), coil tubing can be permanently installed
on the well head and a guide string runs in the well to Total Depth (TD) to convey the coil tubing and fibre cable. Measurement can be carried out when demanded by pumping the fibre line down through the already run in guide string via the tubing. When the meas-urement is carried out, the fibre and coil tubing can be pulled out of the well [86].
Figure 20. Retrievable fibre cable installation [86].
4.2.2. Semi-Permanent Installation
In semi-permanent installation (Figure 21), coil tubing can be permanently installedon the well head and a guide string runs in the well to Total Depth (TD) to convey thecoil tubing and fibre cable. Measurement can be carried out when demanded by pumpingthe fibre line down through the already run in guide string via the tubing. When themeasurement is carried out, the fibre and coil tubing can be pulled out of the well [86].
Another Semi-Permanent method practised in the industry involves the installation ofa stainless-steel capillary tube strapped along the outer diameter of the production tubingas shown in Figure 22. The capillary tube usually with a diameter of 0.25” or smaller isinstalled permanently in the well [86]. The capillary tubing serves as a medium throughwhich the fibre cable is pumped into the well for the DTS survey. This is often used formonitoring submersible pumps, gas lift mandrel operation, well flow profile, etc. Specialpackers are designed to allow the capillary tube to pass through the packer preventingleakage into the annulus of the production tubing.
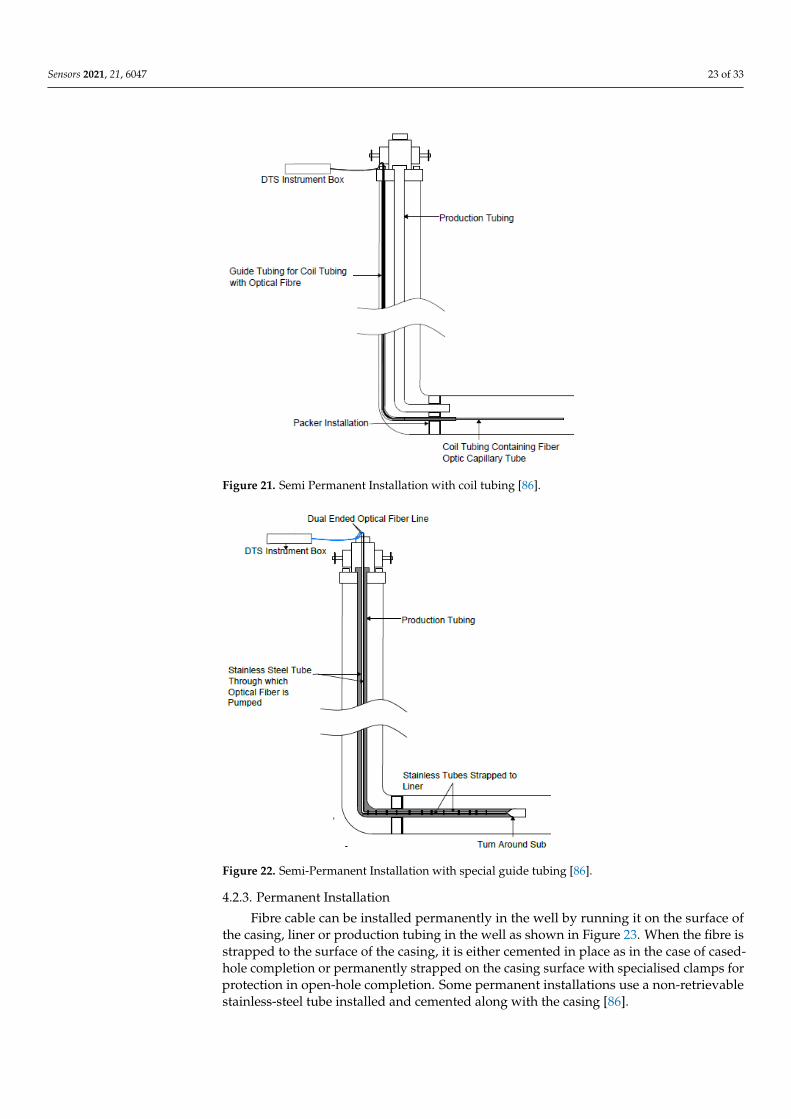
Sensors 2021, 21, 6047 23 of 33Sensors 2021, 21, x FOR PEER REVIEW 24 of 34
Figure 21. Semi Permanent Installation with coil tubing [86].
Another Semi-Permanent method practised in the industry involves the installation of a stainless-steel capillary tube strapped along the outer diameter of the production tub-ing as shown in Figure 22. The capillary tube usually with a diameter of 0.25” or smaller is installed permanently in the well [86]. The capillary tubing serves as a medium through which the fibre cable is pumped into the well for the DTS survey. This is often used for monitoring submersible pumps, gas lift mandrel operation, well flow profile, etc. Special packers are designed to allow the capillary tube to pass through the packer preventing leakage into the annulus of the production tubing.
Figure 21. Semi Permanent Installation with coil tubing [86].
Sensors 2021, 21, x FOR PEER REVIEW 24 of 34
Figure 21. Semi Permanent Installation with coil tubing [86].
Another Semi-Permanent method practised in the industry involves the installation of a stainless-steel capillary tube strapped along the outer diameter of the production tub-ing as shown in Figure 22. The capillary tube usually with a diameter of 0.25” or smaller is installed permanently in the well [86]. The capillary tubing serves as a medium through which the fibre cable is pumped into the well for the DTS survey. This is often used for monitoring submersible pumps, gas lift mandrel operation, well flow profile, etc. Special packers are designed to allow the capillary tube to pass through the packer preventing leakage into the annulus of the production tubing.
Figure 22. Semi-Permanent Installation with special guide tubing [86].
4.2.3. Permanent Installation
Fibre cable can be installed permanently in the well by running it on the surface ofthe casing, liner or production tubing in the well as shown in Figure 23. When the fibre isstrapped to the surface of the casing, it is either cemented in place as in the case of cased-hole completion or permanently strapped on the casing surface with specialised clamps forprotection in open-hole completion. Some permanent installations use a non-retrievablestainless-steel tube installed and cemented along with the casing [86].

Sensors 2021, 21, 6047 24 of 33
Sensors 2021, 21, x FOR PEER REVIEW 25 of 34
Figure 22. Semi-Permanent Installation with special guide tubing [86].
4.2.3. Permanent Installation Fibre cable can be installed permanently in the well by running it on the surface of
the casing, liner or production tubing in the well as shown in Figure 23. When the fibre is strapped to the surface of the casing, it is either cemented in place as in the case of cased-hole completion or permanently strapped on the casing surface with specialised clamps for protection in open-hole completion. Some permanent installations use a non-retrieva-ble stainless-steel tube installed and cemented along with the casing [86].
Figure 23. Permanent DTS Installation [86].
5. Optical Fibre-Based Multiparameter Sensors Different kinds of losses like the leakage or mode confinement losses experienced by
traditional optical fibres is a major limitation, especially when looking for long-distance fibre-optic remote sensing applications [109,110]. Furthermore, noises are frequently gen-erated within the fibre-optic sensing system and also from the environment which greatly influences the noise floor performance and the weak signal detection especially in largescale quasi-distributed sensing network [111]. Hence, to compensate for these noise effects within the sensing system and also the losses in the fibre sensors, advanced tech-niques are required for various O&G remote sensing applications. Moreover, the oil in-dustry is keen on developing multi-point or distributed multimodal sensors, for the con-dition monitoring of critical parameters like pressure, temperature, vibration, strain, etc. [112,113].
Multiparameter sensors provide versatile sensing solutions, enabling miniaturiza-tion of the sensors and also bringing new sensor functionalities with improved measure-ment performances for sensing different critical parameters [114]. This part of the review will focus on optical fibre-based sensor configurations suitable for multi-parameter sens-ing and will also look into various approaches for improving the SNR of these fibre sen-sors for O&G application.
Among the different optical fibre-based sensors, FBG sensors have several distinct advantages and are competent to sense almost all physical parameters such as tempera-ture, strain, pressure, vibration, etc., and also offer multi-point sensing with appreciably good range. Specific advantages of FBG sensors over other types of fibre-optic sensors are: They give wavelength encoded measurements and hence information is not susceptible to light power fluctuations [15]. Multiple gratings can be inscribed onto the same fibre, taking advantage of the wavelength multiplexing capability [115]. This enables them to
Figure 23. Permanent DTS Installation [86].
5. Optical Fibre-Based Multiparameter Sensors
Different kinds of losses like the leakage or mode confinement losses experienced bytraditional optical fibres is a major limitation, especially when looking for long-distancefibre-optic remote sensing applications [109,110]. Furthermore, noises are frequently gener-ated within the fibre-optic sensing system and also from the environment which greatly in-fluences the noise floor performance and the weak signal detection especially in largescalequasi-distributed sensing network [111]. Hence, to compensate for these noise effectswithin the sensing system and also the losses in the fibre sensors, advanced techniques arerequired for various O&G remote sensing applications. Moreover, the oil industry is keenon developing multi-point or distributed multimodal sensors, for the condition monitoringof critical parameters like pressure, temperature, vibration, strain, etc. [112,113].
Multiparameter sensors provide versatile sensing solutions, enabling miniaturizationof the sensors and also bringing new sensor functionalities with improved measurementperformances for sensing different critical parameters [114]. This part of the review willfocus on optical fibre-based sensor configurations suitable for multi-parameter sensing andwill also look into various approaches for improving the SNR of these fibre sensors forO&G application.
Among the different optical fibre-based sensors, FBG sensors have several distinctadvantages and are competent to sense almost all physical parameters such as temperature,strain, pressure, vibration, etc., and also offer multi-point sensing with appreciably goodrange. Specific advantages of FBG sensors over other types of fibre-optic sensors are: Theygive wavelength encoded measurements and hence information is not susceptible to lightpower fluctuations [15]. Multiple gratings can be inscribed onto the same fibre, takingadvantage of the wavelength multiplexing capability [115]. This enables them to read manynumbers of sensors on very few fibres, resulting in reduced cabling requirements and easierinstallation. Multi-point or quasi-distributed sensing can be achieved in a cost-effectiveand compact manner [116]. The sensor responds to strain and temperature in a linear andadditive manner [117]. A major limitation of the FBG sensor is its cross-sensitivity, as itresponds to multiple parameters like temperature and strain in a coupled fashion [52].Consequently, the effects of these parameters need to be separated out from each other,in order to make measurements simultaneously or separately. Hence, the existing FBGtechnology needs to be adapted to overcome its technical difficulties, for ensuring betterperformance for the oil industry.
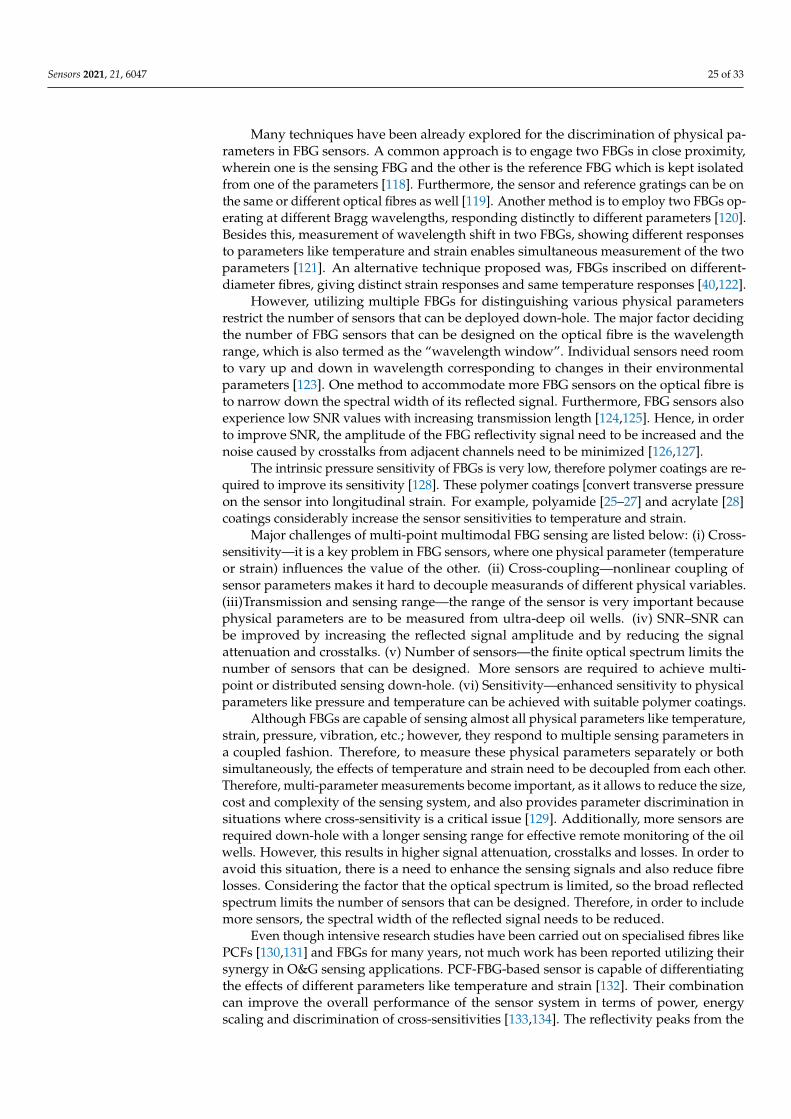
Sensors 2021, 21, 6047 25 of 33
Many techniques have been already explored for the discrimination of physical pa-rameters in FBG sensors. A common approach is to engage two FBGs in close proximity,wherein one is the sensing FBG and the other is the reference FBG which is kept isolatedfrom one of the parameters [118]. Furthermore, the sensor and reference gratings can be onthe same or different optical fibres as well [119]. Another method is to employ two FBGs op-erating at different Bragg wavelengths, responding distinctly to different parameters [120].Besides this, measurement of wavelength shift in two FBGs, showing different responsesto parameters like temperature and strain enables simultaneous measurement of the twoparameters [121]. An alternative technique proposed was, FBGs inscribed on different-diameter fibres, giving distinct strain responses and same temperature responses [40,122].
However, utilizing multiple FBGs for distinguishing various physical parametersrestrict the number of sensors that can be deployed down-hole. The major factor decidingthe number of FBG sensors that can be designed on the optical fibre is the wavelengthrange, which is also termed as the “wavelength window”. Individual sensors need roomto vary up and down in wavelength corresponding to changes in their environmentalparameters [123]. One method to accommodate more FBG sensors on the optical fibre isto narrow down the spectral width of its reflected signal. Furthermore, FBG sensors alsoexperience low SNR values with increasing transmission length [124,125]. Hence, in orderto improve SNR, the amplitude of the FBG reflectivity signal need to be increased and thenoise caused by crosstalks from adjacent channels need to be minimized [126,127].
The intrinsic pressure sensitivity of FBGs is very low, therefore polymer coatings are re-quired to improve its sensitivity [128]. These polymer coatings [convert transverse pressureon the sensor into longitudinal strain. For example, polyamide [25–27] and acrylate [28]coatings considerably increase the sensor sensitivities to temperature and strain.
Major challenges of multi-point multimodal FBG sensing are listed below: (i) Cross-sensitivity—it is a key problem in FBG sensors, where one physical parameter (temperatureor strain) influences the value of the other. (ii) Cross-coupling—nonlinear coupling ofsensor parameters makes it hard to decouple measurands of different physical variables.(iii)Transmission and sensing range—the range of the sensor is very important becausephysical parameters are to be measured from ultra-deep oil wells. (iv) SNR–SNR canbe improved by increasing the reflected signal amplitude and by reducing the signalattenuation and crosstalks. (v) Number of sensors—the finite optical spectrum limits thenumber of sensors that can be designed. More sensors are required to achieve multi-point or distributed sensing down-hole. (vi) Sensitivity—enhanced sensitivity to physicalparameters like pressure and temperature can be achieved with suitable polymer coatings.
Although FBGs are capable of sensing almost all physical parameters like temperature,strain, pressure, vibration, etc.; however, they respond to multiple sensing parameters ina coupled fashion. Therefore, to measure these physical parameters separately or bothsimultaneously, the effects of temperature and strain need to be decoupled from each other.Therefore, multi-parameter measurements become important, as it allows to reduce the size,cost and complexity of the sensing system, and also provides parameter discrimination insituations where cross-sensitivity is a critical issue [129]. Additionally, more sensors arerequired down-hole with a longer sensing range for effective remote monitoring of the oilwells. However, this results in higher signal attenuation, crosstalks and losses. In order toavoid this situation, there is a need to enhance the sensing signals and also reduce fibrelosses. Considering the factor that the optical spectrum is limited, so the broad reflectedspectrum limits the number of sensors that can be designed. Therefore, in order to includemore sensors, the spectral width of the reflected signal needs to be reduced.
Even though intensive research studies have been carried out on specialised fibres likePCFs [130,131] and FBGs for many years, not much work has been reported utilizing theirsynergy in O&G sensing applications. PCF-FBG-based sensor is capable of differentiatingthe effects of different parameters like temperature and strain [132]. Their combinationcan improve the overall performance of the sensor system in terms of power, energyscaling and discrimination of cross-sensitivities [133,134]. The reflectivity peaks from the
Sensors 2021, 21, 6047 26 of 33
PCF-FBG sensor have inconsistent sensitivity to external parameters which helps to attainmulti-parameter measurement simultaneously, offering good stability and a wide range ofbroadband tuning [135–138].
The main advantage of PCF is their high light confinement characteristics which areotherwise difficult to achieve in ordinary conventional fibres. LCPCF (Liquid crystal PCFs)open new perspectives in sensing applications [139]. With the addition of liquid crystalsonto the PCF air holes, its output signal experiences a wavelength shift correspondingto the variation in physical parameters like temperature [140,141]. Liquid crystals alsoprovide means of achieving active control over PCF propagation and polarisation charac-teristics [142]. The thermal and electrical tuning capabilities of LCPCFs along with theirunique spectral and polarisation properties opens up their possibilities for multi-parameterfibre-optic sensing. Furthermore, through PCF nanostructuring, ultra-low confinementlosses can be achieved in a large wavelength region [143–146]. The guidance propertiesof the PCF, with a radially periodic cladding structure of concentric high and low-indexlayers, can be improved by optimising its effective refractive index [147]. A core with ahigher refractive index facilitates higher light confinement [148] which in turn increases thepropagation distance of the light signal. One approach to manipulate the core refractiveindex is through rare-earth doping [149–151]. The refractive index of glass increases withincreasing rare earth concentration [152]. Another offshoot advantage of doping the fibrecore with rare earth elements is its fluorescence and Raman signatures [153]. For differentlaser excitations, the doped glasses generate specific Raman and fluorescent emissionscorresponding to each rare earth element [154]. These Raman and fluorescent emissionscan be utilized for sensing applications as they are sensitive to physical parameters liketemperature and also to chemicals [155–158]. In addition, Raman and fluorescent emissionsfrom the rare earth doped core PCF-FBG sensor facilitates multi-parameter sensing. Raman-based sensing technique also facilitates distributed temperature sensing [159], which isvery beneficial while looking for the complete temperature profile of the oil well. To sumup, optical fibre sensing technologies are promising solutions for smarter sensing systemsin the offshore oil industry.
The new multimodal sensor configuration is expected to be a multi-wavelengthtime-multiplexed fibre-optic sensing system capable of multi-point strain sensing, dis-tributed temperature sensing and key point chemical or temperature measurements. Quasi-distributed FBGs with multi-wavelength-based detection enhances the capabilities of thesensor combination, enabling sensing of critical parameter like strain at multiple points.Microstructuring and liquid crystal infiltrations of cladding holes enhance the signal inten-sity from the sensor configuration and also enables wavelength tunability required for therare-earth-based sensors. Rare earth doping of PCF core further enhances the signal inten-sity and generates Raman signatures useful for Raman-based DTS systems. Furthermore,localised rare-earth doping enables multi-point fluorescence sensing of critical parameterslike temperature or chemicals. The multimodal sensor can be interrogated using differ-ent optical pulses with different frequencies or wavelengths. A multi-wavelength lightsource system can be used consisting of different laser wavelengths needed for probing thequasi-distributed FBGs, multi-point rare earth fluorescence sensors and Raman DTS.
6. Outlook
The various distributed sensing technologies (DTSS, DAS, DPS, DCS, etc.), FBGsensors, interferometry-based sensors are all efficient for single parameter measurement—either temperature, pressure, vibration or strain. For the condition monitoring of multiplecritical parameters like high pressure, high temperature, vibration, etc., the oil and gasindustry is intently looking for multi-point or distributed multimodal sensors. Multimodalsensors will provide a flexible sensing solution, enable miniaturization of the sensors,and add new functionalities with improved measurement capabilities for sensing variousimportant parameters. Furthermore, multimodal fibre-optic sensor configuration will becapable of sensing multiple parameters from different locations. An integrated fibre-optic

Sensors 2021, 21, 6047 27 of 33
sensor configuration, combining features of LCPCF, FBG and rare earth doping; extractingtheir molecular, atomic and vibro-rotational characteristics would be a good option forsensing multiple modalities in the oil industry.
The main limitation of existing fibre-optic sensors is they use a single wavelengthregion (mostly communication window around 1550 nm) for probing the parameters. Thehighlight of the proposed multimodal sensor is that they operate in multiple wavelengthregimes, adding scope for new functionalities and sensing capabilities. Microstructured fi-bre is also expected to improve the light confinement characteristics which in turn enhancesthe signal intensity from the multimodal sensor configuration. Infusing liquid crystals intothe PCF sensor will aid in the tuning of spectral bands from the communication window toother wavelength regimes (NIR and visible).
Electrochemical change induced in the PCF by infusion of liquid crystals will result ina change in the effective refractive index of cladding and also tunes the optical bandgaps.Application of electrical voltage for aligning the LC directors and subsequent refractiveindex changes both plays a key role in the shift of different spectral bands. Bandgap tuningenables the LCPCF sensor to operate within the photonic bands that have peak sensitivities.Liquid crystals can be infiltrated into the PCF holes via capillary effects, a technique knownas vacuum-assisted LC infiltration is commonly used.
Doping the core of microstructured fibres with rare earth elements can further enhancethe light confinement characteristics and also invoke fluorescence and Raman signatureswhen probed with suitable laser excitations. These specialised features of LCPCF canbe effectively utilized in the new sensor configuration for tuning the light confinementwavelengths to suit the fluorescence and Raman spectral regions of the rare earth dopedsensors.
Furthermore, integrating FBGs into the sensor configuration will enable multi-pointmultimodal sensing capabilities. The integrated sensor combination is expected to over-come the limitations of existing fibre-optic sensors with regards to cross-sensitivity, SNR,sensing range and multimodal sensing capability. The new sensor configuration operatingin multiple wavelength regimes in a multiplexed fashion will have the potential to carryout multi-parameter sensing.
7. Conclusions
A detailed review of different fibre-optic sensing techniques was carried out, to identifya feasible sensing solution for the oil industry. The different classifications of the fibre-opticsensors and different types of fibre-optic sensors used for oil and gas applications werediscussed. The challenges posed by the oil and gas harsh environments were discussed.The technical challenges associated with the different fibre-optic sensing technologies,especially the most commonly used FBG sensors and distributed fibre-optic sensors weredescribed in detail. Moreover, a thorough review leading to a new idea for multimodalsensing using a novel fibre-optic configuration for oil and gas applications was discussed.Lastly, to improve the performance of the multimodal sensor in terms of its SNR, differentapproaches and techniques were identified. The proposed configuration of the novelmultimodal fibre-optic sensor consisting of rare-earth-doped microstructured–FBG sensoris expected to overcome the technical difficulties and challenges of the existing sensors inthe O&G industry. The integrated sensor combination is likely to overcome the limitationsof FBG sensors with regards to cross-sensitivity, SNR, sensing range and multimodalsensing capability. The new sensor configuration operating in multiple wavelength regimesin a multiplexed fashion is competent to perform multi-parameter sensing.
Author Contributions: Edited the final manuscript and contributed to most of the manuscript, J.J.;Contributed to some parts of the manuscript, S.A.; Reviewed the manuscript and supervisor to thestudent’s projects, R.P. All authors have read and agreed to the published version of the manuscript.
Funding: This research received no external funding.
Institutional Review Board Statement: Not applicable.
Sensors 2021, 21, 6047 28 of 33
Informed Consent Statement: Not applicable.
Data Availability Statement: Not applicable.
Acknowledgments: Nelson Asin-Nanna and Helena Sofia Verdelho Cardoso Machado has providedtechnical support for the completion this review.
Conflicts of Interest: No conflict of interest.
References1. Lehmkoster, J. Schroder, T. Oil and gas from the sea. In World Ocean Review; Maribus gGmbH: Hamburg, Germany, 2014.2. Algeroy, J.; Lovell, J.; Tirado, G.; Meyyappan, R.; Brown, G.; Greenaway, R.; Carney, M.; Meyer, J.H.; Davies, J.E.; Pinzon, I.D.
Permanent monitoring: Taking it to the reservoir. Oilfield Rev. Spring 2010, 22, 34–41.3. Zhang, Y.; Xiao, L.; Fu, J.; Chen, H.; Zhao, X. The perspective of the permanent monitoring with an FBG sensor network in oil and
gas production in China. Int. Soc. Opt. Photonics 2005, 6041, 60410X. [CrossRef]4. Xu, X.-H.; Peng, G.; Liu, X.-F.; Shao, Y.-L.; Xiao-Hong, X.; Gang, P.; Xue-Feng, L.; Yan-Lin, S. Oil and gas exploration informa-
tion integration management plan based on GIS technology. In Proceedings of the 2012 Fourth International Conference onComputational and Information Sciences, Chongqing, China, 17–19 August 2012; pp. 526–529. [CrossRef]
5. Akhondi, M.R.; Talevski, A.; Carlsen, S.; Petersen, S. Applications of wireless sensor networks in the oil, gas and resourcesindustries. Adv. Inf. Netw. Appl. 2010, 941–948.
6. Stalford, H.; Ahmed, R. Intelligent Casing-Intelligent Formation (ICIF) Design. In Proceedings of the Offshore TechnologyConference, Houstin, TX, USA, 5–8 May 2014. [CrossRef]
7. Zhang, Y.Z.; Xiao, L.Z.; Wang, J.Y. Oil well real-time monitoring with downhole permanent FBG sensor network. Control andautomation. In Proceedings of the 2007 IEEE International Conference on Control and Automation, Seoul, Korea, 17–20 October2007; pp. 2591–2594.
8. Makhlouf, A.S.H.; Aliofkhazraei, M. (Eds.) Handbook of Materials Failure Analysis with Case Studies from the Oil and Gas Industries;Butterworth-Heinemann: Oxford, UK, 2015.
9. Gysling, D.; Bostick, F. Changing paradigms in oil and gas reservoir monitoring—The introduction and commercialization ofin-well optical sensing systems. In Proceedings of the 2002 15th Optical Fiber Sensors Conference, Portland, OR, USA, 6–10 May2002. [CrossRef]
10. Meehan, N. Reservoir Monitoring Handbook; Elsevier Science & Technology Books: Contoocook, NH, USA, 2012.11. Craig, B. Deep oil and gas well construction. Adv. Mater. Processes. 2008, 166, 33–35.12. DeBruijn, G.; Skeates, C.; Greenaway, R.; Harrison, D.; Parris, M.; James, S.; Mueller, F.; Ray, S.; Riding, M.; Temple, L.; et al.
High-pressure, high-temperature technologies. Oilfield Rev. 2008, 20, 46–60.13. Hoffmann, L.; Muller, M.S.; Kramer, S.; Giebel, M.; Schwotzer, G.; Wieduwilt, T. Applications of fibre optic temperature
meas-urement. Proc. Est. Acad. Sci. Eng. 2007, 13, 363–378.14. Mukhopadhyay, S.C. New Developments in Sensing Technology for Structural Health Monitoring; Springer: New York, NY, USA, 2011.15. Lee, B. Review of the present status of optical fiber sensors. Opt. Fiber Technol. 2003, 9, 57–79. [CrossRef]16. Hill, D. Managing oil and gas with fibre-optic sensing. EIC Energy Focus 2014, 3, 221–222.17. Choudhury, P.; Singh, O.N. Frontiers in Optical Technology: Materials and Devices; Nova Publishers: Hauppauge, NY, USA, 2007.18. Gholamzadeh, B.; Nabovati, H. Fiber optic sensors. World Acad. Sci. Eng. Technol. 2008, 42, 335–340.19. Kinet, D.; Mégret, P.; Goossen, K.W.; Qiu, L.; Heider, D.; Caucheteur, C. Fiber bragg grating sensors toward structural health
monitoring in composite materials: Challenges and solutions. Sensors 2014, 14, 7394–7419. [CrossRef]20. Cooper, K.L.; Wang, A.; Pickrell, G.R. Optical Fiber High Temperature Sensor Instrumentation for Energy Intensive Industries; Virginia
Polytechnic Institute and State University: Blacksburg, VA, USA, 2006. [CrossRef]21. Owen, C. Fibre Optic Exploration. 2012. Available online: http://www.oilandgastechnology.net/upstream-news/fibre-optic-
exploration (accessed on 19 April 2021).22. Million Worldwide Distributed Acoustic Sensing Industry to 2025—Impact of COVID-19. 2020. Available online:
https://www.globenewswire.com/news-release/2020/06/18/2050020/0/en/792-Million-Worldwide-Distributed-Acoustic-Sensing-Industry-to-2025-Impact-of-COVID-19.html (accessed on 19 April 2021).
23. Fidanboylu, K.; Efendioglu, H. Fiber optic sensors and their application. In Proceedings of the 5th International AdvancedTechnologies Symposium (IATS’09), Karabuk, Turkey, 13–15 May 2009.
24. Hecht, E. Optics; Pearson: London, UK, 2014.25. Giaccari, P.; Limberger, H.G.; Kronenberg, P. Influence of humidity and temperature on polyimide-coated fiber Bragg gratings. In
Proceedings of the Bragg Gratings, Photosensitivity, and Poling in Glass Waveguides, Stresa, Italy, 4 July 2001.26. Gusarov, A.; Chojetzki, C.; McKenzie, I.; Thienpont, H.; Berghmans, F. Effect of the fiber coating on the radiation sensitivity of
type I FBGs. IEEE Photon- Technol. Lett. 2008, 20, 1802–1804. [CrossRef]27. Yeo, T.; Sun, T.; Grattan, K.; Parry, D.; Lade, R.; Powell, B. Characterisation of a polymer-coated fibre Bragg grating sensor for
relative humidity sensing. Sen. Actuators B Chem. 2005, 110, 148–156. [CrossRef]28. Hill, D.; Cranch, G. Gain in hydrostatic pressure sensitivity of coated fibre Bragg grating. Electron. Lett. 1999, 35, 1268. [CrossRef]
Sensors 2021, 21, 6047 29 of 33
29. Fiber Coatings, Buffering and Cabling Materials. Available online: https://www.ofsoptics.com/optical-fiber-coatings/ (accessedon 19 April 2021).
30. Guobin, R.; Zhi, W.; Shuqin, L.; Yan, L.; Shuisheng, J. Full-vectorial analysis of complex refractive index photonic crystal fibers.Opt. Express 2004, 12, 1126–1135. [CrossRef]
31. Cucinotta, A. Photonic Crystal Fiber: Theory and Fabrication; Bentham Science: Sharjah, United Arab Emirates, 2012; pp. 84–92.32. Dainese, P.; Russell, P.S.J.; Joly, N.; Knight, J.C.; Wiederhecker, G.S.; Fragnito, H.L.; Laude, V.; Khelif, A. Stimulated Brillouin
scattering from multi-GHz-guided acoustic phonons in nanostructured photonic crystal fibres. Nat. Phys. 2006, 2, 388. [CrossRef]33. Bae, H.; Yu, M. Miniature fabry-perot pressure sensor created by using UV-molding process with an optical fiber based mold.
Opt. Express 2012, 20, 14573–14583. [CrossRef]34. Lee, C.; Taylor, H. Fiber-optic Fabry-Perot temperature sensor using a low-coherence light source. J. Lightw. Technol. 1991, 9,
129–134. [CrossRef]35. Liu, T.; Fernando, G.F. A frequency division multiplexed low-finesse fiber optic Fabry–Perot sensor system for strain and
displacement measurements. Rev. Sci. Instrum. 2000, 71, 1275–1278. [CrossRef]36. Udd, E. Fiber optic smart structures. Proc. IEEE 1996, 84, 884–894. [CrossRef]37. Kee, H.H.; Lees, G.P.; Newson, T.P. 1.65 µm Raman-based distributed temperature sensor. Electron. Lett. 1999, 35, 1869–1871.38. Chen, X.; Shen, F.; Wang, Z.; Huang, Z.; Wang, A. Micro-air-gap based intrinsic Fabry-Perot interferometric fiber-optic sensor.
Appl. Opt. 2006, 45, 7760–7766. [CrossRef]39. Pinet, E. Fabry-Pérot fiber-optic sensors for physical parameters measurement in challenging conditions. J. Sens. 2009, 2009,
720980. [CrossRef]40. Song, M.; Lee, B.; Lee, S.B.; Choi, S.S. Interferometric temperature-insensitive strain measurement with different-diameter fiber
Bragg gratings. Opt. Lett. 1997, 22, 790–792. [CrossRef]41. Rao, Y. In-fibre Bragg grating sensors. Meas. Sci. Technol. 1997, 8, 355. [CrossRef]42. Parker, T.R.; Farhadiroushan, M.; Handerek, V.A.; Rogers, A.J. Temperature and strain dependence of the power level and
frequency of spontaneous Brillouin scattering in optical fibers. Opt. Lett. 1997, 22, 787–789. [CrossRef] [PubMed]43. Wait, P.; De Souza, K.; Newson, T. A theoretical comparison of spontaneous Raman and Brillouin based fibre optic distributed
temperature sensors. Opt. Commun. 1997, 144, 17–23. [CrossRef]44. Luo, J.; Hao, Y.; Ye, Q.; Hao, Y.; Li, L. Development of optical fiber sensors based on brillouin scattering and FBG for on-line
mon-itoring in overhead transmission lines. J. Lightw. Technol. 2013, 31, 1559–1565. [CrossRef]45. Hill, K.O.; Fujii, Y.; Johnson, D.C.; Kawasaki, B.S. Photosensitivity in optical fiber waveguides: Application to reflection filter
fabrication. Appl. Phys. Lett. 1978, 32, 647–649. [CrossRef]46. Arie, A.; Lissak, B.; Tur, M. Static fiber-Bragg grating strain sensing using frequency-locked lasers. J. Lightw. Technol. 1999, 17,
1849–1855. [CrossRef]47. Xu, M.; Geiger, H.; Dakin, J. Fibre grating pressure sensor with enhanced sensitivity using a glass-bubble housing. Electron. Lett.
1996, 32, 128–129. [CrossRef]48. Chakravartula, V.; Samiappan, D.; Kumar, R. Sensitivity enhancement analysis due to different coating materials of Fibre Bragg
Grating-based depth sensor for underwater applications. Opt. Quantum Electron. 2020, 52, 1–5. [CrossRef]49. Schroeder, R.J. High pressure and temperature sensing for the oil industry using fiber Bragg gratings written onto side hole single
mode fiber. In Proceedings of the 13th International Conference on Optical Fiber Sensors, Bellingham, WA, USA, 1 September1999; p. 109. [CrossRef]
50. Amos, S.; Njuguma, J.; Prabhu, R. Modelling and simulation of fiber Bragg grating characterization for oil and gas sensingap-plications. In Proceedings of the 2014 First International Conference on Systems Informatics, Modelling and Simulation,Sheffield, UK, 29 April–1 May 2014; pp. 255–260.
51. Sennhauser, U.; Frank, A.; Mauron, P.; Nellen, P. Reliability of optical fiber Bragg grating sensors at elevated temperature. InProceedings of the 2000 IEEE International Reliability Physics Symposium, San Jose, CA, USA, 10–13 April 2002; pp. 264–269.[CrossRef]
52. Lin, B.; Bao, J.; Yu, L.; Giurgiutiu, V. Acoustic emission detection with fiber optical sensors for dry cask storage health monitoring.In Proceedings of the Sensors and Smart Structures Technologies for Civil, Mechanical, and Aerospace Systems, Las Vegas, NV,USA, 21–24 March 2016; Volume 9803, p. 98031H-1. [CrossRef]
53. Shao, Z.; Rong, Q.; Chen, F.; Qiao, X. High-spatial-resolution ultrasonic sensor using a micro suspended-core fiber. Opt. Express2018, 26, 10820–10832. [CrossRef]
54. Berthold, J. Historical review of microbend fiber-optic sensors. J. Lightw. Technol. 1995, 13, 1193–1199. [CrossRef]55. Molenaar, M.M.; Fidan, E.; Hill, D.J. Real-time downhole monitoring of hydraulic fracturing treatments using fibre optic dis-
tributed temperature and acoustic sensing. In Proceedings of the SPE/EAGE European Unconventional Resources Conference &Exhibition-From Potential to Production. European Association of Geoscientists & Engineers, Vienna, Austria, 20 March 2012;p. 285.
56. Amos, S. Cross Sensitivity Analysis of Optical Fibre-Based Sensing for High Pressure, High Temperature Measurement in Oil andGas Applications. Ph.D. Thesis, Robert Gordon University, Aberdeen, UK, 2018.
57. Yin, S.; Yu, F.T.S. Fiber Optic Sensors; CRC Press: Boca Raton, FL, USA, 2002.
Sensors 2021, 21, 6047 30 of 33
58. Chen, L.; Chan, C.; Yuan, W.; Goh, S.; Sun, J. High performance chitosan diaphragm-based fiber-optic acoustic sensor. Sen.Actuators A Phys. 2010, 163, 42–47. [CrossRef]
59. Marques, R.D.S.; Prado, A.R.; Antunes, P.F.D.C.; André, P.S.D.B.; Ribeiro, M.R.N.; Neto, A.F.; Pontes, M.J. Corrosion resistantFBG-based quasi-distributed sensor for crude oil tank dynamic temperature profile monitoring. Sensors 2015, 15, 30693–30703.[CrossRef]
60. Amos, S.; Prabhu, R.; Njuguna, J. Theoretical design and analysis of a sensing system for high pressure and temperaturemeas-urement in subsea underwater applications. In Proceedings of the OCEANS 2017, Aberdeen, UK, 19 June 2017.
61. Liao, Y.-C.; Liu, B.; Liu, J.; Wan, S.-P.; He, X.-D.; Yuan, J.; Fan, X.; Wu, Q. High temperature (Up to 950 ◦C) sensor based on microtaper in-line fiber mach–zehnder interferometer. Appl. Sci. 2019, 9, 2394. [CrossRef]
62. Zhao, Y.; Dai, M.; Chen, Z.; Liu, X.; Gandhi, M.S.A.; Li, Q.; Fu, H.Y. Ultrasensitive temperature sensor with Vernier-effectimproved fiber Michelson interferometer. Opt. Express 2021, 29, 1090–1101. [CrossRef] [PubMed]
63. Wang, Q.; Han, L.; Fan, X.; Zhu, J. Distributed fiber optic vibration sensor based on polarization fading model for gas pipelineleakage testing experiment. J. Low Freq. Noise, Vib. Act. Control. 2017, 37, 468–476. [CrossRef]
64. Krohn, D.A.; MacDougall, T.W.; Mendez, A. Fiber Optic Sensors: Fundamentals and Applications; Spie Press: Bellingham, WA, USA,2014. [CrossRef]
65. Barlow, A.; Payne, D. The stress-optic effect in optical fibers. IEEE J. Quantum Electron. 1983, 19, 834–839. [CrossRef]66. McStay, D.; Shiach, G.; Nolan, A.; McAvoy, S. Optoelectronic sensors for subsea oil and gas production. J. Physics: Conf. Ser. 2007,
76, 012065. [CrossRef]67. Gooneratne, C.P.; Li, B.; Moellendick, T.E. Downhole applications of magnetic sensors. Sensors 2017, 17, 2384. [CrossRef]68. Spillman, W.B. Multimode fiber-optic pressure sensor based on the photoelastic effect. Opt. Lett. 1982, 7, 388–390. [CrossRef]69. Giles, I.P.; McNeill, S.; Culshaw, B. A stable remote intensity based optical fiber sensor. J. Phys. E Sci. Instrum. 1985, 18, 502–504.
[CrossRef]70. Mendez, A. Fiber Bragg grating sensors: A market overview. In Third European Workshop on Optical Fibre Sensors; International
Society for Optics and Photonics: Bellingham, WA, USA, 2007; Volume 6619, p. 661905. [CrossRef]71. Meltz, G.; Morey, W.W.; Glenn, W.H. Formation of Bragg gratings in optical fibers by a transverse holographic method. Opt. Lett.
1989, 14, 823–825. [CrossRef] [PubMed]72. Yariv, A. Coupled-mode theory for guided-wave optics. IEEE J. Quantum Electron. 1973, 9, 919–933. [CrossRef]73. Erdogan, T. Fiber grating spectra. J. Lightw. Technol. 1997, 15, 1277–1294. [CrossRef]74. Lemaire, P.J.; Atkins, R.M.; Mizrahi, V.; Reed, W.A. High pressure H2 loading as a technique for achieving ultrahigh UV
photosensitivity and thermal sensitivity in GeO2 doped optical fibres. Electron. Lett. 1993, 29, 1191–1193. [CrossRef]75. Hill, K.O.; Malo, B.; Bilodeau, F.; Johnson, D.C.; Albert, J. Bragg gratings fabricated in monomode photosensitive optical fiber by
UV exposure through a phase mask. Appl. Phys. Lett. 1993, 62, 1035–1037. [CrossRef]76. Othonos, A.; Xavier, L. Novel and improved methods of writing Bragg gratings with phase masks. IEEE Photonics Technol. Lett.
1995, 7, 1183–1185. [CrossRef]77. He, J.; Xu, B.; Xu, X.; Liao, C.; Wang, Y. Review of femtosecond-laser-inscribed fiber bragg gratings: Fabrication technologies and
sensing applications. Photon-Sensors 2021, 11, 203–226. [CrossRef]78. Qiao, X.; Shao, Z.; Bao, W.; Rong, Q. Fiber Bragg grating sensors for the oil industry. Sensors 2017, 17, 429. [CrossRef]79. Riant, I. UV-photoinduced fibre gratings for gain equalization. Opt. Fiber Technol. 2002, 8, 171–194. [CrossRef]80. Erdogan, T.; Sipe, J.E. Tilted fiber phase gratings. J. Opt. Soc. Am. A 1996, 13, 296–313. [CrossRef]81. Vengsarkar, A.M.; Lemaire, P.J.; Judkins, J.B.; Bhatia, V.; Erdogan, T.; Sipe, J.E. Long-period fiber gratings as band-rejection filters.
J. Lightw. Technol. 1996, 14, 58–65. [CrossRef]82. Eggleton, B.; Ouellette, F.; Poladian, L.; Krug, P. Long periodic superstructure Bragg gratings in optical fibres. Electron. Lett. 1994,
30, 1620–1622. [CrossRef]83. Malo, B.; Hill, K.; Thériault, S.; Bilodeau, F.; Johnson, D.; Albert, J. Apodised in-fibre Bragg grating reflectors photoimprinted
using a phase mask. Electron. Lett. 1995, 31, 223–225. [CrossRef]84. Sipe, J.E.; Poladian, L.; De Sterke, C.M. Propagation through nonuniform grating structures. J. Opt. Soc. Am. A 1994, 11, 1307–1320.
[CrossRef]85. Loh, W.H.; Laming, R.I. 1.55 micron phase-shifted distributed feedback fibre laser. Electron. Lett. 1995, 31, 1440–1442. [CrossRef]86. Smolen, J.J.; Van Der Spek, A. Distributed Temperature Sensing: A DTS Primer for Oil & Gas Production, 2003. The Hague:
Shell International Exploration and Production, B.V. Available online: http://drilling.posccaesar.org/export/385/projects/DailyProductionReport_1.0/XML/Version1.0/WITSML131/doc/Shell_DTS_Primer.pdf (accessed on 19 April 2021).
87. Inaudi, D.; Branko, G. Fiber Optic Sensing for innovative oil and gas production and transport systems. In Opt. Fiber Sensors;Optical Society of America: Washington, DC, USA, 2006.
88. Oulundsen, G.; Hennessey, D.; Conroy, M. Laser Focus World. 2015. Available online: http://www.laserfocusworld.com/articles/print/volume-51/issue-01/features/fiber-for-remote-sensing-downhole-sensing-applications-enhanced-by-specialty-optical-fibers.html (accessed on 19 April 2021).
89. Wang, X.; Lee, J.; Vachon, G. Distributed Temperature Sensor (DTS) System Modeling and Application. In Proceedings of the SPESaudi Arabia Section Technical Symposium, Al-Khobar, Saudi Arabia, 10 May 2008. [CrossRef]
Sensors 2021, 21, 6047 31 of 33
90. Liu, B.; Buric, M.P.; Chorpening, B.T.; Yu, Z.; Homa, D.S.; Pickrell, G.R.; Wang, A. Design and implementation of distributedultra-high temperature sensing system with a single crystal fiber. J. Lightwave Technol. 2018, 36, 5511–5520. [CrossRef]
91. E. Silva, M.S.P.; Alves, H.P.; Nascimento, J.F.D.; Martins-Filho, J.F. Impact of pulse width on the sensitivity and range of araman-based distributed fiberoptic temperature sensor. J. Microw. Optoelectron. Electromagn. Appl. 2018, 17, 539–551. [CrossRef]
92. Tanimola, F.; Hill, D. Distributed fibre optic sensors for pipeline protection. J. Nat. Gas Sci. Eng. 2009, 1, 134–143. [CrossRef]93. Boone, K.; Ridge, A.; Crickmore, A.; Onen, D. Detecting leaks in abandoned gas wells with fibre-optic distributed acoustic sensing.
In Proceedings of the International Petroleum Technology Conference, Doha, Qatar, 19–22 January 2014.94. Boering, M.; Braal, R.; Cheng, L.K. Toward the next fiber optic revolution and decision making in the oil and gas industry. In
Proceedings of the Offshore Technology Conference, Houston, TX, USA, 6–9 May 2013. [CrossRef]95. Hull, J.; Gosselin, L.; Borzel, K. Well integrity monitoring & analysis using distributed acqustic fiber optic sensors. In Proceedings
of the ADC/SPE Drilling Conference and Exhibition, New Orleans, LA, USA, 2–4 February 2010.96. Bao, X.; Chen, L. Recent progress in distributed fiber optic sensors. Sensors 2012, 12, 8601–8639. [CrossRef] [PubMed]97. Hausner, M.B.; Suarez, F.; Glander, K.E.; Van De Giesen, N.; Selker, J.S.; Tyler, S.W. Calibrating single-ended fiber-optic raman
spectra distributed temperature sensing data. Sensors 2011, 11, 10859–10879. [CrossRef] [PubMed]98. Poeggel, S.; Tosi, D.; Duraibabu, D.; Leen, G.; McGrath, D.; Lewis, E. Optical fibre pressure sensors in medical applications.
Sensors 2015, 15, 17115–17148. [CrossRef]99. Méndez, A.; Diatzikis, E. Fiber Optic Distributed Pressure Sensor Based on Brillouin Scattering; Optical Society of America: Washington,
DC, USA, 2006.100. Hashemian, H.; Black, C.; Farmer, J. Assessment of Fiber Optic Pressure Sensors. 1995. Available online: https://www.osti.gov/
servlets/purl/7139 (accessed on 19 April 2021).101. Zhang, L.; Yang, Z.; Szostkiewicz, Ł.; Markiewicz, K.; Nasilowski, T.; Thévenaz, L. Fully distributed pressure sensing with
ul-tra-high-sensitivity using side-hole fibers. In Proceedings of the 26th International Conference on Optical Fiber Sensors,Lausanne, Switzerland, 24–28 September 2018.
102. Pospíšilová, M.; Kuncová, G.; Trögl, J. Fiber-Optic Chemical Sensors and Fiber-Optic Bio-Sensors. Sensors 2015, 15, 25208–25259.[CrossRef]
103. Boersma, A.; Saalmink, M.; Lucassen, T.; Wiegersma, S.; Jansen, R.; Jansen, R.; Cheng, L. Fiber Bragg Distributed Chemical Sensor;IEEE: New York, NY, USA, 2011; pp. 1480–1483. [CrossRef]
104. Hwang, D.; Yoon, D.-J.; Kwon, I.-B.; Seo, D.-C.; Chung, Y. Novel auto-correction method in a fiber-optic distributed-temperaturesensor using reflected anti-Stokes Raman scattering. Opt. Express 2010, 18, 9747–9754. [CrossRef]
105. Van De Giesen, N.; Steele-Dunne, S.C.; Jansen, J.; Hoes, O.; Hausner, M.B.; Tyler, S.; Selker, J. Double-Ended Calibration ofFiber-Optic Raman Spectra Distributed Temperature Sensing Data. Sensors 2012, 12, 5471–5485. [CrossRef]
106. Suh, K.; Lee, C. Auto-correction method for differential attenuation in a fiber-optic distributed-temperature sensor. Opt. Lett.2008, 33, 1845–1847. [CrossRef]
107. Tyler, S.W.; Selker, J.S.; Hausner, M.B.; Hatch, C.E.; Torgersen, T.; Thodal, C.E.; Schladow, S.G. Environmental temperature sensingusing Raman spectra DTS fiber-optic methods. Water Resour. Res. 2009, 45. [CrossRef]
108. Zhang, Z.; Wang, J.; Li, Y.; Gong, H.; Yu, X.; Liu, H.; Jin, Y.; Kang, J.; Li, C.; Zhang, W.; et al. Recent progress in distributed opticalfiber Raman photon sensors at China Jiliang University. Photon-Sensors 2012, 2, 127–147. [CrossRef]
109. Chou, C.-C.; Sun, N.-H. Analysis of leaky-mode losses for optical fibers. J. Opt. Soc. Am. B 2008, 25, 545–554. [CrossRef]110. Alexander Schmidt, M.; Argyros, A.; Sorin, F. Hybrid optical fibers–An innovative platform for in-fiber photonic devices. Adv.
Opt. Mater. 2016, 4, 13–36. [CrossRef]111. Duo, Y.; Xiangge, H.; Fei, L.; Lijuan, G.; Min, Z.; Xiaokang, Q.; Han, Y. Self-suppression of common-mode noises of the different
fiber optic interferometric accelerometers. Opt. Express 2018, 26, 15384–15397. [CrossRef] [PubMed]112. Singer, J.M.; Karabacak, D.M.; Farnan, M.; Ibrahim, S.K.; Todd, M. A fiberoptic sensing system for system health monitoring in oil
& gas industry applications. In Proceedings of the European Workshop on Structural Health Monitoring, Bilbao, Spain, 5–8 July2016.
113. Miah, K.; Potter, D.K. A Review of hybrid fiber-optic distributed simultaneous vibration and temperature sensing technology andits geophysical applications. Sensors 2017, 17, 2511. [CrossRef]
114. Pevec, S.; Donlagic, D. Multiparameter fiber-optic sensors: A review. Opt. Eng. 2019, 58, 072009. [CrossRef]115. Rao, Y. Recent progress in applications of in-fibre Bragg grating sensors. Opt. Lasers Eng. 1999, 31, 297–324. [CrossRef]116. Davis, C.; Carome, E.; Weik, M.; Ezekiel, S.; Einzig, R. Fiberoptic Sensor Technology Handbook; Optical Technology Inc.: Herndon,
VA, USA, 1986.117. Zhang, W.; Dong, X.; Zhao, Q.; Kai, G.; Yuan, S. FBG-type sensor for simultaneous measurement of force (or displacement) and
temperature based on bilateral cantilever beam. IEEE Photon- Technol. Lett. 2001, 13, 1340–1342. [CrossRef]118. Xu, M.; Archambault, J.; Reekie, L.; Dakin, J. Thermally-compensated bending gauge using surface-mounted fibre gratings.
In-ternational. J. Optoelectron. 1994, 9, 281–284.119. Song, M.; Lee, S.B.; Choi, S.S.; Leeb, B. Simultaneous measurement of temperature and strain using two fiber bragg gratings
embedded in a glass tube. Opt. Fiber Technol. 1997, 3, 194–196. [CrossRef]120. Xu, M.G.; Reekie, L.; Dakin, J.P.; Archambault, J.-L. Discrimination between strain and temperature effects using dual-wavelength
fibre grating sensors. Electron. Lett. 1994, 30, 1085–1087. [CrossRef]
Sensors 2021, 21, 6047 32 of 33
121. Rogers, A.J.; Handerek, V.A.; Kanellopoulos, S.E.; Zhang, J. New ideas in nonlinear distributed optical fiber sensing. InProceedings of the European Symposium on Optics for Environmental and Public Safety International Society for Optics andPhotonics, Munich, Germany, 15 September 1995; pp. 162–174.
122. James, S.; Dockney, M.; Tatam, R. Simultaneous independent temperature and strain measurement using in-fibre Bragg gratingsensors. Electron. Lett. 1996, 32, 1133–1134. [CrossRef]
123. Zhou, Z.; Graver, T.W.; Hsu, L.; Ou, J. Techniques of Advanced FBG sensors: Fabrication, demodulation, encapsulation and theirapplication in the structural health monitoring of bridges. Pac. Sci. Rev. 2003, 5, 116–121.
124. Saitoh, T.; Nakamura, K.; Takahashi, Y.; Iida, H.; Iki, Y.; Miyagi, K. Ultra-long-distance fiber bragg grating sensor system. IEEEPhoton- Technol. Lett. 2007, 19, 1616–1618. [CrossRef]
125. Kong, D.; Chang, J.; Gong, P.; Liu, Y.; Sun, B.; Liu, X.; Wang, P.; Wang, Z.; Wang, W.; Zhang, Y. Analysis and improvement of SNRin FBG sensing system. Photon-Sensors 2012, 2, 148–157. [CrossRef]
126. Johny, J.; Prabhu, R.; Fung, W.K.; Watson, J. Investigation of positioning of FBG sensors for smart monitoring of oil and gas subseastructures. In Proceedings of the OCEANS 2016, Shanghai, China, 10–13 April 2016; pp. 1–4. [CrossRef]
127. Johny, J.; Summers, J.; Bhavsar, K.; Joseph, G.P.; Fung, W.K.; Prabhu, R. Theoretical investigation of positional influence of FBGsensors for structural health monitoring of offshore structures. In Proceedings of the OCEANS 2017, Aberdeen, UK, 19 June 2017;pp. 1–5. [CrossRef]
128. Huang, J.; Zhou, Z.; Zhang, D.; Wei, Q. A fiber bragg grating pressure sensor and its application to pipeline leakage detection.Adv. Mech. Eng. 2013, 5, 590451. [CrossRef]
129. Frazao, O.; Carvalho, J.; Ferreira, L.; Araújo, F.; Santos, J. Discrimination of strain and temperature using Bragg gratings inmi-crostructured and standard optical fibres. Meas. Sci. Technol. 2005, 16, 2109. [CrossRef]
130. Knight, J.; Birks, T.A.; Russell, P.; Atkin, D.M. All-silica single-mode optical fiber with photonic crystal cladding. Opt. Lett. 1996,21, 1547–1549. [CrossRef] [PubMed]
131. Knight, J.C. Photonic crystal fibres. Nature 2003, 424, 847–851. [CrossRef]132. Martelli, C.; Canning, J.; Groothoff, N.; Lyytikainen, K. Bragg gratings in photonic crystal fibers: Strain and temperature
characterization. In Proceedings of the International Society for Optics and Photonics, Bruges, Belgium, 23–27 May 2005;pp. 302–305.
133. Jollivet, C.; Guer, J.; Hofmann, P.; Schulzgen, A. Monolithic fiber lasers combining active PCF with bragg gratings in conven-tionalsingle-mode fibers. IEEE J. Sel. Top. Quantum Electron. 2014, 20, 36–41. [CrossRef]
134. Cusano, A.; Paladino, D. Developments and Applications of Microstructured Fiber Bragg Gratings. J. Lightw. Technol. 2009, 27,1663–1697. [CrossRef]
135. Zhao, Y.; Zhang, Y.; Wu, D.; Wang, Q. Magnetic field and temperature measurements with a magnetic fluid-filled photonic crystalfiber bragg grating. Instrum. Sci. Technol. 2013, 41, 463–472. [CrossRef]
136. Chen, W.; Li, J.; Lu, P. Progress of photonic crystal fibers and their applications. Frontiers of Optoelectronics in China. Sel. Publ.Chin. Univ. 2009, 2, 50–57.
137. Johny, J.; Prabhu, R.; Fung, W.K. Investigation of structural parameter dependence of confinement losses in PCF–FBG sensor foroil and gas sensing applications. Opt. Quantum Electron. 2016, 48, 1–9. [CrossRef]
138. Johny, J.; Smith, T.; Bhavsar, K.; Prabhu, R. Design of optical fibre based highly sensitive acoustic sensor for underwaterapplica-tions. In Proceedings of the OCEANS 2017, Aberdeen, UK, 19 June 2017.
139. Wolinski, T.; Szaniawska, K.; Ertman, S.; Lesiak, P.; Domanski, A.W.; Dabrowski, R.; Nowinowski-Kruszelnicki, E.; Wojcik, J.Influence of temperature and electrical fields on propagation properties of photonic liquid-crystal fibres. Meas. Sci. Technol. 2006,17, 985–991. [CrossRef]
140. Algorri, J.F.; Urruchi, V.; Bennis, N.; Sánchez-Pena, J.M. A Novel high-sensitivity, low-power, liquid crystal temperature sensor.Sensors 2014, 14, 6571–6583. [CrossRef]
141. Algorri, J.; Zografopoulos, D.; Tapetado, A.; Poudereux, D.; Sánchez-Pena, J. Infiltrated photonic crystal fibers for sensingap-plications. Sensors 2018, 18, 4263. [CrossRef] [PubMed]
142. Rajan, G. Optical Fiber Sensors: Advanced Techniques and Applications; CRC Press: Boca Raton, FL, USA, 2015.143. Johny, J.; Prabhu, R.; Fung, W.K. Numerical investigation of nanostructured silica pcfs for sensing applications. JOM 2017, 69,
2286–2291. [CrossRef]144. Johny, J.; Prabhu, R.; Fung, W.K. Computational study of nanostructured composite materials for photonic crystal fibre sensors.
IOP Conf. Series Mater. Sci. Eng. 2017, 195, 12012. [CrossRef]145. Chen, D. Nanostructured photonic crystal fiber with ultra-high birefringence. In Proceedings of the 2006 International Symposium
on Biophotonics, Nanophotonics and Metamaterials, Hangzhou, China, 16–18 October 2006; pp. 362–365. [CrossRef]146. Islam, M.S.; Ng, B.W.H.; Abbott, D. Porous-core photonic crystal fibers guide polarization-preserving terahertz waves. Laser
Focus World 2018, 54, 49.147. Cubillas, A.M.; Unterkofler, S.; Euser, T.; Etzold, B.J.; Jones, A.C.; Sadler, P.J.; Wasserscheid, P.; Russell, P.S. Photonic crystal fibres
for chemical sensing and photochemistry. Chem. Soc. Rev. 2013, 42, 8629–8648. [CrossRef]148. Pinto, A.M.R.; Lopez-Amo, M. Photonic crystal fibers for sensing applications. J. Sens. 2012, 2012, 1–21. [CrossRef]149. Lumholt, O.; Bjarklev, A.; Rasmussen, T.; Lester, G. Rare earth-doped integrated glass components: Modeling and optimization. J.
Lightw. Technol. 1995, 13, 275–282. [CrossRef]
Sensors 2021, 21, 6047 33 of 33
150. Wang, F.; Hu, L.; Xu, W.; Wang, M.; Feng, S.; Ren, J.; Zhang, L.; Chen, D.; Ollier, N.; Gao, G.; et al. Manipulating refractive index,homogeneity and spectroscopy of Yb-doped silica-core glass towards high-power large mode area photonic crystal fiber lasers.Opt. Express 2017, 25, 25960. [CrossRef]
151. Nandi, P.; Srinivasan, A.; Jose, G. Structural dependent thermal and optical properties of rare earth doped glass with mixed glassformers. Opt. Mater. 2009, 31, 653–659. [CrossRef]
152. Chimalawong, P.; Kirdsiri, K.; Kaewkhao, J.; Limsuwan, P. Investigation on the physical and optical properties of Dy3+ dopedsoda-lime-silicate glasses. Procedia Eng. 2012, 32, 690–698. [CrossRef]
153. Cui, J.; Hope, G.A. Raman and fluorescence spectroscopy of CeO2, Er2O3, Nd2O3, Tm2O3, Yb2O3, La2O3, and Tb4O. J. Spectrosc.2015, 2015, 1–8. [CrossRef]
154. Burruss, R.C.; Ging, T.G.; Eppinger, R.G.; Samson, A.M. Laser-Excited Fluorescence of Rare Earth Elements in Fluorite: InitialObservations with a Laser Raman Microprobe; Elsevier Science: New York, NY, USA, 1992.
155. Quoi, K.; Lieberman, R.; Cohen, L.; Shenk, D.; Simpson, J. Rare-earth doped optical fibers for temperature sensing. J. Lightw.Technol. 1992, 10, 847–852. [CrossRef]
156. Amira, Z.; Bouyahi, M.; Ezzedine, T. Measurement of temperature through raman scattering. Procedia Comput. Sci. 2015, 73,350–357. [CrossRef]
157. Dakin, J.; Pratt, D.; Bibby, G.; Ross, J. Distributed optical fibre Raman temperature sensor using a semiconductor light source anddetector. Electron. Lett. 1985, 21, 569–570. [CrossRef]
158. Wolfbeis, O.S. Materials for fluorescence-based optical chemical sensors. J. Mater. Chem. 2005, 15, 2657–2669. [CrossRef]159. Soto, M.A.; Nannipieri, T.; Signorini, A.; Lazzeri, A.; Baronti, F.; Roncella, R.; Bolognini, G.; Di Pasquale, F. Raman-based
distributed temperature sensor with 1 m spatial resolution over 26 km SMF using low-repetition-rate cyclic pulse coding. Opt.Lett. 2011, 36, 2557–2559. [CrossRef] [PubMed]