Ontogeny of form and function: Locomotor morphology and drag in zebrafish (Danio rerio)
11
Ontogeny of Form and Function: Locomotor Morphology and Drag in Zebrafish (Danio rerio) Matthew J. McHenry 1 * and George V. Lauder 2 1 Department of Ecology & Evolutionary Biology, University of California, Irvine, California 92697 2 Department of Organismic and Evolutionary Biology, Harvard University, Cambridge, Massachusetts 02138 ABSTRACT Many fish species transform in body shape during growth, but it remains unclear how this influences the mechanics of locomotion. Therefore, the present study focused on understanding how drag generation during coasting is affected by ontogenetic changes in the mor- phology of zebrafish (Danio rerio). The shapes of the body and fins were measured from photographs of fish ranging in size from small larvae to mature adults and these morphometrics were compared to drag coefficients calcu- lated from high-speed video recordings of routine swim- ming. We found that the viscous drag coefficient of larval and juvenile fish increased by more than an order of mag- nitude during growth and the inertial drag coefficient decreased at a comparable rate in adults. These hydrody- namic changes occurred as zebrafish disproportionately increased the span of their fins and their body changed shape from elongated to streamlined, as reflected by the logistic growth of a newly defined streamlining index, S L . These results suggest that morphological changes incur a performance cost by generating greater drag when larvae and juveniles operate in the viscous regime, but later provide a performance benefit by reducing pressure drag in the inertial regime of the adult stage. J. Morphol. 267: 1099 –1109, 2006. © 2006 Wiley-Liss, Inc. KEY WORDS: gliding; locomotion; swimming; fish; scal- ing; allometry; isometry The mechanics of locomotion may transform dra- matically over the growth of an aquatic animal due to changes in morphology and size-dependent hydro- dynamics. Both factors figure prominently in the numerous species of fish that grow from a few mil- limeters to a few centimeters in length. Although zoologists have long appreciated the dramatic pat- terns of morphological change in these animals (e.g., Thompson, 1917), it remains unclear how growth affects the hydrodynamics of locomotion. Therefore, a prior study focused on understanding how hydro- dynamic regimes scale with body size in zebrafish (Danio rerio: McHenry and Lauder, 2005) and the present study examined how changes in body shape affect drag generation in the same species. Scaling of Drag Inertial force plays an increasingly dominant role in the hydrodynamics of locomotion as a fish grows larger. The Reynolds number (Re UL/, where U is flow speed, L is body length, and and are, respectively, the density and dynamic viscosity of water; Lamb, 1945) normalizes the magnitude of this force relative to viscous force and thereby pro- vides a nondimensional index of hydrodynamic scale. Therefore, measurements of Re indicate the relative contribution of inertial and viscous forces to the total force acting on a body. In a coasting fish, drag is primarily generated by viscous force at Re 300 and inertial force at Re 1,000 (McHenry and Lauder, 2005). In the viscous regime, drag may be normalized by the size and speed of the animal to yield the viscous drag coefficient (C visc D/UL, where D is drag). The inertial drag coefficient (C inert 2D / U 2 S) provides a similar nondimen- sional measure of drag for the inertial regime (Lamb, 1945; Batchelor, 1967; Webb and Weihs, 1986; Osse and Drost, 1989; McHenry et al., 2003). These drag coefficients express the propensity of an animal’s shape to generate drag within the appro- priate regime, irrespective of body size or speed. Therefore, the present study used in vivo measure- ments of drag coefficients (Bilo and Nachtigall, 1980; McHenry and Lauder, 2005) to determine how shape change affects drag production over the course of growth. Growth of Locomotor Morphology Although many fishes grow from an elongated larval body to a streamlined adult, interspecific dif- ferences in morphology have confounded attempts to encapsulate this pattern with measurements of lin- ear dimensions. For example, the trunk and caudal regions of both salmon (Oncorhynchus tshawytscha; Contract grant sponsor: National Science Foundation (NSF) Post- doctoral Research Fellowship; Contract grant numbers: NSF IOB0509740 (to M.J.M.); IBN0316675 (to G.V.L.). *Correspondence to: M.J. McHenry, 321 Steinhaus Hall, University of California, Irvine, CA 92697. E-mail: [email protected] Published online 2 June 2006 in Wiley InterScience (www.interscience.wiley.com) DOI: 10.1002/jmor.10462 JOURNAL OF MORPHOLOGY 267:1099 –1109 (2006) © 2006 WILEY-LISS, INC.
-
Upload
independent -
Category
Documents
-
view
1 -
download
0
Transcript of Ontogeny of form and function: Locomotor morphology and drag in zebrafish (Danio rerio)
Ontogeny of Form and Function: Locomotor Morphologyand Drag in Zebrafish (Danio rerio)Matthew J. McHenry1* and George V. Lauder2
1Department of Ecology & Evolutionary Biology, University of California, Irvine, California 926972Department of Organismic and Evolutionary Biology, Harvard University, Cambridge, Massachusetts 02138
ABSTRACT Many fish species transform in body shapeduring growth, but it remains unclear how this influencesthe mechanics of locomotion. Therefore, the present studyfocused on understanding how drag generation duringcoasting is affected by ontogenetic changes in the mor-phology of zebrafish (Danio rerio). The shapes of the bodyand fins were measured from photographs of fish rangingin size from small larvae to mature adults and thesemorphometrics were compared to drag coefficients calcu-lated from high-speed video recordings of routine swim-ming. We found that the viscous drag coefficient of larvaland juvenile fish increased by more than an order of mag-nitude during growth and the inertial drag coefficientdecreased at a comparable rate in adults. These hydrody-namic changes occurred as zebrafish disproportionatelyincreased the span of their fins and their body changedshape from elongated to streamlined, as reflected by thelogistic growth of a newly defined streamlining index, SL.These results suggest that morphological changes incur aperformance cost by generating greater drag when larvaeand juveniles operate in the viscous regime, but laterprovide a performance benefit by reducing pressure dragin the inertial regime of the adult stage. J. Morphol. 267:1099–1109, 2006. © 2006 Wiley-Liss, Inc.
KEY WORDS: gliding; locomotion; swimming; fish; scal-ing; allometry; isometry
The mechanics of locomotion may transform dra-matically over the growth of an aquatic animal dueto changes in morphology and size-dependent hydro-dynamics. Both factors figure prominently in thenumerous species of fish that grow from a few mil-limeters to a few centimeters in length. Althoughzoologists have long appreciated the dramatic pat-terns of morphological change in these animals (e.g.,Thompson, 1917), it remains unclear how growthaffects the hydrodynamics of locomotion. Therefore,a prior study focused on understanding how hydro-dynamic regimes scale with body size in zebrafish(Danio rerio: McHenry and Lauder, 2005) and thepresent study examined how changes in body shapeaffect drag generation in the same species.
Scaling of Drag
Inertial force plays an increasingly dominant rolein the hydrodynamics of locomotion as a fish grows
larger. The Reynolds number (Re � �UL/�, where Uis flow speed, L is body length, and � and � are,respectively, the density and dynamic viscosity ofwater; Lamb, 1945) normalizes the magnitude ofthis force relative to viscous force and thereby pro-vides a nondimensional index of hydrodynamicscale. Therefore, measurements of Re indicate therelative contribution of inertial and viscous forces tothe total force acting on a body. In a coasting fish,drag is primarily generated by viscous force at Re �300 and inertial force at Re � 1,000 (McHenry andLauder, 2005). In the viscous regime, drag may benormalized by the size and speed of the animal toyield the viscous drag coefficient (Cvisc � D/UL�,where D is drag). The inertial drag coefficient(Cinert � 2D / U2S�) provides a similar nondimen-sional measure of drag for the inertial regime(Lamb, 1945; Batchelor, 1967; Webb and Weihs,1986; Osse and Drost, 1989; McHenry et al., 2003).These drag coefficients express the propensity of ananimal’s shape to generate drag within the appro-priate regime, irrespective of body size or speed.Therefore, the present study used in vivo measure-ments of drag coefficients (Bilo and Nachtigall, 1980;McHenry and Lauder, 2005) to determine how shapechange affects drag production over the course ofgrowth.
Growth of Locomotor Morphology
Although many fishes grow from an elongatedlarval body to a streamlined adult, interspecific dif-ferences in morphology have confounded attempts toencapsulate this pattern with measurements of lin-ear dimensions. For example, the trunk and caudalregions of both salmon (Oncorhynchus tshawytscha;
Contract grant sponsor: National Science Foundation (NSF) Post-doctoral Research Fellowship; Contract grant numbers: NSFIOB0509740 (to M.J.M.); IBN0316675 (to G.V.L.).
*Correspondence to: M.J. McHenry, 321 Steinhaus Hall, Universityof California, Irvine, CA 92697. E-mail: [email protected]
Published online 2 June 2006 inWiley InterScience (www.interscience.wiley.com)DOI: 10.1002/jmor.10462
JOURNAL OF MORPHOLOGY 267:1099–1109 (2006)
© 2006 WILEY-LISS, INC.
Hale, 1996) and pike (Esox lucius; Fuiman, 1982)become less elongated and more streamlined duringgrowth. However, the fineness ratio (body lengthdivided by its maximum height) decreases in pikeand increases in salmon because salmon digest arelatively large yolk during the larval stage. Beyondproviding an incomplete description of form, thefineness ratio is difficult to interpret functionallybecause it does not directly relate to a mechanicalparameter, such as a drag coefficient.
Hydrodynamic theory provides a basis for inter-preting how growth affects fish locomotion. As somespecies adopt a more streamlined shape, they movewith greater intermittency and apparent maneuver-ability. It has been observed that these changescorrelate with increases in size and speed that per-mit operating at Re � 20 (Webb and Weihs, 1986;Fuiman and Webb, 1988; Osse and van den Boo-gaart, 2000; Muller and van Leeuwen, 2004). Underthe assumption that locomotor hydrodynamics be-come inertia-dominated at the Re � 20, it has beenargued that streamlining serves as a drag-reducingadaptation to the hydrodynamics of routine swim-ming. According to this argument, changes in loco-motor morphology match the immediate demands ofthe size-dependent hydrodynamics at each stage ofgrowth. However, the hydrodynamic scaling as-sumed by these interpretations (based largely on thehydrodynamics of a sphere: Hoerner, 1965) waschallenged by recent experimental evidence suggest-ing that larval fish are viscous-dominated up to Re �300 (Fuiman and Batty, 1997; McHenry and Lauder,2005). These findings raise the possibility that ob-served morphological and behavioral change pre-cedes any dramatic shift in the hydrodynamics ofroutine swimming. In such conditions, the scale-dependency of hydrodynamics delays the functionalbenefits to streamlining and intermittent swimminguntil the fish are large enough to operate outside ofthe viscous regime.
In order to examine the immediate or delayedconsequences of morphological growth, we relatedchanges in morphology to the drag coefficients dur-
ing coasting in zebrafish. This approach focused onaddressing three specific questions. 1) How does thebody change shape during growth? We measuredlinear dimensions and reconstructed the 3D shape ofthe bodies of fish from photographs to calculate sur-face area and a streamlining index. 2) How do thesize and posture of the fins change during growth?The morphometrics and kinematics of the fins dur-ing coasting were compared across growth stages. 3)How do morphological changes affect drag coeffi-cient? We measured the drag coefficients of coastingfish in vivo and compared how they changed withmorphology and kinematics.
MATERIALS AND METHODS
Measurements were made using wildtype zebrafish, Danio re-rio (Hamilton-Buchanan 1822), ranging in size from small larvae(�5 days postfertilization) to adults (�90 days postfertilization),with each fish categorized by stage of growth based on bodylength. Fish were considered small larvae if L � 5.4 mm (whereL is body length), large larvae if 5.4 mm � L � 8.9 mm, juvenilesif 8.9 mm � L � 18.0 mm, and adults if L � 18.0 mm (Schilling,2002). All fish were maintained according to standard protocols(Westerfield, 1995) on a 14/10 h light/dark cycle at 26°C. Fishwere euthanized by an overdose of MS-222 (Argent Laboratories,Redmond, WA) following kinematic experiments and prior tomorphometric measurements. The present study was conductedin parallel with a previously reported project (McHenry andLauder, 2005) that used some of the same subjects.
Body and Fin Morphometrics
The shape of the body and fins were measured from digitalphotographs of dead fish photographed from dorsal and lateralviews. We used a digital camera (2048 � 1536 pixels in 8-bitgrayscale, Nikon Coolpix 995) mounted onto a stereomicroscopeat a magnification where the body length spanned approximatelythree-quarters of the camera frame. Silhouettes describing theshape of the body and fins were traced from these photographs(Fig. 1A) using Photoshop (v. 6.0, Adobe Systems, San Jose, CA)and converted to a binary image. The area and coordinates de-scribing the peripheral shape of silhouettes were found using acustom program in Matlab (v. 6.5 with Image Processing Toolbox4.0, MathWorks, Natick, MA) that required user input to specifycoordinates for the rostrum, body midline, posterior margin of thecaudal fin, dorsal and ventral margins of each median fin, andproximal and distal ends of the pectoral fins by visual landmarks.
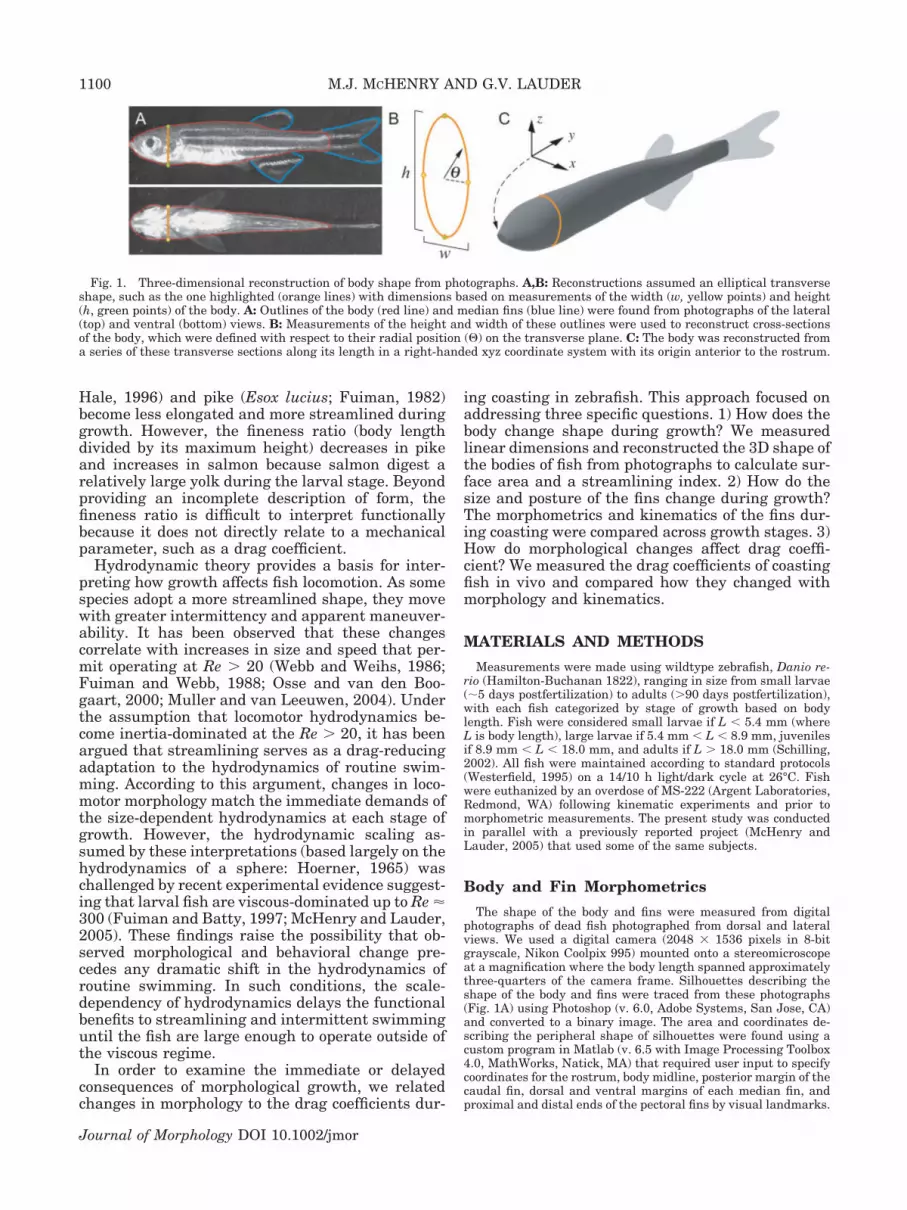
Fig. 1. Three-dimensional reconstruction of body shape from photographs. A,B: Reconstructions assumed an elliptical transverseshape, such as the one highlighted (orange lines) with dimensions based on measurements of the width (w, yellow points) and height(h, green points) of the body. A: Outlines of the body (red line) and median fins (blue line) were found from photographs of the lateral(top) and ventral (bottom) views. B: Measurements of the height and width of these outlines were used to reconstruct cross-sectionsof the body, which were defined with respect to their radial position () on the transverse plane. C: The body was reconstructed froma series of these transverse sections along its length in a right-handed xyz coordinate system with its origin anterior to the rostrum.
1100 M.J. MCHENRY AND G.V. LAUDER
Journal of Morphology DOI 10.1002/jmor

Measurements of the median fins were made from the photo-graphs of the lateral view, but the pectoral fins were photo-graphed and measured from such an angle that the camera wasperpendicular to a single fin (i.e., the view with maximum finarea). The span of the caudal fin was taken as the distancebetween its dorsal and ventral margins. The span of the dorsaland anal fins was considered the sum of distances between thedorsal and ventral margins of both fins and therefore excludedthe height of the body. Similarly, the width of the body wasexcluded from measurements of the span of the pectoral fins,which was calculated as twice the distance between proximal anddistal ends of a single fin.
The exponential growth in linear dimensions, body mass, andwetted surface area of the body and fins were evaluated bybase-10 log-transformation and regression analysis. The expo-nential growth of these dependent parameters, y, were describedby a scaling constant, a, and scaling factor, f, of an exponentialfunction of body length (y � a Lf). Log-transformation of theindependent and dependent variables in these exponential rela-tionships yielded the equation for a line (Log10 y � f Log10 L Log10a; Huxley, 1932). The scaling factor found from this curvefitting was statistically compared to an isometric prediction (fo)using a reduced major axis regression analysis with Matlab(Sokal and Rohlf, 1995). This form of Type II regression analysiswas appropriate in this case because the dependent variablescould not be assumed to have the same scale or dimensions asbody length measurements (Rayner, 1985). We considered growthto be allometric in cases where the isometric prediction (fo � 1 forlinear measurements, fo � 2 for area, fo � 3 for mass or volume)fell outside of the lower, flow, and upper, fup, 95% confidenceintervals for the scaling factor (Rayner, 1985; McHenry and Jed,2003).
The 3D shape of the body of a fish was reconstructed frommeasurements of its peripheral shape from dorsal and lateralviews using a custom program in Matlab. This program firstinterpolated between coordinates of silhouettes of the body’s pe-riphery to find the height (h) and width (w) of the body at 200equally spaced positions along the midline (Fig. 1A,B). The shapeof the body in the transverse plane was calculated from thesemeasurements by approximating its shape as an ellipse (Fig. 1B).This reconstruction of the body was performed in a right-handedxyz coordinate system with its origin at the anterior of the ros-trum, its y-axis directed posteriorly and its z-axis directed dor-sally (Fig. 1C). The transverse ellipses of the body provided x- andz-coordinates describing the shape of the body at each y-position:
xper �w2 Cos�� , (1)
zper �h2 Sin�� � zcen, (2)
where xper and zper are, respectively, the peripheral coordinates ofthe body’s surface along the x- and z-axes, zcen is the position ofthe center of the transverse section in the z direction, and is theradial position of the periphery (100 equally spaced points over0 � � 2�; Fig. 1B). The surface of the body was defined bypolygons connecting the coordinates of neighboring ellipses at thesame radial position. Increasing the resolution beyond 200 mid-line positions and 100 radial positions ceased to influence mor-phometric measurements.
This volumetric description of the body allowed us to calculatea series of mechanically relevant morphometric parameters. Wecalculated the wetted surface area as the sum of area for allpolygons describing the body’s peripheral shape (within Matlab).Measurements of body mass in small larvae were confounded byadherent water or rapid desiccation and the limited sensitivity ofour analytical balance (0.1 mg, Mettler AE50). Therefore, wecalculated the mass of these fish as the product of the density ofwater and the integrated volume enclosed by the peripheralshape of the body.
In order to quantify the degree to which a body is streamlined,we compared its volume distribution to a body having the profileof a streamlined shape. Streamlined shapes were drawn from thefamily of foils classified by the U.S. National Advisory Committeefor Aeronautics (NACA). The shape of the NACA family of 0000-series foils without camber may be described by its height, hNACA,as a function of y in the following equation (Ladson et al., 1996):
hNACA(y) �hmax
2 �0.2969�yL�
1/2
� 0.1260�yL�
� 0.3516�yL�
2
0.2843�yL�
3
�0.1015�yL�
4� (3)
where hmax is the height equal to the maximum height measuredalong the midline of the fish’s body. The same equation was usedto calculate the width, wNACA(y), of the streamlined body usingthe maximum width, wmax, of the fish’s body and the transverseshape of these bodies were also assumed to be elliptical.
The distributions of volume for fish and NACA-streamlinedbodies were compared by finding the ratio of their moments ofinertia. The moment of inertia is calculated by dividing a bodyinto numerous small volumes and then integrating the product ofvolumes by their squared distance from an axis of rotation (Me-riam and Kraige, 1997). In our calculations, the axis of rotationwas positioned anterior to the rostrum in a dorsoventral direction(i.e., running along the z-axis, Fig. 1C). The second moment ofarea, I, for both and streamlined bodies was calculated with thefollowing equation:
I ���
4 �i�1
n � 116w3h � why2�
i
�y, (4)
where �y is the distance between transverse sections and y, h,and w are, respectively, the y-position, height, and width of the ith
section, for a total of n sections. Measurements of height andwidth were used to calculate the moment of inertia for the fishbody, Ifish and Eq. 3 provided the dimensions to find the momentof inertia for the streamlined body, INACA. The streamlining in-dex, SL, was calculated as the ratio of these quantities:
SL �Ifish
INACA. (5)
The streamlining index was related to base-10 log-transformedvalues of body length with a logistic regression. This type ofregression is appropriate for relating a proportion to a continuousvariable (Sokal and Rohlf, 1995) and, in this case, was describedby the following equation:
SL(L)�eb1b2Log10L
1 � eb1b2Log10L, (6)
which yields:
ln� SL
1 � SL�� b1 � b2 Log10L. (7)
Values for the constants describing the intercept, b1, and rate ofchange, b2, were found by maximum-likelihood within Matlab(with the Statistics Toolbox 5.0).
Kinematics and Hydrodynamics
The posture of the fins during coasting was measured fromvideo recordings of fish at different stages of growth. Coastingwas recorded from a dorsal view with a high-speed, high-resolution video camera (500 frames s-1 at 1280 � 1024 pixels,
1101LOCOMOTOR MORPHOLOGY OF ZEBRAFISH
Journal of Morphology DOI 10.1002/jmor

NAC Hi-Dcam II) focused on the center of the aquarium using amacro lens (50 mm Nikkor, Nikon) with a field of view rangingfrom �4 to �50 mm in width. We analyzed only those sequenceswhere fish visibly maintained a constant posture to their fins, fora total of three coasting sequences per individual. Projected an-gles of fin posture from the dorsal view were measured withrespect to the midline of the body for caudal, dorsal, and pectoralfins. The caudal fin angle was taken as half the angle between thedorsal and ventral lobes of the fin with respect to the peduncle.The dorsal fin angle was measured between the posterior fin baseand lateralmost margin of the fin, with respect to its anteriormargin. The pectoral fin angle was taken as the angle betweenthe lateralmost point on the leading edge and the lateral surfaceof the body, with respect to the medial base of the fin. The finangles for each coast were taken as the mean value from fivevideo frames spanning the duration of the coasting phase.
The instantaneous positional changes in the body of coastingfish provided the basis for measurements of Reynolds numberand in vivo drag coefficients. Changes in the position of fish weremeasured from video recordings of coasting (as in Osse and Drost,1989) by autotracking a point between the eyes of fish using acustom Matlab program (methods detailed in McHenry andLauder, 2005). The average Reynolds number, Re, was calculatedusing the mean speed, U� , of fish throughout a glide (Lamb, 1945):
Re ��UL
�, (8)
where � is water density, and � is water viscosity. Consistentwith the results of McHenry and Lauder (2005), fish were consid-ered to operate in the inertial regime when Re � 1,000 and theviscous regime when Re � 300. The drag experienced by fishgliding in the intermediate regime (300 � Re � 1,000) was ap-proximated as inertial drag and therefore treated the same wayas fish at Re � 1,000.
The biomechanical simplicity of coasting allows in vivo mea-surements of drag coefficients. In the inertial regime, the drag ona coasting body may be found by calculating the inverse of in-stantaneous measurements of speed and then curve fitting thefollowing equation to those measurements (Bilo and Nachtigall,1980):
1U�t � jt �
1Uo
. (9)
We found the slope of this relationship, j, with a linear least-squares curve fit (in Matlab) and then used that value with themeasured body mass, m, and wetted surface area, Abody, to cal-culate the inertial drag coefficient for a glide (modified from Biloand Nachtigall, 1980):
Cinert �2j�m � �MV
�Abody, (10)
where M is the added mass coefficient (assumed equal to a 1:6ellipsoid, M � 0.045; Munk, 1922; McHenry and Lauder, 2005)and V is the volume of the body, calculated from our volumetricreconstruction (see above). A similar approach was taken to findthe viscous drag coefficient for fish operating at low Reynoldsnumbers. The following equation was curve-fit to measurementsof body position using a nonlinear least-squares fit (McHenry andLauder, 2005):
p�t � Uo��1 � e�l/� , (11)
where � is the time constant. Values for the time constant foundby curve-fitting were used to calculate the viscous drag coefficientfrom the following equation (McHenry and Lauder, 2005):
Cvisc �m � M�V
�L�. (12)
RESULTSLocomotor Morphology
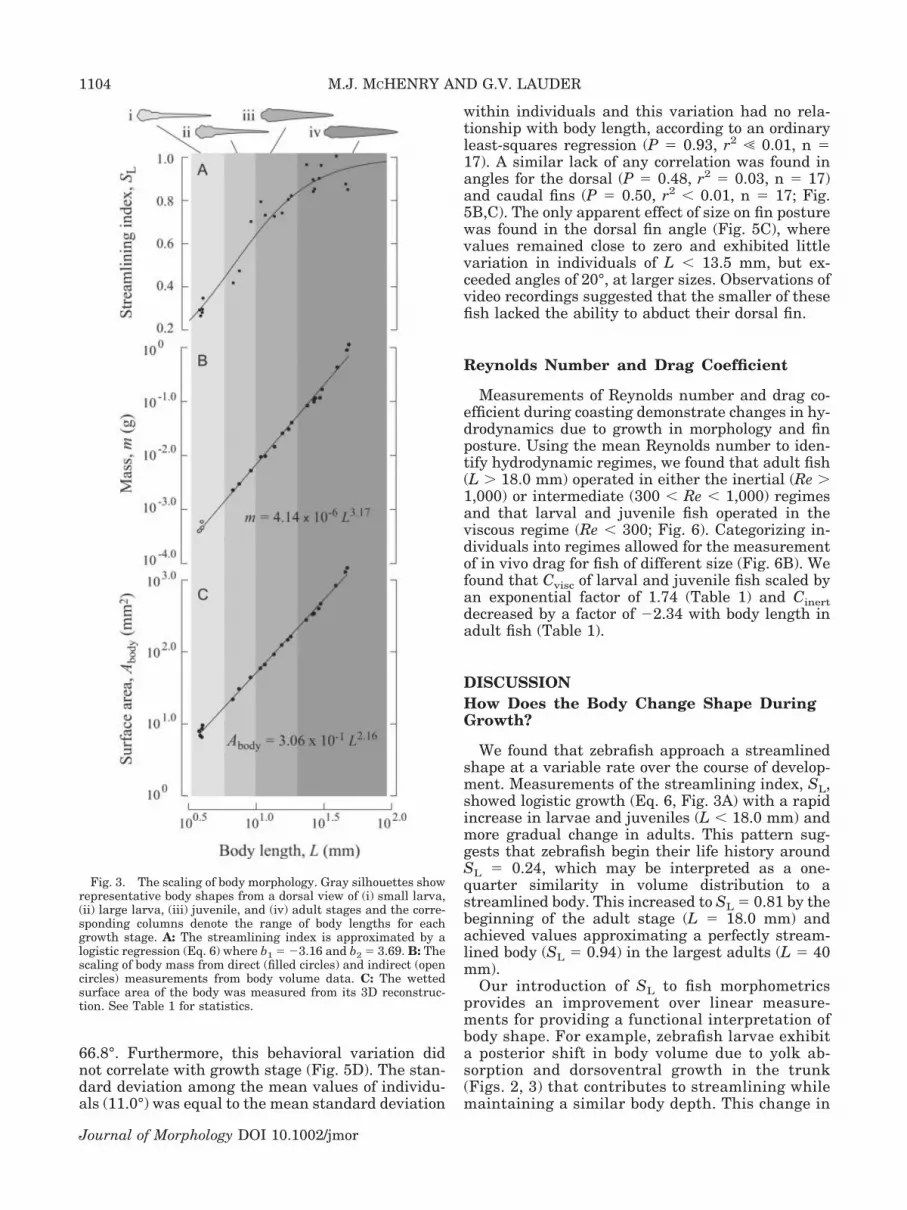
Our morphometric measurements trackedchanges in body shape and the fins during growth.The bodies of larvae tapered posteriorly, with thegreatest width at the eyes (Fig. 2A,B). The trunkand caudal regions became thicker over ontogeny,particularly in the growth from larval to juvenilestages (Fig. 2B,C), and thereby contributed to bodystreamlining. This trend continued in the growthbetween juvenile and adult stages (Fig. 2C,D), whichwas reflected in SL measurements (Fig. 3A). SLshowed a rapid increase (from �0.30 to �0.75) in thegrowth from larval to juvenile stages and a smallerchange (from �0.75 to �0.90) in subsequent growth.These changes were characterized by a logisticgrowth equation (Eq. 6), where b1 � �3.16 and b2 �3.69 and L was given in millimeters.
Changes in the body shape of zebrafish were re-flected by its allometric scaling. The exponentialscale factor for body mass was slightly, but signifi-cantly, greater than isometry (f � 3.17; Fig. 3B,Table 1), which may be attributed to the allometricscaling of body volume (f � 3.33; Table 1). The larg-est few fish showed deviation above this trend inbody mass that suggests a higher scale factor thanthe general trend for all stages (Fig. 3B). The allo-metric growth of the body was further reflected inthe scaling of wetted surface area, which also exhib-ited small, but significant, deviations from isometry(f � 2.16; Fig. 3C, Table 1). Therefore, growth inbody mass, volume, and surface area outpaced in-creases in body length as zebrafish adopted astreamlined form.
Positive allometric growth was found in the scal-ing of fin morphology. The distances spanned by thepectoral (Fig. 4A), dorsal and anal (Fig. 4C), andcaudal (Fig. 4E) fins scaled by factors greater thanpredicted by isometry (Table 1). Although this sug-gests that adults have disproportionately larger finsthan larvae, we found that the wetted surface areascaled with isometry in all but the pectoral fins (Fig.4B,D,F). Therefore, the median fins changed theirshape in a manner that increased their span whilemaintaining the same proportionate area.
Our measurements of fin posture during coastingdemonstrated large behavioral variation that didnot correlate with body size. Although we found fishof all sizes to maintain constant fin postures for theduration of the coasting phase, the angular orienta-tion of the pectoral, dorsal, and caudal fins variedgreatly between individuals of the same size andbetween coasts of the same individual (Fig. 5). Forexample, one juvenile (L � 13.8 mm) exhibited pec-toral fin angles between 25.6° and 26.6°, while an-other (L � 12.0 mm) ranged between 30.7° and
1102 M.J. MCHENRY AND G.V. LAUDER
Journal of Morphology DOI 10.1002/jmor

Fig. 2. The body shapes typical of zebrafish at different stages of growth. Representative individuals of A: small larvae, B: largelarvae, C: juveniles, and D: adults are compared with the shape of a streamlined foil (dashed line). The gray silhouettes traced fromdigital photographs of dorsal and lateral views of the body were used to reconstruct its 3D shape (Fig. 1). The distribution of masscalculated from these volumetric data were compared to a streamlined body using the streamlining index, SL (Eq. 5). Values for SL areshown to the right with the body length, L, for each fish illustrated.
TABLE I. Scaling of morphology and hydrodynamics relative to body length in zebrafish
Dependent variable, yAllometric
relationship f flow fup fo � r2 n
Body mass, m Positive 3.17 3.07 3.28 3 4.14 � 10�6 0.99 23Body volume, V Positive 3.33 3.22 3.45 3 9.75 � 10�3 0.99 23Body surface area, Abody Positive 2.16 2.11 2.22 2 3.06 � 10�1 0.99 23Body height, hmax Positive 1.85 1.54 2.17 1 1.15 � 10�1 0.86 23Body width, wmax Positive 1.56 1.26 1.85 1 6.22 � 10�2 0.83 23Pectoral fin span, spec Positive 1.44 1.25 1.63 1 7.05 � 10�2 0.97 12Caudal fin span, scaud Positive 1.28 1.20 1.36 1 7.06 � 10�2 0.98 23Dorsal anal fin span, sdors Positive 1.19 1.02 1.35 1 8.86 � 10�2 0.90 23Pectoral fin area, Apec Positive 2.84 2.49 3.18 2 2.00 � 10�3 0.97 12Caudal fin area, Acaud Isometric 2.25 1.97 2.54 2 9.19 � 10�2 0.92 23Dorsal anal fin area, Adors Isometric 2.08 1.74 2.42 2 1.62 � 10�1 0.87 23Reynolds number, Re Isometric 2.26 1.98 2.54 2 1.53 � 100 0.93 23Viscous drag coefficient, Cvisc Positive 1.74 1.48 1.99 0 5.24 � 10�2 0.95 14Inertial drag coefficient, Cinert Negative �2.34 0.87 3.82 0 1.44 � 102 0.60 9
The scale factor, f, and its lower, flow, and upper, fup, 95% confidence intervals, were compared with the isometric prediction, fo, andare given with the scaling constant, �, and the coefficient of determination, r2, for the reduced major axis regression of each dependentvariable against body length (y � � Lf).
1103LOCOMOTOR MORPHOLOGY OF ZEBRAFISH
Journal of Morphology DOI 10.1002/jmor
66.8°. Furthermore, this behavioral variation didnot correlate with growth stage (Fig. 5D). The stan-dard deviation among the mean values of individu-als (11.0°) was equal to the mean standard deviation
within individuals and this variation had no rela-tionship with body length, according to an ordinaryleast-squares regression (P � 0.93, r2 � 0.01, n �17). A similar lack of any correlation was found inangles for the dorsal (P � 0.48, r2 � 0.03, n � 17)and caudal fins (P � 0.50, r2 � 0.01, n � 17; Fig.5B,C). The only apparent effect of size on fin posturewas found in the dorsal fin angle (Fig. 5C), wherevalues remained close to zero and exhibited littlevariation in individuals of L � 13.5 mm, but ex-ceeded angles of 20°, at larger sizes. Observations ofvideo recordings suggested that the smaller of thesefish lacked the ability to abduct their dorsal fin.
Reynolds Number and Drag Coefficient
Measurements of Reynolds number and drag co-efficient during coasting demonstrate changes in hy-drodynamics due to growth in morphology and finposture. Using the mean Reynolds number to iden-tify hydrodynamic regimes, we found that adult fish(L � 18.0 mm) operated in either the inertial (Re �1,000) or intermediate (300 � Re � 1,000) regimesand that larval and juvenile fish operated in theviscous regime (Re � 300; Fig. 6). Categorizing in-dividuals into regimes allowed for the measurementof in vivo drag for fish of different size (Fig. 6B). Wefound that Cvisc of larval and juvenile fish scaled byan exponential factor of 1.74 (Table 1) and Cinertdecreased by a factor of �2.34 with body length inadult fish (Table 1).
DISCUSSIONHow Does the Body Change Shape DuringGrowth?
We found that zebrafish approach a streamlinedshape at a variable rate over the course of develop-ment. Measurements of the streamlining index, SL,showed logistic growth (Eq. 6, Fig. 3A) with a rapidincrease in larvae and juveniles (L � 18.0 mm) andmore gradual change in adults. This pattern sug-gests that zebrafish begin their life history aroundSL � 0.24, which may be interpreted as a one-quarter similarity in volume distribution to astreamlined body. This increased to SL � 0.81 by thebeginning of the adult stage (L � 18.0 mm) andachieved values approximating a perfectly stream-lined body (SL � 0.94) in the largest adults (L � 40mm).
Our introduction of SL to fish morphometricsprovides an improvement over linear measure-ments for providing a functional interpretation ofbody shape. For example, zebrafish larvae exhibita posterior shift in body volume due to yolk ab-sorption and dorsoventral growth in the trunk(Figs. 2, 3) that contributes to streamlining whilemaintaining a similar body depth. This change in
Fig. 3. The scaling of body morphology. Gray silhouettes showrepresentative body shapes from a dorsal view of (i) small larva,(ii) large larva, (iii) juvenile, and (iv) adult stages and the corre-sponding columns denote the range of body lengths for eachgrowth stage. A: The streamlining index is approximated by alogistic regression (Eq. 6) where b1 � �3.16 and b2 � 3.69. B: Thescaling of body mass from direct (filled circles) and indirect (opencircles) measurements from body volume data. C: The wettedsurface area of the body was measured from its 3D reconstruc-tion. See Table 1 for statistics.
1104 M.J. MCHENRY AND G.V. LAUDER
Journal of Morphology DOI 10.1002/jmor

shape is reflected in measurements of SL (Fig. 3A),but is neglected by simple linear measurement,such as the fineness ratio (body length divided byits maximum height).
The increase in body streamlining duringgrowth affects other aspects of morphology thatcould influence locomotor mechanics. Adult ze-brafish are relatively wide and tall compared tolarvae, and therefore have disproportionatelygreater wetted surface area (Table 1, Fig. 3) thatlikely contributes to drag production (see discus-sion below). These changes in shape are also re-flected in positive allometries in body volume andmass (Fig. 3B, Table 1). The large body mass ofadult fish combines with their relatively highspeed (McHenry and Lauder, 2005) to generatedisproportionately greater momentum during thepropulsive phase. This high momentum propelsadult fish to travel proportionately further than
larvae during coasting (McHenry and Lauder,2005).
These results reflect prevailing patterns in thegrowth of zebrafish, but neglect some of the fine-scale changes in body shape that have been re-ported for other fish species. Some cyprinid fishesexhibit positive allometries in the width andheight of the body (e.g., Cyprinus carpio; Hoda andTsukahara, 1971) that are similar to what wereport (Table 1). However, studies focused on thescaling of body shape with higher sampling haverevealed subtle changes in allometric scaling be-tween stages of growth (Hoda and Tsukahara,1971; Fuiman, 1983; Webb and Weihs, 1986). Fur-thermore, zebrafish are sexually dimorphic asadults (Schilling, 2002), which implies sex-specificscaling in juvenile and adult fish. It would beinteresting to examine the functional conse-quences of these fine-scale differences.
Fig. 4. The scaling of span and wetted surface area of the fins at rest. The location of pectoral (A,B), dorsal anal (C,D), and caudal(E,F) fins are highlighted in black on gray silhouette drawings of the body (above) of an adult from a lateral view. Gray columns denotegrowth stages, as described in Figure 3. A,B: The span (A) and area (B) of the pectoral fins were measured from a perpendicular viewof the fins. Values are equal to the sum for both fins. C–F: Measurements for the median fins were made from a lateral view. C,D:Values for the span of the dorsal and anal fins is equal to their sum and excludes the portion of the body between the fins. E: The spanfor the caudal fin is the distance between its dorsal and ventral margins. See Table 1 for statistics.
1105LOCOMOTOR MORPHOLOGY OF ZEBRAFISH
Journal of Morphology DOI 10.1002/jmor

How Do the Size and Posture of the FinsChange During Growth?
Allometric changes in the fin morphology of ze-brafish could influence the generation of locomotorforces and moments. Positive allometries in the spanof fins (Table 1, Fig. 4) should enhance the genera-tion of turning moments at later stages by providingdisproportionately large moment arms and a height-ened ability to generate thrust by vortex shedding
(Dickinson, 1996; Drucker and Lauder, 1999). Suchforce generation may be further augmented by thedisproportionately large area of the pectoral fins inadults (Table 1, Fig. 4A,B). The relatively high forcerequired for turning moments in adults could begenerated by their enlarged fin musculature(Thorsen and Hale, 2005). An increase in ability togenerate turning moments is reflected in large shiftsin direction during the propulsive phase of routine
Fig. 5. Fin posture during coasting in fish of different size. A: Measurements of fin posture are illustrated on a video still from acoasting sequence of an adult. B–D: The mean (�1 SD) angle for three coasting sequences for each fish (n � 17) are plotted for the (B)caudal, (C) dorsal, and (D) pectoral fins against body length. Gray columns denote growth stages, as described in Figure 3. Data areabsent for small larvae because fins were not visible on video recordings for that stage.
1106 M.J. MCHENRY AND G.V. LAUDER
Journal of Morphology DOI 10.1002/jmor

swimming in adults (Fuiman and Webb, 1988;McHenry and Lauder, 2005) and the small direc-tional changes created by pectoral fin beating inlarvae (Thorsen et al., 2005).
The amount of drag generated by a fin duringcoasting depends strongly on its posture. Fish arecapable of rapid breaking by abducting and orient-ing their fins with a high angle of attack (Videler,1981; Drucker and Lauder, 2001; Higham et al.,2005) that generates large drag force (Dickinson,1996). We found that the angles of caudal and pec-toral fins showed large behavioral variation that didnot correlate with body size (Fig. 5B,D). This con-trasts with the sigmoidal pattern of resting fin ori-entation reported by Thorsen and Hale (2005; theirfig. 10) for the growth of the pectoral fins. Zebrafishapparently adjust the position of their pectoral finsduring coasting so that no trend in posture is ob-served across ontogeny. Also, with development of
contractile fin musculature in the juvenile stage,zebrafish acquire the ability to actively control dragforces and body stability by manipulating not onlypectoral fin position, but also dorsal, anal, and cau-dal fin orientation. Locomotion may thus be behav-iorally modulated in juvenile and adult fish by ad-justment of all fin positions, not just the pectoralfins.
How Do Morphological Changes Affect DragCoefficient?
Our measurements of drag coefficients evaluatedthe effects of ontogenetic change in body shape andfin posture on hydrodynamics. We found that thestreamlined shape of large juvenile and tetheredadult fish (McHenry and Lauder, 2005) possessedCvisc values that were about 10 times greater thansmall larvae (Table 1; Fig. 6B). This difference maybe attributed solely to a disparity in shape becauseCvisc is a measure of viscous drag that normalizes forthe effects of scale. It is for this reason that a zeroscaling factor was predicted for the isometric scalingof Cvisc within the viscous regime.
The low drag generated by larvae suggests thatthey have a body shape that is well suited to viscoushydrodynamics. In the viscous regime, drag may bereduced by minimizing the area exposed to the sur-rounding water. A spherical body provides the min-imum wetted surface area for a given volume andthereby is predicted to generate relatively low drag.The elongated form of a larval body has a surfacearea that is much greater than a sphere, but is lowerthan an adult shape of the same volume (Fig. 3C). Aslarval zebrafish assume the shape of an adult andincrease their proportionate wetted surface area,viscous drag increases (Table 1, Fig. 3C) and Cviscconsequently scales with positive allometry (Fig.6B).
Although viscous drag production increases in lar-vae and juveniles, the benefit of adopting a stream-lined body becomes apparent in the adult stage.Adult fish routinely operate in the inertial regime(Fig. 6A), where a streamlined body shape providesa well-established optimum for reducing drag(Batchelor, 1967). As adults become more stream-lined (Fig. 3A), the inertial drag coefficient de-creases (Fig. 6B).
The rapid decline in the inertial drag coefficientwith body length in adults suggests that small al-terations in body shape have a marked effect on dragin the inertial regime. Although the rate of declinein adults is comparable to the rate of increase inlarvae and juveniles (Table 1), the adult shapechanges are more subtle (Fig. 3A). Therefore, changein body shape has a more pronounced effect on dragproduction in the inertial regime than in the viscousregime.
Fig. 6. The hydrodynamics of coasting in fish of different size.A: The mean Reynolds number (�1 SD) during coasting (n � 22,three sequences per individual) is shown in relation to hydrody-namic regimes (dashed lines) based on the “dead drag” measure-ments of McHenry and Lauder (2005). B: The in vivo viscous(filled circles) and inertial (open circles) drag coefficients (n � 22)are shown for the same coasting sequences. Dashed lines showthe measured “dead drag” values for adults in the viscous andinertial regimes and gray columns denote growth stages, as de-scribed in Figure 3.
1107LOCOMOTOR MORPHOLOGY OF ZEBRAFISH
Journal of Morphology DOI 10.1002/jmor

Growth of Form and Function in AquaticLocomotion
Ontogenetic changes in behavior and morphologymay have immediate functional consequences foraquatic locomotion. For example, the shell and man-tle of the giant scallop (Placopecten magellanicus)grow in relative proportions such that thrust pro-duction is greatest relative to the submerged weightof the body in the middle of their life history, whenthey achieve their fastest swimming speeds (Dad-swell and Weihs, 1990). Scyphozoan jellyfish (Aure-lia aurita) decrease their pulse frequency as theybecome larger, which decreases their rate of thrustproduction and consequently their length-specificspeed and energetic cost of transport (McHenry andJed, 2003).
Instead of having an immediate impact on locomo-tor performance, some morphological or behavioraltraits grow prior to their being able to play a func-tional role due to scale-dependent hydrodynamics.For example, some propulsive limbs grow in brineshrimp (Artemia sp.) before they are capable of gen-erating thrust, but contribute to propulsion once theanimal is large enough to operate with inertial hy-drodynamics (Williams, 1994a,b). Therefore, thetiming of a transition from viscous to inertial hydro-dynamics influences whether growth has an imme-diate or delayed effect on the performance of aquaticlocomotion.
Our results demonstrate how morphologicalgrowth has both immediate and delayed effects onthe routine swimming of zebrafish. A zebrafish be-gins its life history with a body shape that generatesrelatively low drag in the viscous regime (Fig. 6B).The increase in Cvisc during larval and juvenilegrowth illustrates immediate adverse consequencesof growth on drag production when the fish operatesin the viscous regime. The beneficial consequence ofthis change in body shape is delayed until the fishroutinely operates in the inertial regime at the adultstage, when the streamlined shape of the body aidsin reducing drag at high Re.
The timing of functional benefits and conse-quences to growth may differ between measures ofperformance or may vary with the behavior of theanimal. For instance, zebrafish larvae are capable ofreaching high, inertia-dominated Re values throughtheir escape response (Fuiman and Webb, 1988; Bu-dick and O’Malley, 2000; Muller and van Leeuwen,2004). Unlike routine swimming, the performance ofthese rapid propulsive events should gradually in-crease over the entire course of growth as larvaebecome more streamlined. Therefore, the same pat-tern of growth that causes increased viscous dragproduction during routine coasting is likely benefi-cial to the performance of the inertial escape re-sponse.
Our results also inform evolutionary interpreta-tions of growth in fish. Our finding that drag pro-
duction rises during larval and juvenile growth con-trasts with suggestions that ontogenetic changes infish are well suited to the immediate functional de-mands of each stage of growth (Weihs, 1980; Webband Weihs, 1986; Fuiman and Webb, 1988; Osse,1990; Hale, 1996, 1999; Muller and Videler, 1996;Muller and van Leeuwen, 2004). We propose thatlow mechanical performance during a period ofgrowth is an inevitable consequence of constraintson larval form or the differing functional demands ofviscous and inertial regimes. Growth in morphologyis unlikely to keep pace with the relatively rapidtransition from viscous to inertial hydrodynamics.In zebrafish, change in shape largely precedes thehydrodynamic transition, but it is conceivable thatsuch change could follow the transition in specieslarge enough to operate in the inertial regime earlyin their life history. It would therefore be interestingto compare ontogenetic changes in the morphologyand drag coefficients of related species of differingsize to evaluate how heterochronic changes may re-late to scale-dependent hydrodynamic performance.
ACKNOWLEDGMENTS
T. Griffin provided advice on mechanical scalingand F. Harrison, J. Strother, and an anonymousreviewer made numerous useful suggestions.
LITERATURE CITED
Batchelor GK. 1967. An introduction to fluid dynamics. NewYork: Cambridge University Press.
Bilo D, Nachtigall W. 1980. A simple method to determine dragcoefficients in aquatic animals. J Exp Biol 87:357–359.
Budick SA, O’Malley DM. 2000. Locomotor repertoire of the lar-val zebrafish: Swimming, turning and prey capture. J Exp Biol203:2565–2579.
Dadswell MJ, Weihs D. 1990. Size-related hydrodynamic charac-teristics of the giant scallop, Placopecten magellanicus (Bi-valvia: Pectinidae). Can J Zool 68:778–785.
Dickinson MH. 1996. Unsteady mechanisms of force generationin aquatic and aerial locomotion. Am Zool 36:537–554.
Drucker EG, Lauder GV. 1999. Locomotor forces on a swimmingfish: three-dimensional vortex wake dynamics quantified usingdigital particle image velocimetry. J Exp Biol 202:2393–2412.
Drucker EG, Lauder GV. 2001. Wake dynamics and locomotorfunction in fishes: interpreting evolutionary patterns in pairedfin design. Am Zool 41:1431–1432.
Fuiman LA. 1982. Esocidae. In: Auer NA, editor. Identification oflarval fishes of the Great Lakes Basin with emphasis on theLake Michigan drainage. Ann Arbor: Great Lakes Fishery Com-mission.
Fuiman LA. 1983. Growth gradients in fish larvae. J Fish Biol23:117–123.
Fuiman LA, Batty RS. 1997. What a drag it is getting cold:partitioning the physical and physiological effects of tempera-ture on fish swimming. J Exp Biol 200:1745–1755.
Fuiman LA, Webb PW. 1988. Ontogeny of routine swimmingactivity and performance in zebra danios (Teleostei: Cyprini-dae). Anim Behav 36:250–261.
Hale ME. 1996. The development of fast-start performance infishes: Escape kinematics of the chinook salmon (Oncorhynchustshawytscha). Am Zool 36:695–709.
1108 M.J. MCHENRY AND G.V. LAUDER
Journal of Morphology DOI 10.1002/jmor
Hale M. 1999. Locomotor mechanics during early life history:effects of size and ontogeny on fast-start performance of salmo-nid fishes. J Exp Biol 202:1465–1479.
Higham TE, Malas B, Jayne BC, Lauder GV. 2005. Behaviorcompensates for size: reducing pectroal fin area does not reducebreaking performance in bluegill sunfish (Lepomis macrochi-rus). J Exp Biol 208:4735–4746.
Hoda SMS, Tsukahara H. 1971. Studies on the development andrelative growth of carp (Cyprinus carpio). J Fac Agric KyushuUniv 16:387–509.
Hoerner SF. 1965. Fluid-dynamic drag. Brick Town, NJ: HoernerFluid Dynamics.
Huxley JS. 1932. Problems of relative growth. New York: DialPress.
Ladson CL, Brooks CW, Hill AS, Sproles DW. 1996. Computerprogram to obtain ordinates for NACA airfoils. NASA TechnicalMemorandum 4741:1–22.
Lamb H. 1945. Hydrodynamics. New York: Dover.McHenry MJ, Jed J. 2003. The ontogenetic scaling of hydrody-
namics and swimming performance in jellyfish (Aurelia aurita).J Exp Biol 206:4125–4137.
McHenry MJ, Lauder GV. 2005. The mechanical scaling of coast-ing in zebrafish (Danio rerio). J Exp Biol 208:2289–2301.
McHenry MJ, Azizi E, Strother JA. 2003. The hydrodynamics oflocomotion at intermediate Reynolds numbers: undulatoryswimming in ascidian larvae (Botrylloides sp.). J Exp Biol 206:327–343.
Meriam JL, Kraige LG. 1997. Dynamics. New York: John Wiley &Sons.
Muller UK, van Leeuwen JL. 2004. Swimming of larval zebrafish:ontogeny of body waves and implications for locomotory devel-opment. J Exp Biol 207:853–868.
Muller UK, Videler JJ. 1996. Inertia as a ‘safe harbor’: do fishlarvae increase length growth to escape viscous drag? Rev FishBiol 6:353–360.
Munk MM. 1922. Notes on aerodynamic forces. I. Rectilinearmotion. NACA (Natl Adv Comm Aeronaut) TN No. 104:1–13.
Osse JWM. 1990. Form changes in fish larvae in relation tochanging demands of function. Neth J Zool 40:362–385.
Osse JWM, Drost MR. 1989. Hydrodynamics and mechanics offish larvae. Pol Arch Hydrobiol 36:455–466.
Osse JWM, van den Boogaart JGM. 2000. Body size and swim-ming types in carp larvae: effects of being small. Neth J Zool50:233–244.
Rayner JMV. 1985. Linear relations in biomechanics — the sta-tistics of scaling functions. J Zool 206:415–439.
Schilling TF. 2002. The morphology of larval and adult zebrafish.In: Nusslein-Volhard C, Dahm R, editors. Zebrafish. New York:Oxford University Press.
Sokal RR, Rohlf FJ. 1995. Biometry. New York: W.H. Freeman.Thompson DW. 1917. On growth and form. Cambridge, UK: Cam-
bridge University Press.Thorsen DH, Hale ME. 2005. Development of zebrafish (Danio
rerio) pectoral fin musculature. J Morphol 266:241–255.Thorsen DH, Cassidy JJ, Hale ME. 2004. Swimming of larval
zebrafish: fin-axis coordination and implications for functionand neural control. J Exp Biol 207: 4175–4183.
Videler JJ. 1981. Swimming movements, body structure, andpropulsion in cod (Gadus morhua). In: Day MH, editor. Verte-brate locomotion. Symp Zool Soc Lond p 1–27.
Webb PW, Weihs D. 1986. Functional locomotor morphology ofearly life-history stages of fishes. Trans Am Fish Soc 115:115–127.
Weihs D. 1980. Energetic significance of changes in swimmingmodes during growth of larval anchovy, Engraulis mordax. FishBull 77:597–604.
Westerfield M. 1995. The zebrafish book: a guide for the labora-tory use of zebrafish, Brachydanio rerio. Eugene: University ofOregon Press.
Williams TA. 1994a. Locomotion in developing Artemia larvae:Mechanical analysis of antennal propulsors based on large-scale physical models. Biol Bull 187:156–163.
Williams TA. 1994b. A model of rowing propulsion and the on-togeny of locomotion in Artemia larvae. Biol Bull 187:164–173.
1109LOCOMOTOR MORPHOLOGY OF ZEBRAFISH
Journal of Morphology DOI 10.1002/jmor