On the probabilistic evaluation of the stability resistance of steel columns and beams
9
Journal of Constructional Steel Research 65 (2009) 569–577 Contents lists available at ScienceDirect Journal of Constructional Steel Research journal homepage: www.elsevier.com/locate/jcsr On the probabilistic evaluation of the stability resistance of steel columns and beams József Szalai a,* , Ferenc Papp b a KESZ Ltd., 1095 Budapest, Mester utca 87, Hungary b Department of Structural Engineering, Budapest University of Technology and Economics, 1111 Budapest, Bertalan L. utca 2, Hungary article info Article history: Received 12 December 2007 Accepted 20 August 2008 Keywords: Steel columns Steel beams Column buckling Lateral–torsional buckling Random variables Probabilistic resistance abstract The stability resistance of steel columns and beams is still a relevant research task in the structural engineering field. One of the main goals of these ongoing works is the improvement of the standard design process, making it more and more sophisticated and providing a better modelling of the real behaviour. However the research should provide, in parallel, a better understanding of the probabilistic side of design problems to make its safety level more uniform. This paper presents a deep look into the probabilistic stability resistance of steel columns and beams with hot-rolled I profiles. A wide range of random variables is considered, higher-level statistics are taken into account, and a special probabilistic model is applied to achieve refined and coherent results based on the most current statistical data. The results are applicable for reliability examinations of standard design processes. © 2008 Elsevier Ltd. All rights reserved. 1. Introduction In the 1960s a comprehensive research work was started on the behaviour, analysis and design of steel columns – as the simplest example of stability problems – including both experimental and theoretical examinations. A huge number of buckling tests were performed in various research centres in order to standardize and codify the design processes, a summary of the results can be found in [1,2]. The theoretical background was also developed quickly, focusing mainly on the deterministic behaviour of columns, a wide review can be found in [3]. There were also attempts to reproduce the probabilistic results of the experimental research using numerical methods [4,5]. As a main outcome of these efforts experimentally and theoretically verified design criteria for column strength were developed [6,7] and, based on these results, the form of the European Buckling Curves was established [8]. This form is still the base for the criteria of various stability problems in the European standards (Structural Eurocodes), including the lateral–torsional buckling of beams [9]. The development, harmonization and introduction of the uni- fied Structural Eurocodes has reached its final stage, incorporating a lot of research on re-examining and calibrating the basic stan- dard procedures and also introducing new, more refined ones [10, 11]. These recent research works focus mainly on the determinis- tic mechanical behaviour of the standard models utilizing a great * Corresponding author. Tel.: +36 1 4766 530; fax: +36 1 4766 593. E-mail address: [email protected] (J. Szalai). number of high level numerical analyses performed on sophisti- cated, realistic models (geometrically and materially nonlinear im- perfect models [12]). By such means the deterministic background of the standard is well verified, however the probabilistic verifi- cation of the formulas still needs research in order to make the refined design processes reliable and economic. This paper deals with the latter problem; we propose a probabilistic calibration method utilizing fully the advantages of high-level numerical analysis. The method attempts to unify the accuracy level of the three main components of such calculations: (1) the deterministic model, (2) the probabilistic model, and (3) the set of random variables and their reliable statistics. The technique was directly developed for the deep probabilistic evaluation of simple standard models for structural resistance. It shows not only the final probabilistic parameters of the structural resistance (distribution, mean, standard deviation etc.), but also reveals the significance and influence of the certain random variables and their interactions, making it possible to calibrate directly the inner parameters of the standard models. The method is also able to illustrate the influence of higher order statistics such as the correlation between variables or skewness in the probabilistic distribution. Nevertheless the goal of the paper is not to provide widespread probabilistic results covering several design problems, but to present a coherent probabilistic evaluation method directly developed for simple standard models. In order to show the possibilities of the method, application examples are developed for the standard resistance model for two stability design problems: column buckling and lateral–torsional buckling. Although, as we have described, column buckling is a deeply verified design 0143-974X/$ – see front matter © 2008 Elsevier Ltd. All rights reserved. doi:10.1016/j.jcsr.2008.08.006
-
Upload
consteelsoftware -
Category
Documents
-
view
3 -
download
0
Transcript of On the probabilistic evaluation of the stability resistance of steel columns and beams
Journal of Constructional Steel Research 65 (2009) 569–577
Contents lists available at ScienceDirect
Journal of Constructional Steel Research
journal homepage: www.elsevier.com/locate/jcsr
On the probabilistic evaluation of the stability resistance of steelcolumns and beamsJózsef Szalai a,∗, Ferenc Papp ba KESZ Ltd., 1095 Budapest, Mester utca 87, Hungaryb Department of Structural Engineering, Budapest University of Technology and Economics, 1111 Budapest, Bertalan L. utca 2, Hungary
a r t i c l e i n f o
Article history:Received 12 December 2007Accepted 20 August 2008
Keywords:Steel columnsSteel beamsColumn bucklingLateral–torsional bucklingRandom variablesProbabilistic resistance
a b s t r a c t
The stability resistance of steel columns and beams is still a relevant research task in the structuralengineering field. One of themain goals of these ongoingworks is the improvement of the standard designprocess, making it more and more sophisticated and providing a better modelling of the real behaviour.However the research should provide, in parallel, a better understanding of the probabilistic side of designproblems to make its safety level more uniform. This paper presents a deep look into the probabilisticstability resistance of steel columns andbeamswith hot-rolled I profiles. Awide range of randomvariablesis considered, higher-level statistics are taken into account, and a special probabilistic model is applied toachieve refined and coherent results based on the most current statistical data. The results are applicablefor reliability examinations of standard design processes.
© 2008 Elsevier Ltd. All rights reserved.
1. Introduction
In the 1960s a comprehensive researchworkwas started on thebehaviour, analysis and design of steel columns – as the simplestexample of stability problems – including both experimental andtheoretical examinations. A huge number of buckling tests wereperformed in various research centres in order to standardize andcodify the design processes, a summary of the results can be foundin [1,2]. The theoretical background was also developed quickly,focusing mainly on the deterministic behaviour of columns, awide review can be found in [3]. There were also attempts toreproduce the probabilistic results of the experimental researchusing numerical methods [4,5]. As a main outcome of theseefforts experimentally and theoretically verified design criteria forcolumn strength were developed [6,7] and, based on these results,the form of the European Buckling Curves was established [8]. Thisform is still the base for the criteria of various stability problemsin the European standards (Structural Eurocodes), including thelateral–torsional buckling of beams [9].The development, harmonization and introduction of the uni-
fied Structural Eurocodes has reached its final stage, incorporatinga lot of research on re-examining and calibrating the basic stan-dard procedures and also introducing new, more refined ones [10,11]. These recent research works focus mainly on the determinis-tic mechanical behaviour of the standard models utilizing a great
∗ Corresponding author. Tel.: +36 1 4766 530; fax: +36 1 4766 593.E-mail address: [email protected] (J. Szalai).
0143-974X/$ – see front matter© 2008 Elsevier Ltd. All rights reserved.doi:10.1016/j.jcsr.2008.08.006
number of high level numerical analyses performed on sophisti-cated, realisticmodels (geometrically andmaterially nonlinear im-perfect models [12]). By suchmeans the deterministic backgroundof the standard is well verified, however the probabilistic verifi-cation of the formulas still needs research in order to make therefined design processes reliable and economic.This paper deals with the latter problem; we propose a
probabilistic calibration method utilizing fully the advantages ofhigh-level numerical analysis. The method attempts to unify theaccuracy level of the three main components of such calculations:(1) the deterministicmodel, (2) the probabilisticmodel, and (3) theset of random variables and their reliable statistics. The techniquewas directly developed for the deep probabilistic evaluation ofsimple standard models for structural resistance. It shows notonly the final probabilistic parameters of the structural resistance(distribution, mean, standard deviation etc.), but also reveals thesignificance and influence of the certain random variables andtheir interactions, making it possible to calibrate directly theinner parameters of the standard models. The method is also ableto illustrate the influence of higher order statistics such as thecorrelation between variables or skewness in the probabilisticdistribution. Nevertheless the goal of the paper is not to providewidespread probabilistic results covering several design problems,but to present a coherent probabilistic evaluation method directlydeveloped for simple standard models. In order to show thepossibilities of themethod, application examples are developed forthe standard resistance model for two stability design problems:column buckling and lateral–torsional buckling. Although, as wehave described, column buckling is a deeply verified design
570 J. Szalai, F. Papp / Journal of Constructional Steel Research 65 (2009) 569–577
Table 1The random variables
Geometrical Material ImperfectionGeometrical Material
h—height of section E—elastic modulus f0—out-of-straightness α—residual stressb—width of flange fy—yield stress k0—section out-of-squaretw—thickness of web e0—web excentricitytf—thickness of flange c0—web deformability
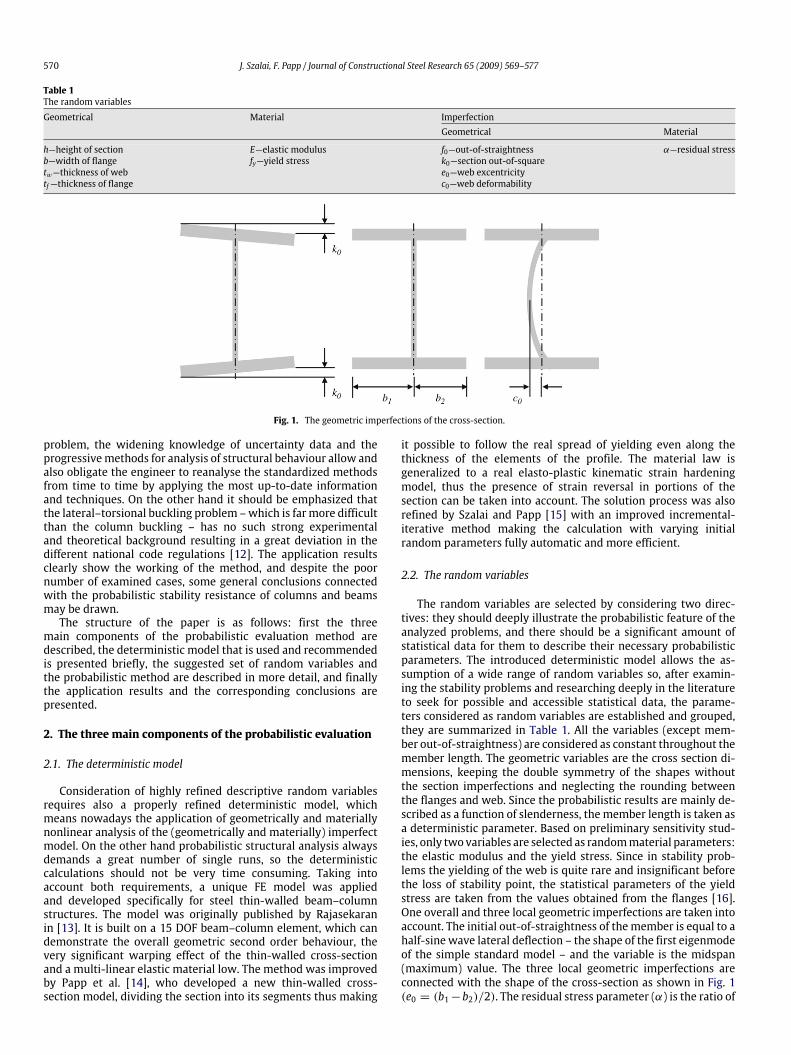
Fig. 1. The geometric imperfections of the cross-section.
problem, the widening knowledge of uncertainty data and theprogressivemethods for analysis of structural behaviour allow andalso obligate the engineer to reanalyse the standardized methodsfrom time to time by applying the most up-to-date informationand techniques. On the other hand it should be emphasized thatthe lateral–torsional buckling problem –which is farmore difficultthan the column buckling – has no such strong experimentaland theoretical background resulting in a great deviation in thedifferent national code regulations [12]. The application resultsclearly show the working of the method, and despite the poornumber of examined cases, some general conclusions connectedwith the probabilistic stability resistance of columns and beamsmay be drawn.The structure of the paper is as follows: first the three
main components of the probabilistic evaluation method aredescribed, the deterministic model that is used and recommendedis presented briefly, the suggested set of random variables andthe probabilistic method are described in more detail, and finallythe application results and the corresponding conclusions arepresented.
2. The three main components of the probabilistic evaluation
2.1. The deterministic model
Consideration of highly refined descriptive random variablesrequires also a properly refined deterministic model, whichmeans nowadays the application of geometrically and materiallynonlinear analysis of the (geometrically and materially) imperfectmodel. On the other hand probabilistic structural analysis alwaysdemands a great number of single runs, so the deterministiccalculations should not be very time consuming. Taking intoaccount both requirements, a unique FE model was appliedand developed specifically for steel thin-walled beam–columnstructures. The model was originally published by Rajasekaranin [13]. It is built on a 15 DOF beam–column element, which candemonstrate the overall geometric second order behaviour, thevery significant warping effect of the thin-walled cross-sectionand a multi-linear elastic material low. The method was improvedby Papp et al. [14], who developed a new thin-walled cross-section model, dividing the section into its segments thus making
it possible to follow the real spread of yielding even along thethickness of the elements of the profile. The material law isgeneralized to a real elasto-plastic kinematic strain hardeningmodel, thus the presence of strain reversal in portions of thesection can be taken into account. The solution process was alsorefined by Szalai and Papp [15] with an improved incremental-iterative method making the calculation with varying initialrandom parameters fully automatic and more efficient.
2.2. The random variables
The random variables are selected by considering two direc-tives: they should deeply illustrate the probabilistic feature of theanalyzed problems, and there should be a significant amount ofstatistical data for them to describe their necessary probabilisticparameters. The introduced deterministic model allows the as-sumption of a wide range of random variables so, after examin-ing the stability problems and researching deeply in the literatureto seek for possible and accessible statistical data, the parame-ters considered as random variables are established and grouped,they are summarized in Table 1. All the variables (except mem-ber out-of-straightness) are considered as constant throughout themember length. The geometric variables are the cross section di-mensions, keeping the double symmetry of the shapes withoutthe section imperfections and neglecting the rounding betweenthe flanges and web. Since the probabilistic results are mainly de-scribed as a function of slenderness, the member length is taken asa deterministic parameter. Based on preliminary sensitivity stud-ies, only twovariables are selected as randommaterial parameters:the elastic modulus and the yield stress. Since in stability prob-lems the yielding of the web is quite rare and insignificant beforethe loss of stability point, the statistical parameters of the yieldstress are taken from the values obtained from the flanges [16].One overall and three local geometric imperfections are taken intoaccount. The initial out-of-straightness of themember is equal to ahalf-sine wave lateral deflection – the shape of the first eigenmodeof the simple standard model – and the variable is the midspan(maximum) value. The three local geometric imperfections areconnected with the shape of the cross-section as shown in Fig. 1(e0 = (b1−b2)/2). The residual stress parameter (α) is the ratio of
J. Szalai, F. Papp / Journal of Constructional Steel Research 65 (2009) 569–577 571
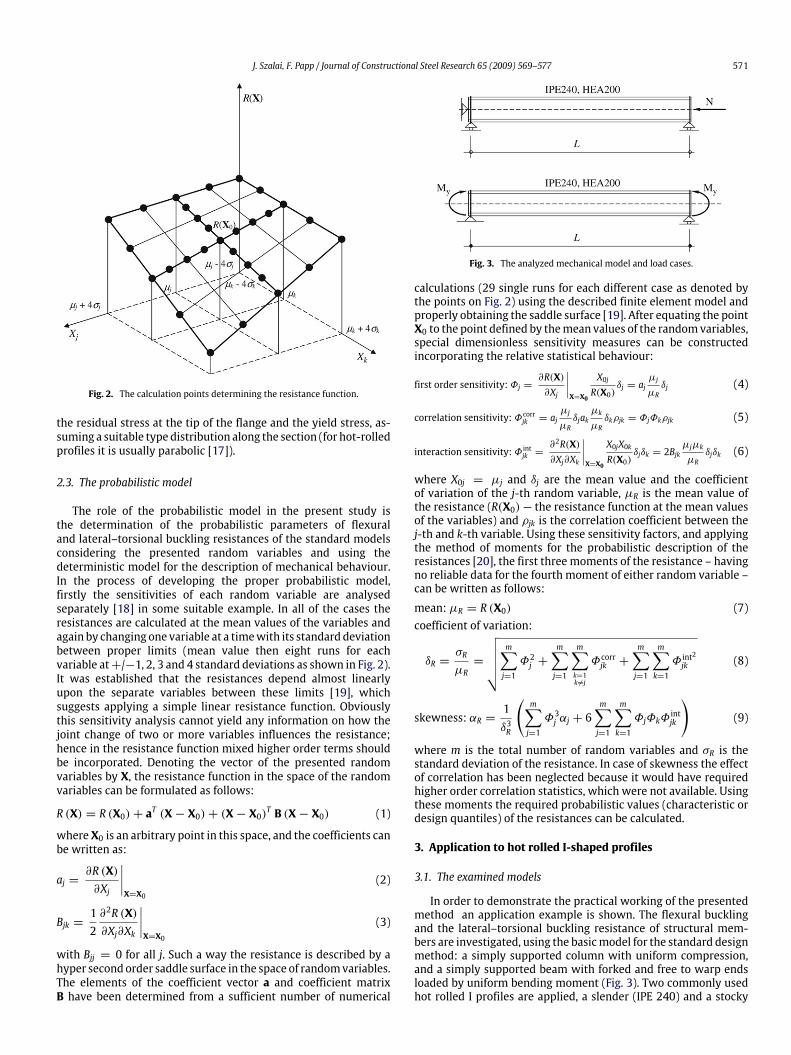
Fig. 2. The calculation points determining the resistance function.
the residual stress at the tip of the flange and the yield stress, as-suming a suitable type distribution along the section (for hot-rolledprofiles it is usually parabolic [17]).
2.3. The probabilistic model
The role of the probabilistic model in the present study isthe determination of the probabilistic parameters of flexuraland lateral–torsional buckling resistances of the standard modelsconsidering the presented random variables and using thedeterministic model for the description of mechanical behaviour.In the process of developing the proper probabilistic model,firstly the sensitivities of each random variable are analysedseparately [18] in some suitable example. In all of the cases theresistances are calculated at the mean values of the variables andagain by changing one variable at a timewith its standard deviationbetween proper limits (mean value then eight runs for eachvariable at+/−1, 2, 3 and 4 standard deviations as shown in Fig. 2).It was established that the resistances depend almost linearlyupon the separate variables between these limits [19], whichsuggests applying a simple linear resistance function. Obviouslythis sensitivity analysis cannot yield any information on how thejoint change of two or more variables influences the resistance;hence in the resistance function mixed higher order terms shouldbe incorporated. Denoting the vector of the presented randomvariables by X, the resistance function in the space of the randomvariables can be formulated as follows:
R (X) = R (X0)+ aT (X− X0)+ (X− X0)T B (X− X0) (1)
whereX0 is an arbitrary point in this space, and the coefficients canbe written as:
aj =∂R (X)∂Xj
∣∣∣∣X=X0
(2)
Bjk =12∂2R (X)∂Xj∂Xk
∣∣∣∣X=X0
(3)
with Bjj = 0 for all j. Such a way the resistance is described by ahyper secondorder saddle surface in the space of randomvariables.The elements of the coefficient vector a and coefficient matrixB have been determined from a sufficient number of numerical
Fig. 3. The analyzed mechanical model and load cases.
calculations (29 single runs for each different case as denoted bythe points on Fig. 2) using the described finite element model andproperly obtaining the saddle surface [19]. After equating the pointX0 to the point defined by themean values of the randomvariables,special dimensionless sensitivity measures can be constructedincorporating the relative statistical behaviour:
first order sensitivity:Φj =∂R(X)∂Xj
∣∣∣∣X=X0
X0jR(X0)
δj = ajµj
µRδj (4)
correlation sensitivity:Φcorrjk = ajµj
µRδjak
µk
µRδkρjk = ΦjΦkρjk (5)
interaction sensitivity:Φ intjk =∂2R(X)∂Xj∂Xk
∣∣∣∣X=X0
X0jX0kR(X0)
δjδk = 2Bjkµjµk
µRδjδk (6)
where X0j = µj and δj are the mean value and the coefficientof variation of the j-th random variable, µR is the mean value ofthe resistance (R(X0)— the resistance function at the mean valuesof the variables) and ρjk is the correlation coefficient between thej-th and k-th variable. Using these sensitivity factors, and applyingthe method of moments for the probabilistic description of theresistances [20], the first three moments of the resistance – havingno reliable data for the fourth moment of either random variable –can be written as follows:
mean: µR = R (X0) (7)coefficient of variation:
δR =σR
µR=
√√√√√ m∑j=1
Φ2j +
m∑j=1
m∑k=1k6=j
Φcorrjk +
m∑j=1
m∑k=1
Φ int2
jk (8)
skewness: αR =1δ3R
(m∑j=1
Φ3j αj + 6m∑j=1
m∑k=1
ΦjΦkΦintjk
)(9)
where m is the total number of random variables and σR is thestandard deviation of the resistance. In case of skewness the effectof correlation has been neglected because it would have requiredhigher order correlation statistics, which were not available. Usingthese moments the required probabilistic values (characteristic ordesign quantiles) of the resistances can be calculated.
3. Application to hot rolled I-shaped profiles
3.1. The examined models
In order to demonstrate the practical working of the presentedmethod an application example is shown. The flexural bucklingand the lateral–torsional buckling resistance of structural mem-bers are investigated, using the basicmodel for the standard designmethod: a simply supported column with uniform compression,and a simply supported beam with forked and free to warp endsloaded by uniform bending moment (Fig. 3). Two commonly usedhot rolled I profiles are applied, a slender (IPE 240) and a stocky

572 J. Szalai, F. Papp / Journal of Constructional Steel Research 65 (2009) 569–577
Table 2The slenderness’s (λz ) and the corresponding lengths (L (mm))
λz 30 60 90 120 200 300
IPE240 820 1640 2460 3280 5466 8200HEA200 1525 3050 4575 6100 10150 15250
(HEA 200) cross-section. For both sections and both loading caseseight different values of slenderness are examined to cover thewhole practical range of the buckling curves. The analysed casesare summarized in Fig. 3 and Table 2, where λz represents the flex-ural slenderness about the minor axis. The statistical data for therandom variables are carefully collected based on awidespread lit-erature review which can be found in [19] using partly our ownmeasurements but mainly the data reported in [4–6,21–26], thevalues are shown in Table 3.
3.2. Importance of the random variables
For the analysis of the significance of the random variables thefirst order sensitivity factors are themost suitablemeasures. Usingthese factors the importance can be determined by examining howthe proper variable influences the coefficient of variation (COV)of the resistance; accordingly the following importance factor isdefined:
Ii (%) = 100Φ2im∑j=1Φ2j
. (10)
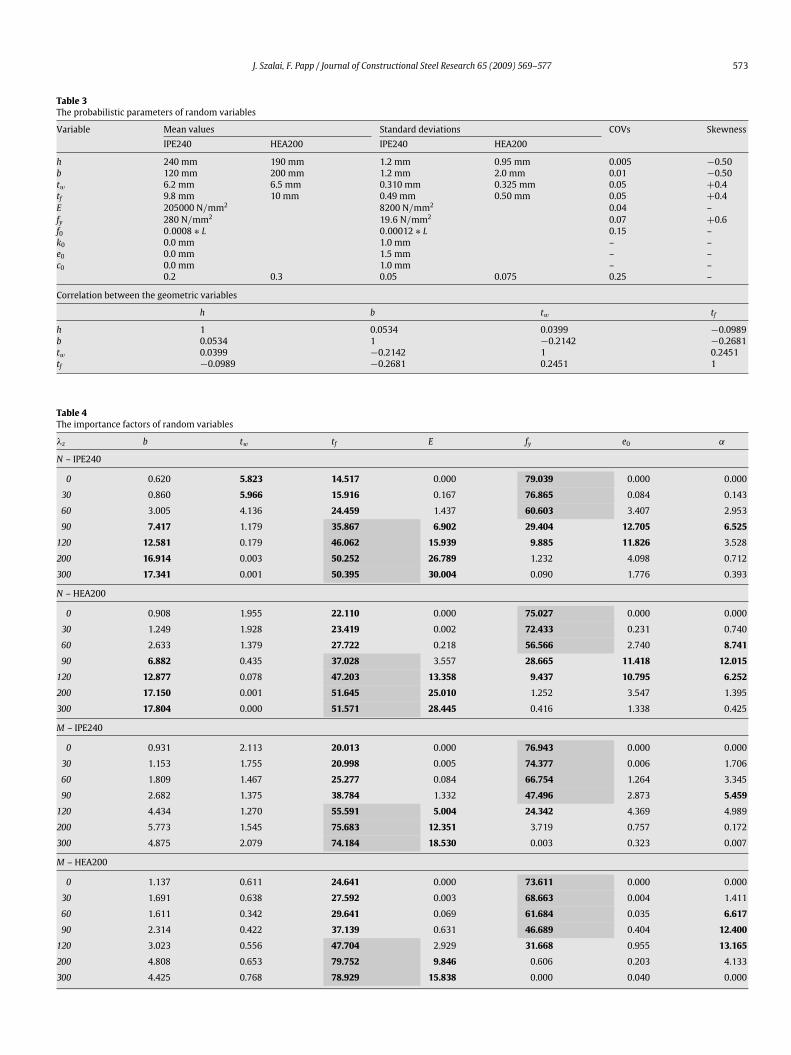
Firstly it is decided which variables can be neglected withoutsignificant loss in the accuracy of the probabilistic parameters. Ithas been shown [19] that the web excentricity (e0) influences theCOV of the resistances only if the load (normal force or bendingmoment) is applied on the web, which is not the case for practicalstructures; so the web excentricity is neglected.When consideringthe height of the section (h), section out-of-square (k0) and webdeformability (c0) the importance factor does not reach 1% forany of these cases, so these variables were also considered asdeterministic variables with their mean values. The first ordersensitivity factors of the rest of the random variables are shown inFigs. 4–7 as a function of lateral slenderness in the case of the twosections and two loading cases. The diagrams clearly demonstratethe sensitivities and significances of the different variables as theyare distributed along the slenderness, but to illustrate accuratelythe order of importance Table 4 shows the importance factors(N — is the flexural buckling,M — is the lateral–torsional bucklingproblem). The importance factor belonging to the most importantvariable is shown with grey background, and the values exceeding5% with bold numbers. It can be readily seen, that the two mostimportant variables are the thickness of the flange and the yieldstress, these two variables constitute minimum 50% of the COV atflexural buckling, and minimum 74% at lateral–torsional buckling.The least important is the thickness of the web; it reaches the 5%limit only in the case of flexural buckling of the IPE 240 profile.All of the variables have a significant effect at flexural buckling inthe medium slenderness range. It can also be noticed that the out-of-straightness and the elastic modulus are more important in theflexural buckling case. The IPE 240 section is more sensitive to theout-of-straightness, while residual stresses have greater influencein case of the HEA 200 profile.
3.3. Effect of interaction between random variables
There are two possible interactions between the variables: thephysical and the probabilistic interaction. The latter one is knownas correlation and represents some relationship between the
Fig. 4. The first order sensitivity factors for IPE 240 at lateral buckling.
Fig. 5. The first order sensitivity factors for HEA 200 at lateral buckling.
Fig. 6. The first order sensitivity factors for IPE 240 at lateral–torsional buckling.
Fig. 7. The first order sensitivity factors for HEA 200 at lateral–torsional buckling.
J. Szalai, F. Papp / Journal of Constructional Steel Research 65 (2009) 569–577 573
Table 3The probabilistic parameters of random variables
Variable Mean values Standard deviations COVs SkewnessIPE240 HEA200 IPE240 HEA200
h 240 mm 190 mm 1.2 mm 0.95 mm 0.005 −0.50b 120 mm 200 mm 1.2 mm 2.0 mm 0.01 −0.50tw 6.2 mm 6.5 mm 0.310 mm 0.325 mm 0.05 +0.4tf 9.8 mm 10 mm 0.49 mm 0.50 mm 0.05 +0.4E 205000 N/mm2 8200 N/mm2 0.04 –fy 280 N/mm2 19.6 N/mm2 0.07 +0.6f0 0.0008 ∗ L 0.00012 ∗ L 0.15 –k0 0.0 mm 1.0 mm – –e0 0.0 mm 1.5 mm – –c0 0.0 mm 1.0 mm – –
0.2 0.3 0.05 0.075 0.25 –
Correlation between the geometric variables
h b tw tf
h 1 0.0534 0.0399 −0.0989b 0.0534 1 −0.2142 −0.2681tw 0.0399 −0.2142 1 0.2451tf −0.0989 −0.2681 0.2451 1
Table 4The importance factors of random variables
λz b tw tf E fy e0 α
N – IPE240
0 0.620 5.823 14.517 0.000 79.039 0.000 0.000
30 0.860 5.966 15.916 0.167 76.865 0.084 0.143
60 3.005 4.136 24.459 1.437 60.603 3.407 2.953
90 7.417 1.179 35.867 6.902 29.404 12.705 6.525120 12.581 0.179 46.062 15.939 9.885 11.826 3.528
200 16.914 0.003 50.252 26.789 1.232 4.098 0.712
300 17.341 0.001 50.395 30.004 0.090 1.776 0.393
N – HEA200
0 0.908 1.955 22.110 0.000 75.027 0.000 0.000
30 1.249 1.928 23.419 0.002 72.433 0.231 0.740
60 2.633 1.379 27.722 0.218 56.566 2.740 8.74190 6.882 0.435 37.028 3.557 28.665 11.418 12.015120 12.877 0.078 47.203 13.358 9.437 10.795 6.252200 17.150 0.001 51.645 25.010 1.252 3.547 1.395
300 17.804 0.000 51.571 28.445 0.416 1.338 0.425
M – IPE240
0 0.931 2.113 20.013 0.000 76.943 0.000 0.000
30 1.153 1.755 20.998 0.005 74.377 0.006 1.706
60 1.809 1.467 25.277 0.084 66.754 1.264 3.345
90 2.682 1.375 38.784 1.332 47.496 2.873 5.459120 4.434 1.270 55.591 5.004 24.342 4.369 4.989
200 5.773 1.545 75.683 12.351 3.719 0.757 0.172
300 4.875 2.079 74.184 18.530 0.003 0.323 0.007
M – HEA200
0 1.137 0.611 24.641 0.000 73.611 0.000 0.000
30 1.691 0.638 27.592 0.003 68.663 0.004 1.411
60 1.611 0.342 29.641 0.069 61.684 0.035 6.61790 2.314 0.422 37.139 0.631 46.689 0.404 12.400120 3.023 0.556 47.704 2.929 31.668 0.955 13.165200 4.808 0.653 79.752 9.846 0.606 0.203 4.133
300 4.425 0.768 78.929 15.838 0.000 0.040 0.000
574 J. Szalai, F. Papp / Journal of Constructional Steel Research 65 (2009) 569–577
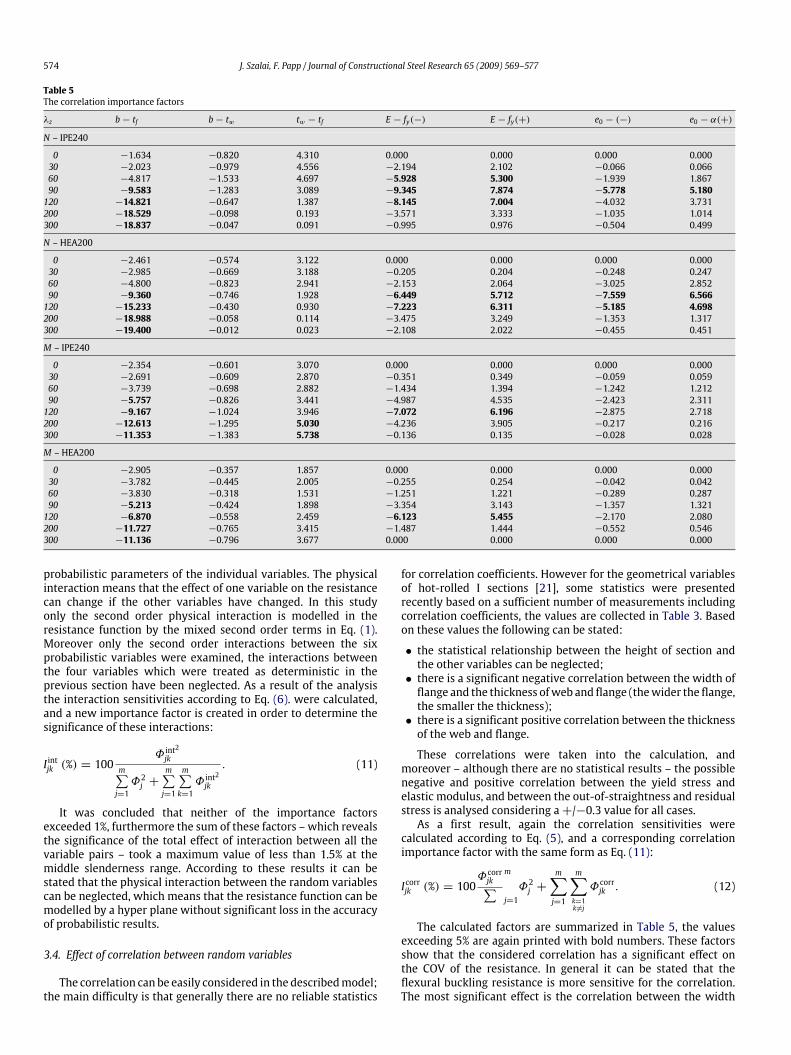
Table 5The correlation importance factors
λz b− tf b− tw tw − tf E − fy(−) E − fy(+) e0 − (−) e0 − α(+)
N – IPE240
0 −1.634 −0.820 4.310 0.000 0.000 0.000 0.00030 −2.023 −0.979 4.556 −2.194 2.102 −0.066 0.06660 −4.817 −1.533 4.697 −5.928 5.300 −1.939 1.86790 −9.583 −1.283 3.089 −9.345 7.874 −5.778 5.180120 −14.821 −0.647 1.387 −8.145 7.004 −4.032 3.731200 −18.529 −0.098 0.193 −3.571 3.333 −1.035 1.014300 −18.837 −0.047 0.091 −0.995 0.976 −0.504 0.499
N – HEA200
0 −2.461 −0.574 3.122 0.000 0.000 0.000 0.00030 −2.985 −0.669 3.188 −0.205 0.204 −0.248 0.24760 −4.800 −0.823 2.941 −2.153 2.064 −3.025 2.85290 −9.360 −0.746 1.928 −6.449 5.712 −7.559 6.566120 −15.233 −0.430 0.930 −7.223 6.311 −5.185 4.698200 −18.988 −0.058 0.114 −3.475 3.249 −1.353 1.317300 −19.400 −0.012 0.023 −2.108 2.022 −0.455 0.451
M – IPE240
0 −2.354 −0.601 3.070 0.000 0.000 0.000 0.00030 −2.691 −0.609 2.870 −0.351 0.349 −0.059 0.05960 −3.739 −0.698 2.882 −1.434 1.394 −1.242 1.21290 −5.757 −0.826 3.441 −4.987 4.535 −2.423 2.311120 −9.167 −1.024 3.946 −7.072 6.196 −2.875 2.718200 −12.613 −1.295 5.030 −4.236 3.905 −0.217 0.216300 −11.353 −1.383 5.738 −0.136 0.135 −0.028 0.028
M – HEA200
0 −2.905 −0.357 1.857 0.000 0.000 0.000 0.00030 −3.782 −0.445 2.005 −0.255 0.254 −0.042 0.04260 −3.830 −0.318 1.531 −1.251 1.221 −0.289 0.28790 −5.213 −0.424 1.898 −3.354 3.143 −1.357 1.321120 −6.870 −0.558 2.459 −6.123 5.455 −2.170 2.080200 −11.727 −0.765 3.415 −1.487 1.444 −0.552 0.546300 −11.136 −0.796 3.677 0.000 0.000 0.000 0.000
probabilistic parameters of the individual variables. The physicalinteraction means that the effect of one variable on the resistancecan change if the other variables have changed. In this studyonly the second order physical interaction is modelled in theresistance function by the mixed second order terms in Eq. (1).Moreover only the second order interactions between the sixprobabilistic variables were examined, the interactions betweenthe four variables which were treated as deterministic in theprevious section have been neglected. As a result of the analysisthe interaction sensitivities according to Eq. (6). were calculated,and a new importance factor is created in order to determine thesignificance of these interactions:
I intjk (%) = 100Φ int
2
jkm∑j=1Φ2j +
m∑j=1
m∑k=1
Φ int2
jk
. (11)
It was concluded that neither of the importance factorsexceeded 1%, furthermore the sum of these factors – which revealsthe significance of the total effect of interaction between all thevariable pairs – took a maximum value of less than 1.5% at themiddle slenderness range. According to these results it can bestated that the physical interaction between the random variablescan be neglected, which means that the resistance function can bemodelled by a hyper plane without significant loss in the accuracyof probabilistic results.
3.4. Effect of correlation between random variables
The correlation can be easily considered in the describedmodel;the main difficulty is that generally there are no reliable statistics
for correlation coefficients. However for the geometrical variablesof hot-rolled I sections [21], some statistics were presentedrecently based on a sufficient number of measurements includingcorrelation coefficients, the values are collected in Table 3. Basedon these values the following can be stated:
• the statistical relationship between the height of section andthe other variables can be neglected;• there is a significant negative correlation between the width offlange and the thickness ofweb and flange (thewider the flange,the smaller the thickness);• there is a significant positive correlation between the thicknessof the web and flange.
These correlations were taken into the calculation, andmoreover – although there are no statistical results – the possiblenegative and positive correlation between the yield stress andelastic modulus, and between the out-of-straightness and residualstress is analysed considering a+/−0.3 value for all cases.As a first result, again the correlation sensitivities were
calculated according to Eq. (5), and a corresponding correlationimportance factor with the same form as Eq. (11):
Icorrjk (%) = 100Φcorrjk∑ m
j=1Φ2j +
m∑j=1
m∑k=1k6=j
Φcorrjk . (12)
The calculated factors are summarized in Table 5, the valuesexceeding 5% are again printed with bold numbers. These factorsshow that the considered correlation has a significant effect onthe COV of the resistance. In general it can be stated that theflexural buckling resistance is more sensitive for the correlation.The most significant effect is the correlation between the width
J. Szalai, F. Papp / Journal of Constructional Steel Research 65 (2009) 569–577 575
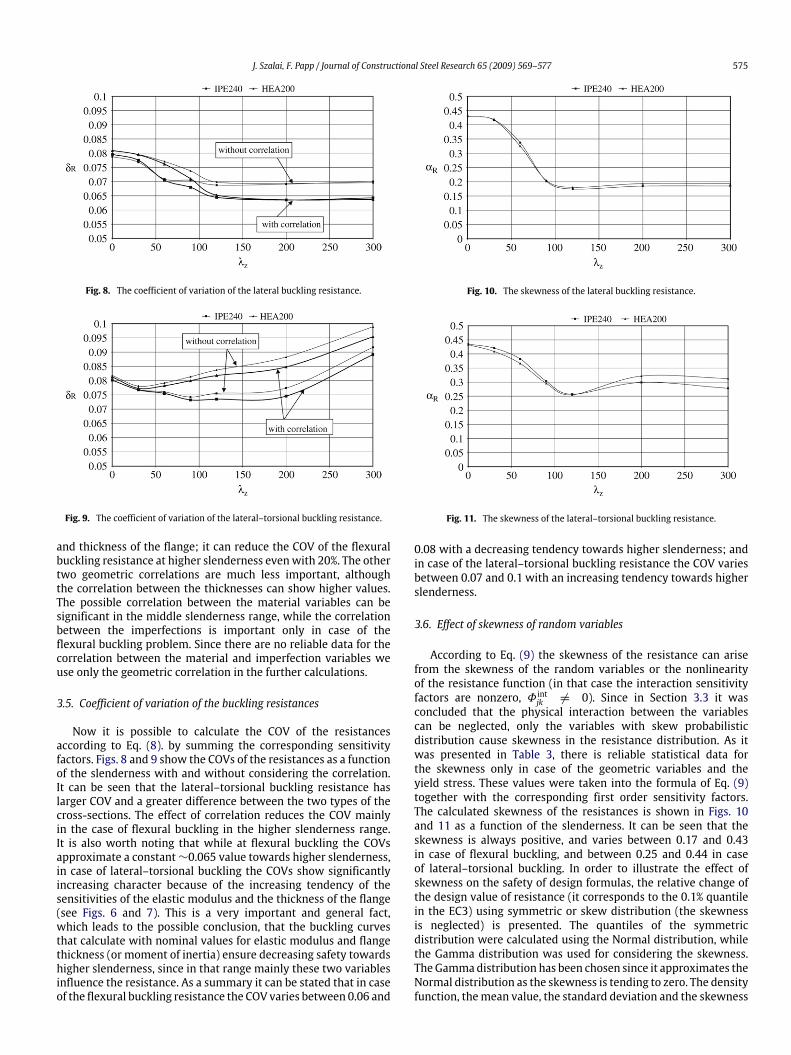
Fig. 8. The coefficient of variation of the lateral buckling resistance.
Fig. 9. The coefficient of variation of the lateral–torsional buckling resistance.
and thickness of the flange; it can reduce the COV of the flexuralbuckling resistance at higher slenderness evenwith 20%. The othertwo geometric correlations are much less important, althoughthe correlation between the thicknesses can show higher values.The possible correlation between the material variables can besignificant in the middle slenderness range, while the correlationbetween the imperfections is important only in case of theflexural buckling problem. Since there are no reliable data for thecorrelation between the material and imperfection variables weuse only the geometric correlation in the further calculations.
3.5. Coefficient of variation of the buckling resistances
Now it is possible to calculate the COV of the resistancesaccording to Eq. (8). by summing the corresponding sensitivityfactors. Figs. 8 and 9 show the COVs of the resistances as a functionof the slenderness with and without considering the correlation.It can be seen that the lateral–torsional buckling resistance haslarger COV and a greater difference between the two types of thecross-sections. The effect of correlation reduces the COV mainlyin the case of flexural buckling in the higher slenderness range.It is also worth noting that while at flexural buckling the COVsapproximate a constant∼0.065 value towards higher slenderness,in case of lateral–torsional buckling the COVs show significantlyincreasing character because of the increasing tendency of thesensitivities of the elastic modulus and the thickness of the flange(see Figs. 6 and 7). This is a very important and general fact,which leads to the possible conclusion, that the buckling curvesthat calculate with nominal values for elastic modulus and flangethickness (or moment of inertia) ensure decreasing safety towardshigher slenderness, since in that range mainly these two variablesinfluence the resistance. As a summary it can be stated that in caseof the flexural buckling resistance the COV varies between 0.06 and
Fig. 10. The skewness of the lateral buckling resistance.
Fig. 11. The skewness of the lateral–torsional buckling resistance.
0.08 with a decreasing tendency towards higher slenderness; andin case of the lateral–torsional buckling resistance the COV variesbetween 0.07 and 0.1 with an increasing tendency towards higherslenderness.
3.6. Effect of skewness of random variables
According to Eq. (9) the skewness of the resistance can arisefrom the skewness of the random variables or the nonlinearityof the resistance function (in that case the interaction sensitivityfactors are nonzero, Φ intjk 6= 0). Since in Section 3.3 it wasconcluded that the physical interaction between the variablescan be neglected, only the variables with skew probabilisticdistribution cause skewness in the resistance distribution. As itwas presented in Table 3, there is reliable statistical data forthe skewness only in case of the geometric variables and theyield stress. These values were taken into the formula of Eq. (9)together with the corresponding first order sensitivity factors.The calculated skewness of the resistances is shown in Figs. 10and 11 as a function of the slenderness. It can be seen that theskewness is always positive, and varies between 0.17 and 0.43in case of flexural buckling, and between 0.25 and 0.44 in caseof lateral–torsional buckling. In order to illustrate the effect ofskewness on the safety of design formulas, the relative change ofthe design value of resistance (it corresponds to the 0.1% quantilein the EC3) using symmetric or skew distribution (the skewnessis neglected) is presented. The quantiles of the symmetricdistribution were calculated using the Normal distribution, whilethe Gamma distribution was used for considering the skewness.TheGammadistribution has been chosen since it approximates theNormal distribution as the skewness is tending to zero. The densityfunction, themean value, the standard deviation and the skewness

576 J. Szalai, F. Papp / Journal of Constructional Steel Research 65 (2009) 569–577
Fig. 12. Relative change in the 0.1% quantile as a function of coefficient of variationand skewness.
of the Gamma distribution can be written using three parameters(λ, ξε):
fGamma(x) =1
ξλ0(λ)e−(x−ε)/ξ (x− ε)λ−1 (13)
µ = ξλ+ ε (14)
σ = ξ√λ (15)
α =2√λ
(16)
where0(λ) =∫∞
0 e−uuλ−1du is the Gamma function. Fromknown
values for the COV and skewness the three parameters can becalculated, and the 0.1% quantile can be determined easily. Therelative change in this quantile was calculated according to thefollowing formula:
relative change =Q Gamma0.1%
QNormal0.1%. (17)
The relative change is shown in Fig. 12, calculated at differentskewness values in the practical range of COV. It can be seen thatthe calculated positive skewness always increases the quantile(the design value of the resistance), and the greater the COV andthe skewness the greater the increase is. For both types of theexaminedproblems the cross-section resistance (zero slenderness)has the greatest skewness (∼0.44), and calculating with a δR =0.8 COV (see Figs. 8 and 9) the increase in the design value isalmost 7%. According to these points it can be stated that neglectingthe skewness can cause significant change in the design value ofthe resistance although with increasing safety.
4. Conclusions
In this paper a new probabilistic evaluation method forstandard resistance models was proposed utilizing fully theadvantages of high-level numerical analysis. The technique clearlyillustrates the probabilistic characteristics of the resistancemodelsand is accordingly applicable for the probabilistic calibration ofstandard formulas. Unlike the existing methods, the proposedprocedure yields explicit information about the significanceof certain variables; the influence of physical interaction andstatistical correlation between them; and the effect of skewnessin their probabilistic distribution. Through a comprehensiveapplication example the power of the method was demonstrated,in which the flexural and lateral–torsional buckling of hot rolledI profiles were analysed. A wide range of random variableswas considered as geometrical and material parameters andimperfections. It was first concluded, that certain variables –such as the web excentricity, the height of the section, section
out-of-square and web deformability – could be considered asdeterministic, and the physical interaction between them hadnegligible influence on the resistance. The correlation betweenvariables reduced significantly the COVs mostly at the higherslenderness range. It was also shown that significant positiveskewness could arise in the distribution of the resistances, andit causes increase in the design value corresponding to the 0.1%quantile. It was shown that the coefficient of variation of thelateral–torsional buckling resistance is progressively increasingtowards higher slenderness. This is a very important and generalfact, which leads to the possible conclusion, that the bucklingcurves that are calculated with nominal values for elastic modulusand flange thickness (or moment of inertia) ensure decreasingsafety for slender members, since in that range mainly these twovariables influence the resistance. In the opinion of the authors thepresented method and the application results can be an efficientnumerical tool for the fully probabilistic calibration of standardformulas, which should done in parallel with the continuousdevelopment of the standard deterministic mechanical models.
References
[1] Janns J, Sedlacek G, Maquoi R, Ungermann D, Kuck J. Evaluation of test resultson columns, beams and beam–columns with cross-sectional classes 1-3 inorder to obtain strength functions and suitable model factors. Backgroundreport to Eurocode 3 Common unified rules for steel structures. 1992.
[2] Galambos TV. Guide to stability design of metal structures. Wiley; 1995.[3] Chen WF, Atsuta T. Theory of beam–columns. McGraw-Hill; 1977.[4] Fukumoto Y, Aoki T, Kajita N. Evaluation of column curves based onprobabilistic concept. In: Proceedings of the international conference onstability. Preliminary report. Tokyo; 1976.
[5] Strating J, Vos H. Computer simulation of the E.C.C.S. buckling curves using aMonte-Carlo method. HERON 1973;19(2).
[6] Bjorhovde R. Deterministic and probabilistic approaches to the strength ofsteel columns. Ph.D. dissertation. Bethlehem: Lehigh University; 1972.
[7] Beer H, Schultz G. Theoretical basis for the European column curves.Construction Métalique 1970;3.
[8] Maquoi R, Rondal J. Mise en Equation des Nouvelles Courbes Européennes deFlambement. Revue Construction Métalique 1978;1.
[9] European Standard, EuroCode 3. Design of Steel Structures – Part1-1: Generalrules and rules for buildings. EN 1993-1-1. 2005.
[10] BoissonadeN, Jaspart JP,Muzeau JP, VilletteM. Improvement of the interactionformulae for beamcolumns in Eurocode 3. Computers and Structures 2002;80:2375–85.
[11] Greiner R. Recent developments of the new rules for member stability inEurocode 3. Stability and ductility of steel structures, Budapest: AkadémiaiKiadó; 2002.
[12] Greiner R. Background information on the beam–column interaction formulaeat level 1. ECCS TC 8, Ad-hoc working group on beam–columns. TechnicalUniversity Graz; 2001.
[13] Rajasekaran S, Murray DW. Finite element solution of inelastic beamequations. Journal of the Structural Division 1973;99(6):1024–42.
[14] Papp F, Iványi M, Jármai K. Unified object-oriented definition of thin-walled steel beam–column cross-sections. Computers and Structures 2001;79:839–52.
[15] Szalai J, Papp F. An automatic strain-based incremental-iterative technique forelasto-plastic beam–columns. Structural Mechanics 2005;38(1):28–44.
[16] European convention for constructional steelwork.Manual on stability of steelstructures. 1976.
[17] Szalai J, Papp F. A new residual stress distribution for hot-rolled I-shapedsection. Journal of Constructional Steel Research 2005;61(6):845–61.
[18] Szalai J. Overall sensitivity analysis of hot-rolled beam–columns. In: Jár-mai Károly, Farkas József, editors. Metal structures: Design, fabrication, econ-omy. Rotterdam: Millpress; 2003.
[19] Szalai J. Analysis of the resistance of steel beam–columns on probabilisticbasis. Ph.D. dissertation. Budapest University of Technology and Economics;2005.
[20] Zhao YG, Ono T. Moment methods for structural reliability. Structural Safety2001;23:47–75.
[21] Melcher J, Kala Z, Holicky M, Fajkus M, Rozlivka L. Design characteristics ofstructural steels based on statistical analysis ofmetallurgical products. Journalof Constructional Steel Research 2004;60:795–808.
[22] Anslijn R. Tests on steel I beam–columns subjected to thrust and biaxialbending. Construction Metallique, Centre de Nercherches Scientifiques etTechniques de L’Industrie des Fabrications Metalliques. 1983.

J. Szalai, F. Papp / Journal of Constructional Steel Research 65 (2009) 569–577 577
[23] Joint Comitee of Structural Safety (JCSS). Probabilistic model code. InternetPublication; 2002.
[24] Galambos TV, Ravindra MK. Properties of steel for use in LFRD. Journal of theStructural Division 1978; ASCE 104: 1459–1468.
[25] Alpsten GA. Variations in mechanical and cross-sectional properties of steel.
In: Tall building criteria and loading (Volume 1b), Proceedings of theinternational conference on planning and design tall buildings. Bethlehem(PA): Lehigh University; 1972.
[26] Agostini N, Ballio G, Poggi C. Statistical analysis of the mechanical propertiesof structural steel. Costruzioni Metalliche 1994;2(XLVI):31–9.