On the performance of homogeneous and heterogeneous cooperative search strategies
14
On the performance of homogeneous and heterogeneous cooperative search strategies A.D. Masegosa and D. Pelta and I.G. del Amo and J.L. Verdegay Abstract Cooperative strategies are search techniques composed by a set of indi- vidual methods (solvers) that, through information exchange, cooperate to solve an optimization problem. In this paper, we focus on the composition of such set and we analyze the results of a cooperative strategy when the solvers in the set are equal (homogeneous) or different (heterogeneous). Using the Uncapacitated Single Allo- cation p-Hub Median Problem as test bed we found that taking copies of the same solver and adding cooperation, the results are better than using an isolated solver. Regarding using different solvers, the cooperative heterogeneous scheme is usually better than the best performing isolated solver search (which usually changes in terms of the instance being solved). In terms of heterogeneous vs. homogeneous composition of the cooperative strategy, an advantage in using the former scheme can be observed. 1 Introduction Cooperative search is a very promising field in combinatorial optimisation as can be seen in some recent works [6]. This type of search consists of a set of search threads or solvers which exchange information to increase their robustness and efficiency. In the case that such threads implement the same algorithm with the same parame- ter configuration, the resulting cooperative strategy is named homogeneous. On the other hand, if the threads implement different algorithms or the same with distinct configurations, then the strategy is called heterogeneous. If the threads communi- cate during the search, such strategies are called cooperative multi-thread methods; if they communicate at the end of the run, they are called independent search meth- {A.D. Masegosa,D. Pelta and I.G. del Amo and J.L. Verdegay} Dept. of Computer Science and Artificial Intelligence University of Granada, E-18071 Granada, e-mail: {admase, dpelta, ngdelAmo, verdegay}@decsai.ugr.es 1
Transcript of On the performance of homogeneous and heterogeneous cooperative search strategies

On the performance of homogeneous andheterogeneous cooperative search strategies
A.D. Masegosa and D. Pelta and I.G. del Amo and J.L. Verdegay
Abstract Cooperative strategies are search techniques composed by a set of indi-vidual methods (solvers) that, through information exchange, cooperate to solve anoptimization problem. In this paper, we focus on the composition of such set andwe analyze the results of a cooperative strategy when the solvers in the set are equal(homogeneous) or different (heterogeneous). Using the Uncapacitated Single Allo-cation p-Hub Median Problem as test bed we found that taking copies of the samesolver and adding cooperation, the results are better than using an isolated solver.Regarding using different solvers, the cooperative heterogeneous scheme is usuallybetter than the best performing isolated solver search (which usually changes interms of the instance being solved). In terms of heterogeneous vs. homogeneouscomposition of the cooperative strategy, an advantage in using the former schemecan be observed.
1 Introduction
Cooperative search is a very promising field in combinatorial optimisation as can beseen in some recent works [6]. This type of search consists of a set of search threadsor solvers which exchange information to increase their robustness and efficiency.In the case that such threads implement the same algorithm with the same parame-ter configuration, the resulting cooperative strategy is named homogeneous. On theother hand, if the threads implement different algorithms or the same with distinctconfigurations, then the strategy is called heterogeneous. If the threads communi-cate during the search, such strategies are called cooperative multi-thread methods;if they communicate at the end of the run, they are called independent search meth-
{A.D. Masegosa,D. Pelta and I.G. del Amo and J.L. Verdegay}Dept. of Computer Science and Artificial IntelligenceUniversity of Granada, E-18071 Granada,e-mail: {admase, dpelta, ngdelAmo, verdegay}@decsai.ugr.es
1

2 A.D. Masegosa and D. Pelta and I.G. del Amo and J.L. Verdegay
ods. The cooperative search threads exchange and share information collected alongthe trajectories which they investigate. This shared information is implemented ei-ther as global variables stored in a shared memory, or as a pool in the local memoryof a dedicated central processor which can be accessed by all other processors.
These type of ideas can be found either explicitly or implicitly in various optimi-sation strategies:
• Multi-agents systems, where a set of very simple entities (‘ants’ in ACO‘s[9] or‘particles’ in PSO‘s[15]) proceed in a cooperative way to improve progressivelya population of solutions.
• Multi-memetic algorithms[16] are a special type of memetic algorithms that usea set of local searches to refine a population of solutions which is evolved by agenetic algorithm. Self-adaptation can be used to promote and disseminate thoselocal searchers that provide the best results, thereby yielding in robust and adap-tive search strategies.
• Hiperheuristics[3], where a set of low-level heuristics are managed by a concreteheuristic that determine which one should be applied in every moment. This deci-sion is made using information about the performance of the low-level heuristics.This sort of hierarchical cooperation or organization of the search is also done in[12]
• Multi-thread parallel metaheuristics[2, 7], where several heuristics that are ex-ecuted in parallel cooperate sharing performance information in order to reachpromising regions of the search space, avoid local minimums, determine the mostsuitable heuristic, etc.
In former works [8, 21, 20], we presented a multi-thread cooperative strategywhere a set of solver/threads are controlled by a central coordinator. Each thread canimplement a specific heuristic to solve the problem. The central coordinator receivesinformation about the different threads’ trajectories during the search process. Basedon this data, it decides whether the behaviour of the solvers should be changed ornot.
In this paper, we focus on the composition of the set of solvers and we analyzethe results of a cooperative strategy when the set is homogeneous (solvers in the setare equal) or heterogeneous (the solvers are different). Besides, we also analyze thebehaviour of both cooperative schemes against that provided by the best individualsolver (which usually changes in terms of the instance being solved). As test bed wehave used the Uncapacitated Single Allocation p-Hub Median Problem.
This work is structured as follows. Firstly, in Section 2 the general scheme ofthe basic strategy will be described and the details of the information managementcarried out will be given. After that, the Uncapacitated Single Allocation p-HubMedian Problem will be defined in Section 3. Design and implementation details ofthe cooperative strategy are described in Section 4. Section 5 is devoted to show theexperimentation done, as well as the results obtained. Finally, Section 6 is devotedto the conclusions.

Homogeneous vs. heterogeneous cooperative search strategies 3
2 A basic cooperative strategy
The proposed studies will be conducted over a centralized cooperative strategy [21].There is a set of solvers, where each solver implements the same or a different res-olution strategy for the problem at hand. The coordinator processes the informationreceived from the solvers and produces subsequent adjustments of their behaviourby sending “orders”. To achieve this exchange of data, a blackboard architecture[10] is used. Concretely, two blackboards are available, one where the solvers writethe reports of their performance and the coordinator reads them, and another, wherethe orders are written by the coordinator and read by the solvers.
After an initialization stage, the solvers are executed asynchronously while send-ing and receiving information. The coordinator checks through the input blackboardwhich solver provided new information and decides whether its behaviour needs tobe adapted or not. This decision is taken according to a fuzzy rule. If adaptationis needed, the coordinator will calculate a new behaviour which will be sent to thesolvers through the output blackboard. As for the solvers, its working is also verysimple: once execution has begun, performance information is sent and adaptationorders from the coordinator are received alternatively.
Every cooperative strategy of this kind should define an information managementstrategy providing: the type of information that solvers send, the type of informa-tion the coordinator send, and how such information is processed. Such details aredescribed below.
2.1 The information management strategy
The information flow in the strategy can be divided in the following steps: 1) per-formance information is sent from the solvers to the coordinator, 2) this informationis processed and stored by the coordinator and 3) coordinator sends orders to thesolvers. In this subsection we are going to describe what data are used in each stepand which transformations are made.
As in previous works [21, 8], the solvers are trajectory-based search proce-dures (Tabu Search, Simulated Annealing (SA) and Variable Neighborhood Descentsearch(VND). The details are in section 4). In the data flow from solvers to the co-ordinator, each report contains the next items:
• Solver identification.• A time stamp t, that is associated with the number of evaluations performed by
the solver.• The current solution of the solver at that time st .• The best solution reached until that time by this solver sbest .
The coordinator keeps the last two reports sent by each solver, so in the next step
(information processing), the improvement rate is calculated as ∆ f = f (st )− f (st′ )t−t ′ ,

4 A.D. Masegosa and D. Pelta and I.G. del Amo and J.L. Verdegay
where t− t ′ represents the elapsed time between two consecutive reports, st ′ corre-sponds to the solution sent by the solver in the former report and f is the objectivefunction. The values ∆ f and f (st) are then stored in two fixed length ordered “mem-ories”, one for improvements and another for costs.
Over those memories, fuzzy sets and a fuzzy rule are constructed. The rule isintended to model the following behaviour: If a solver is working well, keep it; but ifa solver seems to be trapped, do something to alter its behaviour. To determine thequality of the thread, it makes use of the memories previously seen. We use Cbest todenote the best solution ever recorded by the coordinator. The implemented rule isthe following:
IF the quality of the current solution reported by solveri is low AND the im-provement rate of solveri is low THEN send modified Cbest to solveri
The label low is defined as a fuzzy set with the following membership function:
µ(x,α,β ) =
0, if x > ββ−xβ−α , if α ≤ x≤ β1, if x < α
where x is the relative position (resembling the notion of percentile rank) of a value(an improvement rate or a cost) in the samples stored in memory of improvementsor memory of costs, respectively, and the other parameters are fixed to α = 80 andβ = 100 for the memory of costs, and α = 0 and β = 20 for the memory of improve-ments. In short, what the rule says is that if the values reported by a solver are amongthe worst in the memories, then such a solver should be changed in some way. Themodification done to Cbest is accomplished by a neighborhood operator that will bedescribed later (Section 4.1). The objective of such alteration of the solution is toavoid relocating all solvers in the same point of the search space.
It should be mentioned that other types of rules can be obtained. For example, in[4] the authors propose a data mining process to optimize certain parameters of abasic rule. However, the data mining process should be conducted after a not trivialdata generation and gathering process where the individual methods are run over anumber of different instances.
3 The Uncapacitated Single Allocation p-Hub Median Problem
Hub location problems appear when it is necessary to guide the flow from an originto a destiny, but it is not recommendable or very expensive to have connections be-tween each pair origin-destiny. The objective of this kind of problems is composedof two steps: 1)Hub location: to determine which nodes should be the hubs andthe number of them, in order to distribute the flow across them, and 2) Non-hub tohub allocation: to assign the rest of the nodes to the hubs. Generally, these tasks
Homogeneous vs. heterogeneous cooperative search strategies 5
are performed by minimising an objective function that describes the exchange flowand its cost. A general survey of this kind of problems can be found in [5].
This work focuses on the Uncapacitated Single Allocation p-Hub Median Prob-lem (USApHMP). Uncapacitated means the hubs have no constraint on the amountof traffic, single indicates the nodes can be only assigned to a unique hub, and p-Hubsignifies that the number of hubs is fixed to p.
In this paper we are going to use the quadratic integer formulation given byO’Kelly in [19]. Let N be a set of n nodes. We define Wi j as the amount of flowfrom the node i to j, and Ci j the cost of transporting a unit between the nodes i andj.
Let Xi j be a decision variable defined as Xi j ={
1 if node i is allocated to hub j0, otherwise
The USApHMP can be formulated as:
min ∑i, j,k,l∈N
Wi j(χCikXik +αCklXikX jl +δC jlX jl) (1)
subject ton
∑j=1
X j j = p (2)
n
∑j=1
Xi j = 1,∀i = 1, . . . ,n (3)
Xi j ≤ X j j,∀i, j = 1, . . . ,n (4)
Xi j ∈ {0,1},∀i, j = 1, . . . ,n (5)
Parameters χ , α and δ stand for the cost of collection (generally χ = 1), the costof distribution (generally α < 1) and the cost of transfer (generally δ = 1), respec-tively. The objective function (1) minimises the sum of the origin-hub, hub-hub andhub-destination flow costs. Constraint (2) ensures that exactly p hubs exist. (3) in-dicates that a node can only be allocated to a unique hub. Condition (4) guaranteesthat a non-hub point can only be allocated to a hub and not to another non-hub node.Finally, (5) is the classical binary constraint.
The USApMP belongs to the class of the NP-hard problems. Moreover, althoughthe set of hubs is fixed, the assignment sub-problem is also NP-Hard [18].
The instances chosen for the experimentation were obtained from the resourceORLIB [1]. Concretely, we used the AP (Australian Post) data set derived from astudy of the postal delivery system. The instances are divided in two groups, thosewith 50 or less nodes, and those with more than 50. For the first set, instances with3, 4 and 5 hubs were considered , while for the second one, the different numbers ofhubs were 3, 4, 5,10,15 and 20. The value of the constants χ , α and δ were fixed to3, 0.75 and 2 respectively.

6 A.D. Masegosa and D. Pelta and I.G. del Amo and J.L. Verdegay
4 Implementation details
The cooperative strategies that we are going to use are based on three differentheuristic searches: Tabu Search, Simulated Annealing (SA) and Variable Neighbor-hood Descent search(VND). A common element among them is the neighborhoodoperator used to generate solutions that is described below. The particular imple-mentation details for the heuristics are omitted due to space constraints. Howeverwe should say that the “standard” versions of them, as described in [11, 14, 13], wastaken as guideline.
Although cooperative strategies are natural candidates to be implemented in par-allel, here we “simulate” the parallelism in a one-processor computer as follows. Weconstruct an array of solvers and we run each of them for certain number of evalua-tions of the objective function. This number is randomly generated from the interval[100,150]. Once a solver is executed, the communication with the coordinator takesplace. These steps are repeated until the stop condition is fulfilled.
4.1 Neighborhood operator
The neighborhood operator is composed of two distinct mechanisms: assignmentchange of non-hub nodes and location change of hubs. The first of them, consist onchanging the allocation of a non-hub node to a different hub. The steps done are thenext:
1. Choose randomly a group G j, being G j = {i|Xi j = 1, i 6= j} the group of thosenodes that are assigned to hub j.
2. Select randomly a node i ∈ G j3. Choose randomly another group Gk, k 6= j4. Allocate the selected node to the new group: Xi j ← 0,Xik ← 1
The other mechanism changes the location of a hub j to another node that iscurrently allocated to such hub. If there are no nodes allocated to j, a different nodeis selected as hub and j is assigned to other group. To do this change the next stagesare followed:
1. Choose randomly a group G j2. If there is at least one node in the group (|G j|> 0) then:
a. Select randomly a node i ∈ G jb. Allocate all nodes in G j and its hub node j to the new hub node i: ∀k ∈ G j:
Xk j ← 0, X j j ← 0, Xki ← 1, X ji ← 1 and Xii ← 1
3. If the group has no nodes (|Gi|= 0), then:
a. Choose randomly another group Gk,k 6= j with at least one node.b. Select randomly a node i ∈ Gk.
Homogeneous vs. heterogeneous cooperative search strategies 7
c. Make a new group with the selected node i. Xii ← 1d. Allocate the last hub j as a normal node to another hub selected randomly.
X jr ← 1 where r is a random hub.
5 Experiments and results
In this section we will describe the experiments done as well as the results obtained.As we wish to compare two types of cooperative strategies (homogeneous vs
heterogeneous) and isolated solvers, we implemented the following set of methods:
1. SA: isolated simulated annealing strategy2. Tabu: isolated tabu search strategy3. VND: isolated variable neighborhood descent search strategy4. H-SA: cooperative strategy composed by 3 identical copies of SA5. H-Tabu: cooperative strategy composed by 3 identical copies of Tabu6. H-VND: cooperative strategy composed by 3 identical copies of VND7. Heterogeneous: cooperative strategy composed by one SA, one Tabu and one
VND
Every strategy is run 30 times (each one starting from a different initial solution)and each run finishes when 25000 evaluations for instances with 50 nodes or less,and 200000 for instances with more than 50 nodes were used.
At the end of each run, we measure an error as error = 100× obtained value−optimumoptimum .
The optimum for those instances with a number of nodes less than 50 was providedby the resource ORLIB, and for the other instances we considered the best solutionfound for one of the state-of-art algorithms for this problem, presented in [17].
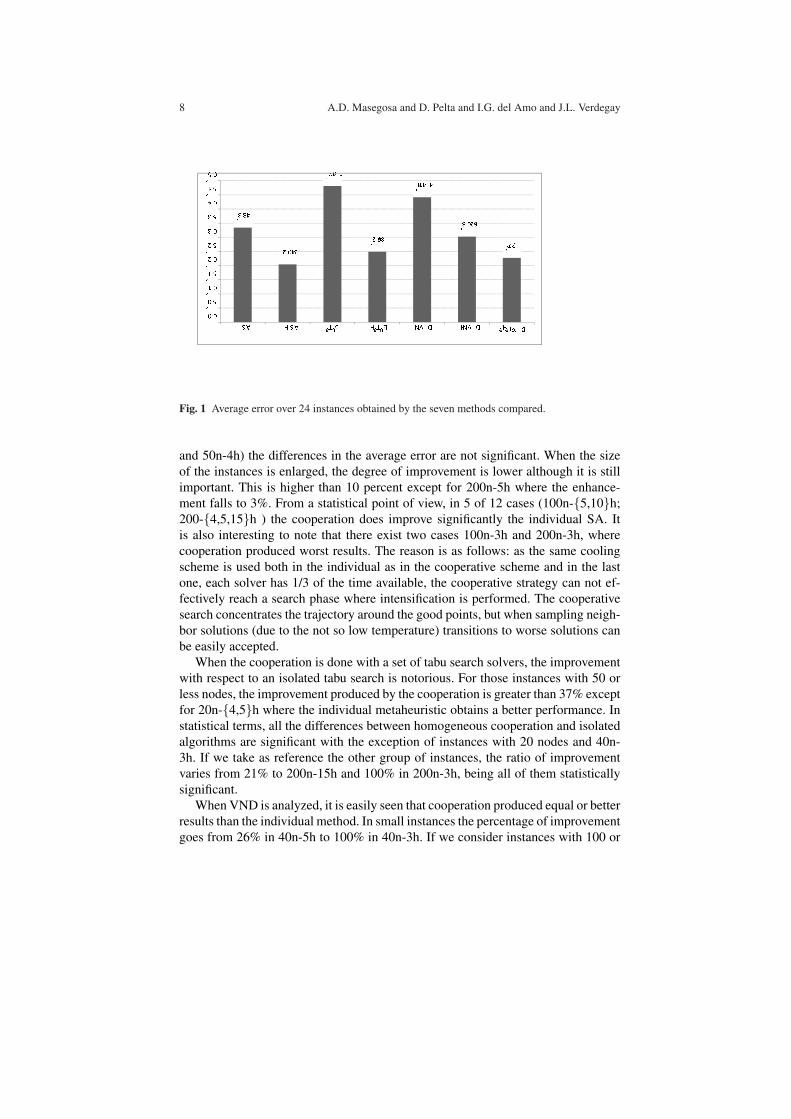
A global view of the results can be seen in Figure 1, where for every method,the average error obtained over all the instances is displayed. Viewing this graphic,a substantial improvement can be observed when cooperation is used. Looking atthe isolated vs homogeneous cooperation strategies, we can see that H-Tabu ex-perienced the largest decrease in error (48%), following by H-SA (38%) and H-VND (31%). The Mann-Whitney’s U non-parametric test with α < 0.05 confirmedthat these differences have statistical significance. If we compare the heterogeneousmethod versus the homogeneous strategies, we can say that the average global errorobtained by the first one is significantly better than the achieved one by H-VND.However, when such comparison is done versus either H-SA or H-Tabu instead ofH-VND, the differences are not significant (same non-parametric test).
A detailed analysis per instance is shown in Table 1 where the average errorfor both the individual methods and their homogeneous cooperative versions aredisplayed. The corresponding improvement percentage is also shown.
Focusing on the simulated annealing algorithm, we can observe that the homoge-neous cooperation led to better results in almost all cases. For those instances withless than 50 nodes, we can find decreases in average error above 25 percent, reach-ing the 100 percent in 40n-4h (40 nodes and 4 hubs). Only in two cases (25n-4h
8 A.D. Masegosa and D. Pelta and I.G. del Amo and J.L. Verdegay
�� � �� �� � � ��� �� �
�� � ��� �� � � � � � � � � � �
�� ��� � � �� � � � �� � � � �� � �� ��� � �
� � �� � � �� �� �� �� �� �� � �� �� � �� �� � !"Fig. 1 Average error over 24 instances obtained by the seven methods compared.
and 50n-4h) the differences in the average error are not significant. When the sizeof the instances is enlarged, the degree of improvement is lower although it is stillimportant. This is higher than 10 percent except for 200n-5h where the enhance-ment falls to 3%. From a statistical point of view, in 5 of 12 cases (100n-{5,10}h;200-{4,5,15}h ) the cooperation does improve significantly the individual SA. Itis also interesting to note that there exist two cases 100n-3h and 200n-3h, wherecooperation produced worst results. The reason is as follows: as the same coolingscheme is used both in the individual as in the cooperative scheme and in the lastone, each solver has 1/3 of the time available, the cooperative strategy can not ef-fectively reach a search phase where intensification is performed. The cooperativesearch concentrates the trajectory around the good points, but when sampling neigh-bor solutions (due to the not so low temperature) transitions to worse solutions canbe easily accepted.
When the cooperation is done with a set of tabu search solvers, the improvementwith respect to an isolated tabu search is notorious. For those instances with 50 orless nodes, the improvement produced by the cooperation is greater than 37% exceptfor 20n-{4,5}h where the individual metaheuristic obtains a better performance. Instatistical terms, all the differences between homogeneous cooperation and isolatedalgorithms are significant with the exception of instances with 20 nodes and 40n-3h. If we take as reference the other group of instances, the ratio of improvementvaries from 21% to 200n-15h and 100% in 200n-3h, being all of them statisticallysignificant.
When VND is analyzed, it is easily seen that cooperation produced equal or betterresults than the individual method. In small instances the percentage of improvementgoes from 26% in 40n-5h to 100% in 40n-3h. If we consider instances with 100 or

Homogeneous vs. heterogeneous cooperative search strategies 9
imp imp impNds Hbs SA H-SA SA Tabu H-Tabu Tabu VND H-VND VND20 3 2,89(2,15) 0,10(0,33) 97∗ 2,24(2,20) 0,72(1,41) 68 1,16(2,15) 0,19(1,05) 83∗
4 3,42(1,98) 2,01(1,54) 41∗ 1,41(1,85) 1,45(1,55) -3 2,54(1,35) 1,43(1,31) 44∗5 1,82(1,66) 0,74(1,13) 59∗ 0,25(0,67) 0,50(0,79) -99 2,43(2,47) 0,70(1,00) 71∗
25 3 2,17(2,26) 0,79(1,27) 64∗ 2,42(2,01) 1,12(1,65) 54∗ 1,92(1,74) 0,11(0,55) 94∗4 1,84(2,45) 0,43(0,83) 77 2,16(2,36) 0,82(1,72) 62∗ 3,73(3,60) 1,87(2,45) 505 4,48(3,52) 1,44(2,72) 68∗ 2,56(3,55) 1,01(2,35) 60∗ 7,40(4,13) 4,43(3,45) 40∗
40 3 0,43(0,91) 0,32(0,72) 26∗ 0,83(1,27) 0,32(0,72) 62 0,57(1,11) 0,00(0,00) 100∗4 1,60(2,54) 0,00(0,00) 100 2,35(2,81) 0,30(1,16) 87 3,54(3,09) 0,79(1,83) 785 2,37(1,72) 1,18(1,58) 50∗ 3,72(2,73) 2,05(1,08) 45∗ 3,52(2,71) 2,60(1,60) 26
50 3 1,99(2,34) 0,51(1,03) 75∗ 3,73(2,38) 1,04(1,76) 72∗ 3,13(2,32) 0,79(1,57) 75∗4 2,28(3,06) 0,69(2,11) 70 6,17(3,23) 1,54(2,66) 75∗ 4,46(3,98) 3,65(3,04) 185 4,87(2,63) 2,90(2,06) 40∗ 6,93(3,41) 4,33(1,47) 37∗ 5,87(3,35) 4,28(1,31) 27∗
100 3 0,52(1,06) 0,61(1,12) -16∗ 2,78(1,80) 0,87(1,25) 69∗ 1,02(2,05) 0,09(0,47) 92∗4 1,96(3,02) 0,00(0,00) 100∗ 4,45(2,42) 0,22(1,14) 95∗ 1,68(2,82) 0,37(1,39) 785 2,55(1,25) 2,13(0,60) 16 3,84(2,03) 2,19(0,42) 43∗ 2,46(0,80) 2,13(0,45) 13
10 5,56(3,10) 2,88(2,04) 48∗ 9,15(3,63) 4,13(2,39) 55∗ 9,42(3,91) 5,14(2,69) 45∗15 7,96(2,17) 5,95(2,32) 25∗ 11,29(2,79) 6,70(2,43) 41∗ 9,51(2,80) 7,57(2,54) 20∗20 6,24(2,38) 5,10(2,12) 18 8,41(2,37) 4,78(1,89) 43∗ 7,85(3,21) 7,00(2,46) 11
200 3 0,23(0,70) 0,35(0,78) -52∗ 0,79(0,95) 0,00(0,00) 100∗ 0,66(1,28) 0,17(0,61) 74∗4 1,83(3,12) 0,23(1,13) 87 1,60(2,47) 0,44(1,57) 72∗ 1,74(2,87) 0,39(1,20) 785 1,24(0,46) 1,10(0,59) 11∗ 2,21(2,39) 1,02(0,34) 54∗ 1,68(1,40) 0,98(0,28) 42∗
10 4,56(2,36) 4,04(1,93) 11 8,34(3,50) 4,12(1,88) 51∗ 7,02(2,37) 5,56(2,05) 21∗15 8,33(2,42) 8,07(1,81) 3 12,58(2,40) 9,93(2,55) 21∗ 10,76(2,64) 10,64(1,69) 120 9,13(2,87) 7,43(2,06) 19∗ 15,38(3,19) 10,13(2,31) 34∗ 11,87(3,23) 11,75(2,19) 1
Table 1 Average(std. deviation) for individual and homogeneous cooperativesearches, and percentage of improvement (imp) for each instance ((avg.invidual −avg.cooperative)/avg.individual ∗ 100). (*) indicates that the improvement is significant(Mann-Whitney’s U non-parametric test α < 0,05)
more nodes, we found that in the two biggest ones (200n-{15-20}h) the improve-ment obtained by cooperation is just slightly appreciable, only a 1%, and obviouslyis not statistically significant. However, in the remaining cases, the enhancement ob-tained by homogeneous VND is superior to 10%, even reaching a 92% in 100n-3h.Apart of the two biggest instances, just seven cases are not statistically significant.These are 25n-4h, 40n-{4,5}h, 50n-4h, 100n-{4,20}h and 200n-4h.
In short, these results say that using just three copies of an individual method plusa cooperation scheme, one can obtain an optimization scheme that almost alwayswill lead to an important improvement in performance.
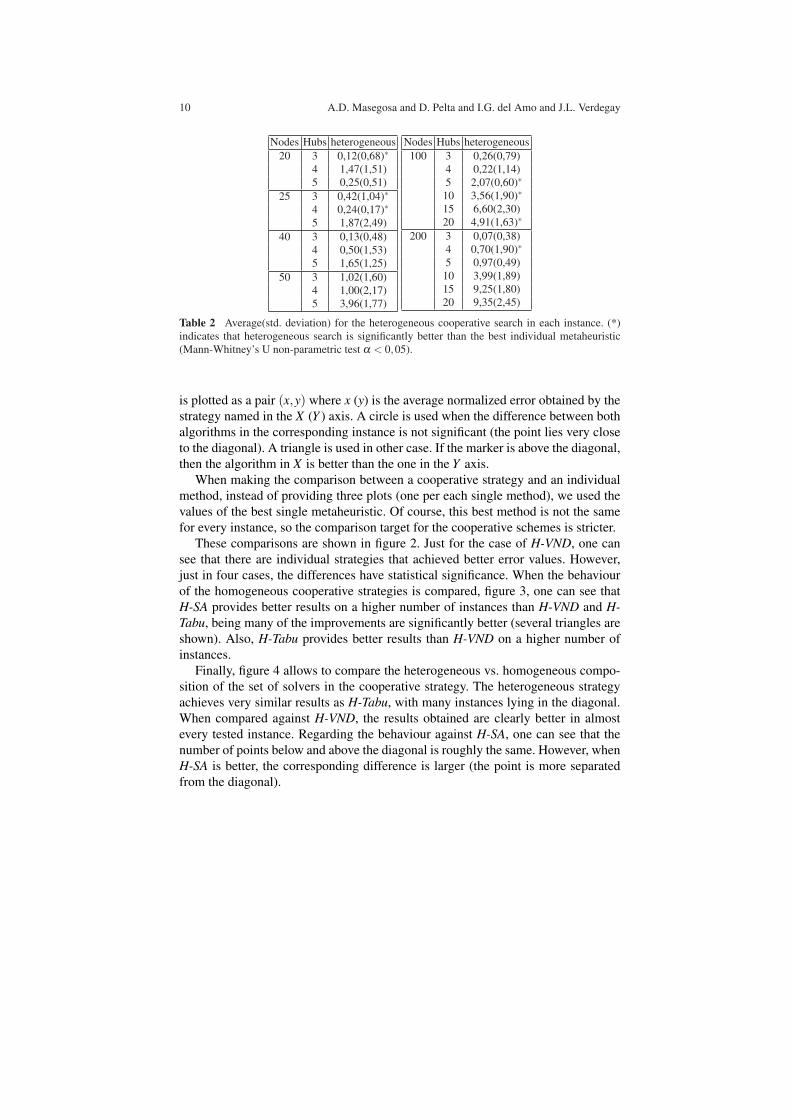
When the cooperative strategy is made up from different solvers, the analysisshould be slightly changed. The average error and the standard deviation obtainedby the heterogeneous cooperative strategy are shown in Table 2. We marked thoseinstances where the method obtained better results than the best individual method(the minimum of each row among SA,Tabu,V ND in Table 1). Again, cooperationallowed to obtain equal or better results than the individual methods.
To conclude the analysis, we show in Figures 2,3 and 4 a number of scatter plotsproviding pairwise comparison among the seven methods evaluated. Every instance
10 A.D. Masegosa and D. Pelta and I.G. del Amo and J.L. Verdegay
Nodes Hubs heterogeneous20 3 0,12(0,68)∗
4 1,47(1,51)5 0,25(0,51)
25 3 0,42(1,04)∗4 0,24(0,17)∗5 1,87(2,49)
40 3 0,13(0,48)4 0,50(1,53)5 1,65(1,25)
50 3 1,02(1,60)4 1,00(2,17)5 3,96(1,77)
Nodes Hubs heterogeneous100 3 0,26(0,79)
4 0,22(1,14)5 2,07(0,60)∗10 3,56(1,90)∗15 6,60(2,30)20 4,91(1,63)∗
200 3 0,07(0,38)4 0,70(1,90)∗5 0,97(0,49)10 3,99(1,89)15 9,25(1,80)20 9,35(2,45)
Table 2 Average(std. deviation) for the heterogeneous cooperative search in each instance. (*)indicates that heterogeneous search is significantly better than the best individual metaheuristic(Mann-Whitney’s U non-parametric test α < 0,05).
is plotted as a pair (x,y) where x (y) is the average normalized error obtained by thestrategy named in the X (Y ) axis. A circle is used when the difference between bothalgorithms in the corresponding instance is not significant (the point lies very closeto the diagonal). A triangle is used in other case. If the marker is above the diagonal,then the algorithm in X is better than the one in the Y axis.
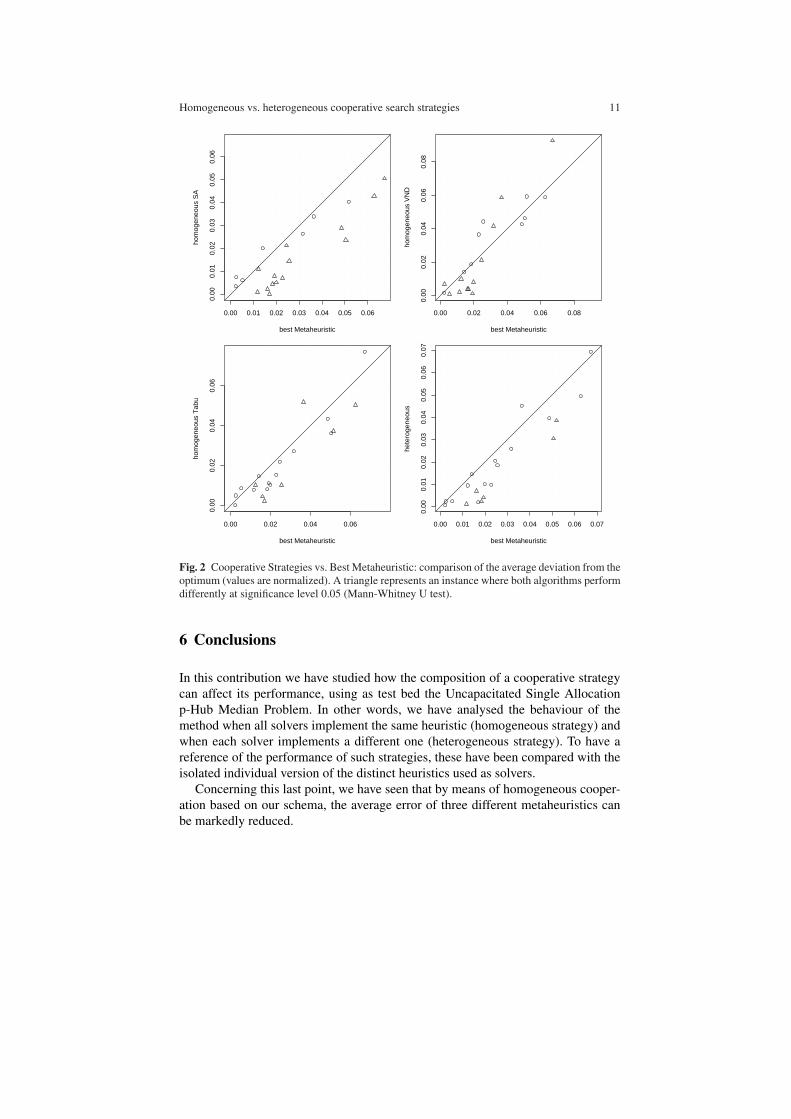
When making the comparison between a cooperative strategy and an individualmethod, instead of providing three plots (one per each single method), we used thevalues of the best single metaheuristic. Of course, this best method is not the samefor every instance, so the comparison target for the cooperative schemes is stricter.
These comparisons are shown in figure 2. Just for the case of H-VND, one cansee that there are individual strategies that achieved better error values. However,just in four cases, the differences have statistical significance. When the behaviourof the homogeneous cooperative strategies is compared, figure 3, one can see thatH-SA provides better results on a higher number of instances than H-VND and H-Tabu, being many of the improvements are significantly better (several triangles areshown). Also, H-Tabu provides better results than H-VND on a higher number ofinstances.
Finally, figure 4 allows to compare the heterogeneous vs. homogeneous compo-sition of the set of solvers in the cooperative strategy. The heterogeneous strategyachieves very similar results as H-Tabu, with many instances lying in the diagonal.When compared against H-VND, the results obtained are clearly better in almostevery tested instance. Regarding the behaviour against H-SA, one can see that thenumber of points below and above the diagonal is roughly the same. However, whenH-SA is better, the corresponding difference is larger (the point is more separatedfrom the diagonal).
Homogeneous vs. heterogeneous cooperative search strategies 11
0.00 0.01 0.02 0.03 0.04 0.05 0.06
0.00
0.01
0.02
0.03
0.04
0.05
0.06
best Metaheuristic
hom
ogen
eous
SA
0.00 0.02 0.04 0.06 0.08
0.00
0.02
0.04
0.06
0.08
best Metaheuristic
hom
ogen
eous
VN
D
0.00 0.02 0.04 0.06
0.00
0.02
0.04
0.06
best Metaheuristic
hom
ogen
eous
Tab
u
0.00 0.01 0.02 0.03 0.04 0.05 0.06 0.07
0.00
0.01
0.02
0.03
0.04
0.05
0.06
0.07
best Metaheuristic
hete
roge
neou
s
Fig. 2 Cooperative Strategies vs. Best Metaheuristic: comparison of the average deviation from theoptimum (values are normalized). A triangle represents an instance where both algorithms performdifferently at significance level 0.05 (Mann-Whitney U test).
6 Conclusions
In this contribution we have studied how the composition of a cooperative strategycan affect its performance, using as test bed the Uncapacitated Single Allocationp-Hub Median Problem. In other words, we have analysed the behaviour of themethod when all solvers implement the same heuristic (homogeneous strategy) andwhen each solver implements a different one (heterogeneous strategy). To have areference of the performance of such strategies, these have been compared with theisolated individual version of the distinct heuristics used as solvers.
Concerning this last point, we have seen that by means of homogeneous cooper-ation based on our schema, the average error of three different metaheuristics canbe markedly reduced.

12 A.D. Masegosa and D. Pelta and I.G. del Amo and J.L. Verdegay
0.00 0.02 0.04 0.06 0.08
0.00
0.02
0.04
0.06
0.08
homogeneous SA
hom
ogen
eous
VN
D
0.00 0.02 0.04 0.06
0.00
0.02
0.04
0.06
homogeneous SA
hom
ogen
eous
Tab
u
0.00 0.02 0.04 0.06 0.08
0.00
0.02
0.04
0.06
0.08
homogeneous VND
hom
ogen
eous
Tab
u
Fig. 3 H-Sa vs. H-Tabu vs H-VND:comparison of the average deviation from the optimum (valuesare normalized). A triangle represents an instance where both algorithms perform differently atsignificance level 0.05 (Mann-Whitney U test).
Another relevant point of this work consists on the comparison of the differentcooperative strategies studied versus the best individual method which, as we sawformerly, can vary from an instance to another. The obtained results showed thatcooperation, both homogeneous one and heterogeneous one, leads to equal to orbetter average cost values than the best individual metaheuristic in virtually all cases.
To finish, we will talk about the existing performance differences between thecooperative methods, where two aspects should be highlight. As for homogeneousstrategies, this work showed that the method whose solvers implement the bestglobal individual metaheuristic, gets to improve the rest. If the comparison is donebetween the heterogeneous and the homogeneous composition, we checked that thefirst one presents some advantages over the second ones.

Homogeneous vs. heterogeneous cooperative search strategies 13
0.00 0.01 0.02 0.03 0.04 0.05 0.06 0.07
0.00
0.01
0.02
0.03
0.04
0.05
0.06
0.07
homogeneous SA
hete
roge
neou
s
0.00 0.02 0.04 0.06 0.08
0.00
0.02
0.04
0.06
0.08
homogeneous VND
hete
roge
neou
s
0.00 0.02 0.04 0.06
0.00
0.02
0.04
0.06
homogeneous Tabu
hete
roge
neou
s
Fig. 4 Heterogeneous vs. Homogeneous cooperation: comparison of the average deviation fromthe optimum (values are normalized). A triangle represents an instance where both algorithmsperform differently at significance level 0.05 (Mann-Whitney U test).
Acknowledgements A.D. Masegosa is supported by the scholarship program FPI from the Span-ish Ministry of Science and Technology. Ignacio J. G. del Amo is supported by a scholarshipassociated to the excellence project P07-TIC-02970 from the Andalusian Government. This workhas been partially funded by the project TIN-2005-08404-C04-01 from the Spanish Ministry ofScience and Technology and TIC-00129-PE from the Andalusian Government.
References
1. J. Beasley. Obtaining test problems via internet. Journal of Global Optimization, 8(4):429–433, 1996.
2. A. L. Bouthillier and T. G. Crainic. A cooperative parallel meta-heuristic for the vehiclerouting problem with time windows. Comput. Oper. Res., 32(7):1685–1708, 2005.

14 A.D. Masegosa and D. Pelta and I.G. del Amo and J.L. Verdegay
3. E. Burke, G. Kendall, J. Newall, E. Hart, P. Ross, and S. Schulenburg. Handbook of meta-heuristics, chapter Hyper-heuristics: an emerging direction in modern search technology,pages 457–474. Kluwer Academic Publishers, 2003.
4. J. M. Cadenas, M. C. Garrido, and E. Munoz. A cooperative system of metaheuristics. In HIS’07: Proceedings of the 7th International Conference on Hybrid Intelligent Systems, pages120–125, Washington, DC, USA, 2007. IEEE Computer Society.
5. J. Campbell, A. Ernst, and M. Krishnamoorthy. Facility Location: Applications and Theory,chapter Hub location problems, pages 373–406. Springer-Verlag, 2002.
6. T. Crainic and M. Toulouse. Handbook of Metaheuristics, chapter Parallel strategies for meta-heuristics, pages 475–513. Kluwer Academic Publisher, Dordrecht, 2003.
7. T. G. Crainic, M. Gendreau, P. Hansen, and N. Mladenovic. Cooperative parallel variableneighborhood search for the p-median. Journal of Heuristics, 10(3):293–314, 2004.
8. C. Cruz and D. Pelta. Soft computing and cooperative strategies for optimization. AppliedSoft Computing Journal, 2007. doi:10.1016/j.asoc.2007.12.007. In press.
9. M. Dorigo and T. Stutzle. Ant Colony Optimization. Bradford Book, 2004.10. J. Ferber. Multi-Agent Systems: An Introduction to Distributed Artificial Intelligence.
Addison-Wesley Longman Publishing Co., Inc., Boston, MA, USA, 1999.11. M. Gendreau. Handbook of Metaheuristics, chapter An introduction to tabu search, pages
1086–1093. Kluwer Academic Publisher, Dordrecht, 2003.12. R. Gras, D. Hernandez, P. Hernandez, N. Zangge, Y. Mescam, J. Frey, O. Martin, J. Nicolas,
and R. D. Appel. Cooperative metaheuristics for exploring proteomic data. Artif. Intell. Rev.,20(1-2):95–120, 2003.
13. P. Hansen and Mladenovic. Handbook of Metaheuristics, chapter Variable neighborhoodsearch, pages 145–184. Kluwer Academic Publisher, Dordrecht, 2003.
14. D. Henderson, S. Jacobson, and A. Johnson. Handbook of Metaheuristics, chapter The theoryand practice of simulated annealing, pages 287–319. Kluwer Academic Publisher, Dordrecht,2003.
15. J. Kennedy and R. C. Eberhart. Swarm intelligence. Morgan Kaufmann Publishers Inc., SanFrancisco, CA, USA, 2001.
16. N. Krasnogor and D. A. Pelta. Fuzzy Sets based Heuristics for Optimization, volume 126 ofStudies in Fuzziness and Soft Computing, chapter Fuzzy Memes in Multimeme Algorithms:a Fuzzy-Evolutionary Hybrid, pages 49–66. Springer-Verlag Berling Heidelberg New York,2002.
17. J. Kratica, Z. Stanimirovic, and V. F. Duscan Tovsic. Two genetic algorithms for solvingthe uncapacitated single allocation p-hub median problem. European Journal of OperationalResearch, 182(1):15–28, 2007.
18. R. Love, J. Moris, and G. Wesolowsky. Facility location: Models and methods. Publicationin Operations Research, 7, 1988.
19. M. O’Kelly and E. Morton. A quadratic integer program for the location of interacting hubfacilities. European Journal of Operational Research, 32(3):393–404, 1987.
20. D. Pelta, C. Cruz, A. Sancho-Royo, and J. Verdegay. Fuzzy Applications in Industrial Engi-neering, volume 201 of Studies in Fuzziness and Soft Computing, chapter Fuzzy Sets basedCooperative Heuristics for Solving Optimization Problems. Springer, 2006.
21. D. Pelta, A. Sancho-Royo, C. Cruz, and J. L. Verdegay. Using memory and fuzzy rules in a co-operative multi-thread strategy for optimization. Information Sciences, 176(13):1849–1868,2006.