ODISHA 2014
70
GOVERNMENT OF ODISHA PRICE STATISTICS OF ODISHA 2014 DIRECTORATE OF ECONOMICS AND STATISTICS, ODISHA, BHUBANESWAR
-
Upload
khangminh22 -
Category
Documents
-
view
6 -
download
0
Transcript of ODISHA 2014

GOVERNMENT OF ODISHA
PRICE STATISTICS OF
ODISHA 2014
DIRECTORATE OF ECONOMICS AND STATISTICS, ODISHA, BHUBANESWAR
From Director’s Desk
The present Report “ Price Statistics of Odisha” has
been prepared with the intention to present a comprehensive
picture of price trends at state level and at national level on
annual basis. An attempt has been made in this report to place
the data on Prices and Index Numbers at one place and to
bring the same in the form of Annual Report. It reflects the
movement of prices and indices over a period of time based on the data col-
lected from different sources of Odisha and India.
I hope the data presented in this Report will be of great help to the ad-
ministrators, planners and general public in the formulation of Policies relat-
ing to Price.
I would like to record my appreciation for the untiring efforts made by
the officers and staff of Price Division of this Directorate to bring out this
publication .
Any suggestions for further improvement of this Publication will be
highly appreciated.
(D. Behera)
Director Economics and Statistics,
Odisha

OFFICIALS ASSOCIATED
1. Sri S. R. Mahanta Joint Director
2. Sri S. S. Satpathy Deputy Director
3. Sri B. Rout Assistant Director
4. Sri B. Bhoi Statistical Investigator
5. Smt. Anita Dash Statistical Assistant
6. Sri H. H. Panda Statistical Assistant

CONTENTS Pages
LIST OF TABLES
LIST OF FIGURES
LIST OF ABBREVIATIONS USED
1 INTRODUCTION 7
2 CONCEPTS, DEFINITIONS & METHODOLOGY 11
3 FARM HARVEST PRICES & WHOLESALE PRICES 14
4 RURAL RETAIL PRICE 23
5 LIVE STOCK, LIVE STOCK PRODUCTS & BY PRODUCTS 26
6 CONSUMER PRICE INDEX (STATE SERIES ) 31
7 CONSUMER PRICE INDEX ( CENTRAL SERIES) 36
8 CONSUMER PRICE INDEX (INDUSTRIAL WORKERS) 42
9 CONSUMER PRICE INDEX (AGRICULTURAL
LABOURERS & RURAL LABOURERS ) 50
10 WHOLE SALE PRICE INDEX OF INDIA 59

2
LIST OF TABLES
Table
No.
Title Page
No.
3.1.1 Annual State Weighted Average Farm Harvest Prices of 13 principal Agricultural crops in Rs per Qtl.)
14
3.2.1 Annual State Weighted Average Wholesale Prices of 13 principal Agricultural crops (in Rs per Qtl.)
16
3.3.1 The Minimum Support Price, Weighted Farm Harvest Price & Wholesale Price of Paddy along with their growth rates.
19
3.3.2 Year wise Nominal FHP, Nominal WP and Real FHP & Real WP of Paddy along with growth .
20
3.3.3 The Growth Rate & Coefficient of Variation of Farm Harvest Prices & Wholesale Prices of Paddy from 2000-01 to 2011-12
21
4.1.1 Annual State Average of Rural Retail Prices of 13 essential commodities ( in Rs per Kg/ litre )
23
4.1.2 District wise Rural Retail Price (Annual) of year 2012-13 ( in Rs per Kg/ litre )
25
5.1.1 Annual State Average Prices of Animals and Birds in Odisha (In Rupees)
26
5.2.1 Annual State Average Producers Price of Meat, Fish, Egg and Milk & Milk Products in Odisha (In Rupees)
27
5.3.1 Annual State Average Producer's Price of Animal products and by-products in Odisha (In Rupees)
29
5.4.1 Annual State Average Wholesale Price of different Cattle Feeds Molaces ( Gur ), Salt in Odisha
30
6.1 Consumer Price Index Numbers for Rural Odisha (Base: 2006 - 07)
33
6.2 Monthly Consumer Price Index (Rural) of the State for the Year 2012-13
35
7.1 Weights of Rural CPI (Central series) 36
7.2 Weights of Urban CPI (Central series) 36
7.3 Odisha Consumer Price Index (Base 2010=100) (Central Series)
38

3
LIST OF TABLES
Table
No.
Title Page
No.
7.4 All India Consumer Price Index ( Base 2010=100 ) 39
7.5 Final All India Annual Inflation rates (%) for March 2014 41
8.1 All India Weights of CPI (IW) 43
8.2 Consumer Price Index Numbers for Industrial workers : (Base 2001=100)
45
8.3 Month wise CPI (IW) General Index & Food Index for the year 2013
46
8.4 Point to point rate of Inflation in CPI (IW) India 49
9.1.1 All India Weights of CPI (AL) 51
9.1.2 Consumer Price Index Numbers for Agricultural Labourers (Base Year 1986-87 = 100 )
52
9.2.1 All India Weights of CPI (RL) 55
9.2.2 Consumer Price Index for Rural Labourers (Base year: 1986-87=100 )
56
10.1 Statement of weights, No .of items covered & quotations made in WPI
59
10.2 Wholesale Price Index (Base: 2004-05=100 ) 61
10.3 Annual Percentage (%) Variation of WPI. 62
10.4 Weights of major Food Article Group of WPI 63
10.5 Annual % Variation of Food Article Groups of WPI 63
10.6 Monthly Wholesale Price Index Numbers 2013 (Base Year 2004-05=100)
65

4
LIST OF FIGURES
Figure
No. Title Page No
3.1.1 Growth of State Weighted Average Farm Harvest Prices of principal Agricultural crops over 5 years
15
3.2.1 Growth of State Weighted Average Wholesale Prices of principal Agri-cultural crops over 5 years
17
3.3.1 The MSP, Weighted FHP & Weighted WP of Paddy. 18
3.3.2 Growth rate of MSP, FHP & WP of Paddy 19
3.3.3 Nominal & Real Weighted Farm Harvest Prices of Paddy 20
3.3.4 Nominal & Real Weighted Wholesale Prices of Paddy 21
3.3.5 Coefficient of variations in respect of Weighted FHP & Weighted WP of Paddy.
22
4.1.1 Growth of Annual Average Rural Retail Prices of some essential com-modities over 5 years
24
5.2.1 Growth of Annual State Average Producers price of Meat, Fish, Egg and Milk & Milk Products in Odisha over 5 years
28
5.4.1 Growth of Annual State Average Wholesale price of different Cattle Feeds, Molaces (Gur), Salt in Odisha over 5 years.
30
6.1 Odisha Weights CPI Rural (State Serieas) 31
6.2 Consumer Price Index numbers for rural Odisha 33
6.3 Inflation rate of CPI for Rural Odisha (State Series) 34
6.4 CPI Rural Odisha for 2012-13 (State Series) 35
7.1 All India & Odisha Weights for CPI Rural (Central Series) 36
7.2 All India & Odisha Weights for CPI Urban (Central Series) 37
7.3 All India Consumer Price Index (Base : 2010=100) 40
7.4 Odisha Consumer Price IndexBase : 2010=100) 40
7.5 All India Annual Inflation rates (%) of CPI (Combined) for March' 2014. 41
8.1 Group Weights of CPI (IW) 43
8.2 General Index of CPI (IW) 44
8.3 Growth rate of CPI (IW) General Index 44

5
LIST OF FIGURES
Figure
No. Title Page No
8.4 Monthwise CPI (IW) General Index for the year 2013 47
8.5 Monthwise CPI (IW) Food Index for the year 2013 47
8.6 Point to point Inflation rate of CPI (IW) Base : 2001=100 48
9.1.1 Group Weights CPI (Agricultural Labourers) 51
9.1.2 General Index of Agricultural Labourers for Odisha 53
9.1.3 General Index of Agricultural Labourers for All India 53
9.1.4 Food Index of Agricultural Labourers for Odisha 54
9.1.5 Food Index of Agricultural Labourers for All India 54
9.2.1 Group Weights CPI (Rural Labourers) 55
9.2.2 General Index of Rural Labourers of Odisha 57
9.2.3 General Index of Rural Labourers of All India 57
9.2.4 Food Index of Rural Labourers of Odisha 58
9.2.5 Food Index of Rural Labourers of All India 58
10.1 Weights for WPI 60
10.2 WPI of India for the period from 2007-08 to 2012-13 60
10.3 Year wise Inflation Rate(%) of WPI in respect of All commodities & other groups
61
10.4 Sub-group weights of Primary article group 62
10.5 Comparision of Inflation Rate among FA,NF,F&P,AC of WPI 62
10.6 Weights of major Food Article group of WPI 63
10.7 Inflationary trends of major sub-groups of Food Group of WPI 64
10.8 Monthly Index of WPI for the year 2013 66

6
ABBREVIATIONS USED
Abbreviation Meaning
CSO Central Statistical Office
OEA Office of the Economic Advisor
MOSPI Ministry of Statistics & Program Implementation
NSSO National Sample Survey Organisation
NSS National Sample Survey
CPI Consumer Price Index
WPI Wholesale Price Index
IW Industrial Worker
AL Agricultural Labourers
RL Rural Labourers
FA Food Article
NF Non - Food Article
F&P Fuel & Power
AC All Commodity
FHP Farm Harvest Price
PP Producers’ Price
WP Wholesale Price
RP Retail Price
RRP Rural Retail Price
URP Urban Retail Price

7
CHAPTER 1
Introduction
Prices affect all sections of society and as such Price Statistics are regarded as the most
important economic data which reflect the changes in economic activities. Prices influence both
quantum and pattern of consumption. As such price stability is essential for sustaining the
momentum of growth and ensuring proper distribution of the benefits of development. This is
considered world-over as a crucial pre-condition for sustained growth in economic activity and
employment. Therefore it is absolutely essential to keep a constant watch on price behaviour.
Moreover analysis of data on prices is an important component in the monitoring of progress and
health of an economy. The Time Series Data on various prices are of immense use for building up
different economic indicators and models through which the oscillation of the economy could be
perceived. The prices of goods that come across in the market are of different types. Important of
them are wholesale prices, retail prices and other prices such as statutory prices, spot prices of
bullion and security prices. Variants of the above categories of prices are producer prices, factory
gate prices, farm harvest prices, procurement prices, retail prices, etc.
The changes in prices over a period of time can be gauged by the statistical device of Index
Numbers of prices. They are closely watched indicators of macro-economic performances as they
give a sense of the overall direction and trend in prices. It is an indicator of the average price
movement over time of a fixed basket of goods and services. They are also used as deflators in
providing summary measures of the volume of goods and services produced and consumed .Thus
price indices are important tools in the design & conduct of monetary & fiscal policy of the
Govt. The item basket of goods and services is determined in view whether the changes are to be
measured in retail, wholesale or producer prices etc. The basket will also vary for economy-wide,
regional, or sector specific series. The price indices are available for different sectors and for
different groups of people.
At present, separate series of index numbers are being compiled to capture the price
movements at retail and wholesale level in India. They are broadly Wholesale Price Index
(WPI) and Consumer Price Index (CPI). Both these indices are the weighted average prices of
a specified set of goods and services.

8
Wholesale Price Index (WPI) is based on the price prevailing in the wholesale markets
or the price at which bulk transactions are made. It is the price of a representative basket of
wholesale goods which focuses on the price of goods traded between corporations, rather than
goods bought by consumers, which is measured by the Consumer Price Index. The purpose of
the WPI is to monitor price movements that reflect supply and demand in industry,
manufacturing and construction sectors.
Consumer Price Index (CPI) measures changes over time in general level of prices of
goods and services (generally known as consumption basket) that a reference population
acquire, use or pay for consumption . It is obtained by comparing through time, the cost of a
fixed basket of commodities purchased by consumers. CPI reflects a price change for a
constant market basket of goods and services from one period to the next within the same area
(city, region, or nation).
It is based on the average prices of goods at the retail level .The CPIs are compiled
using the retail prices of the commodities and services generally consumed by the target
population for each index . The weights for the CPI are derived from the consumption pattern
reflected by family living/ household consumer expenditure survey conducted from time to
time covering the target population .
There are five CPIs compiled and released at national level on monthly basis. These are
CPI for Industrial Workers (IW), CPI for Agricultural Labourers (AL), CPI for Rural
Labourers (RL), and CPI (Rural) & CPI (Urban). While the first three are compiled by the
Labour Bureau in the Ministry of Labour and Employment, the fourth & fifth are compiled by
the Central Statistical Office (CSO) in the Ministry of Statistics and Programme
Implementation, New Delhi. The Wholesale Price Index (WPI) is compiled and released at
national level by the Office of the Economic Adviser (OEA) in the Ministry of Industry on
weekly basis.
The Directorate of Economics and Statistics, Government of Odisha collects data on
prices and compiles the Consumer Price Index Numbers to meet the requirement of both
Central and State Governments and for estimation of Gross State Domestic Product (GSDP) as
well as also to provide feedback price data to different State Govt. Agencies and other linked
stake holders for policy making purpose.

9
In Odisha Price Collection scheme is in operation since 1975 . At present, the following
prices are being collected :
1. Farm Harvest Price
3. Wholesale Price of Agricultural Goods
4. Rural Retail Price
5. Urban Retail Price
6. Producers’ price of live stock & their product
7. Wholesale price of cattle feed
1.1 Objective The price data is being collected through different schedules in Odisha with the following
objectives:
To collect and compile Price Statistics.
To study price movement of various commodities.
To prepare State Weighted Average Farm Harvest Price for onward transmission to the
Ministry of Agriculture, Government of India, New Delhi.
To prepare Annual State Weighted Average Wholesale Price to be used in different
publications like Economic Survey of Odisha, Statistical Abstract and for the compilation
of State Domestic Product as well as District Domestic Product.
To prepare the monthly Consumer Price Index (Rural) & (Urban) of the State as per
instruction and guidance of the C.S.O.
To prepare the Annual State Average price & District Average price on Live Stocks, its
products and by- products, cattle feed for the compilation of State Domestic Product as
well as District Domestic Product.
1.2 Coverage
The entire State covering all Subdivisions and almost all crops produced in the State along
with other items and items on various domestic animals and birds, animal products and
by-products, meat, fish, egg, milk and milk products are brought under the scope of price
collection.

10
1.3 Selection of Primary Markets
116 Primary Markets @ 2 per Subdivision on random basis out of the important markets
having superiority over other markets from the point of view of transaction of agricultural
produce and one retail shop having more grocery items & maximum transaction for each
Primary market have been selected for collection of Rural Retail Price.
1.4. Selection of Feeding Villages
One feeding village preferably nearer to the Primary Market having the variety of crops
growing area and transaction of Marketable surplus with strong agricultural base has been
selected for each Primary Market for collection of Farm Harvest Price & Producer’s price. In this
process 116 feeding villages have been selected covering thirty Districts of the State and these 116
feeding villages are tagged with 116 primary markets.
1.5. Base Period & Reporting Agencies of different Indices
Sl.no Name of the Index Base Year Reporting Agency
1 Consumer Price Index Numbers
for Rural areas of Odisha (State
Series)
2006-07 =100 Directorate of Economics & Statis-
tics, Odisha, BBSR.
2 Consumer Price Index Numbers
for Rural, Urban & Combined
(Central Series)
2010=100. CSO, MOSPI, India.
3 Consumer Price Index Numbers
for Industrial Workers
2001=100 Labour Bureau, Simla.
4 Consumer Price Index Numbers
for Agricultural Labourers.
1986-87=100 Labour Bureau, Simla.
5 Consumer Price Index Numbers
for Rural Labourers.
1986-87=100 Labour Bureau, Simla.
6 Wholesale Price Index of India 2004-05=100 Office of the Economic Adviser
(OEA), India
11
CHAPTER 2
Concepts, Definitions & Methodology
2.1. Farm Harvest Price Farm Harvest Price is the average price at which the commodity is disposed off by the
producers in bulk quantities at the village site during the specified harvest period i.e. within 6-8
weeks of harvest.
2.2. Wholesale Price
Wholesale price is the price at which a relatively large transaction usually for further sale is
effected by the wholesaler. This includes the trade margin and transportation cost paid by the
wholesaler.
2.3. Retail Price It is the Price paid by the ultimate consumer to the retailer. Generally the retail prices of
commodities include the trade margin and transportation cost paid by the retailer.
2.4. Peak Marketing Period Peak Marketing period is the period during the year at which most of the producers
generally dispose off their produces. Usually this is the period of six to eight weeks after com-
pletion of the harvest during which farmers are generally expected to dispose off their produce.
2.5. Wholesale Price Index Wholesale Price Index represents the price of goods at a wholesale stage i.e. goods that are
sold in bulk and traded between organizations instead of consumers. WPI is used as an
important measure of inflation in India. Fiscal and monetary policy changes are greatly influenced
by changes in WPI.

12
2.6. Consumer Price Index
The consumer price Index for a particular period is the money outlay necessary to
procure the same quantity of goods & services of the same quality at that period with that
during a reference period. The change measured by the index is calculated month after month
with reference to that particular reference period known as the Base Year.
2.7. Methodology for Compilation of CPI
2.7.1 Item Basket
The first step in the construction of an index is to select the item basket i.e. a
representative basket of items selected on the basis of their relative importance. Keeping in view
the infrastructural facilities and manpower available in the District Statistical Offices, 219 items
divided in different Groups/ Sub-groups have been included in the Item Basket for preparation of
weighting diagram.
2.7.2 Weighting Diagram
Weighting diagram gives the share of each item considered in the total consumption
expenditure. The weighting diagrams for the current CPI series have been derived on the basis of
average monthly consumer expenditure of an urban/ rural household obtained from the NSS 61st
round Consumer Expenditure Survey data (2004-05). Only consumption expenditure has been
considered for the purpose of preparation of weighting diagrams. Non-consumption expenditure
has been excluded.
2.7.3 Classification of Items of Consumption
After exclusion of non-consumption expenditure from the average monthly
consumption expenditure, the remaining items were classified into several consumption groups
and subgroups considering Classification of Individual Consumption according to Purpose. The
standard classification followed by CSO has been adopted in the existing CPI numbers com-
piled at State level.
13
2.7.4 Collection of Price Data
Prices are being collected for different items included in the Item Basket by personal
interview method from the shop keepers/ vendors of the selected primary market/ Block
Headquarter on monthly basis during the last week on fixed market day of every month by the
Primary Investigators of the Directorate.
2.6.5 Methodology adopted in compilation of CPI
The Consumer Price Index on monthly basis with reference to the base year 2006-2007 is
compiled by adopting Laspayer’s method. The index is compiled at item, sub-group, group levels
and the general index is also is compiled for the rural population of the State.
The item wise State Annual Average Price for the base year 2006-2007 ( July,2006 to
June,2007 ) has been derived from the rural retail price data collected on monthly basis from 116
selected primary markets of the State. The item wise State Monthly Average Price for the given
month is derived from the price data collected on monthly basis from the selected 116 centers.
The item wise Price Relative is derived as Pi = Pi1/Pi0 x 100 ,
where
Pi = Price Relative of ith item , i = 1,2,3,………….
Pi1= Price for the given month of ith item
Pio= Price for the base year 2006-2007 of ith item &
The Consumer Price Index at sub-group, group levels and general level is given by
I = Σ Wi Pi / ΣWi , where
I = Consumer Price Index ,
Wi = Weight assigned to ith item
Pi = Price relative of ith item .

14
CHAPTER 3
Farm harvest Prices & Wholesale Prices
3.1: State Weighted Average Farm Harvest Prices
Farm Harvest Price is defined as an average price at which the commodity in bulk is
disposed off by the producer at the village site during the specified harvest period. Farm Harvest
Price is being collected within 6-8 weeks of harvest for both Kharif and Rabi Seasons. These
Prices are collected in respect of 74 agricultural crops. Out of those, the major thirteen Agriculture
Commodities are 1. Paddy, 2. wheat, 3.Maize, 4.Ragi, 5..Mung, 6. Biri, 7. Kulthi, 8. Til,
9. Mustard, 10. Groundnut, 11. Jute, 12. Potato and 13. Sugarcane.
Table : 3.1.1
Annual State Weighted Average Farm Harvest Prices of
13 Principal Agricultural Crops (Rupees / Quintal)
Sl.
No
Name of the
Crops
2008-09 2009-10 2010-11 2011-12 2012-13 Growth over 5
yers
1 Total Paddy 779 896 932 984 1069 37.23
2 Wheat 1193 1191 1335 1376 1408 18.02
3 Maize 773 869 804 969 923 19.40
4 Ragi 801 961 932 1005 1118 39.58
5 Mung 2871 3339 3729 3835 4206 46.50
6 Biri 2558 3242 3578 3759 3870 51.29
7 Kulthi 1366 1598 1805 19296 2120 55.20
8 Til 3012 3075 3048 3206 3311 9.93
9 Mustard 2835 2908 3047 3197 3469 22.36
10 Ground Nut 2339 2220 2274 2370 2409 2.99
11 Jute 1350 1350 1671 2704 2717 101.26
12 Potato 672 546 614 654 733 9.08
13 Sugarcane 95 105 117 131 145 52.63

15
The State Weighted annual average Farm harvest prices of the agricultural crops are being
calculated by giving their district wise production as the weights and are used by the State Income
Unit, Directorate of Economics & Statistics, Odisha for estimation of GSDP of Odisha.
The weighted average “Farm Harvest Price” of the above major thirteen Agriculture
Commodities for the years 2007-08 to 2012-2013 along with their growth over 5 years is placed at
Table : 3.1.1. It is analytically studied that the prices of paddy, wheat, maize, ragi, Mung, Biri,
kulthi, Til, mustard, groundnut, jute, potato and sugarcane are in the increasing trend starting from
the year 2008-09 to year 2012-13.
The above figure (3.1.1) depicts the overall growth of Annual State Weighted average
Farm harvest prices of the 13th essential agricultural crops from the year 2008-09 to 2012-13. It is
observed from the figure that among the cereals, the growth rate of paddy, wheat, maize, and ragi
are 37.23%, 18.02%, 19.40% & 39.58% respectively. The growth of all the pulses crops like
mung, biri & kulthi are higher than the cereal items. The growth of the Oil seed like mustard is
22.36% as against 9.93% & only 2.99% (the lowest percent among all) in respect of til and
groundnut seeds. It is surprising that the price of cash crop jute has raised substantially showing
the growth rate of 101.26% (highest among all) during these years where as the growth of
sugarcane as well as potato are about 52.63% and 9.08% respectively.

16
3.2: State Weighted Average Whole Sale Prices
Wholesale price is the price at which a relatively large transaction usually for further sale is
effected by the wholesaler. This includes the trade margin and transportation cost paid by the
wholesaler.
The collection of these prices are made in the primary market centre itself from the traders
involved in the transaction of bulk commodities.
The Wholesale Prices for thirteen major Agriculture Commodities received from Primary
market centers of the districts are being scrutinized and State weighted Average of Wholesale
Prices are worked out regularly by the Directorate of Economics & Statistics.
Table : 3.2.1
Annual State Weighed Average Wholesale Pries of 13 Principal Agricultural
Crops (Rupees / Quintal)
Sl.
No
Name of the
Crops
2008-09 2009-10 2010-11 2011-12 2012-13 Growth over 5
yers
1 Total Paddy 891 930 955 1045 1165 30.75
2 Wheat 1260 1352 1429 1449 1506 19.52
3 Maize 950 941 886 997 1072 12.84
4 Ragi 891 1143 965 1058 1185 33.00
5 Mung 3140 3861 4082 4028 4384 39.62
6 Biri 3087 3694 3872 3845 4002 29.64
7 Kulthi 1610 1938 2040 2071 2310 43.48
8 Til 3575 3386 3324 3332 3445 - 3.645
9 Mustard 3109 3153 3179 3324 3651 17.43
10 Ground Nut 2351 2519 2451 2628 2807 19.40
11 Jute 1400 1525 2600 2771 2777 98.36
12 Potato 748 652 715 695 790 5.61
13 Sugarcane 95 125 131 142 164 72.63

17
The State Weighted annual average Wholesale prices of the agricultural crops are being
calculated by giving the district wise production as the weights. The weighted average Wholesale
Prices of these major thirteen Agriculture Commodities for the years 2008-09 to 2012-2013 is
placed at Table: 3.2.1. The figure 3.2.1 is the graphical representation of the table 3.2.1.
As observed from the above figure, the growth rates of all the principal crops like paddy,
wheat, maize, ragi, Mung, Biri, kulthi, mustard, groundnut, jute, potato and sugarcane shows the
positive trend such as 30.75%, 19.52%, 12.84%, 33%, 39.62%, 29.64%, 43.48%, 17.43%,
19.40%, 98.36%, 5.61% & 72.63% respectively except the crop til that shows the negative growth
(-3.64%) over these 5 years.
3.3.Price Behaviours of Paddy
The importance of agriculture in the economy of our state need to be emphasized. About
62% of the total working population of the State depends upon agriculture for their livelihood.
Most of them live in rural area. The share of agriculture in the estimation of Gross State Domestic
Product (GSDP) is about 15%. As such, agricultural population occupies a strategic position in
the State’s economy.

18
Therefore major developmental programs implemented during various plan periods were primarily
designed to raise the standard of living of the people and top priority are given to agricultural
development so that economic condition of the farmers would be improved. Paddy is the major
crop as more than 70% of the farmers of rural Odisha are producing the crop both in the winter as
well as summer seasons and generally earn their livelihood.
To analyze the behaviour of prices, the first indicator is the Minimum Support Price,
which “sets the floor below which prices should not be allowed to fall.” (Tyagi -1990). Based on
the recommendations made by the Commission for Agricultural Costs and Prices (CACP), the
government announces the Minimum Support prices (MSP) in every year to assure the producer
that the price of his produce will not be allowed to fall below a certain minimum level. The
Minimum Support Price sets the floor of both Farm harvest as well as Wholesale price. The Farm
Harvest prices (FHP) are the prices that the farmer directly get from the sell of his products. It
includes the cost of cultivation as well as the minimum profit of the farmers. These prices prevail
during six to eight weeks of harvesting period and Wholesale prices (WP) are those which prevail
in the Wholesale markets.
The time series annual data from the year 2000-01 to 2011-12 in respect of Paddy has been
taken for the study. The annual state weighted average Farm harvest price as well as Wholesale
prices of Paddy (collected from the Feeding Villages/ primary markets/ Mundies of Rural areas)
have been taken from Directorate of Economics & Statistics, Odisha.
Fig: 3.3.1

19
Table : 3.3.1
The Minimum Support Price, Weighted Farm Harvest Price & Wholesale Price of
PADDY along with their growth rates.
First stage The MSP, FHP and WP of Paddy along with the growth rates have been depicted in the
Table 3.3.1 separately. So far as the crop paddy is concerned, it is observed that from the begin-
ning to the end, the Minimum Support Price (MSP) is always above the Farm harvest price (FHP)
except in the year 2007-08. The Wholesale Prices are always higher than the Farm Harvest prices
over the twelve years. The gap between the WP & FHP is wider in the year 2007-08 where the
FHP > MSP. The reason behind this is that more than 70% of the farmers of rural Odisha are pro-
ducing the crop Paddy in both the winter as well as summer seasons and generally earn their live-
lihood from it. They sell their produces in lower prices in the harvesting periods to meet their basic
needs. As a result, the standard of living of the farmers are not improving in relation to the
growth of the other communities of the society.
Year MSP Weighted
FHP Weighted WP Growth
MSP
Growth
FHP Growth WP
2000-01 510 400.92 443.89
2001-02 530 390.52 425.13 3.9 -2.6 -4.2
2002-03 530 387.93 453.92 0.0 -0.7 6.8
2003-04 550 417.08 430.31 3.8 7.5 -5.2
2004-05 560 468.95 490 1.8 12.4 13.9
2005-06 570 482 515 1.8 2.8 5.1
2006-07 580 472.68 547 1.8 -1.9 6.2
2007-08 645 672.76 820 11.2 42.3 49.9
2008-09 850 779.31 891 31.8 15.8 8.7
2009-10 1000 895.84 930.29 17.6 15.0 4.4
2010-11 1000 932.28 955.47 0.0 4.1 2.7
2011-12 1080 984.2 1045.01 8.0 5.6 9.4
Fig: 3.3.2

20
So far as the growth rate is concerned, it is observed from the figure 3.3.2 that the growth
of Paddy in respect of MSP, FHP and WP are more fluctuating in the 2nd half of the time series
(2006-07 to 2011-12) as compared to the 1st six years (2000-01 to 2005-06) data. In the year
2007-08, there is the highest amount of growth of FHP (42.3 %) & WP (49.9%) as compared to
other years.
Second Stage
Further, to observe minutely the variability in the price behavior of Paddy, both the
Nominal and the Real Weighted Farm Harvest Prices and the Wholesale Prices have been taken in
to account. The nominal prices are deflated by the whole sale price index of the corresponding
group to derive the corresponding real prices. It is observed from the figure 3.3.3 and figure 3.3.4
that the gap between the nominal prices and real prices has been becoming wider from the year
2008-09 onwards in respect of the Farm Harvest Prices and Wholesale Prices.
Table : 3.3.2
Year wise Nominal FHP, Nominal WP and Real FHP & Real WP of PADDY
along with growth
Year Nominal FHP
Growth Nominal
FHP
Real FHP Growth Real FHP
Nominal WP
Growth Nominal WP
Real WP Growth Real WP
2000-01 400.92 245.02 443.89 271.28
2001-02 390.52 -2.59 231.02 -5.72 425.13 -4.23 251.49 -7.30
2002-03 387.93 -0.66 219.28 -5.08 453.92 6.77 256.58 2.02
2003-04 417.08 7.51 228.07 4.01 430.31 -5.20 235.30 -8.29
2004-05 468.95 12.44 248.60 9.00 490 13.87 259.76 10.40
2005-06 482 2.78 245.39 -1.29 515 5.10 262.19 0.93
2006-07 472.68 -1.93 221.21 -9.85 547 6.21 255.99 -2.36
2007-08 672.76 42.33 292.50 32.23 820 49.91 356.52 39.27
2008-09 779.31 15.84 310.22 6.06 891 8.66 354.69 -0.51
2009-10 895.84 14.95 313.20 0.96 930.29 4.41 325.25 -8.30
2010-11 932.28 4.07 266.41 -14.94 955.47 2.71 273.03 -16.05
2011-12 984.2 5.57 255.05 -4.26 1045.01 9.37 270.81 -0.82
Fig: 3.3.3

21
In case of the Farm Harvest Prices as well as the Wholesale Prices of Paddy, the Nominal
Prices of Paddy shows the increasing trend where as the Real prices shows the decreasing trend
except in the year 2007-08 & 2008-09. In most cases (especially in the year 2010-11 & 2011-12),
very positive growth in the nominal prices of paddy has been observed with corresponding
negative growth in the real prices.
Third Stage
In this stage, the Average Annual growth rates and the Coefficient of Variations of the crop
Paddy in respect of FHP & WP from the beginning to end of the time series (2000-01 to 2011-12)
have been calculated separately for the nominal as well as the real prices. It has been observed
from the table 3.3.3 and the figure 3.3.5 that the coefficients of variations (CV) in the cases of
nominal prices are more than that of the real prices of Paddy. In other words, the variability in case
of nominal prices are more than the real prices. This implies that the fluctuations in the price
trends of Paddy are mainly due to the inflationary changes rather than the real changes.
Table : 3.3.3
The Growth Rate & Coefficient of Variation of Farm Harvest Prices & Whosale
Prices of Paddy from 2000-01 to 2011-12
% of Growth Rate Coefficient of variation
Nominal Real Nominal Real
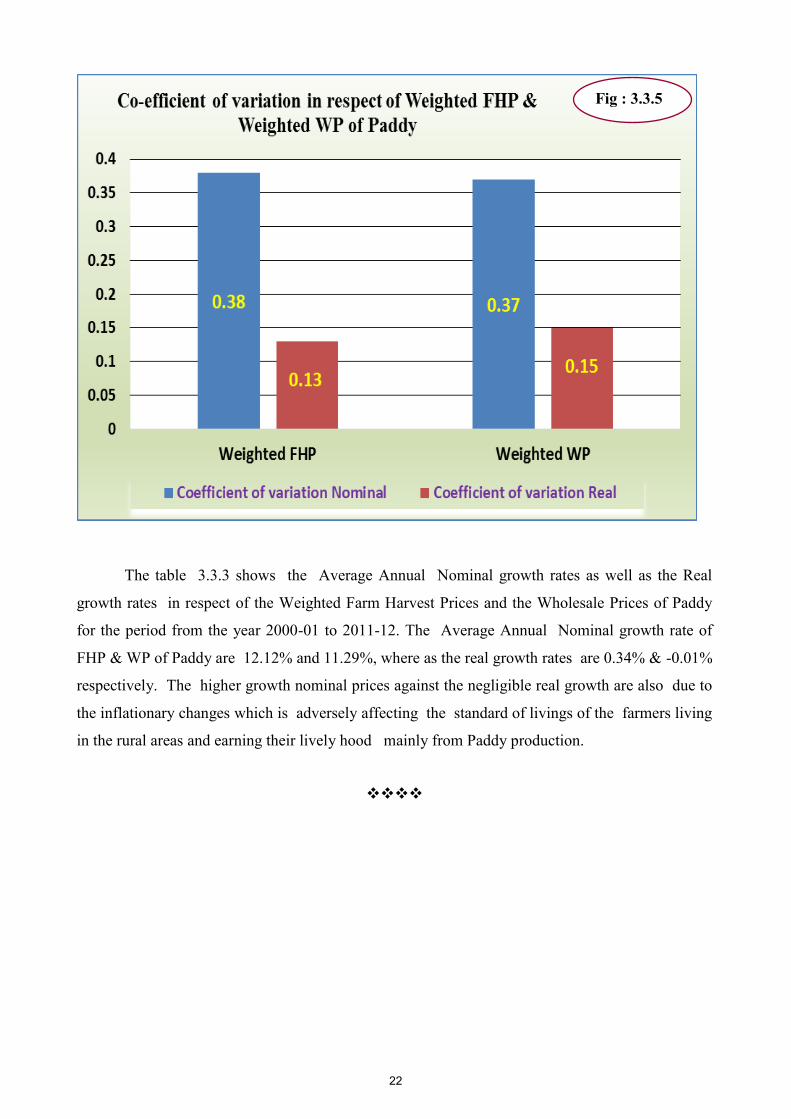
Weighted FHP 12.12 0.34 0.38 0.13
Weighted WP 11.29 -0.01 0.37 0.15
Fig: 3.3.4
22
The table 3.3.3 shows the Average Annual Nominal growth rates as well as the Real
growth rates in respect of the Weighted Farm Harvest Prices and the Wholesale Prices of Paddy
for the period from the year 2000-01 to 2011-12. The Average Annual Nominal growth rate of
FHP & WP of Paddy are 12.12% and 11.29%, where as the real growth rates are 0.34% & -0.01%
respectively. The higher growth nominal prices against the negligible real growth are also due to
the inflationary changes which is adversely affecting the standard of livings of the farmers living
in the rural areas and earning their lively hood mainly from Paddy production.
Fig : 3.3.5

23
CHAPTER 4
Rural Retail price
4.1 Annual Average Rural Retail Price
Retail price is the Price paid by the ultimate consumer to the retailer. Generally the retail
prices of commodities include the trade margin and transportation cost paid by the retailer. The
prices, being collected from the selected retail shops of the rural primary markets are known as
rural retail price. These Prices are collected in respect of 219 consumable items comprising of 24
different groups/ sub-groups.
Annual State Average of Rural Retail Prices for thirteen essential commodities of the State
for the years 2008-09 to 2012-13 along with its overall growth rates in these years is depicted in
Table : 4.1.1
Table:4.1.1
Annual State Average of Rural Retail Prices of 13 essential commodities
( Rupees / Kg/ litre )
Sl. No Item Name 2008-09 2009-10 2010-11 2011-12 2012-13 growth over
5years
1 Rice 13.03 14.12 16.41 17.42 18.64 43.05
2 Atta 17.16 18.37 19.26 19.77 21.82 27.16
3 Mung dal 45.59 74.02 71.57 68.55 71.13 56.02
4 Arhar dal 49.27 78.67 68.87 67.21 70.81 43.72
5 Mustard oil 77.4 71.94 74.63 83.75 99.01 27.92
6 Groundnut oil 69.62 70.58 77.59 90.06 101.73 46.12
7 Coconut oil 102 109.29 123.47 147.88 169.78 66.45
8 Salt 8.42 9.25 9.67 10.58 11.39 35.27
9 Potato 8.67 12.77 9.19 10.12 14.7 69.55
10 Onion 14 16.04 19.56 13.89 19.55 39.64
11 Sugar 22.93 35.62 33.24 33.75 38.17 66.46
12 Gur 23.82 37.31 36.17 35.42 39.96 67.76
13 Kerosene oil 19.07 21.41 24.1 26.57 28.21 47.93
24
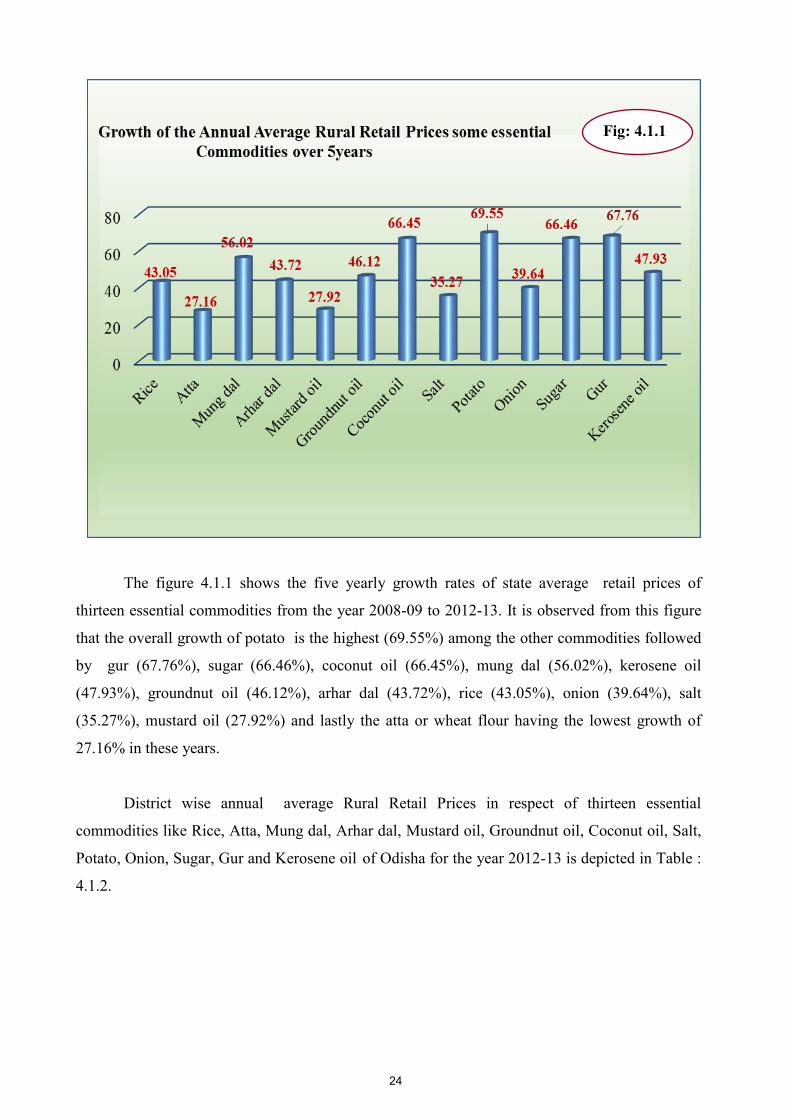
The figure 4.1.1 shows the five yearly growth rates of state average retail prices of
thirteen essential commodities from the year 2008-09 to 2012-13. It is observed from this figure
that the overall growth of potato is the highest (69.55%) among the other commodities followed
by gur (67.76%), sugar (66.46%), coconut oil (66.45%), mung dal (56.02%), kerosene oil
(47.93%), groundnut oil (46.12%), arhar dal (43.72%), rice (43.05%), onion (39.64%), salt
(35.27%), mustard oil (27.92%) and lastly the atta or wheat flour having the lowest growth of
27.16% in these years.
District wise annual average Rural Retail Prices in respect of thirteen essential
commodities like Rice, Atta, Mung dal, Arhar dal, Mustard oil, Groundnut oil, Coconut oil, Salt,
Potato, Onion, Sugar, Gur and Kerosene oil of Odisha for the year 2012-13 is depicted in Table :
4.1.2.
Fig: 4.1.1

25
Table : 4.1.2
District wise Rural Retail Price (Annual) for the year 2012-13( in Rs per Kg/ litre )
Sl
No
District
Name Rice Atta Mung
dal
Arhar
dal
Mus-tard
oil
Groundnut
oil
Coco-
nut oil Salt Potato Onion Sugar Gur Kero-
sene
oil
1 Anugul 20.11 21.88 71.52 72.16 98.30 106.00 176.05 12.38 14.41 20.51 37.93 38.88 30.78
2 Balasore 18.49 20.75 72.22 71.70 97.73 102.02 169.59 11.23 14.24 19.00 38.84 40.08 30.99
3 Baragarh 19.53 21.35 71.16 71.56 98.37 104.04 160.21 11.09 14.68 18.97 37.77 39.66 28.73
4 Bhadrak 17.69 20.83 71.38 72.00 97.43 106.18 161.46 11.03 14.50 17.94 37.55 38.60 28.56
5 Balangir 18.63 21.81 69.82 71.04 100.09 102.75 165.53 11.16 14.68 20.11 39.02 40.04 26.62
6 Boudh 18.73 21.61 71.21 72.61 99.35 101.66 161.93 10.52 14.78 19.00 37.74 38.74 28.13
7 Cuttack 17.95 21.28 70.52 70.53 97.23 99.40 176.51 11.06 14.14 18.18 38.10 38.48 28.97
8 Deogarh 18.73 23.22 69.22 70.33 99.01 101.95 172.51 12.46 14.88 19.82 37.87 39.86 27.34
9 Dhenkanal 18.91 21.36 70.44 72.17 97.58 92.64 188.10 11.94 14.29 19.26 37.64 40.89 29.47
10 Gajapati 19.18 23.64 71.34 73.31 99.61 101.66 178.91 12.28 14.82 19.65 38.63 39.92 28.84
11 Ganjam 18.70 23.60 70.41 69.19 99.78 102.06 173.57 11.98 14.69 19.31 38.23 39.29 28.02
12 Jagatsinghpur
18.41 20.77 70.17 69.45 99.75 97.90 168.39 10.63 14.27 18.65 37.93 39.44 24.95
13 Jajapur 18.22 20.93 69.82 69.50 99.34 165.77 10.67 14.47 19.47 38.26 39.07 28.09
14 Jharsuguda. 19.92 21.71 71.25 67.61 100.10 168.40 12.35 14.87 19.47 37.64 41.99 26.71
15 Kalahandi 18.49 21.43 71.53 69.74 99.97 93.90 166.96 10.67 14.68 19.97 37.60 42.57 26.27
16 Kandhamal 18.27 23.76 70.58 73.22 99.58 105.24 168.87 11.05 14.56 19.32 37.55 38.31 26.65
17 Kendrapara 17.71 20.18 70.74 68.83 97.53 102.42 173.70 10.82 14.49 18.47 38.68 38.39 26.74
18 Keonjhar 18.95 21.97 71.51 69.71 100.19 105.54 170.74 11.25 14.22 20.00 39.09 42.67 30.12
19 Khurda 17.81 20.96 71.39 69.91 98.49 104.24 163.44 12.02 14.12 19.76 38.80 38.84 28.75
20 Koraput 18.08 23.04 71.63 69.74 99.40 106.51 173.41 10.94 15.24 20.38 37.60 39.19 26.81
21 Malkangiri 18.22 23.48 72.03 70.80 99.63 106.06 168.87 11.84 15.45 20.70 37.64 38.48 26.53
22 Mayurbhanj 19.22 20.49 72.32 71.18 99.33 102.25 162.81 11.82 14.56 20.06 37.86 40.67 28.89
23 Na-warangpur
17.87 22.45 72.70 70.33 99.55 103.92 174.29 10.99 15.61 19.76 38.30 39.30 31.63
24 Nayagarh 17.82 20.41 71.64 71.87 98.71 95.26 160.49 10.54 14.33 19.06 38.96 38.93 27.91
25 Nuapara 19.66 22.20 70.00 68.70 99.45 102.17 172.70 11.88 14.89 19.06 38.82 42.36 27.00
26 Puri 18.01 20.80 70.64 69.36 97.29 96.02 161.69 10.28 14.17 19.94 38.21 38.66 29.37
27 Rayagada 17.86 23.98 71.78 72.63 99.41 104.37 174.61 11.03 15.86 21.02 38.87 39.23 29.53
28 Sambalpur 19.29 21.86 71.51 71.75 99.33 100.56 175.03 12.76 14.88 19.61 37.71 42.64 28.25
29 Sonepur 19.39 22.10 70.97 71.25 99.52 99.55 166.24 11.00 14.95 20.20 38.03 41.66 28.13
30 Sundargarh 19.29 20.64 72.41 72.09 99.35 102.26 172.68 11.93 15.24 19.74 38.10 42.03 27.52

26
CHAPTER 5
Prices of Live Stock, it’s Products & By-Products
5.1 State producers’ Prices of Live stock , it’s products & by products
The Directorate of Economics and Statistics is collecting the data on prices of different
categories of Livestock, Livestock Products, Milk Products & Live Stock Feed from the District
Head quarters.
Table : 5.1.1
Annul State Average Prices of Animals and Birds in Odisha (In Rupees)
Items Specification 2008-09 2009-10 2010-11 2011-12 2012-13 Growth over 5
years
Cattle Cross Breed Male
Between 1 - 3 year 2352.86 2860.22 3227.37 3489.91 4096.74 74.12
Above 3 year 4199.42 4651.61 5532.41 5801.88 6503.26 54.86
Cattle Cross Breed Female
Between 1 - 3 year 3163.15 3646.79 4026.25 4411.80 5704.94 80.36
Above 3 years milch 6798.36 7343.17 8193.77 8708.38 9916.75 45.87
Above 3 year not calved yet 4877.50 5180.44 5532.87 5859.94 6618.12 35.69
Cattle Local Male Between 1 - 3 year 2667.24 3168.22 3744.36 4328.44 5114.97 91.77
Above 3 year 4332.45 5149.34 6130.24 6948.71 7937.5 83.21
Cattle Local Female
Between 1 - 3 year 2221.27 2803.51 2989.62 3309.01 4011.65 80.60
Above 3 years milch 4658.37 4938.69 5236.64 5545.76 6596.52 41.61
Above 3 year not calved yet 3499.73 3620.96 3643.91 3895.97 4548.38 29.96
Buffalo Male Between 1 - 3 year 2820.77 3363.70 3881.89 4273.50 5354.81 89.84
Above 3 year 5210.09 5846.73 6017.66 6780.69 8161.45 56.65
Buffalo Female
Between 1 - 3 year 2904.36 3584.28 3952.30 4370.33 5319.21 83.15
Above 3 years milch 5368.27 6171.13 6812.00 7355.82 8803.58 63.99
Above 3 year not calved yet 3987.51 4381.78 4661.91 5119.41 6139.29 53.96
Sheep Local Male Below 1 year 940.33 971.53 1079.79 1221.94 1374.59 46.18
Above 1 year 1674.29 1578.02 1681.38 1823.03 2259.55 34.96
Sheep Local Female Below 1 year 777.42 989.24 1053.17 1147.47 1290.37 65.98
Above 1 year 1516.31 1488.27 1562.43 1623.14 2004.25 32.18
Goat Local Male Below 1 year 949.03 1258.40 1412.22 1567.28 1735.72 82.89
Above 1 year 1652.11 1904.31 2233.92 2438.80 2944.49 78.23
Goat Local Female Below 1 year 859.14 1099.22 1193.76 1320.01 1508.03 75.53
Above 1 year 1448.01 1640.28 1887.26 2023.96 2423.36 67.36
Pig local male Above 1/2 year 853.14 1065.19 1205.35 1378.58 1566.62 83.63
Pig local female Above 1/2 year 822.41 1097.19 1213.91 1330.71 1504.04 82.88
Cock local Above 1/2 year 179.47 208.80 237.32 261.13 294.84 64.28
Cock improved Above 1/2 year 158.05 177.55 204.43 211.77 239.92 51.80
Hen local Above 1/2 year 121.87 161.29 182.06 201.63 235.57 93.30
Hen improved Above 1/2 year 125.22 147.22 165.57 172.51 185.29 47.97
Hen local Below 1/2 year 50.87 54.73 63.67 72.53 85.99 69.04
Hen improved Below 1/2 year 45.36 52.41 58.39 64.42 74.83 64.97
Drake local Above 1/2 year 138.74 156.50 165.75 182.82 217.88 57.04
Duck local Above 1/2 year 139.10 148.49 150.58 167.50 206.6 48.53
Duckling Below 1/2 year 62.21 63.08 66.06 72.60 92.64 48.91

27
These State Average Prices are used by the State Income Unit, Directorate of Economics &
Statistics, Odisha for estimation of GSDP of Odisha. The Statements showing the State average
Producers’ prices of selected Livestock, Livestock Products & the Wholesale prices of Live Stock
Feed form the year 2008-09 to 2012-13 with their overall growth rates are given in the Table
5.1.1. to 5.4.1.
Annual State Average Producers’ Prices of different Cattle & Birds in respect of Odisha
from the year 2008-09 to 2012-13 along with the growth rates have been quoted in the table 5.1.1.
The annual State Average Producers’ Prices of Meat, Fish, Egg and Milk & Milk Products
from the year 2008-09 to 2012-13 with the growth rates have been placed in the following table :
5.2.1
Table : 5.2.1
Annual State Average Producers Price of Meat, Fish, Egg and Milk &
Milk Products in Odisha(In Rupees)
Items Specification Unit 2008-09 2009-10 2010-11 2011-12 2012-13 Growth over
5 years
Meat
Goat Kg. 178.98 228.99 255.34 268.46 304.72 70.25
Sheep Kg. 159.47 192.02 213.97 224.81 254.84 59.80
Fowl dressed Kg. 104.38 122.23 129.05 127.33 142.56 36.58
Pig Kg. 67.84 76.59 84.49 89.60 98.65 45.42
Beef Kg. 44.88 52.01 57.92 64.38 73.63 64.06
Fish ( Fresh Water)
Big size ( above 500 gm )
Kg. 74.97 92.59 105.88 113.47 128.19 70.99
Small size (below 500gm)
Kg. 63.8 77.79 88.25 96.23 107.31 68.20
Fish (Saline Water)
Big size ( above 500 gm )
Kg. 73.33 82.45 96.58 102.41 116.74 59.20
Small size (below 500gm)
Kg. 61.43 66.12 77.86 85.90 95.43 55.35
Egg
Hen local Each 3.79 4.31 4.78 5.24 6.15 62.27
Hen improved Each 2.82 3.17 3.44 3.79 4.39 55.67
Duck Each 2.77 3.29 3.73 4.16 4.76 71.84
Milk Cow Lit 15.86 17.65 19.13 21.05 23.87 50.50
Buffalo Lit 15.73 17.37 18.94 21.34 24.74 57.28
Fats of Slaugh-ter Animals & Birds
Sheep Kg. 103.88 123.03 136.54 158.66 184.91 78.00
Goat Kg. 116.51 139.62 165.19 197.50 223.31 91.67
Pig Kg. 50.83 53.5 60.84 66.67 71.18 40.04
Cow Kg. 38.37 41.38 46.67 54.25 62.17 62.03

28
The above figure 5.2.1 depicts the overall growth rates of the annual State Average
Producers’ Prices of Meat, Fish, Egg and Milk & Milk Products from the year 2008-09 to 2012-13.
Here, it is observed that the percentage growth of animal product like goat meat has increased by
70.25% at the end of 2012-13 as compared to the year 2008-09 which is the highest increasing
trend in growth as compared to other animal meats namely sheep (59.80%), fowl (36.58%), pig
(45.42%) and beef (64.06%). On the other hand, all other items are also showing the positive
amount of growth in the aforesaid years. The average prices in respect of fish (fresh water) of big
size & small size are showing more than 50% of growth rates i.e. 70.99% & 68.20%, fish (saline
water) of big size & small size are showing growth rates of 59.20% & 55.35%, egg (hen local) ,
egg (hen improved), egg (duck) are showing the growth of 62.27%, 55.67% & 71.84%
respectively in these years. The milk and the milk products are also in the way of increasing trend
for example, the growth of cow milk and buffalo milk have become 50.50% & 57.28%. Besides,
so far as the percentage growth of the fats of slaughter animals are concerned, fats of goat has
increased by 91.67% which is the highest growth than others during the said period where as fats
of slaughter animals like sheep, pig & cow have shown 78%, 40.04% & 62.03% growth
respectively.

29
Table : 5.3.1
Annual State Average Producer's Price of Animal products and
by-products in Odisha (In Rupees)
The tables 5.3.1 reflects the Annual State Average Producer's Prices of Animal products
and by-products like head of goat & sheep, leg with hoof of goat & sheep, hide of cattle &
buffalo, skin of goat & sheep and other items like edible (consumable) & liver from the year
2008-09 to 2012-13 along with their overall growth rates in respect of Odisha. As shown in the
above table, all the above items are reflecting very positive growths during these years.
The table 5.4.1 reflects the Annual State Average Wholesale Prices of different Cattle
Feeds, Molasses ( Gur ), Salt from the year 2008-09 to 2012-13 along with their overall growth
rates in respect of Odisha. From the table, it may be concluded that all the cattle feed items have
increased every year during the period from 2008-09 to 2012-13.
Items Specification Unit 2008-09 2009-10 2010-11 2011-12 2012-13 Growth over
5 years
Head
Goat Each 71.34 80.27 93.32 106.38 115.9 62.46
Sheep Each 59.46 64.52 73.73 83.55 96.25 61.87
Leg with Hoof
Goat 4 nos 22.59 26.85 30.78 33.49 44.49 96.95
Sheep 4 nos 17.97 20.54 24.71 27.87 34.41 91.49
Hide
Cattle Each 234.49 256 283.28 345.95 418.06 78.28
Buffalo Each 233.91 264.82 295.60 334.35 370.52 58.40
Skin
Goat Each 130.9 98 116.85 138.36 185.24 41.51
Sheep Each 96.24 87.4 96.27 109.10 142.69 48.26
Edible Consumable K.g 42.16 39.14 42.47 45.75 56.39 33.75
Liver K.g 171.74 224.13 264.85 287.94 308.43 79.59

30
Table 5.4.1
Annual State Average Wholesale Price of different Cattle Feeds,
Molaces ( Gur ), Salt in Odisha
The figure 5.4.1 depicts the overall growth rates of the Annual State Average Wholesale
Prices of different Cattle Feeds, Molasses ( Gur ) & salt etc. from the year 2008-09 to 2012-13.
From this it is observed that the growth of the oil cakes shows the highest percentage i.e, 96.16%
followed by husk (88.34%), gram (60.47%), crushed pulses (51.65%), salt (45.22%), cereals
(39.74%) and the molaces (32.34%) in these five years.
Sl.
no. Items Unit 2008-09 2009-10 2010-11 2011-12 2012-13 Growth over 5
years
1 Oil cakes Qtl. 1224.02 1459.49 1664.90 1921.96 2401 96.16
2 Crushed pulses Qtl. 1045.18 1211.65 1349.05 1412.46 1585 51.65
3 Cereals Qtl. 1106.31 1273.27 1324.77 1375.03 1546 39.74
4 Gram Qtl. 1907.52 2245.74 2403.62 2567.66 3061 60.47
5 Husk Qtl. 506 692.17 748.07 808.37 953 88.34
6 Molasses Qtl. 2442.93 2667.11 2795.23 2782.28 3233 32.34
7 Salt Qtl. 348.44 398.80 420.08 458.61 506 45.22
0.00
10.00
20.00
30.00
40.00
50.00
60.00
70.00
80.00
90.00
100.00
Oil cakesCrushed pulsesCereals Gram Husk Molaces Salt
96
.16
51
.65
39
.74
60
.47
88
.34
32
.34 4
5.2
2
Growth of Annual State Average Wholesale Price of different
Cattle Feeds Molaces ( Gur ), Salt in Odisha over 5 years Fig: 5.4.1

31
CHAPTER 6
Consumer price Index (State Series)
6.1 Consumer Price Index for Rural Areas of Odisha Base Year 2006-07
(State Series)
At present Directorate of Economics and Statistics is compiling consumer Price Index for
Rural areas of Odisha.
Base Year: The year 2006-2007 has been adopted as base year considering it as a normal year
i.e. a year in which there were no abnormalities in the level of production, trade & in the price
level and price variations and also to revise the Item Basket by adding more items in order to have
the CPI more meaningful.
Selection of Markets: In order to cover the entire Rural Population of the State uniformly,
two Primary Markets from each Sub-Division which are located in the village area of the District
have been selected by simple random sampling for collection of rural retail prices. The retail
prices of selected items included in the Item Basket are being collected from 116 centers from
July,2006 to derive the base year average price for 2006-07 (July,2006-June,2007) and monthly
average price of the State from July,2007 onwards for compilation of CPI. The prices of those
items which are not available in the selected market are being collected from the nearest Block
Head quarters.
For CPI compilation, continuous monthly price data for items included in the Item Basket
right from the base year of the index & weights (expenditure shares on the items) are required for
compilation of the price relatives at the elementary aggregate level and for combining the indices
to derive higher level indices.
Fig: 6.1

32
Weighting Diagram: The consumer expenditure data collected by the DES in 61st round NSS
(July’2004-June’2005) from the rural samples of the State has been used for derivation of
weighting diagram. The different steps involved in derivation of weighting diagram are as
follows:
1. Different groups/ sub-groups have been formed by clubbing the items of consumer
expenditure schedule of 61st round NSS report .
2. The criteria that items having more than 0.04% contribution at all items level or 1% or
more contribution at sub-group level after formation of sub-group/ group or items for
which consumption reporting is more than 80% family as per the 61st round NSS report
have been adopted in selecting items in construction of Weighting Diagram
3. Some items like gram (split), lime, katha, diesel etc. with less than 1% contribution at
sub-group level have been included because of its extensive use in some area of the State.
4. Some items such as other ‘category in some sub-group’ or for which price could not be
collected for the base year or which are unmanageable in collecting price data have been
excluded from the weighting diagram.
5. Imputation has been done at Item level, Section level and Sub-group/ Group level
according to the need.
6. The Housing Sector having its average monthly expenditure of Rs 6.19, the percentage
share of which is only 0.31 % and the expenditure under legal expenses of Rs 0.39 have
been excluded from the Item Basket and their share have been distributed to all items.
7. The percentage share of expenditure of each item included in the Weighting Diagram after
imputation has been worked out and reflected in the final Weighting Diagram along with
the step wise calculation of CPI.
8. By adopting the above principle, 219 items have been included in the item Basket. The
average price of some important priced items have been taken in to account to cover the
items like “Stationary” under “Education” sub-group, “Medicine” under “Medical care” sub-
group etc. of the Weighting Diagram.
The grouping followed is as under :
Gr. 1 Food, beverages and tobacco
1.1 Cereals and cereal products
1.2 Pulses and pulses products
1.3 Oils and fats
1.4 Meat, fish and eggs
1.5 Milk and milk products
1.6 Condiments and spices
1.7 Vegetables
1.8 Fruits
1.9 Sugar, honey etc.
1.10 Non-alcoholic beverages
1.11 Prepared meals and refreshments
1.12 Pan, supari, tobacco etc.
Gr. 2 Fuel and light
Gr. 3 Clothing, bedding and footwear
3.1 Clothing and bedding
3.2 Footwear
Gr. 4 Miscellaneous
4.1 Medical care
4.2 Education
4.3 Recreation and amusement
4.4 Transport & communication
4.5 Personal care and effects
4.6 Household requisites
4.7 Others

33
The Index is separately prepared for six groups and then combined by assigning weights
to each group. The figure 6.2 represents the year wise general indices with Food, Beverages &
Tobacco group & Fuel & Light group indices from the year 2007-08 to the year 2012-13. From
this, it is seen that Food, Beverages & Tobacco index is higher than the others up to the year
2010-11. In 2011-12, the Fuel & Light index goes a little bit higher than the Food group
followed by the General index . But in the year 2012-13, the Fuel & Light index reaches at the
highest point followed by the Food Group Index and the General Index.
TABLE . 6.1
Consumer Price Index Numbers for Rural Odisha (Base: 2006 - 07)-
GROUP 2007-08 2008-09 2009-10 2010-11 2011-12 2012-13
I. FOOD , BEVERAG-
ES & TOBACCO etc. 111.86
129.57 149.61 162.91 171.94 187.56
[15.83] [15.47] [8.89] [5.54] [9.08]
IA. FOOD & BEVERAG-
ES 111.84
129.84 150.01 163 171.51 187.08
[16.09] [15.53] [8.66] [5.22] [9.07]
IB. PAN, TOBACCO &
INTOXICANTS 112.44
122.62 139.45 160.55 183.01 199.92
[9.05] [13.73] [15.13] [13.99] [9.24]
II. FUEL & LIGHT 108.11 115.49 130.9 153.78 172.14 190.8
[6.83] [13.34] [17.48] [11.94] [10.84]
III. CLOTHING, BEDDING, &
FOOT-WEAR
102.86 108.75 120.64 132.91 147.53 165.58
[5.73] [10.93] [10.17] [11.0] [12.23]
IV. MISCELLANEOUS 107.05 115.65 123 133.61 146.74 159.72
[8.03] [6.36] [8.63] [9.83] [8.84]
GENERAL INDEX 109.77 123.53 139.87 153.68 165.06 180.69
[12.54] [13.23] [9.87] [7.4] [9.47]
Fig: 6.2

34
Table No. 6.1 depicts Consumer Price Index for Rural areas of Odisha.( State Series) for
the years 2007-08 to 2012-2013. The table indicates the following:
The highest increase in CPI for Rural areas in Odisha was during the year 2009-10
(13.23%) followed by 2008-09 (12.54 %) & 2010-11 (9.87%). The index for Food group was
111.84 in 2007-08, which increased to 187.08 in 2012-2013 registering an increase of 75.24 points
(67%). Index for Pan, Supari, Tobacco & Intoxicants has increased from 112.44 to 199.92
registering an increase of 87.48 points (78%). The index of Fuel and Light was 108.11 which
increased to 190.80 registering an increase of 82.69 points (76%). The index under Clothing,
Bedding and Foot wear increased from 102.86 to 165.58 registering an increase of 62.72 points
(61%). Under the Miscellaneous group, there are certain items like Medical Care, Education,
Recreation, Amusement, Transport Communication and Personal effects, the Index in this
group rose from 107.05 to 159.72 registering an increase of 52.67 points (49%). Thus the
maximum increase was in Pan, Supari, Tobacco & Intoxicants, group followed by Fuel & Light,
Food items, Clothing bedding & footwear, & Miscellaneous items.
Figure 6.3 depicts the year wise growth rate of General index, Food, Beverages &
Tobacco index and Fuel & Light index from the year 2008-09 to 2012-13. It depicts that the line
showing Food, Beverages & Tobacco index is higher than the Fuel & Light index & General
index in the year 2008-09 & 2009-10. From the year 2010-11 to 2012-13 the inflation rate of the
Fuel & Light index is higher than the others and in 2010-11 it reaches at the maximum level.
It can be concluded that the the inflation rates of Food, Beverages & Tobacco group indices
having much weights (60.59%) are the major determinant of the General Indices in these periods.
Table No. 6.2 represents the monthly CPI (Rural) of Odisha in respect of General index &
the group wise indices for the period from July, 2012 to June, 2013. The table depicts that the General
index varies from 175.79 to 182.61, the Food index from 183.57 to 188.85, Pan, Tobacco &
intoxicant index from 193.78 to 202.6, Fuel & Light index from 183.61 to 193.42, Clothing, Bedding
& footwear index from 156.42 to 170.45 and the Miscellaneous index from 153.9 to 162.85.

35
Table . 6.2 Monthly Consumer Price Index (Rural) of the State for the Year 2012-13
Figure 6.4 is the graphical representation of the Food index, Fuel & Light index & the
General index of the table 6.2. The figure depicts that the line showing Fuel & Light index is
above the other indices followed by Food index & General index through out the year. It can be
seen that the Food index is closer to the Fuel & Light index up to the month of November and
after that it shows the mixed trend. The General index shows the increasing trend throughout the
period except for the month of December.
Year / Group Food Pan, Tobacco &
Intoxicants
Fuel &
Light
Clothing,
Bedding etc.
Miscella-
neous
General
index
July ,2012 183.57 193.78 183.61 156.42 153.9 175.79
August ,2012 185.51 196.05 186.28 157.86 155.23 177.67
Septeber ,2012 186.66 197.2 188.22 161.02 157.02 179.2
October,2012 188.38 198.13 190.11 162.85 158.01 180.78
Noveber ,2012 188.85 199.66 191.33 164.16 159.04 181.54
December ,2012 187.38 200.51 192.15 165.85 159.77 181.07
January,2013 186.96 201.49 192.64 168.71 161.4 181.45
February, 2013 186.8 201.97 192.78 169.36 161.92 181.54
March,2013 187.38 202.5 192.85 169.89 162.28 182.01
April ,2013 187.63 202.54 193.02 170.08 162.55 182.25
May ,2013 187.77 202.57 193.22 170.28 162.7 182.4
June ,2013 188.01 202.6 193.42 170.45 162.85 182.61
Fig : 6.4

36
CHAPTER 7
Consumer price Index (Central Series)
7. Consumer Price Index Numbers for Rural, Urban and Combined
(Base : 2010 = 100) (Central Series )
The Central Statistical Office (CSO), Ministry of Statistics and Programme
Implementation (MOSPI) has introduced a new series of Consumer Price Indices for All India and
States/ Union Territories separately for rural, urban and combined for the purpose of intra
temporal price comparison with effect from January 2012 with 2010 as the base year. The
consumption patterns (Weighting diagrams) for this series of CPI have been derived on the basis
of average monthly consumer expenditure of an urban / rural household obtained from the results
of the consumer expenditure survey conducted in 61st round NSS (2004-2005)by the NSSO.
All India Weights are as under:
Table : 7.1 Table : 7.2 Weights of Rural CPI (Central series) Weights of Urban CPI (Central series)
Group Sub-group India Odisha
I. Food, Beverages and Tobacco
59.31 65.02
II Fuel and Light 10.42 12.01
III Clothing, Bedding and Footwear
5.36 3.94
IV Miscellaneous 24.91 19.04
All Groups 100 100
Group Sub-group India Odisha
I. Food, Beverages and Tobacco
37.15 46.09
II Fuel and Light 8.40 9.36
III Housing Group 22.53 16.93
IV Clothing, Bedding and Footwear
3.91 3.48
V Miscellaneous 28 24.14
All Groups 100 100
Fig: 7.1

37
Only consumption expenditure has been considered for the purpose of preparation of
Weighting diagram. Non-consumption expenditure items, like legal expenses have been
excluded. The items were classified into several consumption groups and sub-groups
considering classification of individual consumption according to purpose.
Table: 7.1 represents the classified groups along with their percentage of weights
separately for All India and Odisha for Rural areas whereas the Table: 7.2 shows the CPI groups
along with their weights for Urban areas in respect of All India as well as of Odisha. As
observed, more weights have been given to the Food, Beverages & Tobacco groups like CPI
(IW), CPI (AL) & CPI (RL).
The figure 7.1 depicts that the Odisha rural CPI has even got more weights in respect of
Food, Beverages & Tobacco group & Fuel & Lights groups in comparison to the All India Rural
CPI. But the All India CPI (Rural) has got more weights in respect of Clothing & footwear
group and Miscellaneous group. Further, the figure 7.2 shows the sub group weights of both All
India and Odisha in respect of CPI urban. This figure reflects that Odisha Urban CPI has also got
more weights in respect of Food, Beverages & Tobacco group & Fuel & Lights groups in
comparison to the All India Urban CPI. But the All India CPI Urban has got more weights in
respect of Housing group, Clothing & footwear group and Miscellaneous group.
The category-wise & group-wise final indices of Odisha and All India for January, 2013
to December, 2013 released by CSO have been presented in Table : 7.3 & 7.4 respectively.
Fig: 7.2

38
Table : 7.3
Od
ish
a C
on
su
me
r P
ric
e In
de
x B
as
e
201
0=
10
0 (
Ce
ntr
al S
eri
es
)
Cate
go
ry
Gro
up
s
Ja
n.'13
Fe
b.'13
Ma
r'1
3
Ap
ril'1
3
Ma
y'1
3
Ju
ne
'13
Ju
ly'1
3
Au
g.'1
3
Se
pt.
'13
Oc
t.'1
3
No
v.'1
3
De
c.'1
3
Rura
l F
oo
d; b
eve
rage
s a
nd
to
bacco
1
24
12
4.1
1
23
.5
12
5
12
7.3
1
31
13
3
13
4
13
5.8
1
39
.7
14
6.6
1
42
Urb
an
Fo
od
; b
eve
rage
s a
nd
to
bacco
1
24
12
4.2
1
23
.7
12
5
12
8
13
2
13
5
13
5
13
5.1
1
38
.3
14
7.2
1
39
.3
Com
bin
ed
Fo
od
; b
eve
rage
s a
nd
to
bacco
1
24
12
4.1
1
23
.5
12
5
12
7.4
1
31
13
4
13
4.2
1
35
.7
13
9.4
1
46
.7
14
1.5
Rura
l F
ue
l a
nd
Lig
hting
13
5
13
7.8
1
37
.8
13
8
14
0.2
1
43
14
4
14
4.4
1
45
.1
14
2.9
1
49
.4
14
9.3
Urb
an
Fu
el a
nd
Lig
hting
13
8
13
8.1
1
38
.3
14
0
14
1.3
1
41
14
1
14
1.9
1
41
.8
14
1.9
1
42
.8
14
3.8
Com
bin
ed
Fu
el a
nd
Lig
hting
13
5
13
7.9
1
37
.9
13
8
14
0.4
1
43
14
3
14
3.9
1
44
.4
14
2.7
1
48
14
8.1
Rura
l H
ou
sin
g
Urb
an
Ho
usin
g
13
4
13
5.5
1
38
14
0
14
0.8
1
43
14
3
14
4.9
1
45
.8
14
6.9
1
47
.6
14
9.9
Com
bin
ed
Hou
sin
g
Rura
l C
loth
ing
; be
ddin
g a
nd
fo
otw
ear
13
0.1
1
30
.9
13
2.2
1
32
.3
13
4.3
1
35
.5
13
5.6
1
37
13
9.1
1
41
.4
14
1.7
1
42
.2
Urb
an
Clo
thin
g;
be
ddin
g a
nd
fo
otw
ear
13
9.1
1
39
.5
13
9.8
1
40
.7
14
1.6
1
42
.2
14
2.9
1
44
.3
14
5.1
1
46
.8
14
7.4
1
48
.9
Com
bin
ed
Clo
thin
g;
be
ddin
g a
nd
fo
otw
ear
13
2.2
1
32
.9
13
3.9
1
34
.2
13
6
13
7
13
7.3
1
38
.7
14
0.5
1
42
.6
14
3
14
3.7
Rura
l M
isce
llane
ous
12
0.4
1
21
.6
12
1.7
1
21
.5
12
2.1
1
24
12
4.1
1
25
.4
12
7
12
7.3
1
27
.8
12
8.9
Urb
an
Mis
ce
llane
ous
12
0.3
1
20
.7
12
1.1
1
21
.2
12
0.7
1
21
.3
12
2.7
1
23
.4
12
4.7
1
24
.8
12
5
12
5.5
Com
bin
ed
Mis
ce
llane
ous
12
0.4
1
21
.3
12
1.5
1
21
.4
12
1.7
1
23
.2
12
3.7
1
24
.8
12
6.3
1
26
.6
12
7
12
7.9
Rura
l G
en
era
l In
de
x
12
4.6
1
25
.5
12
5.2
1
26
.1
12
8.1
1
30
.9
13
2.9
1
33
.7
13
5.4
1
37
.8
14
3.2
1
40
.4
Urb
an
Ge
ne
ral In
de
x
12
6.7
1
27
.1
12
7.4
1
28
.4
13
0.1
1
32
.4
13
4.2
1
34
.8
13
5.4
1
37
.1
14
1.5
1
38
.5
Co
mb
ine
d
Ge
ne
ral In
de
x
12
5.1
1
25
.9
12
5.8
1
26
.7
12
8.6
1
31
.3
13
3.2
1
34
13
5.4
1
37
.6
14
2.8
1
39
.9
So
urc
e:
Ce
ntr
al
Sta
tis
tic
al O
ffic
e, G
ove
rnm
en
t o
f In
dia

39
Table : 7.4 A
ll I
nd
ia C
on
su
me
r P
ric
e I
nd
ex B
as
e 2
01
0=
10
0
Cate
go
ry
Gro
up
s
Ja
n.'13
Fe
b.'13
Ma
r'1
3
Ap
ril'1
3
Ma
y'1
3
Ju
ne
'13
Ju
ly'1
3
Au
g.'1
3
Se
pt.
'13
Oc
t.'1
3
No
v.'1
3
De
c.'1
3
Rura
l F
oo
d; b
eve
rage
s a
nd
to
bacco
1
27
.8
12
8.7
1
28
.9
12
9.5
1
30
.8
13
3.8
1
36
13
8.2
1
41
14
3.3
1
46
.3
14
3.2
Urb
an
Fo
od
; b
eve
rage
s a
nd
to
bacco
1
27
.2
12
8.5
1
28
.9
13
0.2
1
32
.2
13
5.7
1
38
.2
14
0.2
1
39
.5
14
1.6
1
44
.3
14
0
Com
bin
ed
Fo
od
; b
eve
rage
s a
nd
to
bacco
1
27
.6
12
8.6
1
28
.9
12
9.7
1
31
.3
13
4.4
1
36
.7
13
8.8
1
40
.5
14
2.7
1
45
.7
14
2.2
Rura
l F
ue
l a
nd
Lig
hting
13
0.6
1
31
.2
13
0.8
1
31
.3
13
2.7
1
34
13
5.2
1
35
.5
13
7.4
1
38
13
9.2
1
39
.5
Urb
an
Fu
el a
nd
Lig
hting
12
8.8
1
29
.2
12
9.6
1
30
.1
13
1.2
1
32
13
2.8
1
33
.7
13
4.1
1
34
.4
13
4.8
1
35
.4
Com
bin
ed
Fu
el a
nd
Lig
hting
12
9.9
1
30
.4
13
0.3
1
30
.8
13
2.1
1
33
.2
13
4.3
1
34
.8
13
6.1
1
36
.6
13
7.5
1
37
.9
Rura
l H
ou
sin
g
13
0.6
1
31
.2
13
0.8
1
31
.3
13
2.7
1
34
13
5.2
1
35
.5
13
7.4
1
38
13
9.2
1
39
.5
Urb
an
Hou
sin
g
12
8.8
1
29
.2
12
9.6
1
30
.1
13
1.2
1
32
13
2.8
1
33
.7
13
4.1
1
34
.4
13
4.8
1
35
.4
Com
bin
ed
Hou
sin
g
12
9.9
1
30
.4
13
0.3
1
30
.8
13
2.1
1
33
.2
13
4.3
1
34
.8
13
6.1
1
36
.6
13
7.5
1
37
.9
Rura
l C
loth
ing
; be
ddin
g a
nd
fo
otw
ear
13
5.9
1
36
.4
13
6.9
1
37
.7
13
8.3
1
39
.5
14
0.6
1
41
.5
14
3.7
1
45
14
6.3
1
47
.8
Urb
an
Clo
thin
g;
be
ddin
g a
nd
fo
otw
ear
13
6.5
1
37
.3
13
7.9
1
39
13
9.8
1
40
.7
14
1.5
1
42
.4
14
3.7
1
45
14
6.2
1
47
.1
Com
bin
ed
Clo
thin
g;
be
ddin
g a
nd
fo
otw
ear
13
6.1
1
36
.7
13
7.3
1
38
.2
13
8.8
1
39
.9
14
0.9
1
41
.8
14
3.7
1
45
14
6.3
1
47
.5
Ru
ral
Mis
ce
llane
ous
12
3
12
3.5
1
23
.7
12
3.8
1
24
.4
12
5.5
1
26
.4
12
7.6
1
29
.2
12
9.8
1
30
.7
13
1.3
Urb
an
Mis
ce
llane
ous
11
9.1
1
20
12
0.8
1
21
.1
12
0.9
1
22
12
3.4
1
24
.6
12
6
12
5.9
1
26
.2
12
6.6
Com
bin
ed
Mis
ce
llane
ous
12
1.2
1
21
.9
12
2.4
1
22
.6
12
2.8
1
23
.9
12
5
12
6.2
1
27
.7
12
8
12
8.6
1
29
.1
Rura
l G
en
era
l In
de
x
12
7.3
1
28
.1
12
8.3
1
28
.7
12
9.8
1
32
.1
13
3.8
1
35
.4
13
7.8
1
39
.5
14
1.7
1
40
.1
Urb
an
Ge
ne
ral In
de
x
12
4.9
1
25
.8
12
6.5
1
27
.4
12
8.4
1
30
.5
13
2.1
1
33
.6
13
4
13
5.1
1
36
.4
13
5.3
Com
bin
ed
Ge
ne
ral In
de
x
12
6.3
1
27
.1
12
7.5
1
28
.1
12
9.2
1
31
.4
13
3.1
1
34
.6
13
6.2
1
37
.6
13
9.4
1
38

40
As observed from the above tables that the General Indices of CPI have shown
continuous increasing trend from January 2013 to November’ 2013 and then slop to downward
in the month of December in respect of both all India and Odisha level for both the Rural &
Urban sector and as well as for the combined sector. The Food Indices have also shown more or
less the same trend during these periods for the above sectors. Figures 7.3 & 7.4 show the
General price indices of the above three sectors for All India and Odisha respectively. It is
observed from the figures that in all India level, the Rural General index is higher than the other
sectors through out the year followed by the General indices of combined sector & the Urban
sector. But in case of Odisha, the Urban General index line is higher than the other two lines
up to the month of September & then it comes below the lines showing for Rural & combined
sector.
Table: 7.5 represents the All India final annual inflation rates for March’ 2014 in respect of
all sub-groups indices and the General Index. The table indicates that the all India Rural indices are
higher than the Urban indices for all sub-groups, groups as well as for the General index except milk
and milk products and condiments & spices sub-group.
Figure 7.5 represents the combined all India inflation rates for March’ 2014. It may be seen
from the diagram that the all India CPI combined reveals the annual inflation rate as 8.31% in
respect of the General index against 9.15% for Food & beverages group and 8.96% for clothing,
bedding & Foot wear group. The Food & beverages group having maximum weights are the major
determinant of the growth of inflation of the General Index. The inflation rate of the major Food sub
-groups are even higher than the Food Group total also.
Fig: 7.3
Fig: 7.4

41
Table : 7.5
Final All India Annual Inflation rates (%) for March 2014
Source : CSO, Government of India
The corresponding inflation rate for Vegetables, Fruits, Milk & Milk products, Egg, Fish &
Meat and for the Cereals & product sub-groups has been reflected as 17.05%, 17.33%, 11.02%, 9.47%
& 9.53% respectively. Moreover, it can be concluded that the annual inflation rate for the General
index for March’ 2014 is mainly due to the higher increase of the annual inflation rate of the Food
items.
s.l.no Groups / Sub-groups Rural Urban Combined
1 Cereals and products 10.17 7.85 9.53
2 Pulses and products 4.87 3.53 4.45
3 Oils and fats 1.96 -5.19 -0.42
4 Egg, fish and meat 9.62 9.27 9.47
5 Milk and products 10.65 11.74 11.02
6 Condiments and spices 7.62 11.80 8.87
7 Vegetables 20.33 9.56 17.05
8 Fruits 19.84 13.95 17.33
9 Sugar etc -3.16 -6.91 -4.17
10 Non-alcoholic beverages 8.09 7.31 7.70
11 Prepared meals etc 8.72 8.42 8.53
12 Food and beverages and Tobacco 9.93 7.60 9.15
13 Fuel and light 7.03 4.94 6.29
14 Clothing, bedding and Foot wear 9.50 8.12 8.96
15 General Index 8.89 7.51 8.31
Fig: 7.5

42
CHAPTER 8
Consumer price Index (Industrial Workers)
Consumer Price Indices for industrial workers ( IW) is an important indicator of the retail
price statistics as it measures the periodic change in the retail prices of goods and services
consumed by an average working class family.
The CPI-IW is designed to measure the rate of change in prices of fixed basket of goods
and services over a period of time consumed by the industrial workers with a view to
compensate the rise in their cost of living . It covers industrial workers employed in any one of
the seven sectors namely factories, mines, plantation, railways, public motor transport
undertakings, electricity generation and distribution establishments as well as ports and docks.
The index covers only manual workers irrespective of their income. Therefore, the target group
being the industrial workers, the scope of CPI-IW is confined to the population of industrial
worker families only, rather than the whole population of resident households. A Working Class
Family is defined as one where one of the member worked as a manual worker in any of the seven
sectors listed above and which derived half or more of its income through manual work.
The history of compilation & maintenance of Consumer Price Index Numbers for
industrial Workers owes origin to the deteriorating economic condition of the workers on
account of abnormal rise in prices following the First World War. Since then the compilation and
maintenance of Consumer Price Index Numbers are being done by the Labour Bureau on a
continuous basis. The series (1982=100) had replaced the old (1960=100) series in December,
1988 with the release of October, 1988 index. The new series on base 2001=100 has been
released on 9th March, 2006 with January, 2006 index which has replaced the earlier (1982=100)
series. Under the 1960 series of Consumer Price Index Numbers for Industrial Workers, the
coverage of Industrial Workers was limited to 3 sectors i.e. Factories, Mines and Plantations. The
coverage of the Industrial Workers for 1982 and 2001 series was extended to seven sectors by
including four more sectors viz. i) Railways, ii) Public Motor Transport Undertakings, iii)
Electricity Generating and Distributing Establishments, and iv) Ports and Docks.
Under the 2001=100 series, the Labour Bureau has been compiling Consumer Price Index
Numbers for Industrial Workers for 78 selected centres and an all-India index on the basis of 78
constituent centres as against 70 centres in the 1982 series. These 78 centres were selected on the
basis of their industrial importance in the country and distributed among different States in
proportion to the industrial employment in the State subject to a maximum allotment of 5 centres
in a state in a sector.
The Old Base 1982=100 is replaced with New Base 2001=100 from January 2006. For
construction and compilation of CPI Numbers for Industrial Workers with New Base 2001=100,
two centers have been selected in Odisha namely Angul- Talcher & Rourkela. Here the centre
Angul –Talcher has been substituted for the centre Barbil which was selected for the old series.

43
Table 8.1
All India Weights of CPI (IW)
The above table 8.1 represents the classified groups along with their percentage of weights
for all India CPI (IW). As observed, more weights (48.47) have been given to Food, Beverages &
Tobaco groups followed by the Miscellaneous group ( 23.26), Housing group (15.27), Clothing,
Bedding and Footwear group (6.57) & the Fuel and Light group (6.43). It is observed from the
table that the weights of the Clothing, Bedding and Footwear group and the Fuel and Light group
are almost same. The figure 8.1 is the graphical representation of the table 8.1.
The Table 8.2 represents the group / sub-group indices of the CPI (IW) at Angul- Talcher
& Rourkela & All India level from the year 2008 to 2013. The figure 8.2 reveals that the General
Index for CPI (IW) has shown a rising trend during the period from 2008 to 2013 at All India level
as well as in Odisha at Angul –Talcher & Rourkela where as figure 8.3 reflects their growth rates
of the general index in these years.
Group / Sub-group Percentage of Weights
I Food, Beverages and Tobacco 48.47
II Fuel and Light 6.43
III Housing Group 15.27
IV Clothing, Bedding and Footwear 6.57
V Miscellaneous 23.26

44
The General Index has increased from 143 points in 2008 to 241 in 2010 registering an
increase of 98 points(68.5 %) for Angul –Talcher and from 149 to 245 registering an increase of
96 points(64.4 %) for Rourkela during these six years. At All India level, the General Index has
also registered an increase of 90 points(63.4%) in the said period.
The Food Index of CPI-IW also has showed an increasing trend during the whole period
under reference both at all India level and State level. It increased from 149 points in 2008 to 242
points in 2013 for Angul –Talcher (62.4%) and from 159 points in 2008 to 261 points in 2013
(64.2%) for Rourkela. At All India level it increased from 148 points to 254 points (71.6%) in
2013 .
The Pan, Supari, Tobaco & Intoxicants, Fuel & Light, Housing, Clothing, Bedding &
Footwear and Miscellaneous Index are also in the way of increasing trend during this period.
The maximum increase are in Housing Index both for Angul –Talcher & Rourkela in the
State. The Index in this group rose from 139 to 350 registering an increase of 211 points (151.8
%) for Angul –Talcher and from 149 to 350 registering an increase of 201 points (134.9 %) for
Rourkela over this period. This Index rose from 135 to 250 at all India level registering an increase
of 115 points(85.2%) during this period. The Fuel & Light Index increases by 89.4 % for
Angul –Talcher, by 54.6% for Rourkela and by 61.4% at All India level over the period.
Fig: 8.2
Fig: 8.3

45
(Figures in the parenthesis indicate percentage growth rate Source: Labour Bureau, Simla
Gro
up
An
gu
l T
alc
he
r
Ro
urk
ela
A
ll I
nd
ia
20
08
20
09
20
10
20
11
20
12
20
13
%
gro
wth
o
ve
r 2
00
8
20
08
20
09
20
10
20
11
20
12
20
13
%
gro
wt
h o
ve
r 2
00
8
20
08
20
09
20
10
20
11
20
12
20
13
%
gro
wth
o
ve
r 2
00
8
Ge
ne
ral
Ind
ex
14
3
16
0
18
1
19
9
22
1
24
1
68
.5
14
9
16
6
18
6
20
4
22
2
24
5
64
.4
14
2
15
7
17
6
19
1
20
9
23
2
63
.4
11
.7
11
.9
13
.1
9.9
1
1.1
9
8
.7
11
.4
12
9.7
8
.8
10
.4
7.6
1
1.3
1
2.1
8
.5
9.4
1
1
Fo
od
14
9
17
2
18
8
20
4
22
1
24
2
62
.4
15
9
17
9
19
8
21
5
23
4
26
1
64
.2
14
8
16
9
19
0
20
3
22
3
25
4
71
.6
14
.6
15
.4
9.3
8
.5
8.3
9
.5
11
.1
12
.5
10
.6
8.5
8
.8
11
.5
10
.4
14
.1
12
.4
6.8
9
.9
13
.9
Pa
n,S
upa
ri,T
ob
acco &
In
toxic
an
ts
12
1
12
3
15
1
18
2
25
7
26
3
11
7.4
12
4
13
2
13
9
14
9
16
9
19
7
58
.9
13
5
14
6
16
3
18
7
21
5
24
4
80
.7
5.2
1
.6
22
.8
20
.5
41
.2
2.3
4
.2
6.4
5
.3
7.1
1
3.4
1
6.6
8
8
.1
11
.6
14
.7
15
13
.5
Fu
el &
L
igh
t
13
2
14
2
16
2
18
9
23
3
25
0
89
.4
13
0
13
3
13
9
15
4
18
2
20
1
54
.6
14
0
14
7
15
9
18
1
20
8
22
6
61
.4
9.1
7
.6
14
.0.
16
.7
23
.3
7.3
7
.4
2.3
4
.5
10
.8
18
.2
10
.4
6
5
8.1
1
3.8
1
4.9
8
.7
Hou
sin
g
13
9
17
5
24
4
27
6
30
1
35
0
15
1.8
14
9
18
8
26
8
32
4
33
8
35
0
13
4.9
13
5
15
4
19
5
21
7
24
3
25
0
85
.2
6.1
2
5.9
3
9.4
1
3.1
9
.1
16
.3
4.1
2
6.1
4
2.5
2
0.9
4
.3
3.6
3
.8
14
26
.6
11
.2
12
2.9
Clo
thin
g,
Be
dd
ing
&
Fo
otw
ea
r
15
9
16
2
16
4
18
5
19
6
19
0
19
.5
12
8
13
8
14
6
16
2
17
1
19
3
50
.8
12
1
12
6
13
3
15
1
16
6
17
9
47
.9
21
.3
1.9
1
.2
12
.8
5.9
-3
.1
5.8
7
.8
5.8
1
0.9
5
.6
12
.9
2.5
4
.1
5.5
1
3.5
9
.9
7.8
Mis
ce
llane
-o
us
13
4
13
6
14
4
15
8
17
5
18
7
39
.6
13
4
13
7
14
5
15
4
16
7
17
5
30
.6
13
8
14
7
15
4
16
5
17
8
19
3
39
.9
7.2
1
.4
5.9
9
.7
10
.8
6.9
6
.3
2.2
5
.8
6.2
8
.4
4.8
7
6
.5
4.8
7
.1
7.9
8
.4
Table 8.2
Consumer Price Index Numbers for Industrial workers. Base year:2001=100

46
Table : 8. 3
Month wise CPI (IW) General Index & Food Index for the year 2013
Source : Labour Bureau , Simla
The table 8.3 reveals the month wise CPI (IW) General Indices & Food Indices of All
India level as well as in Odisha at Angul –Talcher & Rourkela for the year 2013. The General
Index has increased from 232 points to 249 registering an increase of 7.33% for Angul –Talcher
and from 229 to 254 registering an increase of 10.92% for Rourkela during these twelve months .
At all India level the General Index has also registered an increase of 8.14% in the said period.
The Food Index of CPI-IW also showed an increasing trend during the whole period under
reference both at all India level and State level. It increased from 227 points in the month of
January to 254 points in December for Angul –Talcher (11.89%) and from 240 points in
January to 274 points in December (14.17%) for Rourkela. At all India level, it increased from
235 points to 262 points (11.49%) in the month of December. However, in respect of both the
Indices, the growth rates are highest at the Rourkela centre during these twelve months for the year
2013.
Angul-Talcher Rourkela All India Months
GEN FOOD GEN FOOD GEN FOOD
January 232 227 229 240 221 235
February 234 229 233 243 223 238
March 233 227 233 243 224 240
April 233 229 237 249 226 245
May 235 233 241 255 228 248
June 237 239 242 257 231 255
July 243 244 248 265 235 259
August 246 248 251 270 237 262
September 246 248 251 270 238 263
October 248 252 255 276 241 268
November 257 272 262 287 243 273
December 249 254 254 274 239 262
% of Growth 7.33 11.89 10.92 14.17 8.14 11.49
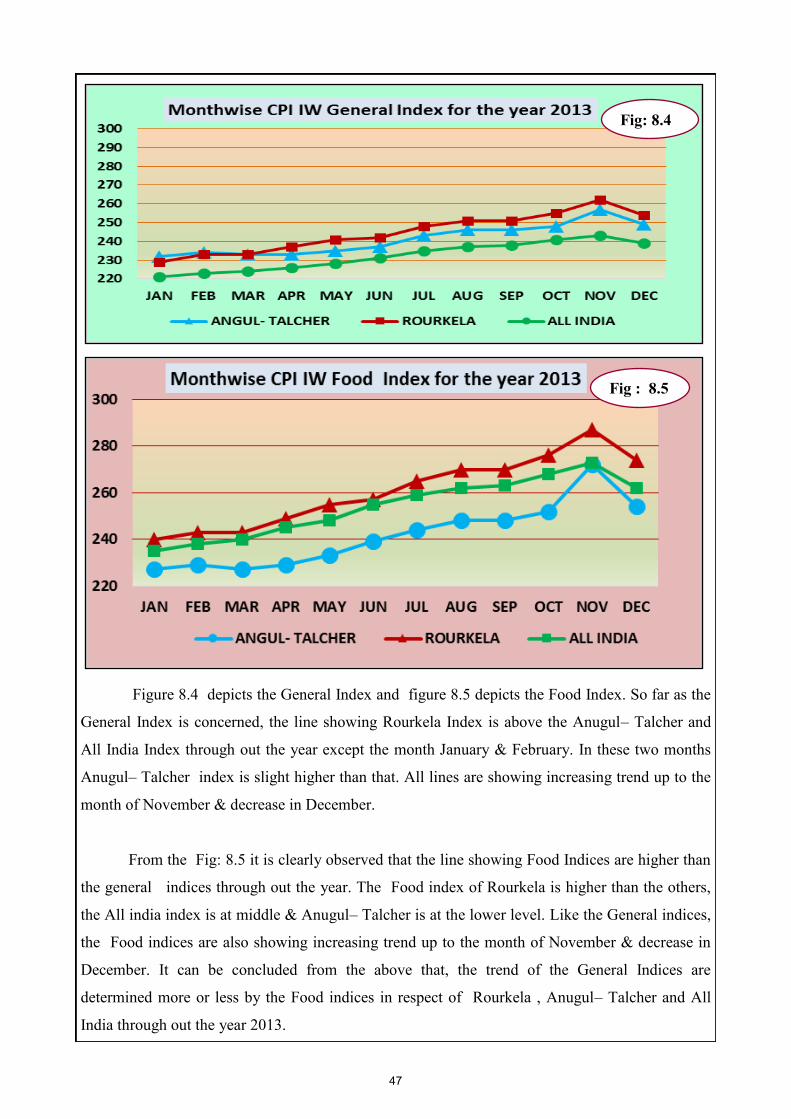
47
Figure 8.4 depicts the General Index and figure 8.5 depicts the Food Index. So far as the
General Index is concerned, the line showing Rourkela Index is above the Anugul– Talcher and
All India Index through out the year except the month January & February. In these two months
Anugul– Talcher index is slight higher than that. All lines are showing increasing trend up to the
month of November & decrease in December.
From the Fig: 8.5 it is clearly observed that the line showing Food Indices are higher than
the general indices through out the year. The Food index of Rourkela is higher than the others,
the All india index is at middle & Anugul– Talcher is at the lower level. Like the General indices,
the Food indices are also showing increasing trend up to the month of November & decrease in
December. It can be concluded from the above that, the trend of the General Indices are
determined more or less by the Food indices in respect of Rourkela , Anugul– Talcher and All
India through out the year 2013.
Fig: 8.4
Fig : 8.5

48
Fig: 8.6 is the graphical representation of the table 8.4 which reflects that the line showing
the inflation rate is more fluctuating in the year 2010 which varies from 8.33 to 16.22
throughout the year. Starting from the month of January to the month of June, this line is above
all other lines in these six years. It is also observed from this figure that starting from the month
of July to the end of the December, the line showing point to point inflation rate for the year
2009 is above the all other lines of the graph. The line showing the inflation rate for the year
2008 reflects that the rate of inflation is below all other lines starting from the month of February
to the month of July. In the month of August & September it is above the lines showing the
inflation rates for the year 2011& 2012 respectively. In the month of October & November, it is
above the lines showing the inflation rates for the year 2010,2011 and 2012. The line showing the
inflation rate for the year 2013 is above all other lines except the line showing the inflation rate
for the year 2010 starting from the month of January to June and from the month of July to
November, it is above all other lines except the line showing the rate for the year 2009 with
exception for July’ 2010. In the month of December, it is above the inflation rate for the year
2011.
Fig: 8.6

49
Table 8. 4
Point to Point Rate of Inflation in CPI (IW) India
Base = 2001-100
Source : Labour Bureau , Simla
Table 8.4 represents the point to point (month wise) rate of inflation in CPI (IW) of All
India from the year 2008 to 2013. The table indicates that in the year 2008, the annual average
inflation rate is 8.31%. The minimum rate observed is 5.51% in the month of February. Then it
increased continuously & reached at 10.45% in the month of October & November and again
decreases to 9.7% in the month of December. In the year 2013, the annual average inflation rate is
estimated at 10.92% with the minimum rate of 9.13% in the month of December and the maximum
rate of 12.06% in February. The annual average inflation rates for the year 2009, 2010, 2011 &
2012 have been estimated at 10.83%, 12.11%, 8.86% & 9.30% respectively.
YEAR 2008 2009 2010 2011 2012 2013
January 5.51 10.45 16.22 9.3 5.32 11.62
February 5.47 9.63 14.86 8.82 7.57 12.06
March 7.87 8.03 14.86 8.82 8.65 11.44
April 7.81 8.7 13.33 9.41 10.22 10.24
May 7.75 8.63 13.91 8.72 10.16 10.68
June 7.69 9.29 13.73 8.62 10.05 11.06
July 8.33 11.89 11.25 8.43 9.84 10.85
August 9.02 11.72 9.88 8.99 10.31 10.75
September 9.77 11.64 9.82 10.06 9.14 10.7
October 10.45 11.49 9.7 9.39 9.6 11.06
November 10.45 13.51 8.33 9.34 9.55 11.47
December 9.7 14.97 9.47 6.49 11.17 9.13
Annual Average
Inflation Rate 8.31 10.83 12.11 8.86 9.30 10.92

50
CHAPTER 9
Consumer price Index (Agricultural Labourers & Rural Labourers)
The Labour Bureau also compiles Consumer Price Index Numbers both for Agricultural
Labourers [CPI(AL)] and Rural Labourers [CPI(RL)] on monthly basis.
Rural Labourer is a person who does manual work in rural areas in agr icultural and/
or non-agricultural occupation in return for wages in cash or kind, or partly in cash and partly in
kind.
A person is treated as an Agricultural Labourer, if he/she follows one or more of the
following agricultural occupations in the capacity of a labourer on hire, whether paid in cash or
kind or partly in cash and partly in kind :
(a) Farming including cultivation, growing and harvesting of any agricultural commodity;
(b) Production, cultivation, growing and harvesting of any horticultural commodity;
(c) Dairy farming;
(d) Raising of livestock, bee-keeping or poultry farming; and
(e) Any practice performed on a farm as incidental to or in conjunction with the farm
operations (including any forestry or timbering operations and the preparation for market
and delivery to storage or to market or to carriage for transportation of farm products).
The manual work in fisheries was, however, excluded from the category of agricultural
labourer. Further, carriage for transportation coming under the category (e) above, referred only
to the first stage of transportation from farm to the first stage of disposal.
Rural Labour Households are those households whose income, dur ing the last 365
days, was more from wage paid manual labour (agricultural and/or non-agricultural) than either
from paid non-manual employment or from self- employment.
The rural labour households, who derive 50 per cent or more of their total income from
wage paid manual labour in agricultural activities, are treated as agricultural labour households.
The Consumer Price Index Numbers for Agricultural Labourers cover the households of
agricultural labourers and the Consumer Price Index Numbers for Rural Labourers cover the
households of rural labourers (including agricultural labourers).
The Labour Bureau has been compiling CPI Numbers for Agricultural Labourers since
September, 1964. The existing series of CPI Numbers for (i) Agricultural and (ii) Rural
Labourers (base 1986-87=100) replaced the earlier series on base 1960-61=100 w.e.f. November,
1995.

51
For both the current series of CPI(AL) and CPI(RL), the retail prices in respect of selected
items of goods and services are collected on monthly basis by the NSSO from 1461 markets
corresponding to 600 sample villages (one price quotation from each village) in 20 States spread
over the country. The prices for these two series are the same but the weights at the compilation
stage are different for the two labour class households i.e. agricultural labour households and rural
labour households. Consumer expenditure data collected by the NSSO during 38th round of NSS
(1983) formed the basis of the State wise weighting diagrams for the series
Table 9.1.1
All India Weights of CPI (AL)
The above table 9.1.1 represents the classified groups along with their percentage of
weights for all India CPI (AL). As observed, more than 70 % weights (72.94)% have been given
to Food, Beverages & Tobacco groups followed by the Miscellaneous group ( 11.73%), Fuel and
Light group (8.35%), & the Clothing, Bedding and Footwear group (6.98%). It is observed from
the table that the Food, Beverages & Tobacco group constitutes the highest percentage of weight
than any other consumer price indices compiled at the all India level. The figure 9.1.1 is the
graphical representation of the table 9.1.1.
Group / Sub-group Weights
I. Food, Beverages and Tobacco 72.94
II Fuel and Light 8.35
III Clothing, Bedding and Footwear 6.98
IV Miscellaneous 11.73
Fig: 9.1.1

52
Table 9.1.2
Consumer Price Index Numbers for Agricultural Labourers
Base Year 1986-87 = 100
(Source : Labour Bureau , Simla)
Table 9.1.2 indicates the data relating to CPI-AL for the years 2007-08 to 2012-13. The
table reveals that CPI-AL showed an increasing trend during the whole period under reference.
The General Index increased from 399 points in 2007–08 to 631 points in 2012-13 for Odisha, the
percentage growth rate being 58.1. The Food Index increased from 391points in 2007-08 to 596
points in 2012-13 for Odisha, the percentage growth rate being 52.4. At all India level, it increased
from 416 points in 2007-08 to 679 points in 2012-13, showing the growth rate of 63.2 %. It is
observed that the percentage of growth of General Index and Food Index are more in case of All
India in comparison to Odisha. The higher growth rates are observed in respect of Odisha in the
year 2009-10 (13.0 % for General index & 13.7% for Food Index). In the year 2012-13, 12.2%
growth is also observed in respect of General Index as against 11.6% in respect of Food Index.
In case of All India also, the higher growth rates of General Index & Food Index occurred in the
year 2009-10 & 2012-13 like Odisha. However, the inflation in respect of the General Indices for
Odisha & All India have reached highest points due to their corresponding higher growth rates of
Food Indices. It may be concluded that the Agricultural labourers being economically backward,
the more inflation rate in their food items badly affects their standard of living as major part of
their income are being spent by them on food items.
Year Odisha All India
General Food General Food
2007-08 399 9.3
391 11.3
417 7.4
416 8.3
2008-09 438 9.8
431 10.2
461 10.5
463 11.2
2009-10 495 13.0
490 13.7
529 14.7
540 16.6
2010-11 538 8.7
528 7.7
577 9.0
581 7.5
2011-12 562 4.4
534 1.1
622 7.8
610 5.0
2012-13 631 12.2
596 11.6
692 11.2
679 11.3
% of growth over the year 2007-08
58.1 52.4 65.9 63.2

53
Figure 9.1.2 depicts the General Index of Odisha in respect of Agricultural labourers along
with the growth rates. The line shows increasing trend up to the year 2009-10, where it is
maximum and then it decreases and reaches at the minimum rate (4.4%) in the year 2011-12 and
again increases to 12.2% in the year 2012-13.
Figure 9.1.3 depicts the General Index of All India in respect of Agricultural labourers
along with the growth rates. It is observed that the line shows the fluctuating trend. In 2007-08
it was at 7.4 % , in 2008-09, it increases to 10.5% and in 2009-10 it further increases and
reaches at maximum point(14.7 %). Then it decreases to 9% in 2010-11 & 7.8% in 2011-12.
But in the year 2012-13, it once again shows the increasing trend & reaches at 11.2%.
Fig: 9.1.3
Fig: 9.1.2
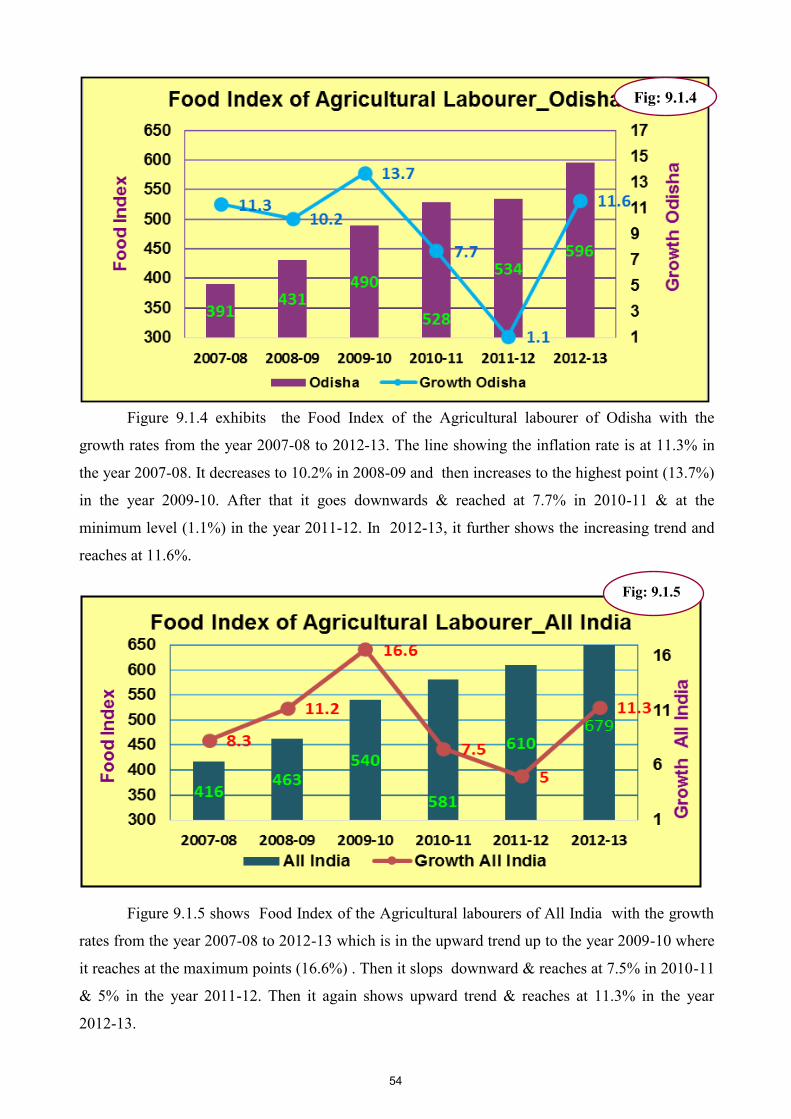
54
Figure 9.1.4 exhibits the Food Index of the Agricultural labourer of Odisha with the
growth rates from the year 2007-08 to 2012-13. The line showing the inflation rate is at 11.3% in
the year 2007-08. It decreases to 10.2% in 2008-09 and then increases to the highest point (13.7%)
in the year 2009-10. After that it goes downwards & reached at 7.7% in 2010-11 & at the
minimum level (1.1%) in the year 2011-12. In 2012-13, it further shows the increasing trend and
reaches at 11.6%.
Figure 9.1.5 shows Food Index of the Agricultural labourers of All India with the growth
rates from the year 2007-08 to 2012-13 which is in the upward trend up to the year 2009-10 where
it reaches at the maximum points (16.6%) . Then it slops downward & reaches at 7.5% in 2010-11
& 5% in the year 2011-12. Then it again shows upward trend & reaches at 11.3% in the year
2012-13.
Fig: 9.1.4
Fig: 9.1.5

55
Table 9.2.1
All India Weights of CPI (RL)
The above table 9.2.1 represents the classified groups along with their percentage of
weights for all India CPI (RL). As observed, more than 70 % weights (70. 47) have been given to
Food, Beverages & Tobacco groups followed by the Miscellaneous group ( 11.87%), Clothing,
Bedding and Footwear group (9.76%) & the Fuel and Light group (7.90%). It is observed from
the table that the percentage of weight in respect of the Food, Beverages & Tobacco group is
nearly 2% less than the CPI (AL) weight. The figure 9.2.1 is the graphical representation of the
table 9.2.1.
Group / Sub-group Weights
I. Food, Beverages and Tobacco 70.47
II Fuel and Light 7.9
III Clothing, Bedding and Footwear 9.76
IV Miscellaneous 11.87

56
Table : 9.2.2
Consumer Price Index for Rural Labourers Base year: 1986-87=100
Source: Labour Bureau, Simla
Table 9.2.2 shows the data for CPI(RL) for the years from 2007-08 to 2012-13. The
movements of CPI(RL) shows the same trend as CPI(AL) for the period under reference.
It is observed from the above Table that the General Index of Odisha increased from 400
points in 2007-08 to 631 points in 2012-13, the growth rate being 57.8 %. At All India
level, the General Index increased from 417 points to 693 points during the said period,
the growth rate being 66.2 % . The Food Index also reflects the upward trend during the
said period of the continuing series. For Odisha, it increased from 391 points to 596 points
registering 52.4% growth . Similarly at All India level, it increased from 416 points to 681
points registering the growth rate of 63.7 % during the said period from 2007-08 to
2012-13.
Year Odisha All India
General Food General Food
2007-08 400 9.5
391 11.3
417 7.1
416 8.3
2008-09 438 9.5
431 10.2
461 10.5
463 11.2
2009-10 495 13.0
490 13.7
529 14.7
540 16.6
2010-11 538 8.7
528 7.7
576 8.9
582 7.8
2011-12 563 4.6
534 1.1
623 8.1
611 5.0
2012-13 631 (12.0)
596 (11.6)
693 (11.2)
681 (11.4)
% growth over 2007-08
57.8 52.4 66.2 63.7

57
Figure 9.2.2 and Figure 9.2.3 depict the General index along with the growth rates of Rural
labourers for Odisha as well as for All India respectively. The growth of General Index of Odisha
varies from the minimum 4.6% to maximum 13% during these six years i.e from 2007-08 to
2012-13whereas the Index of All India varies from 7.1% in 2007-08 to 14.7% in 2009-10.
Comparing both , it is observed that the growth rates of All India General Indices are higher than
that of Odisha except in the year 2007-08 and 2012-13.
Fig: 9.2.2
Fig: 9.2.3

58
Figure 9.2.4 and 9.2.5 depict the Food index along with the growth rates of Rural
labourers for Odisha as well as for All India respectively. These figures depict that the direction
of the lines showing growth rate in respect of All India as well as Odisha are the same, but the
slope of the trend lines in case of the Food indices are more fluctuating than the General
indices.
From the above, it can be concluded that the higher inflation rate of General indices
occurred more or less due to the higher growth of both Food & Non-food indices in these 6
years from 2007-08 to 2012-13 for All India & Odisha in respect of both Agricultural labourers
& Rural labourers. As the target population of these indices ( Agricultural & Rural labour
households) belongs to the lower strata of the society, the higher inflation rate in the food
items badly affects their standard of livings.
Fig: 9.2.4
Fig: 9.2.5

59
CHAPTER 10
Wholesale price Index of India
The Wholesale Price Index (WPI) is a measure of wholesale price movement for the
economy. It is based on the price prevailing in the wholesale markets or the price at which bulk
transactions are made. The purpose of the WPI is to monitor price movements that reflect
supply and demand in industry, manufacturing and construction. This helps in analyzing both
macroeconomic and microeconomic conditions. As WPI captures price movements in a most
comprehensive way, it is widely used by Government, banks, industry and business circles.
The Office of the Economic Advisor (OEA) has been compiling the Wholesale Prices on
weekly basis since 1942. Almost all the important items being transacted in the economy have
been included in the Index in order to adequately reflect the changes that have been taken place in
the structure of the economy. The basket for the WPI includes a wide spectrum of raw materials,
intermediate goods and final products which are traded in the wholesale markets. However, the
services are excluded from its scope .Wholesale price represents the quoted price of bulk
transaction of a commodity generally at primary stage.
The OEA introduced new series of WPI with the base year 2004-05 with effect from
August, 2010 replacing the old series of 1993-94 base. The primary use of WPI is to have
inflationary trend in the economy as a whole.
The Weighting diagram of WPI is comprised of three broad Groups with different
sub-groups like : (A) Primary Articles, (B) Fuel & Power & (C) Manufactured Products.
A representative commodity basket comprising 676 items has been selected and weighting
diagram has been derived for the new series consistent with the structure of the economy.
Table : 10.1
Statement of weights, No .of items covered & quotations made in WPI
Major Group / Group Weight No. of Items No. of Quotations
I. Primary Articles 20.12 102 579
II. Fuel & Power 14.91 19 72
III. Manufactured Products 64.97 555 4831
All Commodities 100 676 5482

60
The sum total of Weights assigned to the three different broad groups is depicted in the
following diagram. The Primary Articles group has got 64.97%, Fuel & Power group 14.91% &
Manufactured Products group 20.12% weights out of 100. The number of quotations selected for
collecting price data for the above items is 5482.
The Index Numbers of the Wholesale Prices in India for all Commodities for the years 2007-08
to 2012-13 is placed in Table 10.2 which shows that the WPI for all Commodities increases from
116.6 to 167.62, for primary articles from 123.9 to 219.97, for Fuel & Power from 121 to 186.49 &
for Manufactured products from 113.4 to 147.06 in these six years.
The official measure of inflation in the Indian economy is based on WPI. At all India level,
Wholesale Price Index (WPI) is used to calculate the rate of inflation in the economy by measuring
changes in prices of selected basket of commodities in wholesale market.
20.11815
14.9102164.97164
Weights For WPI
Primary Articles
Fuel and Power
Manufactured Products
Fig; 10.1
Fig: 10.2

61
Inflation rate calculated on the basis of the movement of the Wholesale Price Index (WPI)
is an important measure to monitor the dynamic movement of prices. The inflation rate is
calculated on a point to point basis at All India level only i.e. on the basis of the variations
between the Wholesale Price Index for the latest week of the current year and Wholesale Price
Index for the corresponding week of previous year.
The Annual Inflation Rates in India based on Wholesale Price Index Numbers (WPI) for the
years 2007-08 to 2012-13 are presented in Table 10.2 and the inflationary trends of the three
measure groups can be clearly understood from the following Figure 10.3.
Table 10.2
Source : Office of the Economic Advisor , Government of India
It is observed from the figure that the line showing inflationary trend of Primary Article
group is above all other lines showing All Commodity Index as well as all other groups through
out the years except in the year 2011-12 & 2012-13 where Fuel & Power group reaches above it.
It reaches at the highest with 17.75 % in the year 2010-11. The average inflationary trend over
six years in respect of AC, PA, F&P and MP are observed as 7.08%, 11.56%, 7.67% & 5.25%
respectively.
Wholesale Price Index Base: 2004-05=100
Commodities Weight 2007-08 2008-09 2009-10 2010-11 2011-12 2012-13 Average
Infla-
tionary
growth
over the
six
years
All Commodities 100 116.6 126 130.8 143.3 156.13 167.62
Primary articles 20.12 123.9 137.5 154.9 182.4 200.32 219.97
Fuel & Power 14.91 121 135 132.1 148.3 169.03 186.49
Manufactured
products
64.97 113.4 120.4 123.1 130.1 139.51 147.06
Inflation rate (Year on Year Percent)
All Commodities 100 4.74 8.06 3.81 9.56 8.95 7.36 7.08
Primary articles 20.12 8.33 10.98 12.65 17.75 9.82 9.81 11.56
Fuel & Power 14.91 0.03 11.57 -2.15 12.26 13.98 10.33 7.67
Manufactured 64.97 4.78 6.17 2.24 5.69 7.23 5.41 5.25
Fig: 10.3

62
Table 10.3
Annual Percentage (%) Variation of WPI.
Source : Office of the Economic Advisor , Government of India
Form the above table & the graphs shown below, it is observed that the line showing
inflationary trend of Food Article (FA) Sub–group is above the line showing the inflationary trend
in respect of All commodities level in all the seven years except for the year 2011-12 where the
Fuel & Power group inflation reaches at highest point (14%). The Food inflation reaches at 15.3%
& 15.6 % in the years 2009-10 & 2010-11 respectively where the inflation rate of All commodity
level were only at 3.8 %& 9.6%. The line showing inflation rate of Non-Food Article sub-group
is in increasing trend up to the year 2008-09. In 2009-10, it slops downwards & in 2010-11 it
reaches at the highest point (22.3) and further slopes down to 9.6 point in 2011-12 & then
increases & reaches at the point of 10.5 in the year 2012-13. Mainly, inflation of food articles
affects the weaker sections of the people in the nation.
Year AC PA FA NF F&P MP
1 2 3 4 5 6
2006-07 6.6 9.6 9.6 5.8 6.5 5.7
2007-08 4.7 8.3 7 11.9 0 4.8
2008-09 8.1 11 9.1 12.9 11.6 6.2
2009-10 3.8 12.7 15.3 5.5 -2.1 2.2
2010-11 9.6 17.7 15.6 22.3 12.3 5.7
2011-12 8.9 9.8 7.3 9.6 14 7.3
2012-13 7.4 9.8 9.9 10.5 10.3 5.4
FA and NF are part of PA.
1) AC : All Commodities.
2) PA : Primary Articles.
3) FA : Food Articles.
4) NF : Non-food Articles.
5) F&P : Fuel and Power.
6) MP : Manu-factured Prod-
ucts.
Fig: 10.4 Fig:10.5

63
Table 10.4
Weights of major Food Article
Group of WPI
Source: Office of the Economic Advisor, Government of India
Food Article Sub–Group again comprises of seven small sub–groups that consist of total
number of 56 items. Egg, meat, fish and milk, vegetables, Fruits, Pulses, Cereals & other Food
articles determines the contribution to the WPI. Here the inflation rate of the small sub–groups that
have got more weights in the Food Article sub-group of WPI is analyzed. These are a1.Cereals, a2.
Pulses, b1.Vegetables, b2. Fruits, d. Egg, Meat & Fish and c. Milk listed in the table below with
their yearly inflation rates.
Table 10.5
Annual % Variation of Food Article Groups of WPI
Year a1. Cereals a2. Pulses b1. Vegetables b2. Fruits d. Egg, Fish &
Meat
c. Milk
2005-06 5.9 13.3 13.9 3.3 6.4 1
2006-07 10.1 31.7 0.5 6.2 6.1 7.9
2007-08 9.6 -2.9 19.9 4.3 3.2 5.1
2008-09 11.9 7.5 3.5 12.8 7.7 7.5
2009-10 12.6 22.5 14 5.5 20.8 18.8
2010-11 5.3 3.2 13 19.8 25.5 20.2
2011-12 3.8 2.5 -1.9 14.2 12.7 10.3
2012-13 13.5 19.6 17.2 1.3 14.1 7.3
Average In-
flation Rate 9.09 12.18 10.01 8.43 12.06 9.76
a1. Cereals 3.37323 (25%)
a2. Pulses 0.71662 (5%)
b1. Vegetables 1.73553 (13%)
b2. Fruits 2.10717 (15%)
d. Egg, Meat & Fish 2.41384 (18%)
c. Milk 3.23818 (24%)
Fig: 10.6

64
The yearly average inflation rates in respect of Cereals, Pulses, Vegetables, Fruits,
(Egg, Fish & Meat) and Milk are 9.09%, 12.18%, 10.01%, 8.43%, 12.06% & 9.76%
respectively. The inflation rates of the above items are graphically represented in the
figure below. It depicts that mainly the higher rate of food inflation on WPI in the year
2009-10 & 2010-11 can be seen in Eggs, meat & Fish and Milk that are found to
contribute more to inflation. The other influential commodities are cereals, vegetables,
Fruits and lastly the pulses. Due to the government intervention in the Five year plan, the
inflation rate on the major items of food articles slops downward to some extent in the
year 2011-12. But again in the year 2012-13, all those items shows the increasing trend. In
the year 2006-07, the pulse rate reaches at maximum 31.7% which is above the rate of all
other items in these 8 years. As observed from the graph, all the food articles contribute
more to the inflation.
Inflation is a burning issue which hinders the economic growth of the country. It is
becoming more hectic to economist, politicians and even people also. It is very dangerous
because it directly affects the standard of living of the people. According to our statistical
data, the higher inflation in Food Articles mainly impacts on lower strata of the economy
by reducing their purchasing power as well as their small savings.
Fig: 10.7

65
Ta
ble
1
0.6
:
Mo
nth
ly W
hole
sale
P
rice
In
dex
Nu
mb
ers
2013
B
ase
Yea
r 2
00
4-0
5=
10
0
Nam
e o
f
The
co
mm
od
itie
s
(Gro
up
ite
ms)
Gro
up
w
eig
hts
Su
b-g
rou
p
we
igh
ts
Jan
Fe
b
Mar
A
pr
May
Ju
n
Jul
Au
g Se
p
Oct
N
ov
De
c
All
Co
mm
iditi
es
1
00
1
00
170.3
170.9
170.1
171.3
171.4
173.2
175.5
179.0
180.7
180.7
181.5
179.6
I. P
rim
ary
Arti
cle
s
20
.11
81
5
223.6
224.4
223.1
226.5
227.3
233.9
240.3
251.9
252.7
251.4
254.9
243.7
Foo
d A
rticl
es
1
4.3
37
09
214.7
215.4
214.1
219.8
223.1
230.9
238.5
252.4
252.9
251.7
255.9
240.2
No
nfo
od
Arti
cles
4.2
57
56
206.9
206.8
207.6
209.7
208.5
209.1
211.1
209.9
213.2
213.0
216.4
215.7
Min
eral
s
1.5
23
5
357.8
351.8
336.0
320.2
330.9
338.1
363.7
360.4
355.3
352.5
354.6
349.1
II.F
ue
l an
d P
ow
er
1
4.9
10
21
193.4
195.5
191.6
193.7
191.9
194.7
199.9
204.7
210.6
209.8
209.6
211.1
Co
al
2
.09
41
9
210.3
210.3
189.7
189.7
189.7
191.5
191.5
191.5
191.5
191.5
191.5
191.5
Min
eral
oils
9.3
64
39
212.1
215.6
213.9
210.8
208.0
212.1
220.4
224.3
232.9
231.3
230.9
232.8
Elec
tric
ity
3
.45
16
3
132.4
132.4
132.4
149.6
149.6
149.6
149.6
159.8
161.7
162.8
162.8
163.8
III.
Man
ufa
ctu
red
P
rod
uct
s
64
.97
16
4
148.5
148.6
148.7
149.1
149.3
149.5
149.9
150.6
151.5
152.1
152.3
152.5
Foo
d p
rod
uct
s
9.9
73
96
166.6
166.7
165.6
166.8
167.3
167.7
167.7
168.9
170.0
170.6
170.6
169.8
Bev
erag
es, T
ob
acco
& T
ob
acco
pro
d-
uct
s
1.7
62
47
178.4
178.5
181.6
181.8
182.2
181.7
181.8
182.2
182.3
183.8
185.1
186.4
Texti
les
7
.32
63
9
132.2
132.8
133.4
134.4
135.7
136.1
137.1
137.9
140.0
140.3
140.1
140.3
Wo
od
& W
oo
d p
rod
uct
s
0.5
87
44
173.9
173.4
174.1
173.9
175.2
175.5
176.4
177.8
179.1
179.2
179.2
179.6
Pap
er &
pap
er p
rod
uct
s
2.0
33
5
139.4
139.4
140.2
140.3
140.6
140.5
140.6
140.9
141.9
142.4
143.4
145.1
Leat
her
& le
ath
er p
rod
uct
s
0.8
35
09
134.5
134.1
134.7
135.6
138.1
140.2
142.7
143.6
145.8
145.2
145.6
145.1
Ru
bb
er &
Pla
stic
pro
du
cts
2
.98
69
7
139.2
139.3
139.5
140.7
142.2
143.3
144.0
145.2
146.4
147.4
147.9
148.1
Ch
emic
als&
Ch
emic
al p
rod
uct
s
12
.01
77
145.6
145.8
145.9
146.2
145.9
146.2
147.4
148.1
149.0
149.1
149.2
149.9
No
n-m
etal
lic &
Min
eral
pro
du
cts
2
.55
59
7
164.8
165.6
166.8
166.2
166.4
166.5
167.1
165.9
164.4
165.2
165.5
166.5
Bas
ic M
etal
s, A
lloys
& M
etal
pro
du
cts
1
0.7
47
85
165.3
165.1
164.8
164.3
163.0
162.5
162.2
162.9
163.7
164.6
165.0
165.1
Mac
hin
ery
& M
ach
ine
Too
ls
8
.93
14
8
129.3
129.3
129.4
130.0
130.6
130.7
130.8
131.0
131.3
131.9
132.4
132.6
Tran
spo
rt ,
Equ
ipm
ent
& P
arts
5.2
12
82
131.4
132.0
132.2
132.1
132.2
132.8
133.3
133.9
134.9
135.8
135.8
135.9
Sou
rce
: O
ffice
of
the
Eco
no
mic
Ad
viso
r , G
ove
rnm
en
t o
f In
dia

66
The monthly Wholesale Price Indices for All commodities, Food Articles,
Non-food Articles, Fuel & Power and Manufactured products are presented in the Table
10.6 from the month of January to the month of December 2013. These are pictorially
represented in the figure 10.8. It may be seen that the line showing All commodities index
is increasing with a very small pace from the month of January to the month of June.
From July to December, it shows a little bit of steeper increasing trend along with a
higher increasing trend of the Food Article index and the Fuel & Power index. But from
the above picture, it is observed that the line showing Food Article index is much higher
than the other indices through out the year followed by Non-food Articles index, Fuel &
Power index, All commodities index and Manufactured products index respectively. It
can be concluded that the increase of the monthly Whole Sale Price Indices in the year
2013 is mainly due to the higher increasing rate of the Food Articles.
Fig: 10.8

DIRECTORATE OF ECONOMICS AND STATISTICS, ODISHA,
4TH FLOOR, HEADS OF DEPARTMENT BUILDING,
BHUBANESWAR– 751001
Phone : 0674-2391295
FAX : 0674-2391897
Email - [email protected] [email protected]