Occurrence and Removal of Veterinary Antibiotics in Livestock ...
17
processes Article Occurrence and Removal of Veterinary Antibiotics in Livestock Wastewater Treatment Plants, South Korea Jin-Pil Kim 1 , Dal Rae Jin 2 , Wonseok Lee 3 , Minhee Chae 1 and Junwon Park 4, * 1 Geum River Environment Research Center, 182-18 Jiyong-ro, Okcheon-eup, Okcheon-gun, Chungcheongbuk-do 29027, Korea; [email protected] (J.-P.K.); [email protected] (M.C.) 2 Division of Water Environmental Engineering Research, National Institute of Environmental Research, 42, Hwangyeong-ro, Seo-gu, Incheon 22689, Korea; [email protected] 3 Division of Waste-to-Energy Research, National Institute of Environmental Research, 42, Hwangyeong-ro, Seo-gu, Incheon 22689, Korea; [email protected] 4 Division of Monitoring and Analysis, Yeongsan River Basin Environmental Office, 31, Gyesuro, Seo-gu, Gwangju 61945, Korea * Correspondence: [email protected] Received: 18 May 2020; Accepted: 17 June 2020; Published: 21 June 2020 Abstract: In this study, livestock wastewater treatment plants in South Korea were monitored to determine the characteristics of influent and effluent wastewater, containing four types of veterinary antibiotics (sulfamethazine, sulfathiazole, chlortetracycline, oxytetracycline), and the removal efficiencies of different treatment processes. Chlortetracycline had the highest average influent concentration (483.7 μg/L), followed by sulfamethazine (251.2 μg/L), sulfathiazole (230.8 μg/L) and oxytetracycline (25.7 μg/L), at five livestock wastewater treatment plants. Sulfathiazole had the highest average effluent concentration (28.2 μg/L), followed by sulfamethazine (20.8 μg/L) and chlortetracycline (11.5 μg/L), while no oxytetracycline was detected. For veterinary antibiotics in the wastewater, a removal efficiency of at least 90% was observed with five types of treatment processes, including a bio-ceramic sequencing batch reactor, liquid-phase flotation, membrane bioreactor, bioreactor plus ultrafiltration (BIOSUF) and bio best bacillus systems. Moreover, this study evaluated the removal efficiency via laboratory-scale experiments on the conventional contaminants, such as organic matter, nitrogen, phosphorus and veterinary antibiotics. This was done using the hydraulic retention time (HRT), under three temporal conditions (14 h, 18 h, 27 h), using the anaerobic–anoxic–oxic (A2O) process, in an attempt to assess the combined livestock wastewater treatment process where the livestock wastewater is treated until certain levels of water quality are achieved, and then the effluent is discharged to nearby sewage treatment plants for further treatment. The removal efficiencies of veterinary antibiotics, especially oxytetracycline and chlortetracycline, were 86.5–88.8% and 87.9–90.8%, respectively, exhibiting no significant differences under various HRT conditions. The removal efficiency of sulfamethazine was at least 20% higher at HRT = 27 h than at HRT = 14 h, indicating that sulfamethazine was efficiently removed in the A2O process with increased HRT. This study is expected to promote a comprehensive understanding of the behavior and removal of veterinary antibiotics in the livestock wastewater treatment plants of South Korea. Keywords: veterinary antibiotic; livestock wastewater; removal efficiency; treatment process 1. Introduction Frequent detection of veterinary antibiotics in aquatic environments, although these substances were originally intended for the prevention and treatment of animal diseases, has recently emerged as a major social issue [1]. Veterinary antibiotics discharged into the environment have been the cause of Processes 2020, 8, 720; doi:10.3390/pr8060720 www.mdpi.com/journal/processes
-
Upload
khangminh22 -
Category
Documents
-
view
2 -
download
0
Transcript of Occurrence and Removal of Veterinary Antibiotics in Livestock ...
processes
Article
Occurrence and Removal of Veterinary Antibiotics inLivestock Wastewater Treatment Plants, South Korea
Jin-Pil Kim 1, Dal Rae Jin 2, Wonseok Lee 3, Minhee Chae 1 and Junwon Park 4,*1 Geum River Environment Research Center, 182-18 Jiyong-ro, Okcheon-eup, Okcheon-gun,
Chungcheongbuk-do 29027, Korea; [email protected] (J.-P.K.); [email protected] (M.C.)2 Division of Water Environmental Engineering Research, National Institute of Environmental Research, 42,
Hwangyeong-ro, Seo-gu, Incheon 22689, Korea; [email protected] Division of Waste-to-Energy Research, National Institute of Environmental Research, 42, Hwangyeong-ro,
Seo-gu, Incheon 22689, Korea; [email protected] Division of Monitoring and Analysis, Yeongsan River Basin Environmental Office, 31, Gyesuro, Seo-gu,
Gwangju 61945, Korea* Correspondence: [email protected]
Received: 18 May 2020; Accepted: 17 June 2020; Published: 21 June 2020�����������������
Abstract: In this study, livestock wastewater treatment plants in South Korea were monitoredto determine the characteristics of influent and effluent wastewater, containing four types ofveterinary antibiotics (sulfamethazine, sulfathiazole, chlortetracycline, oxytetracycline), and theremoval efficiencies of different treatment processes. Chlortetracycline had the highest averageinfluent concentration (483.7 µg/L), followed by sulfamethazine (251.2 µg/L), sulfathiazole (230.8 µg/L)and oxytetracycline (25.7 µg/L), at five livestock wastewater treatment plants. Sulfathiazole hadthe highest average effluent concentration (28.2 µg/L), followed by sulfamethazine (20.8 µg/L) andchlortetracycline (11.5 µg/L), while no oxytetracycline was detected. For veterinary antibiotics inthe wastewater, a removal efficiency of at least 90% was observed with five types of treatmentprocesses, including a bio-ceramic sequencing batch reactor, liquid-phase flotation, membranebioreactor, bioreactor plus ultrafiltration (BIOSUF) and bio best bacillus systems. Moreover, this studyevaluated the removal efficiency via laboratory-scale experiments on the conventional contaminants,such as organic matter, nitrogen, phosphorus and veterinary antibiotics. This was done usingthe hydraulic retention time (HRT), under three temporal conditions (14 h, 18 h, 27 h), using theanaerobic–anoxic–oxic (A2O) process, in an attempt to assess the combined livestock wastewatertreatment process where the livestock wastewater is treated until certain levels of water quality areachieved, and then the effluent is discharged to nearby sewage treatment plants for further treatment.The removal efficiencies of veterinary antibiotics, especially oxytetracycline and chlortetracycline,were 86.5–88.8% and 87.9–90.8%, respectively, exhibiting no significant differences under variousHRT conditions. The removal efficiency of sulfamethazine was at least 20% higher at HRT = 27 hthan at HRT = 14 h, indicating that sulfamethazine was efficiently removed in the A2O process withincreased HRT. This study is expected to promote a comprehensive understanding of the behaviorand removal of veterinary antibiotics in the livestock wastewater treatment plants of South Korea.
Keywords: veterinary antibiotic; livestock wastewater; removal efficiency; treatment process
1. Introduction
Frequent detection of veterinary antibiotics in aquatic environments, although these substanceswere originally intended for the prevention and treatment of animal diseases, has recently emerged asa major social issue [1]. Veterinary antibiotics discharged into the environment have been the cause of
Processes 2020, 8, 720; doi:10.3390/pr8060720 www.mdpi.com/journal/processes

Processes 2020, 8, 720 2 of 17
contamination in the aquatic environment from a variety of channels. Examples include inappropriateeffluent treatment at manufacturing plants or livestock wastewater treatment plants, the disposalof unused antibiotics into sewers or trash, and drugs metabolized by animals or discharged intact.The long-term presence of such materials in aquatic environments, even in trace quantities of ng/Lto µg/L, may have detrimental effects on an ecosystem [2]. Specifically, veterinary antibiotics oftenremain in the environment, and are likely to cause drug tolerance in living organisms. Consequently,global discussions are underway on potential countermeasures [3–5].
Wastewater treatment systems operating within livestock wastewater treatment plants must beinvestigated to ensure efficient livestock effluent management. In South Korea, livestock wastewatertreatment systems are largely divided into two types: an individual treatment method, that reduceseffluent contaminant concentrations below those required by water quality standards in the livestockwastewater treatment plants, and a combined treatment method, in which the livestock wastewateris treated until certain levels of water quality are achieved in the livestock wastewater treatmentplants, and then the effluent is injected into nearby sewage treatment plants for additional treatment.The combined treatment method for livestock wastewater can reduce construction costs, as wellas maintenance costs, thereby facilitating wastewater treatment operations. On the other hand,the combined treatment method may degrade the overall performance of the treatment processes ofsewage treatment plants, because the livestock wastewater, which is pretreated and from the livestockwastewater plant, is likely to contain high contaminant loads and highly concentrated antibiotics.Therefore, it is important to remove these substances efficiently in the combined treatment process.
Over the past decade, South Korea has seen both a decrease in the use of antibiotics (during2011), and a rebound (following 2014), for different livestock species (Table 1), and these are due tothe transitory impact of the foot-and-mouth disease outbreak in 2011 [6]. These figures indicate ahigher level of consumption of antibiotics per capita for livestock in South Korea compared to othercountries [7], thereby drawing attention to the issue of antibiotic overuse. The consumption of livestockantibiotics in South Korea is significantly higher than that of Sweden (80 t, 2003), Denmark (one of theworld’s major dairy producing countries) (170 t, 1997), and even higher than England (735 t, 2003) [8].
Table 1. Sales performance of antibiotics for different livestock species (Unit: kg) [6].
Year Cattle Swine Poultry Fishery Total
2009 63,066 551,109 205,622 178,370 998,1672010 57,443 581,507 204,472 203,490 1,046,9122011 57,726 459,320 199,929 239,316 956,2912012 65,456 448,676 194,309 227,928 936,3692013 63,538 384,296 159,290 213,235 820,3592014 72,414 428,283 150,580 241,855 893,1322015 71,133 480,718 156,903 200,933 909,6872016 69,419 502,068 156,554 235,776 963,8172017 88,741 536,431 153,563 247,841 1,026,5762018 93,398 490,528 157,401 241,889 983,216
With the danger of antibiotics becoming a global issue, antibiotic consumption has had to bemanaged at the national level. In the United States, the U.S. Geological Survey (USGS) conductsfull-scale research on the streams near large cities and agro-livestock industries [9], and the EUupdates 33 kinds of preferred compounds every four years, and continually adds new items [10].Other countries have actively engaged in research on the treatment of pharmaceutical wastewater, aswell as the monitoring of these in public waters, together with on-going research on the pharmaceuticalcharacteristics of different treatment processes [11,12]. Similarly, in South Korea, efforts have beenmade to investigate the development of pharmaceutical analytical methods, together with monitoringefforts for pharmaceuticals in public waters and in influents and effluents from sewage/wastewatertreatment plants [13–17]. Despite these efforts, there is still insufficient research addressing the

Processes 2020, 8, 720 3 of 17
occurrence and removal of veterinary antibiotics in livestock wastewater treatment. In previousstudies targeting antibiotics in sewage treatment plants, the detection limit precluded an accuraterepresentation of the concentration of veterinary antibiotics. The influent concentrations in sewagetreatment plants were limit of quantitation (LOQ)–0.645 µg/L for sulfathiazole, LOQ–0.343 µg/L forsulfamethazine, LOQ–0.06 µg/L for oxytetracycline, and LOQ–0.302 µg/L for chlortetracycline [16–20].Low or even negative removal efficiencies were also obtained for sulfathiazole (ranging from −163.4%to 53.0%), sulfamethazine (12.2% to 67.4%) and chlortetracycline (−88.1% to 0%) [16–20]. The reportedconcentration of antibiotics detected in sewage treatment plants and the negative removal efficiencymake it difficult to clearly understand the removal of antibiotics from these treatment plants, in orderto then develop an efficient way of removing the livestock wastewater in combined treatment plants.
Therefore, this study monitored the livestock wastewater treatment plants operated by five majortreatment processes in South Korea, in order to determine the characteristics of influent and effluentfor four antibiotics, and the removal efficiencies of different treatment processes. This study conductedlaboratory-scale experiments to evaluate the combined treatment method for livestock wastewater inthe anaerobic–noxic–oxic (A2O) process, which is commonly used by the sewage treatment plants inSouth Korea. It also investigated the removal efficiency of conventional contaminants, such as organicmatter, nitrogen and phosphorus, as well as veterinary antibiotics, based on the hydraulic retentiontime (HRT) of the treatment plants.
2. Materials and Methods
2.1. Survey Items
In this study, the selection of target indicators for monitoring was based on high levels of antibioticresistance, high risk and high consumption. The scope of the target indicator among pharmaceuticalswas limited to antibiotics because antibiotics have the greatest impact on the environment [21].To evaluate risks, this study consulted the results of research projects on environmental riskassessment of pharmaceutical residues, conducted by the Ministry of Environment in 2011 [22].Considering the detected concentration, ecotoxicity and unique characteristics of pharmaceuticals,this annual study selected 19 items that were expected to have high risk. Among them were 11 typesof antibiotics, including amoxicillin, chlortetracycline, ciprofloxacin, enrofloxacin, erythromycin,lincomycin, neomycin, oxytetracycline, sulfamethazine, sulfathiazole and tylosin. Of these, four typesof antibiotics—sulfamethazine, sulfathiazole, chlortetracycline and oxytetracycline (which are widelyused in livestock farming)—were finally selected as target indicators for monitoring.
2.2. Selection of Target Treatment Plants and Sampling Method
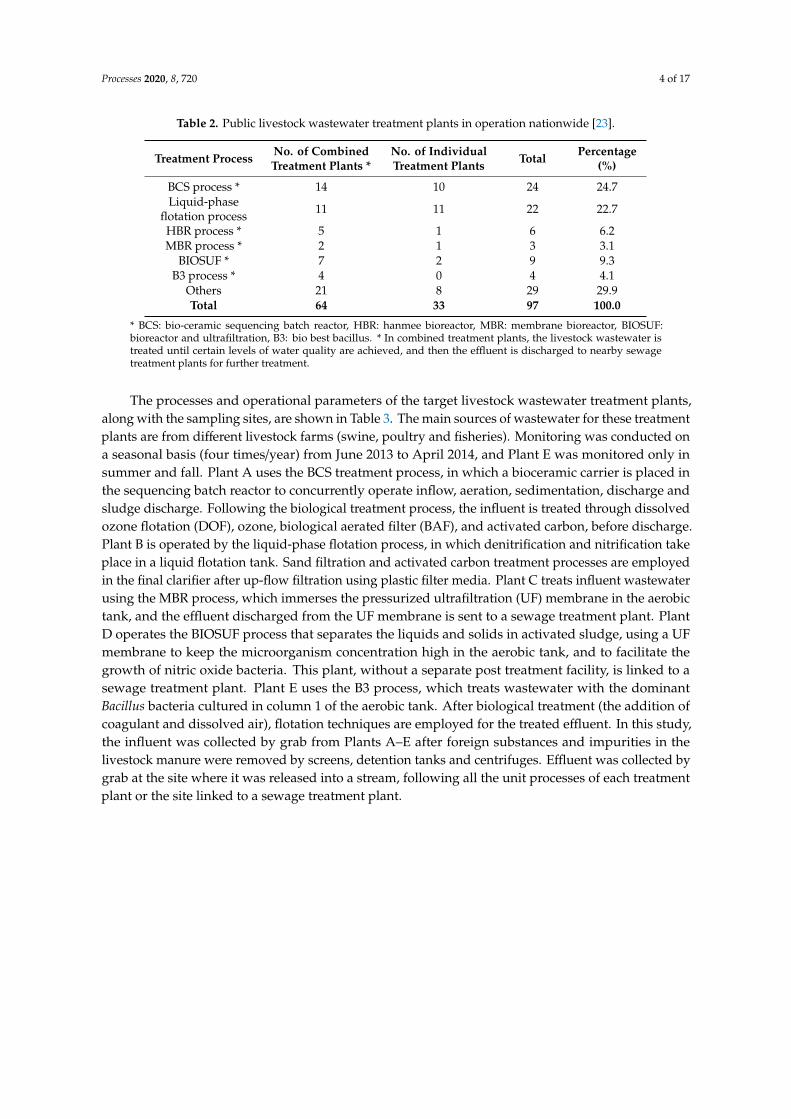
Table 2 shows the livestock wastewater treatment plants currently operating in South Korea [23].Survey results indicated 97 public livestock wastewater treatment plants across the country. The plantsthat used the five major treatment processes [bio-ceramic sequencing batch reactor (BCS), liquid-phaseflotation, membrane bioreactor (MBR), bioreactor plus ultrafiltration (BIOSUF), and Biobest Bacillus (B3)]were selected as target monitoring plants. These five processes are popular, biological, and advancedtreatment methods, and account for operations in approximately 70% of all treatment plants.
Processes 2020, 8, 720 4 of 17
Table 2. Public livestock wastewater treatment plants in operation nationwide [23].
Treatment Process No. of CombinedTreatment Plants *
No. of IndividualTreatment Plants Total Percentage
(%)
BCS process * 14 10 24 24.7Liquid-phase
flotation process 11 11 22 22.7
HBR process * 5 1 6 6.2MBR process * 2 1 3 3.1
BIOSUF * 7 2 9 9.3B3 process * 4 0 4 4.1
Others 21 8 29 29.9Total 64 33 97 100.0
* BCS: bio-ceramic sequencing batch reactor, HBR: hanmee bioreactor, MBR: membrane bioreactor, BIOSUF:bioreactor and ultrafiltration, B3: bio best bacillus. * In combined treatment plants, the livestock wastewater istreated until certain levels of water quality are achieved, and then the effluent is discharged to nearby sewagetreatment plants for further treatment.
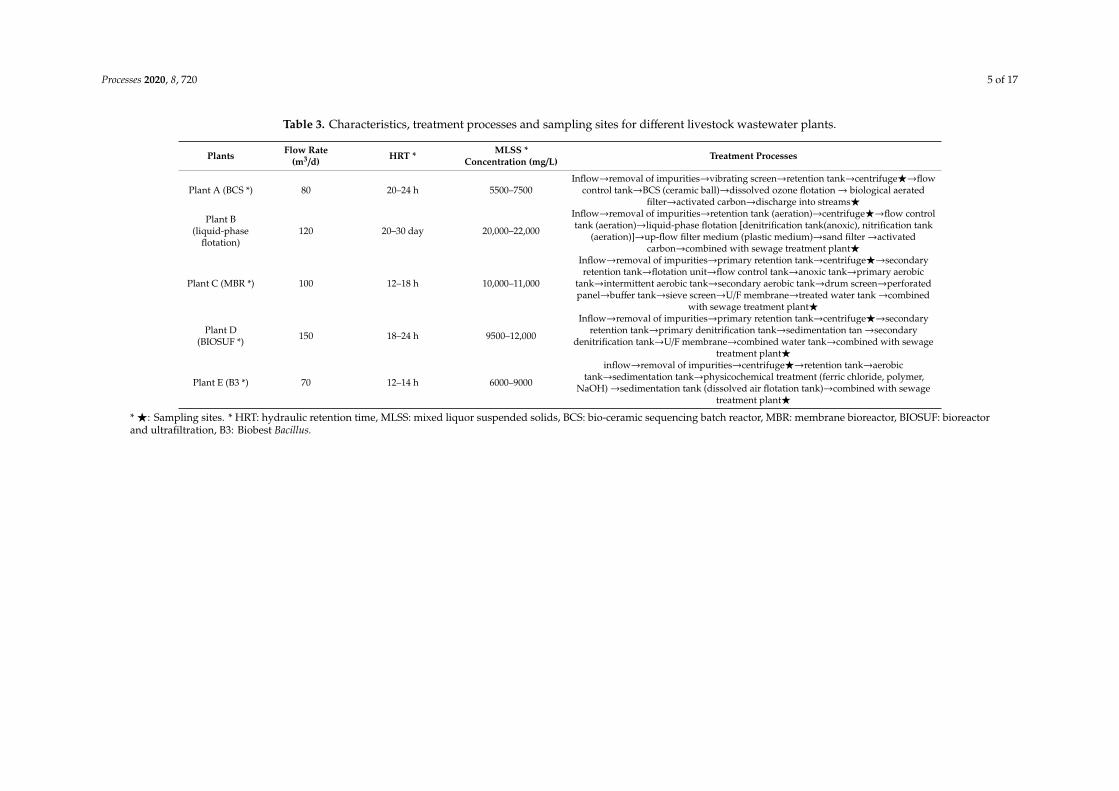
The processes and operational parameters of the target livestock wastewater treatment plants,along with the sampling sites, are shown in Table 3. The main sources of wastewater for these treatmentplants are from different livestock farms (swine, poultry and fisheries). Monitoring was conducted ona seasonal basis (four times/year) from June 2013 to April 2014, and Plant E was monitored only insummer and fall. Plant A uses the BCS treatment process, in which a bioceramic carrier is placed inthe sequencing batch reactor to concurrently operate inflow, aeration, sedimentation, discharge andsludge discharge. Following the biological treatment process, the influent is treated through dissolvedozone flotation (DOF), ozone, biological aerated filter (BAF), and activated carbon, before discharge.Plant B is operated by the liquid-phase flotation process, in which denitrification and nitrification takeplace in a liquid flotation tank. Sand filtration and activated carbon treatment processes are employedin the final clarifier after up-flow filtration using plastic filter media. Plant C treats influent wastewaterusing the MBR process, which immerses the pressurized ultrafiltration (UF) membrane in the aerobictank, and the effluent discharged from the UF membrane is sent to a sewage treatment plant. PlantD operates the BIOSUF process that separates the liquids and solids in activated sludge, using a UFmembrane to keep the microorganism concentration high in the aerobic tank, and to facilitate thegrowth of nitric oxide bacteria. This plant, without a separate post treatment facility, is linked to asewage treatment plant. Plant E uses the B3 process, which treats wastewater with the dominantBacillus bacteria cultured in column 1 of the aerobic tank. After biological treatment (the addition ofcoagulant and dissolved air), flotation techniques are employed for the treated effluent. In this study,the influent was collected by grab from Plants A–E after foreign substances and impurities in thelivestock manure were removed by screens, detention tanks and centrifuges. Effluent was collected bygrab at the site where it was released into a stream, following all the unit processes of each treatmentplant or the site linked to a sewage treatment plant.
Processes 2020, 8, 720 5 of 17
Table 3. Characteristics, treatment processes and sampling sites for different livestock wastewater plants.
Plants Flow Rate(m3/d) HRT * MLSS *
Concentration (mg/L) Treatment Processes
Plant A (BCS *) 80 20–24 h 5500–7500Inflow→removal of impurities→vibrating screen→retention tank→centrifugeF→flow
control tank→BCS (ceramic ball)→dissolved ozone flotation→ biological aeratedfilter→activated carbon→discharge into streamsF
Plant B(liquid-phase
flotation)120 20–30 day 20,000–22,000
Inflow→removal of impurities→retention tank (aeration)→centrifugeF→flow controltank (aeration)→liquid-phase flotation [denitrification tank(anoxic), nitrification tank
(aeration)]→up-flow filter medium (plastic medium)→sand filter→activatedcarbon→combined with sewage treatment plantF
Plant C (MBR *) 100 12–18 h 10,000–11,000
Inflow→removal of impurities→primary retention tank→centrifugeF→secondaryretention tank→flotation unit→flow control tank→anoxic tank→primary aerobic
tank→intermittent aerobic tank→secondary aerobic tank→drum screen→perforatedpanel→buffer tank→sieve screen→U/F membrane→treated water tank→combined
with sewage treatment plantF
Plant D(BIOSUF *) 150 18–24 h 9500–12,000
Inflow→removal of impurities→primary retention tank→centrifugeF→secondaryretention tank→primary denitrification tank→sedimentation tan→secondary
denitrification tank→U/F membrane→combined water tank→combined with sewagetreatment plantF
Plant E (B3 *) 70 12–14 h 6000–9000
inflow→removal of impurities→centrifugeF→retention tank→aerobictank→sedimentation tank→physicochemical treatment (ferric chloride, polymer,
NaOH)→sedimentation tank (dissolved air flotation tank)→combined with sewagetreatment plantF
*F: Sampling sites. * HRT: hydraulic retention time, MLSS: mixed liquor suspended solids, BCS: bio-ceramic sequencing batch reactor, MBR: membrane bioreactor, BIOSUF: bioreactorand ultrafiltration, B3: Biobest Bacillus.
Processes 2020, 8, 720 6 of 17
2.3. Sample Pretreatment and Analysis
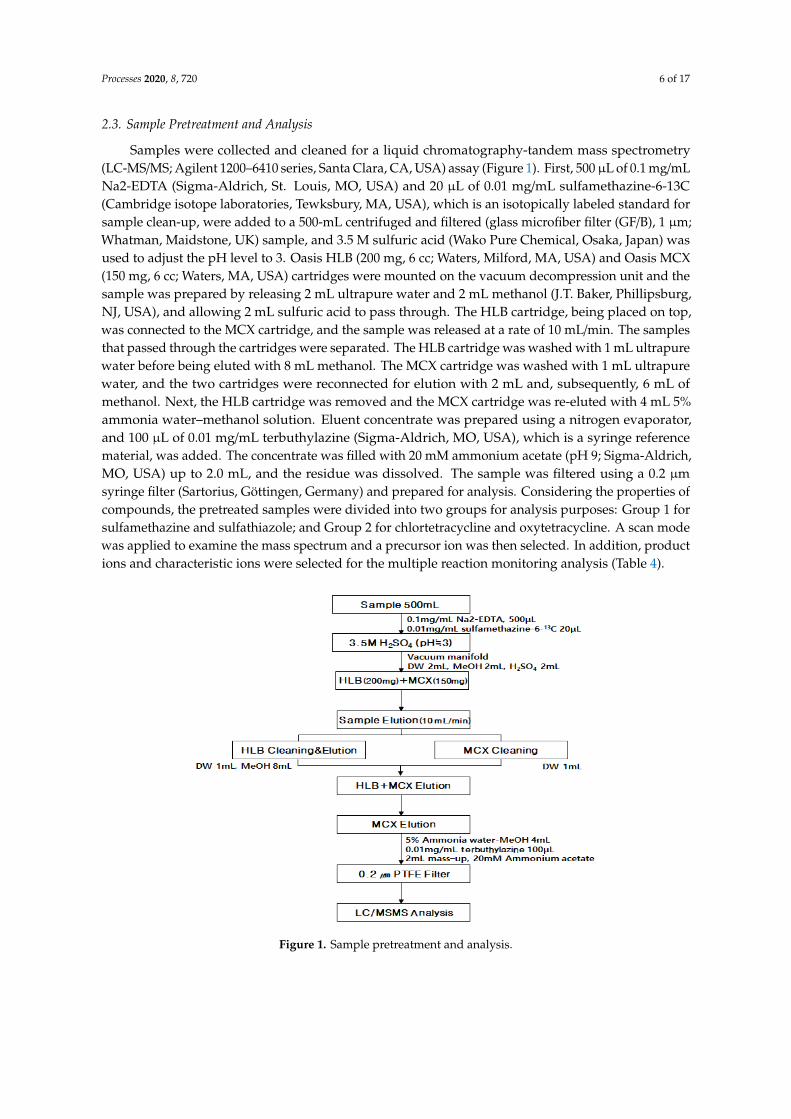
Samples were collected and cleaned for a liquid chromatography-tandem mass spectrometry(LC-MS/MS; Agilent 1200–6410 series, Santa Clara, CA, USA) assay (Figure 1). First, 500µL of 0.1 mg/mLNa2-EDTA (Sigma-Aldrich, St. Louis, MO, USA) and 20 µL of 0.01 mg/mL sulfamethazine-6-13C(Cambridge isotope laboratories, Tewksbury, MA, USA), which is an isotopically labeled standard forsample clean-up, were added to a 500-mL centrifuged and filtered (glass microfiber filter (GF/B), 1 µm;Whatman, Maidstone, UK) sample, and 3.5 M sulfuric acid (Wako Pure Chemical, Osaka, Japan) wasused to adjust the pH level to 3. Oasis HLB (200 mg, 6 cc; Waters, Milford, MA, USA) and Oasis MCX(150 mg, 6 cc; Waters, MA, USA) cartridges were mounted on the vacuum decompression unit and thesample was prepared by releasing 2 mL ultrapure water and 2 mL methanol (J.T. Baker, Phillipsburg,NJ, USA), and allowing 2 mL sulfuric acid to pass through. The HLB cartridge, being placed on top,was connected to the MCX cartridge, and the sample was released at a rate of 10 mL/min. The samplesthat passed through the cartridges were separated. The HLB cartridge was washed with 1 mL ultrapurewater before being eluted with 8 mL methanol. The MCX cartridge was washed with 1 mL ultrapurewater, and the two cartridges were reconnected for elution with 2 mL and, subsequently, 6 mL ofmethanol. Next, the HLB cartridge was removed and the MCX cartridge was re-eluted with 4 mL 5%ammonia water–methanol solution. Eluent concentrate was prepared using a nitrogen evaporator,and 100 µL of 0.01 mg/mL terbuthylazine (Sigma-Aldrich, MO, USA), which is a syringe referencematerial, was added. The concentrate was filled with 20 mM ammonium acetate (pH 9; Sigma-Aldrich,MO, USA) up to 2.0 mL, and the residue was dissolved. The sample was filtered using a 0.2 µmsyringe filter (Sartorius, Göttingen, Germany) and prepared for analysis. Considering the properties ofcompounds, the pretreated samples were divided into two groups for analysis purposes: Group 1 forsulfamethazine and sulfathiazole; and Group 2 for chlortetracycline and oxytetracycline. A scan modewas applied to examine the mass spectrum and a precursor ion was then selected. In addition, productions and characteristic ions were selected for the multiple reaction monitoring analysis (Table 4).
Processes 2020, 8, x FOR PEER REVIEW 6 of 17
2.3. Sample Pretreatment and Analysis
Samples were collected and cleaned for a liquid chromatography-tandem mass spectrometry
(LC-MS/MS; Agilent 1200–6410 series, Santa Clara, CA, USA) assay (Figure 1). First, 500 μL of 0.1
mg/mL Na2-EDTA (Sigma-Aldrich, St. Louis, MO, USA) and 20 μL of 0.01 mg/mL sulfamethazine-6-
13C (Cambridge isotope laboratories, Tewksbury, MA, USA), which is an isotopically labeled
standard for sample clean-up, were added to a 500-mL centrifuged and filtered (glass microfiber filter
(GF/B), 1 μm; Whatman, Maidstone, UK) sample, and 3.5 M sulfuric acid (Wako Pure Chemical,
Osaka, Japan) was used to adjust the pH level to 3. Oasis HLB (200 mg, 6 cc; Waters, Milford, MA,
USA) and Oasis MCX (150 mg, 6 cc; Waters, MA, USA) cartridges were mounted on the vacuum
decompression unit and the sample was prepared by releasing 2 mL ultrapure water and 2 mL
methanol (J.T. Baker, Phillipsburg, NJ, USA), and allowing 2 mL sulfuric acid to pass through. The
HLB cartridge, being placed on top, was connected to the MCX cartridge, and the sample was
released at a rate of 10 mL/min. The samples that passed through the cartridges were separated. The
HLB cartridge was washed with 1 mL ultrapure water before being eluted with 8 mL methanol. The
MCX cartridge was washed with 1 mL ultrapure water, and the two cartridges were reconnected for
elution with 2 mL and, subsequently, 6 mL of methanol. Next, the HLB cartridge was removed and
the MCX cartridge was re-eluted with 4 mL 5% ammonia water–methanol solution. Eluent
concentrate was prepared using a nitrogen evaporator, and 100 μL of 0.01 mg/mL terbuthylazine
(Sigma-Aldrich, MO, USA), which is a syringe reference material, was added. The concentrate was
filled with 20 mM ammonium acetate (pH 9; Sigma-Aldrich, MO, USA) up to 2.0 mL, and the residue
was dissolved. The sample was filtered using a 0.2 μm syringe filter (Sartorius, Göttingen, Germany)
and prepared for analysis. Considering the properties of compounds, the pretreated samples were
divided into two groups for analysis purposes: Group 1 for sulfamethazine and sulfathiazole; and
Group 2 for chlortetracycline and oxytetracycline. A scan mode was applied to examine the mass
spectrum and a precursor ion was then selected. In addition, product ions and characteristic ions
were selected for the multiple reaction monitoring analysis (Table 4).
Figure 1. Sample pretreatment and analysis.
Processes 2020, 8, 720 7 of 17
Table 4. Analytical conditions.
Parameters Conditions
Column UltraHT Pro C18, 50 × 2.0 mm I.d., 2 µmMobile phase (Group 1) A: 20 mM ammonium acetate (pH 6.5)
B: AcetonitrileMobile phase (Group 2) A: 20 mM ammonium formate (0.3% formic acid)
B: AcetonitrileColumn flow rate 0.3 mL/minInjection volume 5 µL
Column temperature 40 ◦CIonization mode ESI positiveCapillary voltage 4.5 kVGas temperature 350 ◦C
Gas flow 10 L/min (N2)Nebulizer 45 psi
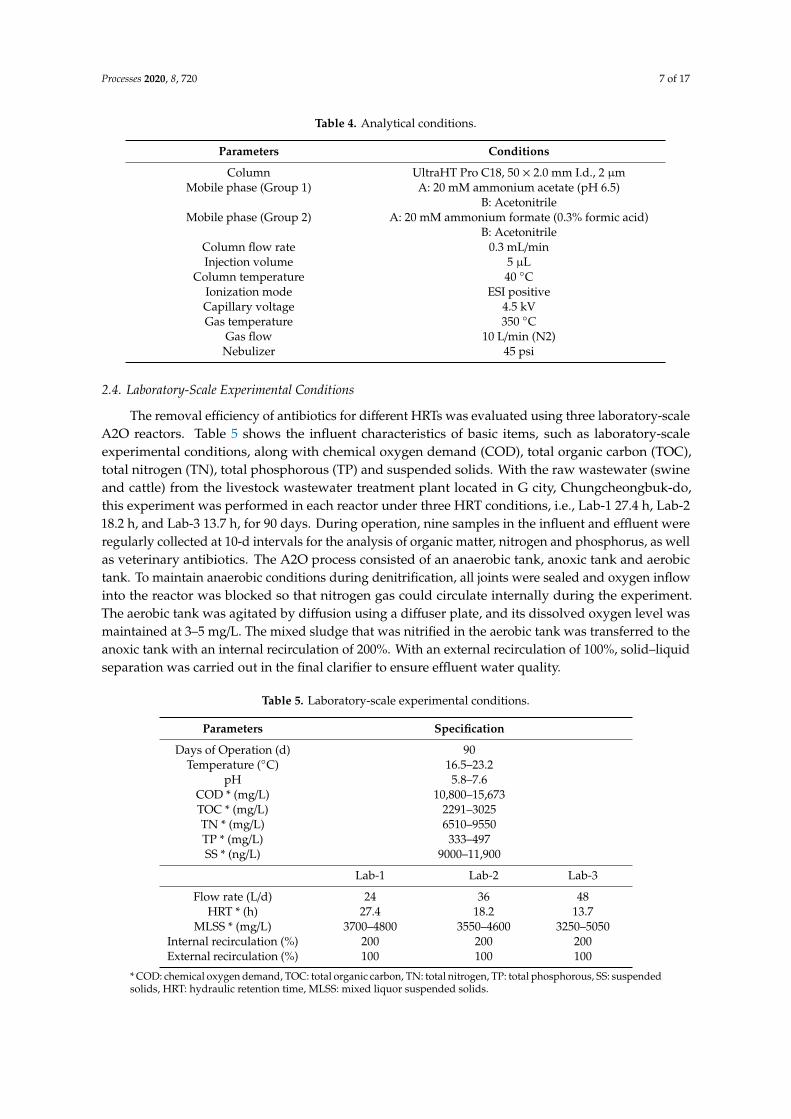
2.4. Laboratory-Scale Experimental Conditions
The removal efficiency of antibiotics for different HRTs was evaluated using three laboratory-scaleA2O reactors. Table 5 shows the influent characteristics of basic items, such as laboratory-scaleexperimental conditions, along with chemical oxygen demand (COD), total organic carbon (TOC),total nitrogen (TN), total phosphorous (TP) and suspended solids. With the raw wastewater (swineand cattle) from the livestock wastewater treatment plant located in G city, Chungcheongbuk-do,this experiment was performed in each reactor under three HRT conditions, i.e., Lab-1 27.4 h, Lab-218.2 h, and Lab-3 13.7 h, for 90 days. During operation, nine samples in the influent and effluent wereregularly collected at 10-d intervals for the analysis of organic matter, nitrogen and phosphorus, as wellas veterinary antibiotics. The A2O process consisted of an anaerobic tank, anoxic tank and aerobictank. To maintain anaerobic conditions during denitrification, all joints were sealed and oxygen inflowinto the reactor was blocked so that nitrogen gas could circulate internally during the experiment.The aerobic tank was agitated by diffusion using a diffuser plate, and its dissolved oxygen level wasmaintained at 3–5 mg/L. The mixed sludge that was nitrified in the aerobic tank was transferred to theanoxic tank with an internal recirculation of 200%. With an external recirculation of 100%, solid–liquidseparation was carried out in the final clarifier to ensure effluent water quality.
Table 5. Laboratory-scale experimental conditions.
Parameters Specification
Days of Operation (d) 90Temperature (◦C) 16.5–23.2
pH 5.8–7.6COD * (mg/L) 10,800–15,673TOC * (mg/L) 2291–3025TN * (mg/L) 6510–9550TP * (mg/L) 333–497SS * (ng/L) 9000–11,900
Lab-1 Lab-2 Lab-3
Flow rate (L/d) 24 36 48HRT * (h) 27.4 18.2 13.7
MLSS * (mg/L) 3700–4800 3550–4600 3250–5050Internal recirculation (%) 200 200 200External recirculation (%) 100 100 100
* COD: chemical oxygen demand, TOC: total organic carbon, TN: total nitrogen, TP: total phosphorous, SS: suspendedsolids, HRT: hydraulic retention time, MLSS: mixed liquor suspended solids.
Processes 2020, 8, 720 8 of 17
3. Results and Discussion
3.1. Results of Quality Control
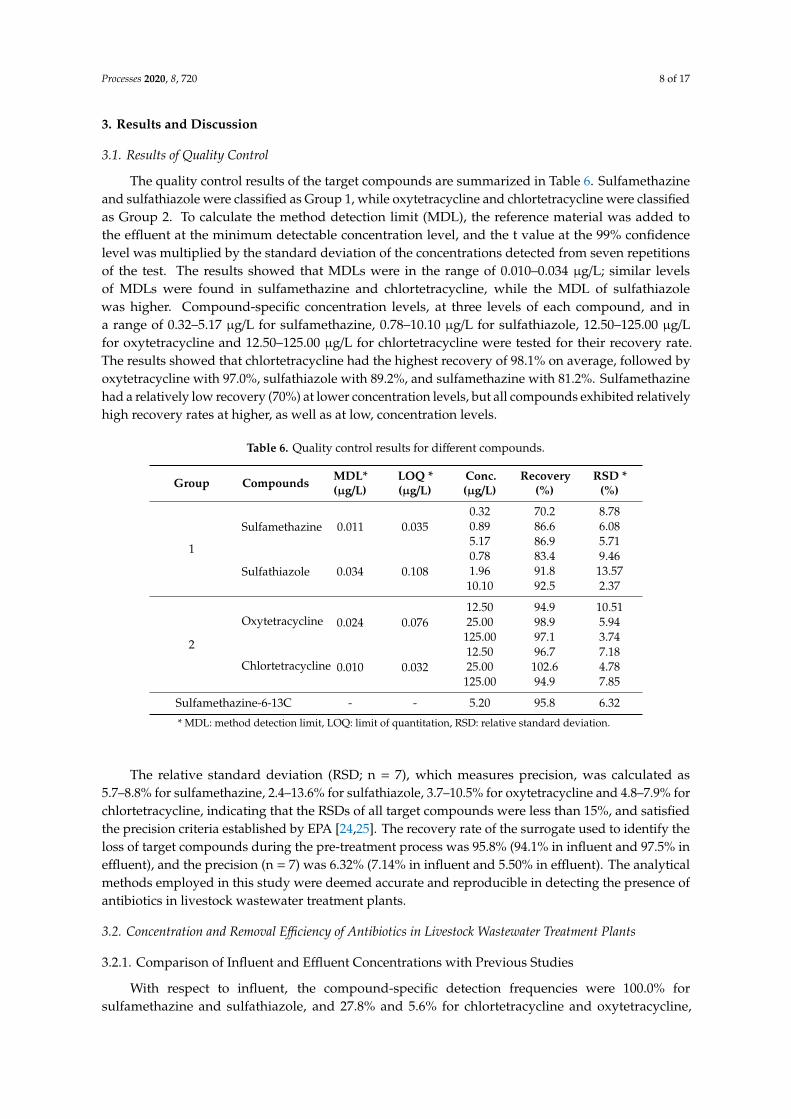
The quality control results of the target compounds are summarized in Table 6. Sulfamethazineand sulfathiazole were classified as Group 1, while oxytetracycline and chlortetracycline were classifiedas Group 2. To calculate the method detection limit (MDL), the reference material was added tothe effluent at the minimum detectable concentration level, and the t value at the 99% confidencelevel was multiplied by the standard deviation of the concentrations detected from seven repetitionsof the test. The results showed that MDLs were in the range of 0.010–0.034 µg/L; similar levelsof MDLs were found in sulfamethazine and chlortetracycline, while the MDL of sulfathiazolewas higher. Compound-specific concentration levels, at three levels of each compound, and ina range of 0.32–5.17 µg/L for sulfamethazine, 0.78–10.10 µg/L for sulfathiazole, 12.50–125.00 µg/Lfor oxytetracycline and 12.50–125.00 µg/L for chlortetracycline were tested for their recovery rate.The results showed that chlortetracycline had the highest recovery of 98.1% on average, followed byoxytetracycline with 97.0%, sulfathiazole with 89.2%, and sulfamethazine with 81.2%. Sulfamethazinehad a relatively low recovery (70%) at lower concentration levels, but all compounds exhibited relativelyhigh recovery rates at higher, as well as at low, concentration levels.
Table 6. Quality control results for different compounds.
Group Compounds MDL*(µg/L)
LOQ *(µg/L)
Conc.(µg/L)
Recovery(%)
RSD *(%)
1
Sulfamethazine 0.011 0.0350.32 70.2 8.780.89 86.6 6.085.17 86.9 5.71
Sulfathiazole 0.034 0.1080.78 83.4 9.461.96 91.8 13.5710.10 92.5 2.37
2
Oxytetracycline 0.024 0.07612.50 94.9 10.5125.00 98.9 5.94
125.00 97.1 3.74
Chlortetracycline 0.010 0.03212.50 96.7 7.1825.00 102.6 4.78
125.00 94.9 7.85
Sulfamethazine-6-13C - - 5.20 95.8 6.32
* MDL: method detection limit, LOQ: limit of quantitation, RSD: relative standard deviation.
The relative standard deviation (RSD; n = 7), which measures precision, was calculated as5.7–8.8% for sulfamethazine, 2.4–13.6% for sulfathiazole, 3.7–10.5% for oxytetracycline and 4.8–7.9% forchlortetracycline, indicating that the RSDs of all target compounds were less than 15%, and satisfiedthe precision criteria established by EPA [24,25]. The recovery rate of the surrogate used to identify theloss of target compounds during the pre-treatment process was 95.8% (94.1% in influent and 97.5% ineffluent), and the precision (n = 7) was 6.32% (7.14% in influent and 5.50% in effluent). The analyticalmethods employed in this study were deemed accurate and reproducible in detecting the presence ofantibiotics in livestock wastewater treatment plants.
3.2. Concentration and Removal Efficiency of Antibiotics in Livestock Wastewater Treatment Plants
3.2.1. Comparison of Influent and Effluent Concentrations with Previous Studies
With respect to influent, the compound-specific detection frequencies were 100.0% forsulfamethazine and sulfathiazole, and 27.8% and 5.6% for chlortetracycline and oxytetracycline,
Processes 2020, 8, 720 9 of 17
respectively, which are relatively high compared with other studies. The concentration levels of thedetected compounds are shown in Table 7 [18,26–32]
Table 7. Influent and effluent concentrations in livestock wastewater treatment plants at home andabroad (unit: µg/L).
Influent Effluent
Country ReferenceFrequency Concentration Frequency Concentration
Mean Range Mean Range
sulfamethazine
18/18 251.24 1.64–1629 9/18 20.82 N.D.*–115 Korea This study6/8 57.8 1.76–189 4/8 11.6 0.011–25.4 Korea [18]2/20 0.002 0.005–0.007 0/20 N.D N.D Korea [26]4/4 2.928 0.597–7.995 3/4 4.448 N.D.–7.300 Korea [27]8/10 148.5 N.D.–658.5 6/10 0.3236 N.D.–1.856 Korea [28]7/8 29.828 N.D.–69.69 1/8 4.656 N.D.–37.24 Korea [29]5/6 - 0.022–0.963 5/6 - 0.007–0.035 China [30]8/8 - 35.0–45.0 16/16 - 11.07–13.15 China [31]
sulfathiazole
18/18 230.78 0.75–922 7/18 28.20 N.D.–159 Korea This study8/8 153 7.44–403 5/8 72.2 0.028–170 Korea [18]0/20 N.D N.D 0/20 N.D N.D Korea [26]4/4 N.D 0.179–11.76 4/4 6.329 0.179–16.63 Korea [27]
10/10 666.6 0.193–2294 9/10 0.6567 N.D.–4.08 Korea [28]8/8 317.45 1.137–659.7 7/8 30.415 N.D.–241.7 Korea [29]
chlortetracycline
5/18 483.71 N.D.–1491 5/18 11.47 0.73–33.52 Korea This study2/8 20.7 1.37–40.0 2/8 1.05 0.067–2.03 Korea [18]0/20 N.D N.D 0/20 N.D N.D Korea [26]4/4 0.644 0.017–2.407 2/4 0.002 N.D.–0.003 Korea [27]2/10 4.680 N.D.–31.08 0/10 N.D N.D Korea [28]5/8 754.97 N.D.–2960 4/8 16.328 N.D.–129.2 Korea [29]5/6 - N.D.–1.74 6/6 - N.D.–0.056 China [30]- - N.D.–4.32 - - - Taiwan [32]
oxytetracycline
1/18 25.70 N.D.–25.70 0/18 - N.D Korea This study0/8 N.D N.D 1/8 0.42 N.D.–3.38 Korea [18]0/20 N.D N.D 0/20 N.D N.D Korea [26]4/4 2.291 0.038–8.50 2/4 1.834 N.D.–3.65 Korea [27]7/10 3.5578 N.D.–24.74 3/10 0.0928 N.D.–0.69 Korea [28]1/8 19.777 N.D.–158.2 1/8 0.0928 N.D.–0.28 Korea [29]6/6 - 1.76–76.4 5/6 - N.D.–1.82 China [30]8/8 - 25.0–58.0 16/16 - 2.2–4.34 China [31]- - N.D.–5.33 Taiwan [32]
* N.D.: Not Detected.
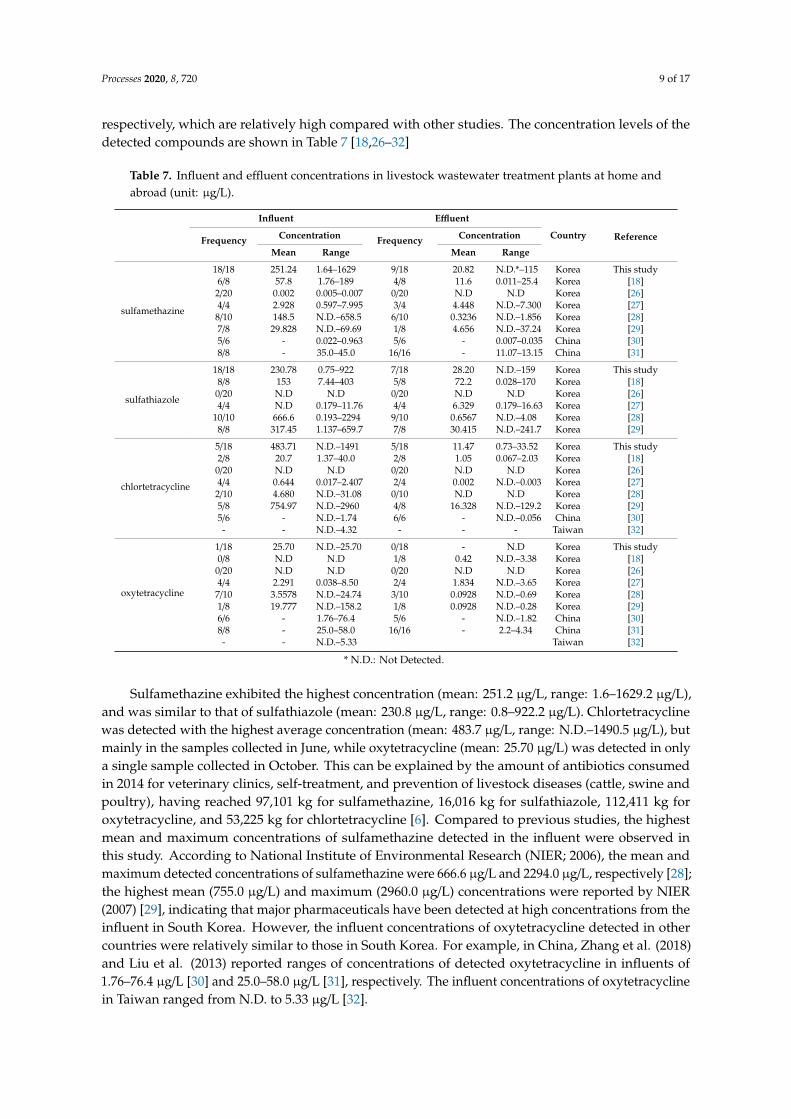
Sulfamethazine exhibited the highest concentration (mean: 251.2 µg/L, range: 1.6–1629.2 µg/L),and was similar to that of sulfathiazole (mean: 230.8 µg/L, range: 0.8–922.2 µg/L). Chlortetracyclinewas detected with the highest average concentration (mean: 483.7 µg/L, range: N.D.–1490.5 µg/L), butmainly in the samples collected in June, while oxytetracycline (mean: 25.70 µg/L) was detected in onlya single sample collected in October. This can be explained by the amount of antibiotics consumedin 2014 for veterinary clinics, self-treatment, and prevention of livestock diseases (cattle, swine andpoultry), having reached 97,101 kg for sulfamethazine, 16,016 kg for sulfathiazole, 112,411 kg foroxytetracycline, and 53,225 kg for chlortetracycline [6]. Compared to previous studies, the highestmean and maximum concentrations of sulfamethazine detected in the influent were observed inthis study. According to National Institute of Environmental Research (NIER; 2006), the mean andmaximum detected concentrations of sulfamethazine were 666.6 µg/L and 2294.0 µg/L, respectively [28];the highest mean (755.0 µg/L) and maximum (2960.0 µg/L) concentrations were reported by NIER(2007) [29], indicating that major pharmaceuticals have been detected at high concentrations from theinfluent in South Korea. However, the influent concentrations of oxytetracycline detected in othercountries were relatively similar to those in South Korea. For example, in China, Zhang et al. (2018)and Liu et al. (2013) reported ranges of concentrations of detected oxytetracycline in influents of1.76–76.4 µg/L [30] and 25.0–58.0 µg/L [31], respectively. The influent concentrations of oxytetracyclinein Taiwan ranged from N.D. to 5.33 µg/L [32].
Processes 2020, 8, 720 10 of 17
With respect to the effluent, the detection frequencies of sulfamethazine, sulfathiazole andoxytetracycline were reported as 60.0%, 90.0% and 30.0%, respectively, in NIER (2006) [28]. Beingsimilar to each other, sulfathiazole (mean: 28.2 µg/L, range: N.D.–158.7 µg/L) and sulfamethazine(mean: 20.8 µg/L, range: N.D.–115.9 µg/L) were detected at the highest concentrations. They werefollowed by chlortetracycline (mean: 11.5 µg/L, range: 0.7–33.5 µg/L), and no oxytetracycline wasdetected. Compared to previous studies, the highest compound-specific detection concentration forthe effluent was reported in this study, but the high concentration was only observed from a samplecollected in October. NIER (2007) reported the highest mean concentrations of sulfathiazole andchlortetracycline detected in the effluent (30.4 µg/L, and 16.3 µg/L, respectively) [29], and Liu et al.(2013) reported relatively high concentrations (2.2–4.34 µg/L) of oxytetracycline [31]. A comparison wasmade between detection concentrations by country, and the results showed that sulfamethazine andchlortetracycline were detected at the highest concentrations in South Korea, and high concentrationlevels of oxytetracycline were detected in the influent of South Korea, as compared to China andTaiwan. Higher concentrations of antibiotics in the effluent of wastewater treatment plants werealso observed in South Korea, which highlights the need to develop policies and regulations on thedischarge of pharmaceuticals into the environment.
3.2.2. Seasonal Influent Characteristics
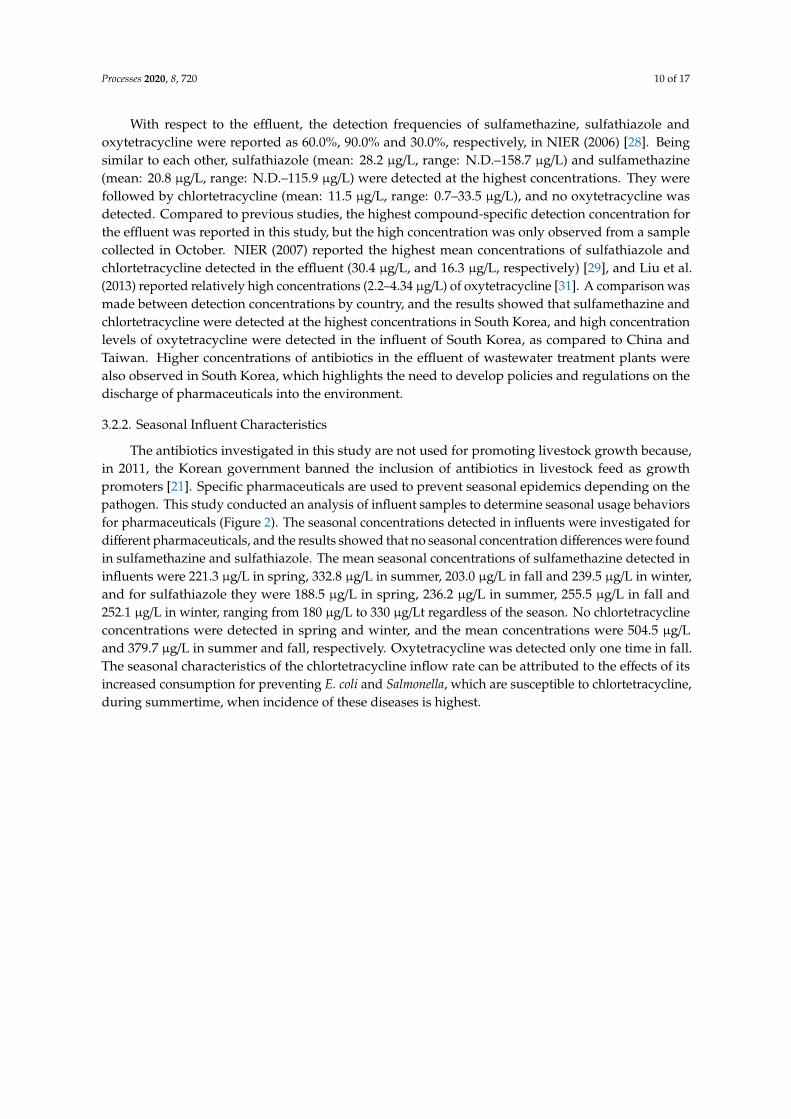
The antibiotics investigated in this study are not used for promoting livestock growth because,in 2011, the Korean government banned the inclusion of antibiotics in livestock feed as growthpromoters [21]. Specific pharmaceuticals are used to prevent seasonal epidemics depending on thepathogen. This study conducted an analysis of influent samples to determine seasonal usage behaviorsfor pharmaceuticals (Figure 2). The seasonal concentrations detected in influents were investigated fordifferent pharmaceuticals, and the results showed that no seasonal concentration differences were foundin sulfamethazine and sulfathiazole. The mean seasonal concentrations of sulfamethazine detected ininfluents were 221.3 µg/L in spring, 332.8 µg/L in summer, 203.0 µg/L in fall and 239.5 µg/L in winter,and for sulfathiazole they were 188.5 µg/L in spring, 236.2 µg/L in summer, 255.5 µg/L in fall and252.1 µg/L in winter, ranging from 180 µg/L to 330 µg/Lt regardless of the season. No chlortetracyclineconcentrations were detected in spring and winter, and the mean concentrations were 504.5 µg/Land 379.7 µg/L in summer and fall, respectively. Oxytetracycline was detected only one time in fall.The seasonal characteristics of the chlortetracycline inflow rate can be attributed to the effects of itsincreased consumption for preventing E. coli and Salmonella, which are susceptible to chlortetracycline,during summertime, when incidence of these diseases is highest.
Processes 2020, 8, 720 11 of 17
Processes 2020, 8, x FOR PEER REVIEW 11 of 17
sulfamethazine detected in influents were 221.3 μg/L in spring, 332.8 μg/L in summer, 203.0 μg/L in
fall and 239.5 μg/L in winter, and for sulfathiazole they were 188.5 μg/L in spring, 236.2 μg/L in
summer, 255.5 μg/L in fall and 252.1 μg/L in winter, ranging from 180 μg/L to 330 μg/Lt regardless
of the season. No chlortetracycline concentrations were detected in spring and winter, and the mean
concentrations were 504.5 μg/L and 379.7 μg/L in summer and fall, respectively. Oxytetracycline was
detected only one time in fall. The seasonal characteristics of the chlortetracycline inflow rate can be
attributed to the effects of its increased consumption for preventing E. coli and Salmonella, which are
susceptible to chlortetracycline, during summertime, when incidence of these diseases is highest.
Figure 2. Seasonal antibiotic concentrations detected in influents from targeted livestock wastewater
treatment plants (no data in spring and winter at B3). BCS: bio-ceramic sequencing batch reactor,
MBR: membrane bioreactor, BIOSUF: bioreactor and ultrafiltration, and B3: Biobest Bacillus.
The regional concentrations of antibiotics were also investigated. The use of antibiotics varied
depending on the type of livestock being raised near the wastewater treatment plants, as different
types of antibiotics are prescribed for different livestock species. The mean concentrations, by region,
of sulfamethazine and sulfathiazole were 910.8 μg/L and 613.1 μg/L, respectively, at Plant E, 287.1
μg/L and 165.5 μg/L, respectively, at Plant B, 358.2 μg/L and 269.7 μg/L, respectively, at Plant C, 17.0
μg/L and 42.0 μg/L, respectively, at Plant A, and 12.9 μg/L and 254.7μg/L, respectively, at Plant D;
Plant E had the highest concentration. For chlortetracycline, Plant A had the highest mean
concentration of 1490.5 μg/L, followed by Plant C (514.8 μg/L), Plant B (384.3 μg/L), Plant D (80.5
μg/L) and Plant E (47.9 μg/L). Oxytetracycline was only detected in Plant D at a mean concentration
of 25.7 μg/L, which can be attributed to the effects of fish farms and fishing areas near Plant D’s public
wastewater treatment facility, when considering that oxytetracycline is widely used for the treatment
of fish diseases [33].
3.2.3. Removal Efficiency by Treatment Process
Removal efficiencies of veterinary antibiotics in livestock wastewater treatment plants are
shown in Table 8. The results showed that sulfamethazine and sulfathiazole had the highest removal
efficiencies, of 99.7% and 100%, respectively, at Plant A, indicating that these compounds contained
in wastewater were fully treated in most cases. Furthermore, 99.5% and 99.4% removal efficiencies of
sulfamethazine and sulfathiazole, respectively, were reported for Plant B, 97.4% and 97.8%,
respectively, for Plant C, and 90.0% and 99.8%, respectively, for Plant D, indicating a high removal
efficiency in most treatment plants. In contrast, low treatment efficiencies were observed in fall and
summer at Plants C and D, respectively. For Plant E, low treatment efficiencies of 39.7% and 47.8%
were observed in fall for sulfamethazine and sulfathiazole, respectively, which is attributable to
Figure 2. Seasonal antibiotic concentrations detected in influents from targeted livestock wastewatertreatment plants (no data in spring and winter at B3). BCS: bio-ceramic sequencing batch reactor,MBR: membrane bioreactor, BIOSUF: bioreactor and ultrafiltration, and B3: Biobest Bacillus.
The regional concentrations of antibiotics were also investigated. The use of antibiotics varieddepending on the type of livestock being raised near the wastewater treatment plants, as differenttypes of antibiotics are prescribed for different livestock species. The mean concentrations, by region,of sulfamethazine and sulfathiazole were 910.8 µg/L and 613.1 µg/L, respectively, at Plant E, 287.1 µg/Land 165.5 µg/L, respectively, at Plant B, 358.2 µg/L and 269.7 µg/L, respectively, at Plant C, 17.0 µg/L and42.0 µg/L, respectively, at Plant A, and 12.9 µg/L and 254.7µg/L, respectively, at Plant D; Plant E had thehighest concentration. For chlortetracycline, Plant A had the highest mean concentration of 1490.5 µg/L,followed by Plant C (514.8 µg/L), Plant B (384.3 µg/L), Plant D (80.5 µg/L) and Plant E (47.9 µg/L).Oxytetracycline was only detected in Plant D at a mean concentration of 25.7 µg/L, which can beattributed to the effects of fish farms and fishing areas near Plant D’s public wastewater treatmentfacility, when considering that oxytetracycline is widely used for the treatment of fish diseases [33].
3.2.3. Removal Efficiency by Treatment Process
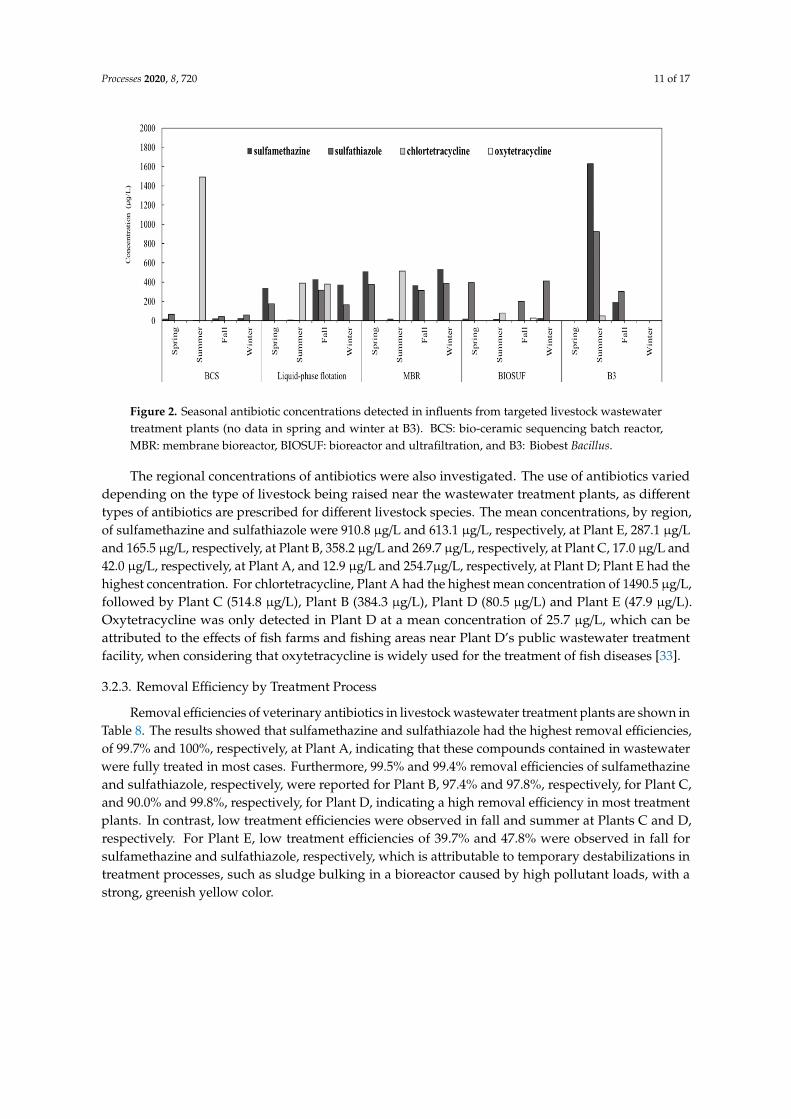
Removal efficiencies of veterinary antibiotics in livestock wastewater treatment plants are shown inTable 8. The results showed that sulfamethazine and sulfathiazole had the highest removal efficiencies,of 99.7% and 100%, respectively, at Plant A, indicating that these compounds contained in wastewaterwere fully treated in most cases. Furthermore, 99.5% and 99.4% removal efficiencies of sulfamethazineand sulfathiazole, respectively, were reported for Plant B, 97.4% and 97.8%, respectively, for Plant C,and 90.0% and 99.8%, respectively, for Plant D, indicating a high removal efficiency in most treatmentplants. In contrast, low treatment efficiencies were observed in fall and summer at Plants C and D,respectively. For Plant E, low treatment efficiencies of 39.7% and 47.8% were observed in fall forsulfamethazine and sulfathiazole, respectively, which is attributable to temporary destabilizations intreatment processes, such as sludge bulking in a bioreactor caused by high pollutant loads, with astrong, greenish yellow color.
Processes 2020, 8, 720 12 of 17
Table 8. Removal efficiencies of livestock wastewater treatment plants.
TreatmentPlant Influent Sulfamethazine Sulfathiazole Chlortetracycline Oxytetracycline
Plant A
Spring 99.0 100.0 - -Summer 100.0 100.0 100.0 -
Fall 100.0 100.0 - -Winter 100.0 100.0 - -
Plant B
Spring 98.0 97.6 - -Summer 100.0 100.0 98.3 -
Fall 100.0 100.0 99.2 -Winter 99.8 100.0 - -
Plant C
Spring 98.7 98.9 - -Summer 100.0 100.0 93.5 -
Fall 91.1 92.3 - -Winter 99.8 100.0 - -
Plant D
Spring 100.0 100.0 - -Summer 60.2 99.6 82.8 -
Fall 100.0 99.5 - 100.0Winter 100.0 100.0 - -
Plant ESummer 98.6 99.4 100.0 -
Fall 39.7 47.8 - -
As chlortetracycline and oxytetracycline had low detection frequencies, it was difficult to determinetheir seasonal differences, but both compounds exhibited a high treatment efficiency, exceeding 90%.However, for chlortetracycline, the summertime treatment efficiency at Plant D was 82.8%, which wasrelatively low. A comparison was made between the four treatment plants, except for Plant E, as itwas experiencing temporary problems with treatment processes. The results showed that most of theplants had an at least 90% treatment efficiency, revealing no major challenges in reducing the amountof veterinary antibiotics in wastewater. However, the monitoring results showed that insufficientoperation and management of a treatment plant may cause its treatment efficiency to fall below 50%,thereby suggesting the need for maintenance improvements.
3.3. Evaluation of Removal Performance According to HRT in Livestock Wastewater Treatment Using aLaboratory-Scale Reactor
3.3.1. Removal of Organic Matter, Nitrogen, and Phosphorus
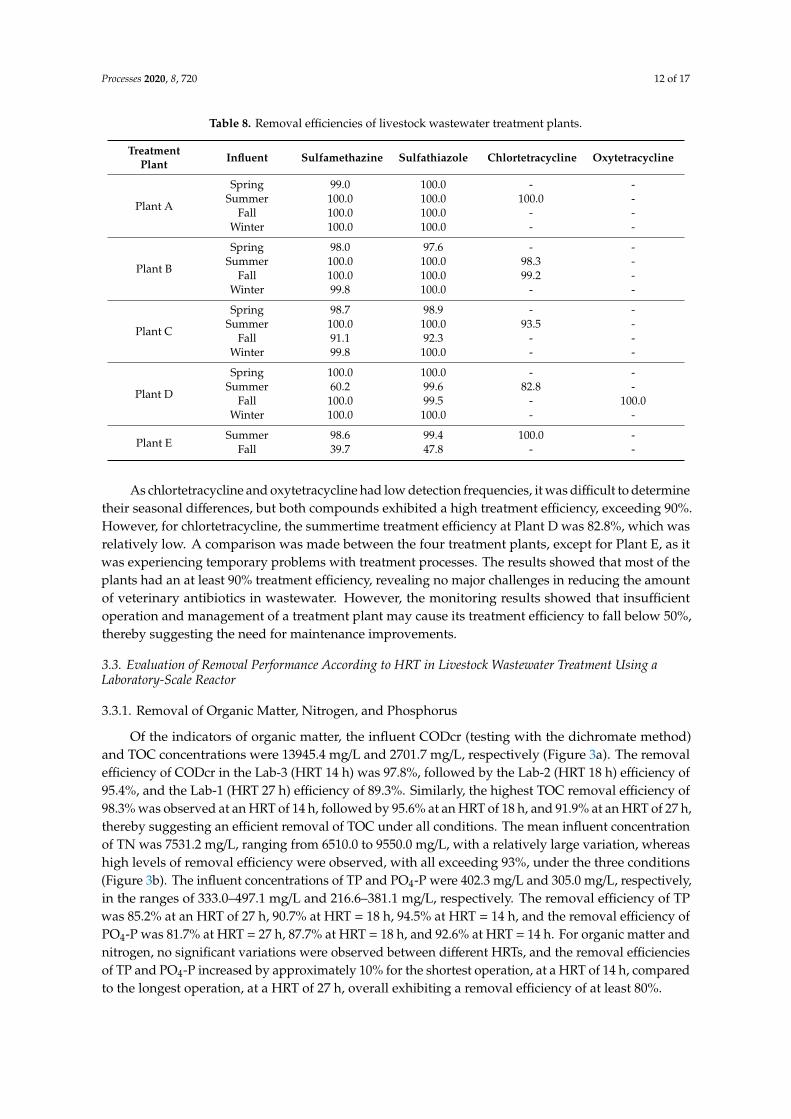
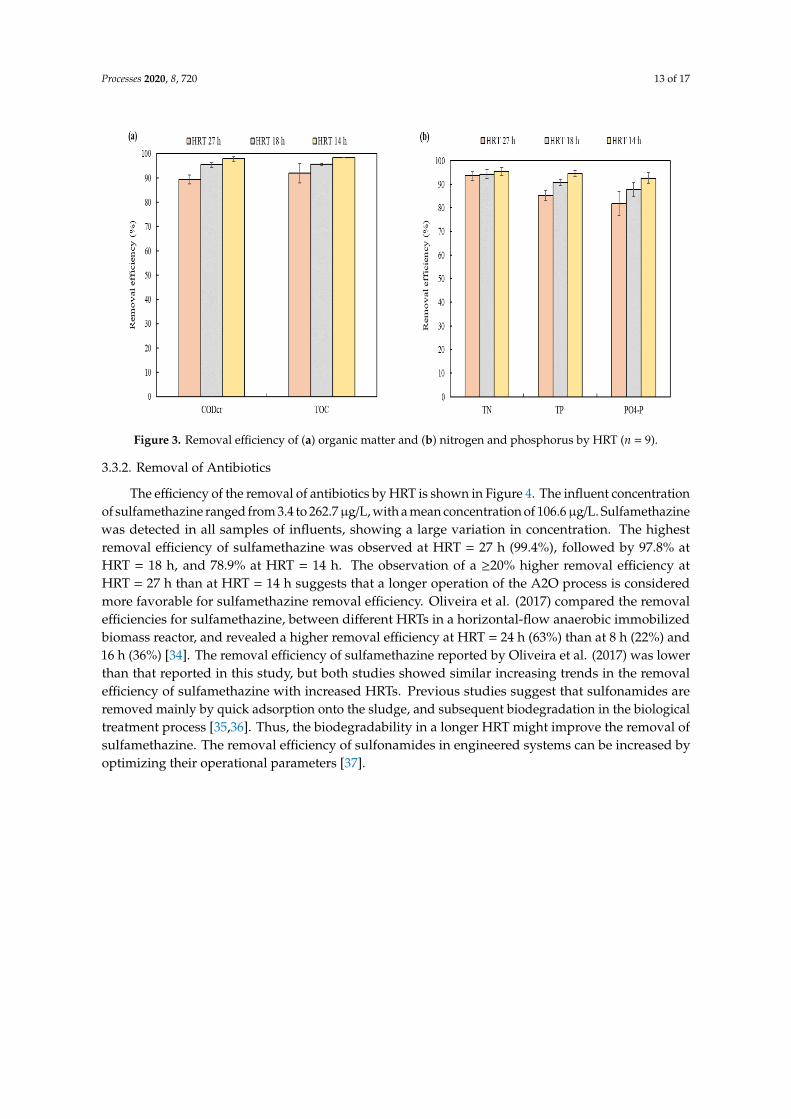
Of the indicators of organic matter, the influent CODcr (testing with the dichromate method)and TOC concentrations were 13945.4 mg/L and 2701.7 mg/L, respectively (Figure 3a). The removalefficiency of CODcr in the Lab-3 (HRT 14 h) was 97.8%, followed by the Lab-2 (HRT 18 h) efficiency of95.4%, and the Lab-1 (HRT 27 h) efficiency of 89.3%. Similarly, the highest TOC removal efficiency of98.3% was observed at an HRT of 14 h, followed by 95.6% at an HRT of 18 h, and 91.9% at an HRT of 27 h,thereby suggesting an efficient removal of TOC under all conditions. The mean influent concentrationof TN was 7531.2 mg/L, ranging from 6510.0 to 9550.0 mg/L, with a relatively large variation, whereashigh levels of removal efficiency were observed, with all exceeding 93%, under the three conditions(Figure 3b). The influent concentrations of TP and PO4-P were 402.3 mg/L and 305.0 mg/L, respectively,in the ranges of 333.0–497.1 mg/L and 216.6–381.1 mg/L, respectively. The removal efficiency of TPwas 85.2% at an HRT of 27 h, 90.7% at HRT = 18 h, 94.5% at HRT = 14 h, and the removal efficiency ofPO4-P was 81.7% at HRT = 27 h, 87.7% at HRT = 18 h, and 92.6% at HRT = 14 h. For organic matter andnitrogen, no significant variations were observed between different HRTs, and the removal efficienciesof TP and PO4-P increased by approximately 10% for the shortest operation, at a HRT of 14 h, comparedto the longest operation, at a HRT of 27 h, overall exhibiting a removal efficiency of at least 80%.
Processes 2020, 8, 720 13 of 17
Processes 2020, 8, x FOR PEER REVIEW 13 of 17
the removal efficiency of PO4-P was 81.7% at HRT = 27 h, 87.7% at HRT = 18 h, and 92.6% at HRT =
14 h. For organic matter and nitrogen, no significant variations were observed between different
HRTs, and the removal efficiencies of TP and PO4-P increased by approximately 10% for the shortest
operation, at a HRT of 14 h, compared to the longest operation, at a HRT of 27 h, overall exhibiting a
removal efficiency of at least 80%.
Figure 3. Removal efficiency of (a) organic matter and (b) nitrogen and phosphorus by HRT (n = 9).
3.3.2. Removal of Antibiotics
The efficiency of the removal of antibiotics by HRT is shown in Figure 4. The influent
concentration of sulfamethazine ranged from 3.4 to 262.7 μg/L, with a mean concentration of 106.6
μg/L. Sulfamethazine was detected in all samples of influents, showing a large variation in
concentration. The highest removal efficiency of sulfamethazine was observed at HRT = 27 h (99.4%),
followed by 97.8% at HRT = 18 h, and 78.9% at HRT = 14 h. The observation of a ≥ 20% higher removal
efficiency at HRT = 27 h than at HRT = 14 h suggests that a longer operation of the A2O process is
considered more favorable for sulfamethazine removal efficiency. Oliveira et al. (2017) compared the
removal efficiencies for sulfamethazine, between different HRTs in a horizontal-flow anaerobic
immobilized biomass reactor, and revealed a higher removal efficiency at HRT = 24 h (63%) than at 8
h (22%) and 16 h (36%) [34]. The removal efficiency of sulfamethazine reported by Oliveira et al.
(2017) was lower than that reported in this study, but both studies showed similar increasing trends
in the removal efficiency of sulfamethazine with increased HRTs. Previous studies suggest that
sulfonamides are removed mainly by quick adsorption onto the sludge, and subsequent
biodegradation in the biological treatment process [35,36]. Thus, the biodegradability in a longer HRT
might improve the removal of sulfamethazine. The removal efficiency of sulfonamides in engineered
systems can be increased by optimizing their operational parameters [37].
Figure 3. Removal efficiency of (a) organic matter and (b) nitrogen and phosphorus by HRT (n = 9).
3.3.2. Removal of Antibiotics
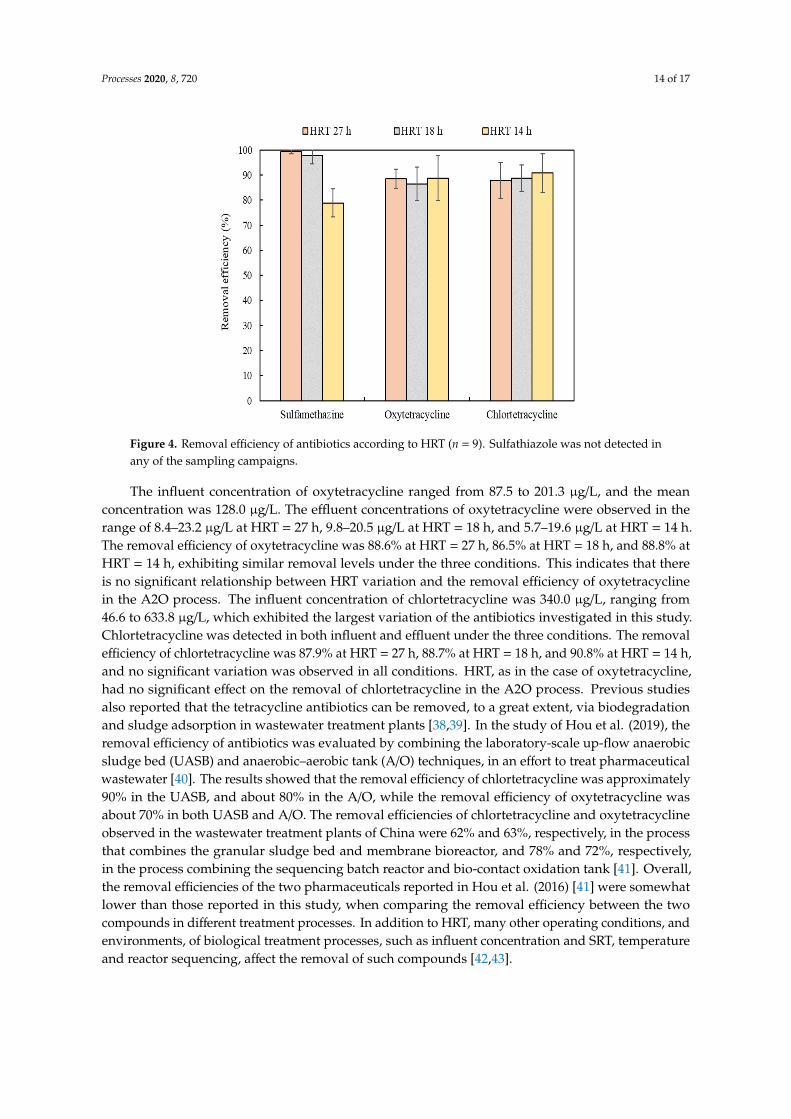
The efficiency of the removal of antibiotics by HRT is shown in Figure 4. The influent concentrationof sulfamethazine ranged from 3.4 to 262.7µg/L, with a mean concentration of 106.6µg/L. Sulfamethazinewas detected in all samples of influents, showing a large variation in concentration. The highestremoval efficiency of sulfamethazine was observed at HRT = 27 h (99.4%), followed by 97.8% atHRT = 18 h, and 78.9% at HRT = 14 h. The observation of a ≥20% higher removal efficiency atHRT = 27 h than at HRT = 14 h suggests that a longer operation of the A2O process is consideredmore favorable for sulfamethazine removal efficiency. Oliveira et al. (2017) compared the removalefficiencies for sulfamethazine, between different HRTs in a horizontal-flow anaerobic immobilizedbiomass reactor, and revealed a higher removal efficiency at HRT = 24 h (63%) than at 8 h (22%) and16 h (36%) [34]. The removal efficiency of sulfamethazine reported by Oliveira et al. (2017) was lowerthan that reported in this study, but both studies showed similar increasing trends in the removalefficiency of sulfamethazine with increased HRTs. Previous studies suggest that sulfonamides areremoved mainly by quick adsorption onto the sludge, and subsequent biodegradation in the biologicaltreatment process [35,36]. Thus, the biodegradability in a longer HRT might improve the removal ofsulfamethazine. The removal efficiency of sulfonamides in engineered systems can be increased byoptimizing their operational parameters [37].
Processes 2020, 8, 720 14 of 17Processes 2020, 8, x FOR PEER REVIEW 14 of 17
Figure 4. Removal efficiency of antibiotics according to HRT (n = 9). Sulfathiazole was not detected in
any of the sampling campaigns.
The influent concentration of oxytetracycline ranged from 87.5 to 201.3 μg/L, and the mean
concentration was 128.0 μg/L. The effluent concentrations of oxytetracycline were observed in the
range of 8.4–23.2 μg/L at HRT = 27 h, 9.8–20.5 μg/L at HRT = 18 h, and 5.7–19.6 μg/L at HRT = 14 h.
The removal efficiency of oxytetracycline was 88.6% at HRT = 27 h, 86.5% at HRT = 18 h, and 88.8%
at HRT = 14 h, exhibiting similar removal levels under the three conditions. This indicates that there
is no significant relationship between HRT variation and the removal efficiency of oxytetracycline in
the A2O process. The influent concentration of chlortetracycline was 340.0 μg/L, ranging from 46.6 to
633.8 μg/L, which exhibited the largest variation of the antibiotics investigated in this study.
Chlortetracycline was detected in both influent and effluent under the three conditions. The removal
efficiency of chlortetracycline was 87.9% at HRT = 27 h, 88.7% at HRT = 18 h, and 90.8% at HRT = 14
h, and no significant variation was observed in all conditions. HRT, as in the case of oxytetracycline,
had no significant effect on the removal of chlortetracycline in the A2O process. Previous studies also
reported that the tetracycline antibiotics can be removed, to a great extent, via biodegradation and
sludge adsorption in wastewater treatment plants [38,39]. In the study of Hou et al. (2019), the
removal efficiency of antibiotics was evaluated by combining the laboratory-scale up-flow anaerobic
sludge bed (UASB) and anaerobic–aerobic tank (A/O) techniques, in an effort to treat pharmaceutical
wastewater [40]. The results showed that the removal efficiency of chlortetracycline was
approximately 90% in the UASB, and about 80% in the A/O, while the removal efficiency of
oxytetracycline was about 70% in both UASB and A/O. The removal efficiencies of chlortetracycline
and oxytetracycline observed in the wastewater treatment plants of China were 62% and 63%,
respectively, in the process that combines the granular sludge bed and membrane bioreactor, and
78% and 72%, respectively, in the process combining the sequencing batch reactor and bio-contact
oxidation tank [41]. Overall, the removal efficiencies of the two pharmaceuticals reported in Hou et
al. (2016) [41] were somewhat lower than those reported in this study, when comparing the removal
efficiency between the two compounds in different treatment processes. In addition to HRT, many
other operating conditions, and environments, of biological treatment processes, such as influent
concentration and SRT, temperature and reactor sequencing, affect the removal of such compounds
[42,43].
Figure 4. Removal efficiency of antibiotics according to HRT (n = 9). Sulfathiazole was not detected inany of the sampling campaigns.
The influent concentration of oxytetracycline ranged from 87.5 to 201.3 µg/L, and the meanconcentration was 128.0 µg/L. The effluent concentrations of oxytetracycline were observed in therange of 8.4–23.2 µg/L at HRT = 27 h, 9.8–20.5 µg/L at HRT = 18 h, and 5.7–19.6 µg/L at HRT = 14 h.The removal efficiency of oxytetracycline was 88.6% at HRT = 27 h, 86.5% at HRT = 18 h, and 88.8% atHRT = 14 h, exhibiting similar removal levels under the three conditions. This indicates that thereis no significant relationship between HRT variation and the removal efficiency of oxytetracyclinein the A2O process. The influent concentration of chlortetracycline was 340.0 µg/L, ranging from46.6 to 633.8 µg/L, which exhibited the largest variation of the antibiotics investigated in this study.Chlortetracycline was detected in both influent and effluent under the three conditions. The removalefficiency of chlortetracycline was 87.9% at HRT = 27 h, 88.7% at HRT = 18 h, and 90.8% at HRT = 14 h,and no significant variation was observed in all conditions. HRT, as in the case of oxytetracycline,had no significant effect on the removal of chlortetracycline in the A2O process. Previous studiesalso reported that the tetracycline antibiotics can be removed, to a great extent, via biodegradationand sludge adsorption in wastewater treatment plants [38,39]. In the study of Hou et al. (2019), theremoval efficiency of antibiotics was evaluated by combining the laboratory-scale up-flow anaerobicsludge bed (UASB) and anaerobic–aerobic tank (A/O) techniques, in an effort to treat pharmaceuticalwastewater [40]. The results showed that the removal efficiency of chlortetracycline was approximately90% in the UASB, and about 80% in the A/O, while the removal efficiency of oxytetracycline wasabout 70% in both UASB and A/O. The removal efficiencies of chlortetracycline and oxytetracyclineobserved in the wastewater treatment plants of China were 62% and 63%, respectively, in the processthat combines the granular sludge bed and membrane bioreactor, and 78% and 72%, respectively,in the process combining the sequencing batch reactor and bio-contact oxidation tank [41]. Overall,the removal efficiencies of the two pharmaceuticals reported in Hou et al. (2016) [41] were somewhatlower than those reported in this study, when comparing the removal efficiency between the twocompounds in different treatment processes. In addition to HRT, many other operating conditions, andenvironments, of biological treatment processes, such as influent concentration and SRT, temperatureand reactor sequencing, affect the removal of such compounds [42,43].
Processes 2020, 8, 720 15 of 17
4. Conclusions
In this study, four types of veterinary antibiotics were investigated for their concentration, seasonalinfluent characteristics, and removal efficiency of different treatment processes in livestock wastewatertreatment plants. Chlortetracycline was detected at the highest concentration in influents, followed bysulfamethazine, sulfathiazole and oxytetracycline. Sulfathiazole was detected at the highest effluentconcentration, followed by sulfamethazine and chlortetracycline. A high removal efficiency (>90%),was observed in the four treatment plants. To evaluate the combined treatment measures for livestockwastewater in the A2O process, a laboratory-scale reactor was operated under three different HRTconditions. The highest removal efficiency of TP and PO4-P was obtained at HRT = 14 h in the shortestoperation, but the overall removal efficiency exceeded 80% under all conditions. For organic matterand nitrogen, no significant differences were observed in removal efficiency, even with varied HRTs.The removal efficiency of tetracycline antibiotics (oxytetracycline and chlortetracycline) ranged from86.5% to 88.8% and from 87.9% to 90.8%, respectively, exhibiting no significant differences in variedHRT conditions. The removal efficiency of sulfamethazine was at least 20% higher at HRT = 27 h thanat HRT = 14 h. This indicates that sulfamethazine was efficiently removed in the A2O process withincreased HRT. The experimental results obtained from the laboratory-scale reactor are expected to beuseful in removing the antibiotics, as well as the conventional contaminants, contained in livestockwastewater, which can be more effectively treated by combining the livestock wastewater treatmentplants and conventional sewage treatment plants.
Author Contributions: Conceptualization, J.-P.K. and D.R.J.; Methodology, D.R.J.; Validation, W.L. and J.P.;Investigation, D.R.J.; Writing—Original Draft Preparation, J.-P.K. and D.R.J.; Writing—Review and Editing, J.-P.K.and J.P.; Project Administration, M.C. and J.P.; Supervision, W.L.; Funding Acquisition, M.C. All authors have readand agreed to the published version of the manuscript.
Funding: This research was funded by National Institute of Environmental Research, Republic of Korea(No. NIER-2019-01-01-068).
Conflicts of Interest: The authors declare no conflict of interest.
References
1. Daughton, C.G. Pollution from the combined activities, actions, and behaviors of the public: Pharmaceuticalsand personal care products. NorCal SETAC News 2003, 14, 5–15.
2. Heberer, T. Occurrence, fate, and removal of pharmaceutical residues in the aquatic environment: A reviewof recent research data. Toxicol. Lett. 2002, 131, 5–17. [CrossRef]
3. World Health Organization. In Proceedings of the Medical Impact of the Use of Antimicrobials in FoodAnimals: Report of a WHO Meeting, Berlin, Germany, 13–17 October 1997.
4. World Health Organization. In Proceedings of the WHO Global Principles for the Containment ofAntimicrobial Resistance in Animals Intended for Food: Report of a WHO consultation with the participationof the Food and Agriculture Organization of the United Nations and the Office International des Epizooties,Geneva, Switzerland, 5–9 June 2000.
5. World Health Organization. WHO Global Strategy for Containment of Antimicrobial Resistance; World HealthOrganization: Geneva, Switzerland, 2001.
6. National Institute of Food and Drug Safety Evaluation. Nationwide Antibiotic Consumption and ResistanceMonitoring; National Institute of Food and Drug Safety Evaluation: Cheongju, Korea, 2018; pp. 9–17.
7. Ministry of Food and Drug Safety. Study on the Relationship of Antibiotic Use and Resistance; Ministry of Foodand Drug Safety: Cheongju, Korea, 2002.
8. Kim, J.; Oh, S.; Park, S.; Kim, P.-G.; Park, J.; Jeong, D.; Choi, K. Prioritizing Major Veterinary Antibiotics in Korea;Asia Pacific SETAC: Beijing, China, 2006.
9. Buxton, H.T.; Kolpin, D.W. Pharmaceuticals, Hormones, and Other Organic Wastewater Contaminants in U.S.Streams, 1999–2000: A National Reconnaissance; FS-027-02; U.S. Geological Survey Fact Sheet: Reston, VA,USA, 2002.
Processes 2020, 8, 720 16 of 17
10. Ellis, J. Pharmaceutical and personal care products (PPCPs) in urban receiving waters. Environ. Pollut. 2006,144, 184–189. [CrossRef]
11. Tayo, L.L.; Caparanga, A.R.; Doma, B.T.; Liao, C.-H. A review on the removal of Pharmaceutical and PersonalCare Products (PPCPs) using advanced oxidation processes. J. Adv. Oxid. Technol. 2018, 21, 196–214.[CrossRef]
12. Goel, M.; Das, A. A review on treatment of pharmaceuticals and personal care products (PPCPs) in water andwastewater. In Handbook of Environmental Materials Management; Springer: Berlin/Heidelberg, Germany, 2018.
13. Park, M.; Kim, B.; Myeong, S. The analysis of pharmaceuticals in drinking water (purified water) byHPLC/ESI-MS/MS. Korean Soc. Anal. Sci. 2010, 23, 457–464.
14. Kim, J.; Park, C.; Kim, M.; Ahn, S. Analysis of pharmaceutical residues on aquatic environment using LC/MS.Korean Soc. Environ. Sci. 2008, 11, 99–108.
15. Suh, C.; Kim, B.; Cho, H.; Nam, Y.; Kim, T.; Lee, M.; Myeong, S. Monitoring of pharmaceuticals from livestockwastewater treatment plants by LC/ESI-MS/MS. Korean Soc. Environ. Sci. 2009, 12, 273–282.
16. Park, J.; Yamashita, N.; Park, C.; Shimono, T.; Takeuchi, D.M.; Tanaka, H. Removal characteristics ofpharmaceuticals and personal care products: Comparison between membrane bioreactor and variousbiological treatment processes. Chemosphere 2017, 179, 347–358. [CrossRef]
17. Park, J.; Kim, C.; Hong, Y.; Lee, W.; Chung, H.; Jeong, D.-H.; Kim, H. Distribution and removal ofpharmaceuticals in liquid and solid phases in the unit processes of sewage treatment plants. Int. J. Environ.Res. Public Health 2020, 17, 687. [CrossRef]
18. Sim, W.; Lee, J.; Lee, E.; Shin, S.; Hwang, S.; Oh, J. Occurrence and distribution of pharmaceuticals inwastewater from households, livestock farms, hospitals and pharmaceutical manufactures. Chemosphere2011, 82, 179–186. [CrossRef]
19. Behera, S.K.; Kim, H.; Oh, J.; Park, H. Occurrence and removal of antibiotics, hormones and several otherpharmaceuticals in wastewater treatment plants of the largest industrial city of Korea. Sci. Total Environ.2011, 409, 4351–4360. [CrossRef] [PubMed]
20. Ekpeghere, K.L.; Lee, J.; Kim, H.; Shin, S.; Oh, J. Determination and characterization of pharmaceuticalsin sludge from municipal and livestock wastewater treatment plants. Chemosphere 2017, 168, 1211–1221.[CrossRef] [PubMed]
21. Maron, D.F.; Smith, T.J.; Nachman, K.E. Restrictions on antimicrobial use in food animal production: Aninternational regulatory and economic survey. Global Health 2013, 9, 48. [CrossRef]
22. National Institute of Environmental Research. Environmental Risk Assessment of Pharmaceutical Residues;Ministry of Environment: Sejong, Korea, 2011; pp. 34–59.
23. National Institute of Environmental Research. National Survey Data of Contaminants; Ministry of Environment:Sejong, Korea, 2019.
24. United States Environmental Protection Agency (U.S. EPA). Method 1694: Pharmaceuticals and Personal CareProducts in Water, Soil, Sediment, and Biosolids by HPLC/MS/MS; U.S. Environmental Protection Agency:Washington, DC, USA, 2007.
25. United States Environmental Protection Agency (U.S. EPA). Handbook for Analytical Quality Control in Waterand Wastewater Laboratories; U.S. Environmental Protection Agency: Washington, DC, USA, 1979.
26. National Institute of Environmental Research. A Study on the Investigation and Analysis of PharmaceuticalResidues (IV); Ministry of Environment: Sejong, Korea, 2011; pp. 191–240.
27. National Institute of Environmental Research. A Study on Sources and Behaviors of Pharmaceuticals Released intothe Environment (III); Ministry of Environment: Sejong, Korea, 2010; pp. 228–270.
28. National Institute of Environmental Research. A Study on the Investigation and Analysis of Pharmaceuticals inthe Environment; Ministry of Environment: Sejong, Korea, 2006; pp. 216–249.
29. National Institute of Environmental Research. A Study on the Investigation and Analysis of Pharmaceuticals inthe Environment (II); Ministry of Environment: Sejong, Korea, 2007; pp. 143–150.
30. Zhang, M.; Liu, Y.; Zhao, J.; Liu, W.; He, L.; Zhang, J.; Chen, J.; He, L.; Zhang, Q.; Ying, G.; et al. Occurrence,fate and mass loadings of antibiotics in two swine wastewater treatment systems. Sci. Total Environ. 2018,639, 1421–1431. [CrossRef]
31. Liu, L.; Liu, C.; Zheng, J.; Huang, X.; Wang, Z.; Liu, Y.; Zhu, G. Elimination of veterinary antibiotics andantibiotic resistance genes from swine wastewater in the vertical flow constructed wetlands. Chemosphere2013, 91, 1088–1093. [CrossRef] [PubMed]

Processes 2020, 8, 720 17 of 17
32. Chang, B.V.; Hsu, F.Y.; Liao, H.Y. Biodegradation of three tetracyclines in swine wastewater. J. Environ. Sci.Health B 2014, 49, 449–455. [CrossRef]
33. Jeong, H.; Chun, S. The utilization of antibiotics and the treatment of bacterial diseases in fish. J. Fish Pathol.1992, 5, 37–48.
34. Oliveira, G.H.D.; Santos-Neto, A.J.; Zaiat, M. Removal of the veterinary antimicrobial sulfamethazine ina horizonal-flow anaerobic immobilized biomass (HAIB) reactor subjected to step changes in the appliedorganic loading rate. J. Environ. Manag. 2017, 204, 674–683. [CrossRef]
35. Haung, M.; Tian, S.; Chen, D.; Zhang, W.; Wu, J.; Chen, L. Removal of sulfamethazine antibiotics by aerobicsludge and an isolated Achromobacter sp. S-3. J. Environ. Sci. 2012, 24, 1594–1599. [CrossRef]
36. Yang, N.; Wan, J.; Zhao, S.; Wang, Y. Removal of concentrated sulfamethazine by acclimatized aerobic sludgeand possible metabolic products. PeerJ 2015, 3, e1359. [CrossRef] [PubMed]
37. Chen, J.; Xie, S. Overview of sulfonamide biodegradation and the relevant pathways and microorganisms.Sci. Total Environ. 2018, 640–641, 1465–1477. [CrossRef] [PubMed]
38. Batt, A.L.; Kim, S.; Aga, D.S. Comparison of the occurrence of antibiotics in four full-scale wastewatertreatment plants with varying designs and operations. Chemosphere 2007, 68, 428–435. [CrossRef] [PubMed]
39. Guerra, P.; Kim, M.; Shah, A.; Alaee, M.; Smyth, S.A. Occurrence and fate of antibiotic,analgesic/anti-inflammatory, and antifungal compounds in five wastewater treatment processes. Sci.Total Environ. 2014, 473–474, 235–243. [CrossRef]
40. Hou, J.; Chen, Z.; Gao, J.; Xie, Y.; Li, L.; Qin, S.; Wang, Q.; Mao, D.; Luo, Y. Simultaneous removal of antibioticsand antibiotic resistance genes from pharmaceutical wastewater using the combinations of up-flow anaerobicsludge bed, anoxic-oxic tank, and advanced oxidation technologies. Water Res. 2019, 159, 511–520. [CrossRef][PubMed]
41. Hou, J.; Wang, C.; Mao, D.; Luo, Y. The occurrence and fate of tetracyclines in two pharmaceutical wastewatertreatment plants of Northern China. Environ. Sci. Pollut. Res. 2016, 23, 1722–1731. [CrossRef] [PubMed]
42. Gao, P.; Ding, Y.; Li, H.; Xagoraraki, I. Occurrence of pharmaceuticals in a municipal wastewater treatmentplant: Mass balance and removal processes. Chemosphere 2012, 88, 17–24. [CrossRef]
43. Luo, Y.; Guo, W.; Ngo, H.H.; Nghiem, L.D.; Hai, F.I.; Zhang, J.; Liang, S.; Wang, X.C. A review on theoccurrence of micropollutants in the aquatic environment and their fate and removal during wastewatertreatment. Sci. Total Environ. 2014, 473–474, 619–641. [CrossRef]
© 2020 by the authors. Licensee MDPI, Basel, Switzerland. This article is an open accessarticle distributed under the terms and conditions of the Creative Commons Attribution(CC BY) license (http://creativecommons.org/licenses/by/4.0/).