o, p′-DDT elicits PXR/CAR-, not ER-, mediated responses in the immature ovariectomized rat liver
14
TOXICOLOGICAL SCIENCES 101(2), 350–363 (2008) doi:10.1093/toxsci/kfm275 Advance Access publication November 5, 2007 o,p#-DDT Elicits PXR/CAR-, Not ER-, Mediated Responses in the Immature Ovariectomized Rat Liver Naoki Kiyosawa,* , † , ‡ Joshua C. Kwekel,* , ‡ Lyle D. Burgoon,* , ‡ Kurt J. Williams,§ Colleen Tashiro,k Brock Chittim,k and Timothy R. Zacharewski* , ‡ ,1 *Department of Biochemistry and Molecular Biology, Michigan State University, East Lansing, Michigan 48824; †Medicinal Safety Research Laboratories, Daiichi Sankyo Co., Ltd., Shizuoka 437-0065, Japan; ‡Center for Integrative Toxicology, and the National Food Safety and Toxicology Center, Michigan State University, East Lansing, Michigan 48824; §Department of Pathobiology and Diagnostic Investigation, Michigan State University, East Lansing, Michigan 48824; and kWellington Laboratories Inc., Guelph, Ontario N1G 3M5, Canada Received September 27, 2007; accepted November 1, 2007 Technical-grade dichlorodiphenyltrichloroethane (DDT) is an agricultural pesticide and malarial vector control agent that has been designated a potential human hepatocarcinogen. The o,p#- enantiomer exhibits estrogenic activity that has been associated with the carcinogenicity of DDT. The temporal and dose- dependent hepatic estrogenicity of o,p#-DDT was investigated using complementary DNA microarrays in immature ovariecto- mized Sprague-Dawley rats with complementary histopathology and tissue-level analysis. Animals were gavaged with 300 mg/kg o,p#-DDT either once or once daily for 3 consecutive days. Liver samples were examined 2, 4, 8, 12, 18, or 24 h after a single dose or following three daily doses. For dose-response studies, a single dose of 3, 10, 30, 100, or 300 mg/kg body weight o,p#-DTT was administered for 3 consecutive days. Genes associated with drug metabolism (Cyp2b2 and Cyp3a2), the nuclear receptors consti- tutive androstane receptor (CAR) and pregnane X receptor (PXR), cell proliferation (Ccnd1, Ccnb1, Ccnb2, and Stmn1), and oxidative stress (Gclm and Hmox1) were significantly induced. Cyp2b2 exhibited dose-dependent regulation and was significantly induced across all time points, while cell proliferation– and oxidative stress–related genes exhibited transient induction. The induction of Cyp2b2 and Cyp3a2 mRNA levels suggest PXR/ CAR activation, consistent with expression of genes associated with oxidative stress. Few genes known to be estrogen receptor (ER) regulated were differentially expressed when compared to the hepatic gene expression profile elicited by ethynyl estradiol in immature ovariectomized C57BL/6 mice using the same study design and analysis methods. These data indicate that o,p#-DDT elicits PXR/CAR-, not ER-, mediated gene expression in the rat liver. Based on the species-specific differences in CAR regulation, the extrapolation of rodent DDT hepatocarcinogenicity to humans warrants further investigation. Key Words: DDT; liver; microarray; CAR; carcinogenesis; estrogen. Technical-grade dichlorodiphenyltrichloroethane (DDT) is a mixture of enantiomers and related compounds. DDT and its major metabolites, including 1,1-dichloro-2,2-bis( p-chlorophenyl) ethylene and 1,1-dichloro-2,2-bis( p,p-chlorophenylethane; DDD), are lipophilic, persistent, and known to bioaccumulate (Bayen et al., 2005; Mansour, 2004; Minh et al., 2002). The use of DDT was banned in the United States in 1972 due to potential adverse effects in wildlife and humans associated with its estrogenicity and carcinogenicity (Longnecker, 2005; Turusov et al., 2002). Nevertheless, it is still used in many countries, especially for malaria vector control due to its overall cost-effectiveness (Attaran and Maharaj, 2000; Weissmann, 2006). DDT is reported to be a hepatic tumor promoter (Ito et al., 1983), with inconclusive genotoxicity activity and a non- genotoxic carcinogen in mice and rats. Although considered to be a risk factor (McGlynn et al., 2006), there is no significant correlation between DDT exposure and liver cancer incidence in humans (Cocco et al., 2005). Consequently, the International Agency for Research on Cancer (IARC) classifies it as a ‘‘possibly carcinogenic (Group 2B),’’ based on inadequate evidence of carcinogenicity in humans (IARC, 1991). In the fruit fly, DDT induced glutathione s-transferase and xenobiotic-metabolizing enzyme genes mediated by the nuclear receptor DHR90, an ortholog of the rodent constitutive androstane receptor (CAR) and pregnane X receptor (PXR) (King-Jones et al., 2006; Pedra et al., 2004; Willoughby et al., 2006). Cyp2b and Cyp3a mRNA levels are induced by p,p#- DDT, mediated by PXR/CAR (Wyde et al., 2003). CAR plays a significant role in tumor carcinogenesis in mice through the induction of drug-metabolizing enzymes and cell proliferation– related genes (Columbano et al., 2005; Huang et al., 2005; Yamamoto et al., 2004). The tumor promotion activity of phenobarbital (PB) is also abolished in CAR null mice (Yamamoto et al., 2004). Consequently, DDT may act as a PB-type hepatic tumor promoter through CAR activation in rats and mice. 1 To whom correspondence should be addressed at Department of Biochemistry and Molecular Biology, Michigan State University, East Lansing, MI 48824. Fax: (517) 353-9334. E-mail: [email protected]. Ó The Author 2007. Published by Oxford University Press on behalf of the Society of Toxicology. All rights reserved. For Permissions, please email: [email protected]
Transcript of o, p′-DDT elicits PXR/CAR-, not ER-, mediated responses in the immature ovariectomized rat liver
TOXICOLOGICAL SCIENCES 101(2), 350–363 (2008)
doi:10.1093/toxsci/kfm275
Advance Access publication November 5, 2007
o,p#-DDT Elicits PXR/CAR-, Not ER-, Mediated Responses in theImmature Ovariectomized Rat Liver
Naoki Kiyosawa,*,†,‡ Joshua C. Kwekel,*,‡ Lyle D. Burgoon,*,‡ Kurt J. Williams,§ Colleen Tashiro,k Brock Chittim,k and
Timothy R. Zacharewski*,‡,1
*Department of Biochemistry and Molecular Biology, Michigan State University, East Lansing, Michigan 48824; †Medicinal Safety Research Laboratories,
Daiichi Sankyo Co., Ltd., Shizuoka 437-0065, Japan; ‡Center for Integrative Toxicology, and the National Food Safety and Toxicology Center, Michigan State
University, East Lansing, Michigan 48824; §Department of Pathobiology and Diagnostic Investigation, Michigan State University, East Lansing, Michigan48824; and kWellington Laboratories Inc., Guelph, Ontario N1G 3M5, Canada
Received September 27, 2007; accepted November 1, 2007
Technical-grade dichlorodiphenyltrichloroethane (DDT) is an
agricultural pesticide and malarial vector control agent that has
been designated a potential human hepatocarcinogen. The o,p#-enantiomer exhibits estrogenic activity that has been associated
with the carcinogenicity of DDT. The temporal and dose-
dependent hepatic estrogenicity of o,p#-DDT was investigated
using complementary DNA microarrays in immature ovariecto-
mized Sprague-Dawley rats with complementary histopathology
and tissue-level analysis. Animals were gavaged with 300 mg/kg
o,p#-DDT either once or once daily for 3 consecutive days. Liver
samples were examined 2, 4, 8, 12, 18, or 24 h after a single dose or
following three daily doses. For dose-response studies, a single
dose of 3, 10, 30, 100, or 300 mg/kg body weight o,p#-DTT was
administered for 3 consecutive days. Genes associated with drug
metabolism (Cyp2b2 and Cyp3a2), the nuclear receptors consti-
tutive androstane receptor (CAR) and pregnane X receptor
(PXR), cell proliferation (Ccnd1, Ccnb1, Ccnb2, and Stmn1),
and oxidative stress (Gclm and Hmox1) were significantly
induced. Cyp2b2 exhibited dose-dependent regulation and was
significantly induced across all time points, while cell proliferation–
and oxidative stress–related genes exhibited transient induction.
The induction of Cyp2b2 and Cyp3a2 mRNA levels suggest PXR/
CAR activation, consistent with expression of genes associated
with oxidative stress. Few genes known to be estrogen receptor
(ER) regulated were differentially expressed when compared to
the hepatic gene expression profile elicited by ethynyl estradiol in
immature ovariectomized C57BL/6 mice using the same study
design and analysis methods. These data indicate that o,p#-DDT
elicits PXR/CAR-, not ER-, mediated gene expression in the rat
liver. Based on the species-specific differences in CAR regulation,
the extrapolation of rodent DDT hepatocarcinogenicity to
humans warrants further investigation.
Key Words: DDT; liver; microarray; CAR; carcinogenesis;
estrogen.
Technical-grade dichlorodiphenyltrichloroethane (DDT) is
a mixture of enantiomers and related compounds. DDT and its
major metabolites, including 1,1-dichloro-2,2-bis(p-chlorophenyl)
ethylene and 1,1-dichloro-2,2-bis( p,p-chlorophenylethane;
DDD), are lipophilic, persistent, and known to bioaccumulate
(Bayen et al., 2005; Mansour, 2004; Minh et al., 2002). The
use of DDT was banned in the United States in 1972 due to
potential adverse effects in wildlife and humans associated with
its estrogenicity and carcinogenicity (Longnecker, 2005;
Turusov et al., 2002). Nevertheless, it is still used in many
countries, especially for malaria vector control due to its
overall cost-effectiveness (Attaran and Maharaj, 2000;
Weissmann, 2006).
DDT is reported to be a hepatic tumor promoter (Ito et al.,1983), with inconclusive genotoxicity activity and a non-
genotoxic carcinogen in mice and rats. Although considered to
be a risk factor (McGlynn et al., 2006), there is no significant
correlation between DDT exposure and liver cancer incidence
in humans (Cocco et al., 2005). Consequently, the International
Agency for Research on Cancer (IARC) classifies it as
a ‘‘possibly carcinogenic (Group 2B),’’ based on inadequate
evidence of carcinogenicity in humans (IARC, 1991).
In the fruit fly, DDT induced glutathione s-transferase and
xenobiotic-metabolizing enzyme genes mediated by the
nuclear receptor DHR90, an ortholog of the rodent constitutive
androstane receptor (CAR) and pregnane X receptor (PXR)
(King-Jones et al., 2006; Pedra et al., 2004; Willoughby et al.,2006). Cyp2b and Cyp3a mRNA levels are induced by p,p#-DDT, mediated by PXR/CAR (Wyde et al., 2003). CAR plays
a significant role in tumor carcinogenesis in mice through the
induction of drug-metabolizing enzymes and cell proliferation–
related genes (Columbano et al., 2005; Huang et al., 2005;
Yamamoto et al., 2004). The tumor promotion activity of
phenobarbital (PB) is also abolished in CAR null mice
(Yamamoto et al., 2004). Consequently, DDT may act as
a PB-type hepatic tumor promoter through CAR activation in
rats and mice.
1 To whom correspondence should be addressed at Department of
Biochemistry and Molecular Biology, Michigan State University, East
Lansing, MI 48824. Fax: (517) 353-9334. E-mail: [email protected].
� The Author 2007. Published by Oxford University Press on behalf of the Society of Toxicology. All rights reserved.For Permissions, please email: [email protected]
In addition to the PB-type enzyme-inducing properties of
p,p#-DDT in the rodent liver, the o,p#-enantiomer exhibits
estrogenic activities (Hoekstra et al., 2001). Estrogens have
also been associated with hepatic tumorigenesis in rodents and
humans (Giannitrapani et al., 2006), suggesting that the
hepatocarcinogenicity of DDT may involve the estrogenic
activity of o,p#–DDT. Several structurally diverse estrogenic
compounds including steroids, industrial chemicals, natural
products, and environmental pollutants elicit estrogenic
responses in the liver (Ciana et al., 2003). Microarray studies
have demonstrated that ethynyl estradiol (EE) induces estrogen
receptor (ER)–mediated gene expression changes in rodent
livers (Boverhof et al., 2004; Kato et al., 2004). Therefore, the
temporal and dose-dependent gene expression activity of o,p#-DDT with complementary histopathology and tissue-level
analyses were examined to further investigate the PXR-,
CAR-, and ER-mediated hepatic activities of o,p#-DDT.
Collectively, the data indicate that o,p#-DDT–elicited hepatic
gene expression is not mediated by the ER but rather through
PXR/CAR-dependent mechanisms.
MATERIALS AND METHODS
Husbandry. Female Sprague-Dawley rats, ovariectomized on postnatal
day 20 were obtained from Charles River Laboratories (Raleigh, NC) on day
25. Rats were housed in polycarbonate cages containing cellulose fiber chip
bedding (Aspen Chip Laboratory Bedding, Northeastern Products, Warrens-
berg, NY) and maintained at 40–60% humidity and 23�C in a room with a 12-h
dark/light cycle (7:00 A.M.–7:00 P.M.). Animals were allowed free access to
deionized water and Harlan Teklad 22/5 Rodent Diet 8640 (Madison, WI) and
acclimatized for 4 days prior to dosing.
Treatments and necropsy. In the dose-response study, rats were orally
gavaged once daily for 3 days with 0.1 ml of sesame oil vehicle (Sigma-
Aldrich, St Louis, MO) or 3, 10, 30, 100, or 300 mg/kg body weight o,p#-DDT
(99.2% purity; Sigma-Aldrich) in 0.1 ml of sesame oil vehicle and were
sacrificed 24 h after the last treatment. In the time-course study, rats were orally
gavaged once or once daily for 3 days with 300 mg/kg body weight o p#-DDT
in 0.1 ml of sesame oil vehicle. An equal number of time-matched vehicle
(VEH) control animals were also dosed in the same manner. Rats receiving one
dose were sacrificed 2, 4, 8, 12, 18, and 24 h after treatment. Rats receiving
three daily doses were sacrificed 24 h after the third treatment. Treated and
vehicle groups consisted of five animals each per time point. The o,p#-DDT
dose was calculated from average weights of animals prior to treatment. All
procedures were performed with the approval of the Michigan State University
All-University Committee on Animal Use and Care.
Animals were sacrificed by cervical dislocation, and animal body weights
were recorded. Whole liver weights were recorded, and sections of the left
lateral lobe (approximately 0.1 g) were snap frozen in liquid nitrogen and stored
at � 80�C. The right lateral lobe was placed in 10% neutral-buffered formalin
(NBF; VWR International, West Chester, PA) for histopathology and stored at
room temperature for at least 24 h prior to further processing.
Histopathology. Following fixation of the right lateral lobe for at least 24 h
in 10% NBF, the samples were embedded in paraffin according to standard
techniques. Five-micrometer sections were mounted on glass slides and stained
with hematoxylin and eosin. All embedding, mounting, and staining of tissues
were performed at the Histology/Immunohistochemistry Laboratory (Michigan
State University). The histopathology of each liver section was scored
according to the National Toxicology Program Pathology guidelines.
Measurement of hepatic o,p#-DDT and o,p#-DDD levels. In the time-
course study, one sample from a randomly selected control animal and three
randomly selected liver samples from o,p#-DDT–treated rats from each time
point were processed in parallel with laboratory blanks and a reference or
background sample at Wellington Laboratories Inc. (Guelph, Ontario, Canada).
Samples were weighed, spiked with 13C12 o,p#-DDT or 13C12 o,p#-DDD
surrogate, digested with sulfuric acid, and extracted. Extracts were cleaned,
concentrated, and spiked with an injection standard. Analysis was performed on
a high-resolution gas chromatograph/high-resolution mass spectrometer (HRMS)
using a Hewlett Packard 5890 Series II GC interfaced to a VG 70SE HRMS.
The HRMS was operated in the EI/SIR mode at 10,000 resolutions. A 60-m
DB5 column (J&W Scientific, Folsom, CA) with an internal diameter of 0.25
mm and film thickness of 0.25 lm was employed. Injection volumes were 2 ll,
and a splitless injection was used.
RNA isolation. Total RNA was isolated from left lateral liver sections
using Trizol Reagent (Invitrogen, Carlsbad, CA). Samples were removed from
� 80�C storage and immediately homogenized in 1 ml Trizol Reagent using
a Mixer Mill 300 tissue homogenizer (Retsch, Germany). Total RNA was
isolated according to the manufacturer’s protocol and resuspended in The RNA
Storage Solution (Ambion, Austin, TX). RNA concentrations were determined
by spectrophotometry (A260), and purity was assessed by the A260:A280 ratio and
by visual inspection of 3 lg on a denaturing gel.
Microarray platform. Spotted complementary DNA (cDNA) microarrays
were produced in-house from LION Bioscience’s Rat cDNA library (LION
Bioscience, Heidelberg, Germany). A total of 8565 cDNA features representing
5096 unique genes (confirmed unique Entrez Gene IDs) were selected based on
their level of annotation as well as sequence similarity to well-annotated human
and mouse genes. Detailed protocols for microarray construction, cDNA probe
labeling, sample hybridization, and slide washing can be found at http://
dbzach.fst.msu.edu/interfaces/microarray.html. Briefly, PCR-amplified DNA
was robotically arrayed onto epoxy-coated glass slides (Schott/Nexterion, Jena,
Germany), using an Omnigrid arrayer (GeneMachines, San Carlos, CA)
equipped with 32 (8 3 4) Chipmaker 2 pins (Telechem, Sunnyvale, CA) at the
Research Technology Support Facility at Michigan State University (http://
www.genomics.msu.edu).
Microarray analysis. Dose-response gene expression changes were
analyzed using a spoke design in which samples from o,p#-DDT–treated
animals were cohybridized with VEH animals. Temporal changes in gene
expression were assessed using an independent reference design in which
samples from o,p#-DDT–treated animals were cohybridized with VEH animals.
Comparisons were performed between treated and VEH samples using three
biological replicates and two independent labelings of each sample (i.e., dye
swap) for each time point. Total RNA (25 lg) was reverse transcribed in the
presence of Cy3- or Cy5-labeled dUTP (Amersham, Piscataway, NJ) to create
fluor-labeled cDNA, which was purified using QIAquick PCR purification kit
(Qiagen, Valencia, CA). Cy3- and Cy5-labeled samples were mixed, vacuum
dried, and resuspended in 32 ll of hybridization buffer (40% formamide, 43
sodium chloride-sodium citrate, and 1% sodium dodecyl sulfate) with 20 lg
polydA and 20 lg of mouse COT-1 DNA (Invitrogen) as a competitor. This probe
mixture was heated at 95�C for 2 min and was then hybridized to the array under
a 22- 3 40-mm Lifterslip (Erie Scientific, Portsmouth, NH) in a light-protected
and humidified hybridization chamber (Corning Inc., Lowell, MA). Samples
were hybridized for 18–24 h at 42�C in a water bath. Slides were then washed,
dried by centrifugation, and scanned at 635 nm (Cy5) and 532 nm (Cy3) on
a GenePix 4000B microarray scanner (Molecular Devices, Union City, CA).
Images were analyzed for feature and background intensities using GenePix
Pro 6.0 (Molecular Devices). All data were managed in the toxicogenomic
information management system dbZach relational database (Burgoon et al.,
2006; Burgoon and Zacharewski, 2007). Microarray data quality was monitored
using the laboratory’s quality assurance and control plan (Burgoon et al., 2005).
Microarray data normalization and statistical analysis. Data were
normalized using a semiparametric approach (Eckel et al., 2005). Model-
based t-values were calculated from normalized data, comparing treated and
TOXICOGENOMICS ON o,p#-DDT–TREATED RAT LIVER 351
vehicle responses per time point. Empirical Bayes analysis was used to
calculate posterior probabilities ( p1[t] value) of activity on a per gene and time
point basis using the model-based t-value (Eckel et al., 2004). Genes were
filtered for activity based on the p1(t) value. p1(t) values approaching 1 indicate
changes in gene expression that are more robust. In the dose-response study,
unique genes with a p1(t) > 0.999 and absolute fold change � 1.5-fold
compared to VEH at least at one time point were initially selected for further
investigation. In the time-course study, unique genes with a p1(t) > 0.999 in
a minimum of two time points and absolute fold change � 1.5-fold compared to
VEH at least at one time point were selected for further investigation.
Functional annotation for differentially expressed genes was obtained using
DAVID software (http://david.abcc.ncifcrf.gov/) (Dennis et al., 2003). Gene
ontology (GO) molecular function was examined for active genes at each time
point. Level 2 GO terms with p < 0.05 were considered significant.
Hierarchical clustering analysis was performed by GeneSpring GX 7.3.1
(Agilent Technologies Inc., Santa Clara, CA).
Quantitative real-time PCR. For each sample, 1.0 lg of total RNA was
reverse transcribed by SuperScript II using an anchored oligo-dT primer as
described by the manufacturer (Invitrogen). The resultant cDNA (1.0 ll) was
used as the template in a 30 ll PCR reaction containing 0.1lM each of forward
and reverse gene-specific primers designed using Primer3 (Rozen and
Skaletsky, 2000), 3mM MgCl2, 1.0mM deoxynucleoside triphosphates, 0.025 IU
AmpliTaq Gold, and 13 SYBR Green PCR buffer (Applied Biosystems, Foster
City, CA). Gene names, accession numbers, forward and reverse primer
sequences, and amplicon sizes are listed in Table 1. PCR amplification was
conducted in MicroAmp Optical 96-well reaction plates (Applied Biosystems)
on an Applied Biosystems PRISM 7000 Sequence Detection System using the
following conditions: initial denaturation and enzyme activation for 10 min at
95�C, followed by 40 cycles of 95�C for 15 s and 60�C for 1 min.
A dissociation protocol was performed to assess the specificity of the primers and
the uniformity of the PCR-generated products. Each plate contained duplicate
standards of purified PCR products of known template concentration covering
six orders of magnitude to interpolate relative template concentrations of the
samples from the standard curves of log copy number versus threshold cycle.
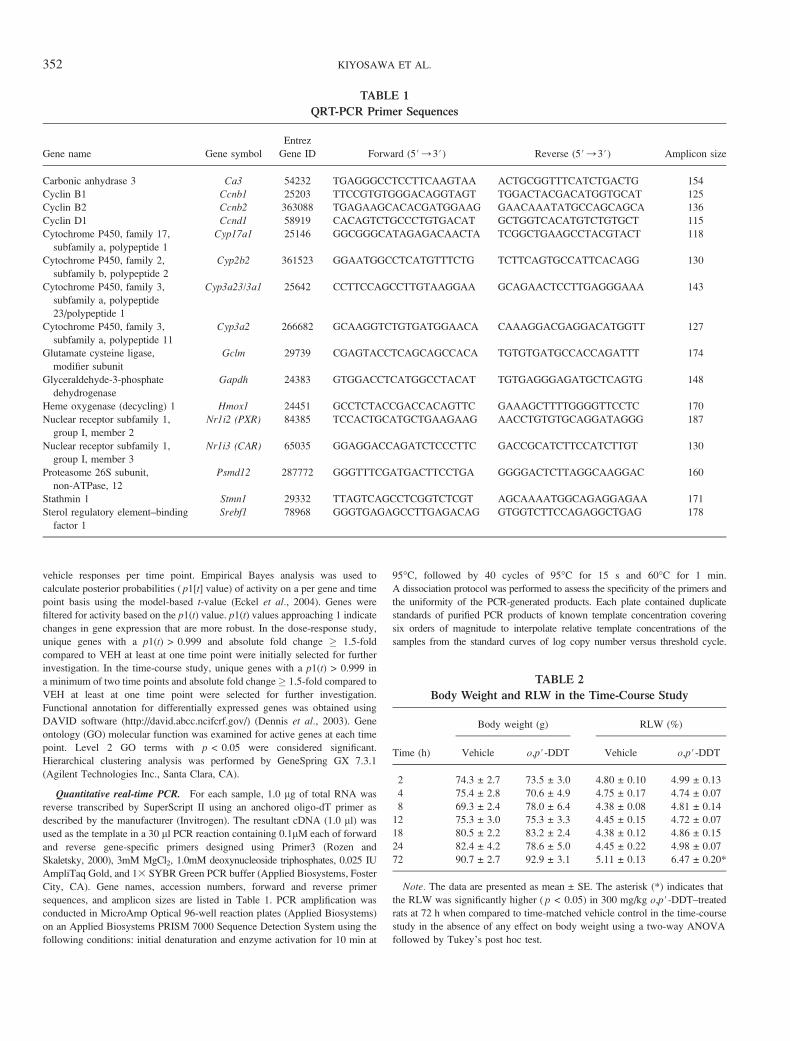
TABLE 1
QRT-PCR Primer Sequences
Gene name Gene symbol
Entrez
Gene ID Forward (5#/3#) Reverse (5#/3#) Amplicon size
Carbonic anhydrase 3 Ca3 54232 TGAGGGCCTCCTTCAAGTAA ACTGCGGTTTCATCTGACTG 154
Cyclin B1 Ccnb1 25203 TTCCGTGTGGGACAGGTAGT TGGACTACGACATGGTGCAT 125
Cyclin B2 Ccnb2 363088 TGAGAAGCACACGATGGAAG GAACAAATATGCCAGCAGCA 136
Cyclin D1 Ccnd1 58919 CACAGTCTGCCCTGTGACAT GCTGGTCACATGTCTGTGCT 115
Cytochrome P450, family 17,
subfamily a, polypeptide 1
Cyp17a1 25146 GGCGGGCATAGAGACAACTA TCGGCTGAAGCCTACGTACT 118
Cytochrome P450, family 2,
subfamily b, polypeptide 2
Cyp2b2 361523 GGAATGGCCTCATGTTTCTG TCTTCAGTGCCATTCACAGG 130
Cytochrome P450, family 3,
subfamily a, polypeptide
23/polypeptide 1
Cyp3a23/3a1 25642 CCTTCCAGCCTTGTAAGGAA GCAGAACTCCTTGAGGGAAA 143
Cytochrome P450, family 3,
subfamily a, polypeptide 11
Cyp3a2 266682 GCAAGGTCTGTGATGGAACA CAAAGGACGAGGACATGGTT 127
Glutamate cysteine ligase,
modifier subunit
Gclm 29739 CGAGTACCTCAGCAGCCACA TGTGTGATGCCACCAGATTT 174
Glyceraldehyde-3-phosphate
dehydrogenase
Gapdh 24383 GTGGACCTCATGGCCTACAT TGTGAGGGAGATGCTCAGTG 148
Heme oxygenase (decycling) 1 Hmox1 24451 GCCTCTACCGACCACAGTTC GAAAGCTTTTGGGGTTCCTC 170
Nuclear receptor subfamily 1,
group I, member 2
Nr1i2 (PXR) 84385 TCCACTGCATGCTGAAGAAG AACCTGTGTGCAGGATAGGG 187
Nuclear receptor subfamily 1,
group I, member 3
Nr1i3 (CAR) 65035 GGAGGACCAGATCTCCCTTC GACCGCATCTTCCATCTTGT 130
Proteasome 26S subunit,
non-ATPase, 12
Psmd12 287772 GGGTTTCGATGACTTCCTGA GGGGACTCTTAGGCAAGGAC 160
Stathmin 1 Stmn1 29332 TTAGTCAGCCTCGGTCTCGT AGCAAAATGGCAGAGGAGAA 171
Sterol regulatory element–binding
factor 1
Srebf1 78968 GGGTGAGAGCCTTGAGACAG GTGGTCTTCCAGAGGCTGAG 178
TABLE 2
Body Weight and RLW in the Time-Course Study
Time (h)
Body weight (g) RLW (%)
Vehicle o,p#-DDT Vehicle o,p#-DDT
2 74.3 ± 2.7 73.5 ± 3.0 4.80 ± 0.10 4.99 ± 0.13
4 75.4 ± 2.8 70.6 ± 4.9 4.75 ± 0.17 4.74 ± 0.07
8 69.3 ± 2.4 78.0 ± 6.4 4.38 ± 0.08 4.81 ± 0.14
12 75.3 ± 3.0 75.3 ± 3.3 4.45 ± 0.15 4.72 ± 0.07
18 80.5 ± 2.2 83.2 ± 2.4 4.38 ± 0.12 4.86 ± 0.15
24 82.4 ± 4.2 78.6 ± 5.0 4.45 ± 0.22 4.98 ± 0.07
72 90.7 ± 2.7 92.9 ± 3.1 5.11 ± 0.13 6.47 ± 0.20*
Note. The data are presented as mean ± SE. The asterisk (*) indicates that
the RLW was significantly higher ( p < 0.05) in 300 mg/kg o,p#-DDT–treated
rats at 72 h when compared to time-matched vehicle control in the time-course
study in the absence of any effect on body weight using a two-way ANOVA
followed by Tukey’s post hoc test.
352 KIYOSAWA ET AL.
The copy number of each unknown sample for each gene was standardized to
that of glyceraldehyde-3-phosphate dehydrogenase gene to control for differ-
ences in RNA loading, quality, and cDNA synthesis. Microarray data for
Ccnd3 gene (Entrez Gene ID: 25193) was not concordant with the quantitative
real-time PCR (QRT-PCR) results and therefore excluded from further analysis.
Correlation analysis between o,p#-DDT–treated rat and EE-treated
mouse livers. Genes with a p1(t) > 0.99 and absolute fold change � 1.5-
fold at one or more time points in the o,p#-DDT–treated rat liver samples were
selected and used for correlation analysis (Burgoon et al., 2006), against our
previously published EE-treated mouse liver gene expression data (see http://
www.bch.msu.edu/~zacharet/publications/supplementary/index.html for EE
data). Orthologous rat and mouse genes were identified using Homologene
(http://www.ncbi.nlm.nih.gov/sites/entrez?db¼homologene). The filtering cri-
teria used for the correlation analysis were relaxed compared to that used in the
GO analysis to include more ortholog comparisons in the correlation analysis
and thus be more informative of the overall similarity between the two data
sets. The correlation analysis involved a multivariate correlation–based
visualization application that was developed in-house (Burgoon et al., 2006)
and has been previously used to investigate the estrogenicity of 2,3,7,8-
tetrachlrodibenzo-p-dioxin in the mouse uterus when compared to EE
(Boverhof et al., 2006). This tool calculates the temporal correlations between
gene expression and significance values for orthologous DDT-treated rat (this
study) and EE-treated mouse genes (Boverhof et al., 2004) and summarizes the
results in a scatterplot.
Statistical analysis. Body weight, relative liver weight (RLW), and QRT-
PCR data are presented as the mean ± SE. Statistical analysis was performed
with two-way ANOVA followed by Tukey’s post hoc test between VEH and
o,p#-DDT–treated groups ( p < 0.05). Hepatic o,p#-DDT and o,p#-DDD
concentration data were analyzed using a two-way ANOVA to identify
significant differences in o,p#-DDT and o,p#-DDD concentrations across time.
Pairwise comparisons were performed using Tukey’s honestly significant
difference post hoc test to control type I error (a ¼ 0.05). For QRT-PCR data,
the relative expression levels of target genes were scaled such that the
standardized expression level of the time-matched VEH group was equal to 1
for graphing purposes. All statistics were performed using SAS 9.1.3 software
(SAS Institute Inc., Cary, NC).
RESULTS
Body Weight, RLW, and Histopathology
There was no significant difference between VEH and o,p#-DDT–treated animal body and RLWs in the dose-response
study at 72 h (data not shown). RLWs were significantly higher
in 300 lg/kg o,p#-DDT–treated rats at 72 h when compared to
VEH in the time-course study in the absence of any effect on
body weight (Table 2), consistent with the increase in RLW in
rats treated with 106 mg/kg p,p#-DDT (Tomiyama et al.,2003). Thus, 300 lg/kg o,p#-DDT was used in the time-course
study.
There were also no significant signs of irreversible hepa-
tocellular injury at any time point. Hepatocytes exhibited early
centrilobular and midzonal swelling with hypertrophy and
eosinophilic staining (Table 3). However, there was no evi-
dence of hepatocyte swelling with hypertrophy and eosinophilia
after 18 h, and therefore, the 72 h dose-response sections were
not examined.
TABLE 3
Liver Histopathology Following o,p#-DDT Treatment in Time-Course Study
Histological findings
Time (h)
2 4 8 12 18 24 72
Swelling
Centrilobular Mild (2/5) Mild (4/5) — — — — —
Centrilobular-midzonal Moderate (2/5),
moderate to
marked (1/5)
Moderate (1/5) Mild (1/5),
moderate (4/5)
Mild (2/5) Mild (2/5) — —
Mild-moderate (2/5)
Moderate (1/5)
Eosinophila
Centrilobular Mild (2/5) — — — — — —
Centrilobular-midzonal Moderate (2/5) Moderate (1/5) — Mild (2/5) — — —
Mild-moderate (2/5)
Moderate (1/5)
Note. The numbers in parentheses indicate the number of animals in the o,p#-DDT–treated group exhibiting the pathology.
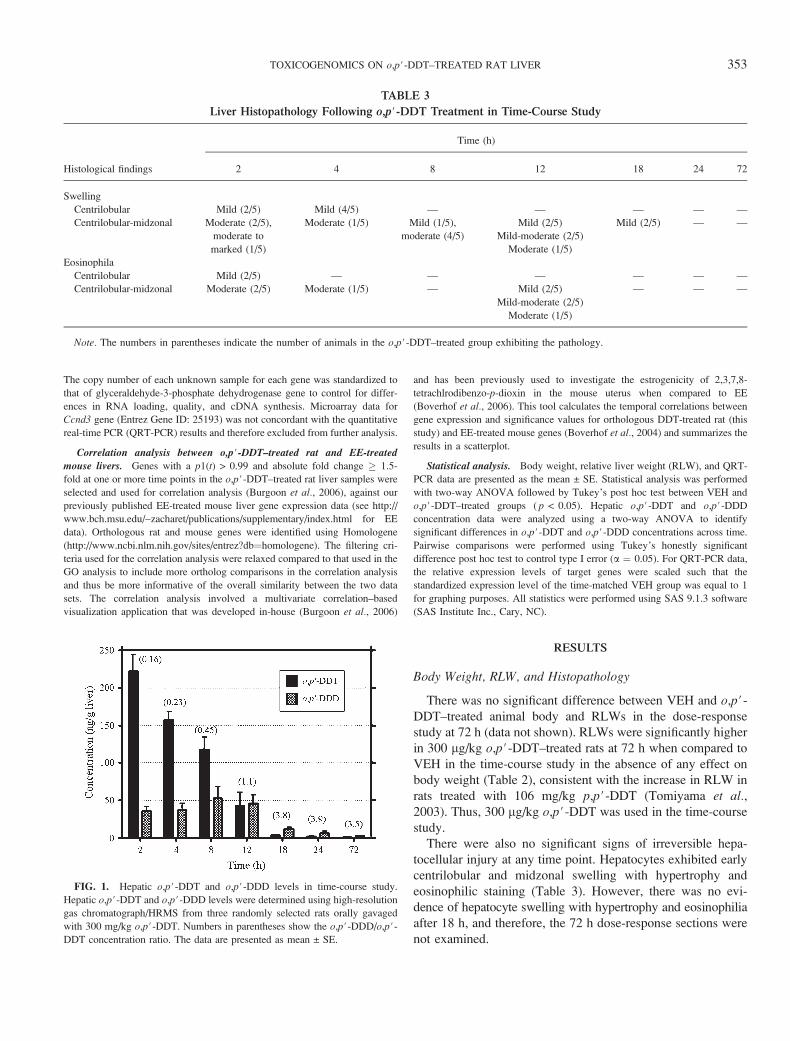
FIG. 1. Hepatic o,p#-DDT and o,p#-DDD levels in time-course study.
Hepatic o,p#-DDT and o,p#-DDD levels were determined using high-resolution
gas chromatograph/HRMS from three randomly selected rats orally gavaged
with 300 mg/kg o,p#-DDT. Numbers in parentheses show the o,p#-DDD/o,p#-DDT concentration ratio. The data are presented as mean ± SE.
TOXICOGENOMICS ON o,p#-DDT–TREATED RAT LIVER 353
Hepatic o,p#-DDT and o,p#-DDD Concentrations in Time-Course Study
The time-dependent accumulation and elimination of hepatic
o,p#-DDT has not been previously reported using a comparable
study design. Following an initial accumulation, o,p#-DDT and
o,p#-DDD levels decreased over time. o,p#-DDT concentra-
tions were only significantly different from o,p#-DDD at 2 h.
The levels of o,p#-DDT were highest at 2 h (222 ng/g liver),
which dramatically decreased in a time-dependent manner to
0.68 ng/g liver at 72 h (Fig. 1). In contrast, the levels of o,p#-DDD modestly increased to 35.1–52.7 ng/g liver at 12 h and
then decreased to 5.8 ng/g liver by 24 h. o,p#-DDT
concentrations continued to decrease (2.4 ng/g liver at 72 h),
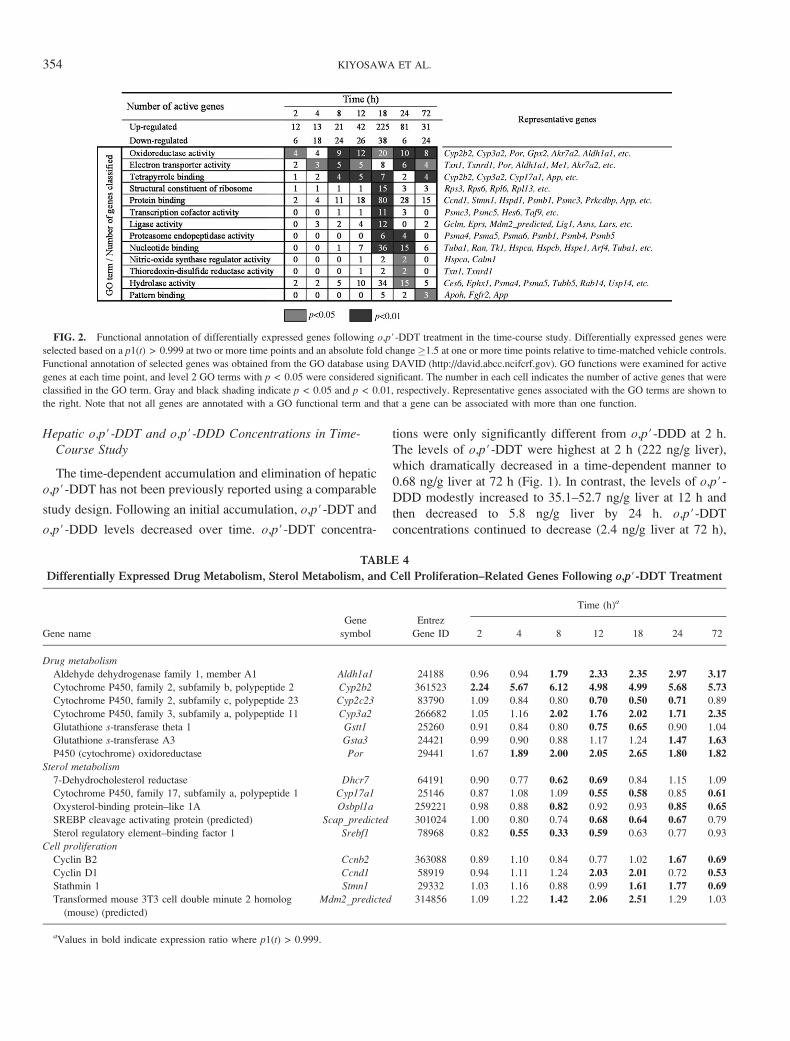
FIG. 2. Functional annotation of differentially expressed genes following o,p#-DDT treatment in the time-course study. Differentially expressed genes were
selected based on a p1(t) > 0.999 at two or more time points and an absolute fold change �1.5 at one or more time points relative to time-matched vehicle controls.
Functional annotation of selected genes was obtained from the GO database using DAVID (http://david.abcc.ncifcrf.gov). GO functions were examined for active
genes at each time point, and level 2 GO terms with p < 0.05 were considered significant. The number in each cell indicates the number of active genes that were
classified in the GO term. Gray and black shading indicate p < 0.05 and p < 0.01, respectively. Representative genes associated with the GO terms are shown to
the right. Note that not all genes are annotated with a GO functional term and that a gene can be associated with more than one function.
TABLE 4
Differentially Expressed Drug Metabolism, Sterol Metabolism, and Cell Proliferation–Related Genes Following o,p#-DDT Treatment
Gene name
Gene
symbol
Entrez
Gene ID
Time (h)a
2 4 8 12 18 24 72
Drug metabolism
Aldehyde dehydrogenase family 1, member A1 Aldh1a1 24188 0.96 0.94 1.79 2.33 2.35 2.97 3.17
Cytochrome P450, family 2, subfamily b, polypeptide 2 Cyp2b2 361523 2.24 5.67 6.12 4.98 4.99 5.68 5.73
Cytochrome P450, family 2, subfamily c, polypeptide 23 Cyp2c23 83790 1.09 0.84 0.80 0.70 0.50 0.71 0.89
Cytochrome P450, family 3, subfamily a, polypeptide 11 Cyp3a2 266682 1.05 1.16 2.02 1.76 2.02 1.71 2.35
Glutathione s-transferase theta 1 Gstt1 25260 0.91 0.84 0.80 0.75 0.65 0.90 1.04
Glutathione s-transferase A3 Gsta3 24421 0.99 0.90 0.88 1.17 1.24 1.47 1.63
P450 (cytochrome) oxidoreductase Por 29441 1.67 1.89 2.00 2.05 2.65 1.80 1.82
Sterol metabolism
7-Dehydrocholesterol reductase Dhcr7 64191 0.90 0.77 0.62 0.69 0.84 1.15 1.09
Cytochrome P450, family 17, subfamily a, polypeptide 1 Cyp17a1 25146 0.87 1.08 1.09 0.55 0.58 0.85 0.61
Oxysterol-binding protein–like 1A Osbpl1a 259221 0.98 0.88 0.82 0.92 0.93 0.85 0.65
SREBP cleavage activating protein (predicted) Scap_predicted 301024 1.00 0.80 0.74 0.68 0.64 0.67 0.79
Sterol regulatory element–binding factor 1 Srebf1 78968 0.82 0.55 0.33 0.59 0.63 0.77 0.93
Cell proliferation
Cyclin B2 Ccnb2 363088 0.89 1.10 0.84 0.77 1.02 1.67 0.69
Cyclin D1 Ccnd1 58919 0.94 1.11 1.24 2.03 2.01 0.72 0.53
Stathmin 1 Stmn1 29332 1.03 1.16 0.88 0.99 1.61 1.77 0.69
Transformed mouse 3T3 cell double minute 2 homolog
(mouse) (predicted)
Mdm2_predicted 314856 1.09 1.22 1.42 2.06 2.51 1.29 1.03
aValues in bold indicate expression ratio where p1(t) > 0.999.
354 KIYOSAWA ET AL.

suggesting that treatment enhanced its hepatic clearance. The
levels of o,p#-DDD were higher compared to o,p#-DDT after
12 h, and the o,p#-DDD/o,p#-DDT ratio showed a time-
dependent increase from 2 h (ratio: 0.16) to 72 h (ratio: 3.5),
suggesting that o,p#-DDT was metabolized to o,p#-DDD. o,p#-DDT and o,p#-DDD levels were not examined in the dose-
response study samples and were not detected in the liver
samples from VEH animals in the time-course study.
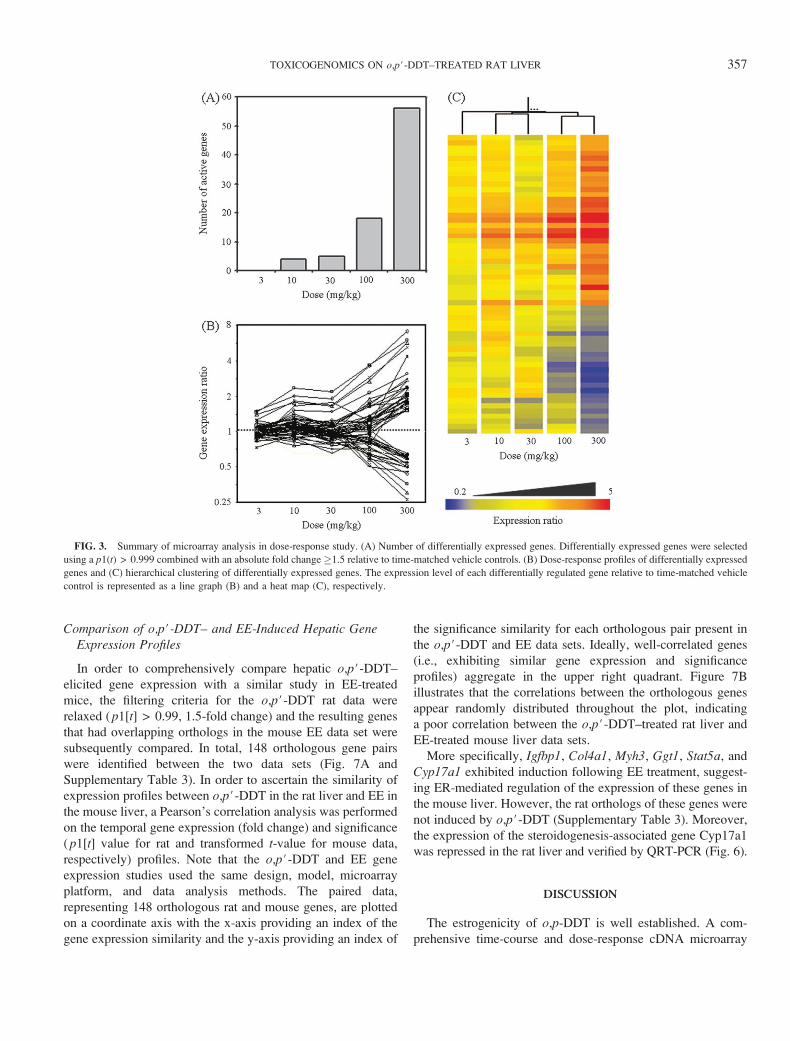
Microarray Analysis
All the microarray data for both the dose response and the
time-course studies are provided as Supplementary Tables 1
and 2, respectively. In the time-course study, 327 unique genes
were differentially expressed following treatment (Fig. 2,
Tables 4–6). In addition, there was a clear dose-dependent
increase in the number of differentially expressed genes (Fig.
3a). Of the 81 genes induced at 72 h in the time-course study,
58 exhibited dose-dependent induction, although none
achieved a plateau, thus precluding Effective dose, 50%
(ED50) determinations (Fig. 3). GO analysis indicated that
genes associated with oxidoreductase activity such as Cyp2b2or Cyp3a2 were induced as early as 2 h (Table 4), while electron
transport genes related to reductive reactions (e.g., Txn1,
Txnrd1, Por, Aldh1a1, and Akr7a2) exhibited differential
expression as early as 4 h (Table 5), which persisted to 72 h.
Both the number of active genes and overrepresented GO
terms were highest at 18 h. Diverse biological responses such
as protein synthesis (GO term: structural constituent of
ribosome) and degradation (GO term: proteasome endopepti-
dase activity) were represented (Table 6). Many eukaryotic
translational initiation factors, and proteasome-related and
ribosomal protein genes were induced at 18 h. In addition,
the stress-responsive heat shock protein (HSP) and Hmox1genes were induced as well as Gclm and Gpx2 genes, which are
involved in glutathione homeostasis, at 18 and 24 h. Genes
involved in electron transport or reductive reactions such as
Ephx1, Flt1, and Txn1 were also induced at 18 h.
TABLE 5
Differentially Expressed Electron Transport, Reductive Reaction, and Stress Response–Related Genes Following o,p#-DDT Treatment
Gene name Gene symbol
Entrez
Gene ID
Time (h)a
2 4 8 12 18 24 72
Electron transport/reductive reactions
Aldo-keto reductase family 7, member A2 Akr7a2 171445 2.61 1.57 3.11 2.60 3.53 1.18 1.55
Epoxide hydrolase 1, microsomal Ephx1 25315 1.16 1.02 1.35 1.90 2.67 2.40 2.48
Ferritin light chain 1 Ftl1 29292 1.09 0.89 0.87 0.92 1.25 1.55 1.28
Glutamate cysteine ligase, modifier subunit Gclm 29739 0.91 0.64 0.78 1.08 2.07 1.50 1.22
Glutamate-cysteine ligase, catalytic subunit Gclc 25283 1.01 0.63 0.68 1.23 1.50 1.39 1.03
Glutathione peroxidase 2 Gpx2 29326 0.86 0.86 0.95 1.13 2.25 1.72 1.58
Thioredoxin 1 Txn1 116484 0.96 1.00 1.00 1.11 1.67 1.70 1.37
Thioredoxin reductase 1 Txnrd1 58819 0.91 0.86 0.95 1.87 2.45 1.59 0.92
Stress responsiveHeat shock 10 kDa protein 1 (chaperonin 10) Hspe1 25462 1.06 1.01 1.02 1.38 1.61 1.43 1.12
Heat shock 90 kDa protein 1, beta Hspcb 301252 0.93 0.89 1.00 1.23 1.51 1.39 1.14
Hsp 1 (chaperonin) Hspd1 63868 1.03 1.04 1.11 1.32 1.67 1.45 1.21
Hsp 1, alpha Hspca 299331 0.87 0.89 1.00 1.90 2.78 2.29 1.25
Heat shock 90 kDa protein 1, alpha-like 3 (predicted) Hspcal3_predicted 297852 0.88 0.89 0.97 1.88 2.65 2.23 1.18
Heme oxygenase (decycling) 1 Hmox1 24451 0.84 0.93 0.96 2.47 3.13 1.23 0.95
Similar to DnaJ (Hsp40) homolog, subfamily B,
member 10 isoform 2
LOC689593 689593 0.97 0.87 1.00 1.17 1.54 1.02 0.88
DnaJ (Hsp40) homolog, subfamily C, member 2 Dnajc2 116456 0.88 0.99 0.97 1.24 1.53 1.02 0.83
Poly (ADP-ribose) polymerase family, member 1 Parp1 25591 1.12 1.04 1.53 1.43 1.80 1.40 1.13
Poly (ADP-ribose) polymerase family, member 2
(predicted)
Parp2_predicted 290027 1.03 0.95 1.08 1.21 1.83 1.56 1.09
Miscellaneous
Amyloid beta (A4) precursor protein App 54226 0.96 0.98 1.03 1.22 1.61 1.23 1.10
Carbonic anhydrase 3 Ca3 54232 0.66 0.83 0.73 0.59 0.23 0.30 0.91
Carboxylesterase 6 Ces6 246252 1.11 1.50 1.11 1.24 1.88 1.99 2.28
Double C2, gamma Doc2g 293654 1.66 3.32 5.27 4.93 5.63 5.37 3.73
Insulin-like growth factor 1 Igf1 24482 1.02 0.91 0.78 0.85 0.68 0.63 0.77
Insulin-like growth factor–binding protein 3 Igfbp3 24484 0.89 0.99 0.98 0.96 0.92 0.78 0.60
Interferon regulatory factor 1 Irf1 24508 0.44 0.61 0.60 0.82 0.81 1.14 1.06
RAN, member RAS oncogene family Ran 84509 0.99 1.00 0.97 1.28 1.89 1.43 1.05
aValues in bold indicate expression ratio where p1(t) > 0.999.
TOXICOGENOMICS ON o,p#-DDT–TREATED RAT LIVER 355
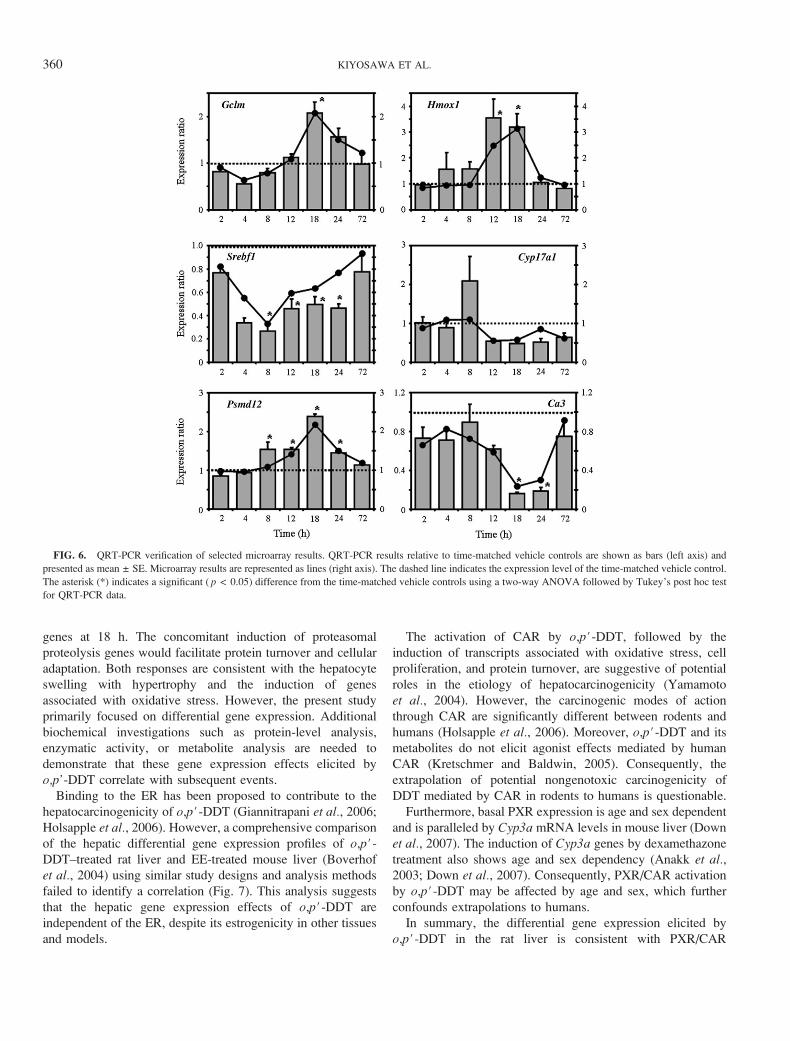
Several sterol metabolism– and cell proliferation–related
genes were also differentially expressed (Table 4). The sterol
metabolism–related gene, Srebf1, was repressed 4–18 h along
with another sterol metabolism–related gene, Cyp17a1, at
12–18 h. Genes associated with cell proliferation, including
Ccnb1, Ccnb2, Mdm2_predicted, and Stmn1, exhibited in-
duction by o,p#-DDT.
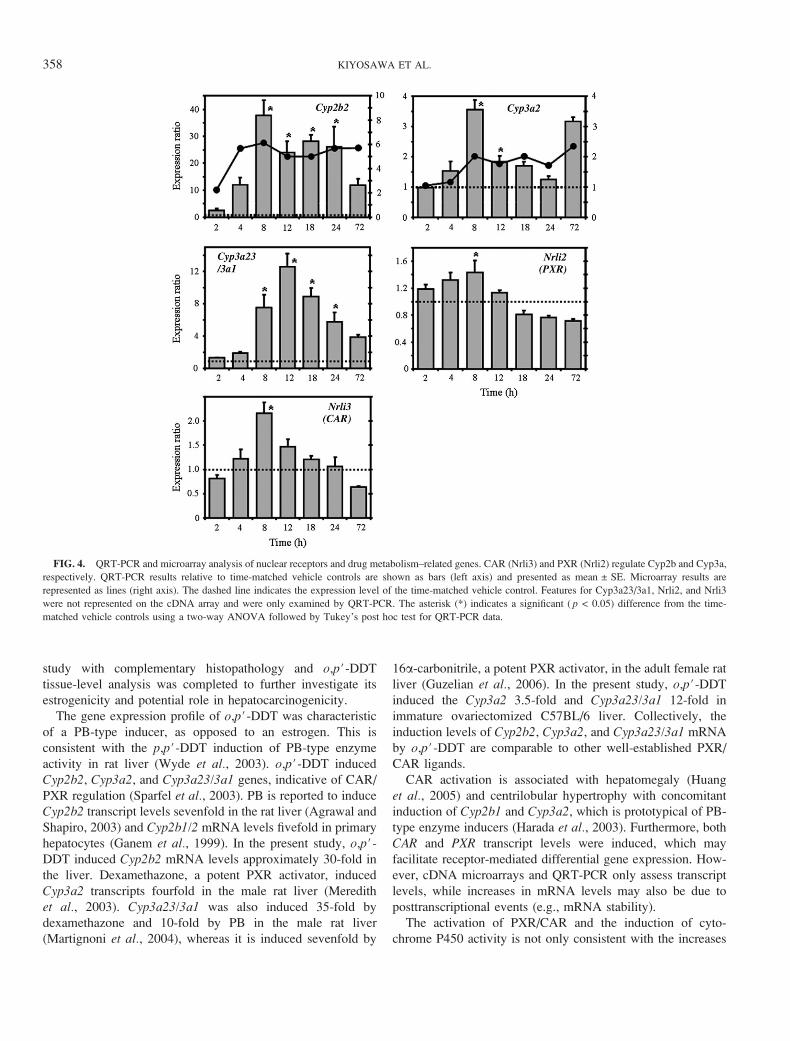
Quantitative Real-Time PCR
In total, 15 genes identified as being differentially regulated
by o,p#-DDT in the microarray time-course study, including
other genes known to be regulated by PXR/CAR that were not
represented on our cDNA array, were examined by QRT-PCR.
QRT-PCR confirmed that the PXR/CAR-regulated drug-
metabolizing genes, Cyp2b2, Cyp3a2, and Cyp3a23/3a1, were
induced by o,p#-DDT when compared to VEH (Fig. 4).
Moreover, the expression of CAR (Nrli3) and PXR (Nrli2)
mRNA, which regulate Cyp2b and Cyp3a, respectively, were
also induced (Fig. 4). The cell proliferation genes, Ccnb1,
Ccnb2, Ccnd1, and Stmn1, also exhibited comparable micro-
array and QRT-PCR expression profiles (Fig. 5). Overall, there
was a good correlation between the 12 genes examined by
microarray and QRT-PCR (Figs. 4–6).
TABLE 6
Differentially Expressed Protein Turnover–Related Genes Following o,p#-DDT Treatment
Gene name Gene symbol
Entrez
Gene ID
Time (h)a
2 4 8 12 18 24 72
Protein synthesis/degradation
Eukaryotic translation initiation factor 2, subunit 2 (beta) Eif2s2 296302 1.00 1.02 1.10 1.35 1.77 1.08 0.97
Eukaryotic translation initiation factor 3, subunit 8, 110 kDa Eif3s8 293484 1.04 1.02 1.12 1.25 1.69 1.07 1.05
Eukaryotic translation initiation factor 4E–binding protein 1 Eif4ebp1 116636 1.08 0.95 1.26 1.32 1.68 1.29 1.08
Similar to mitochondrial ribosomal protein 63 LOC691814 691814 0.91 0.98 1.52 1.87 1.96 1.49 0.96
Mitochondrial ribosomal protein S12 (predicted) Mrps12_predicted 292758 1.05 1.02 1.21 1.43 1.47 1.64 1.81
Proteasome (prosome, macropain) 26S subunit, ATPase 3 Psmc3 29677 0.99 0.97 1.09 1.32 1.85 1.56 1.21
Proteasome (prosome, macropain) 26S subunit, ATPase, 4 Psmc4 117262 0.91 0.90 1.03 1.25 1.82 1.47 1.15
Proteasome (prosome, macropain) 26S subunit, non-ATPase, 1 Psmd1 83806 0.97 0.91 0.95 1.27 1.89 1.54 1.14
Proteasome (prosome, macropain) 26S subunit,
non-ATPase, 11 (predicted)
Psmd11_predicted 303353 0.96 0.91 1.09 1.41 1.99 1.54 1.18
Proteasome (prosome, macropain) 26S subunit, non-ATPase, 12 Psmd12 287772 0.98 0.96 1.08 1.42 2.17 1.50 1.19
Proteasome (prosome, macropain) 26S subunit, non-ATPase, 2 Psmd2 287984 0.96 0.96 1.02 1.18 1.85 1.62 1.32
Proteasome (prosome, macropain) 26S subunit, non-ATPase, 4 Psmd4 83499 0.91 0.91 1.01 1.27 1.88 1.45 1.08
Proteasome (prosome, macropain) 26S subunit, non-ATPase, 8 Psmd8 292766 0.95 0.99 1.08 1.25 1.91 1.74 1.40
Proteasome (prosome, macropain) subunit, alpha type 4 Psma4 29671 0.93 0.94 1.00 1.24 1.75 1.53 1.21
Proteasome (prosome, macropain) subunit, alpha type 5 Psma5 29672 0.94 0.90 1.07 1.30 2.00 1.52 1.20
Proteasome (prosome, macropain) subunit, alpha type 6 Psma6 29673 0.93 1.04 1.05 1.24 1.68 1.40 1.21
Proteasome (prosome, macropain) subunit, beta type 1 Psmb1 94198 0.98 0.94 1.04 1.23 1.58 1.47 1.20
Proteasome (prosome, macropain) subunit, beta type 4 Psmb4 58854 0.99 1.00 1.06 1.17 1.73 1.56 1.27
Proteasome (prosome, macropain) subunit, beta type 5 Psmb5 29425 1.10 0.98 1.09 1.22 1.74 1.59 1.37
Similar to ribosomal protein L10a (predicted) RGD1560124_predicted 302497 1.18 1.09 1.18 1.23 1.56 1.26 1.10
Ribosomal protein L13 Rpl13 81765 1.12 1.07 1.15 1.20 1.56 1.31 1.10
Ribosomal protein L18 Rpl18 81766 1.09 1.03 1.09 1.22 1.55 1.28 1.07
Ribosomal protein L23 Rpl23 29282 1.09 1.04 1.10 1.15 1.57 1.23 0.98
Ribosomal protein L3 Rpl3 300079 1.06 1.06 1.24 1.21 1.60 1.24 0.97
Ribosomal protein L37 Rpl37 81770 1.05 1.05 1.11 1.21 1.52 1.20 1.06
Ribosomal protein L6 Rpl6 117042 1.08 1.03 1.11 1.18 1.61 1.24 1.03
Ribosomal protein P0–like protein RGD1311709_predicted 298586 1.00 1.03 1.10 1.42 1.80 1.21 0.93
Ribosomal protein S15a Rps15a 117053 1.21 1.07 1.11 1.22 1.71 1.31 1.09
Ribosomal protein S17 Rps17 29286 1.07 1.05 1.10 1.12 1.55 1.26 1.06
Ribosomal protein S20 Rps20 122772 1.12 1.14 1.10 1.17 1.62 1.33 1.12
Ribosomal protein S3 Rps3 140654 1.06 1.05 1.12 1.20 1.57 1.30 1.10
Ribosomal protein S5 Rps5 25538 1.13 1.10 1.14 1.20 1.55 1.36 1.13
Ribosomal protein S6 Rps6 29304 1.16 1.09 1.17 1.25 1.70 1.31 1.10
Ribosomal protein S7 LOC497813 497813 1.06 1.03 1.15 1.09 1.56 1.28 1.08
Ribosomal protein S8 Rps8 65136 1.09 1.09 1.12 1.24 1.63 1.28 1.09
Ribosomal protein SA Rpsa 29236 1.11 1.12 1.20 1.22 1.59 1.35 1.42
aValues in bold indicate expression ratio where p1(t) > 0.999.
356 KIYOSAWA ET AL.
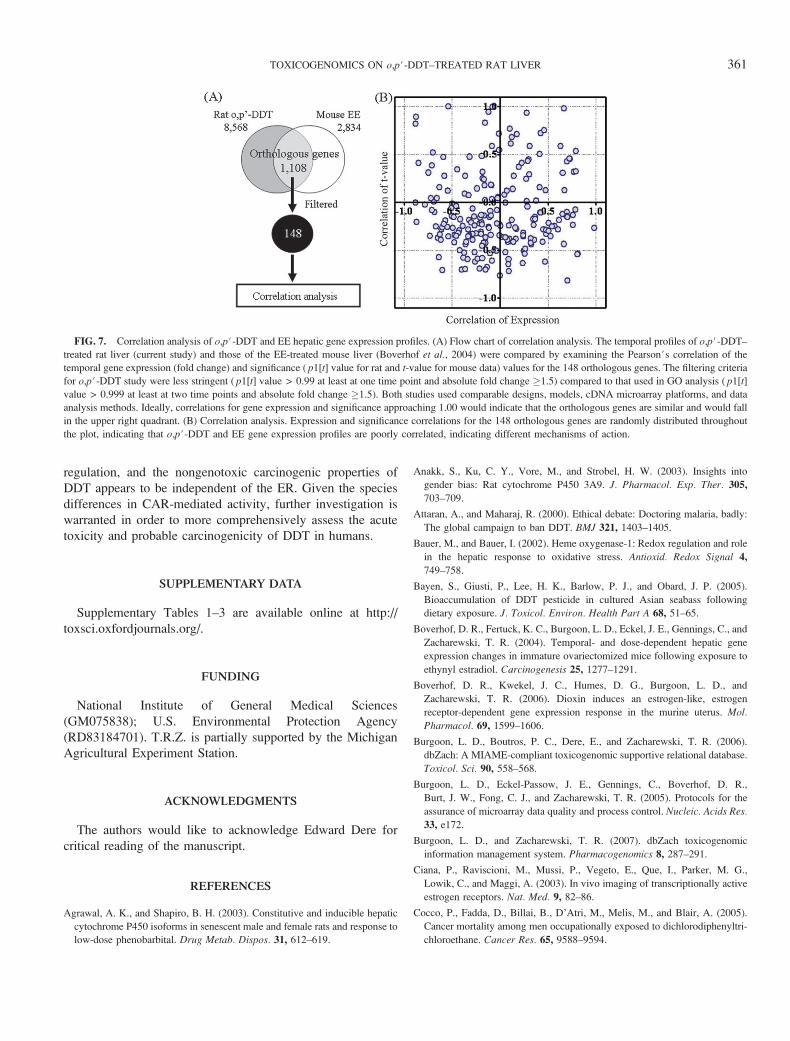
Comparison of o,p#-DDT– and EE-Induced Hepatic GeneExpression Profiles
In order to comprehensively compare hepatic o,p#-DDT–
elicited gene expression with a similar study in EE-treated
mice, the filtering criteria for the o,p#-DDT rat data were
relaxed ( p1[t] > 0.99, 1.5-fold change) and the resulting genes
that had overlapping orthologs in the mouse EE data set were
subsequently compared. In total, 148 orthologous gene pairs
were identified between the two data sets (Fig. 7A and
Supplementary Table 3). In order to ascertain the similarity of
expression profiles between o,p#-DDT in the rat liver and EE in
the mouse liver, a Pearson’s correlation analysis was performed
on the temporal gene expression (fold change) and significance
( p1[t] value for rat and transformed t-value for mouse data,
respectively) profiles. Note that the o,p#-DDT and EE gene
expression studies used the same design, model, microarray
platform, and data analysis methods. The paired data,
representing 148 orthologous rat and mouse genes, are plotted
on a coordinate axis with the x-axis providing an index of the
gene expression similarity and the y-axis providing an index of
the significance similarity for each orthologous pair present in
the o,p#-DDT and EE data sets. Ideally, well-correlated genes
(i.e., exhibiting similar gene expression and significance
profiles) aggregate in the upper right quadrant. Figure 7B
illustrates that the correlations between the orthologous genes
appear randomly distributed throughout the plot, indicating
a poor correlation between the o,p#-DDT–treated rat liver and
EE-treated mouse liver data sets.
More specifically, Igfbp1, Col4a1, Myh3, Ggt1, Stat5a, and
Cyp17a1 exhibited induction following EE treatment, suggest-
ing ER-mediated regulation of the expression of these genes in
the mouse liver. However, the rat orthologs of these genes were
not induced by o,p#-DDT (Supplementary Table 3). Moreover,
the expression of the steroidogenesis-associated gene Cyp17a1
was repressed in the rat liver and verified by QRT-PCR (Fig. 6).
DISCUSSION
The estrogenicity of o,p-DDT is well established. A com-
prehensive time-course and dose-response cDNA microarray
FIG. 3. Summary of microarray analysis in dose-response study. (A) Number of differentially expressed genes. Differentially expressed genes were selected
using a p1(t) > 0.999 combined with an absolute fold change �1.5 relative to time-matched vehicle controls. (B) Dose-response profiles of differentially expressed
genes and (C) hierarchical clustering of differentially expressed genes. The expression level of each differentially regulated gene relative to time-matched vehicle
control is represented as a line graph (B) and a heat map (C), respectively.
TOXICOGENOMICS ON o,p#-DDT–TREATED RAT LIVER 357
study with complementary histopathology and o,p#-DDT
tissue-level analysis was completed to further investigate its
estrogenicity and potential role in hepatocarcinogenicity.
The gene expression profile of o,p#-DDT was characteristic
of a PB-type inducer, as opposed to an estrogen. This is
consistent with the p,p#-DDT induction of PB-type enzyme
activity in rat liver (Wyde et al., 2003). o,p#-DDT induced
Cyp2b2, Cyp3a2, and Cyp3a23/3a1 genes, indicative of CAR/
PXR regulation (Sparfel et al., 2003). PB is reported to induce
Cyp2b2 transcript levels sevenfold in the rat liver (Agrawal and
Shapiro, 2003) and Cyp2b1/2 mRNA levels fivefold in primary
hepatocytes (Ganem et al., 1999). In the present study, o,p#-DDT induced Cyp2b2 mRNA levels approximately 30-fold in
the liver. Dexamethazone, a potent PXR activator, induced
Cyp3a2 transcripts fourfold in the male rat liver (Meredith
et al., 2003). Cyp3a23/3a1 was also induced 35-fold by
dexamethazone and 10-fold by PB in the male rat liver
(Martignoni et al., 2004), whereas it is induced sevenfold by
16a-carbonitrile, a potent PXR activator, in the adult female rat
liver (Guzelian et al., 2006). In the present study, o,p#-DDT
induced the Cyp3a2 3.5-fold and Cyp3a23/3a1 12-fold in
immature ovariectomized C57BL/6 liver. Collectively, the
induction levels of Cyp2b2, Cyp3a2, and Cyp3a23/3a1 mRNA
by o,p#-DDT are comparable to other well-established PXR/
CAR ligands.
CAR activation is associated with hepatomegaly (Huang
et al., 2005) and centrilobular hypertrophy with concomitant
induction of Cyp2b1 and Cyp3a2, which is prototypical of PB-
type enzyme inducers (Harada et al., 2003). Furthermore, both
CAR and PXR transcript levels were induced, which may
facilitate receptor-mediated differential gene expression. How-
ever, cDNA microarrays and QRT-PCR only assess transcript
levels, while increases in mRNA levels may also be due to
posttranscriptional events (e.g., mRNA stability).
The activation of PXR/CAR and the induction of cyto-
chrome P450 activity is not only consistent with the increases
FIG. 4. QRT-PCR and microarray analysis of nuclear receptors and drug metabolism–related genes. CAR (Nrli3) and PXR (Nrli2) regulate Cyp2b and Cyp3a,
respectively. QRT-PCR results relative to time-matched vehicle controls are shown as bars (left axis) and presented as mean ± SE. Microarray results are
represented as lines (right axis). The dashed line indicates the expression level of the time-matched vehicle control. Features for Cyp3a23/3a1, Nrli2, and Nrli3
were not represented on the cDNA array and were only examined by QRT-PCR. The asterisk (*) indicates a significant ( p < 0.05) difference from the time-
matched vehicle controls using a two-way ANOVA followed by Tukey’s post hoc test for QRT-PCR data.
358 KIYOSAWA ET AL.
in RLW and hepatocyte swelling with hypertrophy but also
with the hepatic clearance of o,p#-DDT, which bears
similarities to the reductive dechlorination of p,p#-DDT to
p,p#-DDD by Cyp2b and Cyp3a isozymes in the rat liver
(Kitamura et al., 2002). Therefore, the induction of Cyp2b2,
Cyp3a2, and Cyp3a23/3a1 mRNA levels likely contributes to
the time-dependent clearance of o,p#-DDT and the detection of
o,p#-DDD from 2 to 12 h as well as its subsequent decrease, as
seen with metabolism of p,p#-DDT (Tebourbi et al., 2006;
Tomiyama et al., 2003). Furthermore, p,p#-DDT and its
metabolites accumulate in adipocytes with relatively low levels
present in the liver (Tebourbi et al., 2006). Collectively, this
suggests that o,p#-DDT was metabolized to o,p#-DDD and
subsequently stored in peripheral fat stores, as reported for
p,p#-DDT metabolism (Tebourbi et al., 2006). Cyp2b and
Cyp3a induction may also contribute to sterol metabolism
(Tabb and Blumberg, 2006) and alter circulating steroid
hormone levels (Gupta et al., 1980), although a poor
correlation between hepatic enzyme induction and enhanced
hormone clearance has been reported (You, 2004).
The induction of Cyp2b2 and Cyp3a23/3a1 mRNA and the
differential expression of electron transport and reductive
reaction–related genes such as Ephx1, Gclm, Gpx2, Txn1, and
Txnrd1 are also suggestive of an oxidative stress response.
Hmox1, HSPs, and poly (ADP-ribose) polymerases are
elevated in response to oxidative stress (Bauer and Bauer,
2002; Diller, 2006; Gero and Szabo, 2006) and were induced
by o,p#-DDT. Reported increases in hepatic lipid peroxide
content (Harada et al., 2003) confirm the significance of these
gene expression changes.
CAR activation is associated with cell cycle regulation
(Ledda-Columbano et al., 2000) and transient hepatomegaly
from the induction of DNA replication and the suppression of
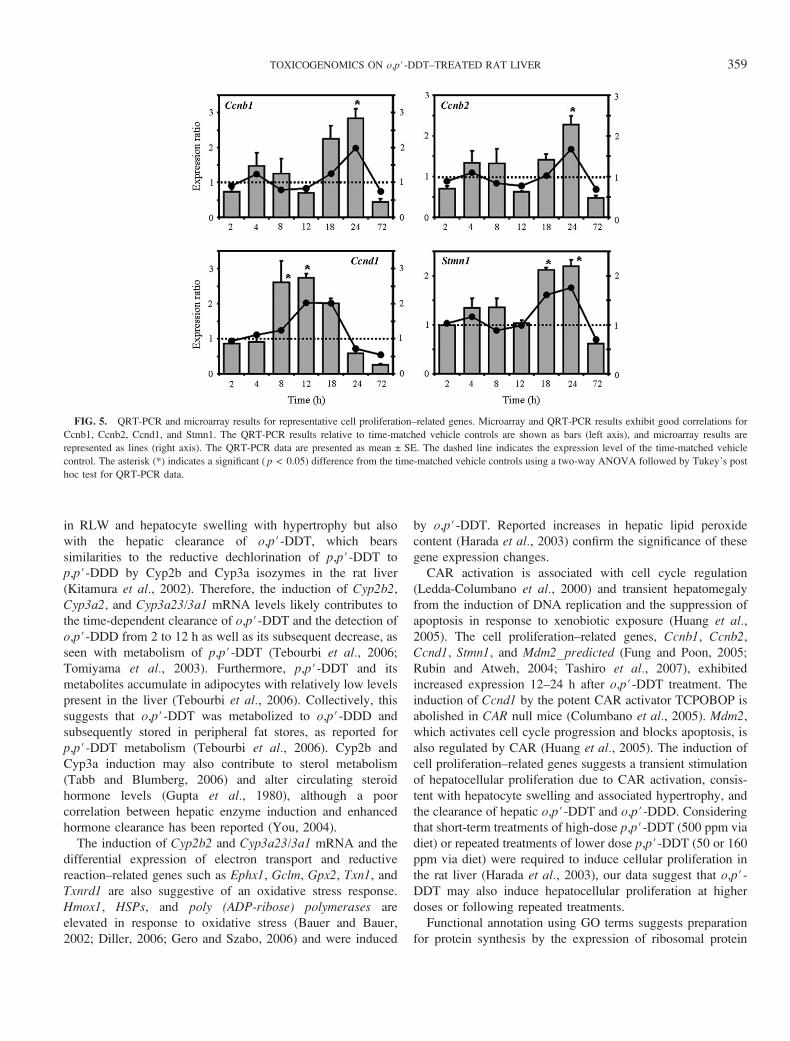
apoptosis in response to xenobiotic exposure (Huang et al.,2005). The cell proliferation–related genes, Ccnb1, Ccnb2,
Ccnd1, Stmn1, and Mdm2_predicted (Fung and Poon, 2005;
Rubin and Atweh, 2004; Tashiro et al., 2007), exhibited
increased expression 12–24 h after o,p#-DDT treatment. The
induction of Ccnd1 by the potent CAR activator TCPOBOP is
abolished in CAR null mice (Columbano et al., 2005). Mdm2,
which activates cell cycle progression and blocks apoptosis, is
also regulated by CAR (Huang et al., 2005). The induction of
cell proliferation–related genes suggests a transient stimulation
of hepatocellular proliferation due to CAR activation, consis-
tent with hepatocyte swelling and associated hypertrophy, and
the clearance of hepatic o,p#-DDT and o,p#-DDD. Considering
that short-term treatments of high-dose p,p#-DDT (500 ppm via
diet) or repeated treatments of lower dose p,p#-DDT (50 or 160
ppm via diet) were required to induce cellular proliferation in
the rat liver (Harada et al., 2003), our data suggest that o,p#-DDT may also induce hepatocellular proliferation at higher
doses or following repeated treatments.
Functional annotation using GO terms suggests preparation
for protein synthesis by the expression of ribosomal protein
FIG. 5. QRT-PCR and microarray results for representative cell proliferation–related genes. Microarray and QRT-PCR results exhibit good correlations for
Ccnb1, Ccnb2, Ccnd1, and Stmn1. The QRT-PCR results relative to time-matched vehicle controls are shown as bars (left axis), and microarray results are
represented as lines (right axis). The QRT-PCR data are presented as mean ± SE. The dashed line indicates the expression level of the time-matched vehicle
control. The asterisk (*) indicates a significant ( p < 0.05) difference from the time-matched vehicle controls using a two-way ANOVA followed by Tukey’s post
hoc test for QRT-PCR data.
TOXICOGENOMICS ON o,p#-DDT–TREATED RAT LIVER 359
genes at 18 h. The concomitant induction of proteasomal
proteolysis genes would facilitate protein turnover and cellular
adaptation. Both responses are consistent with the hepatocyte
swelling with hypertrophy and the induction of genes
associated with oxidative stress. However, the present study
primarily focused on differential gene expression. Additional
biochemical investigations such as protein-level analysis,
enzymatic activity, or metabolite analysis are needed to
demonstrate that these gene expression effects elicited by
o,p’-DDT correlate with subsequent events.
Binding to the ER has been proposed to contribute to the
hepatocarcinogenicity of o,p#-DDT (Giannitrapani et al., 2006;
Holsapple et al., 2006). However, a comprehensive comparison
of the hepatic differential gene expression profiles of o,p#-DDT–treated rat liver and EE-treated mouse liver (Boverhof
et al., 2004) using similar study designs and analysis methods
failed to identify a correlation (Fig. 7). This analysis suggests
that the hepatic gene expression effects of o,p#-DDT are
independent of the ER, despite its estrogenicity in other tissues
and models.
The activation of CAR by o,p#-DDT, followed by the
induction of transcripts associated with oxidative stress, cell
proliferation, and protein turnover, are suggestive of potential
roles in the etiology of hepatocarcinogenicity (Yamamoto
et al., 2004). However, the carcinogenic modes of action
through CAR are significantly different between rodents and
humans (Holsapple et al., 2006). Moreover, o,p#-DDT and its
metabolites do not elicit agonist effects mediated by human
CAR (Kretschmer and Baldwin, 2005). Consequently, the
extrapolation of potential nongenotoxic carcinogenicity of
DDT mediated by CAR in rodents to humans is questionable.
Furthermore, basal PXR expression is age and sex dependent
and is paralleled by Cyp3a mRNA levels in mouse liver (Down
et al., 2007). The induction of Cyp3a genes by dexamethazone
treatment also shows age and sex dependency (Anakk et al.,2003; Down et al., 2007). Consequently, PXR/CAR activation
by o,p#-DDT may be affected by age and sex, which further
confounds extrapolations to humans.
In summary, the differential gene expression elicited by
o,p#-DDT in the rat liver is consistent with PXR/CAR
FIG. 6. QRT-PCR verification of selected microarray results. QRT-PCR results relative to time-matched vehicle controls are shown as bars (left axis) and
presented as mean ± SE. Microarray results are represented as lines (right axis). The dashed line indicates the expression level of the time-matched vehicle control.
The asterisk (*) indicates a significant ( p < 0.05) difference from the time-matched vehicle controls using a two-way ANOVA followed by Tukey’s post hoc test
for QRT-PCR data.
360 KIYOSAWA ET AL.
regulation, and the nongenotoxic carcinogenic properties of
DDT appears to be independent of the ER. Given the species
differences in CAR-mediated activity, further investigation is
warranted in order to more comprehensively assess the acute
toxicity and probable carcinogenicity of DDT in humans.
SUPPLEMENTARY DATA
Supplementary Tables 1–3 are available online at http://
toxsci.oxfordjournals.org/.
FUNDING
National Institute of General Medical Sciences
(GM075838); U.S. Environmental Protection Agency
(RD83184701). T.R.Z. is partially supported by the Michigan
Agricultural Experiment Station.
ACKNOWLEDGMENTS
The authors would like to acknowledge Edward Dere for
critical reading of the manuscript.
REFERENCES
Agrawal, A. K., and Shapiro, B. H. (2003). Constitutive and inducible hepatic
cytochrome P450 isoforms in senescent male and female rats and response to
low-dose phenobarbital. Drug Metab. Dispos. 31, 612–619.
Anakk, S., Ku, C. Y., Vore, M., and Strobel, H. W. (2003). Insights into
gender bias: Rat cytochrome P450 3A9. J. Pharmacol. Exp. Ther. 305,
703–709.
Attaran, A., and Maharaj, R. (2000). Ethical debate: Doctoring malaria, badly:
The global campaign to ban DDT. BMJ 321, 1403–1405.
Bauer, M., and Bauer, I. (2002). Heme oxygenase-1: Redox regulation and role
in the hepatic response to oxidative stress. Antioxid. Redox Signal 4,
749–758.
Bayen, S., Giusti, P., Lee, H. K., Barlow, P. J., and Obard, J. P. (2005).
Bioaccumulation of DDT pesticide in cultured Asian seabass following
dietary exposure. J. Toxicol. Environ. Health Part A 68, 51–65.
Boverhof, D. R., Fertuck, K. C., Burgoon, L. D., Eckel, J. E., Gennings, C., and
Zacharewski, T. R. (2004). Temporal- and dose-dependent hepatic gene
expression changes in immature ovariectomized mice following exposure to
ethynyl estradiol. Carcinogenesis 25, 1277–1291.
Boverhof, D. R., Kwekel, J. C., Humes, D. G., Burgoon, L. D., and
Zacharewski, T. R. (2006). Dioxin induces an estrogen-like, estrogen
receptor-dependent gene expression response in the murine uterus. Mol.
Pharmacol. 69, 1599–1606.
Burgoon, L. D., Boutros, P. C., Dere, E., and Zacharewski, T. R. (2006).
dbZach: A MIAME-compliant toxicogenomic supportive relational database.
Toxicol. Sci. 90, 558–568.
Burgoon, L. D., Eckel-Passow, J. E., Gennings, C., Boverhof, D. R.,
Burt, J. W., Fong, C. J., and Zacharewski, T. R. (2005). Protocols for the
assurance of microarray data quality and process control. Nucleic. Acids Res.
33, e172.
Burgoon, L. D., and Zacharewski, T. R. (2007). dbZach toxicogenomic
information management system. Pharmacogenomics 8, 287–291.
Ciana, P., Raviscioni, M., Mussi, P., Vegeto, E., Que, I., Parker, M. G.,
Lowik, C., and Maggi, A. (2003). In vivo imaging of transcriptionally active
estrogen receptors. Nat. Med. 9, 82–86.
Cocco, P., Fadda, D., Billai, B., D’Atri, M., Melis, M., and Blair, A. (2005).
Cancer mortality among men occupationally exposed to dichlorodiphenyltri-
chloroethane. Cancer Res. 65, 9588–9594.
FIG. 7. Correlation analysis of o,p#-DDT and EE hepatic gene expression profiles. (A) Flow chart of correlation analysis. The temporal profiles of o,p#-DDT–
treated rat liver (current study) and those of the EE-treated mouse liver (Boverhof et al., 2004) were compared by examining the Pearson#s correlation of the
temporal gene expression (fold change) and significance ( p1[t] value for rat and t-value for mouse data) values for the 148 orthologous genes. The filtering criteria
for o,p#-DDT study were less stringent ( p1[t] value > 0.99 at least at one time point and absolute fold change �1.5) compared to that used in GO analysis ( p1[t]
value > 0.999 at least at two time points and absolute fold change �1.5). Both studies used comparable designs, models, cDNA microarray platforms, and data
analysis methods. Ideally, correlations for gene expression and significance approaching 1.00 would indicate that the orthologous genes are similar and would fall
in the upper right quadrant. (B) Correlation analysis. Expression and significance correlations for the 148 orthologous genes are randomly distributed throughout
the plot, indicating that o,p#-DDT and EE gene expression profiles are poorly correlated, indicating different mechanisms of action.
TOXICOGENOMICS ON o,p#-DDT–TREATED RAT LIVER 361
Columbano, A., Ledda-Columbano, G. M., Pibiri, M., Cossu, C.,
Menegazzi, M., Moore, D. D., Huang, W., Tian, J., and Locker, J. (2005).
Gadd45beta is induced through a CAR-dependent, TNF-independent
pathway in murine liver hyperplasia. Hepatology 42, 1118–1126.
Dennis, G., Jr, Sherman, B. T., Hosack, D. A., Yang, J., Gao, W., Lane, H. C.,
and Lempicki, R. A. (2003). DAVID: Database for Annotation, Visualiza-
tion, and Integrated Discovery. Genome Biol. 4, P3.
Diller, K. R. (2006). Stress protein expression kinetics. Annu. Rev. Biomed.
Eng. 8, 403–424.
Down, M. J., Arkle, S., and Mills, J. J. (2007). Regulation and induction of
CYP3A11, CYP3A13 and CYP3A25 in C57BL/6J mouse liver. Arch.
Biochem. Biophys. 457, 105–110.
Eckel, J. E., Gennings, C., Chinchilli, V. M., Burgoon, L. D., and
Zacharewski, T. R. (2004). Empirical bayes gene screening tool for time-
course or dose-response microarray data. J. Biopharm. Stat. 14, 647–670.
Eckel, J. E., Gennings, C., Therneau, T. M., Burgoon, L. D., Boverhof, D. R.,
and Zacharewski, T. R. (2005). Normalization of two-channel microarray
experiments: A semiparametric approach. Bioinformatics 21, 1078–1083.
Fung, T. K., and Poon, R. Y. (2005). A roller coaster ride with the mitotic
cyclins. Semin. Cell Dev. Biol. 16, 335–342.
Ganem, L. G., Trottier, E., Anderson, A., and Jefcoate, C. R. (1999).
Phenobarbital induction of CYP2B1/2 in primary hepatocytes: Endocrine
regulation and evidence for a single pathway for multiple inducers. Toxicol.
Appl. Pharmacol. 155, 32–42.
Gero, D., and Szabo, C. (2006). Role of the peroxynitrite-poly (ADP-ribose)
polymerase pathway in the pathogenesis of liver injury. Curr. Pharm. Des.
12, 2903–2910.
Giannitrapani, L., Soresi, M., La Spada, E., Cervello, M., D’Alessandro, N.,
and Montalto, G. (2006). Sex hormones and risk of liver tumor. Ann. N Y
Acad. Sci. 1089, 228–236.
Gupta, C., Shapiro, B. H., and Yaffe, S. J. (1980). Reproductive dysfunction in
male rats following prenatal exposure to phenobarbital. Pediatr. Pharmacol.
(New York) 1, 55–62.
Guzelian, J., Barwick, J. L., Hunter, L., Phang, T. L., Quattrochi, L. C., and
Guzelian, P. S. (2006). Identification of genes controlled by the pregnane X
receptor by microarray analysis of mRNAs from pregnenolone 16alpha-
carbonitrile-treated rats. Toxicol. Sci. 94, 379–387.
Harada, T., Yamaguchi, S., Ohtsuka, R., Takeda, M., Fujisawa, H.,
Yoshida, T., Enomoto, A., Chiba, Y., Fukumori, J., Kojima, S., et al.
(2003). Mechanisms of promotion and progression of preneoplastic lesions
in hepatocarcinogenesis by DDT in F344 rats. Toxicol. Pathol. 31, 87–98.
Hoekstra, P. F., Burnison, B. K., Neheli, T., and Muir, D. C. (2001).
Enantiomer-specific activity of o,p’-DDT with the human estrogen receptor.
Toxicol. Lett. 125, 75–81.
Holsapple, M. P., Pitot, H. C., Cohen, S. M., Boobis, A. R., Klaunig, J. E.,
Pastoor, T., Dellarco, V. L., and Dragan, Y. P. (2006). Mode of action
in relevance of rodent liver tumors to human cancer risk. Toxicol. Sci. 89,
51–56.
Huang, W., Zhang, J., Washington, M., Liu, J., Parant, J. M., Lozano, G., and
Moore, D. D. (2005). Xenobiotic stress induces hepatomegaly and liver
tumors via the nuclear receptor constitutive androstane receptor. Mol.
Endocrinol. 19, 1646–1653.
International Agency for Research on Cancer (IARC). (1991). Summaries &
evaluations, DDT and associated compounds, accessed on September 26,
2007. Available at: http://www.inchem.org/documents/iarc/vol53/
04-ddt.html. Accessed September 26, 2007.
Ito, N., Tsuda, H., Hasegawa, R., and Imaida, K. (1983). Comparison of the
promoting effects of various agents in induction of preneoplastic lesions in
rat liver. Environ. Health Perspect. 50, 131–138.
Kato, N., Shibutani, M., Takagi, H., Uneyama, C., Lee, K. Y., Takigami, S.,
Mashima, K., and Hirose, M. (2004). Gene expression profile in the livers of
rats orally administered ethinylestradiol for 28 days using a microarray
technique. Toxicology 200, 179–192.
King-Jones, K., Horner, M. A., Lam, G., and Thummel, C. S. (2006). The
DHR96 nuclear receptor regulates xenobiotic responses in Drosophila. Cell
Metab. 4, 37–48.
Kitamura, S., Shimizu, Y., Shiraga, Y., Yoshida, M., Sugihara, K., and Ohta, S.
(2002). Reductive metabolism of p,p’-DDT and o,p’-DDT by rat liver
cytochrome P450. Drug Metab. Dispos. 30, 113–118.
Kretschmer, X. C., and Baldwin, W. S. (2005). CAR and PXR: Xenosensors of
endocrine disrupters? Chem. Biol. Interact. 155, 111–128.
Ledda-Columbano, G. M., Pibiri, M., Loi, R., Perra, A., Shinozuka, H., and
Columbano, A. (2000). Early increase in cyclin-D1 expression and
accelerated entry of mouse hepatocytes into S phase after administration of
the mitogen 1, 4-Bis[2-(3,5-Dichloropyridyloxy)] benzene. Am. J. Pathol.
156, 91–97.
Longnecker, M. P. (2005). Invited Commentary: Why DDT matters now. Am.
J. Epidemiol. 162, 726–728.
Mansour, S. A. (2004). Pesticide exposure–Egyptian scene. Toxicology 198,
91–115.
Martignoni, M., de Kanter, R., Grossi, P., Mahnke, A., Saturno, G., and
Monshouwer, M. (2004). An in vivo and in vitro comparison of CYP
induction in rat liver and intestine using slices and quantitative RT-PCR.
Chem. Biol. Interact. 151, 1–11.
McGlynn, K. A., Abnet, C. C., Zhang, M., Sun, X. D., Fan, J. H.,
O’Brien, T. R., Wei, W. Q., Ortiz-Conde, B. A., Dawsey, S. M.,
Weber, J. P., et al. (2006). Serum concentrations of 1,1,1-trichloro-2,2-
bis(p-chlorophenyl)ethane (DDT) and 1,1-dichloro-2,2-bis(p-chlorophenyl)-
ethylene (DDE) and risk of primary liver cancer. J. Natl. Cancer Inst. 98,
1005–1010.
Meredith, C., Scott, M. P., Renwick, A. B., Price, R. J., and Lake, B. G. (2003).
Studies on the induction of rat hepatic CYP1A, CYP2B, CYP3A and
CYP4A subfamily form mRNAs in vivo and in vitro using precision-cut rat
liver slices. Xenobiotica 33, 511–527.
Minh, T. B., Kunisue, T., Yen, N. T., Watanabe, M., Tanabe, S., Hue, N. D.,
and Qui, V. (2002). Persistent organochlorine residues and their bioaccu-
mulation profiles in resident and migratory birds from North Vietnam.
Environ. Toxicol. Chem. 21, 2108–2118.
Pedra, J. H., McIntyre, L. M., Scharf, M. E., and Pittendrigh, B. R. (2004).
Genome-wide transcription profile of field- and laboratory-selected dichlor-
odiphenyltrichloroethane (DDT)-resistant Drosophila. Proc. Natl. Acad. Sci.
USA 101, 7034–7039.
Rozen, S., and Skaletsky, H. (2000). Primer3 on the WWW for general users
and for biologist programmers. Methods Mol. Biol. 132, 365–386.
Rubin, C. I., and Atweh, G. F. (2004). The role of stathmin in the regulation of
the cell cycle. J. Cell. Biochem. 93, 242–250.
Sparfel, L., Payen, L., Gilot, D., Sidaway, J., Morel, F., Guillouzo, A., and
Fardel, O. (2003). Pregnane X receptor-dependent and -independent effects
of 2-acetylaminofluorene on cytochrome P450 3A23 expression and liver
cell proliferation. Biochem. Biophys. Res. Commun. 300, 278–284.
Tabb, M. M., and Blumberg, B. (2006). New modes of action for endocrine-
disrupting chemicals. Mol. Endocrinol. 20, 475–482.
Tashiro, E., Tsuchiya, A., and Imoto, M. (2007). Functions of cyclin D1
as an oncogene and regulation of cyclin D1 expression. Cancer Sci. 98,
629–635.
Tebourbi, O., Driss, M. R., Sakly, M., and Rhouma, K. B. (2006). Metabolism
of DDT in different tissues of young rats. J. Environ. Sci. Health B 41,
167–176.
Tomiyama, N., Watanabe, M., Takeda, M., Harada, T., and Kobayashi, H.
(2003). A comparative study on the reliablility of toxicokinetic parameters
for predicting hepatotoxicity of DDT in rats receiving a single or repeated
administration. J. Toxicol. Sci. 28, 403–413.
362 KIYOSAWA ET AL.

Turusov, V., Rakitsky, V., and Tomatis, L. (2002). Dichlorodiphenyltrichloro-
ethane (DDT): Ubiquity, persistence, and risks. Environ. Health Perspect.
110, 125–128.
Weissmann, G. (2006). DDT is back: Let us spray!. FASEB J. 20, 2427–2429.
Willoughby, L., Chung, H., Lumb, C., Robin, C., Batterham, P., and
Daborn, P. J. (2006). A comparison of Drosophila melanogaster de-
toxification gene induction responses for six insecticides, caffeine and
phenobarbital. Insect Biochem. Mol. Biol. 36, 934–942.
Wyde, M. E., Bartolucci, E., Ueda, A., Zhang, H., Yan, B., Negishi, M.,
and You, L. (2003). The environmental pollutant 1,1-dichloro-2,2-bis
(p-chlorophenyl)ethylene induces rat hepatic cytochrome P450 2B and
3A expression through the constitutive androstane receptor and pregnane
X receptor. Mol. Pharmacol. 64, 474–481.
Yamamoto, Y., Moore, R., Goldsworthy, T. L., Negishi, M., and
Maronpot, R. R. (2004). The orphan nuclear receptor constitutive active/
androstane receptor is essential for liver tumor promotion by phenobarbital in
mice. Cancer Res. 64, 7197–7200.
You, L. (2004). Steroid hormone biotransformation and xenobiotic induction
of hepatic steroid metabolizing enzymes. Chem. Biol. Interact. 147,
233–246.
TOXICOGENOMICS ON o,p#-DDT–TREATED RAT LIVER 363