DDT User Guide - Barcelona Supercomputing Center
10
-
Upload
khangminh22 -
Category
Documents
-
view
2 -
download
0
Transcript of DDT User Guide - Barcelona Supercomputing Center
DDT User Guide
Barcelona Supercomputing CenterCopyright © 2017 BSC-CNS
January 3, 2022
Contents
1 Introduction to debugging with DDT 2
2 Basic interactive debugging with DDT 2
2.1 Compiling your application for interactive debugging . . . . . . . . . . . . . . . 22.2 Modifying your job script for interactive debugging . . . . . . . . . . . . . . . . 22.3 Launching the job for interactive debugging . . . . . . . . . . . . . . . . . . . . 22.4 Quick look of common utilities and general usage . . . . . . . . . . . . . . . . . 3
3 Basic o�ine debugging with DDT 5
3.1 Compiling your application . . . . . . . . . . . . . . . . . . . . . . . . . . . . . 53.2 Modifying your job script . . . . . . . . . . . . . . . . . . . . . . . . . . . . . . 53.3 Launching the job . . . . . . . . . . . . . . . . . . . . . . . . . . . . . . . . . . . 6
4 Enabling memory debugging with DDT 6
4.1 Interactive debugging . . . . . . . . . . . . . . . . . . . . . . . . . . . . . . . . . 64.2 O�ine debugging . . . . . . . . . . . . . . . . . . . . . . . . . . . . . . . . . . . 64.3 Static Linking . . . . . . . . . . . . . . . . . . . . . . . . . . . . . . . . . . . . . 7
5 Example of a debugging, step by step 7
5.1 Compiling . . . . . . . . . . . . . . . . . . . . . . . . . . . . . . . . . . . . . . . 75.2 Adapting the job script . . . . . . . . . . . . . . . . . . . . . . . . . . . . . . . . 75.3 Launching the program and the debugger . . . . . . . . . . . . . . . . . . . . . 75.4 Locating the issue with the debugger . . . . . . . . . . . . . . . . . . . . . . . . 85.5 Fixing the issue . . . . . . . . . . . . . . . . . . . . . . . . . . . . . . . . . . . . 10
6 Where can I know more? 10
1
1 Introduction to debugging with DDT
Debugging programs that run on MPI can be fairly cumbersome without the right tools, so we haveprovided our systems with the DDT program.
DDT is a debugger initially developed by Allinea, now property of ARM. The debugger is specif-ically designed to be used in HPC environments, as its purpose is to keep track of the state of theprogram in every MPI node/task it uses.
With DDT you can (but not limited to):
� Interactively track and debug program crashes that may occur on certain nodes.
� Track memory related problems in your programs.
� Use o�ine (non-interactive) debugging for long running jobs.
� Get more information about crashes.
We'll begin explaining how to set up your environment and job scripts for a simple debuggingsession.
2 Basic interactive debugging with DDT
To debug with DDT using an interactive session (as if it was a typical debugger), you need to do somethings: you need to compile your program with a debugging �ag and then modify your job script soyour program is launched with the option to connect to the debugger (note that this is only one ofthe ways you use DDT).
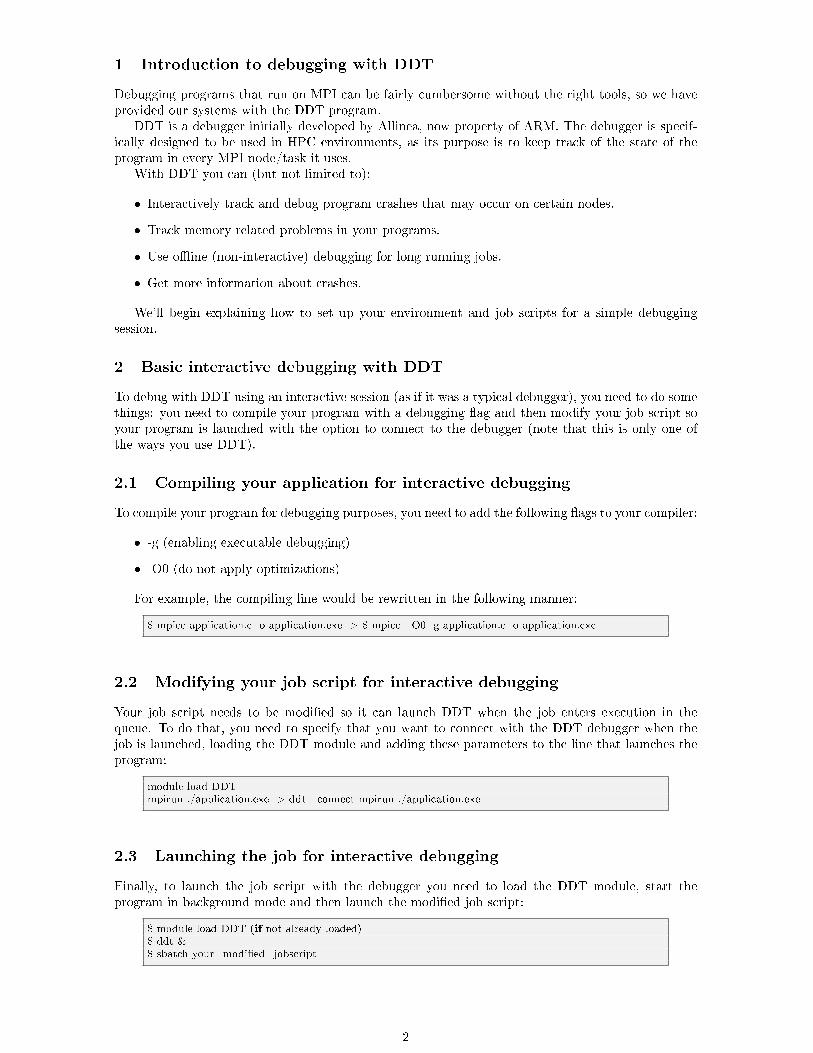
2.1 Compiling your application for interactive debugging
To compile your program for debugging purposes, you need to add the following �ags to your compiler:
� -g (enabling executable debugging)
� -O0 (do not apply optimizations)
For example, the compiling line would be rewritten in the following manner:
$ mpicc application.c -o application.exe -> $ mpicc -O0 -g application.c -o application.exe
2.2 Modifying your job script for interactive debugging
Your job script needs to be modi�ed so it can launch DDT when the job enters execution in thequeue. To do that, you need to specify that you want to connect with the DDT debugger when thejob is launched, loading the DDT module and adding these parameters to the line that launches theprogram:
module load DDTmpirun ./application.exe -> ddt --connect mpirun ./application.exe
2.3 Launching the job for interactive debugging
Finally, to launch the job script with the debugger you need to load the DDT module, start theprogram in background mode and then launch the modi�ed job script:
$ module load DDT (if not already loaded)$ ddt &$ sbatch your_modi�ed_jobscript
2
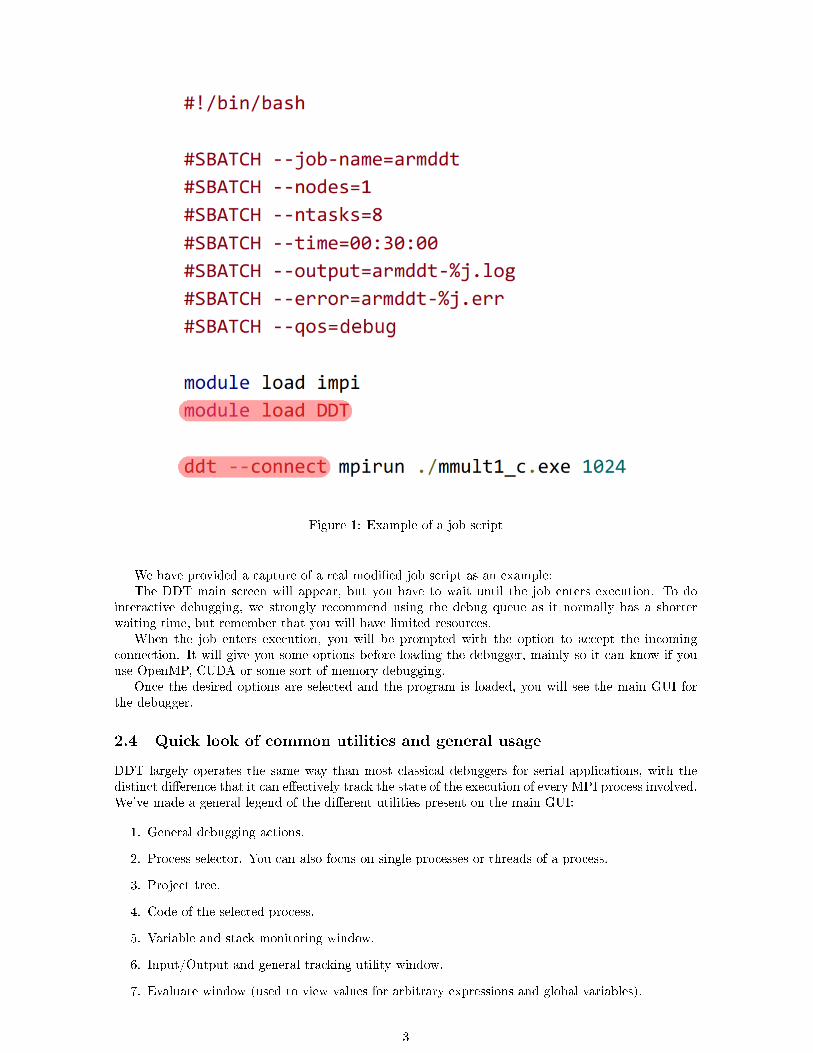
Figure 1: Example of a job script
We have provided a capture of a real modi�ed job script as an example:The DDT main screen will appear, but you have to wait until the job enters execution. To do
interactive debugging, we strongly recommend using the debug queue as it normally has a shorterwaiting time, but remember that you will have limited resources.
When the job enters execution, you will be prompted with the option to accept the incomingconnection. It will give you some options before loading the debugger, mainly so it can know if youuse OpenMP, CUDA or some sort of memory debugging.
Once the desired options are selected and the program is loaded, you will see the main GUI forthe debugger.
2.4 Quick look of common utilities and general usage
DDT largely operates the same way than most classical debuggers for serial applications, with thedistinct di�erence that it can e�ectively track the state of the execution of every MPI process involved.We've made a general legend of the di�erent utilities present on the main GUI:
1. General debugging actions.
2. Process selector. You can also focus on single processes or threads of a process.
3. Project tree.
4. Code of the selected process.
5. Variable and stack monitoring window.
6. Input/Output and general tracking utility window.
7. Evaluate window (used to view values for arbitrary expressions and global variables).
3
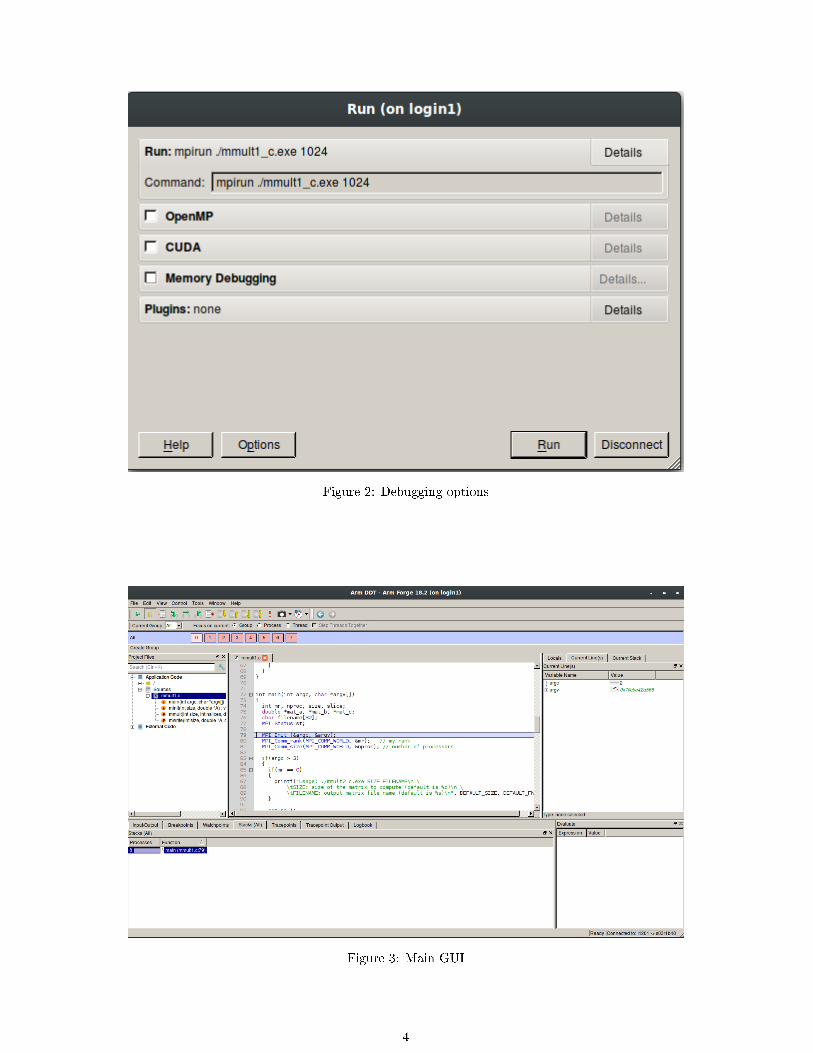
Figure 2: Debugging options
Figure 3: Main GUI
4
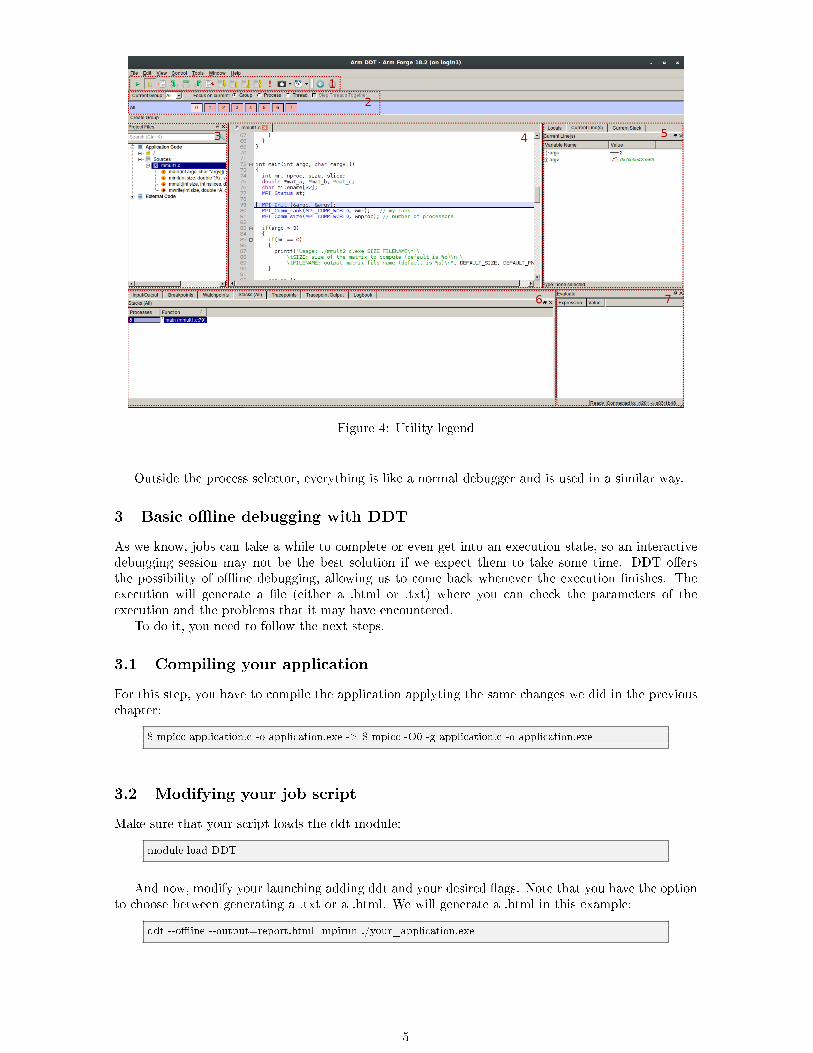
Figure 4: Utility legend
Outside the process selector, everything is like a normal debugger and is used in a similar way.
3 Basic o�ine debugging with DDT
As we know, jobs can take a while to complete or even get into an execution state, so an interactivedebugging session may not be the best solution if we expect them to take some time. DDT o�ersthe possibility of o�ine debugging, allowing us to come back whenever the execution �nishes. Theexecution will generate a �le (either a .html or .txt) where you can check the parameters of theexecution and the problems that it may have encountered.
To do it, you need to follow the next steps.
3.1 Compiling your application
For this step, you have to compile the application applyting the same changes we did in the previouschapter:
$ mpicc application.c -o application.exe -> $ mpicc -O0 -g application.c -o application.exe
3.2 Modifying your job script
Make sure that your script loads the ddt module:
module load DDT
And now, modify your launching adding ddt and your desired �ags. Note that you have the optionto choose between generating a .txt or a .html. We will generate a .html in this example:
ddt --o�ine --output=report.html mpirun ./your_application.exe
5
3.3 Launching the job
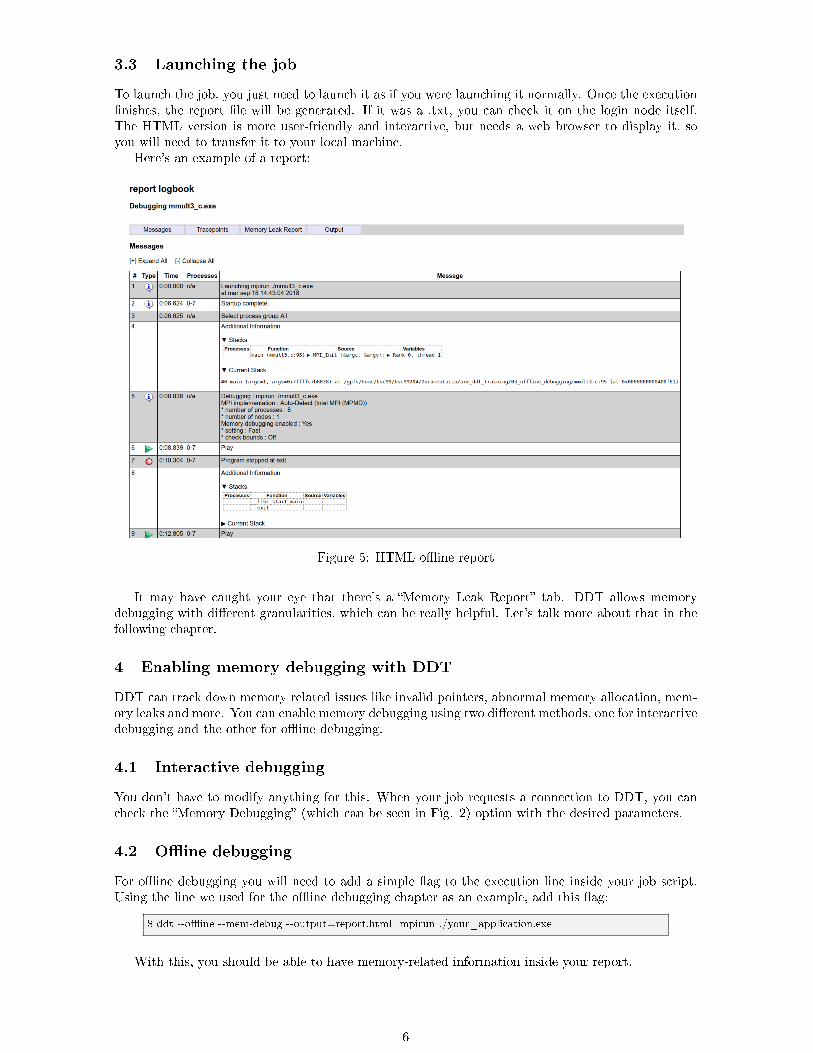
To launch the job, you just need to launch it as if you were launching it normally. Once the execution�nishes, the report �le will be generated. If it was a .txt, you can check it on the login node itself.The HTML version is more user-friendly and interactive, but needs a web browser to display it, soyou will need to transfer it to your local machine.
Here's an example of a report:
Figure 5: HTML o�ine report
It may have caught your eye that there's a �Memory Leak Report� tab. DDT allows memorydebugging with di�erent granularities, which can be really helpful. Let's talk more about that in thefollowing chapter.
4 Enabling memory debugging with DDT
DDT can track down memory related issues like invalid pointers, abnormal memory allocation, mem-ory leaks and more. You can enable memory debugging using two di�erent methods, one for interactivedebugging and the other for o�ine debugging.
4.1 Interactive debugging
You don't have to modify anything for this. When your job requests a connection to DDT, you cancheck the �Memory Debugging� (which can be seen in Fig. 2) option with the desired parameters.
4.2 O�ine debugging
For o�ine debugging you will need to add a simple �ag to the execution line inside your job script.Using the line we used for the o�ine debugging chapter as an example, add this �ag:
$ ddt --o�ine --mem-debug --output=report.html mpirun ./your_application.exe
With this, you should be able to have memory-related information inside your report.
6
4.3 Static Linking
There's an exception to the previous instructions, and that is when your program has been staticallylinked. If your program is statically linked then you must explicitly link the memory debugginglibrary with your program in order to use the Memory Debugging feature in Arm DDT. To link withthe memory debugging library, you must add the appropriate �ags from the table below at the verybeginning of the link command. This ensures that all instances of allocators, in both user code andlibraries, are wrapped. Any de�nition of a memory allocator preceding the memory debugging link�ags can cause partial wrapping, and unexpected runtime errors.
The required linking �ags are the following:
LFLAGS = -L/apps/DDT/18.0.1/lib/64 -zmuldefs -Wl,--unde�ned=malloc,-unde�ned=_ZdaPv -ldmallocthcxx
5 Example of a debugging, step by step
To end this manual, we will provide you a code and we will debug it using DDT. You can follow thesame procedures that we will show by yourself. You can get the source code here (copy it to yourhome folder and extract it):
(Assuming you're inside your home folder)$ cp /apps/DDT/SRC/DDT_example.tar.gz ~$ tar xvf DDT_example.tar.gz
Inside the generated folder you will see some source code �les (one in C and the other one inFortran, we'll use the C version), a job script and a make�le alongside a solutions folder.
5.1 Compiling
Our job is to �nd and �x what is wrong with the source code, so the �rst step will be compiling ourapplication using our make�le (feel free to check the contents). This make�le has an option to addthe required compiling �ags for debugging, so we'll take advantage of it:
$ make DEBUG=1
This will generate the required executable �les for when we launch our job script.
5.2 Adapting the job script
The job script provided is functional as it is, but we will be doing an interactive debugging session, soyou could be waiting for a while. To alleviate that, we will be using the debug queue, which shouldn'thave too many waiting jobs. To achieve that, add this line to your job script:
#SBATCH --qos=debug
We're almost ready to launch it!
5.3 Launching the program and the debugger
First we need to load our DDT module:
$ module load DDT
Once we've done this, we can launch DDT as a background process:
$ ddt &
As you read before, the DDT window will appear, but ignore it for now. Now it's time to launchour job script:
7
$ sbatch job.sub
It may take a while, but eventually your job will enter execution and DDT will prompt you witha little window telling you there's an incoming connection. Accept it. In the next window you don'tneed to check any box, just press �Run�.
5.4 Locating the issue with the debugger
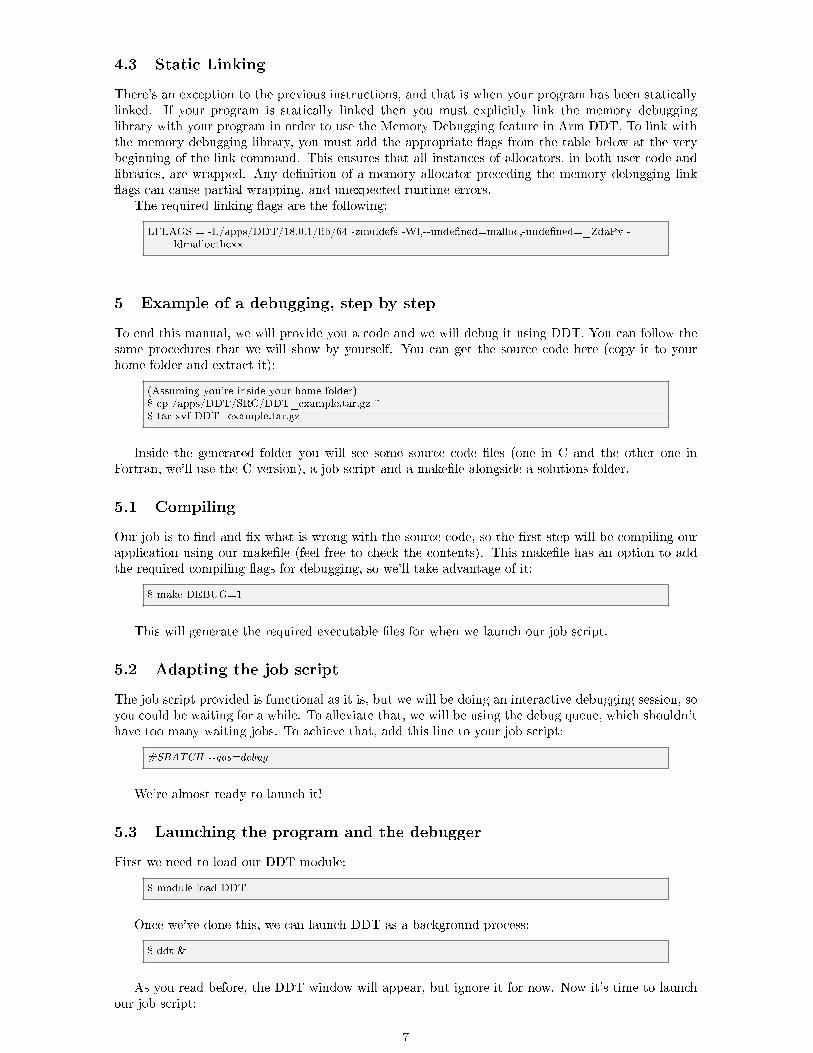
First of all, lets talk a bit about the program we are launching. It's a matrix multiplication imple-mented with MPI, following this algorithm:
1. Master initializes matrices A, B and C.
2. Master slices the matrices A and C, sends them to slaves.
3. Master and slaves perform the multiplication.
4. Slaves send their results back to master.
5. Master writes the result matrix C in an output �le.
Here you have a diagram showing the data distribution:
Figure 6: Data distribution
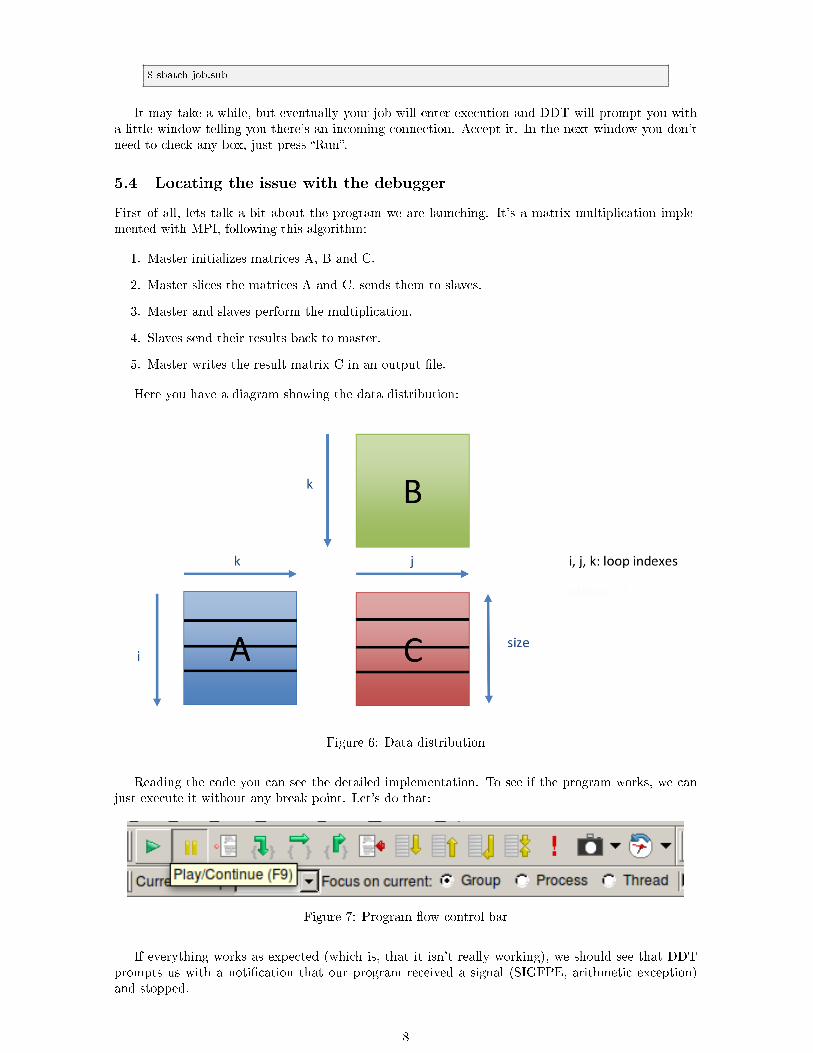
Reading the code you can see the detailed implementation. To see if the program works, we canjust execute it without any break point. Let's do that:
Figure 7: Program �ow control bar
If everything works as expected (which is, that it isn't really working), we should see that DDTprompts us with a noti�cation that our program received a signal (SIGFPE, arithmetic exception)and stopped.
8
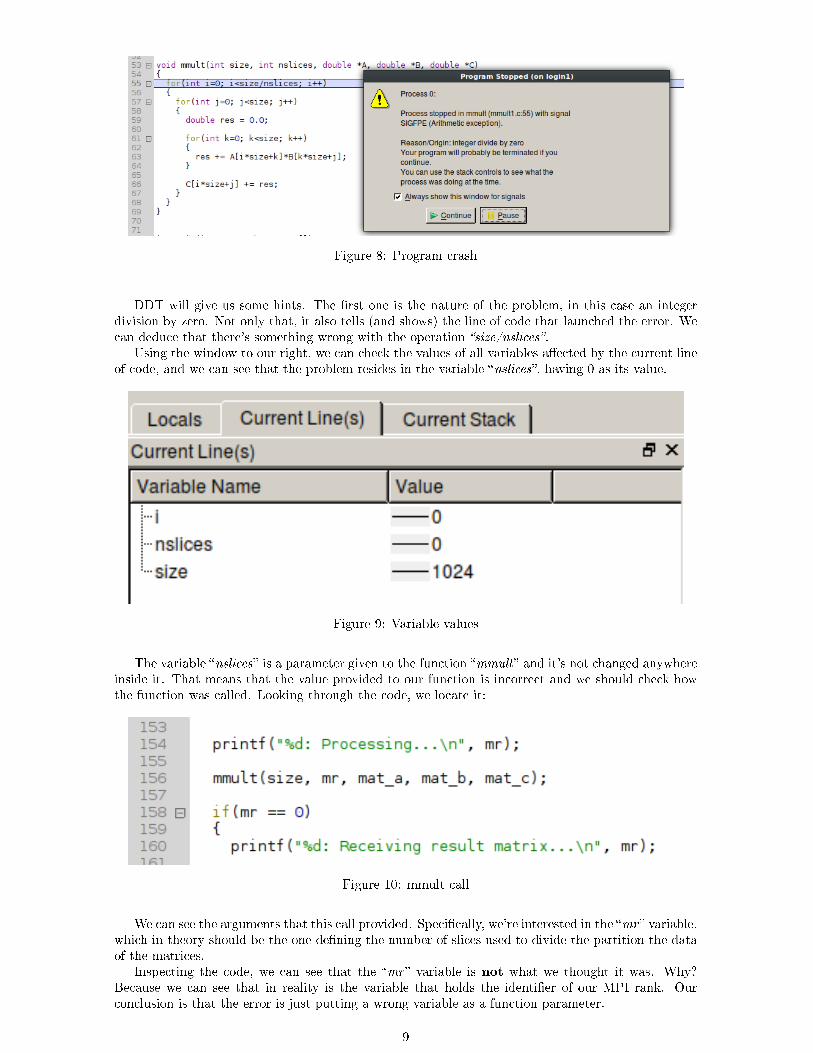
Figure 8: Program crash
DDT will give us some hints. The �rst one is the nature of the problem, in this case an integerdivision by zero. Not only that, it also tells (and shows) the line of code that launched the error. Wecan deduce that there's something wrong with the operation �size/nslices�.
Using the window to our right, we can check the values of all variables a�ected by the current lineof code, and we can see that the problem resides in the variable �nslices�, having 0 as its value.
Figure 9: Variable values
The variable �nslices� is a parameter given to the function �mmult� and it's not changed anywhereinside it. That means that the value provided to our function is incorrect and we should check howthe function was called. Looking through the code, we locate it:
Figure 10: mmult call
We can see the arguments that this call provided. Speci�cally, we're interested in the �mr � variable,which in theory should be the one de�ning the number of slices used to divide the partition the dataof the matrices.
Inspecting the code, we can see that the �mr � variable is not what we thought it was. Why?Because we can see that in reality is the variable that holds the identi�er of our MPI rank. Ourconclusion is that the error is just putting a wrong variable as a function parameter.
9
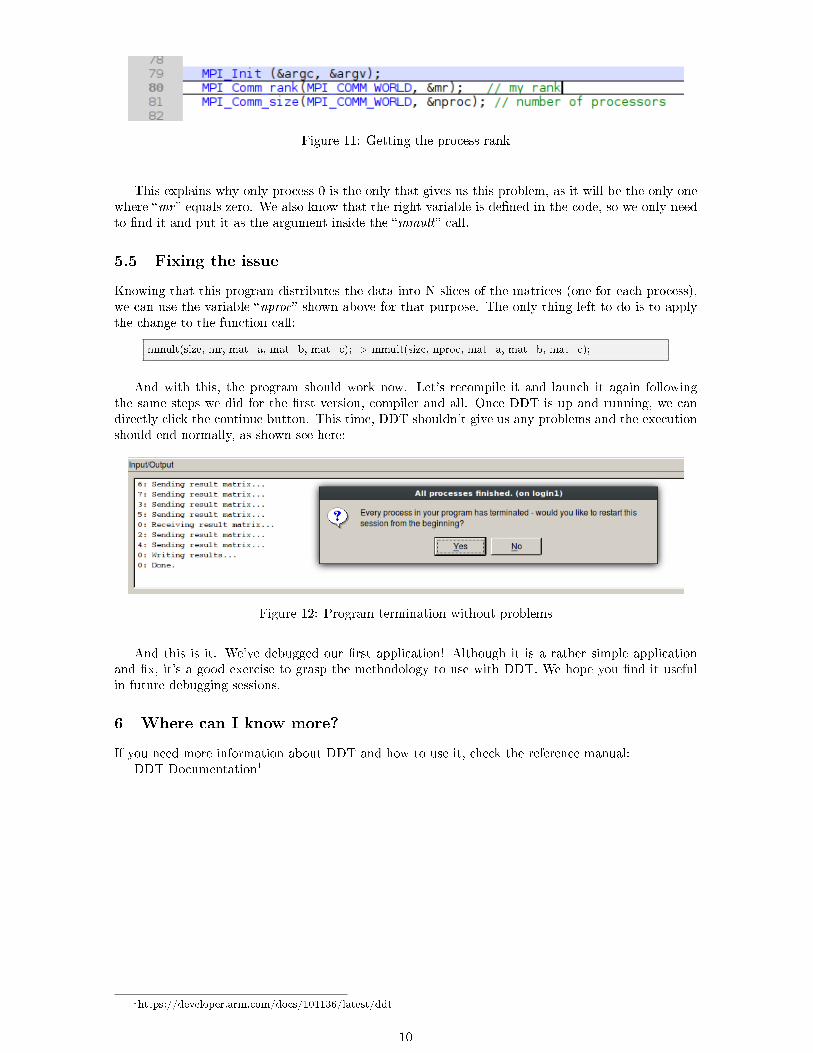
Figure 11: Getting the process rank
This explains why only process 0 is the only that gives us this problem, as it will be the only onewhere �mr � equals zero. We also know that the right variable is de�ned in the code, so we only needto �nd it and put it as the argument inside the �mmult� call.
5.5 Fixing the issue
Knowing that this program distributes the data into N slices of the matrices (one for each process),we can use the variable �nproc� shown above for that purpose. The only thing left to do is to applythe change to the function call:
mmult(size, mr, mat_a, mat_b, mat_c); -> mmult(size, nproc, mat_a, mat_b, mat_c);
And with this, the program should work now. Let's recompile it and launch it again followingthe same steps we did for the �rst version, compiler and all. Once DDT is up and running, we candirectly click the continue button. This time, DDT shouldn't give us any problems and the executionshould end normally, as shown see here:
Figure 12: Program termination without problems
And this is it. We've debugged our �rst application! Although it is a rather simple applicationand �x, it's a good exercise to grasp the methodology to use with DDT. We hope you �nd it usefulin future debugging sessions.
6 Where can I know more?
If you need more information about DDT and how to use it, check the reference manual:DDT Documentation1
1https://developer.arm.com/docs/101136/latest/ddt
10