Analyses of lindane, vinclozolin, aldrin, p, p′DDE, o, p′DDT and p, p′DDT in human serum using...
15
760 (2001) 1–15 Journal of Chromatography B, www.elsevier.com / locate / chromb Analyses of lindane, vinclozolin, aldrin, p, p 9-DDE, o, p 9-DDT and p, p 9-DDT in human serum using gas chromatography with electron q capture detection and tandem mass spectrometry a a a, a * ´ ´ ´ M. Moreno Frıas , A. Garrido Frenich , J.L. Martınez Vidal , M. Mateu Sanchez , b c F. Olea , N. Olea a ´ ´ Department of Analytical Chemistry, University of Almerıa, 04071 Almerıa, Spain b Department of Nutrition and Food Science, University of Granada, 18071 Granada, Spain c Department of Radiology, University of Granada, 18071 Granada, Spain Received 7 November 2000; received in revised form 4 April 2001; accepted 5 April 2001 Abstract A sensitive, selective and reliable procedure was developed and validated to determine organochlorinated compounds, which present endocrine-disrupting effects, lindane, vinclozolin, aldrin, p, p9-DDT, o, p9-DDT and p, p9-DDE, in human serum. The analytical methodology combines serum extraction with organic solvents, clean-up of the organic extract using acid treatment with H SO , elution of the cleaned-up extract through liquid column chromatography system and analysis of 2 4 the fraction eluted by gas chromatography (GC) with electron capture detection (ECD) and tandem mass spectrometry (MS–MS) detection mode. Performance characteristics, such as linearity, sensitivity, precision, accuracy or recovery, of both chromatographic methods were studied. The proposed analytical methodology was applied to analyse the target compounds ´ in serum samples from women living in agricultural areas of Almerıa (Spain). Comparison of the MS–MS and the ECD results was made and the advantage of the MS–MS operation mode to determine endocrine disrupting compounds in complex matrices is also presented. 2001 Elsevier Science B.V. All rights reserved. Keywords: Lindane; Vinclozolin; Aldrin; DDE; DDT 1. Introduction suffered adverse health consequences from exposure to environmental chemicals that interact with the Evidence has been accumulating which indicates endocrine system [1–5] and so they are more that humans, domestic and wildlife species have accurately named ‘‘endocrine disrupting’’ [6]. There are many factors which influence whether a com- pound will affect humans, depending on how the q Presented at the 29th Scientific Meeting of the Spanish Group compound enters the body, how it is distributed, ´ of Chromatography and Related Techniques, Alcala de Henares what hormonal or other processes it interacts with (Madrid), 12–14 July 2000. and what other endocrine disrupting or complex *Corresponding author. Tel.: 134-950-015-429; fax: 134-950- mixture of them is present. Nowadays, pesticide 015-483. ´ E-mail address: [email protected] (J.L. Martınez Vidal). blood levels are considered a good indicator of 0378-4347 / 01 / $ – see front matter 2001 Elsevier Science B.V. All rights reserved. PII: S0378-4347(01)00212-2
Transcript of Analyses of lindane, vinclozolin, aldrin, p, p′DDE, o, p′DDT and p, p′DDT in human serum using...

760 (2001) 1–15Journal of Chromatography B,www.elsevier.com/ locate /chromb
Analyses of lindane, vinclozolin, aldrin, p, p9-DDE, o, p9-DDT andp, p9-DDT in human serum using gas chromatography with electron
qcapture detection and tandem mass spectrometrya a a , a*´ ´ ´M. Moreno Frıas , A. Garrido Frenich , J.L. Martınez Vidal , M. Mateu Sanchez ,
b cF. Olea , N. Oleaa ´ ´Department of Analytical Chemistry, University of Almerıa, 04071 Almerıa, Spain
bDepartment of Nutrition and Food Science, University of Granada, 18071 Granada, SpaincDepartment of Radiology, University of Granada, 18071 Granada, Spain
Received 7 November 2000; received in revised form 4 April 2001; accepted 5 April 2001
Abstract
A sensitive, selective and reliable procedure was developed and validated to determine organochlorinated compounds,which present endocrine-disrupting effects, lindane, vinclozolin, aldrin, p, p9-DDT, o, p9-DDT and p, p9-DDE, in humanserum. The analytical methodology combines serum extraction with organic solvents, clean-up of the organic extract usingacid treatment with H SO , elution of the cleaned-up extract through liquid column chromatography system and analysis of2 4
the fraction eluted by gas chromatography (GC) with electron capture detection (ECD) and tandem mass spectrometry(MS–MS) detection mode. Performance characteristics, such as linearity, sensitivity, precision, accuracy or recovery, of bothchromatographic methods were studied. The proposed analytical methodology was applied to analyse the target compounds
´in serum samples from women living in agricultural areas of Almerıa (Spain). Comparison of the MS–MS and the ECDresults was made and the advantage of the MS–MS operation mode to determine endocrine disrupting compounds incomplex matrices is also presented. 2001 Elsevier Science B.V. All rights reserved.
Keywords: Lindane; Vinclozolin; Aldrin; DDE; DDT
1. Introduction suffered adverse health consequences from exposureto environmental chemicals that interact with the
Evidence has been accumulating which indicates endocrine system [1–5] and so they are morethat humans, domestic and wildlife species have accurately named ‘‘endocrine disrupting’’ [6]. There
are many factors which influence whether a com-pound will affect humans, depending on how the
qPresented at the 29th Scientific Meeting of the Spanish Group compound enters the body, how it is distributed,´of Chromatography and Related Techniques, Alcala de Henares what hormonal or other processes it interacts with
(Madrid), 12–14 July 2000.and what other endocrine disrupting or complex*Corresponding author. Tel.: 134-950-015-429; fax: 134-950-mixture of them is present. Nowadays, pesticide015-483.
´E-mail address: [email protected] (J.L. Martınez Vidal). blood levels are considered a good indicator of
0378-4347/01/$ – see front matter 2001 Elsevier Science B.V. All rights reserved.PI I : S0378-4347( 01 )00212-2
760 (2001) 1–152 ´M. Moreno Frıas et al. / J. Chromatogr. B
pesticide body burden as close correlations between ing interfering compounds that limit performance ofthe concentrations of pesticides in blood and fat have capillary columns and the certainty of the analysis.been established even in the case of non-occupation- Nowadays, the tandem of GC with Mass Spec-ally exposed individuals [7]. As a consequence the trometry (MS) has become the ideal analytical tooldetermination of such compounds in biological sam- for confirmatory analysis [18]. The introduction ofples, specifically blood, from exposed populations is MS–MS capabilities to benchtop instruments, theconsidered of high interest. improvement of chemical ionization or the intro-
Effects of some types of these compounds, mainly duction of the ion trap mass spectrometers [19] haveorganochlorinated pesticides, have been already been important evolutions in benchtop GC–MS.studied. Lindane may produce kidney and liver They offer tandem MS that improves selectivity inchanges in some experimental animals and, more the analysis of mixtures and, therefore, can lowerimportantly, there have been several cases of aplastic detection limits by eliminating or minimizing chemi-anaemia with a clear association between their recent cal interferences [20–24]. Ion traps perform tandemor, less frequently, remote exposure [8]. Occupational in time MS, i.e. analyte-specific ions of a selectedoverexposure to aldrin produces excitation of the mass /charge ratio are first isolated and then frag-nervous system. Ethane, 1,1,1-trichloro-2-(o-chloro- mented. Following fragmentation, the fragment ionsphenyl)-2-( p-chlorophenyl) or o, p9-DDT and are scanned. Both MS stages occur in a single ionethane, 1,1,1-trichloro-2, 2-bis( p-chlorophenyl) or trap. Tandem MS usually results in higher analyticalp, p9-DDT, the primary isomer used extensively sensitivity than single stage MS analyses [23–25].worldwide since the late 1940s, have been banned in On the other hand, MS–MS provides informationthe U.S. and Europe for nearly 25 years on account for structural elucidation, which can be helpful in theof their toxic effect on wildlife and their potential case of unknowns. So, if an unknown compound ishuman carcinogenicity, however, they are still widely detected and the electron ionization (EI) spectrum isused in other regions of the world, primarily for not informative enough to tell the structure, the ionvector control where malaria is endemic. A few trap gives the possibility of doing MS–MS andrecent reports [9] have linked human exposure to learning more about the structure of that compound.p, p9-DDT, or its main persistent metabolite 1,1- Several groups of compounds [2–4] have beenbis( p -chlorophenyl) -2,2-dichloroethylene ( p, p9- reported to exhibit hormone-disrupting effects suchDDE), with an increased risk of breast cancer in as OCs, PCBs, alkylphenols, bisphenol A or phtha-women, possibly as a result of p, p9-DDT’s known lates. It is likely other hormone-disrupting chemicalsestrogenic properties [10,11] although these findings, will be discovered as experimental procedures areare inconsistent [12]. developed. So, there is an urgent need to establish
Perhaps one of the most pertinent issues is risk validated assays to test the activity of endocrine-assessment of the effects of long-term exposure to disrupting chemicals, as well as validated analyticaltrace levels of these chemical pollutants. The low methods to determine trace levels of these com-concentrations of these products in biological fluids pounds.led us to carefully address the analytical determi- In this paper a procedure is described for thenation and quality assurance to obtain accurate simultaneous determination of trace levels of lin-measurements of biological exposure. dane, vinclozolin, aldrin, p, p9-DDE, o, p9-DDT and
The most frequently used detection method for p, p9-DDT in human blood-serum samples. Theorganochlorinated pesticides (OCs) is gas chroma- procedure consists of a solvent extraction step fol-tography (GC) with electron capture detector (ECD) lowed by a sample clean up. Determination was[13–17]. Its application requires, on one hand, an carried by capillary GC–ECD and GC–MS–MS.adequate extraction and isolation technique, by Both chromatographic methods were developed tak-which compound enrichment, since these compounds ing into account criteria established for validation ofare present at trace levels, and on the other hand a routine quantitative analytical compounds [26–28].clean-up step, to obtain clean solutions and eliminat- The limitations and advantages of using GC–ECD or
760 (2001) 1–15 3´M. Moreno Frıas et al. / J. Chromatogr. B
GC–MS–MS techniques for quantitative and quali- minimum in order to avoid adsorptive sample losses.tative determinations in serum samples are compared Instruments and vials were cleaned with hexane andand discussed. acetone.
The procedure was applied to the simultaneousdetermination of the target compounds in blood 2.3. Extraction procedure of pesticides from theserum samples from people living in an agricultural serum
´area (Almerıa, Spain). The target pesticides studiedhere reported to have endocrine-disrupting effects Four ml aliquots of blank serum matrix were[16]. spiked and equilibrated for 3 h at room temperature
in a test tube. To the samples were sequentiallyadded 2 ml of MeOH, mixed in a rotatory mixer for
2. Experimental 1 min, and 5 ml of n-hexane:ethyl ether (1:1) v /v,agitating on a rotary mixer for 2 min and then
2.1. Chemicals and reagents centrifuging at 2500 g for 5 min. The organic phasewas collected, and the aqueous phase was extracted
Standards of the pesticides were obtained from twice more with 5 ml of n-hexane:ethyl ether (1:1,¨Riedel-de-Haen (Seelze-Hannover, Germany) always v/v). The organic phases were evaporated and
with purity higher than 99%. The internal standard concentrated to approximately 1 ml under a gentle(ISTD), heptachlor (99% of purity) was supplied by stream of nitrogen.Aldrich (St. Louis, MO, USA). Stock standard
21solutions, 200 mg ml , were prepared by exact 2.4. Sample clean-upweighting and dissolving them in n-hexane. Workingstandard solutions were prepared by appropriate Chemical clean-up: 0.5 ml of H SO was added to2 4
dilutions and stored in a refrigerator (48C). Pesticide the concentrated 1 ml sample of organic phase,quality solvents: n-hexane, MeOH, diethyl ether and mixed for 1 min and centrifuged for 5 min at 2500 g.2-propanol were supplied by Panreac (Barcelona, The organic phase was collected and the aqueousSpain). Reagent grade concentrated sulphuric acid phase was extracted twice more with 1 ml of n-was also supplied by Panreac. Organic free water hexane; the organic phases were evaporated andwas prepared by distillation and then by Milli-Q SP dried completely under a stream of nitrogen; thetreatment (Millipore Corporation, USA). Sex ster- samples were dissolved in 1 ml of n-hexane and thenoids-free serum was obtained according to the method injected into the HPLC system.described by Brotons et al. [29].
2.5. Chromatographic techniques2.2. Sampling and sample storage
Clean-up procedure using high-performance liquidSix serum samples were obtained from women chromatography with photodiode-array detector
breast cancer patients from Almeria’s province. (HPLC–DAD): the ml of the previous extract inAround 10 ml of venous blood were collected into n-hexane was injected into the HPLC–DAD and thevacutainer tubes (Venoyect, Terumo Europe N.V. fraction eluted for the first 15 min, where the OC3001, Leuven, Belgium) without preservatives. The compounds were present, was collected, dried undersamples were left to coagulate naturally for 3–7 h nitrogen stream and eluted with 1 ml of n-hexane.and then, they were centrifuged to separate the serum One ml of this extract was injected into the GC–ECDthat was transferred into glass vials capped with system and 2 ml into the GC–MS–MS instrument.teflon-faced silicone rubber septa. These vials were A Waters (Milford, MA, US) model 990 liquidstored at 2208C until analysis. chromatographic system was used, equipped with a
All instruments and vials used were made of glass; Model 600 E constant-flow pump, a Rheodyne six-sample contact to plastic materials was reduced to a port injection valve with a 1 ml sample loop, a

760 (2001) 1–154 ´M. Moreno Frıas et al. / J. Chromatogr. B
Lichrospher Si 25034 mm (5 mm particle size) experimental conditions. In addition, another EI–MScolumn from E. Merck (Darmstadt, Germany), a library was available.Model 990 UV-visible photodiode-array detector GC conditions were as follows: initial column(DAD), a printer /plotter and a microcomputer using temperature 808C (2.5 min), increased from 508C
21the Waters 991 software package. The mobile phase, min to 1408C (1 min) and finally increased from21under gradient conditions, was as follows: initially 2 58C min to 2608C (held for 3 min); initial injector
min isocratic with 100 phase A (n-hexane), 15 min temperature 908C (0.1 min) and increased from21linear gradient to 60% phase A, 40% phase B (n- 2008C min to 2808C (held 31 min); carrier gas He
21hexane:MeOH:2-propanol, (40:45:15), v /v), 20 min (99.999%) at a flow rate of 1 ml min at 1508Clinear gradient to 100% phase B and 30 min linear oven temperature; manifold, transfer-line and trapgradient to 100% phase A. An additional time of 5 temperatures were 45, 280 and 2008C, respectively;min with this composition of mobile phase was operated in the splitless mode; injection volume 2 ml.enough to return the system to the initial conditions GC–MS conditions were: solvent delay 11 min;for subsequent analysis. Samples of 1 ml were 70 eV of electron impact energy; scan rate 0.6 scans
21injected with the solvent flow-rate maintained at 1 ml s ; scanned-mass range 85–450 m /z. The Auto-21min . Photometric detection was performed in the matic Gain Control (AGC) was switched on with a
range 200–280 nm, with a spectral resolution of 1.4 target fixed at 5000 counts. Helium (99.999%) at a21nm. flow rate of 1 ml min was used as the carrier and
collision gas. The mass spectrometer was calibratedweekly. The MS–MS parameters are shown in Table 1.
2.5.1. GC–ECD analysisA gas chromatograph Hewlett-Packard (Palo Alto,
63CA, USA) model 5890 equipped with a Ni ECD, a 2.6. Assay validationsplit / splitless injector operated in the splitless mode,a fused-silica capillary HP-1 chromatographic col- All validation samples were prepared using sexumn (60 m30.25 mm id); film thickness 0.25 mm steroids-free serum [29]. Calibration standards wereand an HP 7673 autosampler. A HP 3365 Chem- prepared by adding appropriate working standardstation software was used for instrument control and solutions to the final (and dried) extract collecteddata treatment. Operating conditions were as follows: during the first 15 min. The validation of theinitial column temperature 1308C (1 min), increased methods included the following studies:
21at 108C min to 2008C (11 min); injector tempera-ture 2508C; detector temperature 3008C. Carrier gas
21 2.6.1. LinearityN at a flow-rate 0.85 ml min ; make-up gas N at2 221 Linear calibration graphs in human serum werea flow-rate 60 ml min ; operated in the splitless
constructed by least squares regression of concen-mode; purge off time 2 min; injection volume 1 ml.tration versus height or area ratio (analyte / internalstandard) of the calibration samples.
2.5.2. GC–MS analysisA Saturn 2000 ion trap mass spectrometer from
Varian Instruments (Sunnyvale, CA, USA) equipped 2.6.2. Sensitivitywith an autosampler 8200, a split / splitless pro- In GC–ECD, detection (LOD) and quantitationgrammed temperature injector SPI /1078 operated in (LOQ) limits were calculated on the values of thethe splitless mode and a DB5-MS (30 m30.25 mm blank at the retention times of the analytes (10id.), film thickness 0.25 mm chromatographic column injections). In GC–MS–MS, LOD was determinedwas employed. The ion trap mass spectrometer was as the lowest concentration giving a response ofoperated in the electron ionisation (EI) mode and the three-times the average of the baseline noise andMS–MS option was used. The computer, which LOQ as the lowest concentration of a pesticidecontrolled the system, had an EI–MS–MS library giving a response of ten-times the average of thespecially created for the target analytes in our baseline.

760 (2001) 1–15 5´M. Moreno Frıas et al. / J. Chromatogr. B
Table 1MS–MS parameters
Pesticide Activation Parent Excitation Excitationion (m /z) amplitude (V) storage level (m /z)
time (min) m /zRange
Lindane 11.0–13.5 85–230 219 57 75Vinclozolin 15.0–16.5 85–290 212 66 71ISTD 15.0–16.5 85–290 272 80 100Aldrin 16.5–17.9 85–310 263 96 90p, p9-DDE 20.5–22.0 85–380 318 88 110o, p9-DDT 20.5–22.0 85–380 235 64 80p, p9-DDT 22.0–24.5 85–290 235 65 80
2.6.3. Specificity h in an autosampler and after three freeze–thawSpecificity or the existence of potential interfer- cycles. In addition, the stability of unreconstituted
ences in the chromatograms from the biological dry extracts after thirty days of storage in a 2208Csamples was monitored by running control blank freezer was also tested. QC samples of the medium-
21samples in each calibration. The absence of any level concentration, 160 mg l , were used in thischromatographic components at the same retention study.time as target pesticides suggested that no chemicalinterferences were occurring. Using MS–MS if a 2.6.6. Recoverycoeluted interferent has the same identification ion as The extraction recovery of the compounds at three
21the analyte, the interference can be avoided using QC levels (20, 100 and 200 mg l ) was determinedselected experimental conditions for the collision- by comparing the height or area ratio of the com-induced dissociation (CID). pound signals to the internal standard in the extracted
samples with the corresponding calibration curves2.6.4. Precision prepared in blank sample extracts. The internal
The intra- and inter-day precision observed in one standard was added to both sets of samples after theanalysis were assessed using quality control (QC) extraction and clean-up procedures.samples at three concentration levels, 20, 100 and
21200 mg l in GC–ECD. The samples were all run inpentuplicate (n55) on three different days and the 3. Results and discussionrelative standard deviation (RSD) and the relativeerror (RE) were calculated for each. The intra- and 3.1. GC–ECD analysisinter-day precision was found by performing a one-way analysis of variance (ANOVA). The intra-assay The separation of the target compounds wasprecision can be interpreted as the intra-run vari- optimised by GC–ECD automatically injecting 1 ml
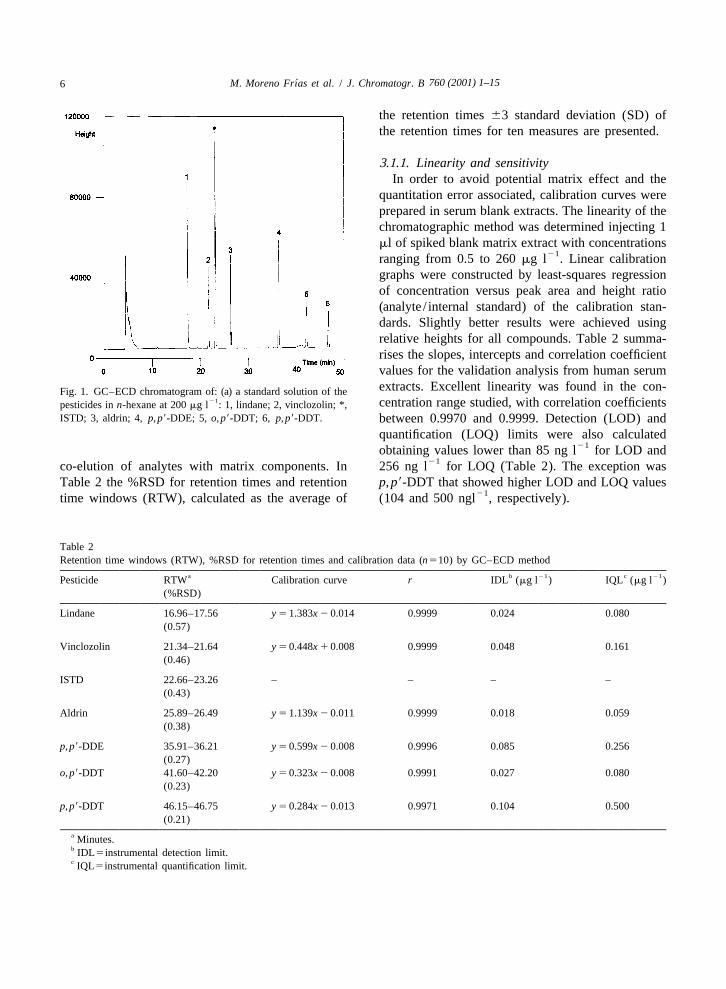
21ability and the inter-assay precision as the inter-run of a standard solution containing 200 mg l of eachvariability. Acceptable precision for biological sam- compound in n-hexane. Fig. 1a shows the GC–ECDples was considered to be an RSD of #15% at the chromatogram of a mixture containing the targetconcentration limits and 10% at higher concentration compounds and the internal standard. A good sepa-levels [30]. ration between them was reached under the final
chromatographic conditions selected, that was suit-2.6.5. Stability able for obtaining accurate calibrations. This situa-
The stability stock solutions of the target com- tion was also adequate for the analysis of realpounds, as well as the stability of human serum samples, where there is always the possibility ofextract samples was studied. The stability of serum poor resolution between the analysed analytes andextracts was evaluated at room temperature, after 24 other compounds frequently used in the area, or even
760 (2001) 1–156 ´M. Moreno Frıas et al. / J. Chromatogr. B
the retention times 63 standard deviation (SD) ofthe retention times for ten measures are presented.
3.1.1. Linearity and sensitivityIn order to avoid potential matrix effect and the
quantitation error associated, calibration curves wereprepared in serum blank extracts. The linearity of thechromatographic method was determined injecting 1ml of spiked blank matrix extract with concentrations
21ranging from 0.5 to 260 mg l . Linear calibrationgraphs were constructed by least-squares regressionof concentration versus peak area and height ratio(analyte / internal standard) of the calibration stan-dards. Slightly better results were achieved usingrelative heights for all compounds. Table 2 summa-rises the slopes, intercepts and correlation coefficientvalues for the validation analysis from human serumextracts. Excellent linearity was found in the con-Fig. 1. GC–ECD chromatogram of: (a) a standard solution of the
21 centration range studied, with correlation coefficientspesticides in n-hexane at 200 mg l : 1, lindane; 2, vinclozolin; *,ISTD; 3, aldrin; 4, p, p9-DDE; 5, o, p9-DDT; 6, p, p9-DDT. between 0.9970 and 0.9999. Detection (LOD) and
quantification (LOQ) limits were also calculated21obtaining values lower than 85 ng l for LOD and
21co-elution of analytes with matrix components. In 256 ng l for LOQ (Table 2). The exception wasTable 2 the %RSD for retention times and retention p, p9-DDT that showed higher LOD and LOQ values
21time windows (RTW), calculated as the average of (104 and 500 ngl , respectively).
Table 2Retention time windows (RTW), %RSD for retention times and calibration data (n510) by GC–ECD method
a b 21 c 21Pesticide RTW Calibration curve r IDL (mg l ) IQL (mg l )(%RSD)
Lindane 16.96–17.56 y 5 1.383x 2 0.014 0.9999 0.024 0.080(0.57)
Vinclozolin 21.34–21.64 y 5 0.448x 1 0.008 0.9999 0.048 0.161(0.46)
ISTD 22.66–23.26 – – – –(0.43)
Aldrin 25.89–26.49 y 5 1.139x 2 0.011 0.9999 0.018 0.059(0.38)
p, p9-DDE 35.91–36.21 y 5 0.599x 2 0.008 0.9996 0.085 0.256(0.27)
o, p9-DDT 41.60–42.20 y 5 0.323x 2 0.008 0.9991 0.027 0.080(0.23)
p, p9-DDT 46.15–46.75 y 5 0.284x 2 0.013 0.9971 0.104 0.500(0.21)
a Minutes.b IDL5instrumental detection limit.c IQL5instrumental quantification limit.

760 (2001) 1–15 7´M. Moreno Frıas et al. / J. Chromatogr. B
3.1.2. Specificity values indicated acceptable intra- and inter-assayThe specificity of the assay is demonstrated by the precision for the assay procedure.
absence of extraneous peaks, in the blank humanserum samples, interfering with the signals of the 3.1.4. StabilityLOQ value of the compounds. Potential interferences Stock solutions of the target compounds werewere minimised by combining the chemical clean-up found to be stable for a minimum of 12 weeks whenusing H SO with the separation power of the HPLC prepared in n-hexane and stored at 2208C prior to2 4
and the selectivity of the ECD detector. However, it and after each use. On the other hand, the stability ofis important to note that the acid clean up used is not the compounds in both reconstituted and unreconsti-a universal method for all pesticides. Dieldrin, tuted human serum extracts was also investigatedchlorothalonil or dichloran are some examples of because it is necessary to have information on thecompounds that are removed from extracts by this ability to store extracted samples over a period ofacid treatment. time allowing a greater flexibility in sample process-
ing and analysis. The stability of the analytes in the3.1.3. Precision injection solvent was studied to verify that the
The intra- and inter-day precision was assessed compounds would not degrade over the course of anwith three concentrations of QC samples. Table 3 analysis. This was accomplished by extracting sam-summarises the results and shows that the intra-assay ples, storing and running them into the chromato-precision (within-run RSD) and inter-assay precision graphic system the following day with a fresh(between run RSD) were found to be lower than standard curve. Table 4 summarises the results
215.5% for the level concentration of 20 mg l , and obtained. Reconstituted extracts were found to belower than 2.9% for the other QC levels. These stable at ambient temperature up to 24 h. The RSD
and accuracy values of a QC sample (mediumconcentration) at room temperature for 24 h were notsignificatively different compared to a 0-h sample.Table 3
Summary of within-day and between-day precision for QC The target compounds were also shown to be stableasamples using GC–ECD method after three freeze (2208C) thaw cycles with RSD and
21Pesticide Level (mg l ) Precision (%RSD) accuracy values lower than 2.6 and 13.3%, respec-a a tively.within-day between-day
The stability of the unreconstituted dry extracts inLindane 20 0.3 0.4
a 2208C freezer was also determined. The com-100 0.3 0.2pounds were found to be stable in unreconstituted200 1.0 0.8dry extracts stored at 2208C for at least thirty days
Vinclozolin 20 5.5 2.9with RSD lower than 3.3%. These results are well100 1.0 1.1within acceptable criteria [30] and indicate that the200 0.9 1.3assay is robust under conditions likely to be en-Aldrin 20 2.8 2.3countered during sample handling.100 1.4 1.5
200 0.5 0.9
3.1.5. Recoveryp, p9-DDE 20 3.0 2.3The extraction recovery of target pesticides at100 1.0 1.5
200 1.0 1.0 three QC levels was determined by comparing thepeak height ratio of the analytes to the internalo, p9-DDT 20 2.6 3.2
100 1.5 1.4 standard in samples which were spiked with the200 2.0 1.8 analyte prior to extraction with the corresponding
calibration curves. In general, the recovery of thep, p9-DDT 20 3.4 2.8100 4.1 4.8 compounds was independent of the concentration in200 3.0 2.1 human serum. As can be seen in Table 5, the
a n55. recoveries are higher than 65% and the RSD values

760 (2001) 1–158 ´M. Moreno Frıas et al. / J. Chromatogr. B
Table 421Summary of precision (%RSD) for a QC sample at 160 mg l in different conditions
Pesticide Study 1 Study 2 Study 3 Study 4%RSD %RSD %RSD
Cycle 1 Cycle 2 Cycle 3%RSD %RSD %RSD
Lindane 0.3 1.5 0.4 1.2 1.5 1.4Vinclozolin 0.4 1.3 0.4 1.0 0.1 1.2Aldrin 0.2 1.8 0.2 0.8 0.7 2.1p, p9-DDE 1.2 4.0 1.2 2.0 2.1 2.7o, p9-DDT 2.0 3.8 2.0 1.0 1.5 3.3p, p9-DDT 1.3 4.3 1.3 2.6 2.5 2.9
Study 1 corresponds to a just prepared QC sample; Study 2 corresponds to a QC sample after 24 h in the autosampler at roomtemperature; Study 3 corresponds to a QC sample after three freeze–thaw cycles; Study 4 corresponds to a QC whose unreconstituted dryextract had been stored at 2208C for 8 days. In all studies n55.
are below 7.4%. The exception was vinclozolin at chromatograms, similar samples were injected intothe lower spiking level that showed a recovery 40%. the GC–MS–MS system. This last system, however,Table 5 also shows the LOD and LOQ data calcu- allows for error-free identification of the compoundslated on the bases of the extraction of 10 serum if the optimisation of MS–MS parameters is properlyblanks at a signal-to-noise ratio of 3 and 10 respec- adjusted. Fig. 2 shows a GC–MS–MS chromatogramtively. They allowed the analysis of pesticides in of the standard compounds, containing both thehuman serum samples at trace levels with LOD target analytes and the internal standard at a con-
21 21values ranging from 4 to 22 ng l . centration of 200 mg l . All of them were properlyOn the other hand, similar studies performed in separated, under the conditions described in the
our laboratory for other pesticides [31,32], endo- experimental section, in less than 28 min. RTW ofsufan, a, b, sulphate, ether and lactone, kepone, the compounds is shown in Table 6.methoxychlor and mirex, and polychlorinated bi- However, the GC described method provides littlephenyls, congeners 21, 48, 61 and 136, showed good resolution between target analytes and PCBs. Therecoveries (70–104%) applying the same extraction detection technique of MS–MS allows the resolutionprocedure. of overlapped signals (peaks that chromatographically
coelute). For that, a MS–MS detector can apply3.2. GC–MS–MS analysis different collision induced dissociation (CID) con-
ditions that conmutates in a short period of time.In order to confirm and quantify the identity of the Each CID condition is specific for each coeluted
compounds in serum samples through the GC–ECD analyte. The change between CID experimental
Table 5Recovery percentages and (RSD%) from the blank serum matrix spiked with the pesticides with GC–ECD quantification
21 b 21 bPesticide Recovery (RSD) LOD (mg l ) LOQ (mg l )
Spiking level Spiking level Spiking level21 a 21 a 21 a(20 mgl ) (100 mgl ) (200 mgl )
Lindane 68 (0.3) 78 (0.3) 72 (1.0) 0.006 0.020Vinclozolin 40 (5.5) 78 (1.2) 80 (2.0) 0.012 0.040Aldrin 77 (2.8) 65 (1.6) 65 (1.6) 0.004 0.015p, p9-DDE 71 (4.2) 70 (3.2) 72 (3.0) 0.022 0.072o, p9-DDT 98 (2.6) 74 (1.8) 81 (2.0) 0.007 0.022p, p9-DDT 103 (3.3) 81 (7.4) 80 (3.0) 0.010 0.032
a n55.b n510.

760 (2001) 1–15 9´M. Moreno Frıas et al. / J. Chromatogr. B
conditions. After acquisition, the plotting of theexperimental data obtained separately for each pes-ticide offers a selective chromatogram for eachcompound. Quantitation and identification can beconducted for these data (area or height of the GCpeak, retention time, MS–MS spectrum).
The process of product ion MS–MS involves twoadditional steps between the formation and detectionof ions. The first step is isolation of a single parention from the other ions present and, the second oneis dissociation of the parent ion into characteristicproduct ions before mass analysis of the productions. Therefore, the ions with the highest intensitiesin the electron-impact mass spectra are first sub-mitted to isolation and then to fragmentation. In thisway the mass–mass spectra of the target compoundswere obtained. Obviously, the isolation, fragmenta-Fig. 2. GC–MS–MS chromatogram of a standard solution of the
21pesticides in n-hexane at 200 mg l : 1, lindane; 2, vinclozolin; *, tion and storage conditions of the ions obtainedISTD; 3, aldrin; 4, p, p9-DDE; 5, o, p9-DDT; 6, p, p9-DDT. (product ions) were optimized for the compounds.
For the mass spectrometer detector, AGC wasconditions must permit the acquisition of at least switched on in order to optimize sensitivity by fillingthree to five points for each analyte in the time of the trap with the target ions. To program theelution of the co-eluted peak. In practice, it is isolation of parent ions for every compound alongpossible the determination of a maximum of four the chromatographic run, the overall run time wascompounds (under our experience) that coelute, in a split into six segments for the separation of thesingle chromatographic peak, in the selected GC pesticides and the ISTD. Each segment was assigned
Table 6Retention time windows (RTW), %RSD for retention times and calibration data (n510) by GC–MS–MS method
b 21 c 21Pesticide RTW Calibration curve r IDL (mg l ) IQL (mg l )a(%RSD)
Lindane 12.88–13.48 y 5 1.520x 1 0.059 0.9970 0.5 3.0(0.81)
Vinclozolin 15.18–15.78 y 5 1.207x 2 0.007 0.9999 2.0 4.0(0.63)
ISTD 15.46216.06 – – – –(0.63)
Aldrin 16.79–17.39 y 5 0.949x 2 0.021 0.9999 0.5 1.0(0.58)
p, p9-DDE 20.66–21.26 y 5 0.841x 2 0.011 0.9999 0.5 1.0(0.47)
o, p9-DDT 20.72–21.32 y 5 0.627x 2 0.010 0.9998 0.5 1.0(0.47)
p, p9-DDT 22.26–22.86 y 5 0.481x 2 0.007 0.9998 2.0 4.0(0.43)
a Minutes.b IDL5instrumental detection limit.c IQL5instrumental quantification limit.

760 (2001) 1–1510 ´M. Moreno Frıas et al. / J. Chromatogr. B
to a m /z fragment according to the base ion obtained the pesticides, showed good linearity with correlationfrom the EI mass spectrum for each compound. The coefficients between 0.997 and 0.999 (Table 6).ions chosen were as follows: lindane (m /z 219), Detection (LOD) and quantification (LOQ) limits
21vinclozolin (m /z 212), ISTD (m /z 272), aldrin (m /z were also calculated with values lower than 2 mg l21263), p, p9-DDE (m /z 318), o,p9-DDT (m /z 235), for LOD and 4 mg l for LOQ.
p, p9-DDT (m /z 235), Fig. 3.Inside each time segment, parent ions were iso- 3.2.2. Precision
lated by ejecting from the trap those ions whose m /z The data for the within and between-day precisionlay outside a 61 units window around the chosen was assessed by analysing five replicates, at threeparent m /z value. concentrations of QC samples, as in the GC–ECD
Then, dissociation conditions were optimized for method (Table 3). The results obtained at the higher21each pesticide. In general, the parent ion isolated concentration level (200 mg l ) are summarised in
from the first ionization was selected with the aim of Table 7. The within and between-day precision wereachieving a compromise between both selectivity found to be ,12.0% for the level concentration of
21(the highest m /z ion) and sensitivity (the highest 20 mg l , and lower than 10% for the other QCintensity ion). To do this, parent ions were CID concentration levels. These measures indicated ac-fragmented with the goal of generating spectra with ceptable intra- and inter-assay precision for the assaymultiple ions of high relative intensity that afforded procedure.accurate quantification while preserving a certainproportion (10 and 20%) of the parent ions. This aim 3.2.3. Stabilitycan be achieved by appropriate selection of the Stability studies were also performed in GC–MS–non-resonant excitation amplitude and excitation MS. They showed similar results to the ones ob-storage level. tained in GC–ECD, demonstrating that for these
The excitation storage level, which is related to pesticides the stability does not depend on thethe trapping field that stabilises the parent ion, was analytical technique tested.selected as the minimum value that allowed thedissociation of the parent ion. If a higher excitation 3.2.4. Recoverystorage level was applied the ions were held in the The extraction recovery of target pesticides attrapping field more strongly allowing the application three QC levels was determined by comparing theof a higher excitation voltage, which was able to peak area and height ratio of the analytes to theproduce more product ions. Nevertheless, if the internal standard in samples which were spiked withexcitation storage level was too high, the lower the analyte prior to extraction with the correspondingweight product ions will not be trapped and will not calibration curves. Each experiment was repeatedbe observed in the spectrum. three times. The recovery and RSD data were
The MS–MS spectra obtained in the final ex- calculated at three concentration levels (20, 100 and21perimental conditions were stored in an home-made 200 mg l ) and the ones obtained at the higher level
MS–MS library. The main ions are shown in Fig. 3. using relative peak areas are reported in Table 7.Criteria for validation of the GC–ECD method were Recoveries were higher than 73% and the RSDalso used for establishing the GC–MS–MS method. values are below 10% in all cases. Table 7 shows
also the LOD and LOQ data calculated on the basis3.2.1. Linearity and sensitivity of the extraction of 10 serum blanks at a signal-to-
The linearity of the chromatographic method was noise ratio of 3 and 10 respectively. They alloweddetermined by injecting 2 ml of spiked blank matrix the analysis of pesticides in human serum samples atextract with concentrations ranging from 0.1 to 260 trace levels.
21mg l . Calibration graphs and the different parame- On the other hand, the proposed method showedters associated with them were studied using both to be effective in the recovery of other pesticides,areas and heights relative to the internal standard. endosufan, a, b, sulphate, ether and lactone, kepone,Better results were achieved using relative areas. All methoxychlor and mirex, and polychlorinated bi-

760 (2001) 1–15 11´M. Moreno Frıas et al. / J. Chromatogr. B
Fig. 3. EI–MS–MS spectra and structural formulas of: (a) lindane; (b) vinclozolin; (c) aldrin; (d) p, p9-DDE; (e) o, p9-DDT; (f) p, p9-DDT;(g) ISTD.

760 (2001) 1–1512 ´M. Moreno Frıas et al. / J. Chromatogr. B
Table 7Summary of precision (%RSD), recovery percentages, RSD%, LOD and LOQ by the GC–MS–MS method
a 21 b 21 bPesticide %RSD* Recovery LOD (mg l ) LOQ (mg l )a aintra inter
Lindane 3.8 4.3 75 (6.8) 0.1 0.3Vinclozolin 2.9 7.3 76 (8.5) 0.5 1.5ISTD – – – – –Aldrin 4.2 7.9 75 (5.1) 0.1 0.3p, p9-DDE 3.2 6.0 77 (6.6) 0.1 0.3o, p9-DDT 4.5 7.3 76 (10.0) 0.1 0.3p, p9-DDT 3.6 6.8 73 (7.9) 0.5 1.3
21* Data obtained with a QC sample of 200 mg l .a n55.b n510.
phenyls, congeners 21, 48, 61 and 136, with values the GC–ECD method, which complicated a reliableranging from 70–114% [31,32]. analysis of this compound. This problem was avoided
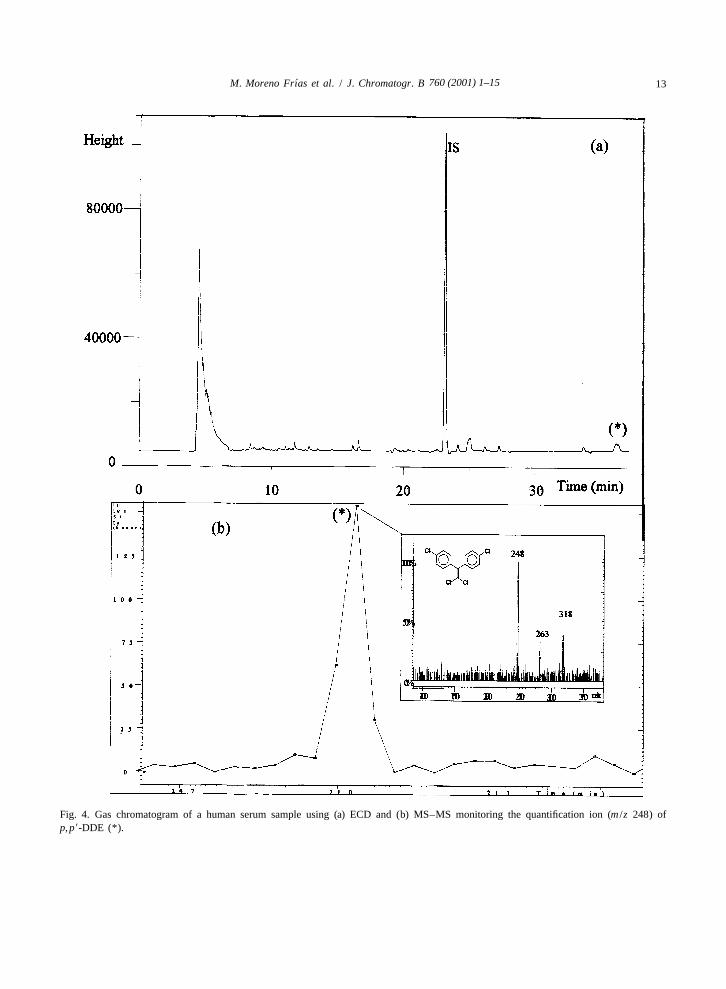
In short, a comparison of the GC–ECD and GC– when using GC–MS–MS analysis. Figs. 4a and bMS–MS methods shows a good linearity of the show, respectively, the chromatograms obtained forpesticides in the studied concentration ranges, with the same extract in GC–ECD and GC–MS–MS.r.0.99. The GC–ECD method showed better preci- In addition, p, p9-DDT was detected in one serumsion values than the GC–MS–MS method. sample by GC–ECD, but with a very low signal that
was easily confused with the background signal (Fig.5a). In order to confirm the presence of the cited
4. Application of the method to the analysis of peak the sample was analysed by the GC–MS–MShuman serum samples method, which allowed its identification and quantifi-
21cation at a concentration of 15.5 mg l (Fig. 5b).To assess the applicability of the methodology, six Therefore, it is evident the great advantage of
human serum samples from patients affected with GC–MS–MS over GC–ECD in the elimination ofbreast cancer were analysed. Analysis of laboratory matrix interferences in the analysis of complexblank serum samples, laboratory spiked serum blank biological samples.and laboratory spiked matrix samples were per-formed together with the set of samples, in additionto calibration graphs. Laboratory blanks rejected anycontamination of interference due to reagents during 5. Conclusionsprocessing samples. Analysis of samples was carriedout if recoveries were between 70 and 80% in both Validated GC–ECD and GC–MS–MS assays havelaboratory spiked blank and laboratory spiked matrix been developed to determine trace levels of endo-samples. crine-disrupting compounds in human serum sam-
The presence of the pesticides in the extracts was ples. Both methods offer good linearity and sensitivityquantified and confirmed taking into account that and meet all method validation criteria. GC–ECDthose compounds were monitored in two detectors, method shows better precision and accurate and, onECD and tandem MS. No target compounds were the contrary, the GC–MS–MS method presents afound in the chromatograms corresponding to the higher selectivity.laboratory blanks processed. The tandem capabilities of the ion trap allow the
An interfering peak was revealed near the re- positive confirmation of the nature of each peak,tention time of p, p9-DDE in two serum samples by being possible, on one hand, the isolation of the
760 (2001) 1–15 13´M. Moreno Frıas et al. / J. Chromatogr. B
Fig. 4. Gas chromatogram of a human serum sample using (a) ECD and (b) MS–MS monitoring the quantification ion (m /z 248) ofp, p9-DDE (*).

760 (2001) 1–1514 ´M. Moreno Frıas et al. / J. Chromatogr. B
Fig. 5. Gas chromatogram of a human serum sample using (a) ECD and (b) MS–MS monitoring the quantification ion (m /z 165) ofp, p9-DDT (**).
target signal from the complex matrix permitting Acknowledgementsreproducible quantification and, on the other hand,the elimination of matrix interferences by monitoring The authors are grateful to FIS (Research Projectof secondary fragmentation products avoiding false No. 95-1959) for the provision of human serumpositive results. samples for this work.

760 (2001) 1–15 15´M. Moreno Frıas et al. / J. Chromatogr. B
[18] A. Balinova, J. Chromatogr. A 754 (1996) 125.References[19] R.E. March, F.J. Tood (Eds.), Practical Aspects On Ion Trap
Mass Spectrometry, Vols. I–III, CRC Press, Baton Roca, FL,[1] T. Colborn, G. Clement, Advances in Modern Environmental 1995.
Toxicology, Vol. XXI, Princeton, NJ, (1992) p. 401. [20] F.W. McLafferty, The Tandem Mass Spectrometry, Wiley,[2] T. Colborn, F. Vom Saal, A.M. Soto, Environ. Health New York, 1983.
Perspect. 101 (1993) 378. [21] K.L. Busch, G.L. Glish, S.A. Mcluckey, Mass Spectrometry;[3] A.M. Soto, H. Justicia, K. Wrayand, C. Sonneenschein, Techniques and Applications of Tandem Mass Spectrometry,
Environ. Health Perspect. 92 (1991) 67. VCH Publishers, New York, 1988.[4] A.M. Soto, K. Chung, C. Sonneenschein, Environ. Health [22] M.-R. Lee, J. See, W.-S. Hsiang, C.-M. Chen, J. Chromatogr.
Perspect. 102 (1994) 380. A 775 (1997) 267.[5] N.R. Adams, Proc. Soc. Exp. Biol. Med. 208 (1995) 87. [23] M.C. Pablos-Espada, F.J. Arrebola, A. Garrido Frenich, J. L
´[6] A.M. Soto, C. Sonnenschein, K. Chung, M.F. Fernandez, N. ´Martınez Vidal, Int. J. Environ. Anal. Chem. 75 (1999) 165.Olea, F. Olea, Environ. Health Perspect. 103 (Suppl. 7) ´[24] J.L. Martınez Vidal, M.C. Pablos-Espada, A. Garrido Fre-(1995) 113. nich, J. Arrebola, J. Chromatogr. A 1 (2000) 867.
[7] J.L. Radomski, W.B. Diechmann, A.A. Rey, T. Merkin, [25] J.V. Johnson, R.V. Tost, Anal. Chem. 57 (1985) 758A.Toxicol. Appl. Pharmacol. 20 (1971) 175. [26] R.L.M. Dobson, D.M. Neal, B.R. DeMark, S.R. Ward, Anal.
[8] T. H Milby, A.J. Samuels, F. Ontobioni, J. Occup. Med. 10 Chem. 62 (1990) 1819.(1968) 584. [27] V.P. Shah, K.K. Midha, S. Dighe, I.J. McGilveray, J.P.
[9] F.J. Falck, M.S. Wolff, J. Goldbold, P. Deckers, Arch. Skelly, A. Jacobi, T. Layloff, C.T. Viswanathan, C.E. Cook,Environ. Health 47 (1992) 143. R.D. McDowall, K.A. Pittman, S. Spector, Pharm. Res. 9
[10] W.H. Bulger, D. Kupfer, Am. J. Ind. Med. 4 (1983) 163. (1992) 588.[11] A. Schecter, P. Toniolo, L.C. Dai, L.T.B. Thuy, M.S. Wolff, [28] C.K. Van Pelt, P. Haggarty, J.T. Brenna, Anal. Chem. 70
Environ. Contamin. Toxicol. 33 (1997) 453. (1998) 4369.[12] N. Krrieger, M.S. Wolff, R. Hiatt, M. Rivera, J.Vogelman, N. [29] J.A. Brotons, M.F. Olea-Serrano, M. Villalobos, V. Pedraza,
Orentreich, J. Nat. Cancer Inst. 86 (1994) 589. N. Olea, Environ. Health Perspect. 103 (1995) 608.[13] V.W. Burse, S.L. Head, M.P. Korver, P. McClure, J.F. [30] L. Huber, LC?GC Int. 11 (1998) 96.
Donahue, L.L. Needham, J. Anal. Toxicol. 14 (1990) 137. ´ ´[31] J.L. Martınez Vidal, M. Moreno Frıas, A. Garrido Frenich, F.[14] M.G. Rosell, J. Obiols, M.J. Berenguer, X. Guardino, F. Olea-Serrano, N. Olea, Rapid Commun. Mass Spectrom. 14
´Lopez, J. Brosa, J. Chromatogr. A 655 (1993) 151. (2000) 939.[15] K.A. Bucholski, J. Begerow, G. Winneke, L. Dunemann, J. ´ ´[32] A. Garrido Frenich, J.L. Martınez Vidal, M. Moreno Frıas, F.
Chromatogr. A 754 (1996) 479. Olea-Serrano, N. Olea, J. Mass. Spectrom. 35 (2000) 967.[16] A. Rivas, N. Olea, F. Olea-Serrano, Trends Anal. Chem. 16
(1997) 613.[17] P. Voogt, P. Haglund, L.B. Reutergardh, C. Wit, F. Waern,
Anal. Chem. 66 (1994) 305.