Fatty acid composition of soybean/sunflower mix oil, fish oil
Upload
independentCategory
view
1download
0
ER
DC
TR
-02-
6
Assessment of DDT Bioavailability in the Little Sunflower River Sediment and Agricultural Soil Roy Wade, Guilherme R. Lotufo, Jeffrey A. Steevens, Jerre G. Houston, Herbert L. Fredrickson, Edward J. Perkins, Agnes B. Morrow, Charles A. Weiss, John S. Furey, Deborah Felt, Maurice Duke, and Jeffery W. Talley
September 2002
En
gin
ee
r R
es
ea
rch
an
d
De
ve
lop
me
nt
Ce
nte
r
Approved for public release; distribution is unlimited.

PRINTED ON RECYCLED PAPER
The contents of this report are not to be used for advertising, pub-lication, or promotional purposes. Citation of trade names does not constitute an official endorsement or approval of the use of such commercial products. The findings of this report are not to be construed as an official Department of the Army position, unless so designated by other authorized documents.

ERDC TR-02-6 September 2002
Assessment of DDT Bioavailability in the Little Sunflower River Sediment and Agricultural Soil
by Roy Wade, Guilherme R. Lotufo, Jeffrey A. Steevens, Jerre G. Houston, Herbert L. Fredrickson, Edward J. Perkins, Agnes B. Morrow
Environmental Laboratory U.S. Army Engineer Research and Development Center 3909 Halls Ferry Road Vicksburg, MS 39180-6199 Charles A. Weiss
Geotechnical and Structures Laboratory U.S. Army Engineer Research and Development Center 3909 Halls Ferry Road Vicksburg, MS 39180-6199 John S. Furey
Dyntel, Inc. Vicksburg, MS 39180-6199 Deborah Felt
Applied Research Associates Vicksburg, MS 39180-6199 Maurice Duke
Analytical Services, Inc. Vicksburg, MS 39180-6199 Jeffrey W. Talley
Notre Dame University Notre Dame, IN 46556 Final report Approved for public release; distribution is unlimited
Prepared for U.S. Army Engineer District, Vicksburg Vicksburg, MS 39180

iii
Contents
Preface .....................................................................................................................ix
1—Introduction ........................................................................................................1
Purpose...............................................................................................................1 Background ........................................................................................................1 Sample Collection, Characterization and Experiments ....................................2 Results and Data Interpretation .........................................................................2
Chemical analyses.......................................................................................2 Physicochemical analyses ...........................................................................3 Microbial biomarker analyses.....................................................................4 Bioaccumulation and toxicity testing .........................................................4
Conclusions and Recommendations .................................................................5
2—Description of Study...........................................................................................6
Site Description .................................................................................................6 Background .................................................................................................6 Statement of problem..................................................................................7
Collection of Sediment Samples .......................................................................8 Objective ............................................................................................................9
3—Literature Review .............................................................................................11
Background ......................................................................................................11 Introduction......................................................................................................11 Bioaccumulation ..............................................................................................13 Toxicological Effects .......................................................................................13
Acute toxicity ............................................................................................14 Chronic toxicity.........................................................................................15
Ecological Effects ............................................................................................16 Effects on birds .........................................................................................16 Effects on aquatic species .........................................................................16 Effects on other animals............................................................................17
Environmental Fate..........................................................................................17 DDT breakdown in soil and groundwater ................................................17 DDT breakdown in surface water.............................................................18 DDT breakdown in vegetation..................................................................18

iv
4—Sediment Characterization ...............................................................................20
Introduction......................................................................................................20 Objective ..........................................................................................................20 Methods............................................................................................................20
Cation exchange capacity (CEC)..............................................................20 DDT extraction..........................................................................................21
Chemical Analysis Results ..............................................................................21 Sample distribution ...................................................................................22 Sediment compositing method .................................................................23
5—Thermal Desorption Analysis ..........................................................................24
Introduction......................................................................................................24 Objective ..........................................................................................................24 Experimental Approach...................................................................................24 Materials and Methods ....................................................................................25 Results and Discussion....................................................................................30 Conclusions......................................................................................................34
6—X-Ray Diffraction Analysis..............................................................................35
Introduction......................................................................................................35 Objectives ........................................................................................................35 Experimental Approach...................................................................................35 Results..............................................................................................................36 Conclusion .......................................................................................................37
7—Phospholipid Fatty Acid and Deoxyribonucleic Acid Analyses .....................38
Introduction......................................................................................................38 Objective ..........................................................................................................39 Experimental Approach...................................................................................39 Materials and Methods ....................................................................................39
Microbial community biomass and community composition ..................39 Contaminant degradative potential...........................................................39
Results and Discussion....................................................................................40 Microbial community biomass and community composition ..................40 Contaminant degradative potential...........................................................42
Conclusions......................................................................................................43
8—Sediment Toxicity Bioassay.............................................................................44
Introduction......................................................................................................44 Objective ..........................................................................................................44 Experimental Approach...................................................................................44 Materials and Methods ....................................................................................45
Test sediment collection ...........................................................................45 Control sediment collection ......................................................................45 Test and control water...............................................................................46 Test organisms ..........................................................................................46 Bioaccumulation test.................................................................................46 Toxicity test ...............................................................................................47 Reference toxicant test ..............................................................................48

v
Statistical analysis .....................................................................................48 Results and Discussion....................................................................................48
Chemical analyses.....................................................................................48 Sediment toxicity.......................................................................................49 Bioaccumulation .......................................................................................55 Expected biological effects .......................................................................57 Reference toxicant test ..............................................................................58
Conclusions......................................................................................................60
9—Sediment Desorption Kinetics Analysis ..........................................................61
Introduction......................................................................................................61 Objective ..........................................................................................................61 Experimental Approach...................................................................................61 Materials and Methods ....................................................................................62
Chemical analysis procedure ....................................................................62 Density separation.....................................................................................62 Initial Tenax experiments .........................................................................64
Results and Discussion....................................................................................68 Qualitative results .....................................................................................68 Quantitative results ...................................................................................68
Conclusions and Recommendations ...............................................................72
10—Summary of Results .......................................................................................73
References ..............................................................................................................75
SF 298
List of Figures
Figure 1. Mississippi River basin.......................................................................7
Figure 2. Core sample locations .........................................................................9
Figure 3. DDT and breakdown products structure ..........................................12
Figure 4. Individual core results.......................................................................22
Figure 5. Schematic of the TPD-MS with a direct insertion probe .................25
Figure 6. Schematic of direct insertion probe tip with sample vial.................26
Figure 7. NIST library mass spectrum .............................................................27
Figure 8. TPD-MS response for PAH mass 228 homologh for PAH spiked sand........................................................................................28
Figure 9. TPD run of 100 ng of DDT in glass vial at selected ion mass.........30

vi
Figure 10. Spectrum of TPH run of 100 ng of DDT in glass vial at selected ion mass...............................................................................30
Figure 11. TPD run of 20 ppm of DDT, DDE, and DDD on sand at selected ion mass...............................................................................31
Figure 12. Spectrum of TPH run of 20 ppm of DDT, DDE, and DDD on sand at selected ion mass .............................................................31
Figure 13. TPD run of 20 ppm of DDT, DDE, and DDD on kaolin at selected ion mass...............................................................................32
Figure 14. Spectrum of TPH run of 20 ppm of DDT, DDE, and DDD on kaolin at selected ion mass...........................................................32
Figure 15. TPD run of DDT, DDE, and DDD on agricultural sample at selected ion mass...............................................................................33
Figure 16. Spectrum of TPD run of DDT, DDE, and DDD on agricultural sample at selected ion mass ..........................................33
Figure 17. TPD run of DDT, DDE, and DDD on sediment sample at selected ion mass...............................................................................34
Figure 18. Spectrum of TPD run of DDT, DDE, and DDD on sediment sample at selected ion mass ..............................................................34
Figure 19. X-Ray diffraction results...................................................................36
Figure 20. XRD overlay plot ..............................................................................37
Figure 21. PFLAME comparison of Little Sunflower River and Harbor Point sediments .................................................................................42
Figure 22. Suspended sediment..........................................................................63
Figure 23. Centrifuged sediment ........................................................................64
Figure 24. Suspended sediment on a rotator ......................................................65
Figure 25. Floating Tenax...................................................................................66
Figure 26. Little Sunflower River sediment contaminant adsorption to Tenax.................................................................................................68
Figure 27. Model fit to DDD adsorption data ....................................................70
Figure 28. Model fit to DDE adsorption data ....................................................70
Figure 29. Model fit to DDT adsorption data ....................................................71

vii
List of Tables
Table 1. Description of Collected Sample Locations .......................................8
Table 2. Little Sunflower River Sediment Chemical Analysis ......................21
Table 3. Sediment Utilization For Experimental Setups ................................23
Table 4. Biomass Of Microorganisms In Little Sunflower River Sediment............................................................................................40
Table 5. PLFAME Profiles of Little Sunflower River Sediment Microbial Community Composition.................................................41
Table 6. Brown's Lake Sediment Physical and Chemical Analysis ...............45
Table 7. Chemical Analysis of Dechlorinated Water .....................................46
Table 8. Little Sunflower Composite Sediment Concentrations (µg/kg dry weight).............................................................................48
Table 9. Tissue Concentrations of DDT, DDD, DDE and ∑DDT in L. variegatus......................................................................................49
Table 10. Percent Lipids in L. variegatus.........................................................49
Table 11. Percent Survival and Length Of H. azteca Following 10-Day Toxicity Experiment.............................................................50
Table 12. Statistical Analysis (Student’s t-test) of H. azteca Survival Data ...................................................................................................50
Table 13. Statistical Analysis (Student’s t-test) of H. azteca Length Data ...................................................................................................50
Table 14. 28-day Bioaccumulation Test Water Quality Results (L. variegatus) ...................................................................................51
Table 15. 10-day Toxicity Test Water Quality Results (H. azteca) .................51
Table 16. 28-day Bioaccumulation Test Daily DO and Temperature of Little Sunflower River and Brown’s Lake Sediments......................52
Table 17. 10-day Toxicity Test Daily DO and Temperature of Little Sunflower River and Brown’s Lake Sediments ...............................54
Table 18. Little Sunflower River Sediment and Mean Tissue Concentrations of DDT, DDD, DDE, and ∑DDT and BSAF for L. variegatus ................................................................................56
Table 19. BSAF Values for DDT and DDE for Aquatic Invertebrates ............56

viii
Table 20. LR50 Values for ∑DDT In Benthic Invertebrates Derived from Sediment Exposures .................................................................58
Table 21. LR50 Values for DDT, DDD, And DDE in Benthic Invertebrates Derived from Water Exposures (Lotufo et al. 2000a)................................................................................................58
Table 22. Water Quality Data - Reference Toxicant Results Using L. variegatus......................................................................................58
Table 23. Little Sunflower River 96-hour Cadmium Reference Test Result Using L. variegatus ...............................................................59
Table 24. Water Quality Data - Reference Toxicant Test Results Using H. azteca............................................................................................59
Table 25. Little Sunflower River 96-hour Cadmium Reference Test Result Using H. azteca......................................................................60
Table 26. Tenax Analytical Results For Little Sunflower River Sediment and Agricultural Soil ........................................................67
Table 27. Sediment Model Fit Parameters........................................................70
List of Equations
Equation 1. BSAF equation ..................................................................................55
Equation 2. Contaminant remaining concentration .............................................69
Equation 3. Contaminant desorption equation.....................................................69
Equation 4. Tenax absorption equation................................................................69
Equation 5. Tenax adsorption equation................................................................69

ix
Preface
The work reported herein describes testing and analysis of dredged material from the Little Sunflower River for evaluating the suitability for disposal in an upland confined disposal facility. This work was conducted by the U.S. Army Engineer Research and Development Center (ERDC), Vicksburg, MS, in cooperation with the U.S. Army Engineer District (USAED), Vicksburg. The Project Order number was W807PM10526064. The Project Manager for USAED, Vicksburg was Mr. Dave R. Johnson. Prior to May 2001, Principal Investigators (PIs) for ERDC were Dr. Jeffrey Talley and Mr. Roy Wade, Environmental Laboratory (EL). Mr. Wade became sole PI after May 2001.
This report was written by Mr. Roy Wade of the Environmental Engineering Branch (EEB), Environmental Processes and Effects Division (EPED), EL; Drs. Guilherme R. Lotufo, Jeffrey A. Steevens, and Ms. Jerre G. Houston of the Environmental Risk Assessment Branch, EPED, EL; Drs. Herbert L. Fredrickson and Edward J. Perkins of the Environmental Processes Branch, EPED, EL; Ms. Agnes B. Morrow of the Environmental Chemistry Branch (ECB), EPED; Mr. Charles A. Weiss of the Concrete and Material Branch, Geotechnical and Structures Laboratory (GSL); Mr. John S. Furey of Dyntel Inc.; and Ms. Deborah Felt of Applied Research Associates; Mr. Maurice Duke of Analytical Services Inc., and Dr. Jeffery W. Talley of Notre Dame University.
The bench-scale studies were conducted between April 2001 and August 2001 at the ERDC, EL. Analytical support was provided by Mses. Agnes Morrow and Allyson Harrison, and Messrs. Richard Karn and Robert Jones of ECB, EPED, EL.
This study was conducted under the direct supervision of Mr. Daniel E. Averett, Chief, EEB, and under the general supervision of Dr. Richard E. Price, Chief, EPED, and Dr. Edward Theriot, Director, EL.
At the time of publication of the report, Director of ERDC was Dr. James R. Houston, and Commander was COL John W. Morris III, EN.
This report should be cited as follows:
Wade, R., Lotufo, G. R., Steevens, J. A., Houston, J. G., Duke, B. M., Furey, J. S., Fredrickson, H. L., Perkins, E. J., Talley, J. W., Weiss, C. A., Felt, D., and Morrow, A. B. (2001). “Assessment of DDT

x
Bioavailability in Little Sunflower River Sediment and Agricultural Soil,” ERDC TR-02-6, U.S. Army Engineer Research and Development Center, Vicksburg, MS.
The contents of this report are not to be used for advertising, publication, or promotional purposes. Citation of trade names does not constitute an official endorsement or approval of the use of such commercial products.

Chapter 1 Introduction 1
1 Introduction
Purpose
The purpose of this report is to document testing and analysis of upland disposal of dredged material potentially impacted with dichlorodiphenyl–trichloroethane (DDT) from the Little Sunflower River, Mississippi. Bench-scale efforts were directed towards the investigation of the availability, toxicity, sequestration, and stabilization of DDT in the Little Sunflower River sediments. This entailed modeling and experiments designed to determine the phase partitioning of DDT and its release to the aqueous phase. This work emphasized the study of aged contaminant mixtures in sediment cores for which the sequestration of DDT often renders such unavailable. Reporter gene probes for specific catabolic genes and defined microbial community approaches allowed structured studies to assess DDT degradation, desorption, and stabilization. This project was performed at the U.S. Army Engineer Research and Development Center, Waterways Experiment Station (ERDC-WES), Vicksburg, MS.
Background
The Little Sunflower River is scheduled to receive maintenance dredging to alleviate flooding. However, like many rivers that meander through historical agricultural farmland, it is impacted with DDT, 1,1-dichloro-2,2-bis(p-dichlorodiphenyl) ethylene (DDE) and 1,1-dichloro-2,2-bis(p-chlorophenyl) ethane (DDD). Organochlorine pesticides, such as DDT, were widely used from the mid-1940s to the 1970’s. It has been estimated that the use of DDT plus DDD reached peak levels in the mid-1960’s, with more than 21 lb of active ingredient being applied per square mile of agricultural lands in Mississippi (Nowell et al. 1999). At least 30 years after their use was prohibited, their presence is still observed in sediment and biota.
Levels of DDT have been declining since the late 1960s, yet it continues to enter rivers and streams from atmospheric deposition and the erosion of agricultural soils (Nowell, Capel, and Dileanis 1999). Since these pesticides generally have moderate-to-low water solubility and moderate-to-high environmental persistence, they have the strong potential for accumulation in sediment and aquatic biota. Scheduled maintenance dredging is expected to remove the impacted sediments from the Little Sunflower River and place them

2 Chapter 1 Introduction
in contained upland disposal areas. However, concerns have been raised that such dredging operations could result in sediment resuspension, possibly increasing the transport/availability of DDT, DDE, and DDD in the Little Sunflower River. This work addresses this question by applying multiple investigative techniques to assess the availability, potential treatability, and toxicity of DDT, DDE, and DDD in Little Sunflower River sediment.
Sample Collection, Characterization, and Experiments
Core sediment samples were collected from the Little Sunflower River during March 6-7, 2001. These samples were collected from known “hot spots.” The cores were divided into top, middle, and bottom samples per cross section. Like samples (i.e., tops) were homogenized to provide representative composite samples. Homogenized samples were split into sub-samples for chemical, physicochemical, microbial, and toxicological characterization. Soil samples from adjacent agricultural fields were also collected and analyzed. Samples underwent Soxhlet extraction, followed by gas chromatograph/mass spectrometry (GS/MS) analysis, for the detection of DDT, DDE, and DDD. X-ray diffraction (XRD) techniques were also utilized to properly determine the mineral constituents of the sediment.
Physicochemical analyses included room temperature aqueous desorption studies using Tenax beads, and programmed thermal desorption mass spectrometry (TPD-MS) methods (Talley et al. 2001a). These physicochemical tests were conducted to help assess the physical availability or release of DDT, DDE, and DDD from the sediment. Microbial ecology testing applied polar lipid fatty acid (PLFA) and deoxyribonucleic acid (DNA) analyses to evaluate the potential for enhanced biotreatment and natural attenuation. Bioaccumulation and toxicity testing studied the 10-day survivability of Hyalella azteca (H. azteca) and the 28-day bioaccumulation with Lumbriculus variegatus (L. variegatus), when exposed to the impacted sediment. Overall, the results were used to synthesize and correlate data to assess the availability, potential treatability, and toxicity of DDT, DDE, and DDD in Little Sunflower River sediment.
Results and Data Interpretation
Chemical analyses
Chemical analysis of the sediment indicated that when DDT was present, it was limited to the top layer of the sediment and only in relatively small concentrations (< 24 ug/kg). Since the upper layer of sediment is the “youngest” aged-soil/sediment, it is logical that DDT would be more prevalent on the surface of the sediment. As we move deeper into the sediment, the DDT-impacted zone quickly transitions into DDE and then eventually to DDD. DDE is clearly the most prominent organochlorine in the sediment, present at levels up to 237 ug/kg. The clear delineation trend of DDT to DDE to DDD seems to suggest the

Chapter 1 Introduction 3
presence of natural attenuation, since it has been shown that DDT can undergo both anaerobic biotransformation and abiotic transformation (Sayles et al. 1997, Juhasz and Naidu 1999, Chu 1999).
Chemical analysis of the agricultural soil indicated that DDT, DDE, and DDD were present at concentrations of 988, 797, and 253 ug/kg, respectively. These organochlorine pesticides were at higher concentrations in the agricultural soil than the sediment. This would suggest that runoff from the agricultural soil could be a potential source of DDT contamination in the Little Sunflower River. This is logical since DDT usage was banned in the United States over 30 years ago.
Physicochemical analyses
The physicochemical analyses incorporated both TPD-MS and Tenax bead desorption studies. A review of the physicochemical properties of DDT, DDE, and DDD indicates high partition coeffients (Kows) and low solubility for each compound. This suggests that these compounds are hydrophobic and prefer to tightly bind to the sediments. If the compounds are tightly bound to the sediment, then the mass transfer rate of diffusion from the solid-bound phase to the aqueous phase could be low. Generally, these conditions would reflect lower availability, which may result in low bioavailability and toxicity. At the beginning of the analyses, it was expected that DDT, DDE, and DDD would behave similarly.
TPD-MS was conducted on various milligram-size sediment samples. In these tests, small samples where progressively heated at 10° C/min until they reached approximately 400 °C. The off-gases were collected and analyzed in an MS. The expected result is usually a thermogram that shows the release of organic compounds from the sample. Generally, if higher temperatures are required to release the compounds, this may suggest tighter binding and lower physical availability of that compound.
DDT was not detected during the TPD-MS test duration. One explanation is the very low levels of DDT present in the samples. If a compound is present at low levels, it is sometimes difficult for the MS to clearly distinguish it from the background spectrum of other compounds present at much higher levels in the sediment. Chemical analyses indicated low levels of DDT present in the sediment.
Tenax bead desorption studies were conducted on the same samples. As expected, DDT did not readily desorb. This suggests that DDT was not available from the sediment and therefore may be less biotreatable and toxic. However, DDD and DDE did appreciatively desorb throughout the duration of the studies. This was unexpected since DDD and DDE have physicochemical properties very similar to DDT. These results suggest that DDD and DDE are available for desorption from the sediment. This indicates that these compounds can be mobile, which could correlate with higher potential treatment, toxicity, and bioaccumulation in biota.

4 Chapter 1 Introduction
An XRD of bulk samples was performed to determine the mineral constituents present. The most common constituent in the Little Sunflower River sediment sample was quartz. The bulk pattern indicated a significant fraction of the sample was comprised of phyllosilicates, including a smectite group phase, as well as illite or mica, and kaolinite. There also appears to be a small amount of cristobalite and sodium-feldspar present. Further analyses of the samples indicated that the clay fraction has a large component of expandable clays present. Hydrophobic organic compounds (HOCs), like DDT, can have a higher affinity for binding on clays than on other mineral surfaces. This is especially true when organic matter is attached to the clay surfaces (Talley et al. 2001c).
Microbial biomarker analyses
The microbial biomarker testing served as an in situ analysis to determine if DDT-degrading microorganisms were present in the sediments. In this approach, the lipid fractions of the bacteria present in the composite core samples are extracted and analyzed for both qualitative and quantitative interpretation (Ringelberg et al. 2001). The results of the PLFA analysis revealed a healthy, but not overly vibrant microbial community (106 bacterial cells per gram weight of sediment). However, enough total lipid fractions were present to apply a multiplex polymerase chain reaction approach designed to determine the number of biodegradative genes present in a single sample.
Unfortunately, the DNA analyses did not indicate the presence or significant gene copy of DDT-degrading microorganisms. It is important to realize that this does not mean, with certainty, that DDT degraders are not present, but only that they were not detected based on this specific sample. Sulfate-reducing bacteria were detected in some cases, but at low levels, suggesting the possibility of anaerobic mediated abiotic processes. Although it is difficult to make definitive conclusions from these results, it suggests that natural attenuation processes may be primarily the result of abiotic processes and not biotic processes. Further work is needed to clarify this speculation.
Bioaccumulation and toxicity testing
Bioaccumulation (28-day) and toxicity (10-day) testing were conducted using Little Sunflower River sediment and Brown’s Lake (control) sediment. Test methodology followed recommendations from the guidance document “Methods for Measuring the Toxicity and Bioaccumulation of Sediment-associated Contaminants with Freshwater Invertebrates” (EPA/600/R-99/064). There was no significant difference in toxicity (survival) between the control sediment and the Little Sunflower River sediment. This indicates that the levels of DDT, DDE, and DDD present in the Little Sunflower River sediment are not sufficient to induce mortality in the test organism (H. azteca).
Tissue samples collected from the test organism (L. variegatus) at the termination of the bioaccumulation test revealed significant levels of DDE and DDD. DDT was present, but at much lower levels. Biota-sediment accumulation factors (BSAF) were calculated by normalizing the mean sediment concentrations to organic carbon content and the mean tissue concentrations to lipid content.

Chapter 1 Introduction 5
BSAF values for DDE and DDD were approximately four to ten times higher than the BSAF value for DDT. This suggests that the bioavailability of DDE and DDD far exceed the bioavailability of DDT. Yet, despite the high levels of DDE and DDD, the body residues measured in L. variegatus in the 28-day exposure to Little Sunflower River sediment were lower than the critical body residues previously determined for benthic invertebrates.
Conclusions and Recommendations
The combined investigative approaches used in these studies indicate that the present level of DDT, DDE, and DDD may not be toxic to benthic invertebrates. However, this work has confirmed that DDE and DDD are readily available in the river–sediment system and bioaccumulate in the biota at measurable levels. Dredging or removal of those impacted sediments should eventually reduce the overall DDT, DDE, and DDD levels in the Little Sunflower River. Unfortunately, this work does not provide adequate information to address the question of what short-term effects sediment resuspension (due to dredging) will have. More work is needed to determine the actual fate and transport of the DDE and DDD.
One important consideration should be the effects of dissolved organic matter (DOM). DOM is important for HOCs because they consist of humic material, which can increase the solubility of HOCs by 20-40 percent. For example, it has been shown that the solubility of DDT is increased by 20 to 40 times in the presence of 500 mg/l of humic matter (Carter and Suffet 1982). This effect of DOM on the apparent solubility of HOCs can be estimated (Kile and Chiou 1989). This information could provide key insight as to what the expected short-term concentrations of DDT, DDE, and DDD might be during and immediately following dredging operations. It is recommended that a DOM fate transport study be conducted to model the effective aqueous solubility and concentration of DDT, DDE, and DDD in the Little Sunflower River system.
If the impacted sediment is dredged, it may be placed on the adjacent agricultural farmland. It is recommended that a limited treatability and toxicity study be conducted to determine the optimal conditions for abiotic and possibly biotic upland treatment of the impacted sediment. Special consideration should be placed on containment and minimization of continued transport of DDT-impacted agricultural soil into the Little Sunflower River.

6 Chapter 2 Description of Study
2 Description of Study
Understanding of the complex interactions between hydrophobic organic contaminants and sediments is a key to determining the actual risks associated with the dredging and disposal of contaminated sediments. Decisions based on the chemical properties of the contaminant alone which do not incorporate the adsorption, absorption, and sequestration of the contaminant on and within the sediment may lead to an overprediction or underprediction of the risks associated with the contamination. Contaminants that remain in soils or sediments might not meet stringent regulatory levels, even if they represent site-specific, environmentally acceptable endpoints. This unresolved issue of the availability of residual pesticides is the focus of this study. There is a great need to understand contaminant-sediment interactions and their effect on release, bioavailability, and toxicity of sediments (National Research Council 1997). This is especially true for DDT. The adherence of DDT from soils or sediments, i.e., geosorbents, is an important factor in proper decision making when dredging and disposal of contaminated sediments are proposed. These sediment/contaminant interactions should be considered when assessing cleanup standards and risks (Alexander 1995). This is particularly the case for DDT-contaminated sediments and dredged material where one of the most important of the site-specific factors is the availability of the compounds held within solids and how this affects contaminant release and acceptable toxicological endpoints.
Site Description
Background
The Big Sunflower River is a slow-moving, winding river that carries runoff from the floodplains along the Mississippi River. Although it has been dredged in the past, the river is unusually healthy and undisturbed for the Mississippi Delta. The Big Sunflower River Basin encompasses approximately 4,200 of the 13,355 square miles within the Yazoo Basin located in northwest Mississippi (Figure 1). Construction of the Big Sunflower River Project was initiated in the 1940’s and completed in the 1960’s. The flood control project, which includes channel improvements on approximately 700 miles of the Big Sunflower River, Little Sunflower River, Steele Bayou, Bogue Phalia, Quiver River and other tributaries, is a constituent of the Yazoo Basin Project. The overall Mississippi River and Tributaries encompass the Yazoo Basin.

Chapter 2 Description of Study 7
Statement of problem
Between the summer of 1989 and the winter of 1991, extensive flooding occurred in the lower Sunflower Basin. After the 1989 event, citizens in the area were concerned that the river was not performing as it should. Engineering analyses confirmed that the system had lost some of the channel capacity that existed when the project was completed due to vegetation and sedimentation in the channel. Measurements indicate that the sediment depths range from 2-5 ft above the original channel cross sections. This loss of channel capacity has resulted in a corresponding increase in water levels. The entire length of the Big Sunflower River has shown some sedimentation deposits and must be dredged to increase capacity. To assess the problem, water and sediment samples were collected and analyzed for possible contamination. The resulting data indicated that pesticides, including DDT, were present in the sediments.
One alternative being considered for restoring the channel depth and reducing the pesticide contamination is to dredge and place the dredged material in an upland confined disposal facility (CDF) on the agricultural soil. The Big Sunflower River Maintenance Project is expected to restore the design flow capacity of the Big Sunflower River. The original construction work consisted of channel cleanout, clearing and snagging, and channel diversions. The maintenance work will restore the authorized flood control capacity of approximately 130 miles of the original 663 miles of channels where the capacity has diminished. By removing accumulated sediments from the river, this project is expected to reduce the DDT concentration from the river and place it in several CDFs along the river. The maintenance is designed to avoid and minimize adverse resource impacts. This will be accomplished primarily by hydraulic dredge and/or clearing and snagging. These methods of maintenance are expected to minimize the impacts on bottomland hardwoods and farmed wetlands. As of August 2000, 7 miles along the Little Sunflower River was cleared and snagged. The overall project is scheduled for completion in June 2008.
Figure 1. Mississippi River basin

8 Chapter 2 Description of Study
Collection of Sediment Samples
Core sediment samples were collected along the Little Sunflower River in March 2001 by Vicksburg District personnel. Figure 2 shows five core sample locations several miles apart. At each sample location, three sets of core samples were collected across the river (a sample approximately 10 ft from each edge and one sample in the middle of the river). The core samples were collected with a 6.5-ft stainless steel, piston-driven sampling device that was lowered to the top of the sediment and pushed to the bottom of the river. A clay layer existed on the bottom. Each 6.5-ft core was segregated into top, middle, and bottom. Therefore, nine samples at each sample location were composited into three samples per location, i.e., three top, three middle, and three bottom core samples. Fifteen composite core samples were collected for this project. Table 1 shows the core location, recovery depth, and amount of composited sediment. Vicksburg District personnel also collected several gallons of an agricultural soil sample. After sample collection, the samples were delivered to the ERDC-EL, Hazardous Waste Research Center and stored at 4 ºC until testing.
Table 1 Description of Collected Sample Locations
Site Location Individual Core No. Core Location
Recovery Depth, in.
Length of Collected Sample, in.
1 1 Right descending bank
36 41
2 Middle of river 36 4
3 Left descending bank
36 4
2 1 Right descending bank
48 4
2 Middle of river 48 4
3 Left descending bank
36 3
3 1 Right descending bank
38 4
2 Middle of river 44 4
3 Left descending bank
46 4
4 1 Right descending bank
45 5
2 Middle of river 75 5
3 Left descending bank
36 5
5 1 Right descending bank
67 4
2 Middle of river 45 4
3 Left descending bank
65 4
1 Denotes top 4 in., middle 4 in., and bottom 4 in. of a 36-in. core sample from right descending bank.

Chapter 2 Description of Study 9
Figure 2. Core sample locations
Objective
The work explored mechanisms controlling DDT sequestration using novel techniques to examine the distributions and binding energies of DDT in control substances and sediment cores. These findings were used to interpret geochemical processes affecting biostabilization and toxicity of DDT in sediments. Therefore, the objectives of this research were to identify those factors affecting sequestration of DDT on sediments and develop the technical basis for evaluating the degree of contaminant capture and release from sediments contaminated with DDT. This research focused on improved mechanistic understanding of the sequestration of DDT in sediments. Specific objectives of this study were to:

10 Chapter 2 Description of Study
a. Perform TPD-MS analyses to assess released patterns and distributed binding energies of DDT.
b. Conduct X-ray diffraction (XRD), cation exchange capacity (CEC), and total organic carbon (TOC) analysis on sediment core samples to determine physical/chemical characteristics of the field samples.
c. Conduct phospholipid fatty acid (PLFA) analysis to determine microbial community structure and deoxyribonucleic acid (DNA) testing to determine catabolic potential of the microbial community inherent in the contaminated sediment core samples and agricultural soil.
d. Conduct toxicity bioassays on sediment.
e. Assess the availability of DDT in the suspended sediment by desorption kinetics.

Chapter 3 Literature Review 11
3 Literature Review
Background
Dichlorodiphenyltrichloroethane (also known as Benzene, 1,1'-(2,2,2-trichloroethylidene) bis[4-chloro-, p,p'-DDT, and 4,4'-DDT) is an organochlorine insecticide. Technical grade DDT is actually a mixture of three isomers of DDT, principally the p,p'-DDT isomer (ca. 85 percent), with the o,p'-DDT and o,o'-DDT isomers typically present in much lesser amounts. The molecular weight and formula of DDT are 354.5 and C14H9Cl5, respectively. The boiling point, melting point, and density of DDT are 260º C, 108.5º C, and 0.98 g/cm3, respectively. Chemically pure DDT consists of white needles, colorless crystals, or white to slightly off-white powder. DDT is essentially odorless or has a slightly fruit-like odor. DDT is irritating to the skin and eyes. The U.S. Environmental Protection Agency (EPA) has classified DDT in Toxicity Class II, moderately toxic. DDT has a half-life of 15 years, which means 100 kg of DDT will break down to 0.39 kg in about 120 years. DDT breakdown products are 1,1-dichloro-2,2-bis(p-dichlorodiphenyl) ethylene (DDE) and 1,1-dichloro-2,2-bis(p-chlorophenyl)ethane (DDD). These compounds, in turn, are ultimately transformed into bis(dichlorodiphenyl) acetic acid (DDA) (Figure 3).
Introduction
The existence of DDT dates back to the early 1940s. Since July 1972, the EPA banned all uses of DDT products, except under four circumstances: 1) control of vector diseases; 2) health quarantine; 3) controlling body lice (to be dispensed only by a physician); and 4) in formulating prescription drugs for controlling body lice. Even though DDT is no longer registered for use in the United States, it is used in other (primarily tropical) countries.
DDT was mainly used to control mosquito-borne malaria; use on crops has generally been replaced by less persistent insecticides. It was extensively used during World War II among Allied troops and certain civilian populations to control insect typhus and malaria vectors, and was then extensively used as an agricultural insecticide after 1945. It is reported to be compatible with many other pesticides and incompatible with alkaline substances. DDT actually has rather low toxicity to humans (but high toxicity to insects, hence its use as an insecticide). Because of its overuse post World War II, the phenomena of insect

12 Chapter 3 Literature Review
resistance to pesticides, bioaccumulation, and biomagnification was discovered (Agency for Toxic Substances and Diseases Registry (ATSDR) 1994, Royal Society of Chemistry (RSC) 1991).
Figure 3. DDT and breakdown products’ structure

Chapter 3 Literature Review 13
Bioaccumulation
An important process by which chemicals can affect living organisms is through bioaccumulation. Bioaccumulation is an increase in the concentration of a chemical over time in a biological organism compared to the chemical's concentration in the environment. Compounds accumulate in living things any time they are taken up and stored faster than they are broken down (metabolized) or excreted. Understanding the dynamic process of bioaccumulation is very important in protecting human beings and other organisms from the adverse effects of chemical exposure, and it has become a critical consideration in the regulation of chemicals.
Bioaccumulation results from a dynamic equilibrium between exposure from the outside environment and uptake, excretion, storage, and degradation within an organism. The extent of bioaccumulation depends on the concentration of a chemical in the environment. Other important bioaccumulation factors are the amount of chemical coming into an organism from the food, air, or water, and the time it takes for the organism to acquire the chemical and then excrete, store, and/or degrade it. The nature of the chemical itself, such as its solubility in water and fat, affects its uptake and storage. Equally important is the ability of the organism to degrade and excrete a particular chemical. When exposure ceases, the body gradually metabolizes and excretes the chemical. Bioaccum–ulation is a normal process that can result in injury to an organism only when the equilibrium between exposure and bioaccumulation is overwhelmed (Mader 1996).
Toxicological Effects
The toxicological effect of DDT has been studied over the years in humans and animals. DDT is very slowly transformed in animal systems. As mentioned earlier, DDT metabolizes into DDE and DDD, which are very readily stored in fatty tissues. These compounds in turn are ultimately transformed into DDA via other metabolites at a very slow rate. DDA, or conjugates of DDA, are readily excreted via the urine. Available data from analysis of human blood and fat tissue samples collected in the early 1970s showed detectable levels in all samples, but a downward trend in the levels over time. Later study of blood samples collected in the latter half of the 1970s showed that blood levels were declining further, but DDT or metabolites were still seen in a very high proportion of the samples. Levels of DDT or metabolites may occur in fatty tissues (e.g. fat cells, the brain, etc.) at levels of up to several hundred times that seen in the blood. DDT or metabolites may also be eliminated via mother's milk by lactating women (ATSDR 1994).
There is evidence that DDT causes teratogenic effects in test animals and not humans due to DDT exposure levels. Doses of 26 mg/kg/day of DDT in mice impaired their learning performance and caused abnormal tail development in a second generation of rats. Evidence is contradictory when mutagencity and genotoxicity are issues. DDT was not mutagenic to 10 out of 11 various cell cultures and organisms but genotoxic in 8 out of 12. In humans, blood cell

14 Chapter 3 Literature Review
cultures of men occupationally exposed to DDT showed an increase in chromosomal damage. In a separate study, significant increases in chromosomal damage were reported in workers who had direct and indirect occupational exposure to DDT. Thus it appears that DDT may have the potential to cause genotoxic effects in humans, but does not appear to be strongly mutagenic. It is unclear whether these effects may occur at exposure levels likely to be encountered by most people. Finally, evidence regarding the carcinogenicity of DDT is equivocal. Studies show an increased tumor production (mainly in the liver and lung) in test animals such as rats, mice, and hamsters in some studies but not in others. However, the carcinogenicity of DDT in humans, when taken as a whole, does not suggest that DDT and its metabolites are carcinogenic in humans at likely dose levels (ATSDR 1994). In several epidemiological studies, no significant associations between DDT exposure and disease were observed. One study did observe a weak association (Garabrant et al. 1984). In this latter study, which found a significant association between long-term, high DDT exposures and pancreatic cancers in chemical workers, questions were raised as to the reliability of the medical records.
Acute toxicity
DDT is moderately to slightly toxic to studied mammalian species via the oral route. Reported oral LD50’s range from 113 to 800 mg/kg in rats; 150-300 mg/kg in mice; 300 mg/kg in guinea pigs; 400 mg/kg in rabbits; 500-750 mg/kg in dogs; and greater than 1,000 mg/kg in sheep and goats. Toxicity will vary according to formulation. DDT is readily absorbed through the gastrointestinal tract, with increased absorption in the presence of fats. One-time administration of DDT to rats at doses of 50 mg/kg led to decreased thyroid function. A single dose of 150 mg/kg led to an increase in liver-produced enzymes in rats and changes in the cellular chemistry in the central nervous system of monkeys. Single doses of 50-160 mg/kg produced tremors in rats, and single doses of 160 mg/kg produced hind leg paralysis in guinea pigs. Mice suffered convulsions following a one-time oral dose of 200 mg/kg (RSC 1991, Meister 1992, ATSDR 1994). Single administrations of low doses to developing 10-day-old mice are reported to have caused subtle effects on their neurological development. DDT is slightly to practically nontoxic to test animals via the dermal route, with reported dermal LD50’s of 2,500-3,000 mg/kg in female rats, 1000 mg/kg in guinea pigs, and 300 mg/kg in rabbits. It is not readily absorbed through the skin unless it is in solution. It is thought that inhalation exposure to DDT will not result in significant absorption through the lung alveoli. It is probably trapped in mucous secretions and swallowed by exposed individuals following the trachea-bronchial clearance of secretions by the cilia. Acute effects likely in humans due to low to moderate exposure may include nausea, diarrhea, increased liver enzyme activity, irritation (of the eyes, nose, or throat), disturbed gait, malaise, and excitability. Acute effects due to higher doses may include tremors and convulsions (ATSDR 1994, Van Ert and Sullivan 1992). While adults appear to tolerate moderate to high-ingested doses of up to 280 mg/kg, a case of fatal poisoning was seen in a child who ingested 1 ounce of a 5-percent DDT: kerosene solution (ATSDR 1994).

Chapter 3 Literature Review 15
Chronic toxicity
DDT has caused chronic effects on the nervous system, liver, kidneys, and immune systems in experimental animals (World Health Organization (WHO) 1979). Effects on the nervous system observed in test animals include: tremors in rats at doses of 16-32 mg/kg/day over 26 weeks; tremors in mice at doses of 6.5-13 mg/kg/day over 80-140 weeks; changes in cellular chemistry in the central nervous system of monkeys at doses of 10 mg/kg/day over 100 days; and loss of equilibrium in monkeys at doses of 50 mg/kg/day for up to 6 months. The main effect on the liver seen in animal studies was localized liver damage. This effect was seen in rats given 3.75 mg/kg/day over 36 weeks, rats exposed to 5 mg/kg/day over 2 years, and dogs at doses of 80 mg/kg/day over the course of 39 months. In many cases, lower doses produced subtle changes in liver cell physiology, and in some cases, higher doses produced more severe effects. In mice, doses of 8.33 mg/kg/day over 28 days caused increased liver weight and increased liver enzyme activity. Liver enzymes are commonly involved in detoxification of foreign compounds, so it is unclear whether increased liver enzyme activity in itself would constitute an adverse effect. In some species (monkeys and hamsters), doses as high as 8-20 mg/kg/day caused no observed adverse effects over exposure periods as long as 3.5-7 years. Kidney effects observed in animal studies include adrenal gland hemorrhage in dogs at doses of 138.5 mg/kg/day over 10 days and adrenal gland damage at 50 mg/kg day over 150 days in dogs. Kidney damage was also seen in rats at doses of 10 mg/kg/day over 27 months. Immunological effects observed in test animals include: reduced antibody formation in mice following administration of 13 mg/kg/day for 3-12 weeks and reduced levels of immune cells in rats at doses of 1 mg/kg/day. No immune system effects were observed in mice at doses of 6.5 mg/kg/day for 3-12 weeks (ATSDR 1994). Dose levels at which effects were observed in test animals are very much higher than those that may be typically encountered by humans (WHO 1979). The most significant source of exposure to individuals in the United States is occupational, occurring only to those who work or worked in the production or formulation of DDT products for export (Sax 1984). Analysis of U.S.-market-based surveys showed approximately a 30-fold decrease in detected levels of DDT and metabolites in foodstuffs from 1969-1974, and another threefold drop from 1975-1981, with a final estimated daily dose of approximately 0.002 mg/person/day. Based on a standard 70-kg person, this results in a daily intake of approximately 0.00003 mg/kg/day. Due to the persistence of DDT and its metabolites in the environment, very low levels may continue to be detected in foodstuffs grown in some areas of prior use. It has been suggested that, depending on patterns of international DDT use and trade, dietary exposure levels may actually increase over time. Persons eating fish contaminated with DDT or metabolites may also be exposed via bioaccumulation of the compound in fish. Although current dietary levels of DDT are quite low, past and current exposures may result in measurable body burdens due to its persistence in the body. Adverse effects on the liver, kidney, and immune system due to DDT exposure have not been demonstrated in humans in any of the studies that have been conducted to date (ATSDR 1994).

16 Chapter 3 Literature Review
Ecological Effects
Effects on birds
DDT may be slightly toxic to practically nontoxic to birds. Reported dietary LD50’s range from greater than 2,240 mg/kg in mallards, 841 mg/kg in Japanese quail, and 1,334 mg/kg in pheasant (Hudson, Tucker, and Haegele 1984). Other reported dietary LD50’s in such species as bobwhite quail, California quail, red-winged blackbird, cardinal, house sparrow, blue jay, sandhill crane, and clapper rail also indicate slight toxicity both in acute 5-day trials and over longer periods of up to 100 days. In birds, exposure to DDT occurs mainly via the food web through predation on aquatic and/or terrestrial species having body burdens of DDT, such as fish, earthworms, and other birds. There has been much concern over chronic exposure of bird species to DDT and effects on reproduction, especially eggshell thinning and embryo deaths. The mechanisms of eggshell thinning are not fully understood. It is thought that this may occur from the major metabolite, DDE, and that predator species of birds are the most sensitive to these effects. Laboratory studies on bird reproduction have demonstrated the potential of DDT and DDE to cause subtle effects on courtship behavior, delays in pairing and egg laying, and decreases in egg weight in ring doves and Bengalese finches. The implications of these for long-term survival and reproduction of wild bird species are unclear. There is evidence that synergism may be possible between DDT's metabolites and organophosphate (cholinesterase-inhibiting) pesticides to produce greater toxicity to the nervous system and higher mortality (WHO 1989).
Effects on aquatic species
DDT is very highly toxic to many aquatic invertebrate species. Reported 96-hr LC50’s in various aquatic invertebrates (e.g., stoneflies, midges, crayfish, sow bugs) range from 0.18 ug/L to 7.0 ug/L, and 48-hr LC50’s are 4.7 ug/L for daphnia and 15 ug/L for sea shrimp (Johnson and Finley 1980). Other reported 96-hr LC50’s for various aquatic invertebrate species are from 1.8 ug/L to 54 ug/L. Early developmental stages are more susceptible than adults to DDT's effects (WHO 1989). The reversibility of some effects, as well as the development of some resistance, may be possible in some aquatic invertebrates. DDT is very highly toxic to fish species as well. Reported 96-hr LC50’s are less than 10 ug/L in Coho salmon (4.0 ug/L), rainbow trout (8.7 ug/L), northern pike (2.7 ug/L), black bullhead (4.8 ug/L), bluegill sunfish (8.6 ug/L), largemouth bass (1.5 ug/L), and walleye (2.9 ug/L). The reported 96-hr LC50’s in fathead minnow and channel catfish are 21.5 ug/L and 12.2 ug/L, respectively (Johnson and Finley 1980). Other reported 96-hr LC50’s in largemouth bass and guppy were 1.5 ug/L and 56 ug/L, respectively. Observed toxicity in coho and Chinook salmon was greater in smaller fish than in larger (WHO 1989). It is reported that DDT levels of one ng/L in Lake Michigan were sufficient to affect the hatching of coho salmon eggs (Matsumura 1985). DDT may be moderately toxic to some amphibian species and larval stages are probably more susceptible than adults (Hudson, Tucker, and Haegele 1984; WHO 1989). In addition to acute toxic effects, DDT may bioaccumulate significantly in fish and other aquatic species, leading to long-term exposure. This occurs mainly through uptake from sediment

Chapter 3 Literature Review 17
and water into aquatic flora and fauna, and fish. Fish uptake of DDT from the water will be size-dependent, with smaller fish taking up relatively more DDT than larger fish. A half- time for elimination of DDT from rainbow trout was estimated to be 160 days (WHO 1989). The reported bioconcentration factor for DDT is 1,000 to 1,000,000 in various aquatic species (USEPA 1989), and bioaccumulation may occur in some species at very low environmental concentrations (Johnson and Finley 1980). Bioaccumulation may also result in exposure to species which prey on fish or other aquatic organisms (e.g., birds of prey).
Effects on other animals
Earthworms are not susceptible to acute effects of DDT and its metabolites at levels higher than those likely to be found in the environment, but they may serve as an exposure source to species that feed on them. DDT is nontoxic to bees; the reported topical LD50 for DDT in honeybees is 27 ug/bee. Laboratory studies indicate that bats may be affected by DDT released from stored body fat during long migratory periods (WHO 1989).
Environmental Fate
As mentioned earlier, DDT is banned from general use in the United States but may still be in use elsewhere as a pesticide. If released to the terrestrial compartment, it will adsorb very strongly to soil and be subject to evaporation and photodegradation at the surface of soils. It will not leach appreciably to groundwater or hydrolyze but may be subject to biodegradation in flooded soils or under anaerobic conditions. Reports of half-lives for biodegradation in soil range from 2 years to more than 15 years (Meister 1992; ATSDR 1994). If released to water it will adsorb very strongly to sediments. It would significantly bioconcentrate in fish and would be subject to considerable evaporation. The estimated half-lives for evaporation are several hours to almost 50 hr from certain waters. It may be subject to considerable indirect photodegradation near the surface of certain waters, but will not appreciably hydrolyze. It may be subject to biodegradation in waters and sediments where high populations of the required microorganisms are present, but generally, biodegradation in water is poor. It will not hydrolyze and will not significantly biodegrade in most waters. If released to the air it will be subject to direct photooxidation and reaction with photochemically produced hydroxyl radicals. Under simulated atmospheric conditions, both DDT and DDE decompose to form carbon dioxide and hydrochloric acid. Wet and dry deposition will be major removal mechanisms from the atmospheric compartment (RSC 1991). General population exposure will occur mainly through ingestion of contaminated food, especially contaminated fish and human milk.
18 Chapter 3 Literature Review
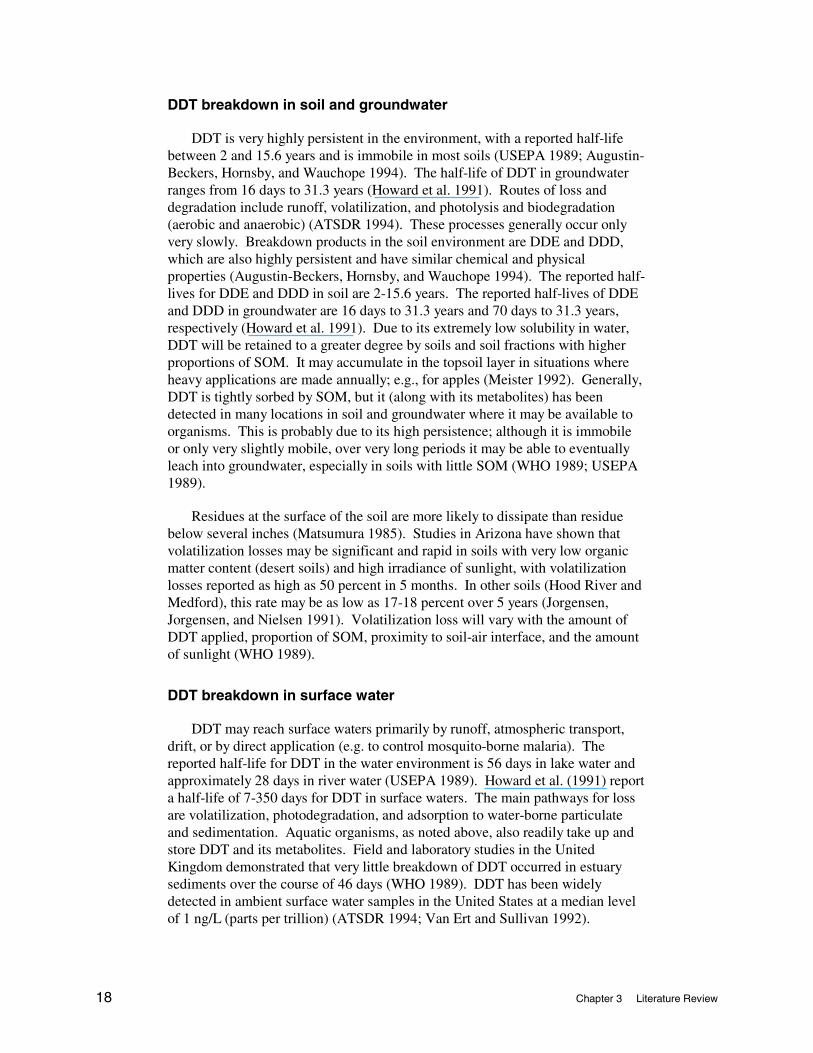
DDT breakdown in soil and groundwater
DDT is very highly persistent in the environment, with a reported half-life between 2 and 15.6 years and is immobile in most soils (USEPA 1989; Augustin-Beckers, Hornsby, and Wauchope 1994). The half-life of DDT in groundwater ranges from 16 days to 31.3 years (Howard et al. 1991). Routes of loss and degradation include runoff, volatilization, and photolysis and biodegradation (aerobic and anaerobic) (ATSDR 1994). These processes generally occur only very slowly. Breakdown products in the soil environment are DDE and DDD, which are also highly persistent and have similar chemical and physical properties (Augustin-Beckers, Hornsby, and Wauchope 1994). The reported half-lives for DDE and DDD in soil are 2-15.6 years. The reported half-lives of DDE and DDD in groundwater are 16 days to 31.3 years and 70 days to 31.3 years, respectively (Howard et al. 1991). Due to its extremely low solubility in water, DDT will be retained to a greater degree by soils and soil fractions with higher proportions of SOM. It may accumulate in the topsoil layer in situations where heavy applications are made annually; e.g., for apples (Meister 1992). Generally, DDT is tightly sorbed by SOM, but it (along with its metabolites) has been detected in many locations in soil and groundwater where it may be available to organisms. This is probably due to its high persistence; although it is immobile or only very slightly mobile, over very long periods it may be able to eventually leach into groundwater, especially in soils with little SOM (WHO 1989; USEPA 1989).
Residues at the surface of the soil are more likely to dissipate than residue below several inches (Matsumura 1985). Studies in Arizona have shown that volatilization losses may be significant and rapid in soils with very low organic matter content (desert soils) and high irradiance of sunlight, with volatilization losses reported as high as 50 percent in 5 months. In other soils (Hood River and Medford), this rate may be as low as 17-18 percent over 5 years (Jorgensen, Jorgensen, and Nielsen 1991). Volatilization loss will vary with the amount of DDT applied, proportion of SOM, proximity to soil-air interface, and the amount of sunlight (WHO 1989).
DDT breakdown in surface water
DDT may reach surface waters primarily by runoff, atmospheric transport, drift, or by direct application (e.g. to control mosquito-borne malaria). The reported half-life for DDT in the water environment is 56 days in lake water and approximately 28 days in river water (USEPA 1989). Howard et al. (1991) report a half-life of 7-350 days for DDT in surface waters. The main pathways for loss are volatilization, photodegradation, and adsorption to water-borne particulate and sedimentation. Aquatic organisms, as noted above, also readily take up and store DDT and its metabolites. Field and laboratory studies in the United Kingdom demonstrated that very little breakdown of DDT occurred in estuary sediments over the course of 46 days (WHO 1989). DDT has been widely detected in ambient surface water samples in the United States at a median level of 1 ng/L (parts per trillion) (ATSDR 1994; Van Ert and Sullivan 1992).

Chapter 3 Literature Review 19
DDT breakdown in vegetation
DDT does not appear to be taken up or stored by plants. It was not translocated into alfalfa or soybean plants and only trace amounts of DDT or its metabolites were observed in carrots, radishes, and turnips all grown in DDT-treated soils. Some accumulation was reported in grain, maize and rice plants, but little translocation occurred and residues were located primarily in the roots (ATSDR 1994; WHO 1989).

20 Chapter 4 Sediment Characterization
4 Sediment Characterization
Introduction
The purpose of this chapter is to present and document the chemical results obtained on the Little Sunflower River sediment. This section will also discuss the rationale behind the distribution of sediment samples for testing and composition of the sediment core samples. The chemical analysis was conducted by the Environmental Chemistry Branch, EPED.
Objective
The objective of characterizing the Little Sunflower River sediment and agricultural soil is to confirm the presence or absence of DDT, DDE, DDD, and other parameters. Characterizing the Little Sunflower River sediment and agricultural soil also provided a base for interpreting the results of each experiment.
Methods
Cation exchange capacity (CEC)
One of the parameters utilized in sediment characterization is CEC. The CEC of a soil/sediment is the total amount of exchangeable positive-charged cations that a soil can absorb. The positive-charged cations are calcium, magnesium, potassium, sodium, hydrogen, and aluminum. The amount of these positively charged cations that a soil can hold is described as the CEC and is expressed in milliequivalents per 100 grams (meq/100g) of soil. The larger the CEC value, the more cations the soil can hold. A clay soil will have a larger CEC than a sandy soil. For example, kaolinite has very little capacity to hold cations, i.e., the CEC ranges between 3 and 15 meq/100g. The CEC gives an indication of the soil’s potential to hold plant nutrients. Increasing the organic matter content of any soil will help to increase the CEC, since it also holds cations like the clays. Organic matter has a high CEC.
The CEC will influence the ability of the soil to hold and interact with pesticides. Pesticides that have a positive charge will be held more tightly to the

Chapter 4 Sediment Characterization 21
soil when the CEC of the soil is high. As mentioned earlier, soils with a low CEC are sandy in nature and have a lower ability to hold cations than high-CEC soils. This can lead to potential leaching and movement of some pesticides in soils with a low CEC.
DDT Extraction
SW 846 Method 3545, “Accelerated Solvent Extraction” was employed in extracting the Little Sunflower River samples. Each sample was mixed with a spatula and a 15-gram sample was placed into a beaker. The sample was mixed with hydromatrix until sediment was dry and free-flowing. The sediment mixture was placed into a 30-gram stainless steel cell on a Dionex Accelerated Solvent Extractor (ASE) 200 for extraction. This method uses high temperature (100o C) and high pressure (1500-2000 psi) to extract organics from the sediment sample. The ASE uses a solvent mixture of 75 percent hexane and 25 percent acetone for organochlorine pesticide extraction. The period for total extraction is about 10 minutes.
The cells are removed from the ASE and allowed to cool. The extract is poured through sodium sulfate to remove any excess water. The extract is then collected in a Turbo Vap tube and placed on Zymark Turbo Vap II concentration workstation. The extract is concentrated to 5 ml and cleaned up using Method 3620b before analyses are performed using Method 8081a.
Chemical Analysis Results
The Little Sunflower River sediment was chemically characterized by ECB using SW846 methods. Individual core, agricultural soil, and composited core sample analyses are presented in Table 2.
Table 2 Little Sunflower River Sediment Chemical Analysis Core Description DDD, ug/kg DDE, ug/kg DDT, ug/kg TOC, mg/kg CEC1
Site 1-Top 15.9 67.8 6.54 7,390 71.6 Middle 23.3 81.3 <1.67 14,900 63.7 Bottom 65.7 119 <1.67 13,400 46.2 Site 2-Top 23.3 180 23.30 16,800 59.6 Middle 93.3 237 <1.67 10,400 93.8 Bottom 81.4 196 <1.67 16,000 60.8 Site 3-Top 31.5 103 <1.67 10,000 62.4 Middle 91.1 233 <1.67 10,400 67.5 Bottom 55.2 86.2 <1.67 15,900 65.2 Site 4-Top 27.5 85.8 10.60 9,800 62.0 Middle 32.0 167 19.70 9,100 58.7 Bottom 42.9 187 <1.67 15,300 51.0 Site 5-Top 18.6 57.5 9.80 9,100 65.0 Middle 19.5 74.9 8.02 10,600 64.5 Bottom 7.15 23.2 <1.67 5,850 35.2 Composited Cores2 36.5 81.1 16.3 11,000 39.7 Agriculture Soil 253 797 988 10,900 27.6 1 Denotes meq/100g of soil 2 Denotes average concentration

22 Chapter 4 Sediment Characterization
Sample distribution
Figure 4 shows DDT concentration in four of the top cores, two of the middle cores, and none of the bottom cores. Based on the chemical results, each core sample had DDT, DDE, or DDD. The total concentration of the core sample was somewhat similar. The top core samples had DDT, DDE, and DDD, except for Site 3-Top. The majority of the contaminants were located in the middle core samples. Site 2-Middle showed the highest concentration of DDD and DDE, but no DDT. Site 3-Middle showed the next highest concentration of DDD and DDE. However, Site 2-Top was selected as the sample to advance for each study. The Site 2-Top core sample had DDT, DDE, and DDD at elevated concentrations. The Site 2-Top core sample underwent XRD, PLFA and DNA, TPD, and sediment desorption kinetic testing (Table 3). However, additional samples were required for the modified toxicity bioassay study. Since a limited amount of samples were on hand, compositing all the cores was deemed a reasonable and a variable option. The scope of work then changed to using composited sediment for TPD, sediment desorption kinetic, and bioassay studies (Table 3).
Figure 4. Individual core results
The DDT concentration generally decreased with depth. DDT was not detected in the bottom cores. Two possible phenomena are that DDT is not transported through the sediment or DDT was transported and subsequently transformed into its by-products. DDE (mono dechlorinated DDT) was detected and was the most prevalent species present. DDE was more prevalent in the middle cores and less prevalent in the top and bottom cores. This indicates that
0 50 100 150 200 250 300 350
1 BOT
2 BOT
3 BOT
4 BOT
5 BOT
1 MID
2 MID
3 MID
4 MID
5 MID
1 TOP
2 TOP
3 TOP
4 TOP
5 TOP
Sam
ple
Lo
cati
on
s
Total Concentration (µg/kg)
DDDDDEDDT

Chapter 4 Sediment Characterization 23
DDE is more mobile than DDT and may be formed from the reductive dechlorination of DDT. DDD (di-dechlorinated DDT) was predominanly detected in the bottom cores and may be the result of reductive dechlorination of DDE. The bottom line is that reductive dechlorination of DDT is occurring. Additional samples would facilitate the effort to determine if DDT is undergoing intrinsic attenuation.
Table 3 Sediment Utilization for Experimental Setups
Core Description Thermal Desorption
X-ray Diffraction PLFA/DNA
Toxicity Bioassay
Sediment Desorption Kinetics
Site 1-Top
Middle
Bottom
Site 2-Top X X X X
Middle X X
Bottom X X
Site 3-Top
Middle
Bottom
Site 4-Top
Middle
Bottom
Site 5-Top
Middle
Bottom
Composited Cores X X X
Agriculture Soil X X
Sediment compositing method
Of the 15 sample jars of Little Sunflower River sediment cores, 14 remained, discounting the small portion remaining labeled Site 2-Top. Each sample jar had approximately 0.5 liter. Each jar was opened and the contents transferred with a stainless steel spatula into a 5-gal stainless steel mixing bowl. The sediment samples were mixed with a 4-in. stainless steel propeller. The sediment was lumpy, but the mixer sustained a speed of 100 rpm for about 30 min, in the usual from-the-bottom and all-around mixing procedure. Next, the composited sample was transferred to a 10-gal container. A large stainless steel spoon was used to further mix for about 15 min. Unfortunately, there was some unavoidable slop and unrecoverable material, but no big globs from any one sample jar were noted. The composite sediment was subsampled into a 500-ml jar for further analyses. The sediment samples were re-homogenized by stirring for a minute every time the sample jar was opened.

24 Chapter 5 Thermal Desorption Analysis
5 Thermal Desorption Analysis
Introduction
This chapter presents and documents the results of the Thermal Program Desorption (TPD) analyses on the Little Sunflower River sediment. This chapter will discuss the bond energies of DDT and derivatives. This work was conducted by the Environmental Engineering Branch, EPED.
Objective
The objective of TPD analysis was to help assess availability of DDT, DDE, and DDD. Based on previous studies, TPD analysis has proven to be a useful tool for hydrophobic contaminants such as PAHs (Talley et al. 2001, Ghosh et al. 2000). Such TPD analyses have not been performed previously for DDT, DDE, and DDD.
Experimental Approach
TPD is a method that determines the physical availability of a medium substance measuring absolute fugacity. In the TPD experiment, a small sample is heated under vacuum, and the substance vaporizes. It is most useful for semivolatiles. Since no chromatographic separation is employed, interferences are common in environmental samples.
Hydrophobic compounds preferentially bind to various components of soil and sediment depending on organic matter content and type (Karapanagioti et al. 2000). The degree of binding with sorbents strongly influences availability and environmental effects. For example, a major factor influencing successful sediment bioremediation is the availability of contaminants to microorganisms for degradation, whereas contaminants that are strongly sorbed and not available to microorganisms may also not be available for a toxic response. Thus, an understanding of how binding to a solid substrate changes the availability is

Chapter 5 Thermal Desorption Analysis 25
important for evaluating the environmental fate and effects of these compounds. The processes affecting the availability in soil and sediment are complex due to the large heterogeneity in soil/sediment particle types and sorbent organic matter typically present (Luthy et al. 1997).
TPD mass spectrometry (TPD-MS) with a direct insertion probe was used to study the release characteristics of DDT, DDE, and DDD that were sorbed onto different mineral and organic surfaces. Spiked sand, kaolin, bentonite, XAD-4 resin beads, and both spiked and unspiked Little Sunflower River sediments were used in the TPD experiment. The materials were spiked with DDT, DDE, and DDD. The materials were chosen to be representative standard surrogates of the high clay and organic content of the sediment discussed in Chapter 4.
Materials and Methods
A schematic of the TPD-MS is shown in Figure 5. The TPD-MS used was a ThermoQuest GCQ instrument. The probe used was a ThermoQuest GCQ Plus Direct Insertion Probe with a glass sample vial as shown in Figure 6. This instrument configuration was selected so that a sample could be inserted directly into the ion volume of the MS.
Figure 5. Schematic of the TPD-MS with a direct insertion probe

26 Chapter 5 Thermal Desorption Analysis
Figure 6. Schematic of the direct insertion probe tip with a sample vial
The sample is placed in an open sample vial and weighed. The sample vials are cylindrical with an inside diameter of 1.0 mm and a length of 10 mm. The probe holding the vial is inserted into the MS and heated linearly. The ion trap in the TPD-MS is a chamber consisting of an ion source, injection optics, mass analyzer, multiplier, and detector. The system is filled with helium damping gas and is regulated so that pressure in the system is approximately 10-7 atm.
Within each TPD run, the raw ion count is proportional to the molecular flux in the ion volume. Thus, the ion count measured at any time is proportional to the rate of release of semivolatiles from the sample vial. The characteristic spectra of the contaminants of concern are show in Figures 7a, 7b, and 7c. The sensitivity of the instrument with the direct insertion probe accommodates very small samples and very low-level contamination, depending upon adsorption properties.
A linear heating ramp rate of 10°C/min with a final temperature of 400°C was selected as standard, from previous method development. Many organic samples exhibit pyrolysis starting at approximately 400° C, which is a limiting factor. The usable amount of material is limited by mass transfer effects.
All powdery samples exhibited a volume-dependent TPD response that is attributed to interparticle diffusion, illustrated in Figure 8. Based on a previous study, Ottawa sand was spiked with 40 ppm of MW 228 homolog (benzo (a) anthracene and chrysene), and 1.8-mg sand (3 grains) was placed in the vial.
thermocouple spring clip
flaredsample
vial
heater coil

Chapter 5 Thermal Desorption Analysis 27
a. DDT
b. DDE
Figure 7. NIST library mass spectrums

28 Chapter 5 Thermal Desorption Analysis
c. DDD
Figure 8. TPD-MS response for PAH mass 228 homolog for PAH spiked sand
The sand grains were then covered with 0, 3, or 6 mm of kaolin. The results show that mass diffusion through the kaolin delayed the TPD-MS response. For clayey samples, 1 mg is optimal for TPD, this being the largest amount that can be used without appreciable additional mass transfer effects. The kaolin was bulk powder from Aldrich Chemical Co. and the pulverized activated carbon was
0
0.2
0.4
0.6
0.8
1
1.2
0 50 100 150 200 250 300 350
Temperature (°C)
No
rmal
ized
Co
un
ts sand; no kaolin sand; 3 mm kaolin cover sand; 6 mm kaolin cover

Chapter 5 Thermal Desorption Analysis 29
BL pulverized from Calgon Carbon Co. The sand was washed Ottawa sand, 20-30 mesh with typical dimension of about 400 µm, and the bentonite was from Fisher Scientific Co. The XAD-4 resin beads were from Aldrich Chemical Co.
Sediment samples were obtained by coring at several locations in the Little Sunflower River. These samples were characterized as reported in Chapter 2. Among the sediment, characteristics relevant for this analysis are the high TOC content and the high swelling clay content.
4,4-DDT, 4,4-DDE, and 4,4-DDD were used for spiking as single 200 ng/µL methanol solutions. The methanol was GC grade, and the water was distilled deionized.
Clean materials were prepared by washing first in water and then methanol, with thorough drying in ambient room temperature, except for the sediment, which was not washed but was dried in ambient air and then pulverized. Homogenization was achieved by manual stirring with a stainless steel spatula. The materials were spiked at several concentrations, with 20-ppm concentration being the lowest concentration that gave any usable results.
One gram of solid sample was saturated with methanol to produce a slurry mixture. For the 20-ppm spike, 100 µL of each standard was spiked into the slurry, and stirred continuously for 15 min, followed by 5 min of stirring every hour for 4 hr. Between the stirs, the material was allowed to dry in ambient air.
Samples were stored in glass containers with foil-lined tops in a dark cooler at 4° C. Results reported in this work are measured 2 weeks following spikes. No significant aging effects were noticed in any other measurements.
In initial tests, 0.5 µL of 200 ng/µL DDT in methanol was spiked into an empty glass TPD sample vial and allowed to evaporate for 15 min before the start of the run. Figure 9 shows the TPD run for DDT at ion thermograms of 246, 235, and 318 m/z. The DDT desorbed easily from the glass vial and was easily detectable. The DDT spectrum is shown in Figure 10.

30 Chapter 5 Thermal Desorption Analysis
Figure 9. TPD run of 100 ng of DDT in glass vial at selected ion mass
Figure 10. Spectrum of TPD run of 100 ng of DDT in glass vial at selected ion mass
Results and Discussion
The sand that was spiked with 20 ppm each of DDT, DDE, and DDD showed good TPD peaks (Figure 11). The DDE spectrum (selected ion mass 318, with 214 as a check) was slightly more bound to sand than DDT (ion mass 235), since it desorbed at temperatures 300 higher. DDD had approximately the same spectrum as DDT, and was an interference. The spectrum showed all the right mass peaks (Figure 12).
RT: 0.00 - 37.01
0 2 4 6 8 10 12 14 16 18 20 22 24 26 28 30 32 34 36Time (min)
0
20
40
60
80
1000
20
40
60
80
100
Re
lativ
e A
bu
nda
nce
0
20
40
60
80
1000.49
0.76 1.771.93
2.28
4.56 4.864.46
5.04
5.58 6.297.48
8.77 10.24 11.94 13.42 15.60 17.12 18.79 20.31 22.18 23.73 25.17 27.13 28.40 30.54 31.66 35.7533.640.52 0.71
1.48 1.78
2.01
4.584.13
5.34
6.72 7.30 8.71 10.46 12.09 14.03 15.89 16.96 18.45 20.56 22.33 23.66 25.22 36.6232.78 34.3727.52 30.9829.43
0.671.71
1.79
4.582.28 4.654.41 5.91 6.47
6.97
7.558.20
9.10 9.7711.11 13.01 15.80 16.74 18.20 19.76 21.41 22.93 24.70 26.23 28.05 30.70 33.21 35.16
NL:3.64E6
m/z= 245.5-246.5 MS 121503
NL:2.98E7
m/z= 234.5-235.5 MS 121503
NL:8.53E5
m/z= 317.5-318.5 MS 121503
121503#83-339 RT: 1.00-3.99 AV: 257 NL: 1.62E7T: + c Full ms [ 95.00-355.00]
100 120 140 160 180 200 220 240 260 280 300 320 340m/z
0
5
10
15
20
25
30
35
40
45
50
55
60
65
70
75
80
85
90
95
100
Re
lativ
e A
bu
nd
an
ce
235.0
237.0
165.2
200.1
199.1 212.1 246.0176.2 248.0201.1
164.2214.1 282.0249.0177.2 317.9136.1105.3 123.2 150.2 285.0 353.6320.9217.1 280.0186.2 252.1 349.8298.9

Chapter 5 Thermal Desorption Analysis 31
Figure 11. TPD run of 20 ppm DDT, DDE, DDD on sand at selected ion mass
Figure 12. Spectrum TPD run of 20 ppm DDT, DDE, DDD on sand at selected ion mass
Kaolin that was spiked with 20 ppm each of DDT, DDE, and DDD showed little desorption of DDE at much higher temperatures (2700) and no desorption of DDT could be discerned (Figure 13). DDE was definitely less bound to kaolin than DDT. Figure 14 shows a faint spectrum but definite mass peaks of DDE, along with other contaminants that had been present in the kaolin.
RT: 0.00 - 37.01
0 2 4 6 8 10 12 14 16 18 20 22 24 26 28 30 32 34 36Time (min)
0
20
40
60
80
1000
20
40
60
80
100
Rel
ativ
e A
bund
anc
e
0
20
40
60
80
1006.35
4.96 7.237.79
4.769.69 10.01
3.86 10.393.55 11.25
12.572.98 14.05 15.25 16.99 18.742.35 20.22 21.79 23.251.46 24.97 29.8527.65 30.78 32.364.963.29
2.87
2.61
2.205.172.04 6.35
1.67 6.617.79
9.69 10.17 11.36 12.95 15.17 17.10 18.54 26.86 31.0029.9420.22 21.53 25.4123.33 32.526.35
7.23
4.96
4.76 7.799.11 9.58
4.50 11.1711.68
4.17 13.20 14.863.60 17.10 18.21 19.71 21.282.25 22.94 24.56 27.27 28.36 30.21 31.73
NL:6.03E4
m/z= 245.5-246.5 MS 051602
NL:4.97E4
m/z= 234.5-235.5 MS 051602
NL:3.86E4
m/z= 317.5-318.5 MS 051602
051602#74-383 RT: 2.01-10.01 AV: 310 NL: 2.02E4T: + c Full ms [ 50.00-650.00]
50 100 150 200 250 300 350 400 450 500 550 600 650m/z
0
5
10
15
20
25
30
35
40
45
50
55
60
65
70
75
80
85
90
95
100
Re
lativ
e A
bu
nda
nce
246.0
165.1
248.0235.0
317.9
176.1
315.9
319.9
199.0280.9
164.1249.0
149.0123.187.1 321.9283.975.0 280.0
251.073.0 285.9 322.9 353.5 400.9 414.9 440.0 475.8 600.2572.3559.8509.8 628.0 647.2

32 Chapter 5 Thermal Desorption Analysis
Figure 13. TPD run of 20 ppm DDT, DDE, DDD on kaolin at selected ion mass
Figure 14. Spectrum of TPD run of 20 ppm DDT, DDE, DDD on kaolin at selected ion mass
No other spiked materials showed any DDT, DDE, or DDD desorption at any spiking level tested, from 1 to 100 ppm. DDT, DDE, and DDD were simply bound too tightly. The spiked sediment did not show any desorption at the 20-ppm level, and the approximately 20-ppb level in the environment was therefore completely undetectable. Apparently, the sediment sorbed DDT and DDE so strongly that they cannot be thermally desorbed.
The agricultural soil that was collected per Chapter 2 had higher levels of DDT concentration than the Little Sunflower River sediment. TPD results on the agricultural soil showed no DDT desorption (Figure 15). Figure 16 shows a
RT: 0.00 - 37.01
0 2 4 6 8 10 12 14 16 18 20 22 24 26 28 30 32 34 36Time (min)
0
20
40
60
80
1000
20
40
60
80
100
Re
lativ
e A
bu
nda
nce
0
20
40
60
80
1000.13
0.43
25.6324.6720.10 23.5916.87 26.09 29.970.71 30.9318.59 28.90 31.92 36.2514.891.46 14.6611.5010.871.98 8.654.70 7.81
0.22
0.30
0.59
0.8234.06 35.641.08 31.361.62 28.667.40 25.8311.93 22.4310.75 23.7821.0618.145.843.09 13.89 15.019.41
0.12
24.9622.9425.2522.35
19.93 26.0718.9417.400.28 15.23 26.47
33.0713.930.39 10.978.00 27.16 36.9030.594.46 31.296.90 34.451.49 9.522.144.56
NL:1.04E3
m/z= 245.5-246.5 MS 121902
NL:1.02E3
m/z= 234.5-235.5 MS 121902
NL:5.78E2
m/z= 317.5-318.5 MS 121902
121902#1357-1896 RT: 20.01-28.01 AV: 540 NL: 2.33E2T: + c Full ms [ 95.00-355.00]
100 120 140 160 180 200 220 240 260 280 300 320 340m/z
0
5
10
15
20
25
30
35
40
45
50
55
60
65
70
75
80
85
90
95
100
Rel
ativ
e A
bun
dan
ce
129.0
149.0
97.0
105.0 115.0 143.0
246.0
317.8157.1
123.1 248.0135.1 315.9185.1
171.1
159.0165.1
319.9
233.0176.1
199.1 282.9213.0281.0255.0
191.1221.1 284.0207.1 256.0237.0
267.0321.9286.0 353.1301.1 343.0

Chapter 5 Thermal Desorption Analysis 33
complicated spectrum with many compounds desorbing and interfering, but no mass peaks from DDT, DDE, or DDD. TPD results of the Little Sunflower River sediment are relatively clean (Figure 17). However, Figure 18 shows some organic pyrolysis, with typical hydrocarbon mass peaks.
Figure 15. TPD run of DDT, DDE, and DDD on agricultural sample at selected ion mass
Figure 16. Spectrum of TPD run of DDT, DDE, and DDD on agricultural sample at selected ion mass
RT: 0.00 - 37.01
0 2 4 6 8 10 12 14 16 18 20 22 24 26 28 30 32 34 36Time (min)
0
20
40
60
80
1000
20
40
60
80
100
Re
lativ
e A
bu
nd
an
ce
0
20
40
60
80
10024.84
27.7126.4123.220.49 0.80
21.41 28.021.281.44 20.859.39 28.798.21 10.37 19.972.05
11.57 17.377.186.11 19.352.46 28.9011.94 17.045.92 13.933.43 30.3330.56 31.60 33.22 35.55
0.53
0.75
1.09
1.33 26.1125.2615.75 26.351.53 23.7314.552.11 16.62 27.5313.557.84 22.8017.91 18.4511.2110.132.38 28.6719.58 22.069.652.76 29.517.663.3731.09 33.93 34.50
0.38
0.45
14.5126.130.68 25.91 27.521.30
28.3625.1414.35 16.56 17.22 23.441.38 18.9710.86 20.18 29.372.98 9.558.05 11.286.75 29.595.873.50 30.56 36.9332.42
NL:2.99E4
m/z= 245.5-246.5 MS 111402
NL:3.74E4
m/z= 234.5-235.5 MS 111402
NL:1.92E4
m/z= 317.5-318.5 MS 111402
111402#1668-2337 RT: 20.00-28.00 AV: 670 NL: 7.57E4T: + c Full ms [ 95.00-355.00]
100 120 140 160 180 200 220 240 260 280 300 320 340m/z
0
5
10
15
20
25
30
35
40
45
50
55
60
65
70
75
80
85
90
95
100
Re
lativ
e A
bun
danc
e
135.1
109.1 121.1
147.1
97.0313.1123.1
232.1149.1145.1 255.1
353.1161.1111.0175.1 189.1107.1 133.1
273.1260.0
159.1 299.1185.1 285.1
163.1 247.1213.1173.1
311.1 326.1191.1 339.1199.1 227.1 283.1239.0203.1 269.1 297.1
340.0325.1
286.1 300.1 337.1 351.1

34 Chapter 5 Thermal Desorption Analysis
Figure 17. TPD run of DDT, DDE, and DDD on sediment sample at selected ion mass
Figure 18. Spectrum of TPD run of DDT, DDE, and DDD on sediment sample at selected ion mass
Conclusions Based on the TPD analyses, DDE may be less bound to clayey sediments than
DDT. However, this binding is extremely difficult to assess quantitatively, mostly because the binding is so tight that in most cases no desorption was observed. DDT, DDE, and DDD sorb too strongly to swelling clays and organic materials to make TPD useful for sediment contaminant characterization, except to say that they do in fact sorb strongly.
RT: 0.00 - 37.01
0 2 4 6 8 10 12 14 16 18 20 22 24 26 28 30 32 34 36Time (min)
0
20
40
60
80
1000
20
40
60
80
100
Rel
ativ
e A
bund
anc
e
0
20
40
60
80
10036.91
34.5029.94
33.1931.9627.28
31.5019.91 28.8423.59 24.3920.9019.0815.84
1.07 3.09 15.5912.105.47 11.188.997.72
29.46 36.32
32.92
28.76 33.1632.71 35.0931.3126.58
27.2026.1022.7421.3916.65 20.271.32 16.091.98 13.035.902.53 11.7710.149.44
34.88
34.7233.2736.32
28.60 31.6926.8825.85
20.3019.47 24.4421.261.10 18.9715.3414.2412.557.224.882.92 10.238.17
NL:7.75E2
m/z= 245.5-246.5 MS 051601
NL:8.63E2
m/z= 234.5-235.5 MS 051601
NL:4.78E2
m/z= 317.5-318.5 MS 051601
051601#934-1232 RT: 25.99-33.99 AV: 299 NL: 3.81E3T: + c Full ms [ 50.00-650.00]
50 100 150 200 250 300 350 400 450 500 550 600 650m/z
0
5
10
15
20
25
30
35
40
45
50
55
60
65
70
75
80
85
90
95
100
Re
lativ
e A
bu
nd
an
ce
55.0
95.091.0
67.0
79.0
105.0
115.0 129.0
131.0
149.0
165.1
171.1
189.1213.1
233.1 253.1326.1300.0
350.2 446.1358.2 382.1 461.0 485.3 535.1 582.6 624.7 649.0
Chapter 6 X-Ray Diffraction Analysis 35
6 X-Ray Diffraction Analysis
Introduction
This chapter presents and documents the results of XRD analysis on the Little Sunflower River sediment. The importance of the XRD analysis experimental approach, and the mineralogy of the Little Sunflower River sediment are discussed. This work was conducted by the Concrete and Material Branch, GSL.
X-rays are electromagnetic radiation of wavelength about one Å (10-10 m), which is about the size of an atom. X-rays occur in that portion of the electromagnetic spectrum between gamma rays and the ultraviolet. X-ray diffraction (XRD) is used for the fingerprint characterization of crystalline materials and the determination of their structure. Each crystalline solid has its unique characteristic X-ray powder pattern, which may be used as a "fingerprint" for its identification. Once the material has been identified, X-ray crystallography may be used to determine its structure. XRD is one of the most important characterization tools used in solid state chemistry and materials science.
Objectives
The objectives of the XRD were to physically and chemically characterize the sediment by correlating DDT associations with the locations in the sediment cores. XRD was expected to be an excellent tool to determine the sequestration and bioavailability of DDT on geosorbents.
Experimental Approach
Top, middle, and bottom core samples from location 2 collected from the Little Sunflower River were used for this study. In preparation for XRD analysis of the Little Sunflower River sediment sample, a portion of the sample was ground in a mortar and pestle to pass a 45-µm mesh sieve (No. 325). Bulk sample random powder mounts were analyzed using XRD to determine the mineral constituents present in each sample. If other minerals were present, smaller size fraction samples would be analyzed and identified by XRD patterns. These samples were placed in an ethylene glycol atmosphere overnight at room temperature until XRD determination.

36 Chapter 6 X-Ray Diffraction Analysis
Results
The most common constituent in the Little Sunflower River sediment sample was quartz. The bulk pattern also indicated a significant fraction of the sample was comprised of phyllosilicates; including a smectite group phase, as well as illite or mica, and kaolinite (Figure 19). There also appears to be a small amount of cristobalite and sodium-feldspar present. The bulk pattern shows that the samples had a small, but finite amount of phyllosilicates present. To better analyze the phyllosilicates present, oriented samples of the less than 2-µm size fraction of each sample were prepared and XRD patterns were obtained. Figure 20 shows the XRD patterns in overlay plots for each locality for both the air-dried condition and after exposure to an ethylene glycol atmosphere. Other phases that were present in minor or trace amounts in all samples but are in greater concentration in the finer fractions include kaolinite, illite, and smectite. To determine if there was any expandable component in these fractions, each oriented sample was exposed to an ethylene glycol atmosphere. Smectite, if present in the sample, will expand to 1.7 nm (17 µm). Kaolinite and illite will not expand upon exposure to this compound. These data indicate that the clay fraction has a large component of expandable clays present. The stoichiometries of the minerals present in these samples will probably vary from those values indicated on the XRD patterns.
Figure 19. X-ray diffraction results
d=15
.351
7
d=10
.056
0
d=7.
1872
d=5.
0051
d=4.
5012
d=4.
2695
d=3.
7834
d=3.
6761
d=3.
5111
d=3.
3535
d=3.
2015
d=2.
9962
d=2.
8024
d=2.
5721
d=2.
4621
d=2.
3929
d=2.
2853
d=2.
2409
d=2.
1321
d=1.
9835
d=1.
8209
d=1.
8039
d=1.
6739
d=1.
6624
d=1.
5439
d=1.
5011
d=1.
4548
0
500
1000
1500
2000
2500
I(C
ount
s)
Quartz - SiO2Cristobalite - SiO2Montmorillonite-15A - Ca0.2(Al,Mg)2Si4O10(OH)2!4H2OIllite-2M#1 - (K,H3O)Al2Si3AlO10(OH)2Kaolinite-1A - Al2Si2O5(OH)4Albite - NaAlSi3O8
10 20 30 40 50 602-Theta(°)

Chapter 6 X-Ray Diffraction Analysis 37
Figure 20. XRD overlay plot
Conclusion
The Little Sunflower River sediment had a large component of expandable clays present. The sediment also had a trace amount of finer fractions such as kaolinite, illite, and smectite. Although a quantitative analysis of minerals present in the sediment was not performed, the presence of high-swelling clay may act to reduce the bioavailabilty of DDT, DDE, and DDD.
d=16
.824
9
d=10
.039
6
d=8.
6185
d=7.
1887
d=5.
6221
d=5.
0045
d=3.
5731
d=3.
3483
d=2.
8119
d=2.
3841
0
500
1000
1500
2000
Inte
nsity
(Cou
nts)
Montmorillonite-15A - Ca0.2(Al,Mg)2Si4O10(OH)2!4H2O
Illite-2M#1 - (K,H3O)Al2Si3AlO10(OH)2
Kaolinite-1A - Al2Si2O5(OH)4
5 10 15 20 25 30 35 402-Theta(°)

38 Chapter 7 Phospholipid Fatty Acid and Deoxyribonucleic Acid Analyses
7 Phospholipid Fatty Acid and Deoxyribonucleic Acid Analyses
Introduction
This chapter presents and documents the results of an ester-linked phospholipid fatty acid (PLFA) and deoxyribonucleic acid (DNA) analysis on the Little Sunflower River sediment. This chapter will also discuss the inherent microbial community and potential biodegradation potential in the Little Sunflower River sediment. This work was conducted by the Environmental Processes and Environmental Risk Assessment Branches, EPED.
The analysis of PLFA’s and their use in defining microbial communities associated with organic contaminant degradation has a 20-year history (White and Ringelberg 1998). This quantitative technique, which examines cell membrane constituents, provides a quantitative measure of viable microbial biomass in environmental samples as well as a “fingerprint” of the in situ microbial community structure (White et al. 1996). This is based on the fact that ubiquitous phosphatase enzymes rapidly remove phosphate groups from phospholipids upon cell lysis and death.
PLFA analysis indicates microbial community structures and microbial biomass, but does not indicate if the microbial community can degrade the target contaminant. One way to determine this is to analyze for the production of genes by the inherent sediment bacteria related to the biodegradation of DDT. This can be accomplished by use of a multiplex polymerase chain reaction (PCR) approach designed to determine the multiple numbers of biodegradative gene copies present in a single sample. Gene sequences are typically selected for their relationship to a particular biodegradation pathway or toward a general assessment of multiple biodegradative pathways. The identification of a catabolic gene sequence in a DNA extract does not indicate the gene is being actively expressed, but indicates intrinsic biodegradation potential of the contaminated material (Langworthy 1998). Recent studies showed phenotype and genetic potential of the extant microbiota can be used to assess the intrinsic biodegradative potential of the sediment (Talley 2000).

Chapter 7 Phospholipid Fatty Acid and Deoxyribonucleic Acid Analyses 39
Objective
The objective of these experiments was to apply microbial ecology techniques to assess the capability of indigenous microorganisms to degrade DDT in the Little Sunflower River sediment and agricultural soil. PLFA analysis was used to determine the level of microbial biomass present in samples of Little Sunflower River sediment and to provide information on sedimentary microbial community structure. DNA analysis was used to determine the presence of genes known to be involved in aromatic organic contaminant degradation.
Experimental Approach
Top, middle, and bottom core samples from location 2 collected from the Little Sunflower River were chemically characterized for contaminant concentration. The sediment was also biologically characterized for microbial biomass and community structure. Cell membrane lipids, PLFA and PRC, were extracted with solvent. The extracts were analyzed by gas chromatography and mass spectrometry (GC/MS).
Materials and Methods
Microbial community biomass and community composition
Total lipid fractions were extracted from Little Sunflower River sediment samples using a modified Bligh/Dyer extraction method (White and Ringelberg 1998), and separated into nonpolar, glycolipid and polar lipid fractions using amino-propyl solid phase extraction columns. Phospholipid fatty acids methyl esters (PLFAME) from the polar lipid fraction were prepared for GC/MS by mild alkaline methanolic transesterification. Mixtures of PLFAME were resolved using a capillary gas chromatography. Column peaks were detected, quantified, and identified using a mass selective detector with electron impact ionization at 70eV. Areas under the peaks were converted to concentrations that were normalized to the gram weight extracted for biomass determinations. For community comparisons, the percent contribution of each peak was calculated and then normalized using an arcsine transformation. Multivariate PLFAME profiles of the sediment samples were compared using principal component numerical analysis.
Contaminant degradative potential
The Little Sunflower River sediment samples were analyzed for the numbers of copies of genes related to the biodegradation of DDT by using a multiplex PCR approach. Eleven genes were examined in the PCR assay: mercury reductase (merR and merP); toluene 1,2 dioxygenase (todC1); alkane dehydrogenase (alkB); toluene monooxygenase (tmoA); 16S ribosomal RNA gene; NAD (P) H dependent nitroreductase (nfsB/nfnB); dissimilatory sulfite

40 Chapter 7 Phospholipid Fatty Acid and Deoxyribonucleic Acid Analyses
reductase (dsrB); 2-nitrotoluene reductase (ntdAc); biphenyl dioxygenase/benzene 1,2-dioxygenase; catechol 2,3-oxygenase (xylE); and atrazine chlorohydrolase (atzA and atzB). Detection limits of the assay are approximately 1.0 E+04 to 1.0E+06 cells/g soil (wet weight). Total DNA was isolated from seeded soil into a final volume of 50 ul. Borneman et al. (1996) describe extracting 500 mg of triplicate subsamples from each sediment sample using a mini-beadbeater and a FastDNA SPIN (BIO 101, Vista, CA). Multiplex PCR reactions were performed using 1 µl of sediment DNA extract, or an equivalent of 10-mg sediment per analysis, as described in Ringelberg et al (2001). A positive control consisting of a DNA extract from soil containing biphenyl and catechol degrading bacteria was also amplified.
For comparison, the minimal detectable number of target genes was determined by a semi-quantitative replicative limiting dilution approach. Each of the three soil sub-sample DNA extracts was serially diluted tenfold. Serial dilutions were then amplified by multiplex PCR. Samples were scored for the greatest dilution at which a band is observable. To compensate for heterogeneous distribution of bacteria, a gene was scored as detectable if at least two of the three replicate soil sub-sample extracts had the correct band. The dilution factor at which a band is last seen is then considered the minimum detectable copy number for the gene in question. Values were not corrected for inhibition of PCR by the sediment extract. PCR products were analyzed using an ABI 377 automated DNA sequencer using standard ABI protocols (PE Biosystems). Sizes of multiplex PCR products were estimated from comparison to gene standards and size standards.
Results and Discussion
Microbial community biomass and community composition
The total microbial biomass in each sample of the Little Sunflower River sediment was calculated (Table 4). The top core, which is at the sediment-water interface, showed the most biomass and number of cells per gram dry weight (cells/gdw) of sediment compared to the lower cores at the same location. Typically, bacterial cell numbers rapidly fall after the first meter or so of depth in the soil depending on local conditions. Biomass was calculated on the basis of 1 pmole PLFAME. The level of biomass for the top core was equivalent to roughly 2 x 10⁸ bacterial cells (Balkwill et al. 1988), which is normal for surface sediments. Most sediment-water interfacial sediments analyzed at ERDC ranged from 107 to 1010 bacterial cells per gdw of sediment. Although exceptions are known, low levels of microbial biomass are generally not very conducive to contaminant biodegradation.
Table 4 Biomass of Microorganisms in Little Sunflower River Sediment Sample Location pmoles PLFA/gdw Cells x 106/gdw
A Top of Core 8,421 168.4 B Middle of Core 3,164 63.3 C Bottom of Core 5,063 101.3

Chapter 7 Phospholipid Fatty Acid and Deoxyribonucleic Acid Analyses 41
The PLFAME profiles of the Little Sunflower River sediment samples (Table 5) show gram-negative bacteria dominated the biomass in this sediment. This was indicated by the high relative abundances of straight-chained saturated (i.e., 16:0) and monounsaturated (i.e., 16:1w7c) 16-carbon fatty acids. Sulfate-reducing bacteria and others that use branched-chain initiators for fatty acid biosynthesis were present in these sediments to a lesser extent as indicated by iso and anteiso methyl branched fatty acids. PLFAME structures were determined by mass fragmentograms derived from positive ion, electron impact mass spectrometry. Minor peaks known to be fatty acid methyl esters by the presence of the m/z 74 ion, but with insufficient material to completely identify their structures, were indicated by “?” in Table 5.
Table 5 PLFAME Profiles of Little Sunflower River Sediment Microbial Community Composition
PFLAME Little Sunflower River, pmole/g PFLAME Little Sunflower River, pmole/g
ID Retention Time A B C ID Retention Time A B C
12:0 11.751 7 0 0 17:0 23.455 67 4 22 ? 12.698 11 0 0 2Me17:0 23.518 73 0 26 ? 13.411 26 0 0 ? 25.007 0 0 19 ? 14.728 48 9 13 polybrch 20c 25.24 244 27 80 iso14:0 14.914 114 17 30 ? 25.392 291 38 123 14:0 15.735 219 47 104 18:2w6 25.482 63 0 34 iso15:0 17.222 478 81 153 18:1w9 25.569 272 137 170 anteiso 15:0 17.406 604 117 225 18:0 26.198 318 74 171 ? 17.953 29 11 12 ? 27.242 21 0 0 15:0 18.137 85 18 32 ? 27.800 0 11 0 ? 18.298 39 0 0 cyc 19:0 28.469 151 36 59 3meth15:0 18.544 103 14 56 polyunsat 20 29.574 0 19 22 iso 16:0 19.761 261 47 88 polyunsat 20 30.912 0 0 29 16:1w7c 20.133 1126 1046 1133 20:0 31.616 61 23 34 16:01 20.268 64 40 80 ? 33.983 36 0 20 16:1w9 20.401 105 51 68 21:0 34.221 64 34 0 ? 20.523 78 0 50 ? 35.188 0 0 33 16:0 20.738 2503 1004 1646 ? 35.592 0 0 57 ? 21.406 69 41 50 ? 36.088 0 0 18 10Me16:0 21.881 292 79 125 22:0 36.788 77 32 71 iso 17:0 22.438 131 17 46 24:0 41.636 31 14 28 anteiso 17:0 22.652 190 26 52 cyc 17:0 22.958 70 50 84 Total 8,421 3,164 5,063
Notes: 1. A, B, C denote top, middle, and bottom core samples, respectively. 2. "?" denotes no identification was possible.
The PLFAME data presented in Table 5 were normalized to molar percentages, transformed and subjected to a Principal Component Analysis to visualize trends in the multivariate microbial community profiles. PLFAME data from PAH-contaminated sediment from Harbor Point, NY was included in the analysis providing a point for comparison. Figure 21 compares the sample cores on the first two principal components. The figure reveals the microbial communities in the three depths of Little Sunflower River sediment were similar and all were different from the microbial community of the Harbor Point sediment. The Harbor Point sediment also contained approximately 100 times more microbial biomass than the Little Sunflower River sediment samples. However, this quantitative difference was not reflected in this analysis because

42 Chapter 7 Phospholipid Fatty Acid and Deoxyribonucleic Acid Analyses
the PLFAME data were converted to relative abundances of each PLFAME (i.e., molar percentages) before analysis.
Figure 21. PLFAME comparison of Little Sunflower River and Harbor Point sediments
Contaminant degradative potential
Cometabolism of the DDT breakdown product, DDE, has been demonstrated in a biphenyl degrading bacteria. Detection of these genes in sediment was used to suggest potential for DDE degradation (Hay and Focht 1998; Aislabie et al. 1999).
DNA was isolated from all three Little Sunflower River samples in amounts consistent with the 106 cells/gdw sediment levels derived from the PLFAME data. However, after repeated DNA extraction and amplification attempts, no PCR products for any of the targeted contaminant degradation genes were detected. The positive controls for the extractions and amplification procedures were positive. The gene coding sulfite reductases (i.e., bacterial sulfate reduction) was the only gene detectable from the samples (note that this was only seen in the composite sample). If the Little Sunflower River sediment microbial community were geared for aromatic contaminant (e.g., DDT and DDE) degradation, one would expect multiple copies of the targeted genes to be present in the 106 cells/gram of Little Sunflower River sediment. This situation would have been detectable with the molecular methods. Since the Little Sunflower River did contain a 106 population in its sediment and common aromatic contaminant-degrading genes were not detected in this sediment, the potential for DDT and DDE biodegradation in the sediment is low. This sediment may require augmentation to achieve effective DDT and DDE biodegradation. On the other hand, DDT and DDE may not be available in the Little Sunflower River sediment for the resident microorganisms to degrade.

Chapter 7 Phospholipid Fatty Acid and Deoxyribonucleic Acid Analyses 43
Conclusions
The PLFAME analysis indicated the surface-level core of Little Sunflower River sediment contained an average microbial community biomass dominated by gram-negative microorganisms. Gram-negative microorganisms like pseudomonades are opportunists that compete well in disturbed environments. They are commonly found in environments contaminated with aromatic pollutants because they contain and readily acquire plasmids-coding enzymes that attach aromatic rings. Therefore, the microbial community in the Little Sunflower River sediment samples might be specialized and efficient in degrading aromatic contaminants.
Common aromatic contaminant-degrading genes were not detected in the Little Sunflower River sediment samples, which may indicate that the potential for DDT and DDE biodegradation in the sediment is low. The possibility that the inherent microbial community in the Little Sunflower River sediment can bioremediate DDT and DDE contamination cannot be ruled out, however. DDT was only present in the top sediment cores from the Little Sunflower River, with increasing DDE and DDD concentrations at increased depth. These chemical results may indicate reductive transformation of DDT at different levels in the sediment. Dechlorination of heavily chlorinated compounds, such as polychlorinated biphenyls, is the first step in bioremediation pathways of these compounds. Chlorinated compounds must often be dechlorinated before bacteria can metabolize them and cleave the contaminant’s aromatic rings. Gene probes were not included in the study that directly coded dechlorination, although genes coding sulfite reductases, which have been indicated in some studies to indicate dechlorination, were detectable from the composite sample. The microbial community in the Little Sunflower River sediment may be taking the first steps in degrading the contaminant.

44 Chapter 8 Sediment Toxicity Bioassay
8 Sediment Toxicity Bioassay
Introduction
This chapter presents and documents the results of a bioaccumulation and toxicity test performed using freshwater organisms to evaluate the toxicity of the Little Sunflower River sediment. This section will also discuss the potential for bioaccumulation of organochorine pesticides. This work was conducted by the Environmental Risk Assessment Branch, EPED.
Objective
The objective of the sediment toxicity bioassays was to provide information on the potential for adverse biological effects and bioaccumulation. Standardized sediment toxicity and bioaccumulation tests were used.
Experimental Approach
Bioaccumulation and toxicity testing were conducted using Little Sunflower River and Brown's Lake sediments. Test methodology followed recommendations from the U.S. EPA (2000) guidance document “Methods for Measuring the Toxicity and Bioaccumulation of Sediment-associated Contaminants with Freshwater Invertebrates” (EPA/600/R-99/064). Tissue samples collected at termination of the bioaccumulation test were sent to ECB for chemical analysis. Total lipid analysis was conducted of the exposed animals using a colorimetric method tailored for small invertebrates. Upon receiving body residue data, Biota-Sediment Accumulation Factors (BSAFs) were calculated for all nonpolar organic contaminants present in both the sediment and the tissues. Survival and growth data from the toxicity test were provided. Performance control sediment (Brown's Lake) was used in both tests to assess the quality of the test organisms and exposure conditions. In addition, a reference toxicant test was conducted with Hyalella azteca (H. azteca) and Lumbriculus variegatus (L. variegatus) and water quality parameters were monitored throughout the experiment.

Chapter 8 Sediment Toxicity Bioassay 45
Methods and Materials Test sediment collection
Test sediment was collected from the Little Sunflower River during March 2001. Chapter 2 describes core sample locations and sampling techniques. Sediment cores were composited at HWRC and delivered to EERT for testing (Chapter 4). EERT stored the sediment samples at 5-6º C prior to testing.
Control sediment collection
Sediment used as the control sediment was collected from Brown’s Lake located on the property of the ERDC site in Vicksburg, MS. Sediment was collected using a hand shovel, collecting approximately the top 10 cm of the sediment. The sediment was placed in 5-gal (19-L) containers and stored at 5-6º C until testing. Analytical chemistry was conducted on the sediment in the spring of 2000. Brown’s Lake sediment was mainly silty material with 1.8 percent sand, 98.2 percent fines (clay and silt), and 0.65 percent TOC. Concentrations of PAHs, heavy metals, and pesticides were below detection level or at concentrations not associated with adverse effects to aquatic invertebrates (Table 6).
Table 6 Brown's Lake Sediment Physical and Chemical Analysis Total Organic Carbon 0.65% Pesticides ug/kg dry wt Particle Size Distribution Gravel 0.0% A-Benzene Hexachloride <1.46 1.8% B-Benzene Hexachloride <1.46 Fines 98.2% G-Benzene Hexachloride <1.46 D-Benzene Hexachloride <1.46 PAHs ug/kg dry wt DDD <2.92 Naphthalene < 0.51 DDE <2.92 Acenaphthene < 0.51 DDT <2.92 Phenanthrene < 0.51 Heptachlor <1.46 Acenaphthylene < 0.51 Dieldrin <2.92 Fluorene < 0.51 A-Endosulfan <1.46 Anthracene < 0.51 B-Endosulfan <2.92 Fluoranthene < 0.51 Endosulfan sulfate <2.92 Pyrene < 0.51 Endrin <2.92 Chrysene < 0.51 Endrin aldehyde <2.92 Benzo(b)fluoranthene < 0.51 Heptachlor epoxide <1.46 Benzo(a)anthracene < 0.51 Methoxychlor <14.6 Benzo(k)fluoranthene < 0.51 Chlordane <14.6 Benzo(a)pyrene < 0.51 Toxaphene <14.6 Indeno(1,2,3-C,D)pyrene < 0.51 Dibenzo(A,H)anthracene < 0.51 PCBs (Arochlors) ug/kg dry wt. Benzo(G,H,I)perylene < 0.51 1016 <14.6 2-Methylnaphthalene < 0.51 1221 <14.6 1232 <14.6 Metals mg/kg dry wt 1242 <14.6 Arsenic 5.1 1248 <14.6 Cadmium 0.140 1254 <14.6 Chromium 8.99 1260 <14.6 Copper 11.1 Tetrachloro-m-xylene (surrogate) 76.6% Lead 11.8 Decachlorobiphenyl (surrogate) 70.3% Mercury <0.040 Silver 0.400 Zinc 40.8

46 Chapter 8 Sediment Toxicity Bioassay
Test and control water
Water used in the experiments, for both sediments, was dechlorinated tap water. This water was filtered through a glass fiber filter and then an activated carbon filter. Results of metals analysis are shown in Table 7.
Table 7 Chemical Analysis of Dechlorinated Water Metals Concentration (mg/l)
Antimony < 0.003
Arsenic < 0.002
Beryllium < 0.001
Cadmium < 0.0002
Chromium 0.003
Copper 0.001
Lead < 0.001
Mercury < 0.000005
Nickel < 0.001
Selenium < 0.002
Silver < 0.001
Tellurium < 0.002
Zinc < 0.01
Test organisms
L. variegatus was used in the 28-day bioaccumulation experiment and H. azteca in the 10-day toxicity experiment. Both organisms are cultured in the ERDC-EERT laboratory following standard operation procedures. Organisms are cultured in flow-through environmental chambers and fed three times weekly. Cultures were started using organisms originally obtained from the United States Geological Survey (Columbia, MO). L. variegatus are cultured in 20-L aquaria containing soaked brown paper towels as a substrate and food source. H. azteca are cultured in 20-L aquaria containing plastic webbed coil material for a substrate and are fed flake food and soft maple leaves. Water quality parameters (temperature, dissolved oxygen (DO), pH) were measured and recorded weekly, and toxicant reference tests were conducted monthly. A reference toxicant test was set up concurrent to each test to evaluate the health of the test organisms and suitability of the test conditions.
Bioaccumulation test
The USEPA (2000) L. variegatus 28-day bioaccumulation test for sediments (Test Method 100.3) was used to investigate organochlorine bioaccumulation from Little Sunflower River sediment. Three replicates of each sediment site were used because of the limited quantity of Little Sunflower River sediment. Tests were conducted under flow-through conditions in box aquaria (31.5x18x10.5 cm). Test and control sediments were added to each aquarium to achieve a final sediment thickness of 2.5 cm. A water splitter chamber delivered

Chapter 8 Sediment Toxicity Bioassay 47
test water provided by an automated water delivery system to the test chambers every 12 hr (1600 ml/cycle). At the initiation of the bioaccumulation test, organisms equaling 1 g of wet tissue were added to each chamber. Animals were not fed during the experiment. DO concentrations were maintained by slow aeration. Temperature was maintained at 23± 1ºC and the light:dark photo cycle was 16:8 using white light. Water quality parameters (conductivity, hardness, pH, alkalinity, ammonia, temperature and DO) were measured at test initiation and termination. Temperature and DO were monitored daily. At the end of the 28-day test period, test sediments were sieved to recover the worms. Surviving worms were placed in glass culture bowls for 6 hr to depurate the contents of their guts. The worms were then blotted dry, weighed and frozen at -20ºC for chemical and total lipid analysis. Lipid analysis was conducted using a method modified from Van Handel (1985). Tissue samples (whole individual worms) were homogenized in 4 ml of chloroform/methanol (1:1 v/v). Homogenates were transferred to 13x100 mm tubes and centrifuged for 10 min at 1000 g. After recording the total volume, 0.5 ml of the supernatant was transferred to a new 13x100-mm tube and placed in a heating block at 100°C until all the solvent had evaporated. Concentrated sulfuric acid (0.2 ml) was then added and the tubes were re-heated at 100°C for 10 min. After cooling, 4.8 ml of vanillin reagent was added. Vanillin reagent was prepared by dissolving 600 mg of vanillin in 100 ml of hot water and adding 400 ml of 85 percent phosphoric acid. After 5 min, samples were read in a spectrophotometer at 490 nm against a reagent blank. Lipid content was derived from a calibration line obtained using samples of 50, 100, 200, 300, and 400 µg of soybean oil and the procedure described above.
Data from body residue analysis were used to calculate BSAFs for nonpolar organic contaminants present in both animal tissue and sediment.
Toxicity test
The USEPA (2000) H. azteca 10-day survival and growth test using sediments (Test Method 100.1) was used to investigate the toxicity associated with Little Sunflower River sediment. Eight replicates each were tested for the Little Sunflower River sediment and compared to control sediment. The control sediment validates the toxicity test. No reference sediment was available for comparing the Little Sunflower River; therefore, the control sediment was used.
Toxicity tests were conducted utilizing a flow-through system. Water splitter chambers were placed over the 300-ml glass beakers and 2 L of test water (dechlorinated tap water) were delivered to the beakers every 12 hr. Each beaker contained 4.5 cm of homogenized sediment and ten 10-day-old amphipods. Animals were fed 1 ml (1.8 mg/ml) of YCT (mixture of yeast, cerophyll, and trout chow) daily. Initial and final water quality parameters for DO, pH, temperature, ammonia, conductivity, hardness, and alkalinity were determined. Temperature and DO (not to fall below 2.5 mg/L) was monitored daily. At the end of the 10-day test, sediments were sieved to recover the organisms and survival was documented. Initial and final animal image analyses were used to assess growth of the animals.

48 Chapter 8 Sediment Toxicity Bioassay
Reference toxicant test
Cadmium reference tests were conducted in conjunction with the bioaccumulation and toxicity tests using L. variegatus and H. azteca, respectively. Procedures of toxicant testing follow those from EPA guidelines. The tests were 96 hr in duration, using dechlorinated tap water as the water source. There was no renewal of water. Water quality parameters that were measured included hardness, alkalinity, conductivity, DO, and pH at test initiation and termination. Test chambers were 300-ml glass beakers with 10 animals per beaker. Three replicates per concentration were used and tests consisted of five treatments and a control. Animals are not fed during reference toxicant tests. The test endpoint was survival and test acceptability was 90 percent survival of organisms in the control treatments.
Statistical analysis
Trimmed Spearman Karber statistical software was used to calculate LC50
values for the reference toxicant tests. Student’s t-test was used to compare results from the toxicity and bioaccumulation test.
Results and Discussion
Chemical analyses
The concentrations of DDT, p,p’-DDD, p,p’-DDE, ∑DDT (total concentrations of DDT, DDD and DDE), and TOC in Little Sunflower River sediment are reported in Table 8. Concentrations of these compounds in control sediment were below the detection limit (Table 6). Whole-body tissue concentrations of pp-DDT, pp-DDD, pp-DDE and ∑DDT in L. variegatus exposed to Little Sunflower River sediment are reported in Table 9. The percent lipids in L. variegatus exposed to Little Sunflower River and control sediments measured at experiment termination are presented in Table 10. Mean TOC content in Little Sunflower River was 1.1 percent. Chemical analysis of sediment and tissue samples and organic carbon content determination were conducted by the ECB, EPED.
Table 8 Little Sunflower Composite Sediment Concentrations (µg/kg dry weight) Replicate DDT DDD DDE ∑DDT
1 12.9 32.2 74.8 119.9
2 17.4 38.2 85.2 140.8
3 18.5 39.1 83.2 140.8
Mean 16.3 36.5 81.1 133.8
Standard deviation 3.0 3.8 5.5 12.1

Chapter 8 Sediment Toxicity Bioassay 49
Table 9 Tissue Concentrations of DDT, DDD, DDE and ∑DDT in L. variegatus (µg/kg wet weight) Sediment Type Replicate DDT DDD DDE ∑DDT
1 8.9 98.3 548.0 665.2
2 12.5 144.0 784.0 940.5
3 7.4 60.2 402.0 469.6
Mean 9.6 100.8 578.0 668.4
Little Sunflower River
Standard deviation 2.6 42.0 192.8 237.2
1 < 5.03 < 5.03 10.1 20.2
2 < 5.03 < 5.03 10.8 20.9
3 < 5.03 < 5.03 12.5 22.6
Mean < 5.03 < 5.03 11.1 21.2
Brown's Lake
Standard deviation <5.00- <5.00- 1.2 <5.00-
Table 10 Percent Lipids in L. variegatus Replicate Little Sunflower River Brown's Lake
1 2.99 2.92
2 2.79 2.55
3 2.96 4.10
Mean 2.91 3.19
Standard deviation 0.11 0.81
Sediment toxicity
Mean survival in the H. azteca 10-day toxicity experiment was 86.2 percent for Little Sunflower River sediment (Table 11). Mean survival in control sediment was 95 percent. Mean survival in the control sediment was higher than the test acceptability requirement of 80 percent or higher (USEPA 2000), indicating that the testing conditions were adequate for the test species. No statistically significant differences in survival were found between the control and the Little Sunflower River sediments (p = 0.183, Table 12). Organism length at the end of the exposure period was used as an indicator of growth during the 10-day test period. Mean length of organisms exposed to the Little Sunflower River and Brown’s Lake sediments were 2.24 and 2.17, respectively (Table 11). No statistically significant differences in length were observed (p=0.598, Table 13). Initial and final water quality data for bioaccumulation and toxicity test are presented in Tables 14 and 15, respectively. Daily maintenance of DO and temperature for bioaccumulation and toxicity tests are presented in Tables 16 and 17, respectively.
The toxicity of DDT to H. azteca has been previously investigated using spiked sediments (Lotufo et al. 2001a). The 10-day LC50 for ∑DDT was 1,097 µg/kg (885–1,133; 95-percent confidence interval) or 182,833 µg/kg organic carbon (147,500- 188,833; 95-percent confidence interval). Therefore, low toxicity of H. azteca was expected given the low concentration of DDT and its major metabolites in the Little Sunflower River sediment.

50 Chapter 8 Sediment Toxicity Bioassay
Table 11 Percent Survival and Length of H. azteca Following 10-Day Toxicity Experiment
Sediment Type Replicate Percent Survival Mean + 1 SD length (mm)
1 50 2.28+0.38 2 100 2.15+0.31 3 100 2.61+0.45 4 80 2.11+0.34 5 80 2.21+0.18 6 90 1.91+0.18 7 100 2.14+0.39 8 90 2.47+0.27 Mean 86 2.24
Little Sunflower River
Standard deviation 17 0.26 1 90 1.66+0.35 2 100 2.47+0.07 3 100 2.09+0.10 4 90 2.09+0.25 5 100 2.32+0.34 6 90 2.01+0.26 7 90 2.37+0.19 8 100 2.35+0.56 Mean 95 2.17
Brown's Lake
Standard deviation 5 0.22
Table 12 Statistical Analysis (Student’s t-test) of H. azteca Survival Data Group Name Number Missing Mean Std Deviation SEM
Little Sunflower River 8 0 8.625 1.685 0.596
Brown's Lake 8 0 9.500 0.535 0.189
Notes: 1. Normality Test: Passed (P = 0.011). 2. Equal Variance Test: Passed (P = 0.178). 3. Difference: -0.875.4. t = -1.400 with 14 degrees of freedom (P = 0.183). 5. 95-percent confidence interval for difference of means: -2.215 to 0.465 6. The difference in the mean values of the two groups is not significant to reject the possibility that the difference is due to random sampling variability. Statistically, there is no significant difference between the input groups (P = 0.183). 7. Power of performed test with alpha = 0.050:0.141. 8. The power of the performed test (0.141) is below the desired power of 0.800. 9. The negative values should be interpreted cautiously.
Table 13 Statistical Analysis (Student’s t-test) of H. azteca Length Data Group Name Number Missing Mean Std Deviation SEM Little Sunflower River 8 0 2.235 0.262 0.0925 Brown's Lake 8 0 2.170 0.220 0.0778 Notes: 1. Normality Test: Passed (P > 0.200). 2. Equal Variance Test: Passed (P = 0.517). 3. Difference: -0.0653. 4. t = -0.540 with 14 degrees of freedom (P = 0.598). 5. 95 percent confidence interval for difference of means: -0.325 to 0.194. 6. The difference in the mean values of the two groups is not significant to reject the possibility that the difference is due to random sampling variability. Statistically, there is no significant difference between the input groups (P = 0.598).

Chapter 8 Sediment Toxicity Bioassay 51
Table 14 28-day Bioaccumulation Test Water Quality Results (L. variegatus) Sediment Type
Repl No. DO mg/l pH NH3 mg/l Alkalinity mg/l
Hardness mg/l
Conductivity µmhos
Temperature 0C
Initial Final Initial Final Initial Final Initial Final Initial Final Initial Final Initial Final
1 6.1 5.7 8.10 7.54 <1 <1 218 212 100 130 304 150 22 21
2 5.9 5.9 7.85 7.53 <1 <1 214 208 110 120 304 149 22 21
Little Sunflower River
3 6.0 5.8 8.13 7.55 <1 <1 216 207 134 120 308 150 22 21
1 6.5 6.0 7.99 7.79 <1 <1 100 110 116 130 298 * 22 21
2 6.3 6.1 8.23 7.81 <1 <1 100 110 116 120 293 167 22 21 Brown’s Lake
3 6.2 6.0 8.26 7.72 <1 <1 100 110 112 120 299 162 22 21
* Parameters not measured.
Table 15 10-Day Toxicity Test Water Quality Results (H. azteca) Sediment Type
Repl No. DO mg/l pH NH3 mg/l Alkalinity mg/l
Hardness mg/l
Conductivity µmhos Temperature 0C
Initial Final Initial Final Initial Final Initial Final Initial Final Initial Final Initial Final
1 8.0 6.0 7.29 7.39 <1 <1 88 100 84 110 218 212 22 22.2
2 6.7 6.1 7.38 7.38 * <1 * * * * 214 208 21 22.1
3 7.5 6.2 7.36 7.39 <1 <1 88 90 80 90 216 207 21 22.1
4 7.8 6.2 7.29 7.36 * <1 * * * * 220 211 21 22.2
5 6.0 6.1 7.31 7.37 <1 <1 88 110 80 90 222 208 22 22.0
6 6.5 6.2 7.30 7.36 * <1 * * * * 219 208 21 22.0
7 7.6 6.4 7.31 7.35 <1 <1 88 110 70 80 202 208 22 22.1
Little Sunflower River
8 6.5 6.0 7.25 7.31 * <1 * * * * 214 204 21 22.0
1 6.4 7.5 7.90 7.82 <1 <1 108 * 100 * 217 196 22 22.2
2 7.8 7.5 7.97 7.77 * <1 * * * * 215 194 22 22.1
3 7.7 7.3 8.02 7.79 <1 <1 112 * 80 * 223 191 22 21.9
4 7.0 7.0 8.02 7.81 * <1 * * * * 238 195 22 22.0
5 7.8 7.0 8.15 7.80 <1 <1 104 80 80 80 218 195 22 21.9
6 7.4 7.0 7.94 7.79 * <1 * * * * 217 196 22 22.0
7 6.2 6.9 8.01 7.76 <1 <1 104 110 80 110 217 193 22 21.9
Brown’s Lake
8 7.8 7.4 8.16 7.82 * <1 * * * * 218 196 22 21.9
*Parameters not measured.

52 Chapter 8 Sediment Toxicity Bioassay
Table 16 28-day Bioaccumulation Test Daily DO and Temperature of Little Sunflower River and Brown’s Lake Sediments
Little Sunflower River Brown’s Lake Day Aquaria No. DO (mg/L) Temp (0C) Aquaria No. DO (mg/L) Temp (0C)
1 3.5 22 1 4.8 22 2 3.2 22 2 4.9 22 1 3 3.2 22 3 4.9 22 1 5.4 23 1 5.9 23 2 5.4 23 2 5.9 23 2 3 5.9 23 3 6.1 23 1 4.8 22 1 5.1 22 2 4.9 22 2 5.1 22 3 3 5.1 22 3 5.2 22 1 4.8 22 1 4.8 22 2 4.5 22 2 4.5 22 4 3 4.5 22 3 4.5 22 1 6.2 23 1 6.3 23 2 6.0 23 2 6.3 23 5 3 6.2 23 3 6.3 23 1 6.4 23 1 6.9 23 2 6.8 23 2 6.8 23 6 3 6.5 23 3 6.9 23 1 5.1 22 1 6.1 22 2 5.2 22 2 6.0 22 7 3 5.1 22 3 6.0 22 1 5.4 22 1 6.4 22 2 5.4 22 2 6.4 22 8 3 5.2 22 3 6.4 22 1 5.8 23 1 6.9 23 2 5.9 23 2 6.8 23 9 3 5.8 23 3 6.9 23 1 6.2 22 1 7.0 23 2 5.8 23 2 7.0 23 10 3 5.8 23 3 6.8 23 1 6.0 22 1 6.4 22 2 5.7 22 2 6.6 22 11 3 5.7 22 3 6.3 22 1 5.8 22 1 6.5 22 2 5.8 22 2 6.5 22 12 3 5.7 22 3 6.5 22 1 6.0 22 1 6.0 22 2 6.0 22 2 6.5 22 13 3 5.0 22 3 6.0 22 1 6.0 22 1 5.8 22 2 6.0 22 2 6.0 22 14 3 6.0 22 3 5.0 22 1 6.2 22 1 6.0 22 2 5.4 22 2 6.5 22 15 3 5.4 22 3 6.4 22 1 5.2 22 1 6.5 21 2 5.6 22 2 6.4 21 16 3 5.6 22 3 6.5 21 1 5.2 22 1 4.8 22 2 5.1 22 2 4.5 22 17 3 5.0 22 3 5.0 22 1 6.0 22 1 6.2 22 2 5.3 22 2 6.5 22 18 3 5.5 22 3 6.8 22
Continued

Chapter 8 Sediment Toxicity Bioassay 53
Table 16 (Concluded) Little Sunflower River Brown’s Lake
Day Aquaria No. DO (mg/L) Temp (0C) Aquaria No. DO (mg/L) Temp (0C)
1 5.5 22 1 5.5 23 2 6.2 22 2 5.5 22 19 3 6.2 22 3 6.0 22 1 6.2 22 1 5.8 22 2 6.2 22 2 6.0 22 20 3 6.2 22 3 6.5 22 1 6.0 22 1 6.0 22 2 6.0 22 2 6.5 22 21 3 5.5 22 3 6.2 22 1 5.5 22 1 6.2 22 2 5.5 22 2 6.5 22 22 3 5.5 22 3 6.5 22 1 5.0 21 1 6.5 21 2 5.0 21 2 6.5 21 23 3 5.2 21 3 6.0 21 1 5.3 21 1 6.4 21 2 5.3 21 2 6.4 21 24 3 5.3 21 3 6.3 21 1 6.5 21 1 6.5 21 2 6.2 21 2 6.3 21 25 3 6.5 21 3 6.5 21 1 4.5 21 1 4.6 20 2 4.6 21 2 4.5 20 26 3 4.5 21 3 4.6 21 1 4.6 21 1 4.5 21 2 4.0 21 2 5.0 21 27 3 4.8 21 3 5.0 21 1 5.7 21 1 6.0 21 2 5.9 21 2 6.1 21 28 3 5.8 21 3 6.0 21

54 Chapter 8 Sediment Toxicity Bioassay
Table 17 10-day Toxicity Test Daily DO and Temperature of Little Sunflower River and Brown’s Lake Sediments
Little Sunflower River Brown’s Lake Day Aquaria No. DO (mg/L) Temp (0C) Aquaria No. DO (mg/L) Temp (0C)
1 5.1 22 2 4.5 23
3 5.2 22 4 5.0 22
5 5.0 22 6 5.0 22 1
7 4.8 22 8 5.1 22
2 7.8 22 1 7.7 22
4 7.8 21 3 7.9 22
6 7.5 22 5 7.2 22 2
8 7.8 22 7 7.9 22
1 7.5 23 2 7.5 23
3 7.9 23 4 7.9 22
5 7.9 23 6 7.9 23 3
7 7.9 23 8 7.8 22
2 6.5 22 1 7.6 22
4 6.4 22 3 7.1 22
6 6.5 22 5 6.8 22 4
8 6.6 22 7 7.1 22
1 4.8 22 2 4.5 22
3 4.7 22 4 5.0 22
5 4.5 22 6 5.0 22 5
7 4.8 22 8 4.8 22
2 5.2 22 1 5.8 22
4 4.8 22 3 6.0 22
6 4.8 22 5 6.0 22 6
8 4.8 22 7 6.0 22
1 6.2 23 2 6.7 22
3 6.0 22 4 5.6 22
5 6.0 22 6 6.0 23 7
7 6.0 23 8 6.1 22
2 6.6 23 1 6.6 22
4 6.5 23 3 6.6 23
6 6.2 22 5 6.8 23 8
8 6.3 23 7 6.2 23
1 5.7 23 2 6.6 23
3 5.8 23 4 6.6 23
5 5.7 23 6 6.6 23 9
7 5.7 23 8 6.6 23
2 6.1 22 1 7.5 22
4 6.2 22 3 7.3 22
6 6.2 22 5 7.0 22 10
8 6.0 22 7 6.9 22

Chapter 8 Sediment Toxicity Bioassay 55
Bioaccumulation
The mean sediment concentrations were normalized to organic carbon content and the mean tissue concentrations were normalized to lipid content for DDT, DDD, DDE and ∑DDT (Table 18). BSAFs were calculated using tissue and sediment DDT-molar-equivalents concentrations measured at experiment termination as:
( )( )
tissue concentration g / kg lipidsBSAF
sediment concentration g / kg organic carbon
µ=
µ (1)
BSAF values calculated for L. variegatus exposed to Little Sunflower River sediment are presented in Table 18. BSAF values were highest for DDE, followed by DDD and DDT. BSAF values for DDT and DDE derived for aquatic invertebrates in sediment exposures are presented in Table 19. The Little Sunflower River mean BSAF value for DDT (0.22) and for DDD (1.01) are within the range of BSAFs obtained in previous studies for this class of compounds using field-collected sediments. The mean BSAF values for DDE (2.72) and ∑DDT (1.96) obtained in this study were within the range of BSAFs obtained for DDT using spiked sediments. These values were higher than the theoretical maximum value of 1.7 (McFarland and Clarke 1986). Biotransformation of DDT to DDD or DDE has been observed in benthic invertebrates (Lotufo et al. 2000a, Lotufo et al. 2000b) and may have contributed to differences in BSAFs between DDT and DDD or DDE. Although the biotransformation of DDT in L. variegatus has not been investigated, it is unlikely to have occurred at a great extent since these organisms are poor metabolizers of polycyclic aromatic hydrocarbons (Harkey et al. 1994) and PCBs (Fisher et al. 1999). The BSAF of ∑DDT is the best indicator for the overall bioavailability of ∑DDT in Big Sunflower River sediment. Biotransformation of DDT to DDD or DDE has been observed in benthic invertebrates (Lotufo et al. 2000; Lotufo, Farrar, and Bridges 2000); and may have contributed to differences in BSAFs between DDT and DDD or DDE. Although the biotransformation of DDT in L. variegatus has not been investigated, it is unlikely to have occurred at a great extent since these organisms are poor metabolizers of PAH (Harkey, Landrum, and Klaine 1994) and PCBs (Fisher, Chordas, and Landrum 1999). The BSAF of ∑DDT is the best indicator for the overall bioavailability of ∑DDT in Little Sunflower River sediment. This value was exceedingly high, indicating higher than expected bioavailability in the tested sediment.
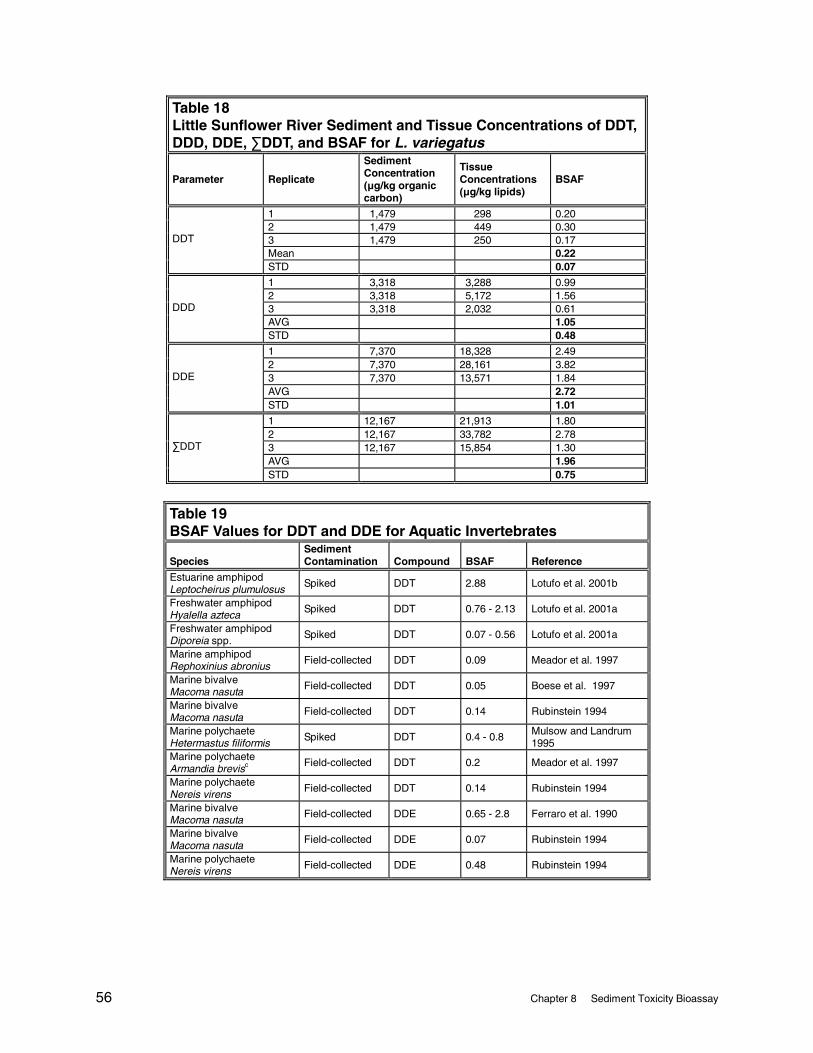
56 Chapter 8 Sediment Toxicity Bioassay
Table 18 Little Sunflower River Sediment and Tissue Concentrations of DDT, DDD, DDE, ∑DDT, and BSAF for L. variegatus
Parameter Replicate
Sediment Concentration (µg/kg organic carbon)
Tissue Concentrations (µg/kg lipids)
BSAF
1 1,479 298 0.20 2 1,479 449 0.30 3 1,479 250 0.17 Mean 0.22
DDT
STD 0.07
1 3,318 3,288 0.99 2 3,318 5,172 1.56 3 3,318 2,032 0.61 AVG 1.05
DDD
STD 0.48
1 7,370 18,328 2.49 2 7,370 28,161 3.82 3 7,370 13,571 1.84 AVG 2.72
DDE
STD 1.01
1 12,167 21,913 1.80 2 12,167 33,782 2.78 3 12,167 15,854 1.30 AVG 1.96
∑DDT
STD 0.75
Table 19 BSAF Values for DDT and DDE for Aquatic Invertebrates
Species Sediment Contamination Compound BSAF Reference
Estuarine amphipod Leptocheirus plumulosus
Spiked DDT 2.88 Lotufo et al. 2001b
Freshwater amphipod Hyalella azteca
Spiked DDT 0.76 - 2.13 Lotufo et al. 2001a
Freshwater amphipod Diporeia spp.
Spiked DDT 0.07 - 0.56 Lotufo et al. 2001a
Marine amphipod Rephoxinius abronius
Field-collected DDT 0.09 Meador et al. 1997
Marine bivalve Macoma nasuta
Field-collected DDT 0.05 Boese et al. 1997
Marine bivalve Macoma nasuta Field-collected DDT 0.14 Rubinstein 1994
Marine polychaete Hetermastus filiformis Spiked DDT 0.4 - 0.8 Mulsow and Landrum
1995 Marine polychaete Armandia brevisc
Field-collected DDT 0.2 Meador et al. 1997
Marine polychaete Nereis virens Field-collected DDT 0.14 Rubinstein 1994
Marine bivalve Macoma nasuta
Field-collected DDE 0.65 - 2.8 Ferraro et al. 1990
Marine bivalve Macoma nasuta Field-collected DDE 0.07 Rubinstein 1994
Marine polychaete Nereis virens Field-collected DDE 0.48 Rubinstein 1994

Chapter 8 Sediment Toxicity Bioassay 57
Expected biological effects
Evaluating the environmental consequences of contaminant bioaccumulation is a complex technical and regulatory problem. In part, this complexity results from the fact that bioaccumulation is a measurable phenomenon, rather than an effect. Merely identifying the presence of a chemical substance in the tissues of an organism, for example, following a bioaccumulation test, is not sufficient information to conclude that the chemical will produce an adverse effect. All chemical substances have the potential to produce adverse effects (i.e., toxicity). Contaminant-specific information must be used to determine the potential for a bioaccumulated substance to produce adverse effects. Critical body residues, i.e., whole-body concentrations that have associated with adverse biological effects, may be used for hazard evaluation of bioaccumulating data from laboratory exposure to field-collected sediments. Lethal body residues (LR50) for ∑DDT have been determined for a variety of aquatic invertebrate species, including freshwater and estuarine amphipods, freshwater oligochaetes, marine polychaetes, and estuarine copepods (Table 20). Amphipods, both freshwater and estuarine, were substantially more sensitive to DDT than other invertebrates. Studies of the relative toxicity of DDT, DDD, and DDE have demonstrated considerable differences in the toxicity of these compounds to freshwater amphipods. DDT was substantially more toxic than DDD or DDE to both H. azteca and Diporeia spp. (Hoke et al. 1994; Lotufo et al. 2000). Therefore, DDT, DDD, and DDE should not be considered dose-additive and the relative amount of these compounds should be taken into account to assess risk. Table 21 shows the LR50 for DDT, DDD and DDE for H. azteca (Lotufo et al. 2000). Sublethal effects on growth were not observed with H. azteca and sublethal effects of DDT on growth and reproduction were not observed with the estuarine amphipod L. plumulosus (Lotufo et al. 2001b). The LR50 of DDT for L. plumulosus (Table 19) was similar to that observed for H. azteca, suggesting that the two amphipods are similarly susceptible to the lethal toxicity of DDT. Therefore, sublethal effects on growth and reproduction are not expected for sensitive invertebrate species.
Body residues measured in L. variegatus in a 28-day exposure to Little Sunflower River sediment were lower than critical body residues previously determined for benthic invertebrates. Therefore, bioaccumulation of DDT and its major metabolites from Little Sunflower River sediments are not expected to result in adverse biological effects.

58 Chapter 8 Sediment Toxicity Bioassay
Table 20 LR50 Values for ∑DDT in Benthic Invertebrates Derived from Sediment Exposures Species LR50 (µg/kg wet wt) Reference
Marine polychaete Neanthes arenaceodentata
>141,600
Estuarine copepod Schizopera knabeni >425,000 Lotufo (unpublished)
Freshwater oligochaete Tubifex tubifex >754,000 Lotufo (unpublished)
Marine amphipod Leptocheirus plumulosus 2,690 Lotufo et al. 2001b
Freshwater amphipod Diporeia spp.
5,947 Lotufo et al. 2001a
Freshwater amphipod Hyalella azteca
2,620 Lotufo et al. 2001a
Table 21 LR50 Values For DDT, DDD, And DDE In Benthic Invertebrates Derived From Water Exposures (Lotufo et al. 2000a) Species Compound LR50 (µg/kg wet wt)
DDT 710 DDD 15,000 Hyalella azteca DDE 123,700 DDT 15,600 DDD 84,200 Diporeia spp. DDE 477,000
Reference toxicant test
Water quality data and 96-hr Cd reference toxicant test results for L. variegatus are presented in Tables 22 and 23, respectively. The water quality data and 96-hr Cd reference toxicant test results for H. azteca are presented in Tables 24 and 25, respectively. The LC50 values for L. variegatus and H. azteca were 0.067 and 0.001 mg of Cd/L, respectively. Concurrent reference toxicant tests were conducted in order to assess the health of test organisms.
Table 22 Water Quality Data - Reference Toxicant Results Using L. variegatus Conc. mg/L Repl No. DO mg/l Temp ºC pH Alkalinity mg/l Cond. µmhos Hardness
0 hr 96 0 96 0 96 0 96 0 96 0 96
1 3.0 7.3 23.3 22.0 8.15 8.03 60 70 310 * 60 70
3 2.8 7.0 23.2 22.2 8.04 8.04 50 80 385 * 80 80
0.0125 1 2.8 6.4 23.2 22.4 7.93 8.05 50 80 383 * 60 70
0.025 3 3.5 5.4 23.2 22.3 7.88 7.88 50 80 385 * 70 70
0.05 2 3.6 5.3 23.1 22.2 7.74 7.82 50 80 315 * 60 70
0.10 2 3.6 5.0 23.2 22.3 7.60 7.79 50 80 310 * 80 70
* No measurements

Chapter 8 Sediment Toxicity Bioassay 59
Table 23 Little Sunflower River 96-hr Cadmium Reference Test Results Using L. variegatus
Worm Count Concentration mg/L
Replicate Number Survival % Survival
1 10 100
2 10 100 0.0
3 10 100
1 10 100
2 10 100 0.00625
3 10 100
1 10 100
2 10 100 0.0125
3 10 100
1 10 100
2 10 100 0.025
3 10 100
1 9 90
2 10 100 0.05
3 9 90
1 1 10
2 1 10 0.10
3 0 0
Table 24 Water Quality Data - Reference Toxicant Test Results Using H. azteca Conc. (mg/L)
Repl No.
DO mg/l
Temp ºC
pH
Alk. mg/l
Cond. µmhos
Hardness
0 hr 96hr 0 96 0 96 0 96 0 96 0 96
0.00 3 6.8 7.2 22.3 22.9 6.31 6.55 60 70 350 386 60 70
0.00125 2 6.8 7.3 22.3 22.9 6.35 7.60 50 70 387 389 70 70
0.0025 1 6.8 7.2 22.3 23.0 7.50 7.54 60 80 400 389 70 80
0.005 3 6.8 7.0 22.3 23.0 7.55 7.61 60 70 410 396 80 70
0.01 2 6.8 6.8 22.4 22.9 7.39 7.49 50 70 400 400 70 80
0.02 1 6.8 6.1 22.5 22.9 7.42 7.56 50 70 388 380 70 80

60 Chapter 8 Sediment Toxicity Bioassay
Table 25 Little Sunflower River 96-hr Cadmium Reference Toxicant Test Results Using H. azteca
Amphipod
Concentration (mg/l) Replicate Number Survival % Survival
1 10 100
2 10 100 0.00
3 10 100
1 6 60
2 5 50 0.00125
3 5 50
1 1 10
2 2 20 0.0025
3 0 0
1 0 0
2 0 0 0.005
3 0 0
1 0 0
2 0 0 0.01
3 0 0
1 0 0
2 0 0 0.20
3 0 0
Conclusions
The Little Sunflower River sediment was not toxic to the aquatic invertebrate Hyalella azteca, a species previously demonstrated to be highly sensitive to DDT exposure compared to other invertebrate species. Differences in the bioavailability of DDT, DDD, and DDE were observed in exposures to Little Sunflower River sediment. Overall, these compounds appear to bioaccumulate in the infaunal biota as predicted by thermodynamic models. However, comparison of measured body burdens in exposed animals with levels expected to promote adverse effects in invertebrates indicate that chronic exposure to Little Sunflower River sediment will not result in adverse biological effects.

Chapter 9 Sediment Desorption Kinetics Analysis 61
9 Sediment Desorption Kinetics Analysis
Introduction
This chapter presents and documents the results of the desorption kinetics experiments on the Little Sunflower River sediment and agricultural soil. This chapter will discuss the availability of DDT, DDE, and DDT to adsorb and/or absorb hydrophobically.
Objective
The objective of this chapter was to use desorption kinetics to help assess availability. Such analyses have proven useful for hydrophobic contaminants such as chlorobenzenes, PCBs, and PAHs (Cornelissen et al. 1997, Macrae and Hall 1998, Ghosh et al. 2000, Talley et al. 2001). Similar analyses have been used for DDT, DDE, DDD, and dieldrin (Morrison, Robertson, and Alexander 2000). This work was conducted by the Environmental Engineering Branch, EPED.
Experimental Approach
Various absorbents are used to remove contaminants from water in locations such as water treatment facilities. Typically, spent absorbent resins have very high affinity for hydrophobic organic compounds such as DDT, DDE, and DDD. In this approach to assess availability of these contaminants in suspended sediment, a suspension of sediment is mixed with an absorbent. The rates of desorption and absorption are taken to be measures of the availabilities of the contaminants: a faster desorbing contaminant would be more available than a slower desorbing one. The absorbent resin was selected to have a high enough affinity so that it instantaneously scavenges the desorbing contaminant from the references. The only rate-controlling factor is assumed to be desorption from the sediment. The experiments were performed under ambient room conditions, approximately 23º C.

62 Chapter 9 Sediment Desorption Kinetics Analysis
Materials and Methods
Tenax resin/bead was selected as the absorbent because its use for this analysis is well documented. It is increasingly old-fashioned and expensive for water cleanup, but it is a tenacious absorbent highly utilized in many laboratories for trapping contaminants. Tenax TA 60/80 mesh was used, as in the references.
Sediment samples were obtained by coring at several locations in the Little Sunflower River. These samples were characterized as reported in Chapter 4. Among the sediment, characteristics relevant for this analysis are the high TOC content and the high swelling clay content. The water used was distilled deionized water. All materials and composited samples were stored in the dark at 4º C until testing.
Chemical analysis procedure
The Tenax samples were delivered to ECB in a vial that contained water and the Tenax beads. The mixture was then spiked with 10 ml of J.T. Baker hexane. The samples were extracted following SW846 method 3550B with a Fisher Scientific 550 Sonic Dismembrator using a microtip probe for 3 min with a pulsed cycle to eliminate heat buildup. The solvent layer was pipetted off and placed into a 20-ml vial. A second extraction with hexane was performed, with this extract being combined with the first. The combined extract was concentrated down to less than 10 ml with nitrogen. Afterwards, the extract was placed on florisil columns following SW846 method 3620b with a modified solvent scheme for removal of interferences. The extract was concentrated to a volume of 1 ml. The 1-ml extract was analyzed on a 5890 Series II GC with dual Electron Captured Detectors. The columns used were a J.W. DB-5 (30m x 0.53mm ID x 1.5 micron film thickness) and a J.W. DB-1701 (30 m x 0.53mm ID x O.83 micron film thickness). The GC was configured with dual injectors, dual auto injector towers, dual columns, and dual detectors. The GC oven conditions used were as follows: Initial temp of 140º C for 1 min followed by a rate of 9.0º C/min to 265º C for 14 min. The injector and detector temperatures were 250º C and 300º C, respectively.
Density separation
It was initially proposed to perform a density separation similar to dredged harbor sediments and soils, such that the light density material (presumably higher in organic content) could be physically separated from the heavy. The light and heavy material could be separately analyzed for desorption kinetics. However, this density separation did not occur, and in hindsight makes sense. This sediment was deposited under riverine conditions, in which light density material (less than water density) was essentially removed already. As received for analyses, this sediment had the consistency of creamy peanut butter, with 50-percent water by weight as measured by air drying.

Chapter 9 Sediment Desorption Kinetics Analysis 63
Higher density separation attempts were made by utilizing salt solutions of higher density; the densest being saturated cesium chloride (CsCl) at 1.80 g/mL. Ten grams of sediment was suspended by wrist action shaking with CsCl solution in a 50-mL Pyrex test tube with foil-lined cap. Much of the sediment was extremely fine clay, remaining suspended under normal gravity for at least 8 hr (Figure 22).
Figure 22. Suspended sediment
Additionally the high CEC (Table 2) and concomitant viscous swelling seemed to further prevent any density separation that might have otherwise occurred. After centrifuging at 1,000 rpm for 30 min, the material settled; none floated. The finest material settled last (Figure 23).

64 Chapter 9 Sediment Desorption Kinetics Analysis
Figure 23. Centrifuged sediment
Initial Tenax experiments
The sediment sample designated Site 2-Top was selected for initial studies because it had the highest DDT concentration and represented the worst case, as reported earlier. The Little Sunflower sediment and Tenax were used as received. The sediment was homogenized as received in a half-full 500-mL glass jar by vigorous stirring with a stainless steel spoon for 15 min.
The Tenax was homogenized as received in a mostly empty (but unopened) 100-mL plastic bottle by vigorous shaking for 5 min. Neither were washed nor otherwise treated prior to use.
Two grams of sediment were placed in five 50-ml Pyrex test tubes with a stainless steel spoon. The amount of sediment was determined to be typical of the references, and maximal for optimum aqueous suspension in 50 mL. Two of the five test tubes loaded with sediment were reserved for later degradation measurements. The other three test tubes were loaded with 0.200 g of Tenax, which is typical of the references, and optimal for handling. The test tubes were filled to the neck with water at ambient temperature. No attempt was made to limit oxygenation.
The Tenax or sediment was not sterilized; however, the containers, instruments, and water were sterilized by autoclaving prior to use. No attempt was made to maintain sterility after loading besides normal cross-contamination

Chapter 9 Sediment Desorption Kinetics Analysis 65
prevention: washing, rinsing, and wiping. A sixth tube for a method blank was prepared by adding water and Tenax without sediment.
The test tubes continuously mixed on a rotator at 20 rpm, as illustrated in Figure 24, except for sampling events. For each sampling event, after a time interval the test tubes were taken off the rotator and then allowed to settle for 10 min. The Tenax that floated immediately as illustrated in Figure 25 was then spooned off the top within a few minutes. The Tenax was rinsed off the spoon with water into 20-mL glass vials covered with foil-lined caps for chemical analysis. Another 0.200 g of Tenax was loaded into each test tube.
Figure 24. Suspended sediment on a rotator

66 Chapter 9 Sediment Desorption Kinetics Analysis
Figure 25. Floating Tenax
Other methods use centrifugation for separating the Tenax bead; these samples were not centrifuged for two reasons. First, the Tenax floated so well that it was not efficacious. Secondly, the handling time increased. Additionally, the very slight dirtiness of the Tenax as illustrated in Figure 25 would not be removed by centrifuging. The Little Sunflower River sediment had no floating fraction.
Vagaries in technique caused various amounts of rinse water (1 to 5 ml) to be in each vial, along with slightly less than 0.200 g of Tenax each. It was impossible to recover each of the Tenax beads, but in method practice 99 percent recovery or greater was achieved every time. The variation in rinse water did not affect the chemical results as described below.
The sampling event took place at 4 hr, 24 hr, and each 24-hr period for 2 weeks. After 1 week, the two reserved test tubes, which had been mixing along with the others, were also loaded with Tenax bead and sampled for a week. This was to detect any degradation resulting from the method over a week, for instance, biodegradation. The sediment remaining in the tubes after the 2-week period was not analyzed. The samples were delivered to the ECB for chemical analysis.
Upon review of the very low concentrations (most all nondetects), the Tenax experiments were repeated with more sediment by volume in each tube. As mentioned earlier, additional sediment was required for better evaluation. Because of the limited amount of sediment, all remaining core samples were composited and analyzed (Table 2).

Chapter 9 Sediment Desorption Kinetics Analysis 67
The composite sediment was used to repeat the Tenax experiments as above, but with 10 g of sediment loaded into the test tubes for greater absorption. This higher loading required that the rotator speed be reduced to 15 rpm for adequate mixing. The sampling intervals were adjusted for longer exposure and therefore greater absorption.
Two additional tubes were also loaded to study shorter-time desorption phenomena, yielding eight sediment tubes all together. The times of the new sampling events are given in Table 26.
Two other tubes were loaded with soil sampled from an agricultural field along the river. These tubes contained the desired 2 g of soil, because the agricultural soil has much higher concentrations of these hydrophobic contaminants than the sediment, especially DDT.
Table 26 Tenax Analytical Results for Little Sunflower River Sediment and Agricultural Soil
Sediment Concentration, ng Agricultural Soil Concentration, ng
Time, days DDD DDE DDT DDD DDE DDT
0.08 --- --- --- <5.00 180 142
0.08 --- --- --- <5.00 170 141
0.17 45.4 76.5 <5.00 <5.00 147 128
0.17 26.9 70.3 2.95 <5.00 145 137
0.46 66.4 133.8 3.80 <5.00 222 254
0.46 42.6 121.6 <5.00 <5.00 294 318
1.00 85.3 187.9 <5.00 <5.00 312 388
1.00 71.5 178.2 <5.00 <5.00 305 403
1.00 55.2 162.0 4.46 --- --- ---
1.00 54.9 163.0 <5.00 --- --- ---
1.00 59.1 154.0 <5.00 --- --- ---
3.00 76.0 223.2 <5.00 --- --- ---
3.00 74.1 210.0 <5.00 --- --- ---
3.00 84.9 227.1 <5.00 --- --- ---
7.00 96.8 262.0 <5.00 --- --- ---
7.00 95.0 259.5 <5.00 --- --- ---
7.00 112.5 264.5 <5.00 --- --- ---
11.00 <5.00 285.7 <5.00 --- --- ---
11.00 <5.00 285.3 <5.00 --- --- ---
11.00 <5.00 287.5 <5.00 --- --- ---
17.00 <5.00 302.3 <5.00 --- --- ---
17.00 <5.00 302.4 <5.00 --- --- ---
17.00 <5.00 307.0 <5.00 --- --- ---
21.00 103.0 233.8 8.14 45.3 491 756
21.00 87.2 218.4 6.97 38.6 460 784
37.00 106.1 321.0 8.67 --- --- ---
37.00 101.5 321.2 4.59 --- --- ---
37.00 118.4 324.4 4.74 --- --- ---

68 Chapter 9 Sediment Desorption Kinetics Analysis
Results and Discussion
Qualitative results
The chemical analysis results are presented in Table 26 and the absorption on the Tenax as described below is illustrated in Figure 26. DDT was still barely detected. DDE desorbs more than DDD or DDT, and more rapidly. Therefore, DDE is more available. Very little DDT desorbs.
Figure 26. Little Sunflower River sediment contaminant adsorption to Tenax
The chemical analysis results reported as nondetects are not assumed zeros but are simply not used in further manipulation. The detection limit in the analyzed hexane was reported as 5 µg/kg for all compounds, but was a little less for some judgements.
The 1-week degradation experiment showed no sign of degradation caused by the mixing process, as would be evidenced by a decrease in concentration. In fact, there was a slight increase in the limited data, undoubtedly simply due to variation and not a trend.
The agricultural samples showed excellent desorption of DDT as well as DDE, but with no DDD. That is not consistent with analysis of the soil that reported high DDD concentration.
Quantitative results
Two-component desorption of the linear form was fit to the chemical analysis data using Equation 5 as developed from Equation 2. One component of the
0
50
100
150
200
250
300
350
0 5 10 15 20 25 30 35 40
Time (days)
Cu
mu
lati
ve S
orp
tio
n (
ng
)
DDD
DDE
DDT

Chapter 9 Sediment Desorption Kinetics Analysis 69
sediment binds a compound more weakly, and one component more strongly, resulting in faster or slower desorption.
The amount not yet desorbed from the sediment is assumed to be of the form
tktk eCeCC 2121
−− += (2)
where C = amount of contaminant remaining in the sediment t = time C1 = faster desorbing concentration k1 = faster desorption rate C2 = slower desorbing concentration k2 = slower desorption rate
Since it is assumed that the Tenax scavenges all the desorbed contaminant,
dt
dC
dt
dA−= (3)
where A = total amount absorbed on the Tenax t = time
It then follows that
tktk eCeCCCA 112121
−− −−+= (4)
For each compound, for quantitation, the data D given by the hexane concentration analysis are directly proportional to the amount absorbed on the Tenax during the preceding sampling interval of time length T, so
)()()( TtAtAtD −−∝
or rewriting using 0)0( ≡A ,
∑ −∝T
TtDtA )()( (5)
The fits using Equation 5 were performed using the Solver tool. The results are given in Table 27 and illustrated in Figures 27, 28, and 29. Since so few points were fit for the DDT, it is overly determined with poor statistics. The r2 > 0.99 fit to DDE is excellent, and the r2 > 0.79 fit to DDD is quite good.

70 Chapter 9 Sediment Desorption Kinetics Analysis
Table 27 Sediment Model Fit Parameters Fit Parameter DDD DDE DDT
A1 (ng) 81.9 155 4.22
A2 (ng) 179 165 181
k1 (day-1) 2.03 3.22 6.9
k2 (day-1) 0.0048 0.149 0.0003
r2 0.788 0.992 0.990
Figure 27. Model fit to DDD adsorption data
Figure 28. Model fit to DDE absorption data

Chapter 9 Sediment Desorption Kinetics Analysis 71
Figure 29. Model fit to DDT absorption data
The faster desorption rates were quite fast, approximately instantaneous for the purposes of suspended sediment in the river. They were finished desorbing before the day was out. The fast-desorbing part of the desorbable contamination is about 50 percent of the total for DDE, about 20 percent for DDD, and approximately 2 percent for the DDT. These ratios indicate the relative ease of availability of the compounds in this sediment. This trend is confirmed by agreement with the biota-sediment accumulation factors (BSAF) reported in Chapter 8.
The slower-desorbing part takes a couple of weeks to desorb for DDE, a few months for DDD, and over a year for DDT. Nevertheless, if this slower-desorbing part were as available to biota as the faster-desorbing part, then this desorption kinetics data would be skewed from agreement with the data from the month-long BSAF tests.
The agricultural samples analyzed in time for this report were only up to 24 hr. A single-component fit (C2=0) revealed that it would take DDT just a few days to desorb, while DDE would take a week. There was no DDD sorption. These anomalous results show that the agricultural soil is completely different in sorption characteristics than the sediment.
It is of interest to calculate the apparent relative equilibrium partition coefficients. The composite sediment had average concentrations of DDD, DDE, and DDT in the ratios 37:81:16. The apparent amounts totally absorbable on the Tenax bead from the sediment, including theoretically completing the slower desorption, are in the ratios 318:309:189. Thus, the apparent relative equilibrium partition coefficients, of the amount absorbable on the Tenax bead compared to the amount in sediment, are in the ratios 8.6:3.8:11.8. This does not correspond to the trend seen in the biota accumulation.

72 Chapter 9 Sediment Desorption Kinetics Analysis
Conclusions and Recommendations
The data presented here suggest the possibility that the slower-desorbing portion may not have any major impact on biota accumulation, even in non-suspended sediment as used in the toxicity tests. The BSAF did not correspond in any way to characteristics of the slower-desorbing portion, only the faster. For purposes of remediation to biostabilization, for instance, it may be that only the fast-desorbing portion need be considered.
These kinetics data could be extended to include longer times to reach equilibrium in order to measure partitioning conditions for prediction of long-term effects. It is recommended that the biota data could be extended to include much shorter accumulation times, on the order of 1 day, to assess the conclusion that only the fast-desorbing portion may be relevant.
The DDE concentration was shown to desorb more easily than DDD and DDT for this sediment. Extending the data to include samples from other locations is also likely to prove fruitful, and may provide a check on some of these results, if they were confined to this specific sediment location.

Chapter 10 Summary of Results 73
10 Summary of Results
Because of potential DDT contamination in the Little Sunflower River, core samples were collected from five locations and composited to conduct various environmental studies and to characterize the sediment and agricultural soil. The environmental studies include thermal desorption analysis, XRD analysis, PLFA and DNA analyses, sediment toxicity bioassay, and sediment desorption kinetics.
The Little Sunflower River sediment was characterized with DDT concentrations (<24 ug/kg) generally decreasing with depth. DDT was not detected in the bottom cores. DDE was detected and was the most prevalent species presented. DDE was more prevalent in the middle cores and less prevalent in the top and bottom cores (<238 ug/kg). This may indicate that DDE is more mobile than DDT and may be formed from the reductive dechlorination of DDT. DDD was predominantly detected in the bottom cores (<94 ug/kg) and may be the result of reductive dechlorination of DDE. TOC and CEC were also detected at concentrations of less than 1.1 percent and less than 94 meq/100g of soil. The high CEC value indicated a clay sediment. Pesticides have the tendency to bond tightly to sediment when the CEC of the sediment is high. The agricultural soil had DDT, DDE, DDD, TOC, and CEC concentrations of 988-, 253-, 797-ug/kg, 1.1 percent, and 28 meq/100g of soil, respectively. Based on CEC, the agricultural soil did not hold DDT as tightly as the sediment. The XRD analysis confirmed a large component of expandable clays present in the sediment that showed trace amounts of finer fractions such as kaolinite, illite, and smectite. Therefore, based on the characterization of the sediment, reductive dechlorination of DDT may be occurring.
The TPD analyses showed that DDE was less bound to clayey sediments than DDT. However, this binding was extremely difficult to assess quantitatively, mostly because the binding was so tight that in most cases no desorption was observed.
The PLFAME analysis indicated the top core of Little Sunflower River sediment contained an average microbial community biomass dominated by gram-negative microorganisms. However, common aromatic contaminant-degrading genes were not detected in the Little Sunflower River sediment samples, which may indicate that the potential for DDT and DDE biodegradation in the sediment is low.

74 Chapter 10 Summary of Results
Tissue samples collected from the test organisms at the termination of the bioaccumulation test revealed significant levels of DDE and DDD present. DDT was present, but at much lower levels. BSAFs were calculated and determined to be 0.88, 4, and 11 for DDT, DDE, and DDD, respectively. Again, bioavailability of DDE and DDD far exceed the bioavailability of DDT.
The desorption kinetic analysis suggested the possibility that the slower-desorbing part may not have any major impact on biota accumulation, even in non-suspended sediment as used in the toxicity tests. The BSAF did not correspond to characteristics of the slower-desorbing part, only the faster. However, DDE concentration was shown to desorb more easily than DDD and DDT for this sediment. Extending the data to include samples from other locations is also likely to prove fruitful, and may provide a check on some of these results, if they were confined to this specific sediment location.
The combined investigative approaches used in these studies indicate that the present level of DDT, DDE, and DDD may not be toxic to benthic invertebrates. However, this work has confirmed that DDE and DDD are readily available and bioaccumulate in the biota at measurable levels. Dredging or removal of those impacted sediments should eventually reduce the overall DDT, DDE, and DDD levels in the Little Sunflower River. Unfortunately, this work does not provide adequate information to address the question of what short-term effects sediment resuspension (due to dredging) will have. More work is needed to determine the actual fate and transport of the DDE and DDD.

References 75
References
Agency for Toxic Substances and Diseases Registry (ATSDR)/US Public Health Service. (1994). “Toxicological Profile for 4,4'-DDT, 4,4'-DDE, 4, 4'-DDD,” ATSDR, Atlanta, GA.
Aislabie, J., Davison, A. D., Boul, H. L., Franzmann, P. D., Jardine, D. R., and Karuso, P. (1999). “Isolation of Terrabacter sp. strain DDE-1, which metabolizes 1, 1-dichloro-2,2-bis(4-chlorophenyl)ethylene when induced with biphenyl.” Appl Environ Microbiol. Dec;65(12):5607-11.
Augustijn-Beckers, P. W. M., Hornsby, A. G., and Wauchope, R. D. (1994). “SCS/ARS/CES Pesticide Properties Database for Environmental Decisionmaking; II: Additional Properties Reviews of Environmental Contamination and Toxicology,” Vol. 137.
Balkwill, D. L., Leach, F. R., Williams, J. T., McNabb, J. F., and White, D. C. (1988). “Equivalence of microbial biomass measures based on membrane and cell wall components, ATP, and direct counts in subsurface sediments,” Appl. Environ. Microbiol. 16:73-84.
Borneman, J., Skroch, P. W., O’Sullivan, K. M., Palus, J. A., Rumjanek, N. G., Jansen, J. L., Nienhuis, J., and Triplett, E. W. (1996). “Molecular microbial diversity of an agricultural soil in Wisconsin,” Appl. Environ. Microbiol. 62:1935-1943, 4.
Boese, B. L., Lee, H., and Echols, S. (1997). “Evaluation of a first-order model for the prediction of the bioaccumulation of PCBs and DDT from sediment into the marine deposit-feeding clam Macoma nasuta,” Environ Toxicol Chem 16:1545-1553.
Carter, C. W., and Suffet, I. H. (1982). “Binding of DDT to dissolved humic material,” Environ. Sci. Technol., 735.
Chandler, D. P. (1998). “Redefining relativity: Quantitative PCR at low template concentrations for industrial and environmental microbiology,” J Indust. Microbiol. Biotechnol. 21:128-140.
Chu, W. (1999). “Photodechlorination mechanisms of DDT in UV/surfactant systems,” Environ. Sci. Technol., 33, 421-425.

76 References
Cornelissen, G., van Noort, P., Parsons, J., and Govers, H. (1997). “Temperature dependence of slow adsorption and desorption kinetics of organic compounds in sediments.” Environmental Science Technology, 31, 454-460.
Ferraro, S. P., Lee, H., Jr., Ozretich, R. J., and Specht, D. T. (1990). “Predicting bioaccumulation potential: a test of a fugacity-based model.” Arch. Environ. Contam. Toxicol. 19:386-394.
Fisher, S. W., Chordas, S. W., and Landrum, P. F. (1999). “Lethal and sublethal body residues for PCB intoxication in the oligochaete, Lumbriculus variegatus,” Aquat. Toxicol. 45:115-126.
Fredrickson, H. L., Cappenberg, T., and de Leeuw, J. (1986). “Polar lipid ester-linked fatty acid composition of Lake Vechten seston: An ecological application of lipid analysis.” FEMS Microbiol. Ecol. 38, 381-396.
Garabrant, D. H., Held, J., Langholz, B., Peters, J. M., and Mack, T. M. (1984). “DDT and related compounds and risk of pancreatic cancer,” J. National Cancer Institute. 84:764-771.
Ghosh, U., Gillette, J. S., Luthy, R., and Zare, R. (2000). “Microscale location, characterization, and association of polycyclic aromatic hydrocarbons on harbor sediment particles,” Environ. Sci. Technol. 34, 1729-1736.
Ghosh, U., Talley, J., and Luthy, R. G. (2001). “Particle-scale investigation of PAH desorption kinetics and thermodynamics from sediment,” Environ. Sci. Technol. 35, 3468-3475.
Glick, B. R., and Pasternak, J. J. (1998). “Molecular biotechnology: Principles and applications of recombinant DNA,” American Society of Microbiology, Washington, DC.
Harkey, G. A., Landrum, P. F., and Klaine, S. J. (1994). “Comparison of whole-sediment, elutriate and pore-water exposures for use in assessing sediment-associated organic contaminants in bioassays,” Environ. Toxicol. Chem. 13(8):1315-1330.
Hay, A. G., and Focht, D. D. (1998). “Cometabolism of 1,1-dichloro-2,2-bis(4-chlorophenyl)ethylene by Pseudomonas acidovorans M3GY grown on biphenyl,” Appl Environ Microbiol 64(6):2141-6.
Heberer, T., and Dunnbier, U. (1999). “DDT metabolite Bis(Chlorophenyl)acetic Acid: The neglected environmental contaminant,” Environ. Sci. Technol. 33, 2346-2351.
Howard, P. H., Boethling, R. S., Jarvis, W. F, Meylan, W. M., and Michalenko, E. M. (1991). Handbook of environmental degradation rates. Lewis Publishers, Chelsea, MI.

References 77
Hudson, R. H., Tucker, R. K., and Haegele, K. (1984). “Handbook of acute toxicity of pesticides to wildlife,” Resource Publication 153, U.S. Dept. of Interior, Fish and Wildlife Service, Washington, DC.
Johnson, W. W., and Finley, M. T. (1980). “Handbook of acute toxicity of chemicals to fish and aquatic invertebrates,” Resource Publication 137, U.S. Dept. of Interior, Fish and Wildlife Service, Washington, DC.
Jorgensen, S. E., Jorgensen, L. A., and Nielsen, S. N. (1991). Handbook of ecological parameters and ecotoxicology. Elsevier. Amsterdam, Netherlands.
Juhasz, A., Naidu, R. (1999). “Apparent degradation of 1,1,1-trichloro-2,2-bis(p-chlorophenyl) ethane (DDT) by a Cladosporium sp.,” Biotechnology Letters, 21: 991-995.
Karapanagioti, H. K., Kleineidam, S., Sabatini, D. A., Grathwohl, P., and Ligouis, B. (2000). “Impacts of heterogeneous organic matter on phenanthrene sorption: Equilibrium and kinetic studies with aquifer material,” Environ. Sci. Technol. 2000, 34, 406-414.
Kile, and Chiou. (1989). “Aquatic humic substances,” ACS Advances in Chemistry Series, No. 219.
Lotufo, G. R., Farrar, J. D., and Bridges, T. S. (2000). “Effects of exposure source, worm density and sex on DDT bioaccumulation and toxicity in the marine polychaete Neanthes arenaceodentata,” Environ. Toxicol. Chem. 19(2):472-484.
Lotufo, G. R., Farrar, J. D., Duke, B. M., and Bridges, T. S. (2001b). “DDT toxicity and critical body residue in the amphipod Leptocheirus plumulosus in exposures to spiked sediment,” Arch. Environ. Contam. Toxicol. 41:142-150.
Lotufo, G. R., Landrum, P. F., Gedeon, M. L., and Tigue, E. (2001a). “Toxicity and toxicokinetics of sediment-associated DDT in freshwater invertebrates,” Environ. Toxicol. Chem. 20(4):810-825.
Lotufo, G. R., Landrum, P. F., Gedeon, M. L., Tigue, E., and Herche, L. R. (2000). “Comparative toxicity and toxicokinetics of DDT, DDD and DDE in freshwater amphipods,” Environ. Toxicol. Chem. 19(2)368-379.
Luthy, R. G., Aiken, G. R., Brusseau, M. L., Cunningham, S. D., Gschwend, P. M., Pignatello, J. J., Reinhard, M., Traina, S. J., Weber, W. J., Jr., and Westall, J. C. (1997). “Sequestration of hydrophobic organic contaminants by geosorbents,” Environ. Sci. Technol., 31, 3341-3347.
Macrae, J., and Hall, K. (1998). “Comparison of methods used to determine the availability of polycyclic aromatic hydrocarbons in marine sediment,” Environmental Science Technology 32, 3809-3815.

78 References
Mader, S. S. (1996). Biology. 5th ed., WCB.
Matsumura, F. (1985). Toxicology of insectides. 2nd ed., Plenum Press, New York.
McFarland, V. A., and Clarke, J. U. (1986). “Testing bioavailability of polychlorinated biphenyls from sediments using a two-level approach,” Proceedings, USAE Committee on Water Quality, Sixth Seminar, The Hydrologic Engineering Center, 609 Second Street, Davis, California, 220-229.
Meador, J. P., Adams, N. G., Casillas, E., and Bolton, J. L. (1997). “Comparative bioaccumulation of chlorinated hydrocarbons from sediment by two infaunal invertebrates,” Arch. Environ. Contam. Toxicol. 33:388-400.
Meijer, S. N., Halsall, C. J., Harner, T., Peters, A. J., Ockenden, W. A., Johnston, A. E., and Jones, K. C. (2001). Environ. Sci. Technol. 35, 1989-1995.
Meister, R. T. (1992). Farm chemicals handbook '92. Meister Publishing Co., Willoughby, OH.
Morrison, D., Robertson, B., and Alexander, M. (2000). “Bioavailability to earthworms of aged DDT, DDE, DDD, and dieldrin in soil,” Environ. Sci. Technol. 34, 709-713.
Mulsow, S. G., and Landrum, P. F. (1995). “Bioaccumulation of DDT in a marine polychaete, the conveyor-belt deposit feeder Heteromastus filiformis (Claparede),” Chemosphere 31:3141-3152.
National Research Council. (1997). “The dynamics of sedimentation basins,” National Academy Press, Washington, DC.
Nowell, L. H., Capel, P. D., and Dileanis, D. P. (1999). “Pesticides in stream sediments and aquatic biota-distribution, trends, and governing factors.” Pesticides in the hydrologic systems series. V. 4, CRC Press, Boca Raton, FL.
Ringelberg, D. B., Talley, J., Bouwer, E., Luthy, R., and Fredrickson, H. L. (2001). “Succession of phenotypic, genotypic and metabolic community characteristics during in vitro bioslurry treatment of polycylic aromatic hydrocarbon-contaminated sediments.” Applied and Environmental Microbiology, 67(4), 1542-1550.
Ringelberg, D., Talley, J. W., Perkins, E., Tuckers, S., Luthy, R. G., and Bouwer, E. (2001). “Defining in-situ PAH biodegradation activity in terms of microbial phenotype and genetic potential,” Applied and Environmental Microbiology 67(4), 1542-1550.
Ringelberg, D., Talley, J. W., Perkins, E. J., Tucker, S. G., Luthy, R. G., Bouwer, E. J., and Fredrickson, H. L. (2001). “Succession of phenotypic, genotypic

References 79
and metabolic community characteristics during the in vitro bioslurry treatment of pah-contaminated sediments,” Appl. Environ. Microbiol. 67:1542-50.
Royal Society of Chemistry (RSC). (1991). The agrochemicals handbook. Royal Society of Chemistry Information Services, Cambridge, UK.
Rubistein, N. I. (1994). “Dredge material assessment methods: Evaluation of the revised implementation manual for Section 103 of the Marine Protection, Research and Sanctuaries Act of 1992 (PL92-532),” USEPA Research Laboratory.
Sax, N. I. (1984). Dangerous properties of industrial materials. 6th ed., Van Nostrand Reinhold, New York.
Sayles, G., You, G., Wang, M., Kupferle, M. J. (1997). “DDT, DDD, and DDE dechlorination by zero-valent iron,” Environ. Sci. Technol. 31, 3448-3454.
Talley, J., and Furey, J. (1999). “Thermal programmed desorption with direct sampling ion trap mass spectrometry for analysis of soils contaminated with semivolatile organic compounds,” 47th American Society of Mass Spectrometry (ASMS) Conference on Mass Spectrometry.
Talley, J. W., Ghosh, U., Tucker, S., Furey, J., and Luthy, R. G. (2001a). “Thermal programmed desorption (TPD) of PAHs from mineral and organic surfaces,” Environmental Engineering and Science (Submitted).
Talley, J., Tucker, S., Furey, J., Felt, D., Ghosh, U., Luthy, R., Gillette, J. S., and Zare, R. (2001b). “Assessment and prediction of biostabilization of polycyclic aromatic hydrocarbons in sediments,” Strategic Environmental Research and Development Office, SERDP CU-1095.
Talley, J., Tucker, S., Furey, J., Ghosh, U., and Luthy, R. G. (2001c). “Particle-scale understanding of availability and bioslurry treatment of PAHs in sediment,” Environ. Sci. Technol. (in press).
Talley, J. W. (Director and Editor). (2001). SERDP CU-720 Final Report, “Biotreatment research: Flask to field initiative,” (submitted).
Tang, J., Robertson, B., Alexander, M. (1999). “Chemical-extraction methods to estimate bioavailability of DDT, DDE, and DDD in soil,” Environ. Sci. Technol. 33, 4346-4351.
U.S. Envioronmental Protection Agency. (2000). “Methods for measuring the toxicity and bioaccumulation of sediment-associated contaminants with freshwater invertebrates,” EPA/600/R-99064. 2nd ed.
U.S. Environmental Protection Agency (USEPA). (1989). “Environmental Fate and Effects Division, Pesticide environmental fate one line summary: DDT,” (p, p'). Washington, DC.
80 References
U.S. Environmental Protection Agency. (2000). “Methods for measuring the toxicity and bioaccumulation of sediment associated contaminants with freshwater invertebrates,” EPA/600/R-99/064.
Van den Hoop, M., Kreule, P., and Loch, J. P. (1999). “Sorption kinetics and transformation of DDT in sediments,” Water, Air, and Soil Pollution 110, 57-66.
Van Ert, M., and Sullivan, J. B. (1992). “Organochlorine pesticides.” Hazardous materials toxicology, clinical principles of environmental health. J. B. Sullivan and G. R. Krieger, eds., Williams & Wilkins, Baltimore, MD.
Van Handel, E. (1985). “Rapid determination of total lipids in mosquitoes,” J. Am. Mosq. Control. Assoc. 1:302-304.
White, D. C., and Ringelberg, D. B. (1998). “Signature lipid biomarker analysis,” Techniques in microbial ecology, R. S. Burlage, R. Atlas, D. Stahl, G. Geesey, and G. Sayler, eds., Oxford University Press, Inc., New York, 255-272.
World Health Organization (WHO). (1979). Environmental health criteria 9, DDT and its derivatives. Geneva.
World Health Organization (WHO). (1989). Environmental health criteria 83, DDT and its derivatives--environmental effects. Geneva.

REPORT DOCUMENTATION PAGE Form Approved
OMB No. 0704-0188 Public reporting burden for this collection of information is estimated to average 1 hour per response, including the time for reviewing instructions, searching existing data sources, gathering and maintaining the data needed, and completing and reviewing this collection of information. Send comments regarding this burden estimate or any other aspect of this collection of information, including suggestions for reducing this burden to Department of Defense, Washington Headquarters Services, Directorate for Information Operations and Reports (0704-0188), 1215 Jefferson Davis Highway, Suite 1204, Arlington, VA 22202-4302. Respondents should be aware that notwithstanding any other provision of law, no person shall be subject to any penalty for failing to comply with a collection of information if it does not display a currently valid OMB control number. PLEASE DO NOT RETURN YOUR FORM TO THE ABOVE ADDRESS.
1. REPORT DATE (DD-MM-YYYY) September 2002
2. REPORT TYPE Final report
3. DATES COVERED (From - To)
5a. CONTRACT NUMBER
5b. GRANT NUMBER
4. TITLE AND SUBTITLE
Assessment of DDT Bioavailability in the Little Sunflower River Sediment and Agricultural Soil
5c. PROGRAM ELEMENT NUMBER
5d. PROJECT NUMBER
5e. TASK NUMBER
6. AUTHOR(S)
Roy Wade, Guilherme R. Lotufo, Jeffrey A. Steevens, Jerre G. Houston, Herbert L. Fredrickson, Edward J. Perkins, Jeffrey W. Talley, Charles A. Weiss, Deborah Felt, Agnes B. Morrow, John S. Furey, Maurice Duke 5f. WORK UNIT NUMBER
7. PERFORMING ORGANIZATION NAME(S) AND ADDRESS(ES) 8. PERFORMING ORGANIZATION REPORT
NUMBER U.S. Army Engineer Research and Development Center, Environmental Laboratory, Geotechnical and Structures Laboratory, 3909 Halls Ferry Rd., Vicksburg, MS 39180-6199; Dyntel, Inc., Vicksburg, MS 39180; Applied Research Associates, Vicksburg, MS 39180; Analytical Services, Inc., Vicksburg, MS 39180; Notre Dame University, Notre Dame, IN 46556
ERDC TR-02-6
10. SPONSOR/MONITOR’S ACRONYM(S)
11. SPONSOR/MONITOR’S REPORT
NUMBER(S)
9. SPONSORING / MONITORING AGENCY NAME(S) AND ADDRESS(ES)
12. DISTRIBUTION / AVAILABILITY STATEMENT
Approved for public release; distribution is unlimited.
13. SUPPLEMENTARY NOTES
14. ABSTRACT
Dredged materials from the Little Sunflower River and soils from its adjacent agricultural fields were collected and homogenized to provide sufficient samples for DDT, DDE, and DDD analyses. Room temperature aqueous desorption studies (using Tenax beads) were performed to assess the release of DDT, DDE, and DDD from the sediment. Microbial ecology testing applied PLFA and DNA procedures to evaluate the potential for enhanced biotreatment or biotic natural attenuation. Toxicity testing studied the survivability of Hyalella azteca exposed for 10 days to DDT-, DDE-, and DDD-impacted dredged material. A 28-day bioaccumulation test was also performed using Lumbriculus variegates as the test organism. Overall, the results were used to synthesize and correlate data to assess the availability and toxicity of DDT, DDE, and DDD in dredged sediments.
The combined investigative approaches used in these studies indicate the present level of DDT, DDE, and DDD may not be toxic to benthic invertebrates. However, this work confirmed that DDE and DDD are readily available and bioaccumulate in the biota at measurable levels.
15. SUBJECT TERMS
Bioaccumulate Bioassay
DDD DDE DDT
Desorption Tenax Toxicity
16. SECURITY CLASSIFICATION OF: 17. LIMITATION OF ABSTRACT
18. NUMBER OF PAGES
19a. NAME OF RESPONSIBLE PERSON
a. REPORT
UNCLASSIFIED
b. ABSTRACT
UNCLASSIFIED
c. THIS PAGE
UNCLASSIFIED 90 19b. TELEPHONE NUMBER (include area code)
Standard Form 298 (Rev. 8-98) Prescribed by ANSI Std. 239.18
Copyright © 2022 FDOKUMEN