Nutrient Budgets in Cupressus lusitanica (Mill.) Plantations of Different Age
11
Resources and Environment 2013, 3(6): 183-193 DOI: 10.5923/j.re.20130306.03 Nutrient Budgets in Cupressus lusitanica (Mill.) Plantations of Different Age Dessie Assefa 1,* , Edzo Veldkamp 2 1 Department of Natural Resources Management, Bahir Dar University, P.o.Box 79, Bahir Dar, Ethiopia 2 Büsgen Institute, Soil Science of Tropical and Subtropical Ecosystems, Georg-August University of Göttingen, D-37077, Germany Abstract The study of nutrient pool helps forest managers to understand the quality and productivity of the site and to take measures on the inputs and outputs of nutrients from the forest ecosystem. The study aimed to know the total amount of nutrient pools of major elements in the soil and tree components, the effect of harvesting on long term productivity and the potential of fast growing plantation to sequester carbon. The soil was moderately acidic and effective cation exchange capacity (ECEC) was higher on topsoil (13.1 cmol/kg) than subsoil (7.9 cmol/kg). Measurements on bulk density showed lower on topsoil (1.05 g/cm 3 ). Nutrients such as P, Mg, Fe, and Al showed significant variability between age groups. Cumulative net mineralization was +0.7 and nitrification was -0.4 mg/kg of soil. The average C: N ratios of the soil were highest in the subsoil (17:1). Harvesting of the stem and branches only would remove 92% of the biomass but only 64% of the nutrients in the stand. Fast growing plantations are effective for carbon sinks both in biomass and in soil. The result clearly emphasized that leaving barks and foliage during harvesting will maintain the availability of nutrients and save nutrients from being lost. Keywords Nutrient Budgets, Cupressus, Nitrogen Transformation, Carbon Sequestration, Biomass 1. Introductioni Cupressus lusitanica (Miller) have been widely planted in Ethiopia as commercial plantations because of its adaptations to a wide range of geographical areas and fast growth rate compared to slow growth rate and low economic return of indigenous species. The planted forest resources are estimated about 400,000 ha only in the whole country[1]. Eucalyptus and Cupressus are the main species in industrial plantations (58% and 29% respectively), followed by Juniperus procera (4%), pinus (2%) and other species about 7%[2]. Soils are a major component of terrestrial ecosystems providing storage pools for nutrients, water, and a medium to support terrestrial plant. Forest soil nutrient pools can be dramatically affected by tree harvesting or removal of forest biomass, soil erosion and leaching[3]. Nutrient removals depend on the types of biomass removed; bole wood is low in nutrient concentration, but bark and foliage are quite high[4-5]. Estimating nutrient pool in the soil is one of the best methods to see the overall supply of plant nutrients available compared to the estimated needs by the plant. A review by[6] described that the validity of nutrient budget * Corresponding author: [email protected] (Dessie Assefa) Published online at http://journal.sapub.org/re Copyright © 2013 Scientific & Academic Publishing. All Rights Reserved calculations for any ecosystem depends on the completeness of the assessment of various nutrient exchange processes in the ecosystem. It involves a series of interrelated processes such as rock weathering, atmospheric deposition, organic matter decomposition and mineralization, and nutrient uptake. Nutrients contained in organic matter must undergo mineralization and only nutrients contained in the soil solution are readily available for plant uptake. A study by[7] suggested that leaching of nitrate from forest soils and the rate of turnover may be largely dependent on the density and activity of the microbial community. Many studies[8-11] revealed that N availability, net N mineralization, and nitrification tend to increase after harvest and decline with increasing stand age. In the past, estimates of N mineralization have been limited under controlled conditions in laboratory incubations of soil. In contrast, in-situ measurements in natural ecosystem have allowed for N mineralization in the field with different methods[12]. Carbon stocks vary in different tree components. For example, studies in a species of Chinese fir, trunks account for a major part of the C stock, usually amounting to more than 60% of total vegetation C stock[13]. Many results suggested that in monoculture plantations, rates of decomposition and nutrient release are slow[14-15]. This phenomenon affects the C: N ratio. The carbon nitrogen ratio added to the soil depends on organic matter quality[16] - the availability of C in the material relative to its available N.
Transcript of Nutrient Budgets in Cupressus lusitanica (Mill.) Plantations of Different Age
Resources and Environment 2013, 3(6): 183-193 DOI: 10.5923/j.re.20130306.03
Nutrient Budgets in Cupressus lusitanica (Mill.)
Plantations of Different Age
Dessie Assefa1,*
, Edzo Veldkamp2
1Department of Natural Resources Management, Bahir Dar University, P.o.Box 79, Bahir Dar, Ethiopia 2Büsgen Institute, Soil Science of Tropical and Subtropical Ecosystems, Georg-August University of Göttingen, D-37077, Germany
Abstract The study of nutrient pool helps forest managers to understand the quality and productivity of the site and to take measures on the inputs and outputs of nutrients from the forest ecosystem. The study aimed to know the total amount of nutrient pools of major elements in the soil and tree components, the effect of harvesting on long term productivity and the potential of fast growing plantation to sequester carbon. The soil was moderately acidic and effective cation exchange capacity (ECEC) was higher on topsoil (13.1 cmol/kg) than subsoil (7.9 cmol/kg). Measurements on bulk density showed lower on topsoil (1.05 g/cm3). Nutrients such as P, Mg, Fe, and Al showed significant variability between age groups. Cumulative net mineralization was +0.7 and nitrification was -0.4 mg/kg of soil. The average C: N ratios of the soil were highest in the subsoil (17:1). Harvesting of the stem and branches only would remove 92% of the biomass but only 64% of the nutrients in the stand. Fast growing plantations are effective for carbon sinks both in biomass and in soil. The result clearly emphasized that leaving barks and foliage during harvesting will maintain the availability of nutrients and save nutrients from being lost.
Keywords Nutrient Budgets, Cupressus, Nitrogen Transformation, Carbon Sequestration, Biomass
1. Introductioni
Cupressus lusitanica (Miller) have been widely planted in Ethiopia as commercial plantations because of its adaptations to a wide range of geographical areas and fast growth rate compared to slow growth rate and low economic return of indigenous species. The planted forest resources are estimated about 400,000 ha only in the whole country[1]. Eucalyptus and Cupressus are the main species in industrial plantations (58% and 29% respectively), followed by Juniperus procera (4%), pinus (2%) and other species about 7%[2].
Soils are a major component of terrestrial ecosystems providing storage pools for nutrients, water, and a medium to support terrestrial plant. Forest soil nutrient pools can be dramatically affected by tree harvesting or removal of forest biomass, soil erosion and leaching[3]. Nutrient removals depend on the types of biomass removed; bole wood is low in nutrient concentration, but bark and foliage are quite high[4-5]. Estimating nutrient pool in the soil is one of the best methods to see the overall supply of plant nutrients available compared to the estimated needs by the plant. A review by[6] described that the validity of nutrient budget
* Corresponding author: [email protected] (Dessie Assefa) Published online at http://journal.sapub.org/re Copyright © 2013 Scientific & Academic Publishing. All Rights Reserved
calculations for any ecosystem depends on the completeness of the assessment of various nutrient exchange processes in the ecosystem. It involves a series of interrelated processes such as rock weathering, atmospheric deposition, organic matter decomposition and mineralization, and nutrient uptake.
Nutrients contained in organic matter must undergo mineralization and only nutrients contained in the soil solution are readily available for plant uptake. A study by[7] suggested that leaching of nitrate from forest soils and the rate of turnover may be largely dependent on the density and activity of the microbial community. Many studies[8-11] revealed that N availability, net N mineralization, and nitrification tend to increase after harvest and decline with increasing stand age. In the past, estimates of N mineralization have been limited under controlled conditions in laboratory incubations of soil. In contrast, in-situ measurements in natural ecosystem have allowed for N mineralization in the field with different methods[12].
Carbon stocks vary in different tree components. For example, studies in a species of Chinese fir, trunks account for a major part of the C stock, usually amounting to more than 60% of total vegetation C stock[13]. Many results suggested that in monoculture plantations, rates of decomposition and nutrient release are slow[14-15]. This phenomenon affects the C: N ratio. The carbon nitrogen ratio added to the soil depends on organic matter quality[16] - the availability of C in the material relative to its available N.
184 Dessie Assefa et al.: Nutrient Budgets in Cupressus lusitanica (Mill.) Plantations of Different Age
The C: N ratio is generally lower in subsoil than in topsoil [17-18].
This study needs to know the nutrient pools distribution, magnitude of nutrient transfer in the soil- plant system and ecosystem responses to anthropogenic disturbances. The primary objective of the study is to explore the total amount of nutrient fraction in the soil used by the plantation under suitable environmental conditions. Further investigation is to examine the path ways and rates of nutrient flow to/from the forest ecosystem and to understand the effects of harvesting on long term productivity. In addition the potential of small scale fast growing plantation to sequester carbon and attenuate anthropogenic CO2 emissions will be predicted. Large gaps exist today in the knowledge of nutrient pools in the soil and removal from the ecosystem through harvesting and its effect in the next rotation periods of plantation management activities. The output is highly significant to the forest managers to know the potential of soil to store enough nutrients and to provide the right combination of chemicals to keep new plantations growing properly after harvesting. Moreover, it can be used to increase the productivity of fast growing plantations by using the application of scientific management and additional effort for the contribution of CO2 emission reductions.
2. Materials and Methods
2.1. The Study Area
The study area is geographically located at 8o 10' North 37o 10' East in Tiro-Afera and Limu-Kosa ‘Weredas’, Jimma Zone of the Oromia Region, Ethiopia. It is situated along a volcanic mountain ridge, running almost north to south, and rising to a series of peaks approximately 1650 to 3020 meter above sea level. The soils are derived from weathered volcanic rocks, mainly reddish in colour in the majority of the area, deep soil (> 100 cm) and are of fine to medium texture. The soils of the study area can be classified as Nitosols. The mean annual maximum temperature is 24.3ć and minimum temperature is 3.8ć. The annual precipitation ranges from 1,100 to 1,800 mm. Tiro Boter Becho forest currently covers an area of 34,000 ha of both natural forest and manmade plantations. The plantation covers about 2294 ha of mostly Cupressus lusitanica and Pinus patula species. The C. lusitanica plantation has the highest area coverage which is mainly used to produce construction materials. The establishment of these plantations began around 1978 through clearing of natural forests by fire and adjacent farmlands while the heavy exploitation of forests started since the 1987 with the establishment of sawmill and produce 3600 m3 of lumber per year in its full capacity.
2.2. Experimental Design
A stratified random sampling was employed to ensure a more even distribution of sampling in all parts of the population and to compare the effect between age groups.
The C. lusitanica plantation stratified in to three age groups (12, 22, and 30 year’s old stand) with four replications at the same geology and soil type. Twelve samples per stratum were allocated randomly throughout the observation sites for soil nutrient pool analysis. Four sample trees per stratum, approximately mean basal area of the stratum, were selected through k nearest tree method to a sample point and analyzed by destructive methods for biomass analysis as well as stand nutrient pool analysis in the above ground woody biomass of C. lusitanica stand.
2.3. Inventory of Stand and Biomass Estimation
The standing tree nutrient analyses were carried out by destructive sampling method from twelve trees with diameter approximately the same as the tree of mean basal area of each stand. Diameters at breast height (DBH at 1.3 m) measurements were taken for each standing sample tree and tree height as well to determine the basal area, volume, and biomass of the stand. Four trees per stratum (approximately equal to mean diameter) were selected, cut down at height of 10 cm from the ground, and separated into the stem, branch, bark, and leaf components. The biomass of the tree was interpolated from the disks taken randomly along the entire tree height. This biomass estimation was used to select the best estimator and calculate tree density. The weight of each disk (2 to 5 cm wide slice) was measured by using an electronic balance to the nearest of 0.01 g and its volume by water displacement system. Composite foliage, branch, bark, and stem samples with 50 g of fresh weight were taken from various positions of tree part for nutrient analysis and oven dried at 60ć for one week. The biomass of each tree component was estimated based on an allometric equation[19] of the following forms:
DE HDBHYBiomass *)( � (1) :KHUH�µȕ¶�DQG�µĮ¶�DUH�FRQVWDQWV��µ+¶�KHLJKW�DQG�µ'%+¶�LV�
diameter at breast height. This relationship is used often in its log-transformed form:
)*ln()ln()ln( HDBHY DE � (2) Therefore, the allometric equations developed by[20-21]
as a function of DBH and H were used to estimate the biomass of each tree components.
)*2(*922163.03001.10)( HDBHLnDWsLn ��� )/( treeMgbiomassstem (3)
)/(406.0420.0 treekgbranchDBHY � (4) )/(695.018.0 treekgfoliageDBHY � (5) )/(099.0308.10 treekgbarkDBHY � (6)
Where: Ln = Neperian logarithm, DWs = dry weight stem
(Mg/tree), DBH = diameter to 1.30 m (cm), H = total height (m), Y = expected biomass (kg/tree)
2.4. Nutrient Pools in the Stand
Well mixed composite samples from each tree component were oven-dried and grounded to powder using a ball mill. Samples were analyzed for total organic carbon and nitrogen by using an automated C-N-S analyzer (Heraeus Vario EL).

Resources and Environment 2013, 3(6): 183-193 185
Total phosphorus and S, Na, K, Ca, Mg, Mn, Fe and Al were determined after digestion under pressure with HNO3. Nutrient pool size was determined by the mean concentration of each nutrient by the mean dry weight for each component and calculated to the total volume of the stand per hectare.
2.5. C: N ration
Samples were grounded to a particle size <0.5 mm and homogenized. Only 3-5 mg was used for analysis. The samples were re-dried in the laboratory and total carbon concentration was analyzed by total C & N analyzer. The concentration was measured by the laboratory technical standards and available instruments in Georg-August University, Goettingen, Germany. With this method, total nitrogen concentration was also analyzed at the same time as analysis for total carbon concentration.
Carbon content of each component (Ci) was estimated as the product of estimated biomass of the component (Bi) and the relevant estimated mean carbon concentration(C):
CBCii
* (7) Total carbon content (CT) in the above-ground biomass
pools in the hectare was estimated as the sum of components (Ci) multiplied by the total number of tree per hectare (N):
1*
n
T i
i
C C N
¦ (8)
Carbon content in the soil was also analysed and calculated in the same procedures as the above.
2.6. Nutrient Pools in the Soil
Twelve samples per stratum were allocated randomly throughout the observation sites. The total numbers of sampling points were 36 and the profile analysis was divided into two soil depths. The upper soil depth was up to 20 cm from the top and the lower one was from 20-50 cm. For laboratory analysis, a composite soil samples from each stratum were collected. The total number of composite soil samples for lab analyses were 24 (3 age group X 2 depth X 4 replications). Well mixed composite soil samples from each soil depth after air dried and sieved were grounded to powder using a ball mill. Soil samples were analysed for total organic carbon and nitrogen by using an automated C-N-S analyser (Heraeus Vario EL) and effective exchangeable cations (Ca2+, Mg2+, K+, Na+, Al3+, and H+) by percolation with 1M NH4Cl followed by atomic absorbance spectrometry at field pH. Total phosphorus and S, Na, K, Ca, Mg, Mn, Fe and Al were determined after digestion under pressure with HNO3. The pH of soil was very important parameter measured for each individual replicate by using a glass electrode. All chemical analysis was done at Büsgen Institute of George-August University, soil science of tropical and subtropical ecosystem, Germany.
Bulk density was measured by using a ring with a known volume pushed in to the sides of the horizon. A piece of wood was placed over the ring and hit the wood with hammer. Bulk soil samples from each horizon (N=24) were
taken and placed in a labelled container. Using a trowel, the ring was removed from the horizon and trimmed the soil around the ring until it is flat against the edges so that the volume of the soil is the same as the volume of the ring. The weight was measured by using electronic balance to the nearest of 0.01 g and dried in the oven to calculate moisture content and dry mass.
Chemical analyses of solid-phase nutrient concentrations were determined on a weight basis (g nutrient per kg of soil) for each soil horizon. To convert nutrient concentrations on a weight basis to a unit area basis (i.e., kg/ha), the mass of soil contained within each soil horizon was determined. This was calculated by measuring the thickness of each horizon and multiplying by the bulk density. Based on the nutrient concentrations (g/kg) and the weight of a particular horizon (kg), the nutrient pool (kg/ha) associated with a given horizon was calculated. The nutrient pool associated with a given soil was then determined by summing the nutrient pool associated with each soil horizon within the two zones and interpolated to hectare basis as shown in the following equation:
vdbkN *** U (9) Where: N = total nutrient of each element; k =
concentration of element per gram of sample soil; ȡE = bulk density of soil; d = soil depth (horizon); and v = volume of soils in a hectare.
2.7. Net Mineralization and Nitrification at Field Level
Net nitrogen transformation rates (nitrogen mineralization and nitrifications) were estimated in the field by using Closed- Top Solid Cylinders method[20]. Thirty six PVC cylinders (5 cm diameter by 22 cm length) were driven in to the soil at random locations in the stratum. The cylinders were kept for 7 days in the ground for incubation and their tops were covered with thin plastic sheet. After 7 days, the incubated cylinders were removed, and soils from each incubated cylinders were taken giving 36 samples for extraction and analysis of NH4
+ and NO3-. The same amounts
of soil samples were also taken from the same site to estimate the initial concentrations of NH4
+ and NO3- before the
incubation and 6 blank samples to analyse the contamination of K2SO4. To hinder biological activity, extracted samples were kept cool by using cool box after removal from the field until analysed in the laboratory. Field moist soils were sieved through a coarse mesh screen (2- mm opening). The resulting fine and coarse fractions from each soil core were weighed. A well mixed, 10 g soil equivalent subsample was extracted with 100 ml of 0.5 M K2SO4. The suspensions were shaken over the next 1 h to ensure complete replacement of NH4
+ by K+ on the soil cation exchange sites. The suspension was filtered through filter paper (Whatman no. 1) that has been previously leached with K2SO4 or deionised water to remove any NH4
+ and NO3- contamination in the filter paper. The filtered extracts were then analysed for NH4
+ and NO3-. Net
N mineralization was calculated by subtracting the initial quantity of soil inorganic-N from post incubation quantity of
186 Dessie Assefa et al.: Nutrient Budgets in Cupressus lusitanica (Mill.) Plantations of Different Age
soil inorganic-N. Net N mineralization = (NH4
+-N + NO3--N)t1 - (NH4
+-N + NO3
--N)t0 where: t is time. (10) Similarly, net nitrification was calculated as the change in
NO3- pool size over the incubation period. Net Nitrification = (NO3
--N)t1 - (NO3--N)t0 (11)
2.8. Data Analysis
Nutrient concentrations in the soil were compared between age groups and soil horizons or depth. The stand nutrient pools were compared between age groups and tree components. Two-way analyses of variance (ANOVA) were used to determine the statistical significance for differences in carbon sequestration and nutrient pools between age groups, soil depth and tree components. In addition, Tukey’s pairwise comparisons were used to determine statistically significant differences within each variable that was analysed. In general, data from the field and laboratory results were statistically analysed by using STATISTICA 7 VRIWZDUH�SDFNDJH��6WDWLVWLFDO� VLJQLILFDQFH�ZDV� IL[HG� DW� Į� �0.05 for most analysis.
3. Results
3.1. Nutrient Pools in the Soil
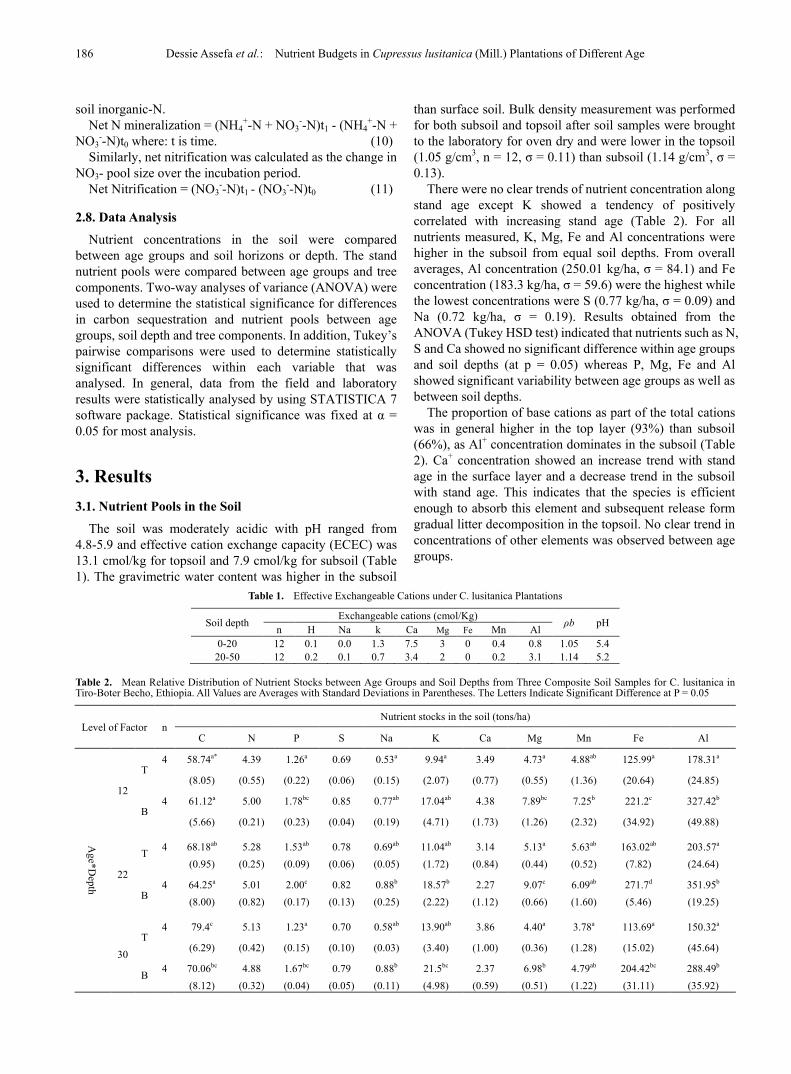
The soil was moderately acidic with pH ranged from 4.8-5.9 and effective cation exchange capacity (ECEC) was 13.1 cmol/kg for topsoil and 7.9 cmol/kg for subsoil (Table 1). The gravimetric water content was higher in the subsoil
than surface soil. Bulk density measurement was performed for both subsoil and topsoil after soil samples were brought to the laboratory for oven dry and were lower in the topsoil (1.05 g/cm3, n = ����ı� �������WKDQ�VXEVRLO�������J�FP3��ı� �0.13).
There were no clear trends of nutrient concentration along stand age except K showed a tendency of positively correlated with increasing stand age (Table 2). For all nutrients measured, K, Mg, Fe and Al concentrations were higher in the subsoil from equal soil depths. From overall averages, Al concentration ��������NJ�KD��ı� �������DQG�)H�FRQFHQWUDWLRQ��������NJ�KD��ı� �������ZHUH the highest while the lowest concentrations ZHUH�6�������NJ�KD��ı� �������DQG�1D� ������ NJ�KD�� ı� � ������� 5HVXOWV� REWDLQHG� IURP� WKH�ANOVA (Tukey HSD test) indicated that nutrients such as N, S and Ca showed no significant difference within age groups and soil depths (at p = 0.05) whereas P, Mg, Fe and Al showed significant variability between age groups as well as between soil depths.
The proportion of base cations as part of the total cations was in general higher in the top layer (93%) than subsoil (66%), as Al+ concentration dominates in the subsoil (Table 2). Ca+ concentration showed an increase trend with stand age in the surface layer and a decrease trend in the subsoil with stand age. This indicates that the species is efficient enough to absorb this element and subsequent release form gradual litter decomposition in the topsoil. No clear trend in concentrations of other elements was observed between age groups.
Table 1. Effective Exchangeable Cations under C. lusitanica Plantations
Soil depth Exchangeable cations (cmol/Kg) ȡE pH n H Na k Ca Mg Fe Mn Al
0-20 12 0.1 0.0 1.3 7.5 3 0 0.4 0.8 1.05 5.4 20-50 12 0.2 0.1 0.7 3.4 2 0 0.2 3.1 1.14 5.2
Table 2. Mean Relative Distribution of Nutrient Stocks between Age Groups and Soil Depths from Three Composite Soil Samples for C. lusitanica in Tiro-Boter Becho, Ethiopia. All Values are Averages with Standard Deviations in Parentheses. The Letters Indicate Significant Difference at P = 0.05
Level of Factor n Nutrient stocks in the soil (tons/ha)
C N P S Na K Ca Mg Mn Fe Al
Age*D
epth
12
T 4 58.74a* 4.39 1.26a 0.69 0.53a 9.94a 3.49 4.73a 4.88ab 125.99a 178.31a
(8.05) (0.55) (0.22) (0.06) (0.15) (2.07) (0.77) (0.55) (1.36) (20.64) (24.85)
B 4 61.12a 5.00 1.78bc 0.85 0.77ab 17.04ab 4.38 7.89bc 7.25b 221.2c 327.42b
(5.66) (0.21) (0.23) (0.04) (0.19) (4.71) (1.73) (1.26) (2.32) (34.92) (49.88)
22
T 4 68.18ab 5.28 1.53ab 0.78 0.69ab 11.04ab 3.14 5.13a 5.63ab 163.02ab 203.57a
(0.95) (0.25) (0.09) (0.06) (0.05) (1.72) (0.84) (0.44) (0.52) (7.82) (24.64)
B 4 64.25a 5.01 2.00c 0.82 0.88b 18.57b 2.27 9.07c 6.09ab 271.7d 351.95b
(8.00) (0.82) (0.17) (0.13) (0.25) (2.22) (1.12) (0.66) (1.60) (5.46) (19.25)
30 T
4 79.4c 5.13 1.23a 0.70 0.58ab 13.90ab 3.86 4.40a 3.78a 113.69a 150.32a
(6.29) (0.42) (0.15) (0.10) (0.03) (3.40) (1.00) (0.36) (1.28) (15.02) (45.64)
B 4 70.06bc 4.88 1.67bc 0.79 0.88b 21.5bc 2.37 6.98b 4.79ab 204.42bc 288.49b
(8.12) (0.32) (0.04) (0.05) (0.11) (4.98) (0.59) (0.51) (1.22) (31.11) (35.92)

Resources and Environment 2013, 3(6): 183-193 187
3.2. Nutrient Pools in above Ground Biomass
Allometric equations developed by[20-21] were applied to estimate the total above ground biomass as a function of DBH and height. Accordingly, the calculated average above ground biomass of 195.2 tons/ha at age 22 had an overall distribution of 82% stem, 8.7% branches, 7.2% bark and 2.1% foliage. Consequently, branch, bark and foliage accounted only 18 % of the dry matter but with the exception of carbon, they contained more than 53% of the total nutrients in a hectare. These distributions do not have significant variation between age groups of a species, however, the biomass increased as ages of trees increased. The empirically determined nutrients pools for each tree components and the fractions of biomass to each tree components are shown in Table 3. Nutrients stored in above ground biomass were in the order of Ca (45%), N (28%), K (19%), Mg (3%) and P (2%).
3.3. C: N ratio and Carbon Concentrations
Concentrations of organic carbon and total nitrogen were high in the topsoil (Figure 1). The C: N ratio of the soil under C. lusitanica SODQWDWLRQ� ZDV� ����� �Q ���� ı ������ LQ� WKH�WRSVRLO�DQG������ �Q ����ı ������ LQ� WKH� VXEVRLO�RQ�DYHUDJH��The average C: N ratio of stem, branch, bark and foliage from 12 sample trees were 254:1, 188:1, 86:1 40:1 respectively. Carbon showed a slight increase with stand age
however the maximum total nitrogen was found in the foliage (Figure 1).
The total organic carbon in soil and above ground biomass and the relative differences in concentration between different age groups were measured after samples have been brought to the laboratory. Both topsoil and subsoil showed similar trends and positively correlated of organic carbon concentrations with an increasing stand age. Results of the present study depicted that the total net organic carbon accumulated in above ground biomass was 192.4 tons/ha in 30 years stand (Table 3) and that of soil was 149.4 Mg/ha up to the depth of 50 cm (Table 4). There was a net accumulation of carbon more than 30 tons/ ha in the soil within 30 years.
Organic carbon constitutes about 51% of the total biomass of the stand and this distribution is almost equal in each tree components except bark 47%. Carbon concentration increased with age in the stem as more dry matter allocation towards stem may be related to rapid growth rate of the species. Mean N, P, S, K, Mg, Mn, Fe and Al concentration per kg of dry matter were quite high in both leaves and bark in the order of stem < branch < bark < foliage (Table 4). Of all the nutrients, the relative abundance of Na and Ca concentration in the bark were significantly higher (p < 0.05, p < 0.01 respectively) than concentration in the stem. No clear trends were found between nutrient pools and stand age.
Table 3. Relative Distribution and Storage of Nutrients between the Common Tree Components of Cupressus lusitanica
Tree
component
Age
Biomass
kg/ha
Nutrient content, Kg/ha
C N P S Na K Ca Mg Mn Fe Al
Stem
12 30705.9 15405.6 56.0 3.1 3.2 1.1 25.5 58.9 3.3 0.1 1.9 2.1 22 160078.7 81069.5 312.5 13.1 23.3 3.9 120.7 239.4 20.0 0.2 5.0 3.1 30 313299.0 159588.4 696.9 28.3 47.7 7.6 321.2 523.8 36.2 0.4 10.4 7.7
Branch
12 5569.9 2794.9 15.6 1.2 1.2 0.2 11.3 35.7 1.9 0.0 0.5 0.5 22 17004.1 8861.6 45.9 4.0 3.3 0.7 31.1 91.1 5.8 0.2 1.3 1.3 30 35855.2 17986.9 93.9 5.8 8.1 1.6 78.5 268.8 16.1 0.3 4.9 5.2
Bark
12 3240.1 1458.0 17.7 2.8 2.1 0.3 30.6 102.7 3.0 0.1 0.7 0.8 22 14097.3 6605.0 84.5 9.1 9.5 0.9 120.5 331.6 19.7 0.6 6.0 6.4 30 24642.9 11844.2 127.1 11.3 14.2 1.5 202.4 518.7 23.6 0.4 6.3 6.7
Foliage 12 2626.9 1618.6 33.4 3.2 2.7 0.1 26.6 49.8 4.6 0.1 1.0 0.9 22 4017.0 2097.9 49.6 4.4 4.2 0.1 39.5 65.4 6.0 0.3 1.3 1.3 30 5838.9 2981.5 77.5 6.9 7.0 0.2 76.1 119.5 10.6 0.2 2.6 2.5
Table 4. Comparison of Nutrient Concentrations between Tree Components and Age Groups. All Values are Averages with Standard Deviations in Parenthesis and Letters Indicate Significant Difference at P = 0.05
Tree component n
C N P S Na K Ca Mg Mn Fe Al
g/Kg
Stem 3 505.91a 2.36a 0.13a 0.17a 0.03a 1.27a 3.15a 0.20a 0.002a 0.05a 0.04a
(3.93) (0.48) (0.08) (0.04) (0.01) (0.69) (2.73) (0.14) (0.002) (0.03) (0.04)
Branch 3 509.39a 2.74a 0.20a 0.21a 0.04ab 2.02a 6.40a 0.38a 0.008a 0.10a 0.11a
(13.17) (0.14) (0.04) (0.02) (0.00) (0.16) (1.109) (0.06) (0.003) (0.04) (0.04)
Bark 3 467.4b 5.59b 0.66b 0.64b 0.07b 8.72b 25.54b 1.10b 0.028ab 0.32b 0.34b (14.25) (0.43) (0.23) (0.06) (0.02) (0.87) (5.47) (0.24) (0.013) (0.10) (0.11)
Foliage 3 514.97a 12.13c 1.15c 1.09c 0.04ab 10.88b 18.64b 1.69c 0.057b 0.39b 0.37b (6.27) (1.06) (0.04) (0.09) (0.02) (1.73) (2.24) (0.15) (0.028) (0.05) (0.05)

188 Dessie Assefa et al.: Nutrient Budgets in Cupressus lusitanica (Mill.) Plantations of Different Age
C:N ratio in the soil
Wilks lambda=.21923, F(4, 16)=4.5430, p=.01214Vertical bars denote 0.95 confidence intervals
12 22 30Stand age
10
11
12
13
14
15
16
17
18
19
20
21
b
a a
a
ab b
Top Bottom
C:N Ratio within each tree component
Wilks lambda=.09122, F(8, 10)=2.8887, p=.05956Vertical bars denote 0.95 confidence intervals
12 22 30Age
0
50
100
150
200
250
300
350
ba ab
Stem Branch Bark Foliage
(a) (b)
C accumlation in soil and wood
12 22 30Age
0
20
40
60
80
100
120
140
160
180
200
220
C (to
nes/
ha)
b
a
b
c
aab
Top and bottom Wood
C concentration in the soil
Wilks lambda=.25643, F(4, 16)=3.8990, p=.02140Vertical bars denote 0.95 confidence intervals
Top Bottom
12 22 30Stand age
10
15
20
25
30
35
40
45
C (g
/kg
of s
oil) b
ab a
(c) (d)
Figure 1. C: N ratio in soil (a) C: N ratio in tree components (b) carbon accumulation in the soil and wood (c) and carbon concentration in the soil (d) in the forest soil and above ground biomass of C. lusitanica plantation in Tiro- Boter Becho, Ethiopia. The letters indicate significant difference at P = 0.05
3.4. Nitrogen Transformation
The study of N- transformation indicated that a significant mode of NH4
+ and NO3- transfer in the plantation site. In all
sites, both NH4+-N and NO3
—N concentrations showed a decrease trend with increasing stand age before and after incubations. The NH4
+-1�SRRO�ZDV�UDQJLQJ�IURP���������ı� ��������Q� �����J�NJ�DW�DJH����WR���������ı� ��������Q� �����J�NJ� RI� VRLO� DW� DJH� ��� EHIRUH� LQFXEDWLRQ� DQG� ������� �ı� �0.006, n = 12) g/NJ�DW�DJH����WR���������ı� ��������Q� �����g/kg of soil at age 30 after seven days of incubation. Mineralization and nitrification from 36 sample points after 7 days incubation in soil to the depth of 20 cm at C.
lusitanica plantation were +0.7 and -0.4 mg/kg of soil respectively. Net nitrification at oldest stand showed below detection limit in both cases (Figure 2). The positive net mineralization rate suggested net accumulation of NH4
+ and the negative sign for rapid immobilization during 7 days of incubation.
At age 22 both showed slight variation (�������ı� ��������Q� �����EHIRUH�DQG��������ı� ��������Q� �����DIWHU�IRU�NH4
+ and �������ı� ��������Q� ����EHIRUH��������ı� ��������Q� �����after 7 days incubation for NO3
-). In general, NO3-
concentrations are lower than NH4+ concentrations before
and after incubations. The concentrations of both NH4+ and
NO3- at age 12 has no significant variations (�������ı� ��������
Q� ���� EHIRUH� DQG� ������ �ı� ������� Q� � ���� DIWHU� �� GD\V�incubation for NH4
+ DQG��������ı� ��������Q� �����EHIRUH�DQG��������ı� ��������Q� �����DIWHU���GD\V�LQFXEDWLRQ�IRU�123
-). Net mineralization and nitrification
Wilks lambda=.80415, F(4, 64)=1.8424, p=.13160Vertical bars denote 0.95 confidence intervals
12 22 30Age
-0.006
-0.004
-0.002
0.000
0.002
0.004
0.006
0.008
g/kg of soil
Net Minerlization Net Nitrification
Figure 2. Nitrogen concentrations under C. lusitanica plantation soil
Resources and Environment 2013, 3(6): 183-193 189
4. Discussion
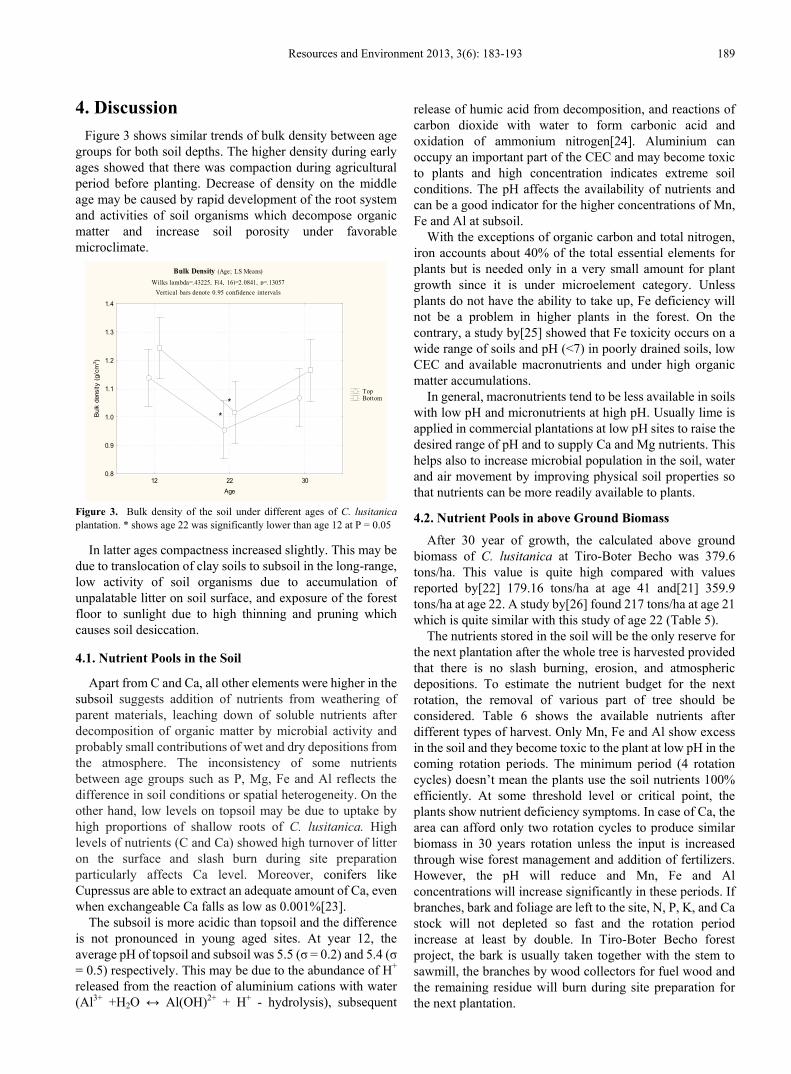
Figure 3 shows similar trends of bulk density between age groups for both soil depths. The higher density during early ages showed that there was compaction during agricultural period before planting. Decrease of density on the middle age may be caused by rapid development of the root system and activities of soil organisms which decompose organic matter and increase soil porosity under favorable microclimate.
Bulk Density (Age; LS Means)
Wilks lambda=.43225, F(4, 16)=2.0841, p=.13057Vertical bars denote 0.95 confidence intervals
Top Bottom
12 22 30Age
0.8
0.9
1.0
1.1
1.2
1.3
1.4
Bul
k de
nsity
(g/
cm3 )
**
Figure 3. Bulk density of the soil under different ages of C. lusitanica plantation. * shows age 22 was significantly lower than age 12 at P = 0.05
In latter ages compactness increased slightly. This may be due to translocation of clay soils to subsoil in the long-range, low activity of soil organisms due to accumulation of unpalatable litter on soil surface, and exposure of the forest floor to sunlight due to high thinning and pruning which causes soil desiccation.
4.1. Nutrient Pools in the Soil
Apart from C and Ca, all other elements were higher in the subsoil suggests addition of nutrients from weathering of parent materials, leaching down of soluble nutrients after decomposition of organic matter by microbial activity and probably small contributions of wet and dry depositions from the atmosphere. The inconsistency of some nutrients between age groups such as P, Mg, Fe and Al reflects the difference in soil conditions or spatial heterogeneity. On the other hand, low levels on topsoil may be due to uptake by high proportions of shallow roots of C. lusitanica. High levels of nutrients (C and Ca) showed high turnover of litter on the surface and slash burn during site preparation particularly affects Ca level. Moreover, conifers like Cupressus are able to extract an adequate amount of Ca, even when exchangeable Ca falls as low as 0.001%[23].
The subsoil is more acidic than topsoil and the difference is not pronounced in young aged sites. At year 12, the DYHUDJH�S+�RI�WRSVRLO�DQG�VXEVRLO�ZDV������ı� ������DQG������ı�= 0.5) respectively. This may be due to the abundance of H+ released from the reaction of aluminium cations with water (Al3+ +H22� ļ� $O�2+�2+ + H+ - hydrolysis), subsequent
release of humic acid from decomposition, and reactions of carbon dioxide with water to form carbonic acid and oxidation of ammonium nitrogen[24]. Aluminium can occupy an important part of the CEC and may become toxic to plants and high concentration indicates extreme soil conditions. The pH affects the availability of nutrients and can be a good indicator for the higher concentrations of Mn, Fe and Al at subsoil.
With the exceptions of organic carbon and total nitrogen, iron accounts about 40% of the total essential elements for plants but is needed only in a very small amount for plant growth since it is under microelement category. Unless plants do not have the ability to take up, Fe deficiency will not be a problem in higher plants in the forest. On the contrary, a study by[25] showed that Fe toxicity occurs on a wide range of soils and pH (<7) in poorly drained soils, low CEC and available macronutrients and under high organic matter accumulations.
In general, macronutrients tend to be less available in soils with low pH and micronutrients at high pH. Usually lime is applied in commercial plantations at low pH sites to raise the desired range of pH and to supply Ca and Mg nutrients. This helps also to increase microbial population in the soil, water and air movement by improving physical soil properties so that nutrients can be more readily available to plants.
4.2. Nutrient Pools in above Ground Biomass
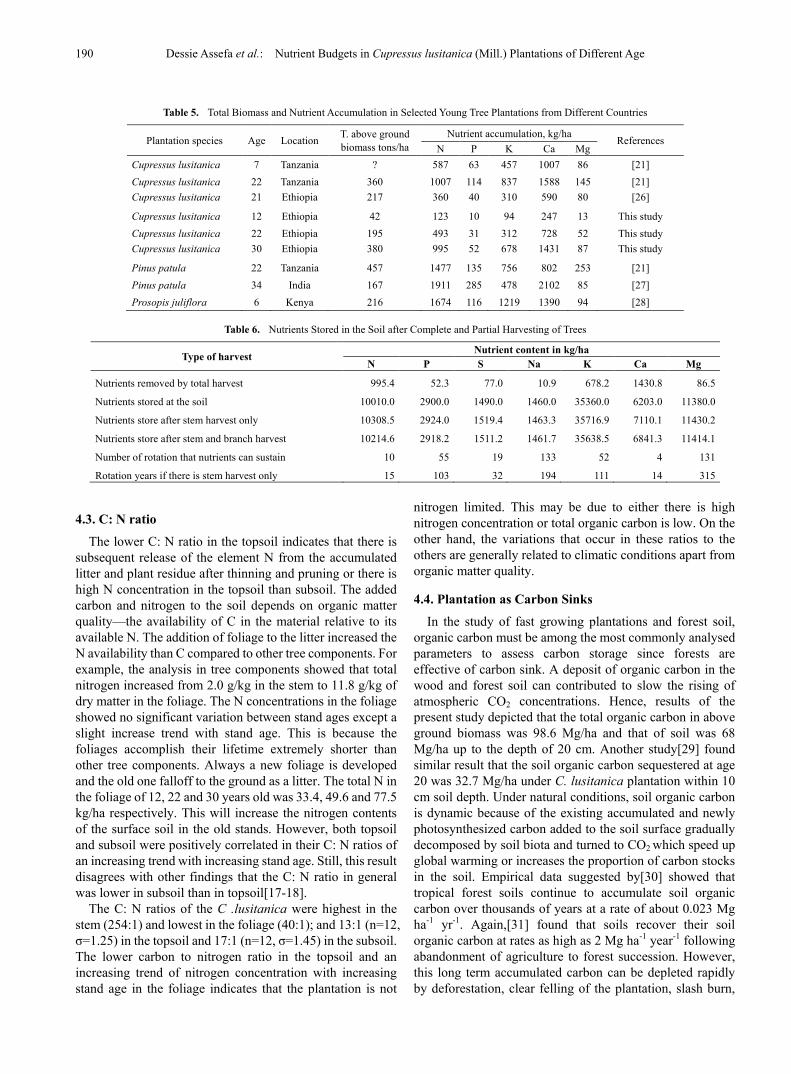
After 30 year of growth, the calculated above ground biomass of C. lusitanica at Tiro-Boter Becho was 379.6 tons/ha. This value is quite high compared with values reported by[22] 179.16 tons/ha at age 41 and[21] 359.9 tons/ha at age 22. A study by[26] found 217 tons/ha at age 21 which is quite similar with this study of age 22 (Table 5).
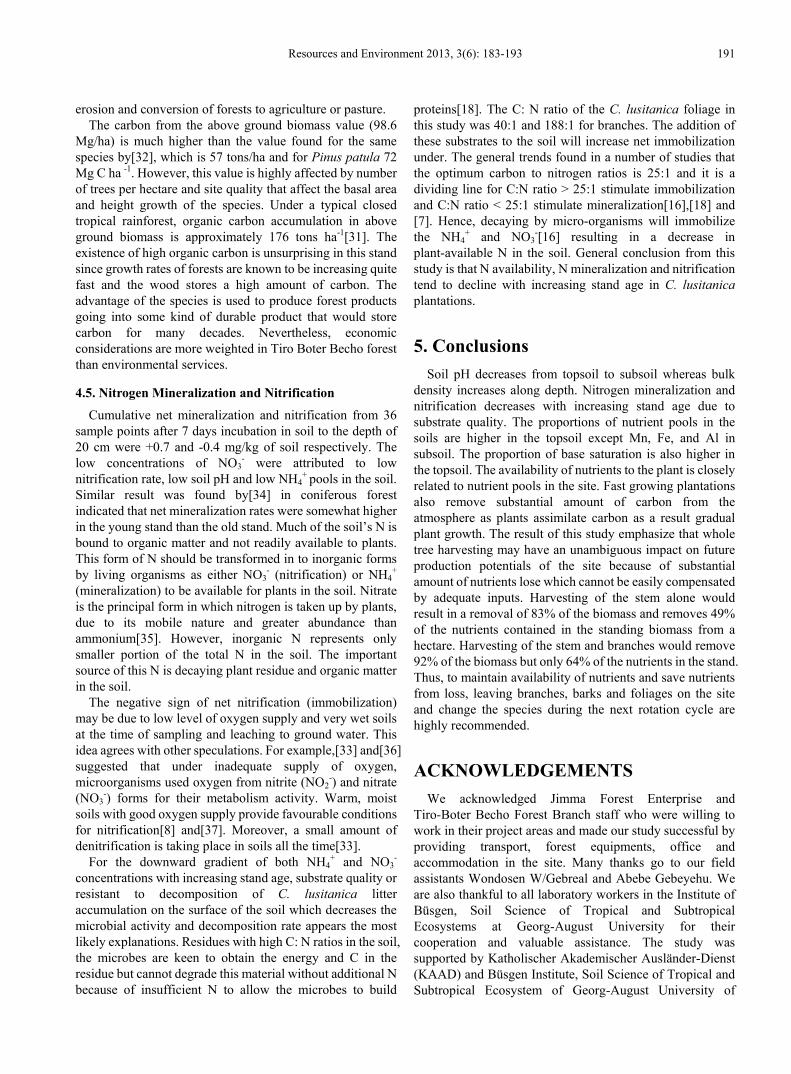
The nutrients stored in the soil will be the only reserve for the next plantation after the whole tree is harvested provided that there is no slash burning, erosion, and atmospheric depositions. To estimate the nutrient budget for the next rotation, the removal of various part of tree should be considered. Table 6 shows the available nutrients after different types of harvest. Only Mn, Fe and Al show excess in the soil and they become toxic to the plant at low pH in the coming rotation periods. The minimum period (4 rotation cycles) doesn’t mean the plants use the soil nutrients 100% efficiently. At some threshold level or critical point, the plants show nutrient deficiency symptoms. In case of Ca, the area can afford only two rotation cycles to produce similar biomass in 30 years rotation unless the input is increased through wise forest management and addition of fertilizers. However, the pH will reduce and Mn, Fe and Al concentrations will increase significantly in these periods. If branches, bark and foliage are left to the site, N, P, K, and Ca stock will not depleted so fast and the rotation period increase at least by double. In Tiro-Boter Becho forest project, the bark is usually taken together with the stem to sawmill, the branches by wood collectors for fuel wood and the remaining residue will burn during site preparation for the next plantation.
190 Dessie Assefa et al.: Nutrient Budgets in Cupressus lusitanica (Mill.) Plantations of Different Age
Table 5. Total Biomass and Nutrient Accumulation in Selected Young Tree Plantations from Different Countries
Plantation species Age Location T. above ground biomass tons/ha
Nutrient accumulation, kg/ha References N P K Ca Mg
Cupressus lusitanica 7 Tanzania ? 587 63 457 1007 86 [21] Cupressus lusitanica 22 Tanzania 360 1007 114 837 1588 145 [21] Cupressus lusitanica 21 Ethiopia 217 360 40 310 590 80 [26]
Cupressus lusitanica 12 Ethiopia 42 123 10 94 247 13 This study Cupressus lusitanica 22 Ethiopia 195 493 31 312 728 52 This study Cupressus lusitanica 30 Ethiopia 380 995 52 678 1431 87 This study
Pinus patula 22 Tanzania 457 1477 135 756 802 253 [21] Pinus patula 34 India 167 1911 285 478 2102 85 [27] Prosopis juliflora 6 Kenya 216 1674 116 1219 1390 94 [28]
Table 6. Nutrients Stored in the Soil after Complete and Partial Harvesting of Trees
Type of harvest Nutrient content in kg/ha
N P S Na K Ca Mg
Nutrients removed by total harvest 995.4 52.3 77.0 10.9 678.2 1430.8 86.5
Nutrients stored at the soil 10010.0 2900.0 1490.0 1460.0 35360.0 6203.0 11380.0
Nutrients store after stem harvest only 10308.5 2924.0 1519.4 1463.3 35716.9 7110.1 11430.2
Nutrients store after stem and branch harvest 10214.6 2918.2 1511.2 1461.7 35638.5 6841.3 11414.1
Number of rotation that nutrients can sustain 10 55 19 133 52 4 131
Rotation years if there is stem harvest only 15 103 32 194 111 14 315
4.3. C: N ratio
The lower C: N ratio in the topsoil indicates that there is subsequent release of the element N from the accumulated litter and plant residue after thinning and pruning or there is high N concentration in the topsoil than subsoil. The added carbon and nitrogen to the soil depends on organic matter quality—the availability of C in the material relative to its available N. The addition of foliage to the litter increased the N availability than C compared to other tree components. For example, the analysis in tree components showed that total nitrogen increased from 2.0 g/kg in the stem to 11.8 g/kg of dry matter in the foliage. The N concentrations in the foliage showed no significant variation between stand ages except a slight increase trend with stand age. This is because the foliages accomplish their lifetime extremely shorter than other tree components. Always a new foliage is developed and the old one falloff to the ground as a litter. The total N in the foliage of 12, 22 and 30 years old was 33.4, 49.6 and 77.5 kg/ha respectively. This will increase the nitrogen contents of the surface soil in the old stands. However, both topsoil and subsoil were positively correlated in their C: N ratios of an increasing trend with increasing stand age. Still, this result disagrees with other findings that the C: N ratio in general was lower in subsoil than in topsoil[17-18].
The C: N ratios of the C .lusitanica were highest in the stem (254:1) and lowest in the foliage (40:1); and 13:1 (n=12, ı ������LQ�WKH�WRSVRLO�DQG�������Q ����ı ������LQ�WKH�VXEVRLO��The lower carbon to nitrogen ratio in the topsoil and an increasing trend of nitrogen concentration with increasing stand age in the foliage indicates that the plantation is not
nitrogen limited. This may be due to either there is high nitrogen concentration or total organic carbon is low. On the other hand, the variations that occur in these ratios to the others are generally related to climatic conditions apart from organic matter quality.
4.4. Plantation as Carbon Sinks
In the study of fast growing plantations and forest soil, organic carbon must be among the most commonly analysed parameters to assess carbon storage since forests are effective of carbon sink. A deposit of organic carbon in the wood and forest soil can contributed to slow the rising of atmospheric CO2 concentrations. Hence, results of the present study depicted that the total organic carbon in above ground biomass was 98.6 Mg/ha and that of soil was 68 Mg/ha up to the depth of 20 cm. Another study[29] found similar result that the soil organic carbon sequestered at age 20 was 32.7 Mg/ha under C. lusitanica plantation within 10 cm soil depth. Under natural conditions, soil organic carbon is dynamic because of the existing accumulated and newly photosynthesized carbon added to the soil surface gradually decomposed by soil biota and turned to CO2 which speed up global warming or increases the proportion of carbon stocks in the soil. Empirical data suggested by[30] showed that tropical forest soils continue to accumulate soil organic carbon over thousands of years at a rate of about 0.023 Mg ha-1 yr-1. Again,[31] found that soils recover their soil organic carbon at rates as high as 2 Mg ha-1 year-1 following abandonment of agriculture to forest succession. However, this long term accumulated carbon can be depleted rapidly by deforestation, clear felling of the plantation, slash burn,
Resources and Environment 2013, 3(6): 183-193 191
erosion and conversion of forests to agriculture or pasture. The carbon from the above ground biomass value (98.6
Mg/ha) is much higher than the value found for the same species by[32], which is 57 tons/ha and for Pinus patula 72 Mg C ha -1. However, this value is highly affected by number of trees per hectare and site quality that affect the basal area and height growth of the species. Under a typical closed tropical rainforest, organic carbon accumulation in above ground biomass is approximately 176 tons ha-1[31]. The existence of high organic carbon is unsurprising in this stand since growth rates of forests are known to be increasing quite fast and the wood stores a high amount of carbon. The advantage of the species is used to produce forest products going into some kind of durable product that would store carbon for many decades. Nevertheless, economic considerations are more weighted in Tiro Boter Becho forest than environmental services.
4.5. Nitrogen Mineralization and Nitrification
Cumulative net mineralization and nitrification from 36 sample points after 7 days incubation in soil to the depth of 20 cm were +0.7 and -0.4 mg/kg of soil respectively. The low concentrations of NO3
- were attributed to low nitrification rate, low soil pH and low NH4
+ pools in the soil. Similar result was found by[34] in coniferous forest indicated that net mineralization rates were somewhat higher in the young stand than the old stand. Much of the soil’s N is bound to organic matter and not readily available to plants. This form of N should be transformed in to inorganic forms by living organisms as either NO3
- (nitrification) or NH4+
(mineralization) to be available for plants in the soil. Nitrate is the principal form in which nitrogen is taken up by plants, due to its mobile nature and greater abundance than ammonium[35]. However, inorganic N represents only smaller portion of the total N in the soil. The important source of this N is decaying plant residue and organic matter in the soil.
The negative sign of net nitrification (immobilization) may be due to low level of oxygen supply and very wet soils at the time of sampling and leaching to ground water. This idea agrees with other speculations. For example,[33] and[36] suggested that under inadequate supply of oxygen, microorganisms used oxygen from nitrite (NO2
-) and nitrate (NO3
-) forms for their metabolism activity. Warm, moist soils with good oxygen supply provide favourable conditions for nitrification[8] and[37]. Moreover, a small amount of denitrification is taking place in soils all the time[33].
For the downward gradient of both NH4+ and NO3
- concentrations with increasing stand age, substrate quality or resistant to decomposition of C. lusitanica litter accumulation on the surface of the soil which decreases the microbial activity and decomposition rate appears the most likely explanations. Residues with high C: N ratios in the soil, the microbes are keen to obtain the energy and C in the residue but cannot degrade this material without additional N because of insufficient N to allow the microbes to build
proteins[18]. The C: N ratio of the C. lusitanica foliage in this study was 40:1 and 188:1 for branches. The addition of these substrates to the soil will increase net immobilization under. The general trends found in a number of studies that the optimum carbon to nitrogen ratios is 25:1 and it is a dividing line for C:N ratio > 25:1 stimulate immobilization and C:N ratio < 25:1 stimulate mineralization[16],[18] and [7]. Hence, decaying by micro-organisms will immobilize the NH4
+ and NO3-[16] resulting in a decrease in
plant-available N in the soil. General conclusion from this study is that N availability, N mineralization and nitrification tend to decline with increasing stand age in C. lusitanica
plantations.
5. Conclusions
Soil pH decreases from topsoil to subsoil whereas bulk density increases along depth. Nitrogen mineralization and nitrification decreases with increasing stand age due to substrate quality. The proportions of nutrient pools in the soils are higher in the topsoil except Mn, Fe, and Al in subsoil. The proportion of base saturation is also higher in the topsoil. The availability of nutrients to the plant is closely related to nutrient pools in the site. Fast growing plantations also remove substantial amount of carbon from the atmosphere as plants assimilate carbon as a result gradual plant growth. The result of this study emphasize that whole tree harvesting may have an unambiguous impact on future production potentials of the site because of substantial amount of nutrients lose which cannot be easily compensated by adequate inputs. Harvesting of the stem alone would result in a removal of 83% of the biomass and removes 49% of the nutrients contained in the standing biomass from a hectare. Harvesting of the stem and branches would remove 92% of the biomass but only 64% of the nutrients in the stand. Thus, to maintain availability of nutrients and save nutrients from loss, leaving branches, barks and foliages on the site and change the species during the next rotation cycle are highly recommended.
ACKNOWLEDGEMENTS
We acknowledged Jimma Forest Enterprise and Tiro-Boter Becho Forest Branch staff who were willing to work in their project areas and made our study successful by providing transport, forest equipments, office and accommodation in the site. Many thanks go to our field assistants Wondosen W/Gebreal and Abebe Gebeyehu. We are also thankful to all laboratory workers in the Institute of Büsgen, Soil Science of Tropical and Subtropical Ecosystems at Georg-August University for their cooperation and valuable assistance. The study was supported by Katholischer Akademischer Ausländer-Dienst (KAAD) and Büsgen Institute, Soil Science of Tropical and Subtropical Ecosystem of Georg-August University of
192 Dessie Assefa et al.: Nutrient Budgets in Cupressus lusitanica (Mill.) Plantations of Different Age
Goettingen, Germany.
REFERENCES
[1] de Vletter, J., "Forest Genetic Resources of Ethiopia. In J. M. Engels, J. G. Hawkes, & M. Worede, Plant Genetic Resources of Ethiopia", Cambridge University Press (pp. 82-100), 1991.
[2] FAO, "Forestry Outlook Studies in Africa, Ethiopia". Rome: FAO, 2001.
[3] Jacques, R., Allie, S., Gelhaye, D., Pollier, B., Turpault, M.-P., & Granier, A., "Nutrient budgets for a rotation of a Douglas-fir plantation in the Beaujolais (France) based on a chronosequence study", Forest management and Ecology 171 , 3-14, 2002.
[4] Khanna, P. K., "Nutrient cycling under mixed-species tree systems in south east Asia", Agroforestry Systems, 22. 1998.
[5] Mackensen, J., & Fölster, H., "Study on sustainable nutrient supply in fast growing plantations: Ecological and Economic Implications in East Kalimantan", Indonesia, 1999.
[6] Titlyanova, A. A., "Nutrient budget in ecosystems", Eurasian Soil Science, 9, 2007.
[7] Bengtsson, G., Bengtson, P., & Mansson, K. F., "Gross nitrogen mineralization-, immobilization-, and nitrification rates as a function of soil C/N ratio and microbial activity", Soil Biology & Biochemistry 35, 143–154, 2003.
[8] Kim, C., "Soil Nitrogen Mineralization at Various Levels of Canopy Cover at Red Pine (Pinus resinosa) Plantation" Japanese Forestry Society, 3: 85-89, 1998.
[9] Liu, F., Toda, H., & Haibara, K., "Effects of clear-cutting and burning on characteristics of nitrogen mineralization and microbes in the forest soil of Pinus massoniana plantation in Southern China", Ecological Research, 16, 531–542, 2001.
[10] Idol, T. W., Pope, P. E., & Ponder Jr., F., "N mineralization, nitrification, and N uptake across a 100-year chronosequence of upland hardwood forests", Forest Ecology and Management, 176: 509-518, 2003.
[11] Jussy, J.-H., Ranger, J., Bienaime, S., & Dambrine, E., "Effects of a clear-cut on the in situ nitrogen mineralisation and the nitrogen cycle in a 67-year-old Douglas-fir (Pseudotsuga menziesii (Mirb.) Franco) plantation", Annals of Forest Science, 61: 397–408, 2004.
[12] Binkley, D., & Hart, S., "The components of nitrogen availability assessments in forest soils", Advances in Soil Science, Volume 10, 57-112, 1989.
[13] Wang, H., Huang, Y., Feng, Z., & Wang, S., "C and N stocks under three plantation forest ecosystems of Chinese fir, Michelia macclurei and their mixture", Front. For. China, 2(3): 251–259, 2007.
[14] Valentine, H., Tritton, L., & Furnival, G., "Subsampling trees for biomass, volume or mineral content", Forest Science, 30: 673-681, 1984.
[15] Guo, L. B., & Sims, R. E., "Eucalypt litter decomposition and nutrient release under a short rotation forest regime and
effluent irrigation treatments in New Zealand: II. internal effects", Soil Biology and Biochemistry 34, 913-922, 2002.
[16] Camberato, J. J., "Nitrogen in soils and fertilizers", South Carolina Turfgrass Foundation News, pp. 8(1):6-10, 2001.
[17] Machulla, G., Zikell, S., Kasler, M., & Jahn, R., "Microbial biomass and respiration in soils derived from lignite ashes: a profile study", Journal of plant nutrition and soil science, 167 (4), 449-456, 2004.
[18] Salome, C., Nunan, N., Pouteau, V., Lerch, T., & Chenu, C., "Carbon dynamics in topsoil and in subsoil may be controlled by different regulatory mechanisms", Global Change Biology, 2009.
[19] Aboal, J. R., Arevalo, J. R., & Fernandez, A., "Allometric relationships of different tree species and stand above ground biomass in the Gomera laurel forest (Canary Islands)", Flora - Morphology, Distribution, Functional Ecology of Plants , 264-274, 2005.
[20] Hart, C. S., John, S. m., Davidson, A. E., & Firestone, K. M., "Nitrogen mineralization, Immobilization, and nitrification", Soil science Society of America, 985-1018, 1994.
[21] Lundgren, B., "Soil conditions and nutrient cycling under natural and plantation forests in Tanzanian highlands", Uppsala: Department of Forest Soils Swedish University of Agricultural Sciences, 1978.
[22] Blandon, L., "Physical accounts of the forest in the basin of piedras Blancas, medellin (Colombia)", Colombia: Invest. Agr.: Sist. Recur, 2001.
[23] Ballard, T., & Carter, R., "Evaluating forest stand nutrient status", British Columbia: Ministry of Forests, 1986.
[24] Kumar, M. D., "The effect of pressure and temperature on aluminium hydrolysis: Implications to trace metal scavenging in natural waters", Indian Journal of Marine Sciences, Vol. 28, 1-4, 1999.
[25] Sahrawat, K. L., "Iron toxicity to rice in an acid sulphate soil as influenced by water regimes", Plant and Soil 51, 143-144, 1979.
[26] Abate, A., "Biomass and Nutrient Studies of Selected Tree Species of Natural and Plantation Forests: Implications for a Sustainable Management of the Munessa-Shashemene Forest, Ethiopia", PhD thesis, 2004.
[27] Singh, B., "Nutrient content of standing crop and biological cycling in Pinus patula ecosystem", Forest Ecol Manage 4, 317-332. 1982.
[28] Maghembe, J. A., Kariuku, E. M., & Haller, R. D., "Biomass and nutrient accumulation in young Prosopis juliflora at Mombasa, Kenya", Agroforestry Systems 1, 313-321, 1983.
[29] Bekele, L., Kleja, D. B., Olsson, M., & Nilsson, I., "Factors controlling soil organic carbon sequestration under exotic tree plantations: A case study using the CO2Fix model in south-western Ethiopia", Forest Ecology and Management 252, 124-131, 2007.
[30] Schlesinger, W., "Evidence from chronosequence studies for low carbon-storage potential of soils", Nature, 348, 232-234, 1990.
[31] Lugo, A. E., & Brown, S., "Tropical forests as sinks of

Resources and Environment 2013, 3(6): 183-193 193
atmospheric carbon", Forest Ecology and Management, 54, 239-259, 1992.
[32] Schroeder, P., "Carbon storage potential of short rotation tropical tree plantations", Forest Ecology and Management, 50, 3 I-41, 1992.
[33] Gosz, J. R., & White, C. S., "Seasonal and annual variation in nitrogen mineralization and nitrifcation along an elevational gradient in New Mexico", Biogeochemistry 2: 281-297, 1986.
[34] Davidson, A. E., Hart, C. S., & Firstone, K. M., "Internal cycling of nitrate in soils of a mature coniferous forest", Ecology, 73(4), pp. 1148-1156, 1992.
[35] Brookshire, E. N., Valett, H. M., Thomas, S. A., & Webster, J. R., "Atmospheric N Deposition Increases Organic N Loss from Temperate Forests", Ecosystems, 10: 252–262, 2007.
[36] Maly, S., Sarapatka, B., & Krskova, M., "Seasonal variability in soil N mineralization and nitrification as influenced by N fertilizer", Rostlinna Vyroba , 389-396, 2002.
[37] Brady, N., & Weil, R., "The Nature and Properties of Soil", (13 ed.), Pearson Prentice Hall, 2008.
[38] Johnson, D. W., & Curtis, P. S., "Effect of forest management on soil C and N storage: Meta analysis", Forest Ecology and Management, 227-238, 2001.