Numerical investigation of concrete subjected to high rates of uniaxial tensile loading
17
International Journal of Impact Engineering 35 (2008) 319–335 Numerical investigation of concrete subjected to high rates of uniaxial tensile loading D.M. Cotsovos, M.N. Pavlovic´ Department of Civil and Environmental Engineering, Imperial College London, London SW7 2AZ, UK Received 6 September 2006; received in revised form 8 January 2007; accepted 15 March 2007 Available online 12 April 2007 Abstract The present article is concerned with the response of structural concrete prisms to high rates of uniaxial tensile loading. The numerical investigation carried out is based on a finite-element (FE) program capable of carrying out three-dimensional (3D) nonlinear static and dynamic analyses. This program is known to yield realistic predictions to the response of a wide range of plain- and reinforced-concrete structural forms subjected to arbitrary static and earthquake actions. Furthermore, its application has recently been successfully extended in predicting the response of plain-concrete prism elements under high rates of uniaxial compressive loading. The main feature of the FE program is that it incorporates a 3D material model which is characterized by both its simplicity and its attention to the actual physical behaviour of concrete in a structure. Its analytical formulation is based on the assumption that the material properties of concrete are independent of the applied loading rate (strain rate) thus attributing the effect of the applied loading rate on the prism’s response to inertia. The validation of this assumption is based on a comparative study between numerical and experimental data which reveals good agreement. This constitutes a major departure from current thinking as regards material modelling of concrete under high- rate loading. In addition, the available data (numerical and experimental) show that the response of the concrete prism elements depends on a number of parameters linked to geometry and material properties of the structural forms under investigation as well as the testing method adopted. This dependence explains, to a significant extent, the scatter that characterizes the available experimental data, and it also suggests that both experimental and numerical results describe structural rather than material behaviour thus raising questions regarding the validity of the use of such data in the constitutive modelling of concrete-material behaviour under high-rate loading conditions. r 2007 Elsevier Ltd. All rights reserved. Keywords: Concrete; Constitutive law; Dynamic analysis; Finite-element modelling; High-rate loading 1. Introduction—background It is well established that the application of an external load onto a concrete structural form leads to the development of a complex triaxial stress field within the concrete medium which is further accentuated by its cracking processes and the ensuing internal stress redis- tributions [1]. Moreover, the application of the external time-varying (dynamic) load onto a concrete structural form leads to the formation of stress waves which propagate through the concrete medium. The propagation speed of these waves is directly linked to the material properties of concrete while their stress intensity level depends on the intensity of the imposed load. The formation of such waves affects the triaxial stress field and may cause the development of high stress concentra- tions in localized regions of the specimen leading to local failure/cracking. The complexity of the above stress field is further intensified by the fact that the stress waves may be deflected by voids formed due to the ongoing cracking process, as well as at the boundaries of the structural form under investigation. Based on the above, it appears that the investigation of the behaviour of concrete structural forms under dynamic—and especially high rate—loading is a complicated nonlinear wave-propagation dynamic problem. ARTICLE IN PRESS www.elsevier.com/locate/ijimpeng 0734-743X/$ - see front matter r 2007 Elsevier Ltd. All rights reserved. doi:10.1016/j.ijimpeng.2007.03.006 Corresponding author. E-mail address: [email protected] (M.N. Pavlovic´).
Transcript of Numerical investigation of concrete subjected to high rates of uniaxial tensile loading
ARTICLE IN PRESS
0734-743X/$ - s
doi:10.1016/j.iji
�CorrespondE-mail addr
International Journal of Impact Engineering 35 (2008) 319–335
www.elsevier.com/locate/ijimpeng
Numerical investigation of concrete subjected to high rates of uniaxialtensile loading
D.M. Cotsovos, M.N. Pavlovic�
Department of Civil and Environmental Engineering, Imperial College London, London SW7 2AZ, UK
Received 6 September 2006; received in revised form 8 January 2007; accepted 15 March 2007
Available online 12 April 2007
Abstract
The present article is concerned with the response of structural concrete prisms to high rates of uniaxial tensile loading. The numerical
investigation carried out is based on a finite-element (FE) program capable of carrying out three-dimensional (3D) nonlinear static and
dynamic analyses. This program is known to yield realistic predictions to the response of a wide range of plain- and reinforced-concrete
structural forms subjected to arbitrary static and earthquake actions. Furthermore, its application has recently been successfully
extended in predicting the response of plain-concrete prism elements under high rates of uniaxial compressive loading. The main feature
of the FE program is that it incorporates a 3D material model which is characterized by both its simplicity and its attention to the actual
physical behaviour of concrete in a structure. Its analytical formulation is based on the assumption that the material properties of
concrete are independent of the applied loading rate (strain rate) thus attributing the effect of the applied loading rate on the prism’s
response to inertia. The validation of this assumption is based on a comparative study between numerical and experimental data which
reveals good agreement. This constitutes a major departure from current thinking as regards material modelling of concrete under high-
rate loading. In addition, the available data (numerical and experimental) show that the response of the concrete prism elements depends
on a number of parameters linked to geometry and material properties of the structural forms under investigation as well as the testing
method adopted. This dependence explains, to a significant extent, the scatter that characterizes the available experimental data, and it
also suggests that both experimental and numerical results describe structural rather than material behaviour thus raising questions
regarding the validity of the use of such data in the constitutive modelling of concrete-material behaviour under high-rate loading
conditions.
r 2007 Elsevier Ltd. All rights reserved.
Keywords: Concrete; Constitutive law; Dynamic analysis; Finite-element modelling; High-rate loading
1. Introduction—background
It is well established that the application of an externalload onto a concrete structural form leads to thedevelopment of a complex triaxial stress field within theconcrete medium which is further accentuated by itscracking processes and the ensuing internal stress redis-tributions [1]. Moreover, the application of the externaltime-varying (dynamic) load onto a concrete structuralform leads to the formation of stress waves whichpropagate through the concrete medium. The propagationspeed of these waves is directly linked to the material
ee front matter r 2007 Elsevier Ltd. All rights reserved.
mpeng.2007.03.006
ing author.
ess: [email protected] (M.N. Pavlovic).
properties of concrete while their stress intensity leveldepends on the intensity of the imposed load. Theformation of such waves affects the triaxial stress fieldand may cause the development of high stress concentra-tions in localized regions of the specimen leading to localfailure/cracking. The complexity of the above stress field isfurther intensified by the fact that the stress waves may bedeflected by voids formed due to the ongoing crackingprocess, as well as at the boundaries of the structural formunder investigation. Based on the above, it appears that theinvestigation of the behaviour of concrete structuralforms under dynamic—and especially high rate—loadingis a complicated nonlinear wave-propagation dynamicproblem.
ARTICLE IN PRESSD.M. Cotsovos, M.N. Pavlovic / International Journal of Impact Engineering 35 (2008) 319–335320
The FE package presently adopted is capable of carryingout three-dimensional (3D) nonlinear static and dynamicanalyses. Its formulation is based on the hypothesis thatmaterial properties of concrete are independent of the rateof loading, thus relying for its response solely on therealistic description of the triaxial nonlinear behaviour ofconcrete under static loading as well as the effect of theinertia of the mass of the structural form under investiga-tion. This program is known to yield realistic predictions tothe response of a wide range of plain- and reinforced-concrete (RC) structural forms subjected to arbitrary staticand earthquake actions [1–3]. Furthermore, its applicationhas recently been successfully extended in predicting theresponse of plain-concrete prism elements—with a lowmoisture content—under high rates of uniaxial compres-sive loading [4,5] which led to a number of interestingconclusions which also form the basis of the presentinvestigation and hence are briefly discussed below.
Based on a comparison of the numerical predictions witha wide range of relevant published experimental data, arecent investigation [4] indicated that the application ofhigh rates of uniaxial compressive loading on concreteprisms results in these specimens exhibiting high rates ofaxial and lateral deformation which, in turn, triggers thedevelopment of significant inertia forces. These forces havea confining effect on the prism and tend to restrict thedeformations in both the axial and lateral directions, thuseffectively slowing down the cracking procedure that theprism undergoes. This causes the concrete prisms to exhibitprimarily higher load-carrying capacities and maximumvalues of strains (compared to their counterparts testedunder static loading) with increasing rates of loading. Thegood correlation exhibited between numerical predictionsand the available experimental data suggests that thechange exhibited in the behaviour of the concrete prismsunder high loading rates is primarily attributed to theinertia forces that develop during the loading process. Suchevidence validates the assumptions upon which the FEmodel’s formulation is based and provides an alternativeexplanation regarding the causes that trigger the changesexhibited in the response of plain-concrete prisms’ underincreasing loading rates which does not rely on thepresently (widely) accepted assumption of strain-ratesensitivity of the material properties of concrete.
Further investigations [5] revealed that the behaviour ofthe concrete prisms under high rates of uniaxial compres-sive loading depends significantly on a number of para-meters related to the geometry, the material properties andthe boundary conditions applied as well as the testing andmeasuring techniques adopted in various experimentalinvestigations. This dependency explains to a significantextent the scatter that characterizes the relevant experi-mental data. More importantly, however, it reveals that,under high-rate loading, the numerical and experimentalresults obtained do not describe the behaviour of concreteat a material level: this is because the concrete prismelements used do not correspond to material units from
which the properties of concrete can be measured anddefined (as in the case of static loading), but describestructural response. The latter conclusion raises questionsregarding the validity of the use of such data in theconstitutive modelling of concrete-material behaviourunder high rates of loading.The work discussed in the present article is concerned
with the numerical investigation of the effect of the rate ofloading on the behaviour of concrete specimens subjectedto uniaxial tension, complementing the work describedabove. It is primarily intended to establish whether the FEpackage presently adopted is able to realistically model thematerial behaviour of concrete and the structural responseof prismatic elements under high rates of uniaxial tension.The present investigation provides additional evidence ofthe generality of the proposed FE model in realisticallypredicting the behaviour of structural concrete under suchextreme loading conditions (i.e. encountered during impactand explosion problems) despite its reliance on purely staticmaterial properties. This is achieved through a comparativestudy between the numerical predictions and availableexperimental data. A comparison of the concrete prisms’response under high rates of uniaxial compressive (aspreviously reported by Cotsovos and Pavlovic [4,6]) andtensile loading is also carried out. Finally, the effect ofvarious parameters on the structural response of theconcrete prisms under high rate uniaxial tensile loadingwill be also investigated in order to explain the causes ofthe observed scatter that characterizes the availableexperimental data and to also show that experimentaland numerical data describe structural, rather thanmaterial, behaviour.
2. Review of experimental data
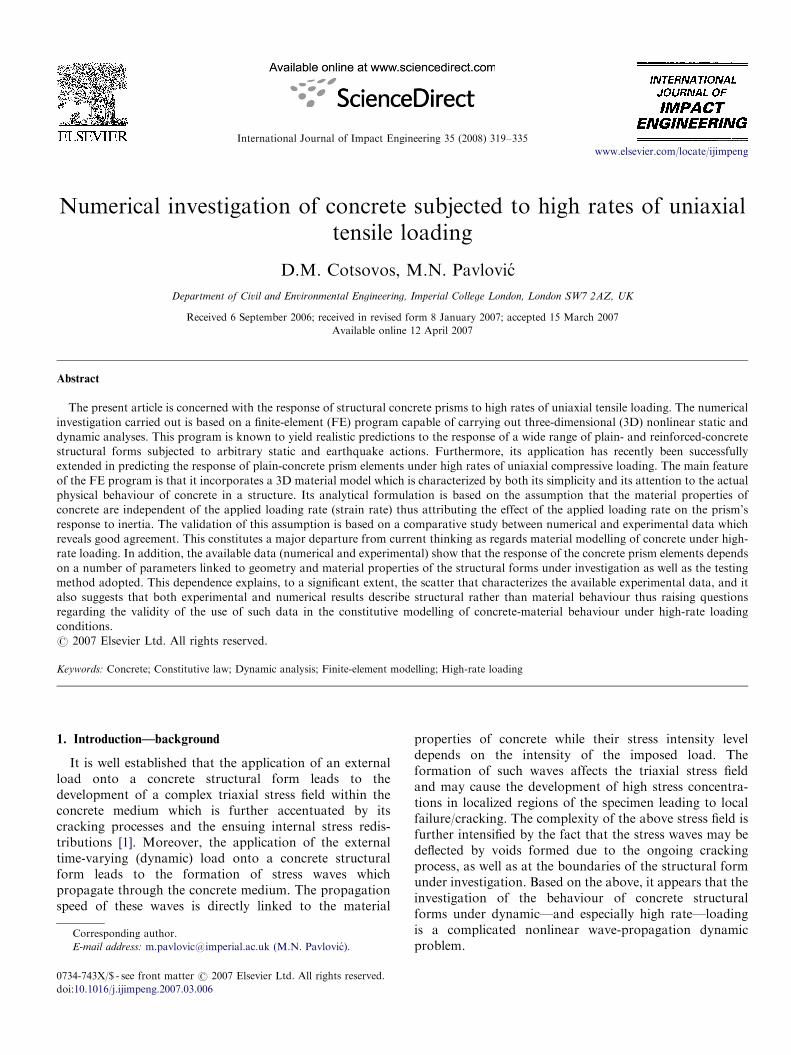
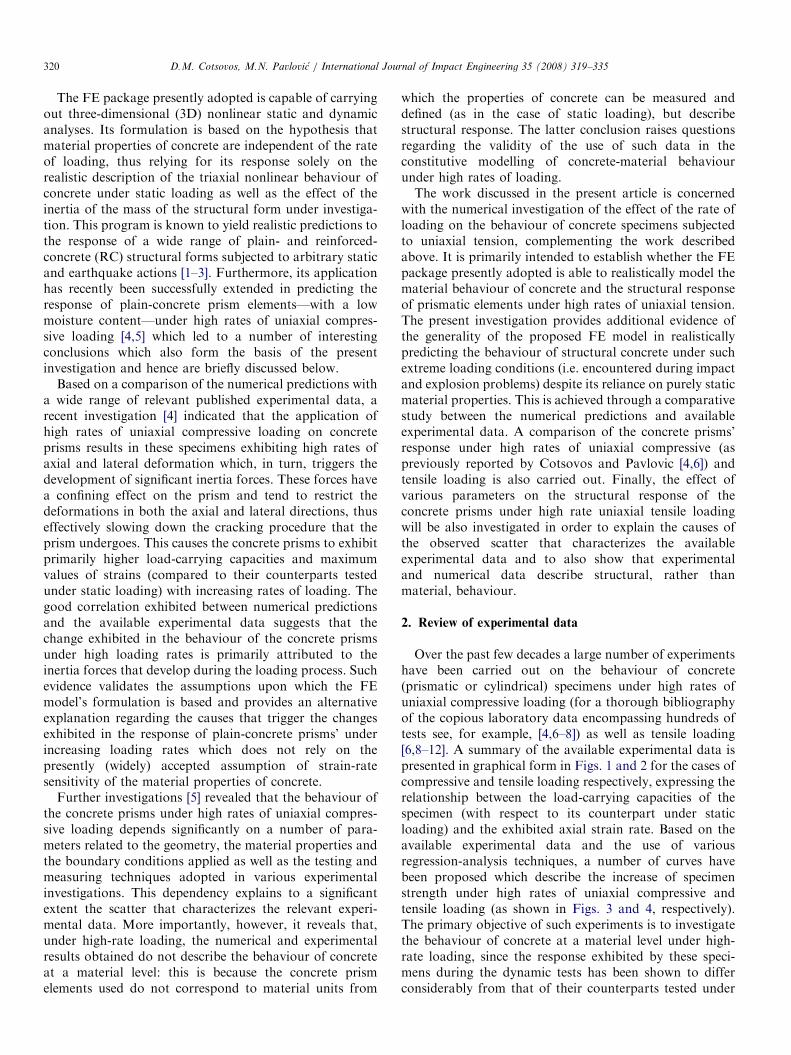
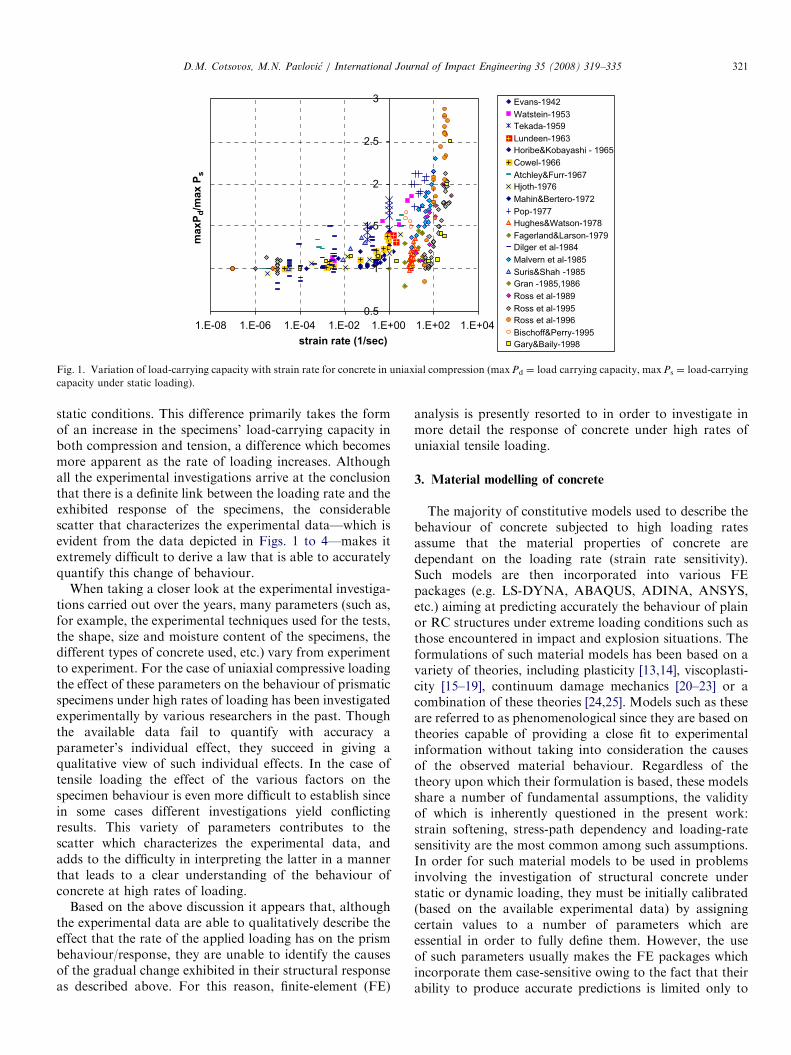
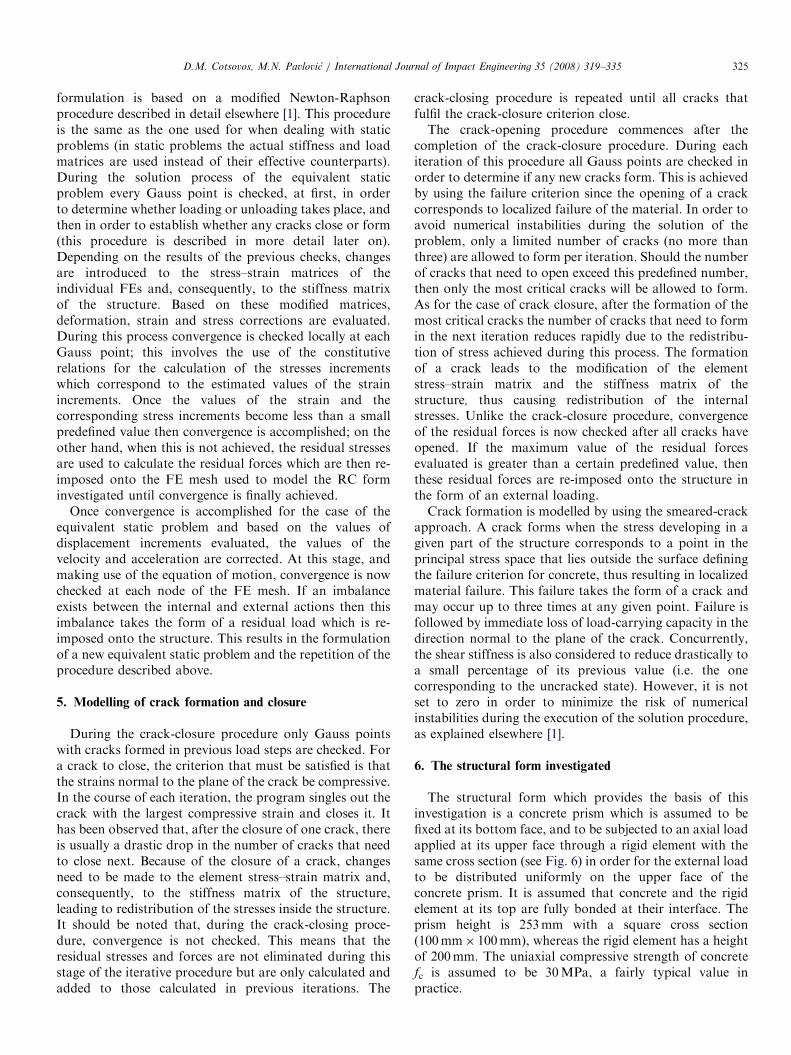
Over the past few decades a large number of experimentshave been carried out on the behaviour of concrete(prismatic or cylindrical) specimens under high rates ofuniaxial compressive loading (for a thorough bibliographyof the copious laboratory data encompassing hundreds oftests see, for example, [4,6–8]) as well as tensile loading[6,8–12]. A summary of the available experimental data ispresented in graphical form in Figs. 1 and 2 for the cases ofcompressive and tensile loading respectively, expressing therelationship between the load-carrying capacities of thespecimen (with respect to its counterpart under staticloading) and the exhibited axial strain rate. Based on theavailable experimental data and the use of variousregression-analysis techniques, a number of curves havebeen proposed which describe the increase of specimenstrength under high rates of uniaxial compressive andtensile loading (as shown in Figs. 3 and 4, respectively).The primary objective of such experiments is to investigatethe behaviour of concrete at a material level under high-rate loading, since the response exhibited by these speci-mens during the dynamic tests has been shown to differconsiderably from that of their counterparts tested under
ARTICLE IN PRESS
0.5
1
1.5
2
2.5
3
ma
xP
d/m
ax
Ps
Evans-1942
Watstein-1953
Tekada-1959
Lundeen-1963
Horibe&Kobayashi - 1965
Cowel-1966
Atchley&Furr-1967
Hjoth-1976
Mahin&Bertero-1972
Pop-1977
Hughes&Watson-1978
Fagerland&Larson-1979
Dilger et al-1984
Malvern et al-1985
Suris&Shah -1985
Gran -1985,1986
Ross et al-1989
Ross et al-1995
Ross et al-1996
Bischoff&Perry-1995
Gary&Baily-1998
1.E-08 1.E-06 1.E-04
strain rate (1/sec)
1.E-02 1.E+00 1.E+02 1.E+04
Fig. 1. Variation of load-carrying capacity with strain rate for concrete in uniaxial compression (maxPd ¼ load carrying capacity, maxPs ¼ load-carrying
capacity under static loading).
D.M. Cotsovos, M.N. Pavlovic / International Journal of Impact Engineering 35 (2008) 319–335 321
static conditions. This difference primarily takes the formof an increase in the specimens’ load-carrying capacity inboth compression and tension, a difference which becomesmore apparent as the rate of loading increases. Althoughall the experimental investigations arrive at the conclusionthat there is a definite link between the loading rate and theexhibited response of the specimens, the considerablescatter that characterizes the experimental data—which isevident from the data depicted in Figs. 1 to 4—makes itextremely difficult to derive a law that is able to accuratelyquantify this change of behaviour.
When taking a closer look at the experimental investiga-tions carried out over the years, many parameters (such as,for example, the experimental techniques used for the tests,the shape, size and moisture content of the specimens, thedifferent types of concrete used, etc.) vary from experimentto experiment. For the case of uniaxial compressive loadingthe effect of these parameters on the behaviour of prismaticspecimens under high rates of loading has been investigatedexperimentally by various researchers in the past. Thoughthe available data fail to quantify with accuracy aparameter’s individual effect, they succeed in giving aqualitative view of such individual effects. In the case oftensile loading the effect of the various factors on thespecimen behaviour is even more difficult to establish sincein some cases different investigations yield conflictingresults. This variety of parameters contributes to thescatter which characterizes the experimental data, andadds to the difficulty in interpreting the latter in a mannerthat leads to a clear understanding of the behaviour ofconcrete at high rates of loading.
Based on the above discussion it appears that, althoughthe experimental data are able to qualitatively describe theeffect that the rate of the applied loading has on the prismbehaviour/response, they are unable to identify the causesof the gradual change exhibited in their structural responseas described above. For this reason, finite-element (FE)
analysis is presently resorted to in order to investigate inmore detail the response of concrete under high rates ofuniaxial tensile loading.
3. Material modelling of concrete
The majority of constitutive models used to describe thebehaviour of concrete subjected to high loading ratesassume that the material properties of concrete aredependant on the loading rate (strain rate sensitivity).Such models are then incorporated into various FEpackages (e.g. LS-DYNA, ABAQUS, ADINA, ANSYS,etc.) aiming at predicting accurately the behaviour of plainor RC structures under extreme loading conditions such asthose encountered in impact and explosion situations. Theformulations of such material models has been based on avariety of theories, including plasticity [13,14], viscoplasti-city [15–19], continuum damage mechanics [20–23] or acombination of these theories [24,25]. Models such as theseare referred to as phenomenological since they are based ontheories capable of providing a close fit to experimentalinformation without taking into consideration the causesof the observed material behaviour. Regardless of thetheory upon which their formulation is based, these modelsshare a number of fundamental assumptions, the validityof which is inherently questioned in the present work:strain softening, stress-path dependency and loading-ratesensitivity are the most common among such assumptions.In order for such material models to be used in problemsinvolving the investigation of structural concrete understatic or dynamic loading, they must be initially calibrated(based on the available experimental data) by assigningcertain values to a number of parameters which areessential in order to fully define them. However, the useof such parameters usually makes the FE packages whichincorporate them case-sensitive owing to the fact that theirability to produce accurate predictions is limited only to

ARTICLE IN PRESS
0
2
4
6
8
10
12
14
1.E+04
strain rate(1/sec)
maxPd/maxPs
Mc Vay-1986
Birkimer-1971
Ross et al-1985
Zielinski et al-1981
Takeda and Tachikawa-1971
Hatano-1960
Komlos-1969
Kvirikadre-1977
Sneikin
Cowell-1966
Weerheijm-1992
Cadoni et al-2000
Barra et al-2001
Wu et al-2005
Brara and Klepaczko-2006-wet
Brara and Klepaczko-2006-dry1.E-08 1.E-06 1.E-04 1.E-02 1.E+00 1.E+02
Fig. 2. Variation of load-carrying capacity with strain rate for concrete in uniaxial tension (maxPd ¼ load-carrying capacity, maxPs ¼ load-carrying
capacity under static loading): (a) data from [6,8,10–12]; (b) data from [9].
0.5
1
1.5
2
2.5
3
3.5
ma
xP
d/m
ax
Ps
Sea bold-1970
Mikkola and Snisalo - 1982
Dilger et al- 1984
Ahmad and Shah - 1985 (fc=10MPa,h=12 in andd=6 in)Ahmad and Shah - 1985 (fc=60MPa,h=12 in andd=6 in)Soroushian et al- 1986 (dry concrete)
Mander et al-1988 (fc=10MPa)
Mander et al-1988 (fc=60MPa)
CEB - 1988 (fc=10MPa)
CEB - 1988 (fc=60MPa)
Pullen et al-1991
Tang et al- 1992
Williams- 1994
Tedesco et al - 1997
Grote et al- 2001
applied strain rate
max value of average strain rate
average strainrate at the mid height region
1.E-05
strain rate (1/sec)
1.E-03 1.E-01 1.E+01 1.E+03
Fig. 3. Best-fit curves of results obtained to date from uniaxial compression tests.
D.M. Cotsovos, M.N. Pavlovic / International Journal of Impact Engineering 35 (2008) 319–335322

ARTICLE IN PRESS
0
1
2
3
4
5
6
7
8
9
10
maxP
d/m
ax
Ps
Tedesco etal-1997
Ross et al-1989
fc=10 Mpa - CEB-1988
fc=60 Mpa - CEB-1988
fc=30 Mpa -Malvar & Ross-1998
fc=60 Mpa -Malvar & Ross-1998
Ross et al-1995
1.E-05 1.E-03 1.E-01 1.E+01 1.E+03
strain rate (1/sec)
Fig. 4. Best-fit curves of results obtained to date from uniaxial tension tests: (a) data from [6]; (b) data from [9].
D.M. Cotsovos, M.N. Pavlovic / International Journal of Impact Engineering 35 (2008) 319–335 323
certain problem types because, in order to apply them todifferent problem types, they need to be recalibrated.
Present work employs an FE model to reproduce theexperimental data and aims to provide a fundamentalexplanation for the sudden increase in concrete strengthand the overall change in the specimen behaviour as alimiting value of loading rate is exceeded. The work isbased on a nonlinear FE program, which incorporates a3D brittle material model of concrete behaviour that isknown to yield realistic predictions of the response of awide range of RC structures under static monotonicallyincreasing loads [1], as well as static load reversals [2],earthquake loading [3] and high-rate compressive loading[4,5]. The material model presently adopted for describingthe behaviour of concrete is fully defined by a singleparameter (the uniaxial compressive strength fc) and doesnot rely on strain softening, stress-path dependency or
loading-rate sensitivity, placing emphasis, instead, on theresponse of concrete to multiaxial (i.e. triaxial) stressconditions and the obvious inertia effects. Full details ofthe FE model can be found elsewhere [1–4,6].
4. Nonlinear solution strategy adopted
It is an undisputed fact that, in the investigation ofconcrete structural elements under high rates of loading,the inertia of the mass has a significant effect on thespecimen’s overall response, as is evident by the governingequation of motion. Due to the nonlinear behaviour ofconcrete, this equation is solved numerically through theimplicit Newmark integration scheme, with the uncondi-tionally stable average acceleration method [26] beingadopted throughout. Furthermore, the proposed FEpackage is capable of 3D nonlinear dynamic analysis,

ARTICLE IN PRESSD.M. Cotsovos, M.N. Pavlovic / International Journal of Impact Engineering 35 (2008) 319–335324
employing a 3D material model to account for the triaxialbehaviour of concrete and 27-node Lagrangian isopara-metric brick elements for the modelling of the concretemedium. The adoption of 3D analysis is dictated by theneed to identify and quantify the complex stress field as theimposed load is increased, the allowance of unavoidabletriaxiality prior to local failure (i.e. cracking) beingreached, and the introduction of non-homogeneity andstress redistribution after cracking is imposed [1]. Addi-tionally, 3D analysis also permits full allowance for theeffect of inertia since it enables the more precise modellingof the specimen’s mass and its effect on the overall responseof the specimen in general, as well as on the area
Fig. 5. Nonlinear iterative pro
surrounding a crack (or a group of cracks) within theconcrete medium in particular.The nonlinear iterative procedure adopted for solving
the nonlinear dynamic problem is described in Fig. 5 [3,6].In essence the nonlinear dynamic problem is viewed as asequence of equivalent static problems. At the beginning ofeach iteration and based on the values of displacement,velocity and acceleration obtained from the previousiteration, the effective stiffness and load matrix arecalculated and an equivalent static problem is formulated.The solution procedure adopted for the equivalent staticproblem—which is described within the dotted lines inFig. 5—is an iterative procedure on its own and its
cedure presently adopted.
ARTICLE IN PRESSD.M. Cotsovos, M.N. Pavlovic / International Journal of Impact Engineering 35 (2008) 319–335 325
formulation is based on a modified Newton-Raphsonprocedure described in detail elsewhere [1]. This procedureis the same as the one used for when dealing with staticproblems (in static problems the actual stiffness and loadmatrices are used instead of their effective counterparts).During the solution process of the equivalent staticproblem every Gauss point is checked, at first, in orderto determine whether loading or unloading takes place, andthen in order to establish whether any cracks close or form(this procedure is described in more detail later on).Depending on the results of the previous checks, changesare introduced to the stress–strain matrices of theindividual FEs and, consequently, to the stiffness matrixof the structure. Based on these modified matrices,deformation, strain and stress corrections are evaluated.During this process convergence is checked locally at eachGauss point; this involves the use of the constitutiverelations for the calculation of the stresses incrementswhich correspond to the estimated values of the strainincrements. Once the values of the strain and thecorresponding stress increments become less than a smallpredefined value then convergence is accomplished; on theother hand, when this is not achieved, the residual stressesare used to calculate the residual forces which are then re-imposed onto the FE mesh used to model the RC forminvestigated until convergence is finally achieved.
Once convergence is accomplished for the case of theequivalent static problem and based on the values ofdisplacement increments evaluated, the values of thevelocity and acceleration are corrected. At this stage, andmaking use of the equation of motion, convergence is nowchecked at each node of the FE mesh. If an imbalanceexists between the internal and external actions then thisimbalance takes the form of a residual load which is re-imposed onto the structure. This results in the formulationof a new equivalent static problem and the repetition of theprocedure described above.
5. Modelling of crack formation and closure
During the crack-closure procedure only Gauss pointswith cracks formed in previous load steps are checked. Fora crack to close, the criterion that must be satisfied is thatthe strains normal to the plane of the crack be compressive.In the course of each iteration, the program singles out thecrack with the largest compressive strain and closes it. Ithas been observed that, after the closure of one crack, thereis usually a drastic drop in the number of cracks that needto close next. Because of the closure of a crack, changesneed to be made to the element stress–strain matrix and,consequently, to the stiffness matrix of the structure,leading to redistribution of the stresses inside the structure.It should be noted that, during the crack-closing proce-dure, convergence is not checked. This means that theresidual stresses and forces are not eliminated during thisstage of the iterative procedure but are only calculated andadded to those calculated in previous iterations. The
crack-closing procedure is repeated until all cracks thatfulfil the crack-closure criterion close.The crack-opening procedure commences after the
completion of the crack-closure procedure. During eachiteration of this procedure all Gauss points are checked inorder to determine if any new cracks form. This is achievedby using the failure criterion since the opening of a crackcorresponds to localized failure of the material. In order toavoid numerical instabilities during the solution of theproblem, only a limited number of cracks (no more thanthree) are allowed to form per iteration. Should the numberof cracks that need to open exceed this predefined number,then only the most critical cracks will be allowed to form.As for the case of crack closure, after the formation of themost critical cracks the number of cracks that need to formin the next iteration reduces rapidly due to the redistribu-tion of stress achieved during this process. The formationof a crack leads to the modification of the elementstress–strain matrix and the stiffness matrix of thestructure, thus causing redistribution of the internalstresses. Unlike the crack-closure procedure, convergenceof the residual forces is now checked after all cracks haveopened. If the maximum value of the residual forcesevaluated is greater than a certain predefined value, thenthese residual forces are re-imposed onto the structure inthe form of an external loading.Crack formation is modelled by using the smeared-crack
approach. A crack forms when the stress developing in agiven part of the structure corresponds to a point in theprincipal stress space that lies outside the surface definingthe failure criterion for concrete, thus resulting in localizedmaterial failure. This failure takes the form of a crack andmay occur up to three times at any given point. Failure isfollowed by immediate loss of load-carrying capacity in thedirection normal to the plane of the crack. Concurrently,the shear stiffness is also considered to reduce drastically toa small percentage of its previous value (i.e. the onecorresponding to the uncracked state). However, it is notset to zero in order to minimize the risk of numericalinstabilities during the execution of the solution procedure,as explained elsewhere [1].
6. The structural form investigated
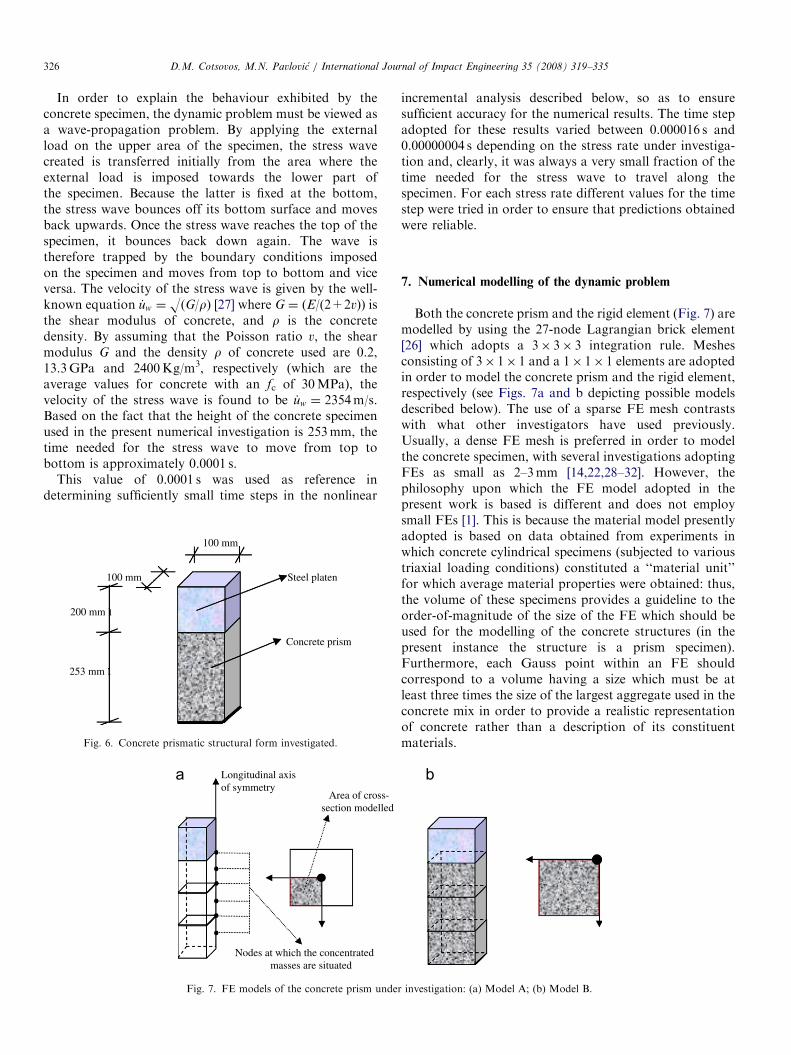
The structural form which provides the basis of thisinvestigation is a concrete prism which is assumed to befixed at its bottom face, and to be subjected to an axial loadapplied at its upper face through a rigid element with thesame cross section (see Fig. 6) in order for the external loadto be distributed uniformly on the upper face of theconcrete prism. It is assumed that concrete and the rigidelement at its top are fully bonded at their interface. Theprism height is 253mm with a square cross section(100mm� 100mm), whereas the rigid element has a heightof 200mm. The uniaxial compressive strength of concretefc is assumed to be 30MPa, a fairly typical value inpractice.
ARTICLE IN PRESSD.M. Cotsovos, M.N. Pavlovic / International Journal of Impact Engineering 35 (2008) 319–335326
In order to explain the behaviour exhibited by theconcrete specimen, the dynamic problem must be viewed asa wave-propagation problem. By applying the externalload on the upper area of the specimen, the stress wavecreated is transferred initially from the area where theexternal load is imposed towards the lower part ofthe specimen. Because the latter is fixed at the bottom,the stress wave bounces off its bottom surface and movesback upwards. Once the stress wave reaches the top of thespecimen, it bounces back down again. The wave istherefore trapped by the boundary conditions imposedon the specimen and moves from top to bottom and viceversa. The velocity of the stress wave is given by the well-known equation _uw ¼ O(G/r) [27] where G ¼ (E/(2+2v)) isthe shear modulus of concrete, and r is the concretedensity. By assuming that the Poisson ratio v, the shearmodulus G and the density r of concrete used are 0.2,13.3GPa and 2400Kg/m3, respectively (which are theaverage values for concrete with an fc of 30MPa), thevelocity of the stress wave is found to be _uw ¼ 2354m/s.Based on the fact that the height of the concrete specimenused in the present numerical investigation is 253mm, thetime needed for the stress wave to move from top tobottom is approximately 0.0001 s.
This value of 0.0001 s was used as reference indetermining sufficiently small time steps in the nonlinear
100 mm
100 mm
200 mm
253 mm
Concrete prism
Steel platen
Fig. 6. Concrete prismatic structural form investigated.
Nodes at which the concentratedmasses are situated
Longitudinal axisof symmetry
Area of cross-section modelled
Fig. 7. FE models of the concrete prism under
incremental analysis described below, so as to ensuresufficient accuracy for the numerical results. The time stepadopted for these results varied between 0.000016 s and0.00000004 s depending on the stress rate under investiga-tion and, clearly, it was always a very small fraction of thetime needed for the stress wave to travel along thespecimen. For each stress rate different values for the timestep were tried in order to ensure that predictions obtainedwere reliable.
7. Numerical modelling of the dynamic problem
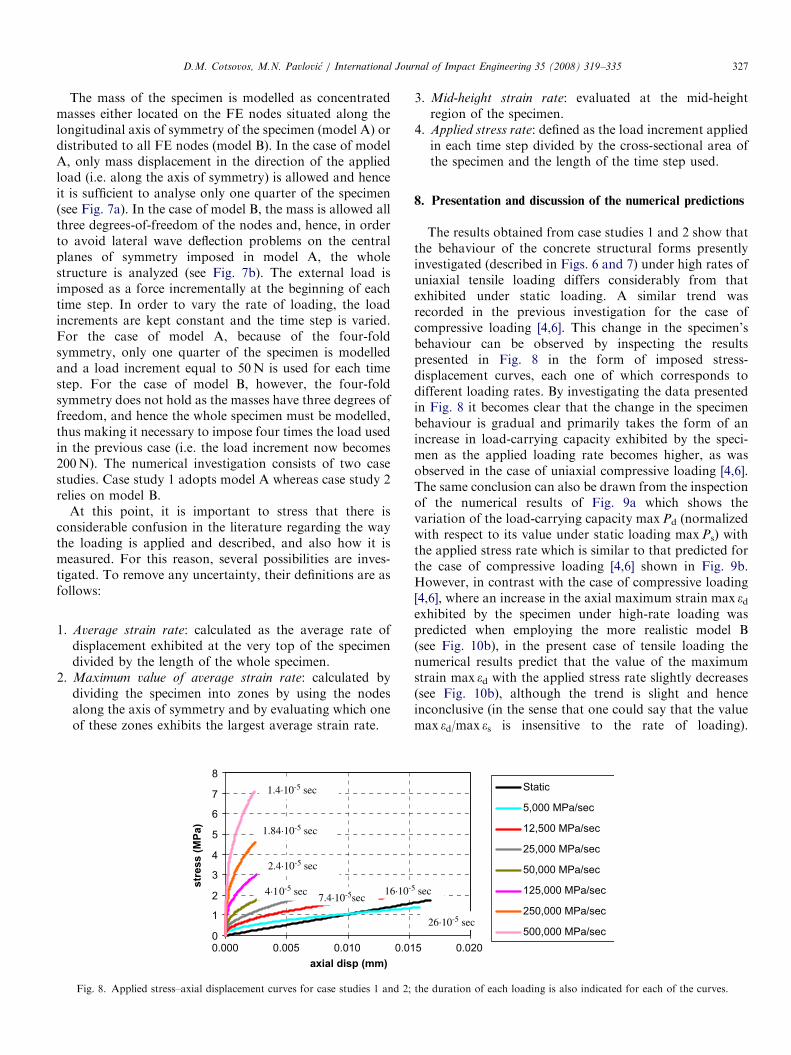
Both the concrete prism and the rigid element (Fig. 7) aremodelled by using the 27-node Lagrangian brick element[26] which adopts a 3� 3� 3 integration rule. Meshesconsisting of 3� 1� 1 and a 1� 1� 1 elements are adoptedin order to model the concrete prism and the rigid element,respectively (see Figs. 7a and b depicting possible modelsdescribed below). The use of a sparse FE mesh contrastswith what other investigators have used previously.Usually, a dense FE mesh is preferred in order to modelthe concrete specimen, with several investigations adoptingFEs as small as 2–3mm [14,22,28–32]. However, thephilosophy upon which the FE model adopted in thepresent work is based is different and does not employsmall FEs [1]. This is because the material model presentlyadopted is based on data obtained from experiments inwhich concrete cylindrical specimens (subjected to varioustriaxial loading conditions) constituted a ‘‘material unit’’for which average material properties were obtained: thus,the volume of these specimens provides a guideline to theorder-of-magnitude of the size of the FE which should beused for the modelling of the concrete structures (in thepresent instance the structure is a prism specimen).Furthermore, each Gauss point within an FE shouldcorrespond to a volume having a size which must be atleast three times the size of the largest aggregate used in theconcrete mix in order to provide a realistic representationof concrete rather than a description of its constituentmaterials.
investigation: (a) Model A; (b) Model B.
ARTICLE IN PRESSD.M. Cotsovos, M.N. Pavlovic / International Journal of Impact Engineering 35 (2008) 319–335 327
The mass of the specimen is modelled as concentratedmasses either located on the FE nodes situated along thelongitudinal axis of symmetry of the specimen (model A) ordistributed to all FE nodes (model B). In the case of modelA, only mass displacement in the direction of the appliedload (i.e. along the axis of symmetry) is allowed and henceit is sufficient to analyse only one quarter of the specimen(see Fig. 7a). In the case of model B, the mass is allowed allthree degrees-of-freedom of the nodes and, hence, in orderto avoid lateral wave deflection problems on the centralplanes of symmetry imposed in model A, the wholestructure is analyzed (see Fig. 7b). The external load isimposed as a force incrementally at the beginning of eachtime step. In order to vary the rate of loading, the loadincrements are kept constant and the time step is varied.For the case of model A, because of the four-foldsymmetry, only one quarter of the specimen is modelledand a load increment equal to 50N is used for each timestep. For the case of model B, however, the four-foldsymmetry does not hold as the masses have three degrees offreedom, and hence the whole specimen must be modelled,thus making it necessary to impose four times the load usedin the previous case (i.e. the load increment now becomes200N). The numerical investigation consists of two casestudies. Case study 1 adopts model A whereas case study 2relies on model B.
At this point, it is important to stress that there isconsiderable confusion in the literature regarding the waythe loading is applied and described, and also how it ismeasured. For this reason, several possibilities are inves-tigated. To remove any uncertainty, their definitions are asfollows:
1.
Average strain rate: calculated as the average rate ofdisplacement exhibited at the very top of the specimendivided by the length of the whole specimen.2.
Maximum value of average strain rate: calculated bydividing the specimen into zones by using the nodesalong the axis of symmetry and by evaluating which oneof these zones exhibits the largest average strain rate.0
1
2
3
4
5
6
7
8
0.005 0.010 0.01
str
es
s (
MP
a)
1.4·10-5 sec
1.84·10-5 sec
2.4·10-5 sec
4·10-5 sec 7.4·10-5sec
16·10-
0.000
axial disp (mm)
Fig. 8. Applied stress–axial displacement curves for case studies 1 and 2;
3.
5
5 sec
the
Mid-height strain rate: evaluated at the mid-heightregion of the specimen.
4.
Applied stress rate: defined as the load increment appliedin each time step divided by the cross-sectional area ofthe specimen and the length of the time step used.8. Presentation and discussion of the numerical predictions
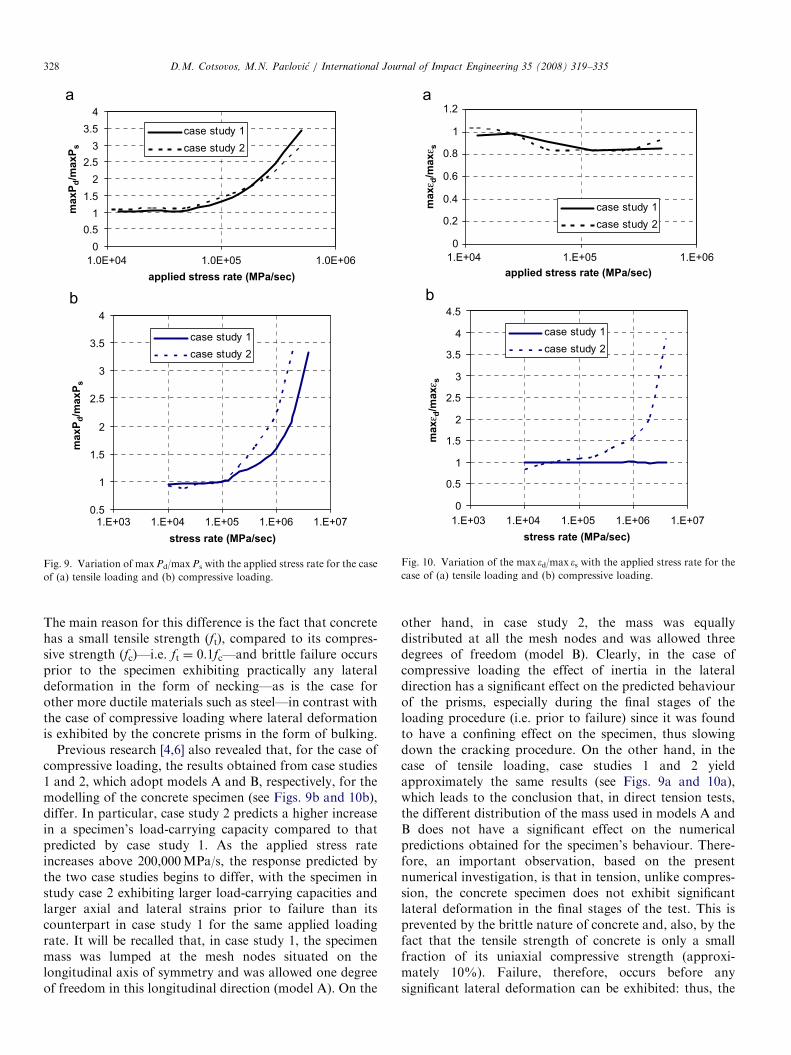
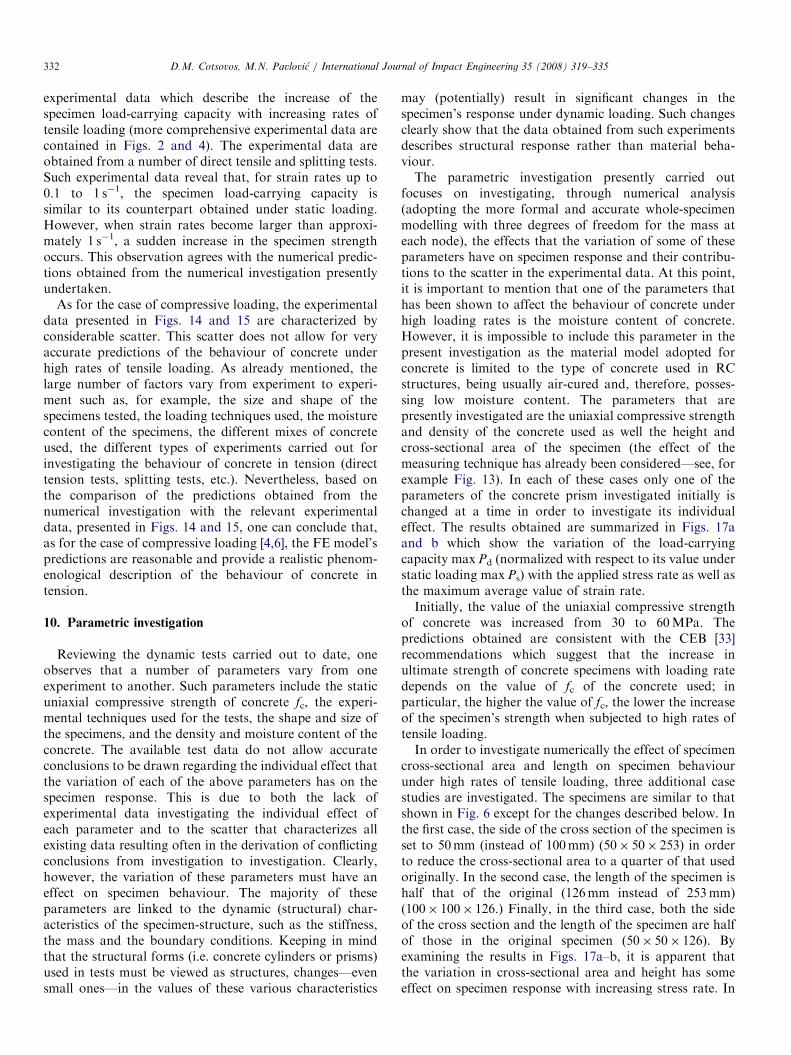
The results obtained from case studies 1 and 2 show thatthe behaviour of the concrete structural forms presentlyinvestigated (described in Figs. 6 and 7) under high rates ofuniaxial tensile loading differs considerably from thatexhibited under static loading. A similar trend wasrecorded in the previous investigation for the case ofcompressive loading [4,6]. This change in the specimen’sbehaviour can be observed by inspecting the resultspresented in Fig. 8 in the form of imposed stress-displacement curves, each one of which corresponds todifferent loading rates. By investigating the data presentedin Fig. 8 it becomes clear that the change in the specimenbehaviour is gradual and primarily takes the form of anincrease in load-carrying capacity exhibited by the speci-men as the applied loading rate becomes higher, as wasobserved in the case of uniaxial compressive loading [4,6].The same conclusion can also be drawn from the inspectionof the numerical results of Fig. 9a which shows thevariation of the load-carrying capacity maxPd (normalizedwith respect to its value under static loading maxPs) withthe applied stress rate which is similar to that predicted forthe case of compressive loading [4,6] shown in Fig. 9b.However, in contrast with the case of compressive loading[4,6], where an increase in the axial maximum strain max edexhibited by the specimen under high-rate loading waspredicted when employing the more realistic model B(see Fig. 10b), in the present case of tensile loading thenumerical results predict that the value of the maximumstrain max ed with the applied stress rate slightly decreases(see Fig. 10b), although the trend is slight and henceinconclusive (in the sense that one could say that the valuemax ed/max es is insensitive to the rate of loading).
0.020
Static
5,000 MPa/sec
12,500 MPa/sec
25,000 MPa/sec
50,000 MPa/sec
125,000 MPa/sec
250,000 MPa/sec
500,000 MPa/sec26·10-5 sec
duration of each loading is also indicated for each of the curves.
ARTICLE IN PRESS
0
0.5
1
1.5
2
2.5
3
3.5
4
maxP
d/m
axP
s
case study 1
case study 2
0.5
1
1.5
2
2.5
3
3.5
4
stress rate (MPa/sec)
maxP
d/m
axP
s
case study 1
case study 2
1.0E+04 1.0E+05 1.0E+06
applied stress rate (MPa/sec)
1.E+03 1.E+04 1.E+05 1.E+06 1.E+07
Fig. 9. Variation of maxPd/maxPs with the applied stress rate for the case
of (a) tensile loading and (b) compressive loading.
0
0.2
0.4
0.6
0.8
1
1.2
max
ε d/m
ax
ε s
case study 1
case study 2
0
0.5
1
1.5
2
2.5
3
3.5
4
4.5
max
ε d/m
ax
ε s
case study 1
case study 2
1.E+04 1.E+05 1.E+06
applied stress rate (MPa/sec)
1.E+03 1.E+04 1.E+05
stress rate (MPa/sec)
1.E+06 1.E+07
Fig. 10. Variation of the max ed/max es with the applied stress rate for the
case of (a) tensile loading and (b) compressive loading.
D.M. Cotsovos, M.N. Pavlovic / International Journal of Impact Engineering 35 (2008) 319–335328
The main reason for this difference is the fact that concretehas a small tensile strength (ft), compared to its compres-sive strength (fc)—i.e. ft ¼ 0.1fc—and brittle failure occursprior to the specimen exhibiting practically any lateraldeformation in the form of necking—as is the case forother more ductile materials such as steel—in contrast withthe case of compressive loading where lateral deformationis exhibited by the concrete prisms in the form of bulking.
Previous research [4,6] also revealed that, for the case ofcompressive loading, the results obtained from case studies1 and 2, which adopt models A and B, respectively, for themodelling of the concrete specimen (see Figs. 9b and 10b),differ. In particular, case study 2 predicts a higher increasein a specimen’s load-carrying capacity compared to thatpredicted by case study 1. As the applied stress rateincreases above 200,000MPa/s, the response predicted bythe two case studies begins to differ, with the specimen instudy case 2 exhibiting larger load-carrying capacities andlarger axial and lateral strains prior to failure than itscounterpart in case study 1 for the same applied loadingrate. It will be recalled that, in case study 1, the specimenmass was lumped at the mesh nodes situated on thelongitudinal axis of symmetry and was allowed one degreeof freedom in this longitudinal direction (model A). On the
other hand, in case study 2, the mass was equallydistributed at all the mesh nodes and was allowed threedegrees of freedom (model B). Clearly, in the case ofcompressive loading the effect of inertia in the lateraldirection has a significant effect on the predicted behaviourof the prisms, especially during the final stages of theloading procedure (i.e. prior to failure) since it was foundto have a confining effect on the specimen, thus slowingdown the cracking procedure. On the other hand, in thecase of tensile loading, case studies 1 and 2 yieldapproximately the same results (see Figs. 9a and 10a),which leads to the conclusion that, in direct tension tests,the different distribution of the mass used in models A andB does not have a significant effect on the numericalpredictions obtained for the specimen’s behaviour. There-fore, an important observation, based on the presentnumerical investigation, is that in tension, unlike compres-sion, the concrete specimen does not exhibit significantlateral deformation in the final stages of the test. This isprevented by the brittle nature of concrete and, also, by thefact that the tensile strength of concrete is only a smallfraction of its uniaxial compressive strength (approxi-mately 10%). Failure, therefore, occurs before anysignificant lateral deformation can be exhibited: thus, the
ARTICLE IN PRESSD.M. Cotsovos, M.N. Pavlovic / International Journal of Impact Engineering 35 (2008) 319–335 329
effect of the inertia of the mass in this (lateral) direction isinsignificant. It can therefore be concluded that only theinertia effect along the height of the specimen affects itsbehaviour under high rates of tensile loading.
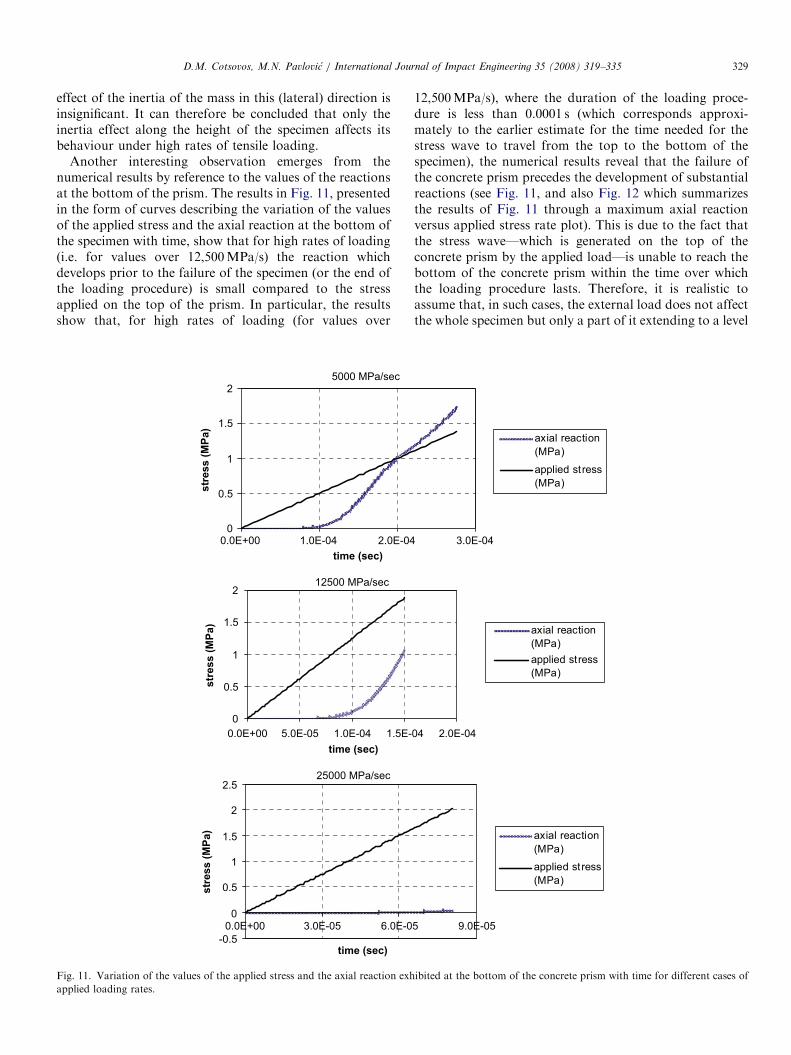
Another interesting observation emerges from thenumerical results by reference to the values of the reactionsat the bottom of the prism. The results in Fig. 11, presentedin the form of curves describing the variation of the valuesof the applied stress and the axial reaction at the bottom ofthe specimen with time, show that for high rates of loading(i.e. for values over 12,500MPa/s) the reaction whichdevelops prior to the failure of the specimen (or the end ofthe loading procedure) is small compared to the stressapplied on the top of the prism. In particular, the resultsshow that, for high rates of loading (for values over
0
0.5
1
1.5
2
str
ess (
MP
a)
0
0.5
1
1.5
2
str
ess (
MP
a)
-0.5
0
0.5
1
1.5
2
2.5
0.0E+00 3.0E-05 6.0E-0
str
ess (
MP
a)
0.0E+00 1.0E-04 2.0E-04
time (sec)
5000 MPa/sec
12500 MPa/sec
25000 MPa/sec
0.0E+00 5.0E-05 1.0E-04 1.5E-
time (sec)
time (sec)
Fig. 11. Variation of the values of the applied stress and the axial reaction exh
applied loading rates.
12,500MPa/s), where the duration of the loading proce-dure is less than 0.0001 s (which corresponds approxi-mately to the earlier estimate for the time needed for thestress wave to travel from the top to the bottom of thespecimen), the numerical results reveal that the failure ofthe concrete prism precedes the development of substantialreactions (see Fig. 11, and also Fig. 12 which summarizesthe results of Fig. 11 through a maximum axial reactionversus applied stress rate plot). This is due to the fact thatthe stress wave—which is generated on the top of theconcrete prism by the applied load—is unable to reach thebottom of the concrete prism within the time over whichthe loading procedure lasts. Therefore, it is realistic toassume that, in such cases, the external load does not affectthe whole specimen but only a part of it extending to a level
axial reaction
(MPa)
applied stress
(MPa)
axial reaction
(MPa)
applied stress
(MPa)
5 9.0E-05
axial reaction
(MPa)
applied stress
(MPa)
3.0E-04
04 2.0E-04
ibited at the bottom of the concrete prism with time for different cases of

ARTICLE IN PRESSD.M. Cotsovos, M.N. Pavlovic / International Journal of Impact Engineering 35 (2008) 319–335330
which the stress wave is able to reach in the time that theloading procedure lasts. Based on this, it is possible toconclude that, beyond a threshold value of applied loadingrate, higher concentrations of stresses (and strains) developin the upper part of the specimen whereas, in the bottompart, the values of stresses and strains are much lower, andoften negligible.
For low rates of loading, where the duration of theloading procedure exceeds 0.0001 s, the stress wave reachesthe bottom of the specimen, bounces off it and starts totravel backwards and forwards along its height, trapped bythe imposed boundary conditions. Because of this, the
0
0.5
1
1.5
2
2.5
3
3.5
maxP
d/m
axP
s
1.E-02
strain rate (1/sec)
1.E-01 1.E+00
Fig. 13. Variation of maxPd/maxPs with the applied strain
0
0.5
1
1.5
2
axia
l re
acti
on
(M
Pa)
applied stress rate (MPa/sec)
1.0E+04 1.0E+05 1.0E+06
Fig. 12. Variation of the maximum axial reaction exhibited at the bottom
of the concrete prism with the applied loading rate.
0.5
1
1.5
2
2.5
3
3.5
4
4.5
5
maxP
d/m
axP
s
strain rate (1/sec)
1.E-02 1.E-01 1.E+00 1.E
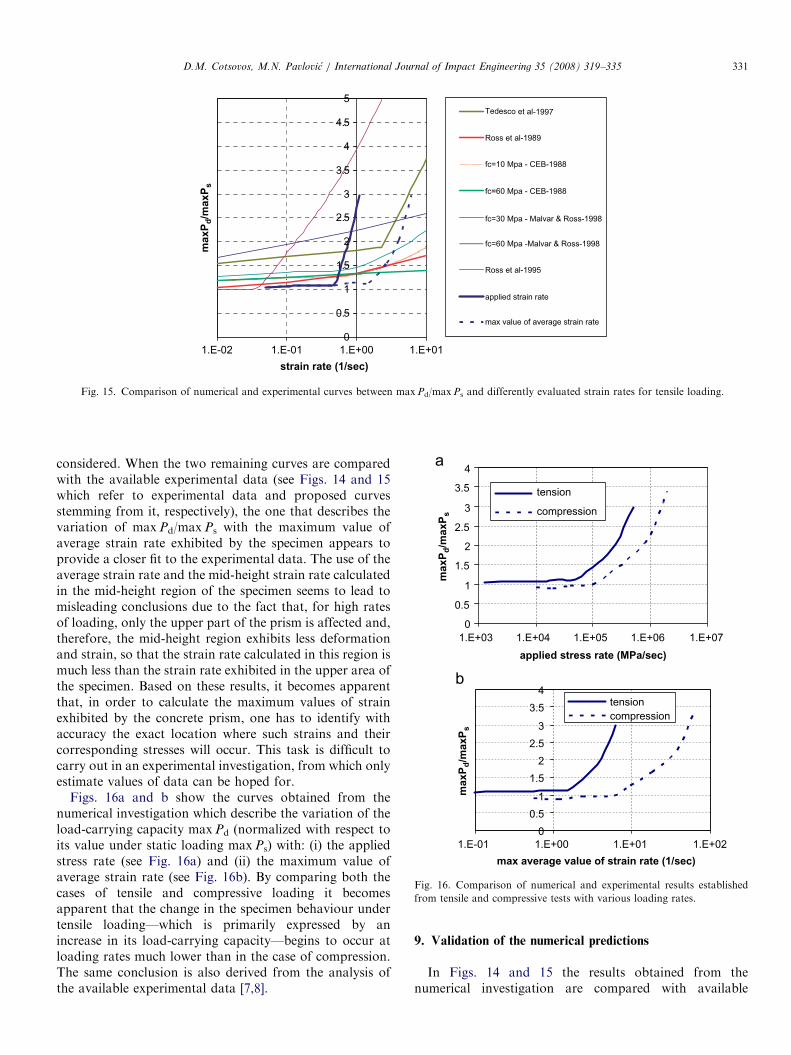
Fig. 14. Comparison of numerical and experimental data between max
stress wave affects the whole of the concrete specimen,adding to the complexity of the stress field which developswithin it (except, of course, for static or quasi-staticloadings). In such cases, it is difficult to predict where thehighest concentrations of stresses (and strains) will developbecause of the continuous travelling of the stress wavewhich causes the internal stress field within the concreteprism to constantly change. It is important to note that forsuch cases the concrete prisms exhibit load-carryingcapacities and maximum values of strain close to theircounterparts obtained for the case of static loading (seeFigs. 9a and 10a).These values begin to be affected by therate of the applied stress rate as the duration of the loadingprocedure becomes less than 0.0001 s, resulting in the stresswave being unable to reach the bottom of the concreteprism.In Fig. 13 a relationship is presented between max
Pd/maxPs and strain rates evaluated by using differentmethods for calculating the exhibited strain rate (namelyaverage strain rate, maximum value of average strain rate,and mid-height strain rate). By comparing the threeresulting relationships, it becomes clear that they aresignificantly different and that the use of the average strainrate at the mid-height region leads to unrealistic results;hence the latter definition of strain rate will no longer be
applied strain rate
max value of average
strain rate
average strain rate at
the midheight region
1.E+01
rate (variously defined) for the case of tensile loading.
1.E+02
experimental
data
applied strain
rate
max value of
average strain
rate
+01
Pd/maxPs and differently evaluated strain rates for tensile loading.
ARTICLE IN PRESS
0
0.5
1
1.5
2
2.5
3
3.5
4
4.5
5
maxP
d/m
axP
s
Tedesco et al-1997
Ross et al-1989
fc=10 Mpa - CEB-1988
fc=60 Mpa - CEB-1988
fc=30 Mpa - Malvar & Ross-1998
fc=60 Mpa -Malvar & Ross-1998
Ross et al-1995
applied strain rate
max value of average strain rate
1.E-02 1.E-01
strain rate (1/sec)
1.E+00 1.E+01
Fig. 15. Comparison of numerical and experimental curves between maxPd/maxPs and differently evaluated strain rates for tensile loading.
0
0.5
1
1.5
2
2.5
3
3.5
4
max
Pd/m
axP
s
tensioncompression
0
0.5
1
1.5
2
2.5
3
3.5
4
max
Pd/m
axP
s
tension
compression
1.E-01 1.E+00 1.E+01 1.E+02
max average value of strain rate (1/sec)
applied stress rate (MPa/sec)
1.E+03 1.E+04 1.E+05 1.E+06 1.E+07
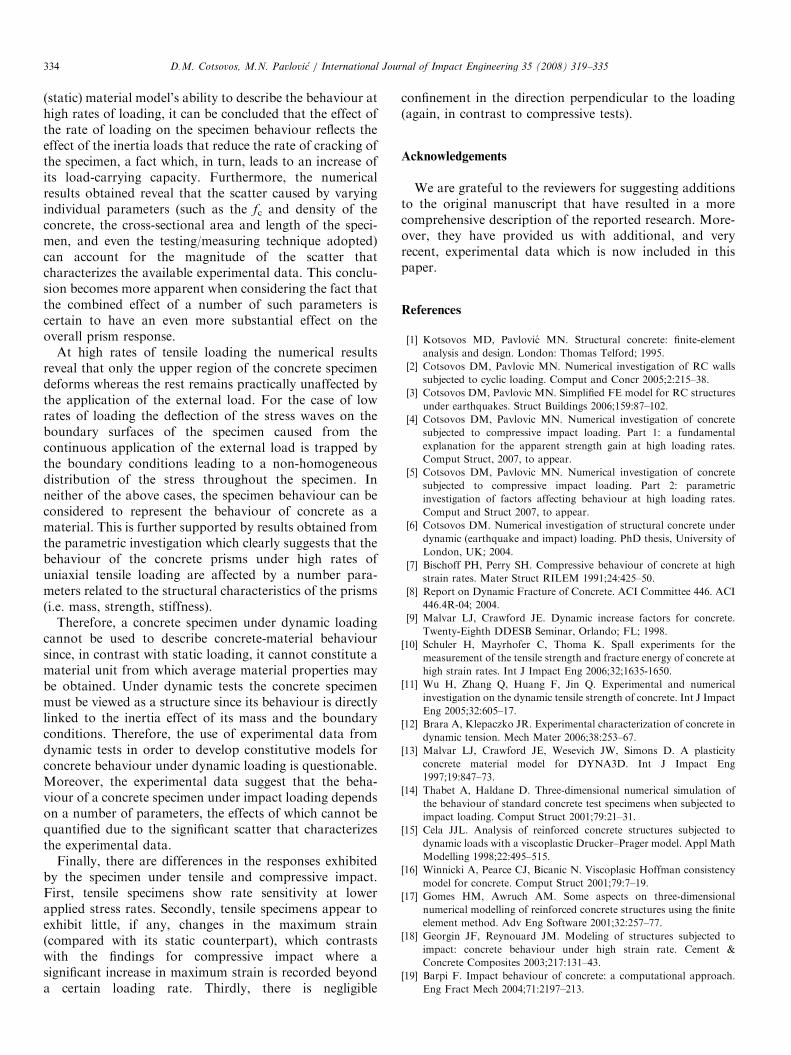
Fig. 16. Comparison of numerical and experimental results established
from tensile and compressive tests with various loading rates.
D.M. Cotsovos, M.N. Pavlovic / International Journal of Impact Engineering 35 (2008) 319–335 331
considered. When the two remaining curves are comparedwith the available experimental data (see Figs. 14 and 15which refer to experimental data and proposed curvesstemming from it, respectively), the one that describes thevariation of maxPd/maxPs with the maximum value ofaverage strain rate exhibited by the specimen appears toprovide a closer fit to the experimental data. The use of theaverage strain rate and the mid-height strain rate calculatedin the mid-height region of the specimen seems to lead tomisleading conclusions due to the fact that, for high ratesof loading, only the upper part of the prism is affected and,therefore, the mid-height region exhibits less deformationand strain, so that the strain rate calculated in this region ismuch less than the strain rate exhibited in the upper area ofthe specimen. Based on these results, it becomes apparentthat, in order to calculate the maximum values of strainexhibited by the concrete prism, one has to identify withaccuracy the exact location where such strains and theircorresponding stresses will occur. This task is difficult tocarry out in an experimental investigation, from which onlyestimate values of data can be hoped for.
Figs. 16a and b show the curves obtained from thenumerical investigation which describe the variation of theload-carrying capacity maxPd (normalized with respect toits value under static loading maxPs) with: (i) the appliedstress rate (see Fig. 16a) and (ii) the maximum value ofaverage strain rate (see Fig. 16b). By comparing both thecases of tensile and compressive loading it becomesapparent that the change in the specimen behaviour undertensile loading—which is primarily expressed by anincrease in its load-carrying capacity—begins to occur atloading rates much lower than in the case of compression.The same conclusion is also derived from the analysis ofthe available experimental data [7,8].
9. Validation of the numerical predictions
In Figs. 14 and 15 the results obtained from thenumerical investigation are compared with available
ARTICLE IN PRESSD.M. Cotsovos, M.N. Pavlovic / International Journal of Impact Engineering 35 (2008) 319–335332
experimental data which describe the increase of thespecimen load-carrying capacity with increasing rates oftensile loading (more comprehensive experimental data arecontained in Figs. 2 and 4). The experimental data areobtained from a number of direct tensile and splitting tests.Such experimental data reveal that, for strain rates up to0.1 to 1 s�1, the specimen load-carrying capacity issimilar to its counterpart obtained under static loading.However, when strain rates become larger than approxi-mately 1 s�1, a sudden increase in the specimen strengthoccurs. This observation agrees with the numerical predic-tions obtained from the numerical investigation presentlyundertaken.
As for the case of compressive loading, the experimentaldata presented in Figs. 14 and 15 are characterized byconsiderable scatter. This scatter does not allow for veryaccurate predictions of the behaviour of concrete underhigh rates of tensile loading. As already mentioned, thelarge number of factors vary from experiment to experi-ment such as, for example, the size and shape of thespecimens tested, the loading techniques used, the moisturecontent of the specimens, the different mixes of concreteused, the different types of experiments carried out forinvestigating the behaviour of concrete in tension (directtension tests, splitting tests, etc.). Nevertheless, based onthe comparison of the predictions obtained from thenumerical investigation with the relevant experimentaldata, presented in Figs. 14 and 15, one can conclude that,as for the case of compressive loading [4,6], the FE model’spredictions are reasonable and provide a realistic phenom-enological description of the behaviour of concrete intension.
10. Parametric investigation
Reviewing the dynamic tests carried out to date, oneobserves that a number of parameters vary from oneexperiment to another. Such parameters include the staticuniaxial compressive strength of concrete fc, the experi-mental techniques used for the tests, the shape and size ofthe specimens, and the density and moisture content of theconcrete. The available test data do not allow accurateconclusions to be drawn regarding the individual effect thatthe variation of each of the above parameters has on thespecimen response. This is due to both the lack ofexperimental data investigating the individual effect ofeach parameter and to the scatter that characterizes allexisting data resulting often in the derivation of conflictingconclusions from investigation to investigation. Clearly,however, the variation of these parameters must have aneffect on specimen behaviour. The majority of theseparameters are linked to the dynamic (structural) char-acteristics of the specimen-structure, such as the stiffness,the mass and the boundary conditions. Keeping in mindthat the structural forms (i.e. concrete cylinders or prisms)used in tests must be viewed as structures, changes—evensmall ones—in the values of these various characteristics
may (potentially) result in significant changes in thespecimen’s response under dynamic loading. Such changesclearly show that the data obtained from such experimentsdescribes structural response rather than material beha-viour.The parametric investigation presently carried out
focuses on investigating, through numerical analysis(adopting the more formal and accurate whole-specimenmodelling with three degrees of freedom for the mass ateach node), the effects that the variation of some of theseparameters have on specimen response and their contribu-tions to the scatter in the experimental data. At this point,it is important to mention that one of the parameters thathas been shown to affect the behaviour of concrete underhigh loading rates is the moisture content of concrete.However, it is impossible to include this parameter in thepresent investigation as the material model adopted forconcrete is limited to the type of concrete used in RCstructures, being usually air-cured and, therefore, posses-sing low moisture content. The parameters that arepresently investigated are the uniaxial compressive strengthand density of the concrete used as well the height andcross-sectional area of the specimen (the effect of themeasuring technique has already been considered—see, forexample Fig. 13). In each of these cases only one of theparameters of the concrete prism investigated initially ischanged at a time in order to investigate its individualeffect. The results obtained are summarized in Figs. 17aand b which show the variation of the load-carryingcapacity maxPd (normalized with respect to its value understatic loading maxPs) with the applied stress rate as well asthe maximum average value of strain rate.Initially, the value of the uniaxial compressive strength
of concrete was increased from 30 to 60MPa. Thepredictions obtained are consistent with the CEB [33]recommendations which suggest that the increase inultimate strength of concrete specimens with loading ratedepends on the value of fc of the concrete used; inparticular, the higher the value of fc, the lower the increaseof the specimen’s strength when subjected to high rates oftensile loading.In order to investigate numerically the effect of specimen
cross-sectional area and length on specimen behaviourunder high rates of tensile loading, three additional casestudies are investigated. The specimens are similar to thatshown in Fig. 6 except for the changes described below. Inthe first case, the side of the cross section of the specimen isset to 50mm (instead of 100mm) (50� 50� 253) in orderto reduce the cross-sectional area to a quarter of that usedoriginally. In the second case, the length of the specimen ishalf that of the original (126mm instead of 253mm)(100� 100� 126.) Finally, in the third case, both the sideof the cross section and the length of the specimen are halfof those in the original specimen (50� 50� 126). Byexamining the results in Figs. 17a–b, it is apparent thatthe variation in cross-sectional area and height has someeffect on specimen response with increasing stress rate. In

ARTICLE IN PRESS
0
1
2
3
4
5
6
maxP
d/m
ax
Ps
100x100x253
fc=60MPa
p=2400kg/m3
100x100x253
fc=30MPa
p=2400kg/m3
100x100x126
fc=30MPa
p=2400kg/m3
50x50x253
fc=30MPa
p=2400kg/m3
50x50x126
fc=30MPa
p=2400kg/m3
100x100x253
fc=30MPa
p=2880kgr/m3
0
1
2
3
4
5
6
100
maxP
d/m
ax
Ps
100x100x253
fc=60MPa
p=2400kg/m3
100x100x253
fc=30MPa
p=2400kg/m3
100x100x126
fc=30MPa
p=2400kg/m3
50x50x253
fc=30MPa
p=2400kg/m3
50x50x126
fc=30MPa
p=2400kg/m3
100x100x253
fc=30MPa
p=2880kgr/m3
1.00E+03 1.00E+04 1.00E+05 1.00E+06
applied stress rate (MPa/sec)
0.01 0.1 1 10
max average value of strain rate (1/sec)
Fig. 17. Numerical predictions obtained from the parametric investigation describing the variation of maxPd/maxPs with (a) the applied stress rate and
(b) the maximum value of exhibited average strain rate for the case of uniaxial tensile loading.
D.M. Cotsovos, M.N. Pavlovic / International Journal of Impact Engineering 35 (2008) 319–335 333
particular, it seems that, the smaller the cross-sectional areaand the longer the specimen, the larger the increase instrength becomes.
Finally, the use of different mixes as well as the use ofdifferent types of components (aggregate, cement paste,etc) may result in a variation of the density of the concretespecimen. Though these differences are expected to berather small, the application of high rates of uniaxialloading onto a concrete specimen becomes a dynamicproblem and, therefore, the inertia of its mass plays asignificant role in its response under such loading condi-tions. In order to investigate the effect of the variation ofdensity, the density of concrete (r) was increased by 20%of that originally used (2400 kg/m3). The numerical dataobtained revealed that an increase of the density resulted in
the specimen exhibiting a higher increase of load-carryingcapacity under tensile loading with increasing loadingrates. This can be explained by the fact that an increase indensity results in an increase of the inertia forces thatdevelop during the application of the loading of theexternal load, thus resulting in a further increase of theload-carrying capacity of the concrete prisms.
11. Conclusions
The comparative study between numerical and experi-mental data revealed that the brittle material model usedand nonlinear FE strategy adopted are capable ofproviding realistic predictions of the behaviour of concreteat high rates of uniaxial tensile loading. In view of this
ARTICLE IN PRESSD.M. Cotsovos, M.N. Pavlovic / International Journal of Impact Engineering 35 (2008) 319–335334
(static) material model’s ability to describe the behaviour athigh rates of loading, it can be concluded that the effect ofthe rate of loading on the specimen behaviour reflects theeffect of the inertia loads that reduce the rate of cracking ofthe specimen, a fact which, in turn, leads to an increase ofits load-carrying capacity. Furthermore, the numericalresults obtained reveal that the scatter caused by varyingindividual parameters (such as the fc and density of theconcrete, the cross-sectional area and length of the speci-men, and even the testing/measuring technique adopted)can account for the magnitude of the scatter thatcharacterizes the available experimental data. This conclu-sion becomes more apparent when considering the fact thatthe combined effect of a number of such parameters iscertain to have an even more substantial effect on theoverall prism response.
At high rates of tensile loading the numerical resultsreveal that only the upper region of the concrete specimendeforms whereas the rest remains practically unaffected bythe application of the external load. For the case of lowrates of loading the deflection of the stress waves on theboundary surfaces of the specimen caused from thecontinuous application of the external load is trapped bythe boundary conditions leading to a non-homogeneousdistribution of the stress throughout the specimen. Inneither of the above cases, the specimen behaviour can beconsidered to represent the behaviour of concrete as amaterial. This is further supported by results obtained fromthe parametric investigation which clearly suggests that thebehaviour of the concrete prisms under high rates ofuniaxial tensile loading are affected by a number para-meters related to the structural characteristics of the prisms(i.e. mass, strength, stiffness).
Therefore, a concrete specimen under dynamic loadingcannot be used to describe concrete-material behavioursince, in contrast with static loading, it cannot constitute amaterial unit from which average material properties maybe obtained. Under dynamic tests the concrete specimenmust be viewed as a structure since its behaviour is directlylinked to the inertia effect of its mass and the boundaryconditions. Therefore, the use of experimental data fromdynamic tests in order to develop constitutive models forconcrete behaviour under dynamic loading is questionable.Moreover, the experimental data suggest that the beha-viour of a concrete specimen under impact loading dependson a number of parameters, the effects of which cannot bequantified due to the significant scatter that characterizesthe experimental data.
Finally, there are differences in the responses exhibitedby the specimen under tensile and compressive impact.First, tensile specimens show rate sensitivity at lowerapplied stress rates. Secondly, tensile specimens appear toexhibit little, if any, changes in the maximum strain(compared with its static counterpart), which contrastswith the findings for compressive impact where asignificant increase in maximum strain is recorded beyonda certain loading rate. Thirdly, there is negligible
confinement in the direction perpendicular to the loading(again, in contrast to compressive tests).
Acknowledgements
We are grateful to the reviewers for suggesting additionsto the original manuscript that have resulted in a morecomprehensive description of the reported research. More-over, they have provided us with additional, and veryrecent, experimental data which is now included in thispaper.
References
[1] Kotsovos MD, Pavlovic MN. Structural concrete: finite-element
analysis and design. London: Thomas Telford; 1995.
[2] Cotsovos DM, Pavlovic MN. Numerical investigation of RC walls
subjected to cyclic loading. Comput and Concr 2005;2:215–38.
[3] Cotsovos DM, Pavlovic MN. Simplified FE model for RC structures
under earthquakes. Struct Buildings 2006;159:87–102.
[4] Cotsovos DM, Pavlovic MN. Numerical investigation of concrete
subjected to compressive impact loading. Part 1: a fundamental
explanation for the apparent strength gain at high loading rates.
Comput Struct, 2007, to appear.
[5] Cotsovos DM, Pavlovic MN. Numerical investigation of concrete
subjected to compressive impact loading. Part 2: parametric
investigation of factors affecting behaviour at high loading rates.
Comput and Struct 2007, to appear.
[6] Cotsovos DM. Numerical investigation of structural concrete under
dynamic (earthquake and impact) loading. PhD thesis, University of
London, UK; 2004.
[7] Bischoff PH, Perry SH. Compressive behaviour of concrete at high
strain rates. Mater Struct RILEM 1991;24:425–50.
[8] Report on Dynamic Fracture of Concrete. ACI Committee 446. ACI
446.4R-04; 2004.
[9] Malvar LJ, Crawford JE. Dynamic increase factors for concrete.
Twenty-Eighth DDESB Seminar, Orlando; FL; 1998.
[10] Schuler H, Mayrhofer C, Thoma K. Spall experiments for the
measurement of the tensile strength and fracture energy of concrete at
high strain rates. Int J Impact Eng 2006;32;1635-1650.
[11] Wu H, Zhang Q, Huang F, Jin Q. Experimental and numerical
investigation on the dynamic tensile strength of concrete. Int J Impact
Eng 2005;32:605–17.
[12] Brara A, Klepaczko JR. Experimental characterization of concrete in
dynamic tension. Mech Mater 2006;38:253–67.
[13] Malvar LJ, Crawford JE, Wesevich JW, Simons D. A plasticity
concrete material model for DYNA3D. Int J Impact Eng
1997;19:847–73.
[14] Thabet A, Haldane D. Three-dimensional numerical simulation of
the behaviour of standard concrete test specimens when subjected to
impact loading. Comput Struct 2001;79:21–31.
[15] Cela JJL. Analysis of reinforced concrete structures subjected to
dynamic loads with a viscoplastic Drucker–Prager model. Appl Math
Modelling 1998;22:495–515.
[16] Winnicki A, Pearce CJ, Bicanic N. Viscoplasic Hoffman consistency
model for concrete. Comput Struct 2001;79:7–19.
[17] Gomes HM, Awruch AM. Some aspects on three-dimensional
numerical modelling of reinforced concrete structures using the finite
element method. Adv Eng Software 2001;32:257–77.
[18] Georgin JF, Reynouard JM. Modeling of structures subjected to
impact: concrete behaviour under high strain rate. Cement &
Concrete Composites 2003;217:131–43.
[19] Barpi F. Impact behaviour of concrete: a computational approach.
Eng Fract Mech 2004;71:2197–213.
ARTICLE IN PRESSD.M. Cotsovos, M.N. Pavlovic / International Journal of Impact Engineering 35 (2008) 319–335 335
[20] Cervenka V, Gerstle K. Inelastic FE analysis of RC panels:
experimental verification and application. IABSE Publ 1972;32:
25–39.
[21] Hatzigeorgiou G, Beskos D, Theodorakopoulos D, Sfakianakis M. A
simple concrete damage model for dynamic FEM applications. Int
J Comput Eng Sci 2001;2:267–86.
[22] Koh CG, Liu ZJ, Quek ST. Numerical and experimental studies of
concrete under impact. Mag Concr Res 2001;53:417–27.
[23] Lu Y, Xu K. Modelling of dynamic behaviour of concrete materials
under blast loading. Int J Solids Struct 2004;41:131–43.
[24] Dube J-F, Pijaudier-Cabot G, La Borderie C. Rate dependent
damage model for concrete in dynamics. ASCE J. Eng. Mech. Div.
1996;122:359–80.
[25] Faria R, Olivera J, Cevera M. A strain-based plastic viscous-damage
model for massive concrete structures. Int J Solids & Struct
1998;35:1533–58.
[26] Bathe K-J. Finite element procedures. Prentice-Hall: Englewood
Cliffs, NJ; 1996.
[27] Hinton E, Owen DRJ. Finite elements in plasticity: theory and
application. Pineridge Press: Swansea; 1980.
[28] Tedesco JW, Ross AC, Brunair RM. Numerical analysis of dynamic
split cylinder tests. Comput Struct 1989;32:609–24.
[29] Tedesco JW, Ross AC, McGill PB, O’Neil BP. Numerical analysis of
high strain rate concrete tension tests. Comput Struct 1991;40:313–27.
[30] Tedesco JW, Powell JC, Ross AC, Hughes ML. A strain-rate-
dependent concrete material model for ADINA. Comput Struct
1997;64:1053–67.
[31] Li QM, Meng H. About the dynamic strength enhancement of
concrete-like materials in a split Hopkinson pressure bar test. Int
J Solids and Struct 2003;40:343–60.
[32] Ross CA, Thompson PY, Tedesco JW. Split Hopkinson pressure bar
tests on concrete and mortar in tension and compression. ACI Mat
J 1989;86:475–81.
[33] CEB. Concrete structures under impact and impulsive loading.
Synthesis Report, Bulletin d’Information No. 187, Comite Euro-
International du Beton, Lausanne;1988.