Numerical Experiments of Forced Cylinder Oscillations at an Angle to Oncoming Flow
16
Engineering Applications of Computational Fluid Mechanics Vol. 5, No. 4, pp. 579–594 (2011) Received: 9 Mar. 2011; Revised: 21 Jun. 2011; Accepted: 18 Jul. 2011 579 NUMERICAL EXPERIMENTS OF FORCED CYLINDER OSCILLATIONS AT AN ANGLE TO ONCOMING FLOW Thau Do # , Li Chen* † , James A. Forrest* and Jiyuan Tu # # School of Aerospace, Mechanical and Manufacturing Engineering, RMIT University, P.O. Box 71, Bundoora VIC 3083, Australia * Maritime Platforms Division, Defence Science & Technology Organisation, 506 Lorimer St, Fishermans Bend VIC 3207, Australia † E-Mail: [email protected] (Corresponding Author) ABSTRACT: A computational study of laminar, incompressible flow past a circular cylinder forced to oscillate in the longitudinally, transversely and at an angle to the uniform freestream is performed using the dynamic mesh method. The numerical simulations are conducted at a fixed Reynolds number of 80 and 300 with amplitude ratios from 0.05 to 0.7 and excitation frequency ratios of 0.05 to 3.0. Excellent agreement to previous experimental and numerical investigations is achieved in the prediction of the lock-on range, force amplifications and vortex-shedding modes. Analysis of the wake response of flow past a cylinder oscillating at an angle to the free stream using phase- plane diagrams and the transverse force coefficients revealed two lock-on regions. The extents of these lock-on regions, the variation of the forces, and the near-wake vortex shedding modes are discussed and presented. Keywords: forced oscillations, lock-on, inline, crossflow, vortex shedding, dynamic mesh 1. INTRODUCTION Viscous flow over a forced oscillating circular cylinder continues to attract much attention both in the academic and practical engineering arenas due to the rich blend of physics involved. A recent study by Carberry et al. (2004) has shown that although controlled oscillation studies do not simulate all components of flow-induced oscillations, many features can still be replicated. Morse and Williamson (2006) have shown there is a good correlation between the forced and free vibrations if experimental conditions are matched. In a later paper, they also predict the flow- structure interactions for an elastically mounted cylinder using the forced oscillating cylinder experimental data (Morse and Williamson, 2009). This nonlinear flow arises from the interaction of the fluid and the structure, and is largely influenced by the combination of the oscillating amplitude ratio A/D and the excitation frequency ratio 0 s e f f (Naudascher, 1987; Karniadakis & Triantafyllou, 1989). Here A, D, f e and f s0 are respectively the displacement amplitude, cylinder diameter, excitation frequency and vortex- shedding frequency of a stationary cylinder. At the right combination, the flow may induce one or more complex phenomena, such as hysteresis, bifurcation, synchronisation, formation of exotic wake streets and competition of the vortex- shedding patterns (Xu et al., 2006; Bishop and Hassan, 1964b; Blackburn & Henderson, 1999; Öngören and Rockwell, 1987). This poses a great challenge to both theoretical and experimental fields. A recent study of a flexibly constrained cylinder in a cross flow at Reynolds number up to 195 by Pereira Gomes et al. (2011) intends to provide a reference case to address the increasing research activities in this field. Crossflow oscillations are commonly found in atmospheric flows around chimneys, transmission wires, high-rise buildings and suspension bridge cables. This has led to a significant number of experimental studies of circular cylinders undergoing forced transverse oscillations (e.g. see Bishop and Hassan, 1964b; Koopman, 1967; Griffin, 1971; Griffin, 1974; Bearman and Currie, 1979; Williamson, 1988). Hence it is generally known that lock-on occurs within a range when 0 s e f f is close to unity. In conjunction with the classical power spectral density analysis, Koopman (1967) and Karniadakis and Triantafyllou (1989) also employed Lissajous figures, otherwise commonly known as phase diagrams, to identify lock-on states using two arbitrary independent variables such as longitudinal velocity ux and transverse velocity uy. In this lock-on range, Bishop and Hassan (1964a) observed an abrupt phase shift between the transverse force and cylinder displacement.
Transcript of Numerical Experiments of Forced Cylinder Oscillations at an Angle to Oncoming Flow
Engineering Applications of Computational Fluid Mechanics Vol. 5, No. 4, pp. 579–594 (2011)
Received: 9 Mar. 2011; Revised: 21 Jun. 2011; Accepted: 18 Jul. 2011
579
NUMERICAL EXPERIMENTS OF FORCED CYLINDER OSCILLATIONS AT AN ANGLE TO ONCOMING FLOW
Thau Do#, Li Chen*†, James A. Forrest* and Jiyuan Tu#
# School of Aerospace, Mechanical and Manufacturing Engineering, RMIT University, P.O. Box 71, Bundoora VIC 3083, Australia
* Maritime Platforms Division, Defence Science & Technology Organisation, 506 Lorimer St, Fishermans Bend VIC 3207, Australia
† E-Mail: [email protected] (Corresponding Author)
ABSTRACT: A computational study of laminar, incompressible flow past a circular cylinder forced to oscillate in the longitudinally, transversely and at an angle to the uniform freestream is performed using the dynamic mesh method. The numerical simulations are conducted at a fixed Reynolds number of 80 and 300 with amplitude ratios from 0.05 to 0.7 and excitation frequency ratios of 0.05 to 3.0. Excellent agreement to previous experimental and numerical investigations is achieved in the prediction of the lock-on range, force amplifications and vortex-shedding modes. Analysis of the wake response of flow past a cylinder oscillating at an angle to the free stream using phase-plane diagrams and the transverse force coefficients revealed two lock-on regions. The extents of these lock-on regions, the variation of the forces, and the near-wake vortex shedding modes are discussed and presented.
Keywords: forced oscillations, lock-on, inline, crossflow, vortex shedding, dynamic mesh
1. INTRODUCTION
Viscous flow over a forced oscillating circular cylinder continues to attract much attention both in the academic and practical engineering arenas due to the rich blend of physics involved. A recent study by Carberry et al. (2004) has shown that although controlled oscillation studies do not simulate all components of flow-induced oscillations, many features can still be replicated. Morse and Williamson (2006) have shown there is a good correlation between the forced and free vibrations if experimental conditions are matched. In a later paper, they also predict the flow-structure interactions for an elastically mounted cylinder using the forced oscillating cylinder experimental data (Morse and Williamson, 2009). This nonlinear flow arises from the interaction of the fluid and the structure, and is largely influenced by the combination of the oscillating amplitude ratio A/D and the excitation frequency ratio 0se ff (Naudascher, 1987; Karniadakis &
Triantafyllou, 1989). Here A, D, fe and fs0 are respectively the displacement amplitude, cylinder diameter, excitation frequency and vortex-shedding frequency of a stationary cylinder. At the right combination, the flow may induce one or more complex phenomena, such as hysteresis, bifurcation, synchronisation, formation of exotic wake streets and competition of the vortex-
shedding patterns (Xu et al., 2006; Bishop and Hassan, 1964b; Blackburn & Henderson, 1999; Öngören and Rockwell, 1987). This poses a great challenge to both theoretical and experimental fields. A recent study of a flexibly constrained cylinder in a cross flow at Reynolds number up to 195 by Pereira Gomes et al. (2011) intends to provide a reference case to address the increasing research activities in this field. Crossflow oscillations are commonly found in atmospheric flows around chimneys, transmission wires, high-rise buildings and suspension bridge cables. This has led to a significant number of experimental studies of circular cylinders undergoing forced transverse oscillations (e.g. see Bishop and Hassan, 1964b; Koopman, 1967; Griffin, 1971; Griffin, 1974; Bearman and Currie, 1979; Williamson, 1988). Hence it is generally known that lock-on occurs within a range when
0se ff is close to unity. In conjunction with the
classical power spectral density analysis, Koopman (1967) and Karniadakis and Triantafyllou (1989) also employed Lissajous figures, otherwise commonly known as phase diagrams, to identify lock-on states using two arbitrary independent variables such as longitudinal velocity ux and transverse velocity uy. In this lock-on range, Bishop and Hassan (1964a) observed an abrupt phase shift between the transverse force and cylinder displacement.
Engineering Applications of Computational Fluid Mechanics Vol. 5, No. 4 (2011)
580
Later, Tanida et al. (1973) showed that the large-scale vortex-shedding frequency of the vibrating cylinder, sf , is exactly equal to the excitation
frequency fe, i.e. 1se ff . They also reported
that there is an amplification of the hydrodynamic forces exerted on the cylinder, both in the transverse ( yF ) and streamwise ( xF ) direction.
Koopman (1967) conducted a flow visualisation study of forced transverse excitation with different amplitude ratios and concluded that this lock-on range is extended to higher DA . Williamson and Roshko (1988) investigated the effects of large amplitude ratios on the wake, up to 5DA . They observed various extraordinary wakes and named them using letters and numbers that describe the combination of pairs of vortices (P) and single vortices (S) being shed during one cycle of forced oscillation. Hines et al. (2009) studied the crossflow oscillation of a square cylinder in a turbulent flow using the k model. However, the lock-on region predicted is significantly larger than other researchers’ results. Experimental studies of inline forced cylinder oscillations is relatively less common compared to crossflow forced excitations. Perhaps this is because the streamwise fluctuating force xF exerted on the cylinder is weaker, being only one tenth in magnitude of the transverse fluctuating force yF (Bishop and Hassan, 1964a). Nonetheless,
in hydrodynamic flows this xF component has
been known to excite braced members of off-shore structures, marine piles and submarine periscopes (King, 1977) and is of engineering significance. Tanida et al. (1973) revealed that lock-on occurs over the forcing frequency of
0.25.1 0 se ff for 80Re and 14.0DA
for inline oscillations and the large-scale vortex-shedding frequency of the vibrating cylinder is exactly one half of the excitation frequency, i.e.
2se ff . Griffin and Ramberg (1974)
performed quantitative inline oscillations at 190Re , }2.2,74.1{0 se ff and
}12.0,06.0{DA . Similar to forced transverse oscillations, they found that the driving frequency lock-on range widens with increasing A/D. They also observed two different vortex shedding patterns in the form of 2S and 2P. At the right combination of amplitude ratio and forcing frequency, longitudinal forced oscillations can also induce interesting symmetric vortex-shedding modes (Öngören and Rockwell, 1987;
Griffin and Ramberg, 1976). Xu et al. (2006) studied experimentally the symmetric binary vortex street induced by the forced inline oscillation at 1150~100Re , 5.0DA and
74.1se ff and developed an semi-empirical
model to predict the onset of the binary vortex street by assuming the flow is two dimensional. Investigations of a circular cylinder experiencing forced oscillations at an angle with respect to an incoming flow have been rare. Öngören & Rockwell (1987) examined such oscillations at 60 and 45, as well as performing inline and crossflow oscillations. They observed and classified two main vortex-shedding modes, namely symmetric (S) – a symmetric vortex pair (per shedding period T) - and antisymmetric (A), where the antisymmetric mode was further sub-classified into AI, AII, AIII and AIV. The four antisymmetric modes correspond to 2S (per T), 2S (per 2T), S+P (per 2T) and 2P (per 2T) respectively, where S and P refer to a single vortex and a pair of vortices. Oscillations at 60 angle exhibit synchronized vortex-shedding modes at 10 se ff , 20 se ff and 40 se ff in the form of AI, AII and S respectively, while at other excitation frequencies, repeating occurrences of S and A modes were observed over time. However, in their 60 angle oscillations only qualitative information from flow visualization can be found from their study, and hence detailed lock-on flow regimes and analysis of the fluctuating forces are not available. The question also arises as to whether the wake street can be modified when the amplitude ratio A/D increases for this configuration of forced oscillations. Karanth et al. (1995) studied the lock-on phenomena for 80Re and
8.02.0 DA for a combined oscillation, in which the trajectory of a free vibrating cylinder was assumed. They used a vorticity-stream-function formula, in which the forced oscillation was modelled on a reference-frame. Therefore, no moving grids are required. They found that the mean drag force and transient lift force acting on the cylinder increase with an increase in the transverse oscillation, but the fluctuation magnitude of the drag force does not. Increasing the amplitude of the oscillation increases the lock-on range. They focused on the lock-on, and no details of the wake structure were reported in their study. A significant number of computational studies have been conducted to study both inline and crossflow forced oscillations, too numerous to
Engineering Applications of Computational Fluid Mechanics Vol. 5, No. 4 (2011)
581
include all in the present paper. The interested reader is referred to some of the low Reynolds number works by Lecointe and Piquet (1990), Li et al. (1992), Hall and Griffin (1993), Braza et. al. (1986), Meneghini and Bearman (1995), Patnaik et al. (1999), and Anagnostopoulos (1967). In these numerical studies, no attempt was made to simulate combined inline and transverse forced oscillations, i.e. oscillations at an angle with respect to the oncoming flow. The first objective of the current study is to firstly assess the capability of a commercially available code with the dynamic mesh feature, which allows the simulation of the “physical” oscillating motion of the circular cylinder. Vigorous validation of lock-on regimes, fluctuating forces and vortex-shedding modes of both transverse and longitudinal forced oscillation against published data will be presented. The second objective is to perform a series of numerical experiments on the case where the oscillations of the cylinder are at 60 to the oncoming freestream and provide an analysis of the fluctuating forces, identification of lock-on regimes and behaviour of the wake street.
2. MODELLING PROCEDURE
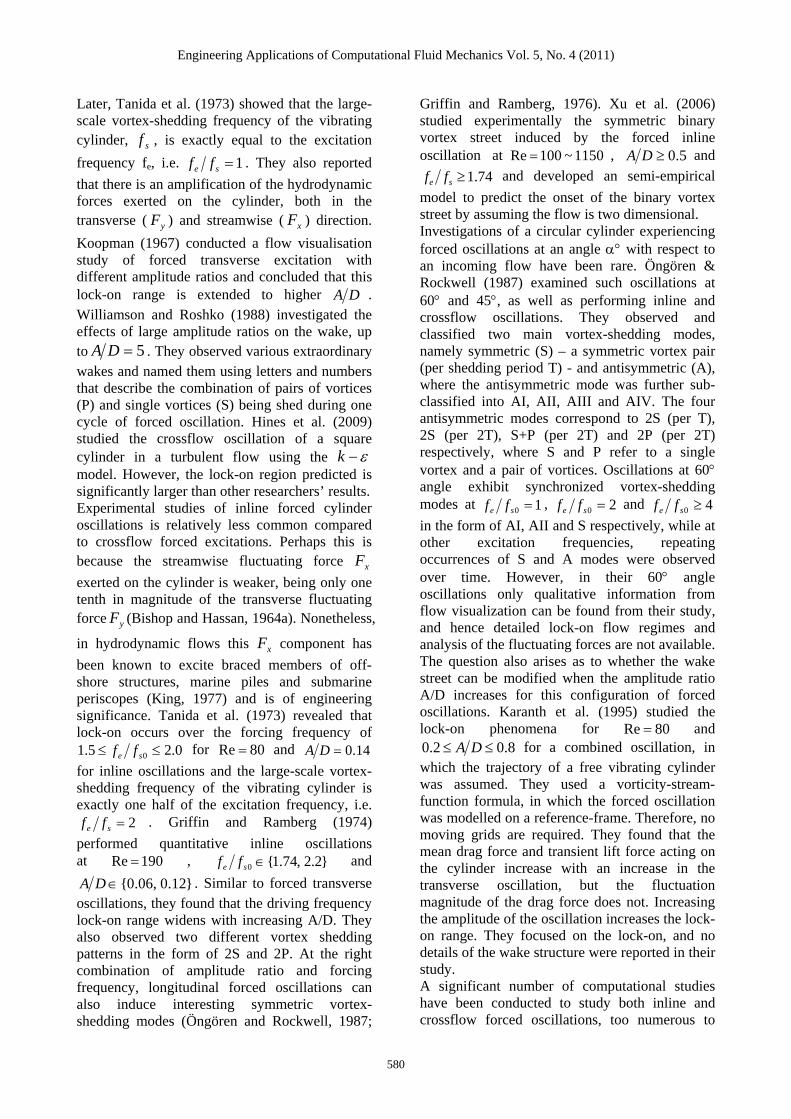
It has been demonstrated that onset of three-dimensionality in a cylinder wake can be delayed if the cylinder is forced to oscillate at moderate amplitudes. For example, Koopman (1967) and Griffin and Ramberg (1974) showed that the wake was essentially two-dimensional at vibration amplitudes above 10 % of a cylinder diameter for Reynolds numbers up to 300-400. Berger (1967) showed through an experimental study that a laminar vortex-shedding regime can be stabilized and extended until 350~300Re by controlled oscillations. Kevlahan & Wadsley (2005) studied the suppression of the 3D instability by a moving tube bundle. They concluded that at 200Re and 125.0DA , the 3D instability of the wake flow is completely suppressed by the moving cylinder. At 1000Re and 125.005.0 DA , the spanwise correlation of the wake street is enhanced, but the vibration is not strong enough to suppress the 3D instability totally. In this numerical study, the majority of flows simulated have Reynolds number up to 300, hence the flow is assumed laminar, two-dimensional and incompressible. For Reynolds number larger than 300, it is assumed that the numerical error acts in the role of a subgrid-turbulence model. Fig. 1 provides the details of a typical computational domain used in this study
with the circular cylinder having a diameter of 01.0D m. Discretization was achieved using
triangular cells everywhere except in the thin region enveloping the circular cylinder, where quadrilateral cells were designated up to a thickness of D1.0 to increase accuracy in resolving the boundary-layer flow (see inset of Fig. 1). The surface of the cylinder was defined with a no-slip wall boundary condition. The incompressible Navier-Stokes equations are solved using a segregated second-order implicit unsteady solver approach in the commercial software FLUENT together with the SIMPLE method to achieve pressure-velocity coupling. The backward difference scheme of first-order accuracy in the time domain, which is the only option available for the dynamic meshing in FLUENT, and the second-order accurate upwind scheme in the spatial domain are used in the simulations. The oscillating motion of the cylinder is achieved by specifying a prescribed velocity for its centre of mass. The prescribed motion of the cylinder is given by the oscillation orientation, excitation frequency and amplitude. Consider a sinusoidal motion due to forced oscillation of a circular cylinder at an arbitrary angle relative to the oncoming flow as depicted in Fig. 2. (The relative
Fig. 1 Details of typical two-dimensional
computational domain. The inset shows enlarged view near cylinder.
Fig. 2 Circular cylinder undergoing forced
sinusoidal oscillations at an angle with respect to oncoming flow.
Symmetry
Symmetry
(t)
x(t)
y(t)
U
fe
A
12D
10D 40D
Pressure OutletVelocity Inlet
Engineering Applications of Computational Fluid Mechanics Vol. 5, No. 4 (2011)
582
displacement shown here is grossly exaggerated for clarity.) The maximum displacement amplitude is A and the trajectory of the cylinder at anytime t is given as )(t . For harmonic sinusoidal motion of the centre of mass of the cylinder, )(t , is defined as:
02sin)( ttfAt e (1)
in which t0 is the delay time. However, in this study the circular cylinder is impulsively started at the beginning of the simulation, 00 t . Using
Cartesian coordinates to describe the motion of the cylinder and keeping the oscillations in a straight line, i.e. eee fff
yx , leads to
)2sin()cos()( tfAtx e (2)
)2sin()sin()( tfAty e (3)
Equations 2 & 3 are used to specify the periodic oscillations of the centre of mass of the circular cylinder. For referencing purposes in the results sections, the directions indicated by the arrows in Fig. 2 for each of )(t , )(tx and )(ty are positive directions. The oscillation orientations simulated in the current study include inline ( 0 ), transverse ( 90 ) and angled ( 60 ) oscillations, with amplitude ratios in the range 0.1~14.0DA and excitation
frequency ratios in the range 0.3~5.00 se ff .
The motion of the cylinder is implemented by updating the whole triangular cell mesh after each time step using the dynamic mesh model with smoothing and remeshing. The thin layer of quadrilateral cells around the cylinder moves with the cylinder as a solid.
3. NUMERICAL FORMULATION
Prior to performing numerical experiments with oscillations at 60 , mesh independence and validation of the current commercial code was carried out. In this section, validation results in terms of lock-on range, fluctuating forces and vortex-shedding modes of both transverse and longitudinal forced oscillations against published data will be presented.
3.1 Mesh independence
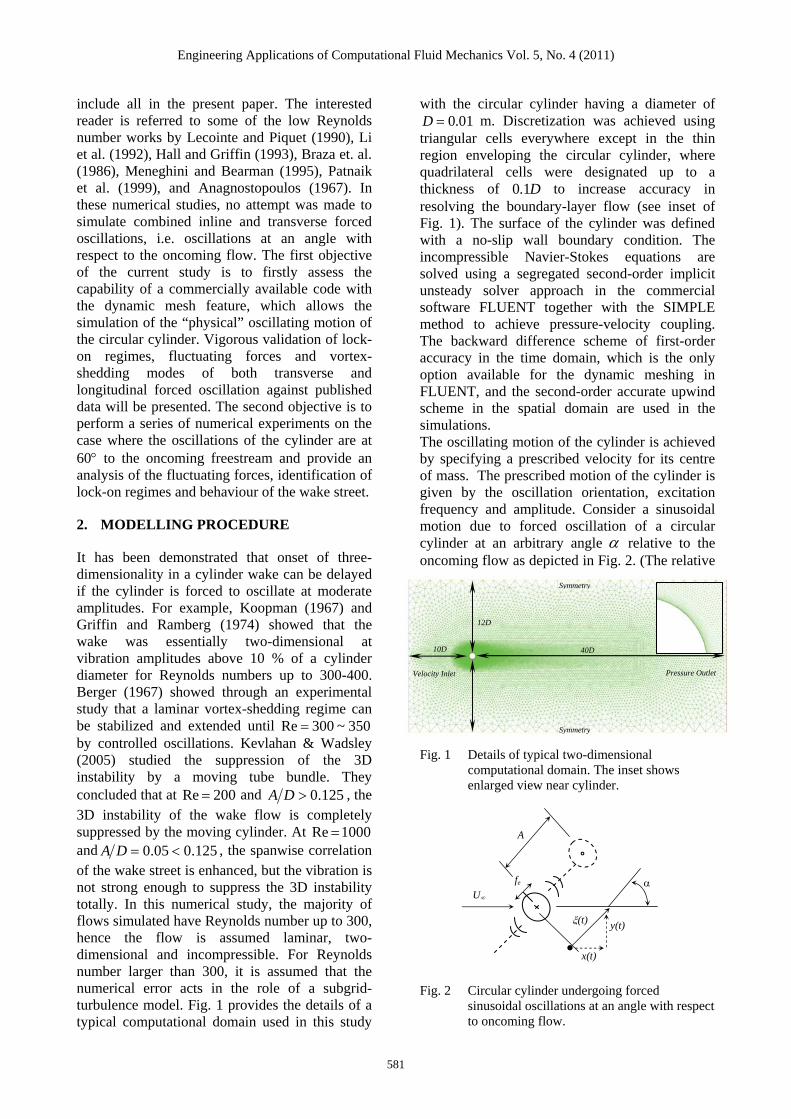
Three meshes were developed for grid independence analysis. Table 1 provides the comparison of the Strouhal number (St), mean
longitudinal force coefficient ( xC ) and the peak-
Table 1 Comparison of main flow characteristics with published data for flow past a stationary cylinder with 100Re .
St xC yC Peak-peak
Mesh A (13,080)
0.1492 1.51 0.360
Mesh B (41,510 cells)
0.1657 1.356 0.603
Mesh C (57,704 cells)
0.1635 1.357 0.604
Tritton (1971)0.15-0.18
1.26-1.32 ---
Braza et al. (1986)
0.16 1.3 0.6
Li et al. (1992)
0.176 1.333 0.685
0.0
1.0
2.0
0 0.5 1 1.5 f e /f s0
f e /f s
0.0
1.0
2.0
Current computations
Tanida et al. (1973) - Experiment
Patnaik et al. (1999) - Numerical
Patnaik et al (1999) - numerical
Current computations
Tanida et al. (1973) - Experiment
U
f e
+A
Fig. 3 Vortex-shedding frequency ratio and mean
longitudinal force coefficient variation for transverse oscillations compared with published data, 80Re and 14.0DA .
to-peak values of transverse force coefficient (Cy), as well as the details of the three meshes. The results were for flow past a stationary circular cylinder with a Reynolds number of 100. It is seen that the variation between the solutions decreases with the refinement of meshes, hence grid independence was achieved. Comparison of the main flow characteristics is shown to have an excellent agreement with published data. The denser mesh, Mesh B, was used throughout this numerical simulation to ensure adequate cells to account for the death and birth of cells in the dynamic remeshing process.
3.2 Lock-on range and fluctuating forces
A comparison of the lock-on range for transverse oscillations with an experimental study by Tanida et al. (1973) and a numerical simulation by
Engineering Applications of Computational Fluid Mechanics Vol. 5, No. 4 (2011)
583
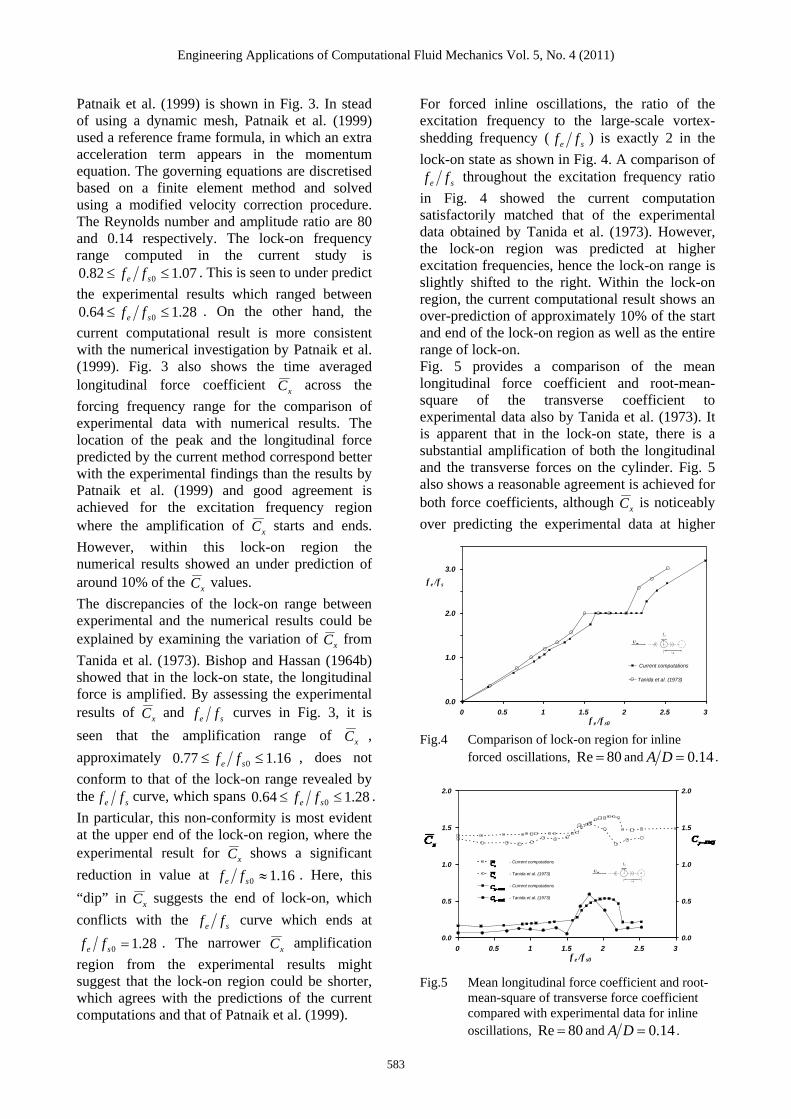
Patnaik et al. (1999) is shown in Fig. 3. In stead of using a dynamic mesh, Patnaik et al. (1999) used a reference frame formula, in which an extra acceleration term appears in the momentum equation. The governing equations are discretised based on a finite element method and solved using a modified velocity correction procedure. The Reynolds number and amplitude ratio are 80 and 0.14 respectively. The lock-on frequency range computed in the current study is
07.182.0 0 se ff . This is seen to under predict
the experimental results which ranged between 28.164.0 0 se ff . On the other hand, the
current computational result is more consistent with the numerical investigation by Patnaik et al. (1999). Fig. 3 also shows the time averaged longitudinal force coefficient xC across the
forcing frequency range for the comparison of experimental data with numerical results. The location of the peak and the longitudinal force predicted by the current method correspond better with the experimental findings than the results by Patnaik et al. (1999) and good agreement is achieved for the excitation frequency region where the amplification of xC starts and ends.
However, within this lock-on region the numerical results showed an under prediction of around 10% of the xC values.
The discrepancies of the lock-on range between experimental and the numerical results could be explained by examining the variation of xC from
Tanida et al. (1973). Bishop and Hassan (1964b) showed that in the lock-on state, the longitudinal force is amplified. By assessing the experimental results of xC and se ff curves in Fig. 3, it is
seen that the amplification range of xC ,
approximately 16.177.0 0 se ff , does not
conform to that of the lock-on range revealed by the se ff curve, which spans 28.164.0 0 se ff .
In particular, this non-conformity is most evident at the upper end of the lock-on region, where the experimental result for xC shows a significant
reduction in value at 16.10 se ff . Here, this
“dip” in xC suggests the end of lock-on, which
conflicts with the se ff curve which ends at
28.10 se ff . The narrower xC amplification
region from the experimental results might suggest that the lock-on region could be shorter, which agrees with the predictions of the current computations and that of Patnaik et al. (1999).
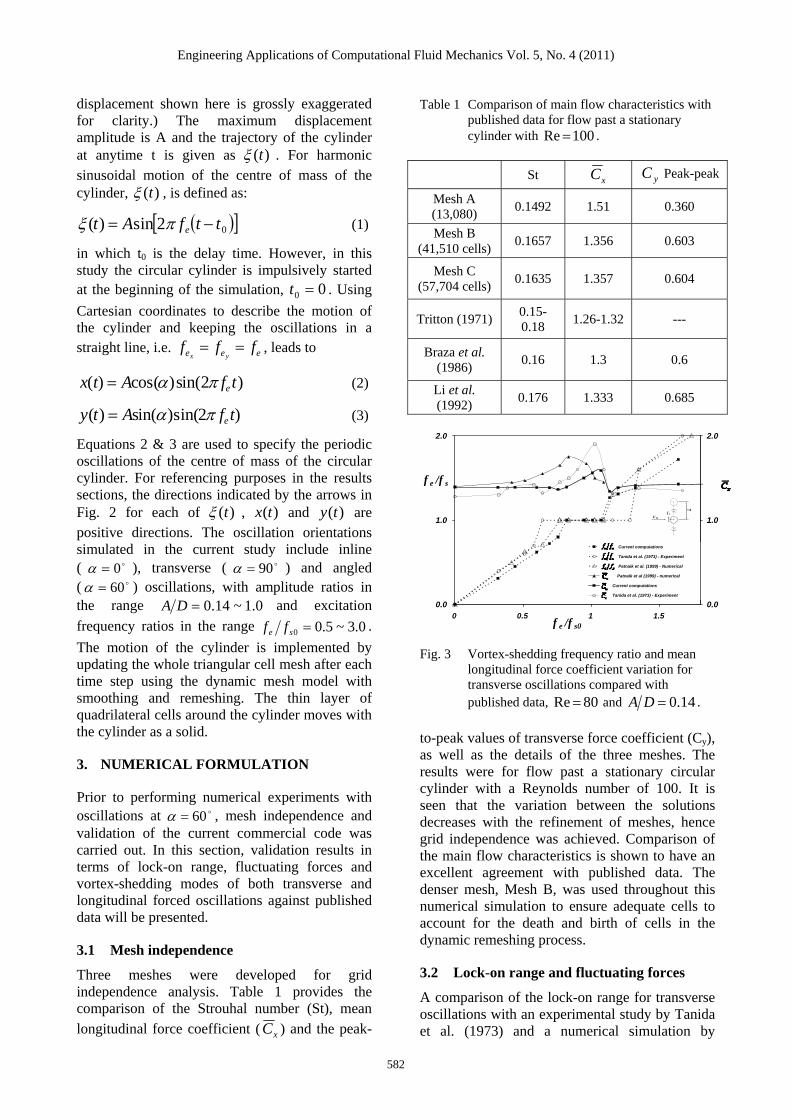
For forced inline oscillations, the ratio of the excitation frequency to the large-scale vortex-shedding frequency ( se ff ) is exactly 2 in the
lock-on state as shown in Fig. 4. A comparison of
se ff throughout the excitation frequency ratio
in Fig. 4 showed the current computation satisfactorily matched that of the experimental data obtained by Tanida et al. (1973). However, the lock-on region was predicted at higher excitation frequencies, hence the lock-on range is slightly shifted to the right. Within the lock-on region, the current computational result shows an over-prediction of approximately 10% of the start and end of the lock-on region as well as the entire range of lock-on. Fig. 5 provides a comparison of the mean longitudinal force coefficient and root-mean-square of the transverse coefficient to experimental data also by Tanida et al. (1973). It is apparent that in the lock-on state, there is a substantial amplification of both the longitudinal and the transverse forces on the cylinder. Fig. 5 also shows a reasonable agreement is achieved for both force coefficients, although xC is noticeably
over predicting the experimental data at higher
0.0
1.0
2.0
3.0
0 0.5 1 1.5 2 2.5 3f e /f s0
f e /f s
Current computations
Tanida et al. (1973)
U
f e
+A
Fig.4 Comparison of lock-on region for inline
forced oscillations, 80Re and 14.0DA .
0.0
0.5
1.0
1.5
2.0
0 0.5 1 1.5 2 2.5 3f e /f s0
0.0
0.5
1.0
1.5
2.0
- Current computations
- Tanida et al. (1973)
- Current computations
- Tanida et al. (1973)
U
f e
+A
Fig.5 Mean longitudinal force coefficient and root-
mean-square of transverse force coefficient compared with experimental data for inline oscillations, 80Re and 14.0DA .
Engineering Applications of Computational Fluid Mechanics Vol. 5, No. 4 (2011)
584
0se ff . The discrepancy could be due to the well
known fact that it is difficult to measure the longitudinal force, which is significantly less than the transverse force, especially for low Reynolds number flows.
3.3 “P+S” and symmetric vortex-shedding modes
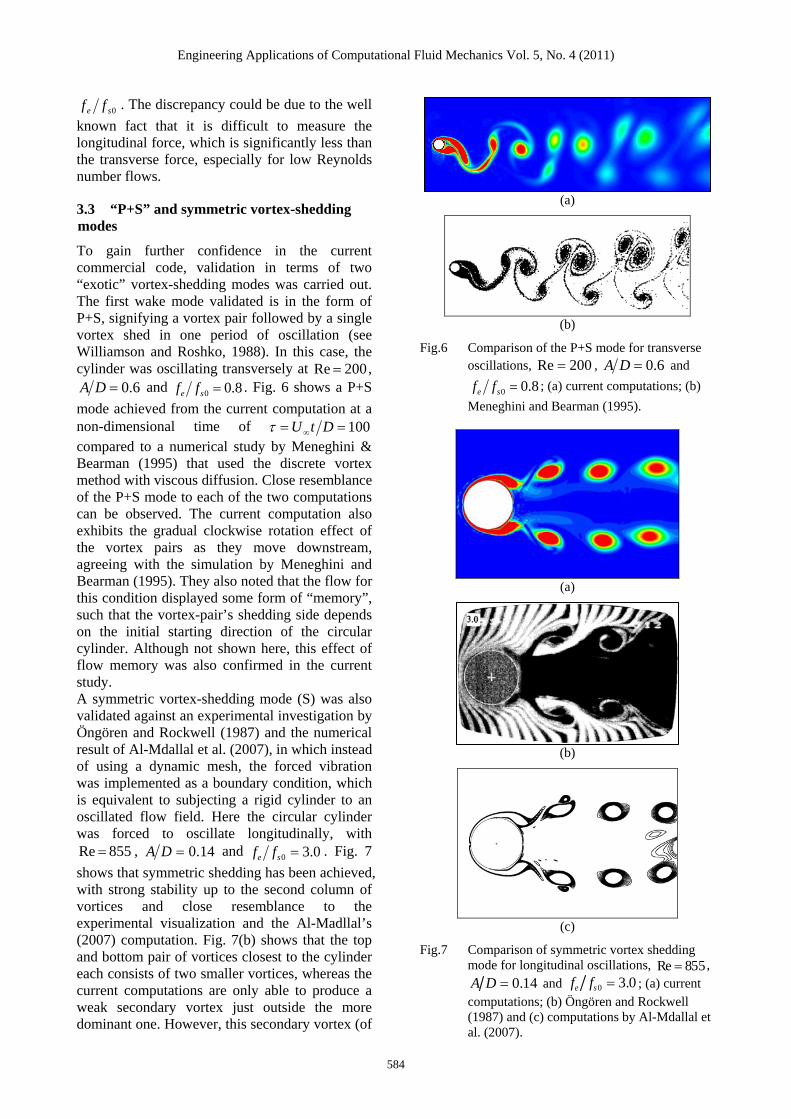
To gain further confidence in the current commercial code, validation in terms of two “exotic” vortex-shedding modes was carried out. The first wake mode validated is in the form of P+S, signifying a vortex pair followed by a single vortex shed in one period of oscillation (see Williamson and Roshko, 1988). In this case, the cylinder was oscillating transversely at 200Re ,
6.0DA and 8.00 se ff . Fig. 6 shows a P+S
mode achieved from the current computation at a non-dimensional time of 100 DtU compared to a numerical study by Meneghini & Bearman (1995) that used the discrete vortex method with viscous diffusion. Close resemblance of the P+S mode to each of the two computations can be observed. The current computation also exhibits the gradual clockwise rotation effect of the vortex pairs as they move downstream, agreeing with the simulation by Meneghini and Bearman (1995). They also noted that the flow for this condition displayed some form of “memory”, such that the vortex-pair’s shedding side depends on the initial starting direction of the circular cylinder. Although not shown here, this effect of flow memory was also confirmed in the current study. A symmetric vortex-shedding mode (S) was also validated against an experimental investigation by Öngören and Rockwell (1987) and the numerical result of Al-Mdallal et al. (2007), in which instead of using a dynamic mesh, the forced vibration was implemented as a boundary condition, which is equivalent to subjecting a rigid cylinder to an oscillated flow field. Here the circular cylinder was forced to oscillate longitudinally, with
855Re , 14.0DA and 0.30 se ff . Fig. 7
shows that symmetric shedding has been achieved, with strong stability up to the second column of vortices and close resemblance to the experimental visualization and the Al-Madllal’s (2007) computation. Fig. 7(b) shows that the top and bottom pair of vortices closest to the cylinder each consists of two smaller vortices, whereas the current computations are only able to produce a weak secondary vortex just outside the more dominant one. However, this secondary vortex (of
(a)
(b)
Fig.6 Comparison of the P+S mode for transverse oscillations, 200Re , 6.0DA and
8.00 se ff ; (a) current computations; (b)
Meneghini and Bearman (1995).
(a)
(b)
(c)
Fig.7 Comparison of symmetric vortex shedding mode for longitudinal oscillations, 855Re , 14.0DA and 0.30 se ff ; (a) current computations; (b) Öngören and Rockwell (1987) and (c) computations by Al-Mdallal et al. (2007).
Engineering Applications of Computational Fluid Mechanics Vol. 5, No. 4 (2011)
585
the binary vortex pair) was clearly shed and was evident during the cylinder’s left-to-right motion, but it quickly loses strength as it merges with the dominant vortex. The less apparent secondary vortex from the current computation may be due to the fact that turbulence was not taken into account.
4. RESULTS AND DISCUSSION
In the following section, detailed results of the lock-on range identification and analysis of the associated fluctuating forces for forced oscillations at 60 will be presented. Further, numerical experiments to investigate the effect of both increasing amplitude ratios and Reynolds number on the wake of 60 oscillations are also reported.
4.1 Lock-on and fluctuating forces at 60 , 80Re and 14.0DA .
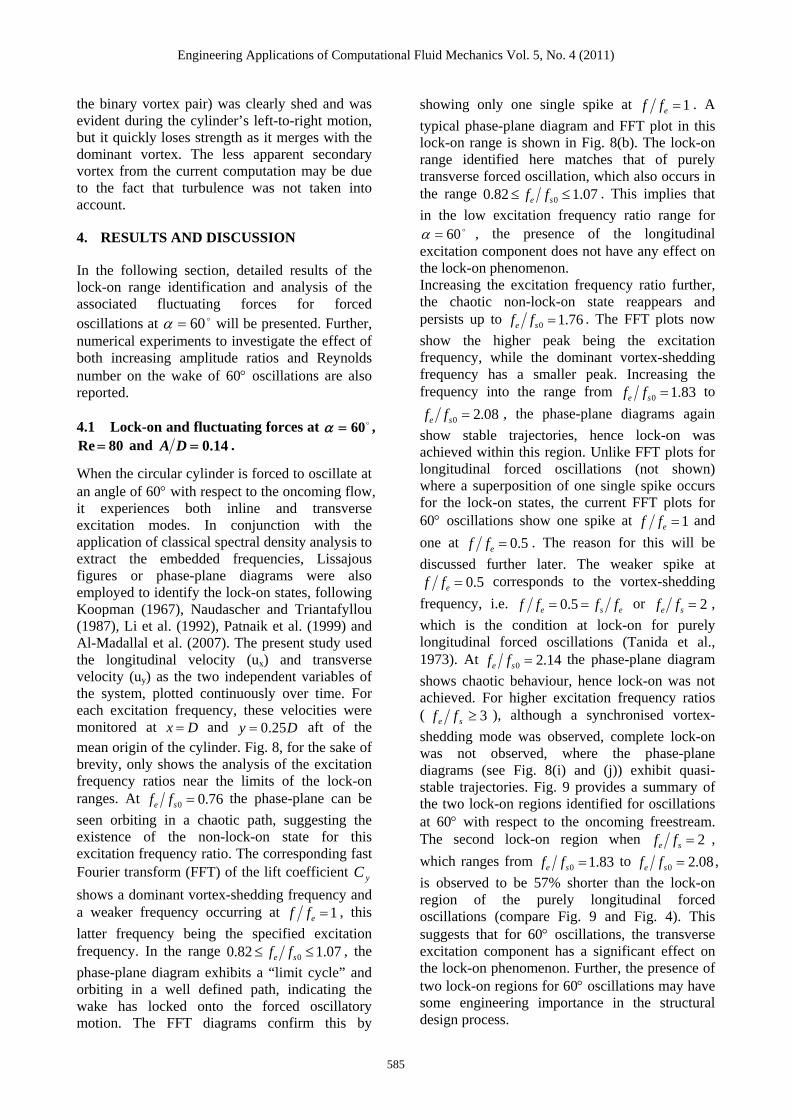
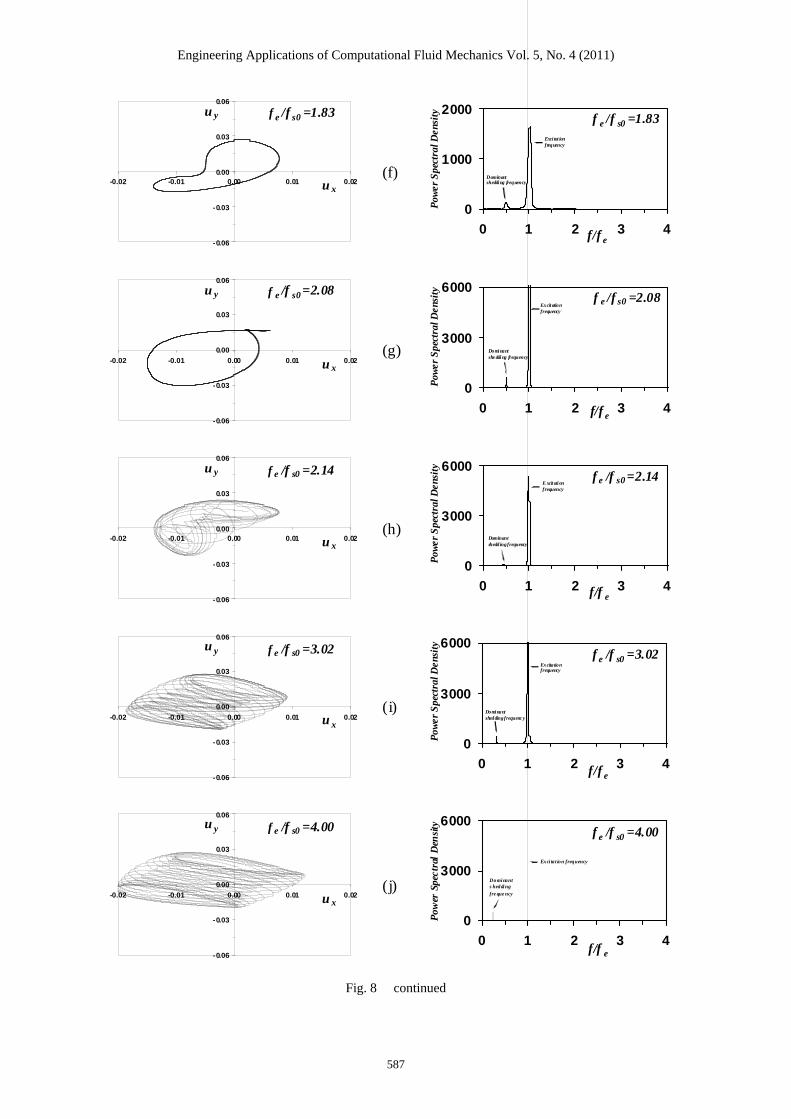
When the circular cylinder is forced to oscillate at an angle of 60 with respect to the oncoming flow, it experiences both inline and transverse excitation modes. In conjunction with the application of classical spectral density analysis to extract the embedded frequencies, Lissajous figures or phase-plane diagrams were also employed to identify the lock-on states, following Koopman (1967), Naudascher and Triantafyllou (1987), Li et al. (1992), Patnaik et al. (1999) and Al-Madallal et al. (2007). The present study used the longitudinal velocity (ux) and transverse velocity (uy) as the two independent variables of the system, plotted continuously over time. For each excitation frequency, these velocities were monitored at Dx and Dy 25.0 aft of the mean origin of the cylinder. Fig. 8, for the sake of brevity, only shows the analysis of the excitation frequency ratios near the limits of the lock-on ranges. At 76.00 se ff the phase-plane can be
seen orbiting in a chaotic path, suggesting the existence of the non-lock-on state for this excitation frequency ratio. The corresponding fast Fourier transform (FFT) of the lift coefficient yC
shows a dominant vortex-shedding frequency and a weaker frequency occurring at 1eff , this
latter frequency being the specified excitation frequency. In the range 07.182.0 0 se ff , the
phase-plane diagram exhibits a “limit cycle” and orbiting in a well defined path, indicating the wake has locked onto the forced oscillatory motion. The FFT diagrams confirm this by
showing only one single spike at 1eff . A
typical phase-plane diagram and FFT plot in this lock-on range is shown in Fig. 8(b). The lock-on range identified here matches that of purely transverse forced oscillation, which also occurs in the range 07.182.0 0 se ff . This implies that
in the low excitation frequency ratio range for 60 , the presence of the longitudinal
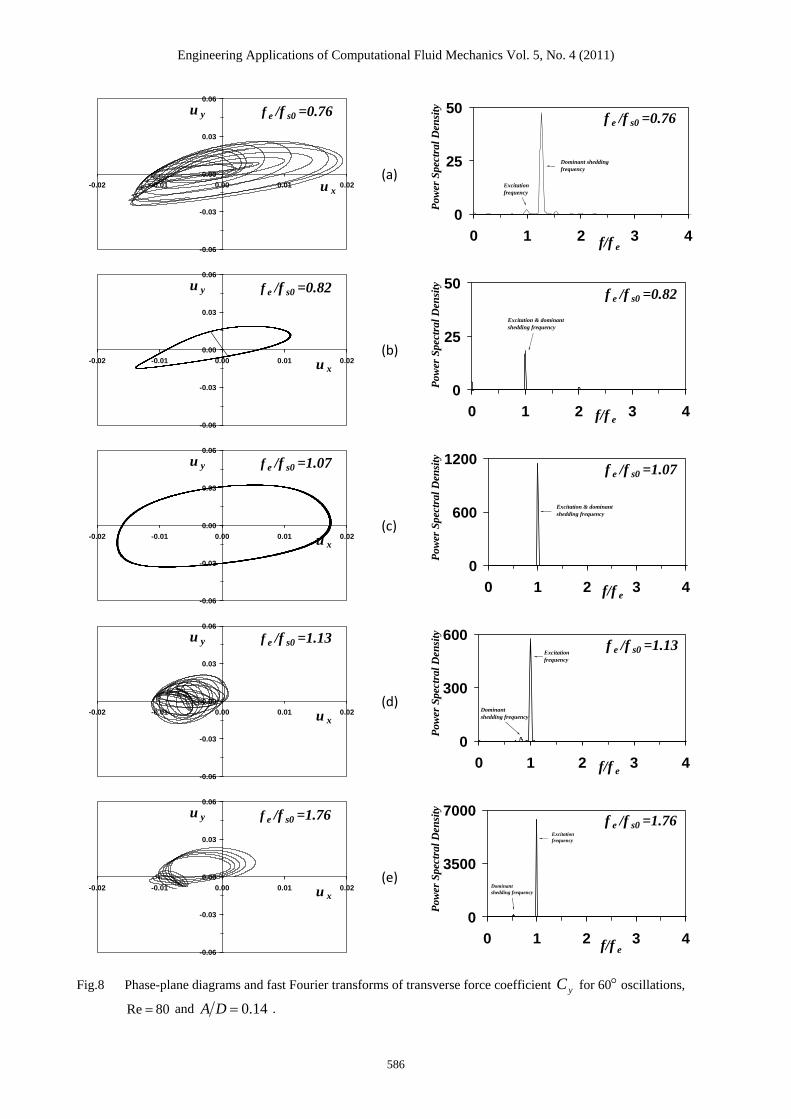
excitation component does not have any effect on the lock-on phenomenon. Increasing the excitation frequency ratio further, the chaotic non-lock-on state reappears and persists up to 76.10 se ff . The FFT plots now
show the higher peak being the excitation frequency, while the dominant vortex-shedding frequency has a smaller peak. Increasing the frequency into the range from 83.10 se ff to
08.20 se ff , the phase-plane diagrams again
show stable trajectories, hence lock-on was achieved within this region. Unlike FFT plots for longitudinal forced oscillations (not shown) where a superposition of one single spike occurs for the lock-on states, the current FFT plots for 60 oscillations show one spike at 1eff and
one at 5.0eff . The reason for this will be
discussed further later. The weaker spike at 5.0eff corresponds to the vortex-shedding
frequency, i.e. ese ffff 5.0 or 2se ff ,
which is the condition at lock-on for purely longitudinal forced oscillations (Tanida et al., 1973). At 14.20 se ff the phase-plane diagram
shows chaotic behaviour, hence lock-on was not achieved. For higher excitation frequency ratios ( 3se ff ), although a synchronised vortex-
shedding mode was observed, complete lock-on was not observed, where the phase-plane diagrams (see Fig. 8(i) and (j)) exhibit quasi-stable trajectories. Fig. 9 provides a summary of the two lock-on regions identified for oscillations at 60 with respect to the oncoming freestream. The second lock-on region when 2se ff ,
which ranges from 83.10 se ff to 08.20 se ff ,
is observed to be 57% shorter than the lock-on region of the purely longitudinal forced oscillations (compare Fig. 9 and Fig. 4). This suggests that for 60 oscillations, the transverse excitation component has a significant effect on the lock-on phenomenon. Further, the presence of two lock-on regions for 60 oscillations may have some engineering importance in the structural design process.
Engineering Applications of Computational Fluid Mechanics Vol. 5, No. 4 (2011)
586
(a)
(b)
(c)
(d)
(e)
-0.06
-0.03
0.00
0.03
0.06
-0.02 -0.01 0.00 0.01 0.02 u x
u y f e /f s0 =0.76
0
25
50
0 1 2 3 4 f/f e
Pow
er S
pect
ral D
ensi
ty
f e /f s0 =0.76
Excitation frequency
Dominant shedding frequency
-0.06
-0.03
0.00
0.03
0.06
-0.02 -0.01 0.00 0.01 0.02 u x
u y f e /f s0 =0.82
0
25
50
0 1 2 3 4 f/f e
Pow
er S
pect
ral D
ensi
ty
f e /f s0 =0.82
Excitation & dominant shedding frequency
-0.06
-0.03
0.00
0.03
0.06
-0.02 -0.01 0.00 0.01 0.02 u x
u y f e /f s0 =1.07
0
600
1200
0 1 2 3 4 f/f e
Pow
er S
pect
ral D
ensi
ty
f e /f s0 =1.07
Excitation & dominant shedding frequency
-0.06
-0.03
0.00
0.03
0.06
-0.02 -0.01 0.00 0.01 0.02 u x
u y f e /f s0 =1.13
0
300
600
0 1 2 3 4 f/f e
Pow
er S
pect
ral D
ensi
ty
f e /f s0 =1.13 Excitation frequency
Dominant shedding frequency
-0.06
-0.03
0.00
0.03
0.06
-0.02 -0.01 0.00 0.01 0.02 u x
u y f e /f s0 =1.76
0
3500
7000
0 1 2 3 4 f/f e
Pow
er S
pect
ral D
ensi
ty
f e /f s0 =1.76 Excitation frequency
Dominant shedding frequency
Fig.8 Phase-plane diagrams and fast Fourier transforms of transverse force coefficient yC for 60 oscillations,
80Re and 14.0DA .
Engineering Applications of Computational Fluid Mechanics Vol. 5, No. 4 (2011)
587
-0.06
-0.03
0.00
0.03
0.06
-0.02 -0.01 0.00 0.01 0.02 u x
u y f e /f s0 =1.83
(f)
0
1000
2000
0 1 2 3 4 f/f e
Pow
er S
pect
ral D
ensi
ty f e /f s0 =1.83 Exci tat ion frequency
Dominant shedding frequency
-0.06
-0.03
0.00
0.03
0.06
-0.02 -0.01 0.00 0.01 0.02 u x
u y f e /f s0 =2.08
(g)
0
3000
6000
0 1 2 3 4 f/f e
Pow
er S
pect
ral D
ensi
ty f e /f s0 =2.08 Excitation frequency
Dominant she dding frequency
-0.06
-0.03
0.00
0.03
0.06
-0.02 -0.01 0.00 0.01 0.02 u x
u y f e /f s0 =2.14
(h)
0
3000
6000
0 1 2 3 4 f/f e
Pow
er S
pect
ral D
ensi
ty
f e /f s0 =2.14 E xcitation frequency
Dominant shedding frequency
-0.06
-0.03
0.00
0.03
0.06
-0.02 -0.01 0.00 0.01 0.02 u x
u y f e /f s0 =3.02
(i)
0
3000
6000
0 1 2 3 4 f/f e
Pow
er S
pect
ral D
ensi
ty
f e /f s0 =3.02 Excitation frequency
Dominant shedding frequenc y
-0.06
-0.03
0.00
0.03
0.06
-0.02 -0.01 0.00 0.01 0.02 u x
u y f e /f s0 =4.00
(j)
0
3000
6000
0 1 2 3 4 f/f e
Pow
er S
pect
ral
Den
sity f e /f s0 =4.00
Exci tat ion frequency
Dominant s hedding
fre que ncy
Fig. 8 continued
Engineering Applications of Computational Fluid Mechanics Vol. 5, No. 4 (2011)
588
0.0
1.0
2.0
3.0
0 1 2 3 f e /f s0
f e /f s
(t)
x(t)
y(t)
=60U
f e
+A
Lock-on
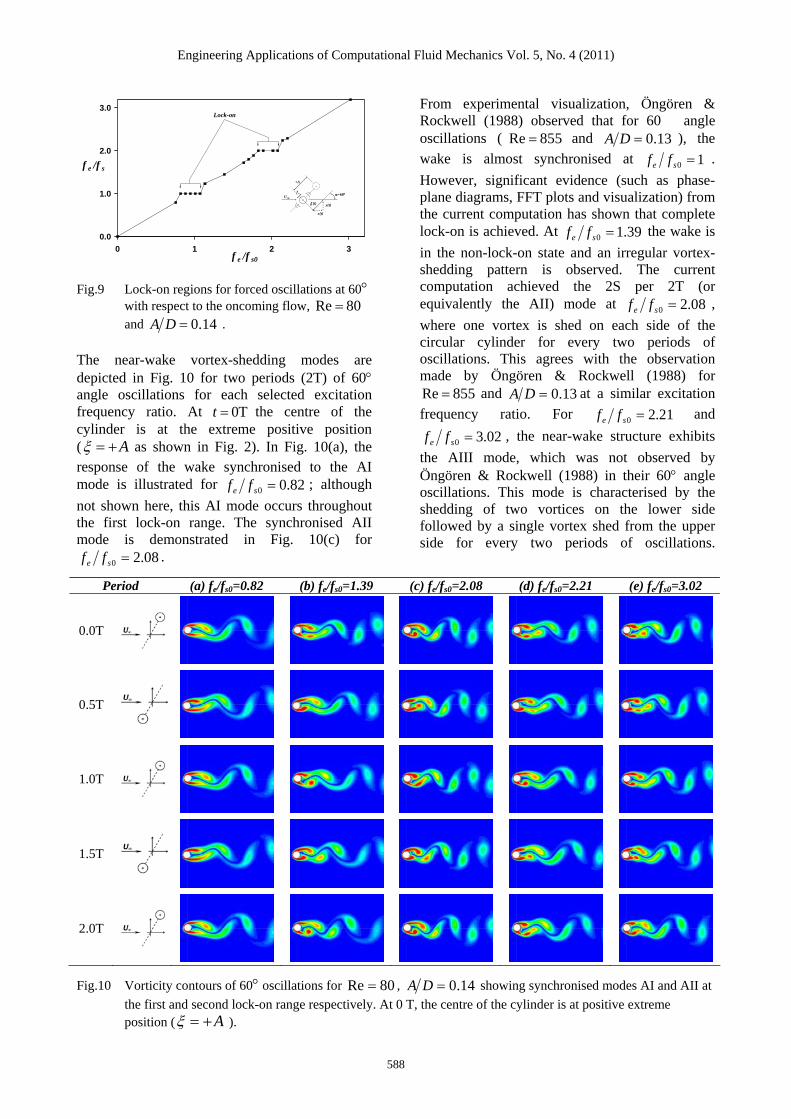
Fig.9 Lock-on regions for forced oscillations at 60 with respect to the oncoming flow, 80Re and 14.0DA .
The near-wake vortex-shedding modes are depicted in Fig. 10 for two periods (2T) of 60 angle oscillations for each selected excitation frequency ratio. At T0t the centre of the cylinder is at the extreme positive position ( A as shown in Fig. 2). In Fig. 10(a), the response of the wake synchronised to the AI mode is illustrated for 82.00 se ff ; although
not shown here, this AI mode occurs throughout the first lock-on range. The synchronised AII mode is demonstrated in Fig. 10(c) for
08.20 se ff .
From experimental visualization, Öngören & Rockwell (1988) observed that for 60 angle oscillations ( 855Re and 13.0DA ), the
wake is almost synchronised at 10 se ff .
However, significant evidence (such as phase-plane diagrams, FFT plots and visualization) from the current computation has shown that complete lock-on is achieved. At 39.10 se ff the wake is
in the non-lock-on state and an irregular vortex-shedding pattern is observed. The current computation achieved the 2S per 2T (or equivalently the AII) mode at 08.20 se ff ,
where one vortex is shed on each side of the circular cylinder for every two periods of oscillations. This agrees with the observation made by Öngören & Rockwell (1988) for
855Re and 13.0DA at a similar excitation
frequency ratio. For 21.20 se ff and
02.30 se ff , the near-wake structure exhibits
the AIII mode, which was not observed by Öngören & Rockwell (1988) in their 60 angle oscillations. This mode is characterised by the shedding of two vortices on the lower side followed by a single vortex shed from the upper side for every two periods of oscillations.
Period (a) fe/fs0=0.82 (b) fe/fs0=1.39 (c) fe/fs0=2.08 (d) fe/fs0=2.21 (e) fe/fs0=3.02
0.0T
0.5T
1.0T
1.5T
2.0T
Fig.10 Vorticity contours of 60 oscillations for 80Re , 14.0DA showing synchronised modes AI and AII at
the first and second lock-on range respectively. At 0 T, the centre of the cylinder is at positive extreme position ( A ).
Engineering Applications of Computational Fluid Mechanics Vol. 5, No. 4 (2010)
589
Referring to the sequence of Fig. 10(d) with 21.20 se ff and concentrating on the lower side
of the cylinder only, at 0T the lower side of the cylinder has just shed 2 vortices. At 0.5T the centre of the cylinder is now at the negative extreme position ( A ) and a small vortex is accumulated. As the cylinder moves back up to the maximum extreme position ( A ), the sudden motion of the cylinder moving away from the negative extreme position causes a separation of this newly accumulated vortex and hence it is forcibly shed from the lower side at 1.0T. The cylinder then starts to move back down to the negative extreme position ( A ), and the relatively downward but forward direction again causes a shear layer between the freestream and the cylinder to develop another new vortex on the lower side (closest to the cylinder) at 1.5T. At 2.0T the newly formed vortex and the preceding vortex from the lower side are shed, resulting in a pair of vortices travelling downstream.
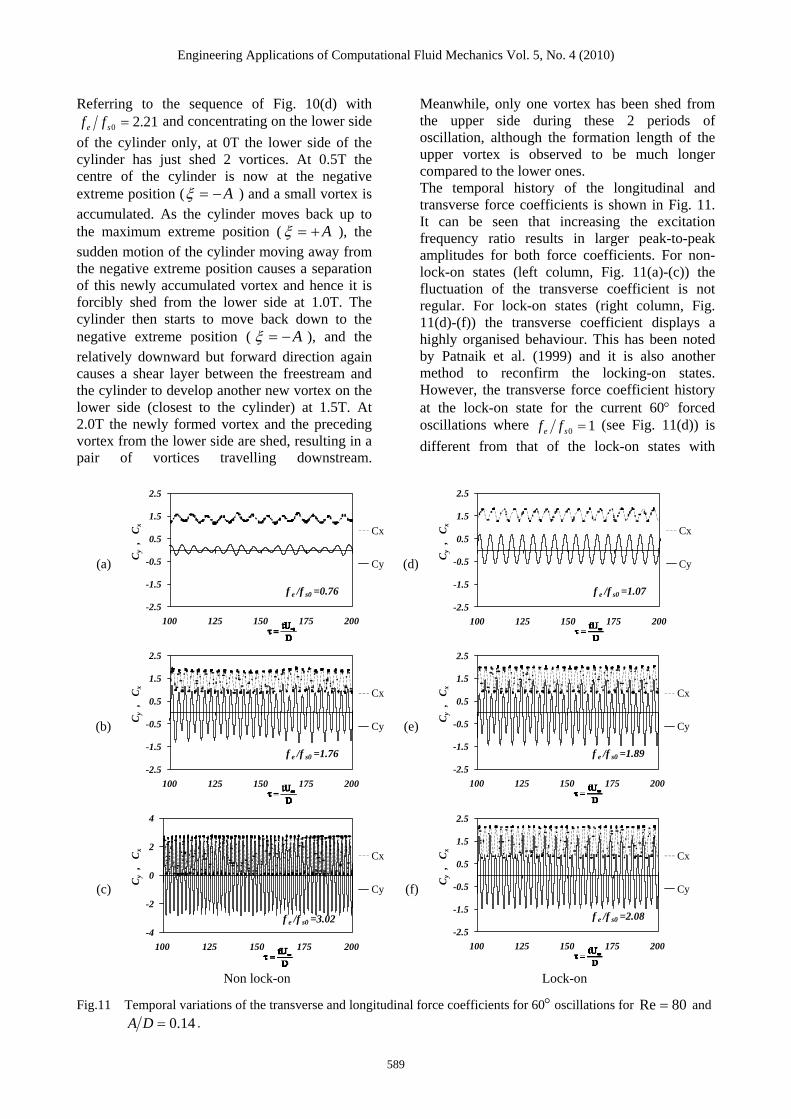
Meanwhile, only one vortex has been shed from the upper side during these 2 periods of oscillation, although the formation length of the upper vortex is observed to be much longer compared to the lower ones. The temporal history of the longitudinal and transverse force coefficients is shown in Fig. 11. It can be seen that increasing the excitation frequency ratio results in larger peak-to-peak amplitudes for both force coefficients. For non-lock-on states (left column, Fig. 11(a)-(c)) the fluctuation of the transverse coefficient is not regular. For lock-on states (right column, Fig. 11(d)-(f)) the transverse coefficient displays a highly organised behaviour. This has been noted by Patnaik et al. (1999) and it is also another method to reconfirm the locking-on states. However, the transverse force coefficient history at the lock-on state for the current 60 forced oscillations where 10 se ff (see Fig. 11(d)) is
different from that of the lock-on states with
(a)
-2.5
-1.5
-0.5
0.5
1.5
2.5
100 125 150 175 200
Cy
,
Cx
Cx
Cy
f e /f s0 =0.76
(d)
-2.5
-1.5
-0.5
0.5
1.5
2.5
100 125 150 175 200
Cy
,
Cx
Cx
Cy
f e /f s0 =1.07
(b)
-2.5
-1.5
-0.5
0.5
1.5
2.5
100 125 150 175 200
Cy
,
Cx
Cx
Cy
f e /f s0 =1.76
(e)
-2.5
-1.5
-0.5
0.5
1.5
2.5
100 125 150 175 200
Cy
,
Cx
Cx
Cy
f e /f s0 =1.89
(c)
-4
-2
0
2
4
100 125 150 175 200
Cy
,
Cx
Cx
Cy
f e /f s0 =3.02
(f)
-2.5
-1.5
-0.5
0.5
1.5
2.5
100 125 150 175 200
Cy
,
Cx
Cx
Cy
f e /f s0 =2.08
Non lock-on Lock-on
Fig.11 Temporal variations of the transverse and longitudinal force coefficients for 60 oscillations for 80Re and
14.0DA .
Engineering Applications of Computational Fluid Mechanics Vol. 5, No. 4 (2010)
590
20 se ff (see Fig. 11(e) & (f)). In Fig. 11(e) &
(f) the transverse force coefficient displays a periodic variation with a high magnitude crest followed by a smaller magnitude crest. The smaller magnitude crest is due to the cylinder’s motion on-course to its extreme displacement amplitude ( A ). Since the oscillations are at
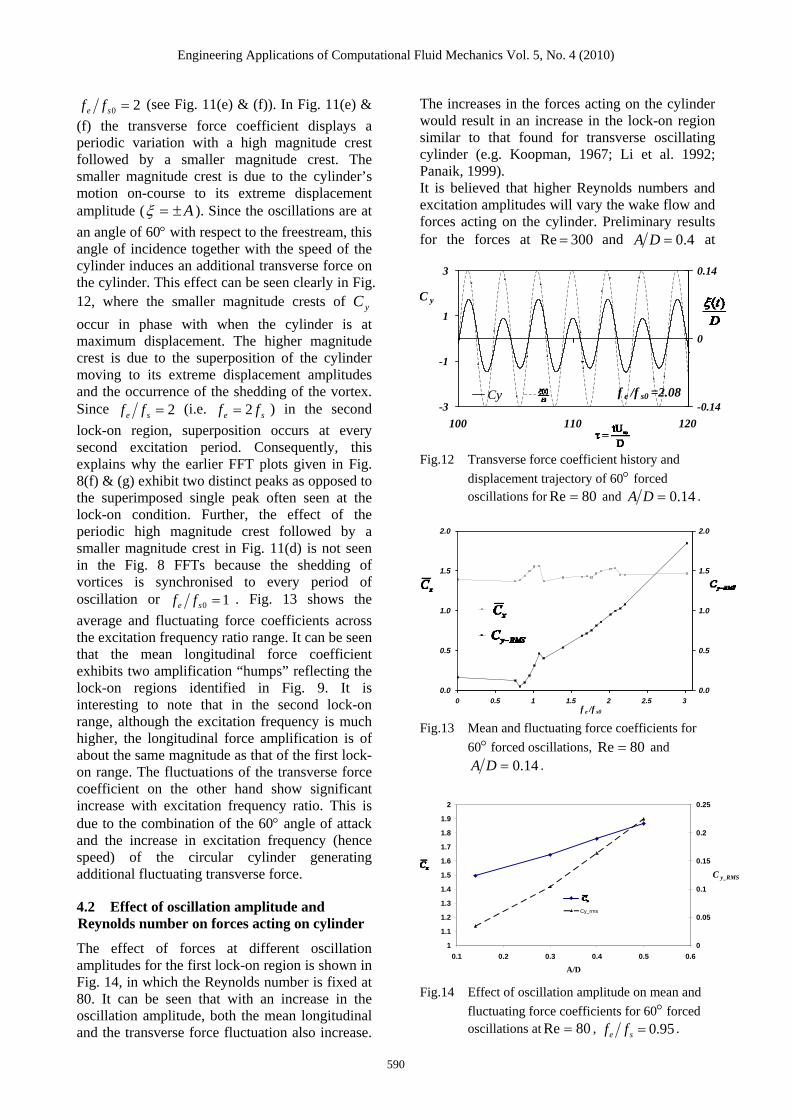
an angle of 60 with respect to the freestream, this angle of incidence together with the speed of the cylinder induces an additional transverse force on the cylinder. This effect can be seen clearly in Fig. 12, where the smaller magnitude crests of yC
occur in phase with when the cylinder is at maximum displacement. The higher magnitude crest is due to the superposition of the cylinder moving to its extreme displacement amplitudes and the occurrence of the shedding of the vortex. Since 2se ff (i.e. se ff 2 ) in the second
lock-on region, superposition occurs at every second excitation period. Consequently, this explains why the earlier FFT plots given in Fig. 8(f) & (g) exhibit two distinct peaks as opposed to the superimposed single peak often seen at the lock-on condition. Further, the effect of the periodic high magnitude crest followed by a smaller magnitude crest in Fig. 11(d) is not seen in the Fig. 8 FFTs because the shedding of vortices is synchronised to every period of oscillation or 10 se ff . Fig. 13 shows the
average and fluctuating force coefficients across the excitation frequency ratio range. It can be seen that the mean longitudinal force coefficient exhibits two amplification “humps” reflecting the lock-on regions identified in Fig. 9. It is interesting to note that in the second lock-on range, although the excitation frequency is much higher, the longitudinal force amplification is of about the same magnitude as that of the first lock-on range. The fluctuations of the transverse force coefficient on the other hand show significant increase with excitation frequency ratio. This is due to the combination of the 60 angle of attack and the increase in excitation frequency (hence speed) of the circular cylinder generating additional fluctuating transverse force.
4.2 Effect of oscillation amplitude and Reynolds number on forces acting on cylinder
The effect of forces at different oscillation amplitudes for the first lock-on region is shown in Fig. 14, in which the Reynolds number is fixed at 80. It can be seen that with an increase in the oscillation amplitude, both the mean longitudinal and the transverse force fluctuation also increase.
The increases in the forces acting on the cylinder would result in an increase in the lock-on region similar to that found for transverse oscillating cylinder (e.g. Koopman, 1967; Li et al. 1992; Panaik, 1999). It is believed that higher Reynolds numbers and excitation amplitudes will vary the wake flow and forces acting on the cylinder. Preliminary results for the forces at 300Re and 4.0DA at
-3
-1
1
3
100 110 120
C y
-0.14
0
0.14
Cy f e /f s0 =2.08
Fig.12 Transverse force coefficient history and
displacement trajectory of 60 forced oscillations for 80Re and 14.0DA .
0.0
0.5
1.0
1.5
2.0
0 0.5 1 1.5 2 2.5 3 f e /f s0
0.0
0.5
1.0
1.5
2.0
Fig.13 Mean and fluctuating force coefficients for
60 forced oscillations, 80Re and
14.0DA .
1
1.1
1.2
1.3
1.4
1.5
1.6
1.7
1.8
1.9
2
0.1 0.2 0.3 0.4 0.5 0.6
A/D
0
0.05
0.1
0.15
0.2
0.25
C y_RMS
Cy_rms
Fig.14 Effect of oscillation amplitude on mean and
fluctuating force coefficients for 60 forced oscillations at 80Re , 95.0se ff .
Engineering Applications of Computational Fluid Mechanics Vol. 5, No. 4 (2011)
591
0
0.5
1
1.5
2
2.5
0 0.5 1 1.5 2 2.5
f e /f s0
0
0.5
1
1.5
2
2.5
3
3.5
4
4.5
5
C y_RMS
Cy_RMS
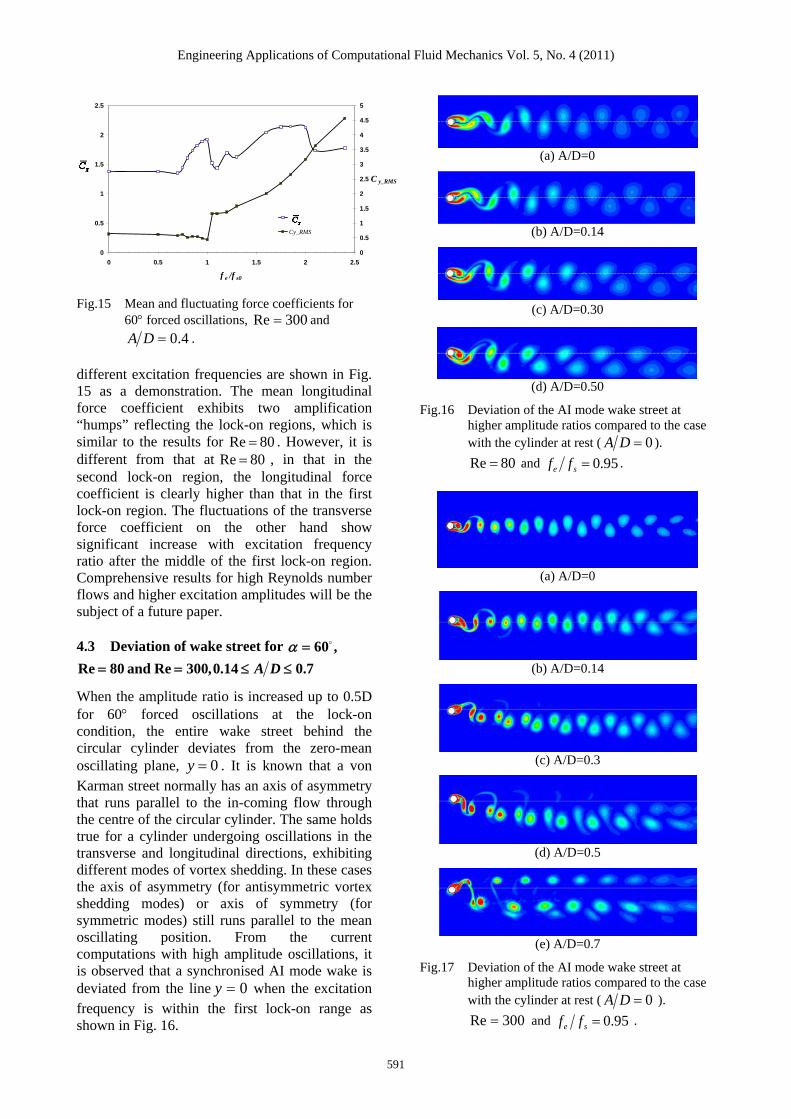
Fig.15 Mean and fluctuating force coefficients for
60 forced oscillations, 300Re and
4.0DA .
different excitation frequencies are shown in Fig. 15 as a demonstration. The mean longitudinal force coefficient exhibits two amplification “humps” reflecting the lock-on regions, which is similar to the results for 80Re . However, it is different from that at 80Re , in that in the second lock-on region, the longitudinal force coefficient is clearly higher than that in the first lock-on region. The fluctuations of the transverse force coefficient on the other hand show significant increase with excitation frequency ratio after the middle of the first lock-on region. Comprehensive results for high Reynolds number flows and higher excitation amplitudes will be the subject of a future paper.
4.3 Deviation of wake street for ,60
7.014.0,300Reand80Re DA
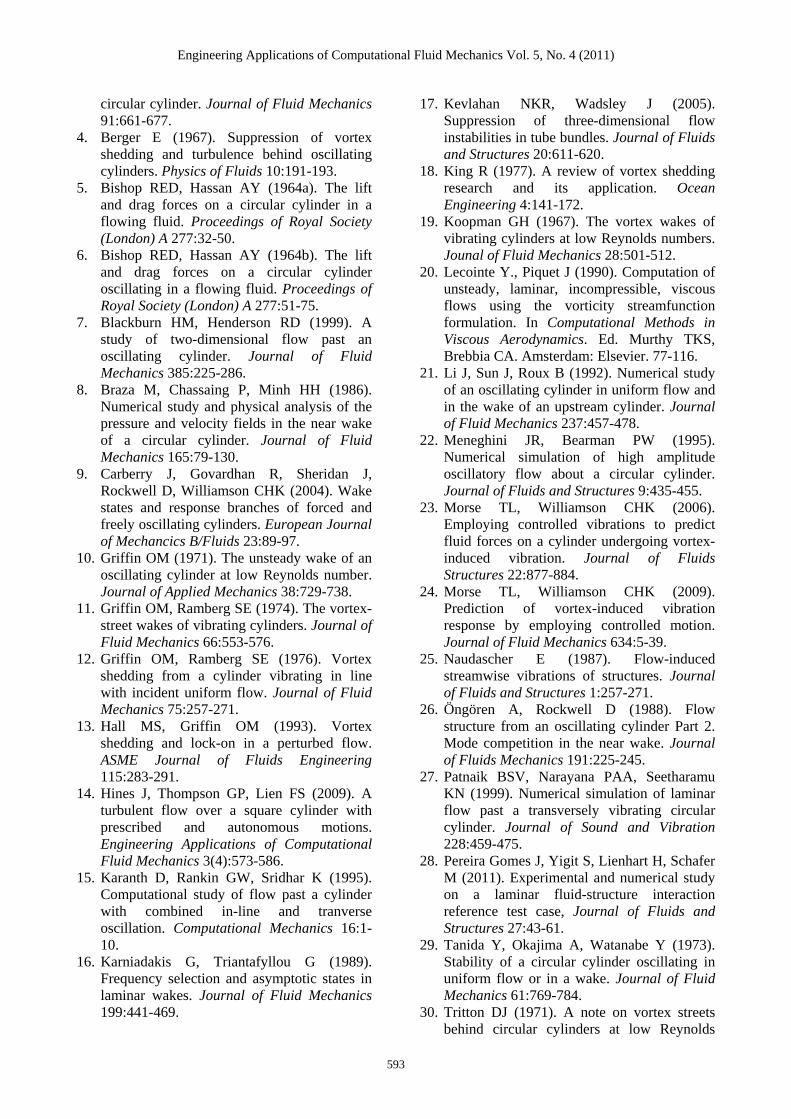
When the amplitude ratio is increased up to 0.5D for 60 forced oscillations at the lock-on condition, the entire wake street behind the circular cylinder deviates from the zero-mean oscillating plane, 0y . It is known that a von Karman street normally has an axis of asymmetry that runs parallel to the in-coming flow through the centre of the circular cylinder. The same holds true for a cylinder undergoing oscillations in the transverse and longitudinal directions, exhibiting different modes of vortex shedding. In these cases the axis of asymmetry (for antisymmetric vortex shedding modes) or axis of symmetry (for symmetric modes) still runs parallel to the mean oscillating position. From the current computations with high amplitude oscillations, it is observed that a synchronised AI mode wake is deviated from the line 0y when the excitation frequency is within the first lock-on range as shown in Fig. 16.
(a) A/D=0
(b) A/D=0.14
(c) A/D=0.30
(d) A/D=0.50
Fig.16 Deviation of the AI mode wake street at higher amplitude ratios compared to the case with the cylinder at rest ( 0DA ).
80Re and 95.0se ff .
(a) A/D=0
(b) A/D=0.14
(c) A/D=0.3
(d) A/D=0.5
(e) A/D=0.7
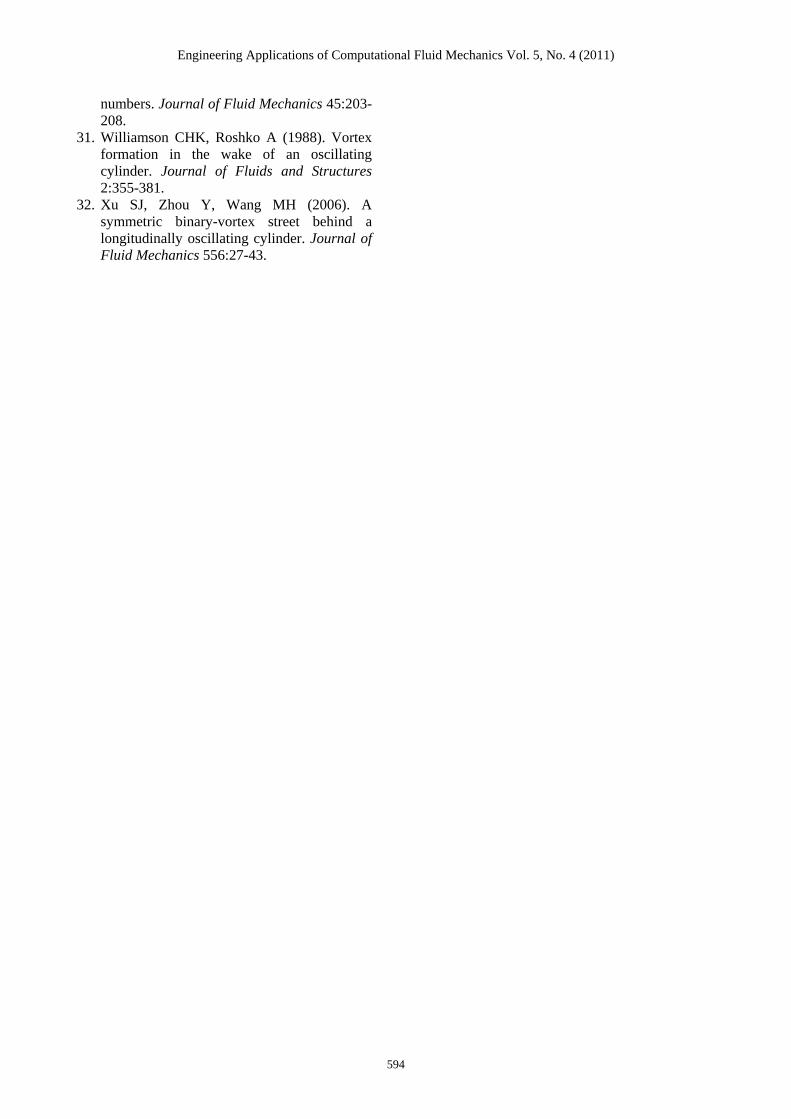
Fig.17 Deviation of the AI mode wake street at higher amplitude ratios compared to the case with the cylinder at rest ( 0DA ).
300Re and 95.0se ff .

Engineering Applications of Computational Fluid Mechanics Vol. 5, No. 4 (2011)
592
With an increase in Reynolds number to 300, the deviation from the centre line increases, as shown in Fig. 17 for the different excitation amplitudes within the first lock-on range. It can be seen that at 5.0DA , the synchronised AI mode wake is deviated with a similar trend to those for 80Re but more severely. At the highest oscillation amplitude, 7.0DA , the wake is no longer able to maintain the AI mode and the wake of the P+S mode is clearly observed (see Fig. 16d). The direction of deviation depends on whether the angle of oscillation is positive or negative. This effect possibly has some engineering implications in flow control situations where the vortices can be induced to shed away from a trailing structure.
5. CONCLUSIONS
Laminar incompressible flow past a circular cylinder forced to oscillate longitudinally, transversely and at an angle of 60 to the uniform freestream was simulated using the dynamic mesh method. This feature presents a powerful approach for simulating a moving body in the presence of other structures. Extensive validation of the simulation results employing “physical” motion both in the longitudinal and transverse directions in turn yielded good agreement with the available experimental and numerical investigations. Different near-wake vortex-shedding modes previously identified in various past studies were also observed at the corresponding flow and excitation conditions. Typical characteristics at lock-on, such as
10 se ff for transverse oscillations and
20 se ff for longitudinal oscillations, as well
as force amplifications, were successfully predicted. When the circular cylinder was forced to oscillate at an angle of 60 to the uniform freestream, two lock-on regions were identified. This was confirmed with various analysis techniques such as phase-plane diagrams, FFT plots, time-history behaviour of the transverse force coefficient, and the locations of average longitudinal force coefficient amplifications. The first lock-on region occurred within the range
07.182.0 0 se ff , while the second lock-on
state appeared in the range 08.283.1 0 se ff .
The first lock-on region is the same as that when the oscillations are in the purely transverse direction, suggesting that the longitudinal excitation component in the 60 angle oscillations has minimal effect on the lock-on phenomenon.
In contrast, the second lock-on range was observed to be 57% shorter compared to the wholly longitudinal oscillations. Vortex-shedding modes AI and AII were observed at the first and second synchronised states respectively, agreeing with the observation made by an experimental study with the same oscillation configuration but with different Reynolds number and amplitude ratio. The AIII vortex-shedding mode was also observed in the current flow conditions at higher excitation frequency ratios. At 80Re , the amplification of the longitudinal force coefficient was of about the same magnitude for the first and second lock-on states, whereas the transverse force coefficient increased substantially with increasing excitation frequency ratio. At
300Re and 4.0DA , the longitudinal force coefficient is higher for the second lock-on region than that for the first lock-on region. An increase in the amplitude of oscillations leads to the wake street consistently displaying a deviation effect from the centreline, and the deviation increases with the increase in Reynolds number. When 7.0DA and 300Re , the deviated wake of the AI mode transfers to the P+S mode. The direction of deviation depends on the direction of motion of the oscillating cylinder.
ACKNOWLEDGEMENT
This work was supported through a collaborative research agreement between the Maritime Platforms Division of the Defence Science & Technology Organisation (Australia) and the School of Aerospace, Mechanical and Manufacturing Engineering at RMIT University, and by an Australian Postgraduate Award (APA) from the Australian Government.
REFERENCES
1. Al-Mdallal QM, Lawrence KP, Kocabiyik S (2007). Forced streamwise oscillations of a circular cylinder: Locked-on modes and resulting fluid forces. Journal of Fluids and Structures 23:681-701.
2. Anagnostopoulos P (2000). Numerical study of the flow past a cylinder excited transversely to the incident stream. Part 1: Lock-in zone, hydrodynamic forces and wake geometry. Journal of Fluids and Structures 14:819-851.
3. Bearman PW, Currie IG (1979). Pressure fluctuation measurements on an oscillating
Engineering Applications of Computational Fluid Mechanics Vol. 5, No. 4 (2011)
593
circular cylinder. Journal of Fluid Mechanics 91:661-677.
4. Berger E (1967). Suppression of vortex shedding and turbulence behind oscillating cylinders. Physics of Fluids 10:191-193.
5. Bishop RED, Hassan AY (1964a). The lift and drag forces on a circular cylinder in a flowing fluid. Proceedings of Royal Society (London) A 277:32-50.
6. Bishop RED, Hassan AY (1964b). The lift and drag forces on a circular cylinder oscillating in a flowing fluid. Proceedings of Royal Society (London) A 277:51-75.
7. Blackburn HM, Henderson RD (1999). A study of two-dimensional flow past an oscillating cylinder. Journal of Fluid Mechanics 385:225-286.
8. Braza M, Chassaing P, Minh HH (1986). Numerical study and physical analysis of the pressure and velocity fields in the near wake of a circular cylinder. Journal of Fluid Mechanics 165:79-130.
9. Carberry J, Govardhan R, Sheridan J, Rockwell D, Williamson CHK (2004). Wake states and response branches of forced and freely oscillating cylinders. European Journal of Mechancics B/Fluids 23:89-97.
10. Griffin OM (1971). The unsteady wake of an oscillating cylinder at low Reynolds number. Journal of Applied Mechanics 38:729-738.
11. Griffin OM, Ramberg SE (1974). The vortex-street wakes of vibrating cylinders. Journal of Fluid Mechanics 66:553-576.
12. Griffin OM, Ramberg SE (1976). Vortex shedding from a cylinder vibrating in line with incident uniform flow. Journal of Fluid Mechanics 75:257-271.
13. Hall MS, Griffin OM (1993). Vortex shedding and lock-on in a perturbed flow. ASME Journal of Fluids Engineering 115:283-291.
14. Hines J, Thompson GP, Lien FS (2009). A turbulent flow over a square cylinder with prescribed and autonomous motions. Engineering Applications of Computational Fluid Mechanics 3(4):573-586.
15. Karanth D, Rankin GW, Sridhar K (1995). Computational study of flow past a cylinder with combined in-line and tranverse oscillation. Computational Mechanics 16:1-10.
16. Karniadakis G, Triantafyllou G (1989). Frequency selection and asymptotic states in laminar wakes. Journal of Fluid Mechanics 199:441-469.
17. Kevlahan NKR, Wadsley J (2005). Suppression of three-dimensional flow instabilities in tube bundles. Journal of Fluids and Structures 20:611-620.
18. King R (1977). A review of vortex shedding research and its application. Ocean Engineering 4:141-172.
19. Koopman GH (1967). The vortex wakes of vibrating cylinders at low Reynolds numbers. Jounal of Fluid Mechanics 28:501-512.
20. Lecointe Y., Piquet J (1990). Computation of unsteady, laminar, incompressible, viscous flows using the vorticity streamfunction formulation. In Computational Methods in Viscous Aerodynamics. Ed. Murthy TKS, Brebbia CA. Amsterdam: Elsevier. 77-116.
21. Li J, Sun J, Roux B (1992). Numerical study of an oscillating cylinder in uniform flow and in the wake of an upstream cylinder. Journal of Fluid Mechanics 237:457-478.
22. Meneghini JR, Bearman PW (1995). Numerical simulation of high amplitude oscillatory flow about a circular cylinder. Journal of Fluids and Structures 9:435-455.
23. Morse TL, Williamson CHK (2006). Employing controlled vibrations to predict fluid forces on a cylinder undergoing vortex-induced vibration. Journal of Fluids Structures 22:877-884.
24. Morse TL, Williamson CHK (2009). Prediction of vortex-induced vibration response by employing controlled motion. Journal of Fluid Mechanics 634:5-39.
25. Naudascher E (1987). Flow-induced streamwise vibrations of structures. Journal of Fluids and Structures 1:257-271.
26. Öngören A, Rockwell D (1988). Flow structure from an oscillating cylinder Part 2. Mode competition in the near wake. Journal of Fluids Mechanics 191:225-245.
27. Patnaik BSV, Narayana PAA, Seetharamu KN (1999). Numerical simulation of laminar flow past a transversely vibrating circular cylinder. Journal of Sound and Vibration 228:459-475.
28. Pereira Gomes J, Yigit S, Lienhart H, Schafer M (2011). Experimental and numerical study on a laminar fluid-structure interaction reference test case, Journal of Fluids and Structures 27:43-61.
29. Tanida Y, Okajima A, Watanabe Y (1973). Stability of a circular cylinder oscillating in uniform flow or in a wake. Journal of Fluid Mechanics 61:769-784.
30. Tritton DJ (1971). A note on vortex streets behind circular cylinders at low Reynolds
Engineering Applications of Computational Fluid Mechanics Vol. 5, No. 4 (2011)
594
numbers. Journal of Fluid Mechanics 45:203-208.
31. Williamson CHK, Roshko A (1988). Vortex formation in the wake of an oscillating cylinder. Journal of Fluids and Structures 2:355-381.
32. Xu SJ, Zhou Y, Wang MH (2006). A symmetric binary-vortex street behind a longitudinally oscillating cylinder. Journal of Fluid Mechanics 556:27-43.