
Numerical and Experimental Analysis of Monostable Mini- and Micro-Oscillators
9
Heat Transfer Engineering, 30(1–2):121–129, 2009 Copyright C Taylor and Francis Group, LLC ISSN: 0145-7632 print / 1521-0537 online DOI: 10.1080/01457630802293548 Numerical and Experimental Analysis of Monostable Mini- and Micro-Oscillators RACHID KHELFAOUI, ST ´ EPHANE COLIN, ST ´ EPHANE ORIEUX, ROBERT CAEN, and LUCIEN BALDAS Universit´ e de Toulouse; INSA, UPS; LGMT (Laboratoire de G´ enie Mecanique de Toulouse), Toulouse, France An asymmetric micro-oscillator design based on a monostable fluidic amplifier is proposed. Experimental data with various feedback loop configurations point out that the main effect responsible for the oscillation is a capacitive and not a propagative effect. Actually, sound propagation in the feedback loop only generates a secondary oscillation which is not strong enough to provoke the jet switching. Data from a hybrid simulation using a commercial CFD code and a simple analytical model are in good agreement with the experimental data. A more compact plane design with reduced feedback loop volumes is also studied through a fully CFD simulation that confirms the previous conclusions. INTRODUCTION Fluidic elements with no moving parts, able to realize logic (yes, no, and, or. . . ) or proportional (signal amplification) func- tions, were widely studied in the 1960s [1] when electronic components were still too sensible for thermal or magnetic con- straints. These devices with submillimetric internal dimensions were designed to perform the same actions as their electronic counterparts. One of the ideas was to design pneumatically, instead of electrically, supplied computers. Given the wide pro- gresses in electronics in the 1970s, the use of fluidic systems were limited to very specific but interesting applications, such as fluid power, mixing, and aeration [2]. However, the wide ex- pansion of microfluidics in the last ten years led to a renewed interest in fluidic elements. These micro-components could be an interesting and very useful alternative to microsystems with moving parts, which remain fragile, hard to manufacture, and unreliable. In micropumps for example, microvalves can advan- tageously be replaced by microdiodes [3]. The authors would like to thank undergraduate student Florian Chaumeton for his appreciated assistance in some of the experiments. Address correspondence to St´ ephane Colin, Universit´ e de Toulouse, INSA, UPS, LGMT, 135, avenue de Rangueil, F-31077 Toulouse, France. E-mail: [email protected] Microfluidic Amplifiers Microfluidic monostable or bistable amplifiers [4, 5] are flu- idic logic components for which functioning principle is gener- ally based on the Coanda effect: a jet issuing from a nozzle and expanding between two inclined walls will attach to the less in- clined one or to the wall which is closer from the jet axis (Figure 1). This position is a stable position. If the geometry of the de- vice is perfectly symmetric, the jet can attach to one wall or the other but will stay in this position. Monostable (M) or bistable (B) components can thus be designed. Whatever the device, only an action on the control ports supplying the recirculation zones downstream from the nozzle N or a pressure modification on the outlets O 1 and O 2 can provoke the jet switching. For some applications, vents S 1 and S 2 prevent the jet switching when the pressure at the corresponding outlet is increasing. If the vents are closed, the switching of the jet may be provoked either from the control ports C 1 and C 2 or from the outlets O 1 and O 2 . Microfluidic Oscillators Thus, if the outlet O 1 in a monostable element is connected, thanks to a feedback loop to the control port C 1 (Figure 2), the jet will oscillate, and the element will behave as a fluidic oscillator. In this figure, M 1 and S respectively locate the middle of the loop and the separation point between the right and the left 121
Transcript of Numerical and Experimental Analysis of Monostable Mini- and Micro-Oscillators

Heat Transfer Engineering, 30(1–2):121–129, 2009Copyright C©© Taylor and Francis Group, LLCISSN: 0145-7632 print / 1521-0537 onlineDOI: 10.1080/01457630802293548
Numerical and Experimental Analysisof Monostable Mini- andMicro-Oscillators
RACHID KHELFAOUI, STEPHANE COLIN, STEPHANE ORIEUX,ROBERT CAEN, and LUCIEN BALDASUniversite de Toulouse; INSA, UPS; LGMT (Laboratoire de Genie Mecanique de Toulouse), Toulouse, France
An asymmetric micro-oscillator design based on a monostable fluidic amplifier is proposed. Experimental data with variousfeedback loop configurations point out that the main effect responsible for the oscillation is a capacitive and not a propagativeeffect. Actually, sound propagation in the feedback loop only generates a secondary oscillation which is not strong enoughto provoke the jet switching. Data from a hybrid simulation using a commercial CFD code and a simple analytical modelare in good agreement with the experimental data. A more compact plane design with reduced feedback loop volumes is alsostudied through a fully CFD simulation that confirms the previous conclusions.
INTRODUCTION
Fluidic elements with no moving parts, able to realize logic(yes, no, and, or. . . ) or proportional (signal amplification) func-tions, were widely studied in the 1960s [1] when electroniccomponents were still too sensible for thermal or magnetic con-straints. These devices with submillimetric internal dimensionswere designed to perform the same actions as their electroniccounterparts. One of the ideas was to design pneumatically,instead of electrically, supplied computers. Given the wide pro-gresses in electronics in the 1970s, the use of fluidic systemswere limited to very specific but interesting applications, suchas fluid power, mixing, and aeration [2]. However, the wide ex-pansion of microfluidics in the last ten years led to a renewedinterest in fluidic elements. These micro-components could bean interesting and very useful alternative to microsystems withmoving parts, which remain fragile, hard to manufacture, andunreliable. In micropumps for example, microvalves can advan-tageously be replaced by microdiodes [3].
The authors would like to thank undergraduate student Florian Chaumetonfor his appreciated assistance in some of the experiments.
Address correspondence to Stephane Colin, Universite de Toulouse, INSA,UPS, LGMT, 135, avenue de Rangueil, F-31077 Toulouse, France. E-mail:[email protected]
Microfluidic Amplifiers
Microfluidic monostable or bistable amplifiers [4, 5] are flu-idic logic components for which functioning principle is gener-ally based on the Coanda effect: a jet issuing from a nozzle andexpanding between two inclined walls will attach to the less in-clined one or to the wall which is closer from the jet axis (Figure1). This position is a stable position. If the geometry of the de-vice is perfectly symmetric, the jet can attach to one wall or theother but will stay in this position. Monostable (M) or bistable(B) components can thus be designed. Whatever the device, onlyan action on the control ports supplying the recirculation zonesdownstream from the nozzle N or a pressure modification onthe outlets O1 and O2 can provoke the jet switching. For someapplications, vents S1 and S2 prevent the jet switching when thepressure at the corresponding outlet is increasing. If the ventsare closed, the switching of the jet may be provoked either fromthe control ports C1 and C2 or from the outlets O1 and O2.
Microfluidic Oscillators
Thus, if the outlet O1 in a monostable element is connected,thanks to a feedback loop to the control port C1 (Figure 2),the jet will oscillate, and the element will behave as a fluidicoscillator. In this figure, M1 and S respectively locate the middleof the loop and the separation point between the right and the left
121

122 R. KHELFAOUI ET AL.
Figure 1 Schematic of monostable (M) and bistable (B) fluidic amplifiers.
channels. The sketch is not symmetric and without a feedbackloop, the stable position for the jet would be in the left channel(1).
Applications for such a device could concern microflows orfluid properties measurements, the oscillation frequency beingrelated to the flow rate, viscosity, and density of the fluid [6].Microfluidic oscillators could also be used for example for mi-cromixing [7], heat transfer [8] enhancement, active control ofboundary layers [9], and jet thrusts vectoring [10], as well as inchirurgical applications [11].
According to the applications, the control port C2 can beopen at atmosphere or connected to a reservoir. For example,the oscillator can be used for mixing a primary fluid supplyingthe inlet I with a secondary fluid sucked by the control portC2 which is in depression downstream from the nozzle N. Themixture is ejected by outlet O2. The principle is valid for liquidsas well as for gases.
A few studies have been devoted to microscale fluidic os-cillators with a design such as the one represented in Figure1. Gebhard et al. [12] proposed a numerical investigation of amicro-oscillator operating with water, with the objective of gen-erating the oscillatory movement of a tool placed at the outputports. This oscillator, designed for being fabricated by the LIGA
Figure 2 Schematic of a fluidic oscillator, based on a monostable amplifier.
technique, had a depth of 250 µm, and its nozzle width was 30µm. Four different supply pressures were investigated, between50 and 300 kPa. The switching frequency was found to increaseroughly linearly with increasing volume flow rate. It was pro-posed that the period of oscillation τ was twice the sum of theswitching time τs from one attachment wall to the other and thetransmission time τt through the feedback loop: τ = 2(τs + τt ).The transmission in the feedback loop was assumed to be per-formed at the sound velocity and consequently was neglected,and a linear fitting of the oscillator frequency was then proposed.The fabrication of the oscillator and its experimental analysiswere presented in [11], and the linear relationship between vol-ume flow rate and oscillation frequency was confirmed. Simoeset al. [13] proposed a flowmeter based on a microfluidic oscilla-tor to convert a volume flow rate into a frequency signal. A 2-Dnumerical simulation using ANSYS software was performedboth for liquid and gases, for a nozzle width of 50 µm. The sim-ulated frequency was also proposed to depend on a switchingtime and a transmission time, as f = 1/[2(τs + τt )], the trans-mission time being neglected in the case of liquid flows, buttaken into account for gas flows. The switching time was pro-posed to depend on the jet velocity and on the nozzle-to-splitterdistance but no real analytical/numerical comparison was pro-posed. A roughly linear relationship between volume flow rateand oscillation frequency was also observed. Experiments wereconducted further [14] with microfluidic oscillators etched inSU-8 based epoxy photoresist using conventional photolithog-raphy, and sealed with Pyrex plates. Two different depths, 100and 175 µm, were investigated. Frequency was measured usinghot wire anemometers, the oscillator being supplied with nitro-gen, argon or carbon dioxide gases. The relationship betweensupply volume flow rate and oscillation frequency was found todepend on the gas and was not linear.
The various micro-oscillators described in the literature andbased on a fluidic amplifier structure [12, 14] have a differentdesign from the one presented in Figure 2. They are symmetricaldevices with only one input, two symmetrical feedback loopsand two outlet channels thanks to a bifurcation at the level ofsections O1 and O2. One of the interests of the particular designproposed in Figure 2 is to allow the suction of a secondary fluidby control port C2 for micromixing applications.
The objective of the present paper is to physically explainthe behavior of this kind of fluidic oscillator, pointing out therelationships between key parameters (supply pressure. oscil-lation frequency, pressure levels and geometrical parameters)and examining in details the oscillation modes through an ex-perimental and a numerical study. In all this study, the fluidis air. The first section presents an experimental analysis of amini-oscillator based on a commercial fluidic amplifier. Thisamplifier is converted into a fluidic oscillator, by connecting theoutlet O1 to the control port C1 with an additional feedback loop.Three different configurations provide experimental data whichshow a main oscillation controlled by a capacitive effect. A sec-ondary oscillation is also observed and it appears to be linked topropagation effects. In the second section, the experimental data
heat transfer engineering vol. 30 nos. 1–2 2009

R. KHELFAOUI ET AL. 123
Figure 3 Photo of the Corning fluidic amplifier used for experiments.
are compared with results from a hybrid numerical simulationcoupling CFD simulations with an analytical model. Finally,in the third section, a more compact micro-oscillator with anintegrated feedback loop is designed. Its behavior is simulatedusing the commercial CFD code Fluent. The origin of the mainand secondary oscillations is confirmed and it is shown thattheir frequency can be rather precisely obtained from simplehypotheses.
EXPERIMENTAL STUDY
The experimental study is made with a fluidic amplifier (Fig-ure 3) commercialized by Corning in the 1970s. The design ofthe main circuit of this amplifier is represented in Figure 1. Theamplifier channels have a depth of 1 mm, the distance betweenthe nozzle N and the outlets O1 or O2 is 2 cm and the nozzlehas a width of 200 µm. Vents S1 and S2 are closed. The inletI is supplied with air at pressure PI ; the control port C2 andthe outlet O2 are open at atmospheric pressure. Three differentconfigurations (see Figure 4) are tested, in order to point outthe main cause of oscillation. The classic configuration is thelooped (L) layout. In order to understand the role of the controlport C1, a similar layout is also tested with a loop closed (C)at the level of this control port. In both (L) and (C) layouts, the
Figure 4 Simplified representation of the three tested experimental configu-rations: looped layout (L), closed layout (C), volume layout (V).
Figure 5 Oscillation frequency versus feedback loop length for a constantdiameter D1 = 4 mm of the feedback loop tube. Looped layout (L); PI =2 × 10⁵ Pa.
loop is a plastic tube connecting O1 and C1. Different values ofthe diameter D1 and the length L1 are tested. In the third layout,the control port C1 is also closed but the loop is replaced with areservoir (V) with an adjustable volume V.
The pressure signal is measured at the middle M1 of the loopfor layouts (L) and (C) or inside the reservoir in layout (V), bymeans of a pressure sensor. Data processing allows determiningthe oscillation frequency, as well as the pressure levels at whichthe jet issuing from the nozzle switches from the stable position(1) to the unstable position (2) and vice versa. The stable position(1) corresponds to the jet flowing in the left channel, as the axisof the nozzle is closer to the left wall of channel (1) than tothe right wall of channel (2). This feature is not very visible inFigure 2 but is magnified in Figure 1, on detail (M).
Figure 5 shows a typical evolution of the oscillation fre-quency f as a function of the loop length L1, for a loop di-ameter D1 = 4 mm and an inlet pressure PI = 2 × 10⁵ Pa.The frequency is obtained analyzing the signal given by thepressure sensor flush mounted in section M1, at the middle ofthe feedback loop (see Figure 2). The frequency decreases asthe loop length increases, following a law f = α/L1, whereα is a constant. The usual explanation proposed in the litera-ture for such a result is that f is mainly due to the propagationof the pressure wave along the loop [14]. However, for theexperimental temperature T = 293 K, the speed of sound isc = √
γR T = 343 m s−1 for air, and the characteristic fre-quency would be f = c/L1 = 343 Hz for L1 = 1 m, and not10 Hz as experimentally measured.
Actually, the experimental data confirm that the oscillator israther driven by capacitive effects than by propagative effects.The oscillating frequency is plotted as a function of 1/V inFigure 6; V represents the volume of the loop in layouts (L) and(C), or the volume of the reservoir in layout (V).
The relationship f (1/V ) is linear; as explained below, thislinear relationship shows that for a given supply pressure PI ,the switching of the jet from the stable position (1) towardsthe unstable position (2) occurs as soon as an upper thresholdpressure P+ is reached inside the volume V . In the same way,the switching from the unstable position (2) towards the sta-ble position (1) occurs when a lower threshold pressure P− is
heat transfer engineering vol. 30 nos. 1–2 2009
124 R. KHELFAOUI ET AL.
Figure 6 Oscillation frequency f versus 1/V .©: looped layout (L) withD1 = 4 mm, �: closed layout (C) with D1 = 4 mm, �: volume layout (V).
reached inside the volume V. The pressure increase or decreaseare directly proportional to the time, as for inlet pressures higherthan 1.9 × 10⁵ Pa, flow at the nozzle N is sonic and the inputmass flow rate is constant for a given supply pressure PI . As aconsequence, the time required to reach a pressure threshold isdirectly proportional to the volume V , and this leads to a linearrelationship between the frequency f and 1/V . In the case oflooped layout (L), the required threshold pressure P+ is lessthan in the case of closed layout (C), leading to a higher slopein Figure 6. This is due to the fact that in the looped layout, twophenomena combine to cause jet switching:
i) the pressure increase at outlet O1 which opposes the jetdeveloping in branch (1);
ii) the pressure and momentum increase at the control port C1
which destabilizes the jet at its base.
On the other hand, in the closed layout (C), the second effect (ii)is no longer present and the first effect (i) must consequently beemphasized.
In both looped (L) and closed (C) layouts, the relationshipbetween f and 1/V is closely linear:
f = β/V, (1)
with β(L) = 1.53 × 10⁻⁴ m3 s−1 for layout (L) and β(C) =9.41 × 10⁻⁵ m3 s−1 for layout (C). On the other hand, in thevolume (V) layout, the relationship is affine but no longer linear:f(V) = β(V)/V + δ.
Equation (1) is the hallmark of a purely capacitive effect,with a characteristic time proportional to the volume. In layout(V), one should consider in addition the local resistance due tothe sudden change of section in O1 (see Figure 2), which is lessimportant in layouts (L) and (C). The left part of the oscillatorshould then be considered as a small capacitance (between Sand O1), a resistance (between O1 and V) and a big capacitance(volume V) connected in series. Modeling of this associationexhibits three distinct regions in the graph f (1/V ):
• for intermediate values of 1/V , the evolution is affine (f(V) =β(V)/V + δ) as represented in Figure 6, with a slope β(V)
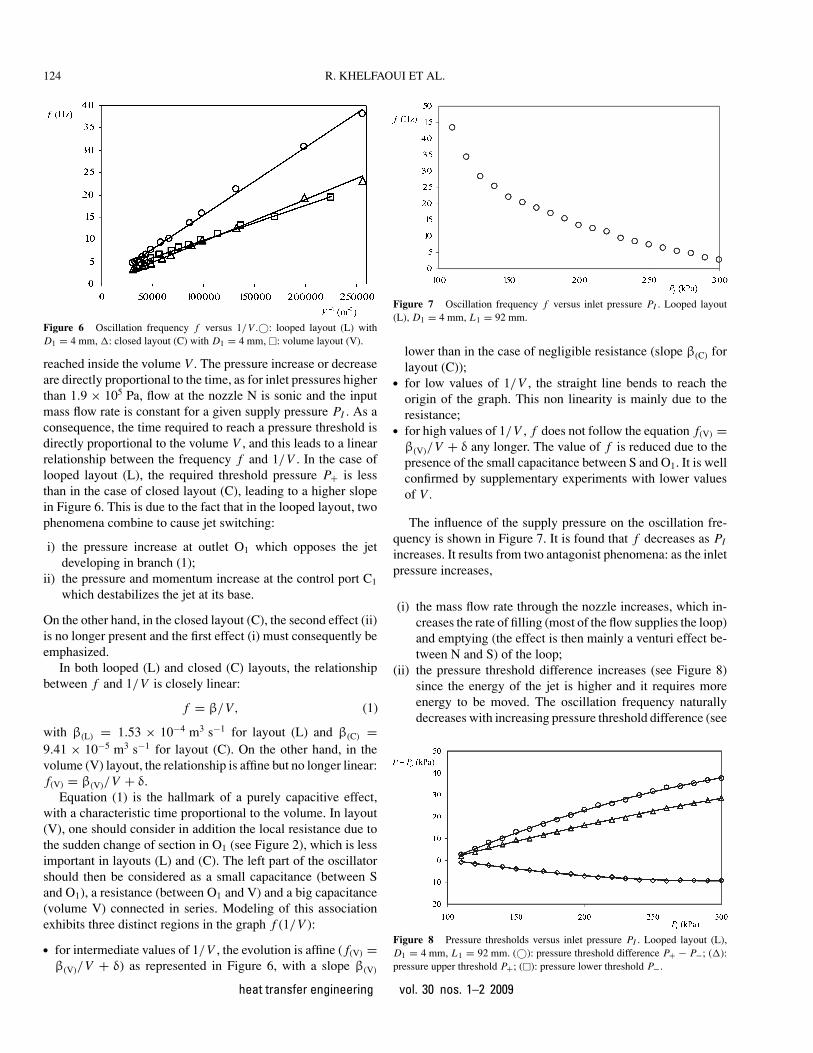
Figure 7 Oscillation frequency f versus inlet pressure PI . Looped layout(L), D1 = 4 mm, L1 = 92 mm.
lower than in the case of negligible resistance (slope β(C) forlayout (C));
• for low values of 1/V , the straight line bends to reach theorigin of the graph. This non linearity is mainly due to theresistance;
• for high values of 1/V , f does not follow the equation f(V) =β(V)/V + δ any longer. The value of f is reduced due to thepresence of the small capacitance between S and O1. It is wellconfirmed by supplementary experiments with lower valuesof V.
The influence of the supply pressure on the oscillation fre-quency is shown in Figure 7. It is found that f decreases as PI
increases. It results from two antagonist phenomena: as the inletpressure increases,
(i) the mass flow rate through the nozzle increases, which in-creases the rate of filling (most of the flow supplies the loop)and emptying (the effect is then mainly a venturi effect be-tween N and S) of the loop;
(ii) the pressure threshold difference increases (see Figure 8)since the energy of the jet is higher and it requires moreenergy to be moved. The oscillation frequency naturallydecreases with increasing pressure threshold difference (see
Figure 8 Pressure thresholds versus inlet pressure PI . Looped layout (L),D1 = 4 mm, L1 = 92 mm. (©): pressure threshold difference P+ − P−; (�):pressure upper threshold P+; (�): pressure lower threshold P−.
heat transfer engineering vol. 30 nos. 1–2 2009

R. KHELFAOUI ET AL. 125
Figure 9 Oscillation frequency versus pressure threshold difference P+−P−.
Looped layout (L), D1 = 4 mm, L1 = 92 mm.
Figure 9). The threshold pressures P+ and P− are measuredat the middle of the loop (point M1).
The former phenomenon (i) has less influence than the latter(ii) and the result is a decrease of f with increasing PI (seeFigure 7).
It can be observed in Figure 9 that the relationship betweenfrequency f and pressure threshold difference P+ −P− is linearwhen the flow at the nozzle is sonic. Nevertheless, this particularbehavior seems to be a coincidence resulting from the conjunc-tion of non-linearities.
The analysis of the pressure signal in section M1 (see Fig-ure 10) points out the influence of the feedback length, for a samefeedback loop volume V = 15.55 cm3. The main observationsare the following:
• the frequency is slightly dependent on the feedback looplength: f decreases as L1 increases;
• pressure thresholds are not much dependent on the feedbackloop length;
• the rise in pressure is more rapid than the fall;• a secondary oscillation is superimposed to the main oscilla-
tion. Its frequency fs increases as the loop length decreases.
Figure 10 Pressure P1 at the middle of the loop as a function of time t . Loopedlayout (L), V = 15.55 cm3, PI = 200 kPa. A:D1 = 2.4 mm, L1 = 2.55 m;B:D1 = 4 mm, L1 = 0.92 m; C:D1 = 6 mm, L1 = 0.41 m; D:D1 = 7 mm,L1 = 0.30 m.
The decrease of f as the loop length is increased is verylikely due to increasing non-linear effects associated with thesecondary oscillation.
A spectral analysis using a FFT of the pressure signal pro-vides the secondary oscillation frequency fs. For data issuedfrom Figure 10, it is found that 0.92 ≤ fsL1/c ≤ 1.08,whichproves that this oscillation is due to a pressure wave traveling atthe speed of sound c in the loop of length L1. This result is inagreement with the classic theory about the frequency responseof pneumatic transmission lines. The pressure perturbation isinitiated as the jet switches from one channel to the other, andthe resulting pressure wave is reflected at both extremities of theloop. These extremities are not totally closed, but they are actu-ally pneumatic restrictions. The design of these restrictions leadto a complex signal pressure but its frequency is directly tied tothe speed of sound and the length of the loop. Note that the flowvelocity at the nozzle is c because the flow is sonic in sectionN, but inside the loop, the velocity is typically 20 to 200 timeslower. As a consequence, the observed secondary oscillation isclearly not connected to a mass transport phenomenon.
Similar observations are made for the closed (C) configu-ration (see Figure 11). For the same pressure range (i.e., for−3 kPa ≤ P1 − Pa ≤ 15 kPa) the pressure rise in layout (C)is slightly more rapid than in layout (L), whereas the pressuredecrease is slower in layout (C), due to the fact that the loop isonly emptied by one end in this configuration. The frequencyincrease is mainly due to the marked increase of pressure thresh-old difference P+ −P−,which is 2.5 times greater than in layout(L). This increase underlines the role played by the momentumand the pressure of the transversal flow issuing from control portC1, which both help the jet switching from stable (1) to unstable(2) position in the looped (L) configuration.
HYBRID SIMULATION
The frequency f of the jet oscillation, as well as the pres-sure thresholds and the form of signal pressure P1 (t) shown inFigures 10 and 11 can be simulated using a hybrid approach.
Figure 11 Pressure P1 at the middle of the loop as a function of time t . Closedlayout (C), V = 15.55 cm3, PI = 200 kPa. A:D1 = 2.4 mm, L1 = 2.55 m;B:D1 = 4 mm, L1 = 0.92 m; C:D1 = 6 mm, L1 = 0.41 m; D:D1 = 7 mm,L1 = 0.30 m.
heat transfer engineering vol. 30 nos. 1–2 2009

126 R. KHELFAOUI ET AL.
This approach consists of simulating by CFD the central partof the oscillator (geometry limited by sections O1, O2, C1, C2 andI) and analytically modeling the loop behavior. This techniquedramatically reduces the computation time.
The central part of the oscillator is simulated with the com-mercial code Fluent 6.3. In order to limit computation time, a2-D simulation is performed, with a structured mesh and 7900cells. The influence of the mesh density has been verified: nosignificant difference was found with a refined grid of 32000cells. The working gas is air, assumed to behave as an ideal gas.Turbulence is modeled by the standard k-ε model with standardwall functions. Adiabatic boundary conditions are assumed atthe walls. Sections O1 and C1 are considered as pressure inlets,with a pressure calculated by a user defined function, solvingfor each time t the following set of equations, where P is themean pressure, T the mean temperature and mthe mass of gasinside the loop of volume V.
P = mRT + mRT
V(2)
is derived from the state equation PV = mRT , the mass vari-ation m being due to the algebraic mass flow rates mO and mC
entering the loop at sections O1 or C1 respectively:
m = mO + mC. (3)
The mean pressure P inside the loop is calculated at eachtime step as
P (t) = P (t − �t) + P �t, (4)
and the mean temperature is estimated assuming either anisothermal behavior of the loop, which means that
T = T (0), (5)
or an adiabatic behavior, which leads to
T = (mO TO − mC TC)γ − m T
m, (6)
from an energy balance, with
T (t) = T (t − �t) + T �t, (7)
Equations (2–7) are programmed in C language and usedin Fluent by means of user defined functions (UDF). The timestep is �t = 10−4 s. Numerical simulation is performed forPI = 200 kPa, and the flow at the nozzle N is always sonic.The maximum Mach number is found just downstream fromthe nozzle and it is of the order of 1.1. The Reynolds number atthe nozzle is around 9500.
As the loop is simulated as a simple capacitance, simulateddata are compared to experimental data in the case of higherloop diameter and lower loop length (see Figure 12).
The experimentally measured oscillation frequency f =150 Hz is found between the simulated frequency assuming anisothermal behavior of the loop (fis = 120 Hz) and the sim-ulated frequency assuming an adiabatic behavior of the loop
Figure 12 Pressure P inside the loop as a function of time t . Looped layout(L), V = 15.55 cm3, D1 = 7 mm, L1 = 30 cm,PI = 200 kPa. —: experimentaldata in the middle of the loop (P1), – – A: numerical simulation (mean looppressure P ) with adiabatic hypothesis, – – I: numerical simulation (P ) withisothermal hypothesis.
(fad = 168 Hz). The filling of the loop, which is about threetimes faster than the emptying, is precisely simulated with anadiabatic assumption, showing that heat transfer at the wall hasnot time enough to develop. On the other hand, the emptying ofthe loop being slower, heat transfer plays a non negligible roleand the pressure decrease is closer to the simulated decreasewith an isothermal hypothesis.
The lower threshold P− is rather well predicted by Fluent,whereas the upper threshold P+ is slightly overestimated. Itcould be explained by the fact that the 2-D simulation doesnot take into account friction at the upper and lower walls; asa consequence, the energy of the jet is overestimated and thecounter-pressure required for forcing its shift is higher than inreality.
All the previous analysis is valid providing the main oscil-lation frequency remains moderate. As pointed out by the localanalysis with CFD code Fluent, the switching time of the jet isof the order of 0.3 ms and it may be neglected for oscillationfrequencies less than 50 Hz. For higher frequencies due to asmaller loop volume, this switching time should be taken intoaccount.
CFD SIMULATION
Previous experiments were made with a plane amplifier ofconstant depth connected to a loop made with a circular tube.For more compact oscillators fully etched in a substrate witha constant depth, the volume of the loop can be dramaticallyreduced and it could become necessary to take into accountsecondary effects due to a non-negligible switching time or tosecondary oscillations. Such plane oscillators are now simulatedby a fully CFD approach. For comparison with the previousconclusions, the central part of the oscillator (geometry limitedby sections O1, O2, C1, C2 and I) is the same as in previoussections, but the loop is now etched with the same depth as therest of the oscillator. Assuming that this depth is not too small, a
heat transfer engineering vol. 30 nos. 1–2 2009

R. KHELFAOUI ET AL. 127
Figure 13 Detail of the grid in the neighbourhood of the nozzle N.
2-D simulation is performed. The mesh is a structured mesh with18,500 cells, the details are shown in Figure 13. The gas is stillan ideal gas and turbulence is modeled by a standard k-ε modelwith standard wall functions. The time step is �t = 10−6 s andthe solver uses a segregated first- or second-order scheme.
The loop volume is now much lower than in the previoussections. For a 1 mm depth of the device, it corresponds to V =0.607 cm3 (i.e., 1/V = 1.65 × 10⁶ m−3) from the separationpoint S to the control port C1. Two different loops have beensimulated with the same volume:
• a short loop with a length L1S = 0.108 m and a mean widthW1S = 5.27 mm;
• a long loop with a length L1L = 0.160 m and a mean widthW1L = 3.50 mm.
An example of typical pressure evolutions is shown in Fig-ure 14, and values of primary and secondary oscillations aresummarized in Table 1.
The pressure signal is comparable to the one experimentallyobserved in the previous sections. The secondary oscillation is
Figure 14 Simulated pressure P at both extremities of the feedback loop asa function of time t . Short loop. PI = 200 kPa. — C: pressure at control portC1; — O: pressure at section O1.
Table 1 Simulated oscillation frequency and secondary frequency
L1 (m)
f (Hz)1st orderscheme
f (Hz)2nd orderscheme
fs (Hz)2nd order
scheme M1
fs (Hz) 2ndorder scheme
O1 and C1
c/(2L1)(Hz)
Short loop 0.1082 240 218 3300 1640 1600Long loop 0.1603 242 230 2200 1048 1082
more present due to a smaller loop volume. It is found (seeTable 1) that this secondary oscillation has a frequency twotimes smaller at the extremities of the loop (points O1 and C1)than at the center of the loop (point M1). This observation is inagreement with the conventional theory of signal transmissionin pneumatic lines. On the other hand, pressure thresholds areincreased, although the amplifier part of the oscillator is exactlythe same as in previous sections. It could be due to the influenceof the non negligible amplitude of the secondary oscillation.
The influence of a second order numerical scheme on thecalculated oscillation frequency is not negligible, especially forthe shorter loop configuration.
The secondary frequency is hard to measure with a high pre-cision, due to the complex form of the pressure signal. But as ex-pected, the secondary oscillation frequency is close to c/(2 L1)at the extremities O1 and C1, and is close to c/L1 at the middleM1 of the loop.
The main oscillation frequency is of the order of thefrequency calculated from equation (1), which gives f =β(L)/V = 1.53 × 10⁻⁴/0.607 × 10−6 = 252 Hz. It is con-firmed from the observation of the jet and of the mass flowrate signal at outlet O2 that this main oscillation frequency is thejet switching frequency. As a consequence, even with this smallvolume of the loop, the oscillation of the jet is mainly controlledby a capacitive effect.
The CFD simulation also provides very useful informationabout the flow rate evolution, notably at the control port C2.This evolution is a key parameter for the mixing quality, whenthe oscillator is used to mix two different gases, one supplyingthe nozzle and the other being sucked through the control portC2. Notably, it is important to accurately know the proportion ofeach gas (the main gas through the nozzle N and the secondarygas through the control port C2) and its evolution during oneoscillation cycle. For the compact oscillator described in thissection, the value of the ratio mC2
/mI is typically of the order
of 0.2.
CONCLUSIONS
A design of asymmetric microfluidic oscillator based on amonostable fluidic amplifier was proposed. An experimental anda numerical study have shown that the oscillation frequency isessentially controlled by a capacitive effect and that a secondaryoscillation, due to the propagation of sound waves, disturbsthe pressure signal without causing the jet switching. A hybrid
heat transfer engineering vol. 30 nos. 1–2 2009

128 R. KHELFAOUI ET AL.
simulation coupling a CFD code and a simple analytical modelfor the loop behavior has provided data in good agreement withthe experiments.
Further simulations are currently underway for studying mix-ing capabilities of this microfluidic oscillator, as well as minia-turization possibilities. Miniaturization naturally leads to higheroscillation frequencies, but if the device is too small, viscouseffects may prevail and prevent oscillations. We are also devel-oping fully analytical models with the objective to provide asimple tool for optimizing microfluidic oscillators based on thesame principle as the one presented in this paper.
NOMENCLATURE
Symbol Description Unitc speed of sound m s−1
D1 diameter of the feedback loop mf oscillation frequency HzL1 length of the feedback loop mm mass of gas inside the loop kgm mass flow rate kg s−1
P mean pressure inside the loop PaPa atmospheric pressure PaPI inlet pressure PaP1 pressure in section M1
(middle of the loop)Pa
P+ pressure upper threshold PaP− pressure lower threshold PaP derivative dP/dt Pa s−1
R specific gas constant J K−1 kg−1
t time sT mean temperature inside the
loopK
T derivative dT/dt K s−1
V volume m3
Greekβ slope for linear relationship
between f and 1/V
m3 s−1
δ offset for affine relationshipbetween f and 1/V
s−1
γ ratio of specific heats —
REFERENCES
[1] Streeter, V. L., Handbook of Fluid Dynamics. New York: MacGraw-Hill, 1961.
[2] Shakouchi, T., Gas absorption, aeration, by fluidic oscillator op-erated by gas-liquid two-phase flow, in Proceedings of the 4thASME/JSME Joint Fluids Engineering Conference (FEDSM03):ASME, pp. FEDSM2003-45132/1-8, 2003.
[3] Anduze, M., Colin, S., Caen, R., Camon, H., Conedera, V., andDo Conto, T., Analysis and testing of a fluidic vortex microdiode,J. Micromech. Microeng., vol. 11, no. 2, pp. 108–112, 2001.
[4] Furlan, R., and Zemel, J. N., Behavior of microfluidic amplifiers,Sens. Actuators, A Phys., vol. 51, pp. 239–246, 1996.
[5] Kim, T.-H., Cho, C.-H., and Cho, D.-L. D., A force-dimensionallysilicon-micromachined fluidic amplifier device, J. Micromech.Microeng., vol. 8, no. 1, pp. 7–14, 1998.
[6] Priestman, G. H. and Boucher, R. F., Smart fluidic meters forsimultaneous measurement of fluid flowrate, Reynolds number,density and viscosity, Journal of Chemical Engineering of Japon,vol. 39, no. 4, pp. 383–393, 2006.
[7] Gregory, J. W., Sullivan, J. P., and Raghu, S., Visualization ofinternai jet mixing in a fluidic oscillator, in 11th InternationalSymposium of Flow Visualization, 2004.
[8] Sun, H. J., Li, D. S., and Ran, H. W., Heat transfer enhancementusing pulsating flow driven by fluidic oscillators, in InternationalSymposium on Heat Transfer, pp. 638–641, 1996.
[9] Cerretelli, C. and Kirtley, K., Boundary layer separation controlwifo fluidic oscillators, in Proceedings of the ASME Turbo Expo,vol. 6 Part A, pp. 29–38, 2006.
[10] Raman, G., Packiarajan, S., Papadopoulos, G., Weissman C., andRaghu, S., Jet thrust vectoring using a miniature fluidic oscillator,Aeronautical Journal, vol. 109, no. 1093, pp. 129–138, 2005.
[11] Gebhard, U., Hein, H., Just, E., and Rufoer, P., Combination ofa fluidic micro-oscillator and micro-actuator in LIGA-techniquefor medical application, in Transducers’97–1997 InternationalConference on Solid-State Sensors and Actuators. Chicago: IEEE,pp. 761–764, 1997.
[12] Gebhard, U., Hein, H., and Schmidt, U., Numerical investigationof fluidic micro-oscillators, J. Micromech. Microeng., vol. 6, pp.115–117, 1996.
[13] Simoes, E. W., Furlan, R., and Pereira, M. T., Numerical analy-sis of a microfluidic oscillator flowmeter operating with gases orliquids, inTechnical Proceedings of the 2002 International Con-ference on Modeling and Simulation of Microsystems, vol. 1, pp.36–39, 2002.
[14] Simoes, E. W., Furlan, R., Leminski, R. E. B., Gongora-Rubio,M. R., Pereira, M. T., Morimoto, N. L, and Aviles, J. J. S., Mi-crofluidic oscillator for gas flow control and measurement,FlowMeas. Instrum., vol. 16, pp. 7–12, 2005.
Rachid Khelfaoui is a lecturer at the Universityof Bechar, Algeria. He currently works on mi-cromixing techniques and obtained his Ph.D. in2007 at the National Institute of Applied Sciences(INSA) of Toulouse, in the Mechanical Engineer-ing laboratory of Toulouse (LGMT), France.
Stephane Colin is a Professor of Mechanical En-gineering at the National Institute of Applied Sci-ences (INSA) of Toulouse, France. He obtainedan Engineer degree from ENSEEIHT in 1987and received his Ph.D. in fluid mechanics fromthe Polytechnic National Institute of Toulouse in1992. He created in 1999 and currently leads withLucien Baldas the Microfluidics Group of the Hy-drotechnic Society of France (SHF). He initiatedand chaired the three first Microfluidics French
Conferences (µFLU’02, µFLU’04 and µFLU’06) and will co-chair the firstMicrofluidics European Conference (µFLU’08) to be held in 2008 in Bologna,Italy.
heat transfer engineering vol. 30 nos. 1–2 2009

R. KHELFAOUI ET AL. 129
Stephane Orieux is a research engineer in theMechanical Engineering laboratory of Toulouse(LGMT), France. He received his Ph.D. in 1999from the National Institute of Applied Sciences(INSA) of Toulouse. He is a specialist in mod-elling and design of pneumatic and electrome-chanical systems and microsystems.
Robert Caen is an Emeritus Professor of me-chanical engineering at the National Institute ofApplied Sciences (INSA) of Toulouse, France. Hereceived his Ph.D. in 1979. He headed the Me-chanical Engineering Department of INSA forfive years and taught automatism, control, fluidmechanics, transient measurements and thermo-dynamics in France, in Quebec and in Morocco.His main research interests are pneumatics andmicrofluidics. He created in 1991 the Modeling
and Control of Fluid Automation Group (MECAF) of the Mechanical Engineer-ing laboratory of Toulouse (LGMT).
Lucien Baldas is an Associate Professor of me-chanical engineering at the National Institute ofApplied Sciences (INSA) of Toulouse. He re-ceived his Ph.D. in fluid mechanics in 1993 fromthe Polytechnic National Institute of Toulouse.His current research focuses on compressibleflows in pneumatic systems and on microfluidicswith a special interest in liquid and gaseous flowsin microchannels and in micro fluidic actuatorsfor flow control.
heat transfer engineering vol. 30 nos. 1–2 2009