Nucleation and growth of ice crystals from water and sugar ...
150
Nucleation and growth of ice crystals from water and sugar solutions in continuous sturred tank crystallizers Citation for published version (APA): Huige, N. J. J. (1972). Nucleation and growth of ice crystals from water and sugar solutions in continuous sturred tank crystallizers. Technische Hogeschool Eindhoven. https://doi.org/10.6100/IR107295 DOI: 10.6100/IR107295 Document status and date: Published: 01/01/1972 Document Version: Publisher’s PDF, also known as Version of Record (includes final page, issue and volume numbers) Please check the document version of this publication: • A submitted manuscript is the version of the article upon submission and before peer-review. There can be important differences between the submitted version and the official published version of record. People interested in the research are advised to contact the author for the final version of the publication, or visit the DOI to the publisher's website. • The final author version and the galley proof are versions of the publication after peer review. • The final published version features the final layout of the paper including the volume, issue and page numbers. Link to publication General rights Copyright and moral rights for the publications made accessible in the public portal are retained by the authors and/or other copyright owners and it is a condition of accessing publications that users recognise and abide by the legal requirements associated with these rights. • Users may download and print one copy of any publication from the public portal for the purpose of private study or research. • You may not further distribute the material or use it for any profit-making activity or commercial gain • You may freely distribute the URL identifying the publication in the public portal. If the publication is distributed under the terms of Article 25fa of the Dutch Copyright Act, indicated by the “Taverne” license above, please follow below link for the End User Agreement: www.tue.nl/taverne Take down policy If you believe that this document breaches copyright please contact us at: [email protected] providing details and we will investigate your claim. Download date: 28. Jan. 2022
-
Upload
khangminh22 -
Category
Documents
-
view
3 -
download
0
Transcript of Nucleation and growth of ice crystals from water and sugar ...

Nucleation and growth of ice crystals from water and sugarsolutions in continuous sturred tank crystallizersCitation for published version (APA):Huige, N. J. J. (1972). Nucleation and growth of ice crystals from water and sugar solutions in continuous sturredtank crystallizers. Technische Hogeschool Eindhoven. https://doi.org/10.6100/IR107295
DOI:10.6100/IR107295
Document status and date:Published: 01/01/1972
Document Version:Publisher’s PDF, also known as Version of Record (includes final page, issue and volume numbers)
Please check the document version of this publication:
• A submitted manuscript is the version of the article upon submission and before peer-review. There can beimportant differences between the submitted version and the official published version of record. Peopleinterested in the research are advised to contact the author for the final version of the publication, or visit theDOI to the publisher's website.• The final author version and the galley proof are versions of the publication after peer review.• The final published version features the final layout of the paper including the volume, issue and pagenumbers.Link to publication
General rightsCopyright and moral rights for the publications made accessible in the public portal are retained by the authors and/or other copyright ownersand it is a condition of accessing publications that users recognise and abide by the legal requirements associated with these rights.
• Users may download and print one copy of any publication from the public portal for the purpose of private study or research. • You may not further distribute the material or use it for any profit-making activity or commercial gain • You may freely distribute the URL identifying the publication in the public portal.
If the publication is distributed under the terms of Article 25fa of the Dutch Copyright Act, indicated by the “Taverne” license above, pleasefollow below link for the End User Agreement:www.tue.nl/taverne
Take down policyIf you believe that this document breaches copyright please contact us at:[email protected] details and we will investigate your claim.
Download date: 28. Jan. 2022
NUCLEATION AND GROWTH OF ICE CRYSTALS · FROM WATER AND SUGAR SOLUTIONS
IN CONTINUOUS STIRREO TANK CRYSTALLIZERS
PROEFSCHRIFT
Ter verkrijging van de graad van doctor in de
technische weten·schappen aan de Technische
Hogeschool Eindhoven, op gezag van de rector
magnificus, prof.dr.ir.G.Vossers, voor een
commissie uit het college van dekanen in het
openbaar te verdedigen op Vrijdag 5 mei 1972
te 16.00 uur
door
Nicolaas Johannes Joseph Huige
geboren te Goes
C 1972 by N,J.J. Huige, Eindhoven, The Netherlands
Dit proefschrift is goedgekeurd door:
prof.dr.ir.H.A.C.Thijssen, promotor prof.ir.E.J.de Jong, co-promotor
NUCLEATION AND GROWTH OF ICE CRYSTALS FROM WATER AND
SUGAR SOLUTIONS IN CONTINUOUS STIRRED TANK CRYSTALLIZERS
N .J.J.Huige
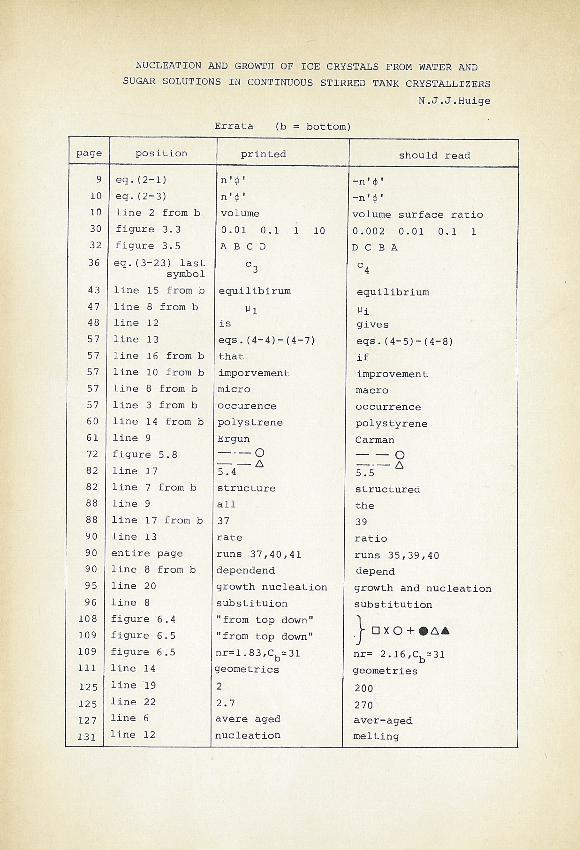
Errata (b = bottom)
page position printed should read
9
10
10
30
32
36
43
47
48
57
57
57
57
57
60
61
72
82
82
88
88
90
90
90
95
96
108
109
109
111
125
125
127
131
eq. (2—1)
eq. (2—3)
line 2 from b
figure 3.3
figure 3.5
eq. (3—23) lastsymbol
line 15 from b
line 8 from b
line 12
line 13
line 16 from b
line 10 from b
line 8 from b
line 3 from b
line 14 from b
line 9
figure 5.8
line 17
line 7 from b
line 9
line 17 from b
line 13
entire page
line 8 from b
line 20
line 8
figure 6.4
figure 6.5
figure 6.5
line 14
line 19
line 22
line 6
line 12
n’4
n’4)’
volume
0.01 0.1 1 10
ABCD
C3
equilibirum
p1is
eqs. (4—4)—(4—7)
that
imporvement
micro
occurence
polystrene
Ergun
—.--o——~5.4
structure
all
37
rate
runs 37,40,41
dependend
growth nucleation
substituion
‘from top down”
“from top down’
nr=l
geome tn es
2
2.7
avere aged
nucleation
—n’ 4)’—n’ 4)’volume surface ratio
0.002 0.01 0.1
DC BA
c4
equilibrium
gives
eqs. (4—5)—(4—8)
if
improvement
macro
occurrence
polystyrene
Carman
——0—-—h5.5
structured
the
39
ratio
runs 35,39,40
depend
growth and nucleation
substitution
}nr= 2.l6,Cb~31
geometries
200
270aver—agedmelting
aan Cary l
ACKNOWLEDGEMENTS
I would like to express my sineere thanks to everyone who
has taken part in the completion of the underlying dissertation.
In the experimental part, the analysis of ice crystals gave many
difficulties since ice crystals in a suspension tend to melt when
the temperature is too high, grow when the temperature is too low,
or form agglomerates when separated from the liquid. Despite these
difficulties, my assistent Vic Heunen and students of the working
group on crystallization, of whom I would like to mention Paul
Bierhuizen, and Wim van Pelt were very persistant and achieved
excellent results.
Marius Vorstman also gave exceptional help in thiS study, not
only in the experimental work, but also in many fruitful discussions
about the experimental set-up.
These delicate experiments could not have been performed,
however, without the help of Mr.W.Koolmees ~nd his technica! staff
who did a superb job in constructing crysta~~s and measuring
apparatus. For the theoretica! part of this work, the discussions
held with Thijs Senden were of great help. M~.J.Bos, by scrutinizing
the extensive crystallization literature, was of irreplaceable help.
Many thanks arealso due to Mrs.Th.de Meijer-van Kempen who typed
this dissertation.
Finally, I would also like to thank my wife, Caryl, for the
many hours she devoted' to correcting the English usage and grammar
as well as for the moral support she provided.
TABLE OF CONTENTS
SUMMARY
CHAPTER 1 INTRODUCTION
CHAPTER 2 NUCLEATION OF CRYSTALS
2.1 Introduetion
2.2 Mechanisms of nucleation
2.2.1 Primary homogeneous nucleation
2.2.2 Mechanisms of heterogeneous nucleation
2.2.3 Mechanism of secondary nucleation
2.3 Effects of process parameters on threshold value of supercooling or supersaturation
page
1
4
8
8
. 9
9
11
i2 14
2.4 Effect of process parameters on nucleation rate 15
2.4.1 Effect of crystal concentratien on the 16 rate of secondary nucleation
2.4.2 Effect of supercooling or supersaturation 17 on rate of secondary nucleation
2 . 4.3 Effect of rate of agitation on rate of 18 secondary nucleation
2.4.4 Effect of additives on secondary 18 nucleation rate
2.4.5 Effect of production rate and crystal residence time on secondary nucleation rate 19
2. 5 Conclusions 20.
CHAPTER 3 GROWTH OF ICE CRYSTALS FROM AQUEOUS SOLUTIONS
3.1 Introduetion 21
3.1.1 Morphology of ice crystals 21
3.1.2 Crystal growth rate 22 .
3.2 Effect of curvature on equilibrium temperature 24
3.3 Inbuilding kinetics 25
3.3.1 C-axis inbuilding correlations 27
3.3.2 A-axis inbuilding correlations 28
3.3.2.1 lee crystal growth in still water 29 and still aqueous solutions
3.3.2.2 lee crystal growth in flowing water 32
3 . 3.3 Influence of solute concentratien on 35 inbuilding kinetics
3.4 Heat and mass transfer coefficients 36
3.4.1 Correlations for heat and mass transfer coefficients
3.4.2 Effect of partiele concentratien on transfer coefficients
3 . 5 Conclusions
CHAPTER 4 CRYSTAL SIZE DISTRIBUTION
4.1 The population balance
4.2 Size dependency of the growth rate
4.3 Classified product removal
4.4 Nuclei removal
4 . 5 Staging
4.6 Non-ideally mixed tanks
4.7 Crystal breakage
4.8 Crystal agglomeration
4.9 Dynamic behavier of crystallizers
4.9.1 Batch crystallization
4.9.2 Dynamic behavier of continuous crystallizers
4.10 Conclusions
CHAPTER 5 NUCLEATION AND GROWTH OF ICE CRYSTALS IN A CONTINUOUS STIRRED TANK CRYSTALLIZER WITH SUPERCOCLED FEED
5 . 1 Introduetion
5.2 Experimental set-up
5 . 3 Measuring techniques
5.3.1 Nucleation rate (direct measurement)
5.3.2 Effectivri crystal diameter
5.3.3 Supercooling measurement
5.3.4 Crystal size distribution measurement
5.4 Experimental results
5.4.1 Crystallization of ice crystals from water
5.4.2 Crystallization of ice crystals from dextrose solutions
5.5 Growth and nucleati on kinet ics of ice from dextrose solutions
5.5.1 Growth kinetics
5.5. 2 Nucleation kinetics
36
41
43
46
48
49
50
50
51
52
53
53
53
54
57
58
59
60
60
61
64
65
65
65
69
75
75
80
5.6 Growth and nucleation kinetics of ice from water 84
5.6.! Growth kinetics 84
5.6.2 Nucleation kinetics 86
5.7 Crystal size distributions 86
5.7.1 Size distributions of ice crystals 86 in dextrose solutions
5.7.2 Size distributions of ice crystals in water 88
5.8 Influence of process parameters upon shape and 89 linear growth rate of ice crystals in stirred suspensions
5.8.1 Shape of ice crystals growing from water and dextrose solutions
5.8.2 Calculations of linear growth rates as a function of 6Tb, de' X, C and c
5.9 Analytica! model
5.10 Conclusions
CHAPTER 6 CRYSTALLIZATION OF ICE CRYSTALS IN A CONTINUDUS STIRRED RIPENING TANK FED WITH A SUSPENSION OF SMALL CRYSTALS IN SUCROSE SOLUTIONS
6.1 Introduetion
6.2 Experimental set-up
6.3 Measuring techniques
6.4 Experimental results
6.4.1 Effective diameter of product crystals
6.4.2 Start-up period
6.4.3 Mixing time
6.4.4 Crysta1 shape
6.4.5 Crystal size distribution
6.5 Unsteady s t ate model
6.6 St eady s t ate model
6.7 Discussion
6. 7. 1 Effects of 1: and x upon d50
6. 7. 2 Effect of eb upon d50
6.7.3 Effect of n!: upon d50 and CVd
e 6.7.4 Effect of type of crystallizer
6. 7. 5 Experiments with coffe e ext ract
upon d50
6.7. 6 Effect of process conditions u pon CVd e
6 . 8 Conclusions
LIST OF SYMBOLS
REPERENCES
BIOGRAPHICAL NOTICE
APPENDIX
89
91
95
97
100
101
103
10 3
10 3
107
110
111
114
115
1 20
125
125
126
127
128
129
1 29
130
132
136
140
141
SUMMARY
Crystallization of water from aqueous solutions has a potentially
wide field of application, especially in water purification and solute
concentratien processes. In these processes part of the water is
crystallized followed by a separation of ice crystals from the concen
trated solutions. The relatively high investment costs for the few
commercial plants that have been built can partly be attributed to a
lack of understanding of the influences of process parameters upon the
average size and size distribution of ice crystals that are produced.
In this study the influences of process conditions upon average size,
shape and size distribution of ice crystals produced from water and
aqueous solutions in various types of crystallizers have been inves
tigated. From the experimental results it has been attempted to deter
mine the mechanisms of growth and nucleation and to derive growth and
nucleation rate correlations.
The growth rate of ice crystals in aqueous solutions is dependent
upon heat and mass transfer coefficients and upon the kinetics of in
building of the water molecules into the ice lattice. Heat and mass
transfer coefficients are obtained from correlations presented in
literature. The inbuilding kinetics have been determined from t he ex
perimental results.
In the first part of this stu~y two types of experiments have been
performed:
1. growth rates of fixed dendritical ice crystals in flowihg water
have been determined as a function of supercooling and flow
velocity,
2-. growth and nucleation rates of freely suspended ice crystals in
water or aqueous dextrose solutions have been measured as a function
of process conditions in a continuous stirred tank crystal l izer
with supercaoled feed stream.
From the experimental data for each t ype of experiment an inbuildi n g
kinetics relationship for growth of ice crystals in water has been
determined. Growth rates of ice crystals in water calculated by means
of these two inbuilding kinetics relationships differed only by 20%.
The growth rabe appeared to be approximately second order in interface
supercooling. The inbuilding mechanism occurs most likely by screw
dislocation growth.
From ice crystal growth in dextrose solutions in the continuous
stirred tank crystallizer the inbuilding kinetics re lationship is first
1
order in interface supercooling. The inbuilding rate constant
appeared to decrease exponentially with increasing dextrose concen
tration. It is suggested that this effect is due to adsorption of
dextrose molecules at the crystal surface, or due to an increase in
relaxation time with increasing dextrose concentration.
The rate of nucleation of ice crystals from dextrose solutions
appeared to be linearly proportional to the total crystal surface
per unit volume of suspension and proportional to the bulksuper
cooling toa power 2.1. The nucleation rate of ice crystals in water
was found to be a factor of 2-5 smaller than in 30 wt.% dextrose
solutions.
The most likely mechanism by which nucleation takes place is by
breakage of dendrites from the surface of parent crystals. Most of
these dendrites are probably formed in regions of large supercooling
that arise from non-instantaneous mixing of the supercaoled feed
stream with the suspension in the crystallizer.
A general analytica! model has been derived by which bulksuper
cooling and moments of the crystal size distribution can be calculat
ed for known growth and nucleation correlations. The results obtained
with this model and the experimentally determined growth and nuclea
tion correlations agreed well with the experimental resul ts .
In the last part of this study a new crystallization process has
been described. This process is based upon the canibalistic growth
of larger crystals at the expense of smaller ones that dissolve. In
the realization of this process very small ice crystals are produced
from sucrose solutions or coffee extract. These crystals are continu
ously fed to a ripening tank where they are thoroughly mixed with a
suspension of larger crystals. The shapes of i ce crystals produced
from both the ripening tank and the continuous stirred tank crystal
lizer appeared to vary from disk-like (height over diameter ratio
0.25) to almost spherical. The crystals appeared to become more
spherical with decreasing bulksupercooling.
It has been found that the average size of crystals produced
from this ripening tank fluctuates with time. The amplitude of the
fluctuations appeared to increase with increasing rate of agitation.
Time averaged values of the mean crystal size varied proportionally
to the mean crystal residence timetoa power 0.75. Furthermore , these
time averaged values increased with increasing stirring rate and with
decreasing dissolved solids concentration. The average size of crys
tals produced from the ripening tank appeared to be independent of
2

the type of crystallizer that was used to produce the feed crystals,
and the eperating conditions of that crystallizer. This has been ex
plained by assuming that in all cases the supercooling in the crystal
lizer adjusts itself to the threshold value of nucleation.
By means of a mathematica! model it has been shown that unstable
behavier of this type of crystallizer may occur for conditions of
very small feed crystals and narrow feed crystal size distributions.
From a mathematica! model descrihing the crystal size distribution at
conditions of stable behavior, a less than linear increase of mean
crystal size with mean residence time has been predicted which is in
agreement with the experimental results. By means of this model i t has
also been calculated that for small feed crystals the average size of
product crystals increases with decreasing feed crystal size.
3
CHAPTER 1
INTRODUCTION
Crystallization of water from aqueous solutions has a potentially
wide field of application, especially in water purification and sol
ute concentratien processes. In these processes part of the water is
crystallized, followed by a separation of ice crystals from the con
centrated solutions. Water forms eutectic systems withalmost all
water soluble materials. From those solutions water crystallizes in
a very pure form. If ice crystals are formed at moderate growth rates,
inclusions of foreign material in the crystals can be prevented.
Separation of ice crystals from the concentrate is usually performed
in centrifuges or wash columns. By washing ice crystals in wash col
umns in countercurrence with water, concentrate losses of less than
0.01% appear to be feasible while only 3% of the melted ice has to
be used as wash water( lJ .
Since water removal by means of freezing is very selective and
does not include a liquid-vapor phase transformation,this processis
particularly suited for the concentratien of food liquids containing
volatile aromas. Moreover, the process temperature is so low that a
loss in quality due to chemical and biochemica! decomposition reac
tions is negligible (2 ).
Freezing can also be used as a process for the production of
potable water from heavily polluted water, brackish water, or sea
water. In these processes crystallization of part of the water is
usually brought about by direct contact with an immiscible evaporat
ing refrigerant or by evaporation of water at low pressure. After
being washed, the ice crystals are melted by direct contact with
condensing vapor. This direct contact heat exchange in freezer and
melter minimizes the need for metal heat transfer surfaces. An ad
vantage of the freezing process as compared to evaporation is that
freezing is thermodynamically favorable since the heat of crystalli
zation is only about 1/7 of the heat of ev~poration. Furthermore. the
low operatien temperature reduces eerrosion and scale formation con
siderably (3 ,4 ) .
Due to the relatively high investment costs, few commerical
freezing plants for solute concentratien or for the production of
potable water have been built(2,J). It seems likely however, that a
better understanding of the influences of process variables upon the
performance of crystallizer and wash column will lead to lower in
vestment costs and therefore to a more competitive position of the
4
freezing processes in the coming years.
One of the major factors thatdetermines the costs of wash col
umn separators is the sharpness of s.eparation. For the production
of potable water for example, poor washing performance may lead to
a considerable loss of product water. For freeze concentratien pro
cesses imperfect washing results in dilution of the concentrate.
Obviously, the capacity of the wash columns is also a major cost
determining factor.
Both the capacity of the separator and the sharpness of separa
tion increase with a decrease of the specific surface of the crys
tals. The specific surface is determined by size and shape of the
crystals produced in the crystallizer. In the underlying investiga
tion the influence of process variables and type of crystallizer
upon the shape and size of ice crystals grown from water and sugar
solutions will be determined. Dextrose and sucrose solutions have
been chosenasamodel salution for food liquids. A few experiments
will also be performed with coffee extract.
At a given production rate the average size of crystals obtain
ed from a contirtuous crystallizer is determined by the total num
ber of crystals produced per unit time and per unit volume. This
so-called net rate of nucleation may be a function of supercooling,
crystal magma density, hydrodynamic conditions, mechanical influ
ences, and many other factors. Nucleation of crvstals from me,l.ts or
solutions can occur by various mechanisms. In chapter 2 nucleation
mechanisms described in literature are reviewed. Subsequently, sever
al possible influences of process parameters upon the rate and occur
rence of various types of nucleation will be discussed.
In chapter 3 the theory describing gr~wth of ice crystals in
water and aqueous solutions will be presented. Furthermore, growth
rate correlations that are indispensable for this theory will be de
rived from experimental results. Three main effects are involved in
growth of ice from solutions: heat transfer, mass transfer, and in
building of water molecules into the ice lattice. Ice crystals ap
pear to grow with different linear growth rates in the two main
crystallographic directions. This growth anisotropy is due to the
difference in inbuilding kinetics in these two directions. Litera
ture on the inbuilding kinetics in both directions will be reviewed,
in addition to which the influence of solute concentratien upon
these kinetics will be discussed. In order to obtain more informa-
5
tion on a-axis inbuilding kinetics, growth rates of ice crystals in
still dextrose solutions, and in still and:flowing water have been
measured . Inbuilding kinetics will be determined only from the
experimental data for ice growth in flowing water. Data for heat and
mass transfer between liquids and suspended particles have been col
lected from literature. From these data correlations for heat and
mass transfer coefficients will be derived. The influence of partiele
concentratien upon these coefficients will also be accounted for in
the correlations.
Continuous crystallizers produce crystals of many differentsizes
at the same time. For a complete description of crystallizer per
formance the effects of process variables and crystallizer design
upon the crystal size distribution have to be known. In chapter 4
some literature on crystal size distributions will be reviewed. För
a mathematica! description the crystal size distribution will be
characterized by means of a population density balance. Special at
tention will also be paid to dynamic behavior of continuous and batch
crystallizers.
In chapters 5 and 6 experiments carried out in two different
types of crystallizers will be described. The concepts of nucleation,
growth, and crystal size distribution that are described in chapters
2, 3, and 4 are used for the interpretation of the experimental re
sults and to deduce nucleation and growth correlations.
In chapter 5 experiments with a small adiabatic continuous,
stirred crystallizer with a supercaoled feed stream will be described.
In this crystallizer, nucleation and growth of ice crystals from wa- .
ter and dextrose solutions were studied. Several possible nucleation
mechanisms are discussed. By means of a mathematical model for the
crystal size distribution, growth and nucleation kinetics will be
calculated from the experimental data. The inbuilding kinetics rela
tienship that is obtained will be compared to the inbuilding kinetics
calculated from the growth rate data described in chapter 3. For a
few runs crystal size distributions will be determined experimentally.
These distributions are compared to crystal size distributions calcu
lated from theory.
In chapter 6 a new process that has been developed in our labora
tory will be described. This process is based upon the canibalistic
growth of larger crystals at the expense of the smaller ones which
dissolve. In the realization of this process very small ice crystals
are produced from sucrose solutions or coffee extr.act. These small
6
crystals are fed to a ripening tank where they are thoroughly mixed
with a suspension of larger crystals. Since the small crystals act
as latent heat sinks, the heat of crystallization is withdrawn every
where in the crystallizer.
The dynamic·behavior of this new type of crystallizer will bede
termined experimentally as well as theoretically for various epera
ting conditions. Steady statevalues of the average size of crystals
produced from this ripening tank will be calculated by means of a
theoretica! model for various size distributions of the feed crystals.
7

CHAPTER 2
NUCLEATION OF CRYSTALS
2.1 Introduetion
If a solution is concentrated or lowered in temperature, spon
taneous nucleation of crystals does not occur until the solution be
comes supercooledor supersaturated to a certain degree. The super
cooling at which nucleation starts is usually referred to as the
threshold value - of supercooling 6Tnuc" This threshold value depends
upon factors such as cooling rate, hydrodynamic conditions, history
of the solution, temperature, presence of foreign material in the
solution, and the presence of crystals of the material to be crys
tallized. The influence of these factors upon 6Tnuc will be discus
sed in paragraph 2.3.
In paragraph 2.2 various possible mechanisms for nucleation wil!
be discussed. There are two main mechanisms for nucleation: primary
and secondary nucleation. Secondary nucleation is defined as the for
mation of new crystals, originated from or promoted by crystals of
the same material, usually referred to as parent crystals or seed
crystals.
Primary nucleation can be subdivided into homogeneous and heterogene
ous nucleation. Heterogeneous nucleation is catalyzed by foreign ma
terial. Homogeneous nucleation is commonly described on the basis of
a classica! theory that was first put forward by Volroerand Weber(6).
Their analysis was based upon Gibbs' concept of the critica! size of
a nucleus. Becker and Döring (7) modified Volroer's theory slightly.
They postulated that clusters of molecules are formed in a supercool
ed solution by a mono-molecular attachment mechanism. The clustering
process is considered reversible. In the liquid there will be a dis
tribution of clusters of different sizes. This distribution is depen
dent upon the supercooling and changes continuously by statistica!
fluctuations. Once a cluster attains a certain critica! size it can
reduce its total free energy by growing and consequently become sta
ble.
For heterogeneous nucleation the structure of liquids at a for-
eign surface becomes important. Since the concentration and size
of molecular clusters at an interface are usually larger than in the
bulk, the critica! size for nucleation is more easily attained at
interfaces.
8
In practice, homogeneaus nucleation hardly ever occurs since it is
difficult to exclude foreign material completely. Even if insoluble
foreign matter could be eliminated there would still be the walls of
the container or in case of emulsions or mists, the fluid surrounding
droplets that the supercocled solution would be exposed to.
Secondary nucleation occurs at a much smaller value! of llTnuc
than primary nucleation since parent crystals are the best nucleating
agents (8). Once new crystals are formed by homogeneaus or heteroge
neaus primary nucleation, secondary nucleation, promoted by the new
ly formed crystals takes over. As a consequence, in continuous crys
tallizers new crystals will be formed predominantly by ~econdary nu
cleation. Since this study is mainly concerned with crystallization
in continuous crystallizers,secondary nucleation will receive the
most attention in the next paragraphs.
In paragraph 2.3 the influence of process parameters on the rate
of secondary nucleation will be discussed.
2.2 Mechanisms of nucleation
2.2.1 Pri marM homogene aus nuaZeati on
Homogeneaus nucleation will be described here by means of the
classica! theory of Gibbs and Thomson. According to this theory the
change in Gibbs free energy llG due to formation of a crystal with
surface area A can be expressed by ( 9 ):
llG = n' 0'+ A o (2-l)
where n' is the number of molecules in the crystal, and 0' is the
difference in free energy per molecule between the two phases. The
secend term on the right is the free energy necessary for the forma
tion of the surface A. Molecules in the surface layer of a solid
phase are in a state of higher potential en~rgy than the interior
molecules. In a macroscopie body, the excess of free energy of the
surface layer can be expressed in terros of the surface tension or sur
face free energy per unit surface area o.
For very small crystals or nuclei consisting of only a small num
ber of molecules, surfac e area and surface free energy are rather ill
defined. o might be dependent upon the size of the crystal and is
certainly notuniform along the crystal surface (9 ) . Therefore, the
classica! nucleation theory based upon macroscopie thermodynamics can
hardly provide quantitative information, but, because of the lack of
other theories this nucleation theory is still generally used.
9
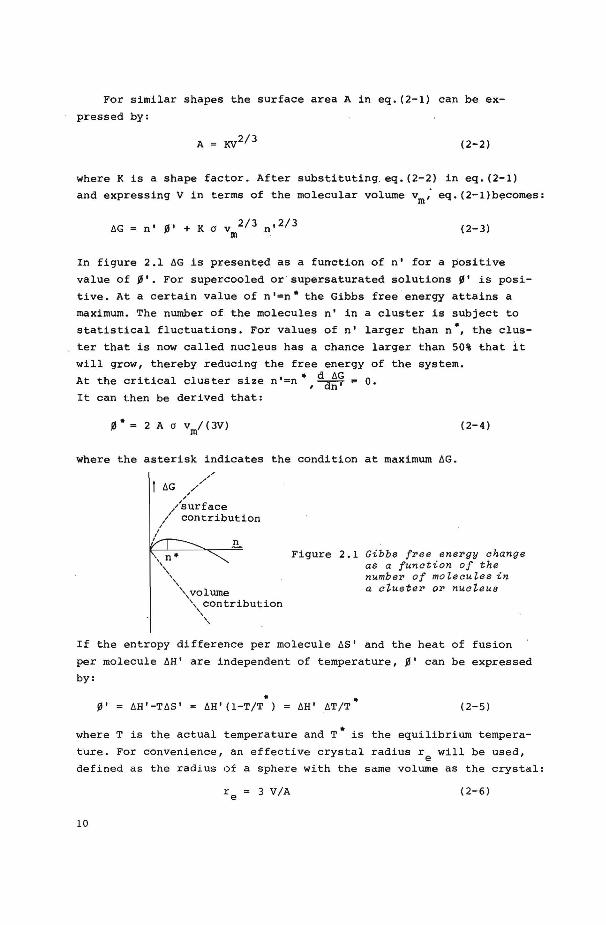
For similar shapes the surface area A in eq. (2-1) can be ex
pressed by:
A KV2/3 (2-2)
where Kis a shape factor. After substituting. eq.(2-2) in eq. (2-1)
and expressing V in termsof the molecular volume vm; eq.(2-1)becomes:
!J.G n' 0' + K o v 2/3 n'2/3 m (2-3)
In figure 2.1 !J.G is presentedas a function of n' for a positive
value of 0'. For supercocled or supersaturated solutions 0' is posi
tive. At a certain value of n'=n• the Gibbs free energy attains a
maximum. The number of the molecules n' in a cluster is subject to
statistica! fluctuations. For values of n' larger than n•, the clus
ter that is now called nucleus has a chance larger than 50% that it
will grow, thereby reducing the free energy of the system.
At the critical cluster si ze n '=n • dd!J.~ = 0. , n It can then be derived that:
(2-4)
where the asterisk indicates the condition at maximum !J.G.
!J.G ,/ ","."'"
, ,/surf ace
/ contribution I
I I
/ .!L ' n• ' \\,
'\volume ', contribution ', ' '
Figure 2.1 Gibbs free energy change as a function of the number of moZecuZes in a cluster or nucleus
If the entropy difference per molecule !J.S' and the heat of fusion
per molecule !J.H' are independent of temperature, 0' can be expressed
by:
• • 0' !J.H'-T!J.S' = !J.H'(1-T/T) = !J.H' !J.T/T (2-5)
where T is the actual temperature and T• is the equilibrium tempera
ture. For convenience, an effective crystal radius re will be used,
defined as the radius of a sphere with the same volume as the crystal:
3 V/A (2-6)
10

Substitution of eqs.(2-5) and (2-6) into eq.(2-4) yields:
r e (2-7)
in which óH is the heat of fusion per unit mass and ps is the speci
fic weight of the solid ,phase. This equation gives the molecular
cluster si ze necessary for homog.eneous nucle;;~tion in a liquid wi th
a supercooling óT.
2.2.2 Mechanisms df heter~geneous nucZeation
Heterogeneous nucleation occurs at much smaller supercoolings
than homogeneous nucleation. According to Nyvlt this is due to ad
sorption of molecules or groups of molecules on foreign material,
also called substrate. Since molecules are in a more structured
:::;tate at the substrate :surf ace than in the bulk of the liquid,
nucleation occurs at the foreign surface at supercoolings that are
lower than those required for homogeneous nucleation.
The presence of foreign material can decreàse the surface free
energy contribution given in eq. (2-1). This effect also causes heter
ogeneous nucleation to occur at· lower supercoolings than homogeneous
nucleation. Similar to eq. (2-1) the change in total free energy óG
can be expressed by:
(2-8)
where óGv is the free energy required to form a unit volume v2 of
phase 2 from phase 1, oij is the free energy of the i-j interface,
and Aij is thé corresponding interfacial area. The decrease in the
surface free energy contribution due to the foreign substrate depends
upon the compatibi1itybetween nucleus and substrate.
Fora spherical cap-shaped nucleus on a flat substrate, Volmer (1 0)
expressed the contact angle e between nucleus and substrate in terros
of the interfacial surface free energies by:
(2-9)
For e = 180° there is no affinity between nucleus and substrate and
the free energy change for nucleation is the same as for homogeneous
nucleation. Complete affinity exists for 6 0°(1 0) . In this case the
free energy change for nucleation is zero. Sadek ( 11 ) showed that for
a fixed contact angle e, a concave substrate surface requires a small-
11
er number of molecules to form a critica! nucleus than a convex sur
face. very small particles with high convex curvatures are therefore
poor nucleators. The compatibility between nucleus and substrate can be influenced
by various factors: a) vonnegut (12) assumed that the compatibility depends upon the
similarity between the structure of substrate and crystals to
be formed. b) According to Fletcher (13 ) only few sites of the substrate surface
are active nucleators. Dislocations are especially favorable in
initiating nucleation. c) In studying the nucleation of ice crystals in the presence of
different forms of Agi Edwards and Evans (14) found that substrates
that exhibit hydrophobic properties are good nucleators.
2.2.3 Mechanism of seaondary nualeativn
In literature many different mechanisms for secondary nucleation
have been proposed. Three major types are commonly distinguished:
A. Nucleation by breakage of dendrites or crystallites from the crys
tal surface.
B. Nucleation by shearing off parts of a structured layer at the sur
face of parent crystals.
C. Nucleation by mechanica! breakage of parent crystals.
Mechanism A. Several investigators (1J,16-19) found that secondary nu
cleation is associated wit~ dendritic growth. Theoccurrenceof dendri
tical growths on the surface of parent crystals is dependent upon the
type of crystal, the supercooling,and the presence of impurities or
additives. On the surface of ice crystals very thin platelets and
needles have been observed at supercoolings as smallas 0.5°C( 20).
Secondary nucleation of ice crystals from water or aqueous solutions
is believed by many investigators (J1, 16, J8) to occur by this mechan
ism. Crystallites formed by two-dimensional nucleation on the sur
face of parent crystals may also serve as potential secondary nuclei
(21). These elementary building blocksarein the order of the criti
cal size.
Meohanism B. New crystals are formed from clusters of molecules that
are torn away from a structured or adsorbed layer around a growing
crystal (22 , 24) . The existence of such a layer was already proven by
12
Miers(23) in 1903. He found that the concentratien of solute mole
cules at the interface between a growing solute crystal and the sol
ution was higher than in the bulk of the solution. This apparently
contradiets the fact that, according to transport theories, the sol-
ute concentratien at the interface of a growing crystal must be lew
er than the bulk concentration. An explanation of this discrepancy
is that in spite of the higher interface concentratien the thermady
namie potentlal in the boundary layer at the interface is lower than
in the bulk of the liquid due to intermolecular forces and crienta
tien of molecules at the interface. It wil! now be postulated that
the depth of this layer (or diffuseness of the interface) depends
upon the ratio of the molecular inbuilding resistance .and the mole
cular diffusion resistance. With more inbuilding controlled crystal
growth, the adsorption layer becomes thicker and consequently more
clusters can be torn away, thereby increasing the nucleation rate.
This has been demonstrated by Leichkis(25), Shor(26) and Johnson ( 27J
who showed that the nucleation rate increases when soluble impurities
are added that hamper the inbuilding rate. Johnson ( 27) also showed
that the nucleation rate is the largest at the slowest growing faces
of Mgso4
-7H2
o crystals.
Dendrites, crystallites or clusters that become detached from the
parent crystals have a chance > 50% to become new nuclei if their
size is at least equal to the critica! size belonging to the prevail
ing bulk supercooling. The clusters that are torn away from the ad
sorption layer may be structured,although this is not necessary. If
a cluster is of supercritical size the time necessary to form a three
dimensional n~cleus is extremely short (< l0- 7sec), as pointed out by
Mullin(28).
Dendrites, crystallites or parts of the adsorption layer can be
detached from the parent crystal by two major causes:
1. They may be sheared off by the surrounding fluid. This mechanism
can be important when shear forces are high, such as when parent
crystals are fixed at a certain place in a mixing vessel or when
they are attached to the impeller(24,29,30). In "real" crystalli
zation processes however, where the relative veloeities between
fluid and freely moving crystals are much lower, nucleation by
ether detachment mechanisms will probably prevail.
2. They can break off due to cellision of the parent crystal with the
impeller, withether crystals, or with the walls of the crystal
lizer. There are many investigators(11,15-18, 31,32J who attribute
13

secondary nucleation to a mechanism of this nature.
Clontz{2 2) .found that the nucleation rate increases linearly with
the impact energy of collision. Crystal-crystal colliSions resulted
in more nuclei than crystal-wall collisions at the same- collision
energy. In a "real" crystallizer, crystal-wall and especially crystal
impeller collisions wil! probably be the primary souree of nucleation
since the cellision energy · involved is much larger ·than for crystal
crystal collisions. Lal and Strickland-Constable(32), and Melia and
Moffitt(15) showed that the rate of secondary nucleation can· be very
large when crystals that are not suspended completely slide along the
crystallizer wall,
Mechanism C. Secondary nucleation •by mechanica! breakage of parent
crystals is very common in industrial crystallizers. Breakage can occur,
again due to cellision of crystals with each other, with the wal! of
the crystallizer, or with the impeller. I-f a suspension circulation
pump is present in a crystallizer its grinding action may be a major
cause of secondary nucleation. Matusevich and Baranov(33-37) carried
out many exP.eriments in industrial-type crystalliz-ers. Thèy found
that, especially at high rotational veloeities of the circulation pump,
mechanica! abrasion reduces the average crystal size considerably(34,
36).
2.3 Effects of process parameters on threshold value of supercooling
or supersaturation
Knowledge of the influence of process parameters upon the thres
hold value of supercooling or. supersaturation, for simplicity indica
ted by one symbol ~Tnuc' is important in order to prevent excessive
nucleation. Therefore the effects of the following factors wil! be
described below: cooling rate, rate of stirring, hydrodynamic c ondi
tions,material to be crystallized, temperature, history of the solut
ion, and presence of seed crystals or other heterogeneous nucleators.
Thermal history may be important in heterogeneous nucleation(ll,
28) since it affects the molecular structure at a substrate surface.
After a crystal at a substrate has been dissolved, for example, mole
cules at thesubstrate surface and especially molecules in pores and
cracks may still be in an ordered state. By cooliri.g such a solution,
nucleation takes place at a smaller value of ~Tnuc than nucleation
from a solution that has not been crystallized in the immediate past
(11). It has been found in many cases that when foreign material is
present in the liquid ~Tnuc can b e reduced considerably( JB , 39), depend
ing upon the compatibility between the foreign material and the nucle
us.
14
When parent crystals are present 6Tnuc has a minimal value(8,11,4 0 ).
Nyvlt(8,2J,40) has performed many experiments to determine the influ
ence of the material to be crystallized and the temperature upon
6Tnuc· Generally, 6Tnuc decreases with increasing temperature.
The effect of the rate of agitation in the crystallizer upon
6Tnuc is very complex. Increasing the stirring rate increases the
rate of transport .of molecules to clusters of embryonic size. This
effect causes 6Tnuc to decrease at high stirring rates. H?wever, the
reverse effect may result when shearing effects become so large that
parts of the clusters break off(41) befere they become supercritical.
6Tnuc can also be influenced by temperature differences in the solu
tion; when, for example, a crystal-free solution is slowly lowered
in temperature at a low stirring rate, 6Tnuc will first be attaine.d
near the cooling surface , while the average supercooling of the so
lution has not yet reached 6Tnuc· 6Tnuc is always observed to increase
with increasing cooling rate(8,11',23,40,42). This is probably dU"e to
the fact that the time necessary to form a cluster of critica! size
can be quite long(4J). At high cooling rates the solution can be
supercocled considerably during this time.
Seeded solutions show the sametrends as unseeded ones(ll, 44).
For low concentrations of seed crystals Ting and McCabe(44) foUnd
that 6Tnuc decreasas with increasing seed crystal concentration.
2.4 Effect of process parameters on nucleation rate
The rate of nucleation can be dependent upon many factors:
supercooling or supersaturation, hydrodynamic conditions, total surface
area of parent crystals, and mechanica! influences. In commercial
crystallizers and even in laboratory crystallizers it is very hard to
determine the effect upon the nucleation rate of each of these factors
separately since one variable cannot be changed independently of the
ethers.
Many authors(15,2J,33,36,40,42 ) have carried out batch experiments
in which at a certain cooling rate and stirring speed nucleation is
brought about with or without seed crystals. The final product that is
obtained in batch experiments is the result of nucleation and growth
in a suspension where supersaturation, total crystal surface, and total
number of crystals change with time. Unless the variatien of these
factors with time is determined(29J, it is doubtful whether any useful
information for industrial crystallization can be obtained from these
experiments.
15
Cayey and Estrin(29) found that after initial nucleation the
total number of crystals increased only very slightly with time un
til the newly formed crystals became large enough to promote further
nucleation. The authors suggest that the critica! size at which new
ly formed particles become nucleators depends on the level of agita
tion. According to Bransom(45) this can be understood in terms of the
Kolmogoroff theory of homogeneous isotropie turbulence. A detailed
description of this theory will be given in chapter 3. According to
Kolmogoroff,viscous energy dissipation only takes place by small ed
dies of size À1 • Crystals that have a size less than À1 can be con
tained in these eddies and can therefore not collide with other crys
tals or experience shear stresses. When the crystals become larger
than the energy dissipating eddies, secondary nucleation can take
place.
Batch experiments that are performed to determine the rate of
primary heterogeneous nucleation only make sense if the experiments
are ended before crystals are large enough to initiate secondary nu
cleation. In the following subparagraphs the influence of some pro
cess parameters on the rate of secondary nucleation will be discussed.
2.4.1 Effe a t of arystal aoncentration on the rate of secondary nuale
ation
In literature the secondary nucleation rate J is not only corre
lated with the weight fraction X of crystals in the suspension(1 6,46,
47), but also with the total crystal surface per unit volume Atot(11,
16,45,48), or with the number of crystals per unit volume ~0 ( 11). In
almost all correlations that have been proposed J is linearly propor
tional to one of these properties.
The rate of secondary nucleation due to breakage of dendrites or
crystallites from the parent crystal surface probably is linearly pro
portional to this surface, since the number of sites where dendrites
or crystallites may develop increases linearly with Atot• The rate of
secondary nucleation J by shearing off parts of the structured layer
around the crystal, increases with the number and size of the frag
ments that are sheared off. J increases therefore, with increasing to
tal volume of the structured layer and consequently with At t• If
nucleation results from collision of crystals both A an~ the ' tot
number of crystals per unit volume ~0 are important factors. Since
the magnitude of the impact energy is important in determining whether
a Collision yields new crystals or not, the nucleation rate can be
dependent upon the total mass of crystals per unit mass of suspension x.
16
Ottens(50) showed that for nucleation due to crystal-crystal colli
sions J is proportional to the square of the total mass of crystals
above a certain critica! size, while for crystal-impeller or crystal
wall collisions a linear dependency was derived.
In correlating nucleation data with X, Atot' or ~0 one has to be
very careful, since it is impossible to vary these properties without
varying one or more of the other important variables. For example,
by increasing X at constant production rate Baranov(J?) found hardly
any variation in average crystal size. This was explained by the fact
that the supercooling in the crystallizer decreased with increasing X.
The efiects of a decrease in J resulting from a redeetion in öC, and
of an increase in J due to an increase in X must have counteracted
each other.
2.4.2 Effeat of superaooLing or supersaturation on rate of seaondary
nuaZeati on
Secondary nucleation that takes place by mechanica! breakage of
crystals will not be affected by the level of supersaturation unless
the fragments that are broken off are of subcritical size. If second
arynucleation occurs by tearing off crystallites or molecular clusters,
the nucleation rate generally increases with increasing supercooling
or supersaturation 6C. This can be explained by the fact that a larger
structured layer around the crystals, and a larger number of crystal
lites exist at higher values of 6C. Furthermore, the chance that a
broken off crystallite or cluster will become a stable nucleus in
creases with increasing 6C.
In most crystallizers 6C varies from place to place and is the
largest in those areas where cooling or evaporation takes place. If
the nucleation rate J is not first order in 6C, the correlation of J
with the average value of 6C can lead to errors. Errors can also be
expected when J is correlated to 6C in those cases where the nuclea
tion mechanism is different in various areas of the crystallizer. A
change of nucleation mechanism with 6C has for example been observed
for the crystallization of MgS04
7H2o, where at supercoolings > 4°C
nuclei are formed under conditions of dendritic growth(49). Secondary
nucleation of ice crystals from supercooled water(l?) or brine(11,4 7)
is also attributed to dendritic growth in local cold spots and subse
quent breaking of those dendrites. Most authors(16,22,45,47) find that
a linear relationship between the nucleation rate and the average su
percooling or supersaturation correlates their data well,
17
2.4.3 Effect of ~ate of agitation on ~ate of seaonda~y nualeation
Many crystallizers are equipped with an impeller or circulation
pump to keep the crystals suspended and to improve heat and mass
transfer rates. There are many ways in which the circulation or stir
ring rate nr can influence the rate of secondary nucleation:
a) If nr is too low to keep all crystals suspended some of them may
slide along the bottorn of the crystallizer, which seems(15,J2)to
be a very effective way to increase the nucleation rate.
b) With increasing nr a higher secondary nucleation rate may result
due to more mechanica! abrasion of crystals by the impeller or
pump. Especially for weak crystals, mechanica! abrasion in a cir-
c)
culation pump causes a large nucleation rate and consequently
small product crystals(J4,J?).
With a higher stirring ra te the frequency of collisions of crys-
tals with one another, with the impeller, or with the crystallizer
wall increases. This larger cellision frequency and alsothe higher cellision energy cause J to increase with nr. For these
systems in which crystallites or molecular clusters are torn off
by fluid shear J will also increase with nr.
d) If, on the ether hand, the stirring speed becomes so large that
crystallites or clusters are wiped from the crystal surface into
the bulk before they reach a size larger than the critica! size
at the bulk conditions, then, the rate of nucleation decreases(41J.
e) With increasing heat and mass transfer rates the resistance for
the inbuilding step becomes larger and more molecules get a chance
to build up at the crystal surface. Due to this effect the nucle
ation rate may increase with nr.
f) With a higher degree of mixing, the supercooling or supersatura
tion öC becomes more evenly distributed throughout the crystal
lizer. Consequently, for nucleation that takes place only at large
values of óC or nucleation that is higher order dependent on óC,
a larger degree of mixin~ results in a lower nucleation rate(l?).
For nucleation of ice crystals from brine or nucleation of
inorganic salts from aqueous solutions(16,24,J4,J5,J7) the most common
trend is that the secondary nucleation rate increases with increasing
rate of agitation.
2.4.4 Effect of additives on seaonda~y nualeation ~ate
Additives can affect the rate of secondary nucleation in a number
of ways. First of all additives can alter the growth mechanism.
18
Under the influence of additives,regularly growing crystals may start
growing dendritically(15),or vice versa(Jl). Since dendrites are
usually fragile, additives that promote dendritic crystallization
can enhance the secondary nucleation rate. This effect was clearly
shown by Melia and Moffitt(15) for NaCl crystallization.
Additives can also act as inhibitors for the inbuilding of mole
cules into the crystal lattice, for example, by blocking dislocations.
In this case, the inbuilding limitation for growth increases and a
thicker molecular layer starts to form at the crystal surface. The
higher cluster concentratien in this case may give rise to a higher
nucleation rate(25,27). On the contrary, for secondary nucleation
that occurs by breaking off crystallites that grow at dislocations
at the crystal surface, the nucleation rate can be reduced as a re
sult of the poisoning effect(26). Shor(26) also found that the rate
of secondary nucleation can increase by as much as twofold due to
the presence of surfactants. Surfactants lower the interfacial ten
sion, thereby lowering the energy requirement for crystallite forma
tion at the crystal surface.
2.4.5 E[[eat of produation rate and arystal residenae time on seaon
dary nualeation rate
When the production rate w of a crystallizer is increased without
changing the crystal concentratien X, the mean residence time' of the
crystals decreases linearly with w. With decreasing residence time
and constant X, local and average supercoolinga or supersaturations
must increase and the rate of secondary nucleation of type A and B
will be affected as described in paragraph 2.4.2. If secondary nucle
ation takes place by breakage of crystals only, . a reduction of the
mean residence time and consequently an increase in average su2ercoo1-
ing will give rise to larger crystals since the growth rate increas
es with supercooling while the nucleation rate is not affected as
long as the broken-off fragments are not in the order of the critica!
size. This favorable effect was shown by Timm(51) and also by Baranov
(37) for NaNo 3 crystallization in a vacuum crystallizer with circula
ting suspension.
When the production rate of a crystallizer is increased without
changing the mean residence time of the crystals, the crystal concen
tratien increases while the supersaturation might also change. The
separate effects of crystal concentratien and supersaturation on the
secondary nucleation are described in paragraphs 2.4.1 and 2.4.2.
19

2.5 CONCLUSIONS
1. Severalrnechanisrns ofnucleation of ice crystals frorn solutions or
frorn the melt have been reviewed. An expression for the critica!
size of a nucleus has been derived. It has been shown that in con
tinuous crystallizers new crystals will be formed predorninantly by
secondary nucleation.
2. Secondary nucleation may occur by breaking off dendrites or
crystallites from a crystal surface, by shearing off parts of a
structured layer around the crystals, or by breakage of crystals
themselves.
l. Generally, the nucleation rate is found to be linearly proportional
to the magma density or to the total crystal surface per unit
volurne of suspension.
4. Most authors find that the nucleation rate J of ice crystals in
water or aqueous solutions increases with increasing supercooling.
5. The rate of agitation in a crystallizer can influence J in various
ways. The overall effect generally is that J increases with in
creasing rate of agitation.
20
CHAPTER 3
GROWTH OF !CE CRYSTALS FROM AQUEOUS SOLUTIONS
3.1 Introduetion
The rate at which crystals grow is commonly expressed by a
linear growth rate, i.e. the rate of change in one dimension. The
linear growth rate can be quite different in various crystallogra
phic directions. The morphology of ice crystals will be discussed,
therefore, befare examining the effects of various factors upon the
linear growth rates of ice crystals in t heir main crystallographic
directions.
3.1.1 Morphology of iee erystals
Ice crystals growing from supercaoled aqueous solutions at at
mospheric pressure usually exhibit a hexagonal, plate-like shape.
The crystallographic c-axis is perpendicular to the basal plane
where 3 pairs of crystallographic a-axis make 60° angles with each
other. Ice crystals usually have a considerable growth anisotropy
as the linear growth rate in the c-axis direction is much smaller
than that in the a-axis direction. The morphology of ice crystals
is dependent upon many factors such as, supercooling, concentratien
of dissolved solids in the aqueous solution, hydrodynamic conditions
around the crystal during its growth, and whether or not the crystals
grow freely or upon a substrate.
Many investigators(20,52-56), have studied the morphology of
ice crystals grown freely in still, supercaoled water or supercaoled
aqueous solutions. At supercoolings < 0.9°C ice crystals grow as
circular discs( 20 ,55,56) until about 3 mm in diameter. In the next
growth stages the disc edges becomes notched, the shape becomes hex
agonal and finally a dendritic crystal with six arms developes . At
supercoolings between 0.9° and 2.7°C the same growth stages occur,
although dendritic growth sets in much earlier and the disc stage
can hardly be observed (54 , 56 ). At supercoolings > 2 . 7°C twelve pri
mary growth directionscan be observed (20 , 52 , 53) , six on each side
of the basal plane. The shape of the crystals is that of two symme
trically situated, hollow pyramids joined at their apices.
Pruppacher ( 54 ) found that the splitting of dendrite arms can occur
at supercoolings as low as 1°C, and showed that the angle of split
increases with increasing supercooling and increasing dissolved sol
ids concentration, until a limiting value of 60°. At supercoolings
2 1
> 5°C secondary and higher order splitting occurs and a three
dimensional ice netwerk is formed.
Ice growth in flowing water and aqueous solutions with supercool
ings up to 0.5°C has been investigated by Fernandez and Barduhn (57) ,
by Farrar and Hamilton(58), and in this laboratory(59). The ice crys
tals grow as thin platelets with a scalloped leading edge. Kawasaki
and Umano, (60 ) and Margelis and Sherwood(4 7) studied the growth of
ice crystals suspended in brine . Cooling was provided by evaporating
liquid butane drops. The average supercooling in the brine was about
0.002°C. The most frequently observed crystal shape was that of a
disc. Kawasaki found an average height over diameter ratio of 0.58,
while Margelis found 0.34. Some of the crystals produced by Margelis
had the double pyramid shape. He proposed that the splitting of these
crystalsoccurred at the surface of the butane drops, where the super
cooling was in the order of 1.5°C.
In the present investigation the growth of ice crystals suspended
in water, dextrose,and sucrose solutions was studied. The average
supercooling in the crystallizer was about 0.002-0.05°C. At the start
of the crystallization process, when the supercooling was 0.05-0.2°C,
very thin disk-like ice crystals could sometimes be observed. The
shape of the crystals produced at steady state conditions appeared to
be disk-like or spherical depending upon the process conditions. Some
possible explanations for the occurrenceof spherical crystals will be
given in chapter 5.
3.1.2 Crysta~ growth rate
As ice crystals grow in a supercocled aqueous solution water mol-
ecules are selectively removed from the solution. Consequently, the
thermodynamic activity of water molecules will be lower near the
crystal interface than in the bulk of the solution. For crystal growth
to proceed, water molecules have to be transported to the interface
and solute molecules away from it. Simultaneously with this mass trans
fer there will be a transfer of heat from the interface to the bulk,
since heat of crystallization that is released has to be removed.
Upon arriving at the interface water molecules are not built into the
lattice immediately since they have to evereome an energy barrier.
The molecules diffuse along the interface to find a preferred spot
where the energy barrier is low or else the molecules accuroulate at
the interface until a cluster is formed that is large enough to over
coroe the energy barrier and to forma two-dimensional nucleus.
22

In mass transfer by diffusion to or from a phase boundary the
mass flux of solute NA is commonly expressed in terms of a mass
transfer coefficient k(16):
( 3-1)
In this equation ei and eb are the solute concentrations at the in
terface anu in the liquid bulk respectively, e 1m is the logarithmic
mean value of ei and eb, p is the specific weight of the solution,
and NAB is the sum of the solute and solvent fluxes.
In case of growing crystals, k is not only dependent upon eperating
conditions, physical properties, and size of the crystals,but possi
bly also upon disturbances of the concentratien field at large growth
rates. For growth rates encountered in this study (< 10- 3 cm/sec) the
change in k due to this effect is always less than 10%. Since solute
is rejected at the interface,the net solute flux with respecttoa
coordinate system fixed at the interface, equals zero. NAB is then
equal to the net mass flux of solvent,-v p5
• After setting e 1m equal
to ei, t _he linear growth ra te v can be expressed by:
(3-2)
The heat flux at the interface can be written as:
(3-3)
where T. and T are the temperatures at the interface and in the bulk l. b
respectively, h is the heat transfer coefficient and óH the heat of
fusion per unit mass. These temperatures and the equilibrium tempera
tures that are used to describe crystal growth are schematically in
dicated in figure 3.1.
Figure 3.1 Temperature and equi~ibrium temperatures used to describe crysta~ growth
23

The kinetics of the inbuilding process are usually described
by an expression of the ferm:
v = kr(T -T . )p = kr 6T.P e ~ ~
( 3-4)
in which Te is the equilibrium temperature at the interface, kr is
the inbuilding rate constant, and p is the order of the inbuilding
process.
* Te is not equal to the equilibrium temperature Ti of a salution
with concentratien ei. The difference between Ti" and Te is dependent
upon the .interface curvature and the surface free energy o. T; -Te
can be expressed by the Gibbs-Thomson equation that was derived for
homogeneaus nucleation in chapter 2.2.1:
T ~ -T = 2o T .• I ( r p 6H) ~ e ~ e s
( 3-5)
where the effective interface curvature is indicated by re. This
equation is subject to the same objections that have been made befare
in chapter 2.2.1. Care must be taken t herefore in making quan t itative
predictions based on eq. (3-5).
In order to relate the driving force for mass transfer to the
bulk supercooling 6Tb, C. and eb will be expressed in terros of their ~ . .
respective equilibrium temperatures, Ti and Tb by means of the equi-
librium curve.
In the next paragraphs the respect i ve influences of curvature, in
building kinetics, and heat and mass transfer upon ice crystal growth
rates will be discussed.
3.2 Effect of curvature on equilibrium temperature
In chapter 2, a general relationship eq. (3-5) is derived between
the supercooling of a salution and the effective size re of a nucleus
that is in equilibrium with the surrounding solution. A crystal that
is larger than re has a chance > 50% that it will grow, while a pre
nucleus with a size < re has a chance > 50% that it will melt.
The interfacial free energy o may be different at various crystal
faces and along the crystal edges. In eq. (3-5) an average value of o
is used. Calculated values of o for the system ice-water at 0°c vary
due to different methods that are e mployed. From homogeneaus nuclea
tion experime nts Turnbull(61) found o = 32 ergs/cm2 . Fletcher ( 62)
found a value of o = 20 based on entropy considerations due to bond
reorientation during solidification. Hardy and Coriell (63J calculated
a value of 22 ergs/cm2
from morphological stability experiments. The
24
most straightforward method was applied by Ketcham (64) by measuring
the contact angle of water on ice. Ketcham found o=33 ± 3 ergs jcm2 .
Dissolved solids in the water phase and especially surfactants
might also influence the value of the interfacial free energy.Very
little is known however, about the influence of concentratien and
nature of dissolved solids on o. Hardy and Coriell(6 3) ascribed the
macroscopie roughening of ice crystals growing in the presence of
ionic salts at low concentrations to a large reduction of the sur
face free energy due to these salts.
For the interfacial free energy of the systems ice-water, ice
dextrose solutions, and ice-sucrose solutions, a value of 20 ergs/cm2
will be used in this study.
3.3 Inbuilding kinetics
The growth anisotropy that is usually exhibited by ice crystals
can be explained in terms of different inbuilding rates in the di
rections of the a- and c-axes. The kinetic orderpin eq.(3-4) depends
upon the inbuilding mechanism which can vary with surface conditions,
supercooling, and with dissolved solids concentration.
At low supercoolings the so-called lateral step growth mechanism
prevails. According to this lateral step growth mechanism, a crystal
surface advances perpendicularly to itself by steps that originate
from the intersectien of a screw dislocation with the growing sur
face(65,66), or by steps that originate from the nucleation of "pill
boxes" of monomolecular height on the otherwise molecularly smooth
interface, the creation of those surface patches being the main ener
gy harrier for growth(6 7-70). According to Hillig(?O) the linear
growth rate for growth from the melt can be written as:
(3-6)
where dm is the diameter of a molecule that is transferred from li
quid to solid, and w is the net mean frequency of such a transfer.
If this molecular transfer occurs by some kind of interface diffusion
process, w is given by:
( 3D l ( ](liS I /::,T ·1 w = l~ f~t R T.~J
m 1
( 3-7)
The first term on the right indicates the frequency with which mole
cules, in a medium having a diffusion coefficient D, strike an area
of molecular dimensions d 2 The factor fr in the secend term of the m .
25
expression indicates the fraction of molecules that are incorporated
into the crystal upon striking this area; fr is dependent upon inter
face orientation. The last term is the thermadynamie driving force.
Substitution of eq.(3-7) into eq. (3-6) yields:
V
3 fr D t:.S' t:.T. ~
d RT . m ~
(3-8)
At large supercoolings the interface becomes rough on a molecular
scale and every part of the interface can continuously advance per
pendicularly to the crystal surface(61,65,71,72). In this case fr be
comes unity and vis linearly dependent on !::.Ti.
For a screw dislocation mechanism the fraction fr of the total
area available for growth is given by:
dm ~ fr (3-9)
in which 4 TI ~ is the uniform spacing between turns of the spiral . «
r is the radius of a critica! size two-dimensional nucleus for which
in a similar way as for three-dimensional nuclei, (chapter 2.2.1) can
be derived:
• r a v m ( 3-10)
Substitution of eqs. (3-9) and (3-10) yields a second order relation
ship between v and !::.Ti for screw dislocation growth:
V = 3 D t:.s• 2
4 TI a RT. ~
t:.T. 2 V ~
(3-11) m
Crystal growth originated by two-dimensional nucleation on perfect
surfaces cannot be described by a simple power law model.
Cahn (7 3) distinguished three regimes: the lateral step growth
regime, the continuous growth regime, and a transitional regime. He
developed a theory to predict the supercoolings at which the transi
tions from one regime to another occur.
,
In the next p a ragraphs, correlations from literature for the lin
ear growth rates of ice crystals in the c-axis and a-axis directions
will be given for different supercooling regimes. Moreover, a oorre
lation for a-axis growth will be derived from experimental data deter
mined in our laboratory. Since dissolved solids can influence the
value of kr and the supercooling at which transition from one re9ime
26
to another takes place, special attention will be given to this sub
ject in the last paragraph.
3.3.1 C-axis inbuiZding aorreZations
The inbuilding rate in the direction of the c-axis is usually
determined from growth rates of ice crystals growing in capillary
tubes. Since the rate of heat transfer generally influences the growth
rate, one has to correct for this effect in order to find the rela
tienship between interface supercooling and growth rate.
Hillig(67) corrected only for the heat transfer resistance of
the tube wall, while Michaels(l8,74) corrected for the thermal resis
tance of the liquid boundary layer around the tube as well. These re
sistances are in the sameorder of magnitude(74).
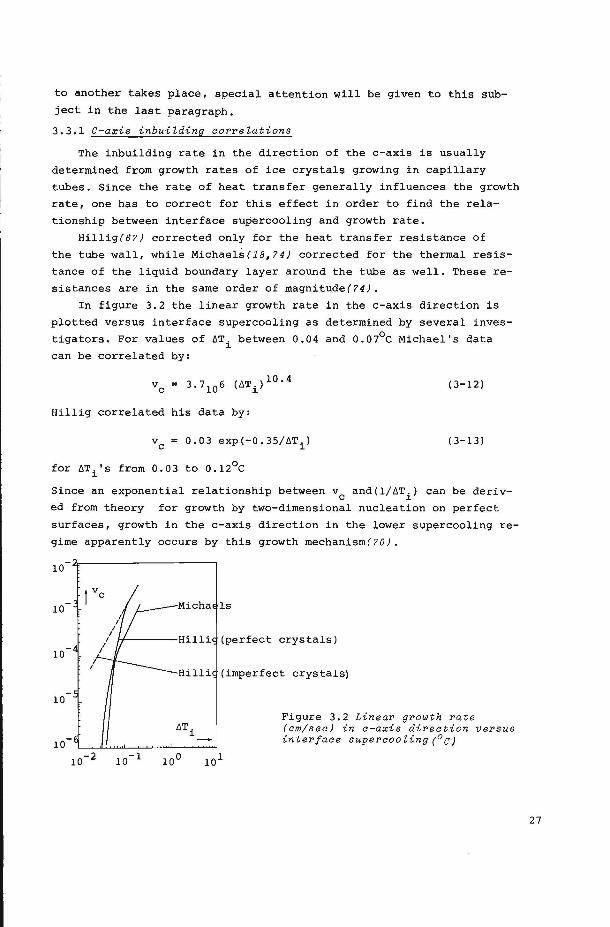
In figure 3.2 the linear growth rate in the c-axis direction is
plotted versus interface supercooling as determined by several inves
tigators. For values of öTi between 0.04 and 0.07°C Michael's data
can be correlated by:
(3-12)
Hillig correlated his data by:
0.03 exp(-0.35/öTi) (3-13)
for öTi's from 0.03 to 0.12°C
Since an exponential relationship between vc and(1/6Ti) can be deriv
ed from theory for growth by two-dimensional nucleation on perfect
surfaces, growth in the c-axis direction in the lower supercooling re
gime apparently occurs by this growth mechanism(70).
10
10
10
10
I I
Hilli (imperfect crystals)
Figure 3.2 Linear growth rate (am/sea) in a-axis direetion versus interface superaooZing(0 c;
27
This conclusion is supported by the fact that occasionall~ in this
supercooling regime growth also occurs at much higher growth rates
as a result of damaged crystals.
At values of óTi larger than approximately 0.1°C the crystal
surface is always imperfect. The growth rate correlations that are
found in this supercooling regime also describe the growth rates of
damaged crystals at lower interface supercoolings. For 0.07 < óT1 < 0.18 the data of Michaels(74) and Sherwood(18) can be correlated by:
V = 0.027(óT.) 2 c ~
(3-14)
while Sperry(47,75) found the following correlation:
(3-15)
Ketcham(76) corrected Hillig's data for the thermal resistance of
the tube wal!. This yields the following correlation:
V = 0.07(óT.) 1• 8
c ~ (3-16)
From these correlations it can be seen that for values of óT. > ~
0.1°C the c-axis growth rates are approximately second order in the
interface supercooling. This second order relationship can be explain
ed theoretically by· screw dislocation growth(65). For this growth
mechanism eq. (3-11) yield~ :
= 0.039 óT. 2 vc ~ (3-17)
3.3.2 A-axis inbuilding aorrelations
Many experirnental results for linear growth rates in the direction
of the a-axis of ice crystals growing from water and aqueous solutions
have been reported in literature. These growth rates have been deter
mined for ice crystals growing in capillaries(65,77-81)for ice crys
tals growing freely in still water and in still aqueous solutions(55,
82-88), and in flowing water and flowing aqueous solutions(57,58).
Since ice crystals growing in capillaries do not have flat growth
fronts, it is extremely difficult to correct for the tube wall and
boundary layer therrnal resistances. Therefore, only freely growing
ice crystals wil! be considered.
* The values used for the physical constants are given in appendix I.
28
3.3.2.1 Ice crys tal growth in s t ill water aná .1.ti ll aque ous s olu tions
The relationship between growth rate and interface supercooling
can be deterrnined frorn the experirnental data by rneans of a suitable
mathematica! model descrihing the ternperature and concentration pro
files around the freely growing crystals. The experirnental results on
free ice growth obtained frorn literature(5 ?,58) do not, however, pro
vide enough inforrnation about the exact shape of the growing crystals
and the conditions under which the experirnents were perforrned.
Therefore, experirnents were carried out in our laboratory to deter
rnine the a-axis growth rate of ice crystals growing freely in still
water and still aqueous solutions. Frorn the experirnental results cor
relations for the interface kinetics have been calculated by rneans of
three mathematica! rnodels. An extensive description of our experiment
al wo rk and of the mathematica! treatrnent by rneans of these three
roodels is given elsewhere(59). Only the results and sorne cornrnents will
be given here.
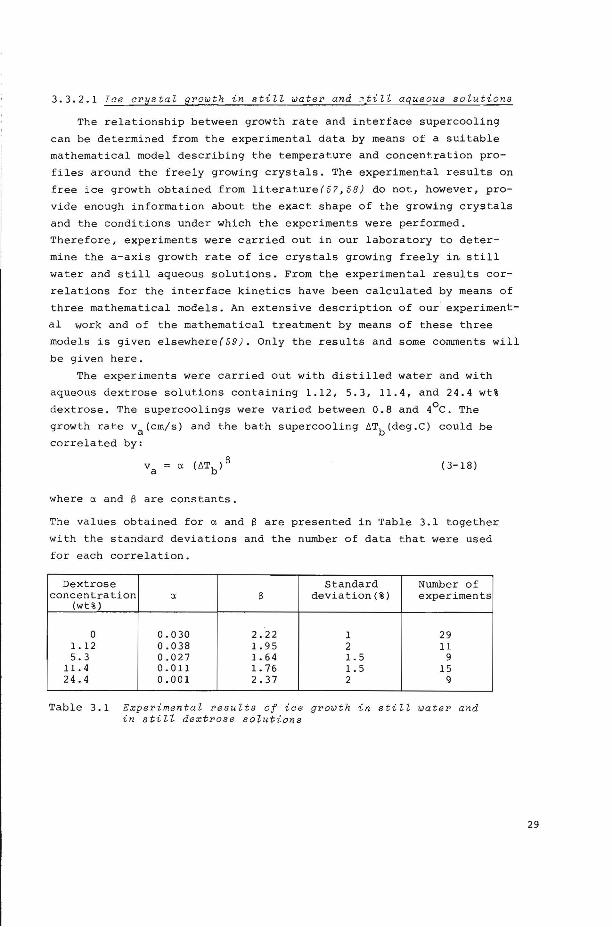
The experirnents were carried out with distilled water and with
aqueous dextrose solutions containing 1.12, 5.3, 11.4, and 24.4 wt %
dextrose. The supercoolings were varied between 0.8 and 4°C. Th e
growth rate va(crn/s) and the bath supercooling ~Tb(deg.C) could be
correlated by:
( 3-18)
where a and B are constants.
The values obtained for a and B are presented in Table 3.1 tagether
with the standard deviations and the nurnber of data that were used
for each correlation.
Dext rose Standard Nurnbe r o f concen t rat ien a 13 dev iation(%) e x perirne nts
(wt%)
0 0.030 2. 2 2 1 29 l. 12 0.038 l. 95 2 11 5 . 3 0.027 l. 64 1.5 9
11.4 0 .Oll l. 76 1.5 15 24.4 0.001 2 . 37 2 9
Ta ble 3.1 Experime n tal resuZ t s of ice growth in still wa ter and in st i ll dextrose s olu t i on s
29
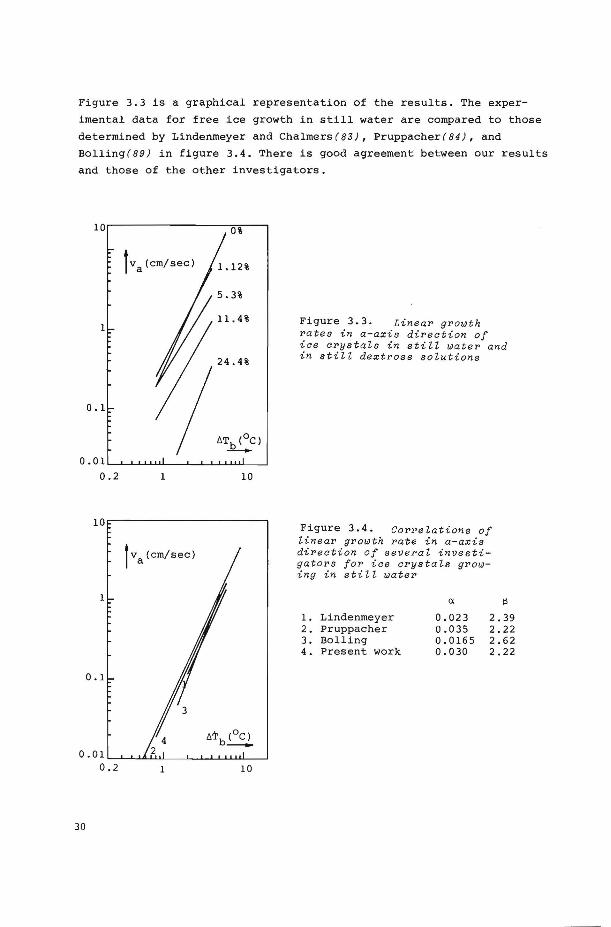
Figure 3.3 is a graphical representation of the results. The exper
imental data for free ice growth in still water are compared to these
determined by Lindenmeyer and Chalmers(83), Pruppacher(84), and
Bolling(89) in figure 3.4. There is good agreement between our results
and these of theether investigators.
fva(cm/sec)
1
0.1
0.01 0.2 1 10
10
fva(cm/sec)
1
30
Figure 3.3. Linear growth rates in a-axis direction of iae crystals in stil~ water and in still dextrose solutions
Figure 3.4. Correlations of linear growth rate in a-axis direction of several investigators for ice crystals growing in still water
a J;l
1. Lindenmeyer 0.023 2.39 2. Pruppacher 0.035 2.22 3. Bolling 0.0165 2.62 4. Present work 0.030 2.22
It has been attempted to obtain a correlation between interface
supercooling and experimentally determined growth rates using three
different roodels descrihing the temperature and concentratien fields
around growing dendrites:
a.Isothermal dendrite model according to Ivantsov(90) and Horvay and
Cahn(91).
In this model the surface of the dendrites is assumed to be iso
thermal. Ivantsov showed that for this boundary condition the
shape of the dendrite would be a paraboloid of revolution. This
shape is preserved during growth. For the calculations by means
of the isothermal dendrite model the equations used by Bolling and
Tiller(89) have been applied. The results for dendritical ice crys
tal growth in still water obtained from the isothermal dendrite
model can be correlated by:
0.064(AT.) 2 · 24 1
(3-19)
b.Nonisothermal dendrite model according to Bolling and Tiller, and
Temkin.
Independently of each other,Bolling and Tiller(89) and Temkin(92)
pointed out that due to the effects of the interface curvature and
inbuilding kinetics the interface of a growing dendrite is non
isothermal. This non~isothermal nature makes the actual steady
state shape of the dendrite deviate from a paraboloid of revolution
and an exact mathematica! salution becomes extremely complicated.
Therefore, the authors assumed only the tip of the dendrite to be
a paraboloid of revolution.
For mathematica! simplicity the inbuilding kinetics are assumed
to be first order. With a fixed kinetic order, 'there is one other
parameter that can be chosen to obtain agreement between theory
and experiments. For this parameter the surface free energy o is
selected. Application of the Bolling and Tiller model to our exper
imental results yields o=l3 ergs/cm2 as the best value, whereas
the Temkin analysis leads to o=l4 ergs/cm2 . With both roodels the
interface kinetics for growth of ice crystals in still water can
be described by:
(3-20)
c.Dendritic plate model according to Trividi.
31
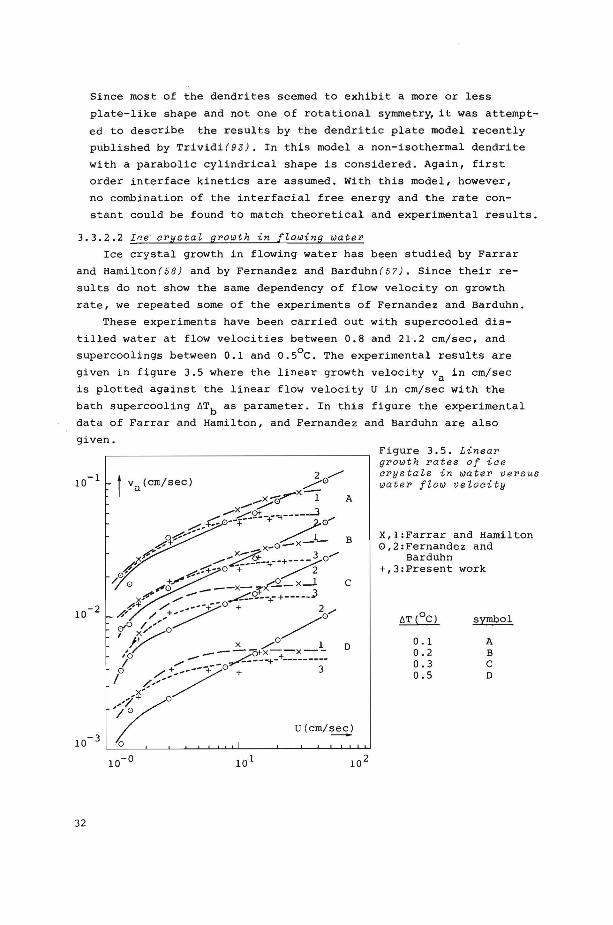
Since most of the dendrites seemed to exhibit a more or less
plate-like shape and not one of rotational symmetr~ it was attempt
ed to describe the results by the dendritic plate model recently
published by Trividi(9JJ. In this model a non-isethermal dendrite
with a parabalie cylindrical shape is considered. Again, first
order interface kinetics are assumed. With this model, however,
no combination of the interfacial free energy and the rate con
stant could be found to match theoretica! and experimental results.
3.3.2.2 Ice cPystal gPowth in [lowing wateP
lee crystal growth in flowing water has been studied by Farrar
and Hamilton(58) and by Fernandez and Barduhn(57). Since their re
sults do not show the same dependency of flow velocity on growth
rate, we repeated some of the experiments of Fernandez and Barduhn.
These experiments have been carried out with supercocled dis
tilled water at flow veloeities between 0.8 and 21.2 cm/sec, and
supercoolings between 0.1 and 0.5°C. The experimental results are
given in figure 3.5 where the linear growth velocity va in cm/sec
is plotted against the linear flow velocity U in cm/sec with the
bath supercooling óTb as parameter. In this figure the experimental
data of Farrar and Hamilton, and Fernandez and Barduhn are also
given.
t va (cm/sec)
A
c
D
U(crn/~
32
Figure 3.5. LineaP gPowth Pates of ice oPystals in wateP VePsus wateP flow velocity
X,1:Farrar and Harnilton 0,2:Fernandez and
Barduhn +,):Present work
óT(°C) symbol
0.1 A 0.2 B 0.3 c 0.5 D
From figure 3.5 it can beseen that the data of Fernandez and Barduhn
for all supercoolings can be correlated by va=u 0 · 5 f(óTb). The re
sults of Farrar and Hamilton cannot be described by this correlation,
but show a tendency to reach a maximum growth rate at high flow ve
locities, especially at low supercoolings. Our own results also show
this tendency toward a maximum growth rate, although they are more
scattered.
In order to check the inbuilding correlations, these maximum
growth rates are compared to the theoretically maximal growth rates
that can be obtained from eq.(3-19) and eq. (3-20) by substituting
6Tb for bTi. The values of the maximum growth rate predicted by eq.
(3-19) (isothermal dendrite model) appear to be lower than the exper
imental values at high flow veloeities by a factor five to fifteen.
Application of eq.(3-20) (non-isothermal dendrite model) on the
ether hand, yields maximum growth rates that are higher than the ex
perimental values by a factor of 70 to 140.
These large differences between the results obtained with both
the isothermal and the non-isethermal dendrite models, and the ex
perimental results,seriously question the usefulness of these den
ctrite growth models in predicting interface kinetics. Consequently,
an alternative method will now be applied in which it will be at
tempted to obtain the interface kineticsrelationship directly from
the experimental data of ice growth in flowing water.
For this method it has to be assumed that the inbuilding kine
tics do notchange with flow velocity, and that the freezing point
depression due to the interface curvature is a constant fraction of
the bulk supercooling. For this fraction a value of 0.25 has been
chosen (59) . With these two assumptions a constant value of the growth
rate at high flow veloeities can only be explained by the fact that
the resistance for heat transfer in the liquid becomes negligible
at high values of U.
For a negligible heat transfer resistance and a curvature effect
of 0.25 bTb the interface supercooling becomes 6Ti=0.75 6Tb. The
maximum growth rates for the various supercoolings are determined by
extrapolating the curves of va against U in figure 3.5 to very high
flow velocities. These maximum growth rates obtained from our exper
iments and these of Farrar and Hamilton can be correlated with the
calculated interface supercoolings by respectively:
0.27 bTi 1 ·55
0.47 bT. 1 · 68 l
(3-21)
(3-22)
33
where va is expressed in cm/sec and 6Ti in degrees centigrade.
These inbuilding kinetic relationships are obtained for growth
of ice crystals in water at interface supercoolings ranging from
0.05 to 0.4°C. In this range of supercoolings growth takes place,
according to Pruppacher,by lateral motion of steps originating at
screw dislocations. For this growth mechanism a parabalie kinetic
growth law is predicted by Hillig(65). The kinetic orders of 1.55
and 1.68 in eqs. (3-21) and (3-22) give reasonable support to this
suggested growth mechanism.
By means of Cahn's t.heory (73) , Pruppacher ( 84) calculated that
for ice crystals growing from pure water a lateral step growth mech
anism can be expected for 6T . < 0. 58°C. It. can be expected there~
fore that eqs. (3-21) and (3-22) hold for values of 6Ti <0.58~C as
long as the crystal surface does not become perfect.
Unfortunately,no growth rate measurements for ice crystals in
flowing dextrose solutions could be made since the ice dendrites
that were formed were very brittle and broke off befere growth rates
could be measured.
It. must be pointed out once more, however, that eq. (3-21) has
been derived from experimental data that show a quite different be
havior than the data of Fernandez and Barduhn, although the experi
ments were performed in a similar apparatus. These differences can
possibly be related to the way the crystals started to grvw in the
flowing stream. In our ·Work every experiment was performed start.ing
with a freshly grown crystal, while Fernandez and Barduhn carried
out experiments with one crystal that was melted back befere every
new experiment. It. is well known that by melting a crystal its in
terface may become pitted(94 ) . When such a crystal is thereupon sub
jected to growth, the inbuilding rate will be considerably larger
than that of a new crystal due to the large number of dislocation
sites. With such a high inbuilding rate growth of ice crystals in
the experiments of Fernandez might have been heat flow limited even
at higher flow velocities.
The effect of the dislocation density upon the inbuilding rate
is also relevant for the growth of very small crystals. Strickland
Constable(95 ) attributed the extremely small growth rates that are
sametimes observed with the growth of very small crystals to the
fact that these small crystals are often born in a very perfect statE
free from defects so that growth can only occur by the slow two
dimensional nucleation mechanism.
34
3.3.3 In[~uenae of so~ute aonaentration on inbuildi ng kinetias
When ice crystals grow from aqueous solutions solute molecules
build up at the interface. Simultaneously with heat trans·fer, a
transfer of solute molecules will take place away from the interface.
If the inbuilding kinetics and the freezing point depression due to
the interface curvature do not change with solute concentration,
then at a constant bulk supercooling (Tb -Tb) , the growth rate will
decrease with increasing solute concentratien due to an increasing
mass transfer resistance. Our experimental data presented in figure
3.3 show however, that the growth rate of ice crystals in solutions
with low solute concentrations can be enhanced above growth rates
in pure water at the same bulk supercooling. This increase in growth
rate at low solute concentratien has also been found by many other
investigators(18,74,85,86,87).
Apart from introducing a mass transfer resistance, the presence
of solute molecules may influence the growth rate in various other
ways. The presence of solute can change the value of the thermal
diffusivity. The freezing point depression éiue to the interface cur
vature can change with the presence of solutes. The inbuilding kine
tics may change because of the adsorption of solute molecules at the
crystal surface or because of changes in the mobility of water mole
cules at the interface.
The enhancement of the growth rate in the presence of certain
solutes usually takes place at solute concentrations between 10- 6
and 10- 3 molar. Pruppacher(85) pointed out that for concentrations
of less than 10- 3 molar the thermal diffusivity decreases only by a
few percent, which cannot account for the observed changes in growth
rate.
The change in freezing point depression due to interface curva
ture can result from a change in surface free energy. Hardy and
Coriell(6J) studied the morphology of ice crystals growing in aqueous
solutions of ionic salts. Some ammonium salts in concentrations of
10- 6 to 10- 4 were found to enhance the growth rate in the c-axis di
rection considerably, while the surface became macroscopically ex
tremely rough. 'rhey as cribed this roughening of crystals to a large
re:duction of the surface free energy •
Sears(96) and Pruppacher(BO) suggested that solute molecules can
be adsorbed at a crystál surface, thereby increasing the rate of
surface nucleation. On the other hand it is possible that solute mole
cules adsorb at dislocation sites that were already available at
35
the crystal surface. The first effect tends to increase the growth
rate while the latter poisoning effect tends to retard it. Adsorption
of solute molecules onto a perfectly smooth basal plane could be a
factor in causing the surface to become imperfect. Transition from
a two-dimensional nucleation mechanism to a dislocation mechanism
or continuous growth mechanism would increase the growth rate.
Since growth in the c-axis direction is kinetically more sensi
tive than in the a-axis direction it can be expected that alteration
of the interface kinetics occurs more readily for c-axis growth.
Enhancement of the c-axis growth rate has indeed been found in aqueous solutions of sucrose(86,87), ammonium iodide:lB), lithium iodide,
several fluorides, and polyacrylic acid(74) at molar concentrations
between 10- 4 and 10- 1 • The growth rate in the a-axis direction is
enhanced insome fluoride solutions, but is retarded in others(85,86).
An enhancement of the a-axis growth rate is also found for growth
of ice in diluted sucrose solutions(86). The most plausible expla
nation for the increase in growth rate at low sucrose or dextrose
concentrations seems to be that sugar molecules decrease the sur-
face free energy.
As the sugar concentration increases, the inbuilding of water
molecules into the crystal lattice might be retarded largely due to
the fact that a larger fraction of the total area available for
growth is occupied by adsorbed sUgar molecules. This effect is ac
counted for by a large reduction of the factor fr in eq.(3-8). The
inbuilding rate constant in this equation will also be reduced due
to a decrease in the diffusion coefficient D.
3.4. Heat and mass transfer coefficients
3.4.1 Correlations for heat and mass transfer aoe[[ia\ents
Coefficients for heat and mass transfer from a rigid spherical
partiele to the surrounding fluid can be calculated from correlations
of the type:
(3-23)
where Sh is the partiele Sherwood number (mass transfer) or the
partiele Nusselt number (heat transfer) , Sc is the Schmidt number
(mass transfer) or the Prandtl number (heat transfer) and Re is the
partiele Reynolds number. Re is defined as:
Re ( 3-24)
36
in which p is the specific density of the fluid, u is the dynamic
viscosity of the fluid, ~ is the partiele size, and vslip is the
slip velocity between partiele and fluid. According to Keey and
Glen ( 9?) c1
, c2
, c3
, and c4
are not constant, but depend upon Re,
while c 4 also depends upon Sc.
Slip veloeities between particles and fluid in agitated tanks
have been determined both experimentally and theoretically.
Schwartzberg and Treybal(98Jmeasured fluid veloeities and partiele
veloeities in baffled turbine agitated vessels using streak photo
graphy. The partiele and fluid velocity data were compared with val
ues calculated from a theoretica! model. In this model differential
equations descrihing partiele motion in a turbulent field, similar
to those applied by Hinze ( 99) and de Graauw(lOC .', were solved. 'fhey
found that the theoretica! and experimental partiele and fluid velo
city data agree well. However, the partiele-to-fluid mass transfer
coefficients calculated from the slip veloeities appeared to be too
low, especially for very smal! particles. It has to be concluded
therefore, that mass transfer in stirred tanks cannot be adequately
described in terms of the slip velocity model only.
Barker and Treybal(lOJJ, and Sykes and Gomezplata(J02) bypassed
the difficulty of unknown slip velocities. They used heat and mass
transfer correlations in which the Reynolds number was based upon
the impeller diameter and impeller speed. The applicability of these
correlations, however, is limi·ted to certain specific geometrical
conditions of the agitated system, such as: tank shape and size, im
peller type, liquid depth, and size and number of baffles.
The fact that the slip velocity model does not satisfactorily
describe mass transfer in stirred tanks can be attributed to the
fact that eq. (3-23) is only valid for steady state mass transfer.
With a modified penetratien theory Harriott ( lOJ ) showed that tran
sient effects can also be important, especially for smal! particles
and for small density differences between particles and fluid.
Harriott suggested that only the very small scale eddies, the pro
perties of which are determined by the local dissipation rate, might
influence the transfer rates. He was able to correlate his mass
transfer data on the basis of the power input of the impeller P. The
power input was calculated from the well known Rushton correlation
(1 04) :
p Po nr 3 D. 5 1 °susp ( 3-25)
37
where nr is the impeller speed, Di is the impeller diameter, and
psusp is the specific weight of the suspension. The power number Po
was assumed to be independent of the tank-diameter impeller-diameter
ratio.
From the workof several investigators, Calderbank(1 05) could
also correlate heat and mass transfer data with the average power
input of the impeller per unit mass of suspension E:
( 3-26)
Most of the data used for this correlation, however, were results
for mass transfer from fixed surfaces.
The most complete correlations for heat and mass transfer from
suspended particles to the surrounding fluid on the basis of the
average agitation power per unit mass of suspension are given by
Brian.Sherwood,and Hales (106). They corrected their experimental re
sults and the data of Harriot and several other investiqators for tran
sient effects. These transient effects can be caused by a changing
partiele diameter and by the transpiration velocity at the surface
of growing or melting particles. Brian's results corrected for tran
sient effects are presented in figure 3 . 6, where the Sherwood num
ber (Sh or Nu) divided by the cube root of the Schmidt number(Sc or
Pr) is plotted versus the cube root of the specific power g roup
( E ~ 4;v 3 ). From figure 3.6 it can be seen that a fairly good corre
lation is obtained, but that the influence of the Schmidt (or Pr)
group is probably less than the 1/3 power that was used.
In order to obtain one generalized correlation for all data
given in figure 3.6, dimensionless groups of the forms Sh/Scn and
(Sh-2)/Scn were plotted against the specific power group ( E ~ 4; v 3 ). The best fit was obtained for (Sh-2/Sc0 · 25 ). The results of this
corre lation for heat and mass transfer are given in figure 3.7 and
can be approximated by:
and
Sh = 2 + 0.4( E ~ 4/v 3)0. 2 43 Sc 0.25
( 3-27)
f or ( E .Q.4
/ v 3) > 106
The constant 2 in this correlation has no fundamental meaning for
heat and mass transfer in suspensions, as will be pointed out in
chapter 3.4.2. Figure 3 . 7 shows that heat and mass transfer data
obtained at different hydrody namica! conditions in agitated systems
38
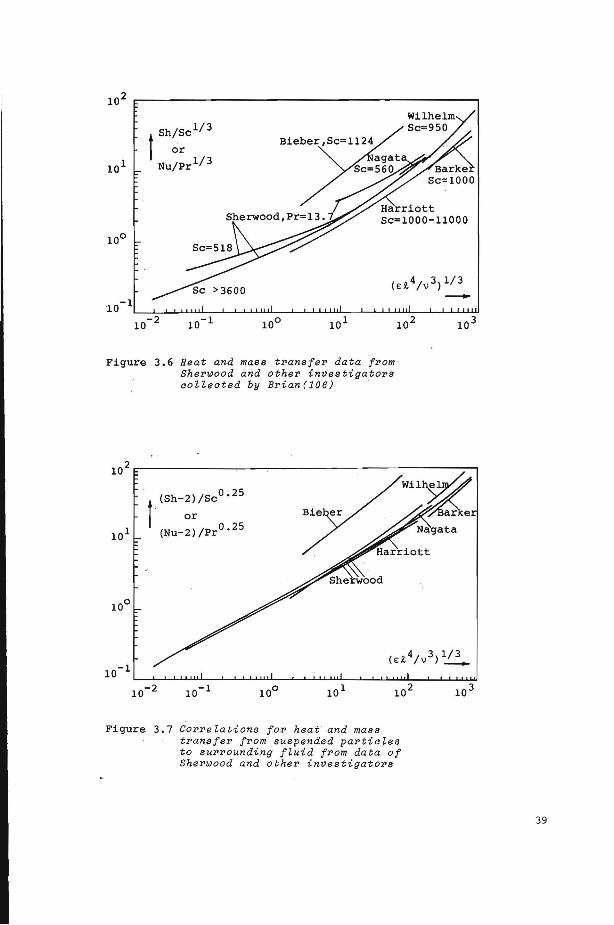
Sh/Sc1/ 3
t or Nu/Pr113
Figure 3.6 Heat and maee transfer data from Sherwood and other inveetigatore ao~~eated by Brian(106)
(Sh-2)/Sc0 · 25
f or (Nu-2) /Pr0
· 25
Figure 3.7 Cor~eZations for heat and maee transfer from suspended partia~es to surrounding f~uid from data of Sherwood and other investigators
39
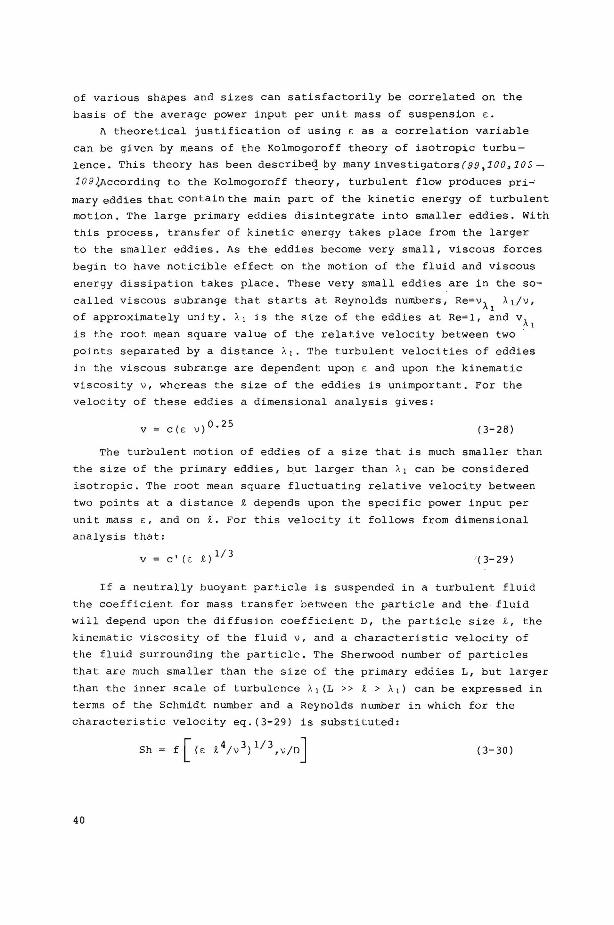
of various shapes and sizes can satisfactorily be correlated on the
basis of the average power input per unit mass of suspension ~.
A theoretica! justification of using ~ as a correlation variable
can be given by means of the Kolmogoroff theory of isotropie turbu
lence. This theory has been describe<'!_ by manyinvestigators(99,100,105-
1 09}.According to the Kolmogoroff theory, turbulent flow produces pri-·
mary eddies that contain the main part of the kinetic energy of turbulent
motion. The large primary eddies disintegrate into smaller eddies. With
this process, transfer of kinetic energy takes place from the larger
to the smaller eddies. As the eddies become very small, viscous forces
begin to have noticible effect on the motion of the fluid and viscous
energy dissipation takes place. These very small eddies are in the so
called viscous subrange that starts at Reynolds numbers, Re= vÀ1
À1 /v,
of approximately unity. À1 is the size of the eddies at Re=l, and vÀ1
is the root mean square value of the relative velocity between two ·
points separated by a distance À1 • The turbulent veloeities of eddies
in the viscous subrange are dependent upon ~ and upon the kinematic
viscosity v, whereas the size of the eddies is unimportant. For the
velocity of these eddies a dimensional analysis gives:
v = c(~ v )0.25 ( 3-28)
The turbulent motion of eddies of a size that is much smaller than
the size of the primary eddies, but larger than À1 can be considered
isotropic. The root mean square fluctuating relative velocity between
two points at a distance ~ depends upon the specific power input per
unit mass ~, and on ~. For this velocity it fellows from dimensional
analysis that:
V = C 1 ( E: ~) 1/3 1( 3-29)
If a neutrally buoyant partiele is suspended in a turbulent fluid
the coefficient for mass transfer between the partiele and the . fluid
will depend upon the diffusion coefficient D, the partiele size ~ . the
kinematic viscosity of the fluid v, and a characteristic velocity of
the fluid surrounding the particle. The Sherwood number of particles
that are much smaller than the size of the primary eddies L, but larger
than the inner scale of turbulence À1 (L >> ~ > À1 ) can be expressed in
terros of the Schmidt number and a Reynolds number in which for the
characteristic velocity eq.(3-29) is substituted:
Sh ( 3-30)
40
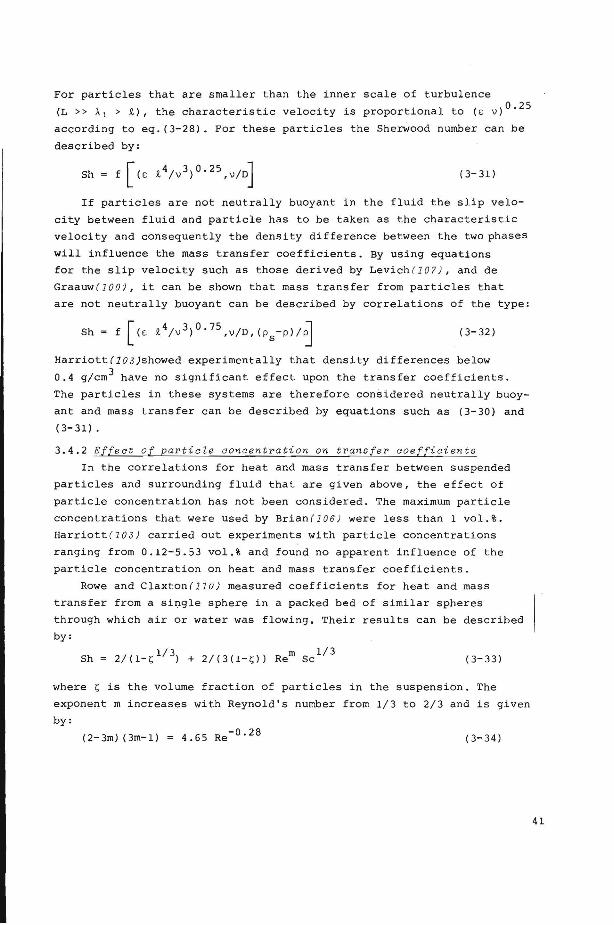
For particles that are smaller than the inner scale of turbulence
(L >> À 1 > t), the characteristic velocity is proportional to (E v)0 · 25
according to eq. (3-28). For these particles the Sherwood number can be
described by:
( 3-31)
If particles are not neutrally buoyant in the fluid the slip velo
city between fluid and partiele has to be taken as the characteristic
velocity and consequently the density difference between the two phases
will influence the mass transfer coefficients. By using equations
fortheslip velocity such as those derived by Levich (10 7 ), and de
Graauw(lOO), it can be shown that mass transfer from particles that
are not neutrally buoyant can be described by correlations of the type:
Sh = f [(c t 4;v 3 ) 0 · 75 ,v/D,( ps-p)/~ ( 3-32)
Harriott(lOJ )showed experimentally that density differences below
0.4 g/cm3 have no significant effect upon the transfer coefficients.
The particles in these systems are therefore considered neutrally buoy
ant and mass transfer can be described by equations such as (3-30) and
( 3-31).
3.4.2 Effe ot of partiele oonoentra t ion on transfer ooef[ioien t s
In the correlations for heat and mass transfer between suspended
particles and surrounding fluid that are given above, the effect of
partiele concentratien has not been considered. The maximum partiele
concentrations that were used by Brian(1 06) were less than 1 vol.%.
Harriott(10 J) carried out experiments with partiele concentrations
ranging from 0.12-5.53 vol.% and found no apparent influence of the
partiele concentratien on heat and mass transfer coefficients.
Rowe and Claxton(11 0) measured coefficients for heat and mass
Sh = 2/(1-ç 113J + 2/(3(1-Ç)) Rem sc113
( 3-33)
where ç is the volume fractio n of particles in the suspension. The
exponent m increases with Reynold' s number from 1/3 t o 2/3 and is given
by:
(2-3m) (3m-1) 4.65 Re- 0 · 28 ( 3-34)
41

Equations (3-33) and (3-34) have been determined for values of ç
ranging from 0.26 to 0.63 and for Reynold's numbers between 2 and
2000.
Harriott(lllJ calculated mass transfer ëoefficients for particles
in a stagnant fluid. He assumed that each partiele was surrourided by
a circular envelope of stagnant fluid whose volume is in the same
ratio to the partiele volume as the ratio of volumes in the entire
suspension. The results are presented in figure 3.8 together with
Rowe and elaxton 's results·. -The Sherwood number is plotted versus the __
volume fraction of particles in the suspension for a Schmidt number
of 1000 and Reynold's numbers of 0, 10, 100, and 1000. It has to be
born in mind that the cases for Re = 0 are purely theoretical since
Re 0 can only be attained if free conveetien effects would be entire
ly absent. The I difference between the limiting values calculated by
Harriott and by Rowe arises from the fact that Harriott defined the
mass transfer coefficient in terms of a concentratien difference
(ei-ë) while Rowe _used (ei-eb), where ei, eb, and ë are respectively
the interface concentration, the bulk concentratien and average con
centration. From figure 3.8 it can be seen that in all cases the Sher
wood number increases with increasing partiele concentration.
I Sh
100 --------------------
-----------------------
Re=1000,Rowe
Re=loo, Rowe
Rowe
Rowe ----10 ,-- Re=O ,Harriott
/:_::::::-::::::::..~~~ Re=O, Rowe
Figure 3.8 effeat of partia~e aonaentration in vo~.% upon Sherwood number for Sa=lOOO
",, ... -1/
ç
eornish(112) showed that due to the presence of ether particles
the minimum possible theoretical value of the Sherwood (or Nusselt)
number may be much less than 2. For example, by considering heat trans
fer in a stagnant medium from a sphere that is surrounded by similar
spheres to a heat sink at infinite distance, eornish found that the
minimum theoretical value of the Nusselt number approaches zero as the
42

partiele concentratien becomes very large. The heat transfer coeffi
cient was defined in terms of the temperature difference between the
surface of the sphere and the sink. In any practical situation, however
the fluid is nat stagnant and by flowing through the array it acts as
a sink, as was assumed by Harriott( lll) , and by Rowe (llO) . The limit
ing value of the Sherwood number can then be obtained by letting the flow velocity approach zero.
For this study the influence of partiele concentratien on heat and
mass transfer coefficients will be described by means of correction
factors similar to those used in eq. (3-33). Equation (3-27) then becomes:
for
( 3-35) Sh for ( r. R. 4/ v3) > 106
Although these correction factors were only determined for
.26 < ç < .63, eq.(3-35) will be applied for values of ç < .26
as well.
3.5 Conclusions
1. ree crystals have two main crystallographic directions.
The linear growth rate in the direction of the crystallographic
a-axis is usually much iarger than the linear growth rate in
the c-axis direction.
2. The temperature of a liquid phase in equilibirum with an ice
crystal depends upon the interface curvature of the crystal
and upQU she interfacial free energy a . This is quantitativcly
expressed by the Gibbs-Thomson relationship eq. (3-5). This
relationship is subject to serieus objections since inter
face curvature and a are rather ill-defined on a molecular
scale. Because of the lack of other theories, however, eq.
(3-5) will be used with a value fora of 20 ergs j cm2 .
3. From literature it is found that at interface supercoolings
óT i that are smaller than 0.1°C the inbuilding mechanism for
ice crystal growth in the direction of the c-axis is by two
dimensional nucleation on perfect surfaces. The growth rate
can then be c orrelated to óTi by an exponential relationship
eq.(3-13). For 0.1 < óT i < 0.2 (and in case of damaged crys
tals for lower values of óT;l the inbuilding occurs by a screw
43
dislocation mechanism. In these cases a second order relation
ship such as eq. (3-14) results for the inbuilding kinetics.
4. Experiments have been performed to obtain a-axis growth rates
for ice crystals growin g freely in st i ll water and still aque
ous dextrose solutions, and for ice crystals growing freely
in flowing water. The experimental results in still wat er a nd
still aqueous solutions agreed wel! with the results o f other
investigators. The linear growth rates of ice c rysta ls in flow
ing water increased with increasing flow rate until a limiting
value was reached at high flow rates. This same tendency was
measured by Farrar and Hamilton, while Fernandez and Barduhn
did riot find a tendency toward a maximum growth rate.
5. Three theoretica! roodels have been used to obtain an inbuild
ing;kinetics relationship from the experimentally determined
growth ratesof ice dendrites in stil l water and still dextrose
solutions. The Trividi model did not yield any correlation at
all. By means of the correlations obtained wi t h the o t her two
roodels an attempt was made to predict the maximum attainable
growth rates of ice crystals in flowi ng water. Since t h e maximum
growth rates predicted by bath roodels differed more t han a factor
of five from the experimental results,an alternative methad is
proposed to obtain a relationship for the .inbuilding kinetics.
6 . An inbuilding kineticsrelationship for growth in the a-axis di
rection eq. (3-21) is derived from t he maximum growth rates of
ice crystals in flowing water at high flow veloc ities. This re
l a tionship is derived for dendritic ice growth in flowing wat e r
at interface supercoolings between .05 and .4°C.
7. The enhancement of the growth rate due to the presence o f dex
tro s e at low c oncent rations c a n be e xplaine d by eithe r a reduc
tion in surface free energy or by an i ncrease in the dislocatio n
density due t o adsorption of dextrose molecules. At high dextrose
conc entratien the density o f adsorbed dextr ose molec u les might
become so large that these molecules s t art hindering the inbuild
ing of water molecules.
8. Liter ature on correlations f or h e at and mass t ransfer from sus
pended particles to the surrounding fluid has been reviewed.
44
By means of the Kolmogoroff theory of isotropie turbulence it i s
made plausible that ge nera l c o rrelatio ns for transfer c oeffic i e nts
can be obtained by correlating these coefficient s with the power

input per unit mass of suspension. The results of Brian and Sher
wood, and of other investigators are correlated with the general
expression(3-27).
9. Most investigators found an increase in transfer coefficients
with increasing partiele concentration. The effect of partiele
concentratien as determined by Rowe is incorporated in the gen
eral correlation: to yield eq. ( 3-35) •
45

CHAPTER 4
CRYSTAL SIZE DISTRIBUTION
4.1 The population balance
For a mathematical model of the crystallization processes net
only energy and material balances must be considered, but ene addi
tional conservation law is needed for a complete description of the
crystal size distribution. This size distribution is dependent upon
the rate of nucleation, the growth rate, and . rate of disappearance
of crystals. The crystal size distribution will be characterized by
means of a so-called numbers or population balance.
For the derivation of the population balance it is assumed that
the crystals maintain their shape upon growth. The crystals can there
fore be characterized by ene linear dimension i. The size distrihu
tien will be described in terms of the population density n, which
is assumed to be a continuous variable. n is defined as:
n = n(i) lim t.N
t.i-+-0 t.i (4-1)
in which t.N is the number of particles in the size interval between
i and i+t.i. A general population balance for an arbitrary suspension
of cr~stals in the size range i1
to t2
has been derived by Randolph
and Larson(5). In this derivation they assumed that no nucleation
and no partiele breakage occurs in the size range.
Accumulation input-output in this size range yields:
(4-2)
in which V is the suspension volume and n, nf, and n0
are the popu
lation densities of respectively, the suspension in the crystallizer,
and the input and output streams. ~f and ~0 are the volumetrie flow
rates of feed and outlet streams. The population densities are ex
pressed per unit volume of suspension and have therefore, the dimen
sion t - 4 • By a repeated use of Leibnitz's Rule totheleft-hand side
of eq. (4-2) and by assuming a constant suspension volume Randolph and
Larson (5 ) derived:
V f [-~~ + ~ t (n ~~~ dV 1-~f nf+~o
46
n 0
0 (4-3)
If it is assumed that the suspension is ideally mixed, n and the
growth rate v = ~~ are independent of position in the crystallizer.
With the additional simplification that the feed stream to the crys
tallizer contains no crystals (nf = 0) eq. (4-3) becomes:
an + a no at äi (n v) - 1 0 (4-4)
in which 1 = ~0/V is the mean residence time of the product crystals.
The crystal size distribution is completely specified by heat and
mass balances over the crystallizer, and eq. (4-4) with proper boun
dary and initia! conditions. This set of equations is difficult to
solve(ll3) since it contains a partial differential equation for
n(~,t). In most cases, however, a variatien of the moments of the
size distribution with time gives enough information. By using these
moments Hulburt and Katz(114) shbwed that the partial differential
equations can be transferred into a set of ordinary differential
equations. The moments of the crystal size distribution are defined
as: '\,
110 = I n d~ total number of crystals per unit volume of suspension (4-5)
0 '\,
IJl J ~ n d~ total length of crystals per unit volume of suspension (4-6)
'\,
ka IJ2=ka I ~2n d~ total crystal surface per
0 unit volume of suspension (4-7)
'\,
kv IJ3=kv I ~3n d~ total crystal volume per unit volume of suspension (4-8)
0
where 111
is the ith moment of the distribution, and ka and kv are
the surface and volumetrie shape factors respectively. By multiplying
eq. (4-4) by ~i d~ and integrating from 0 to"' for i = 0,1,2, 3 four
ordinary differential equations in 110
, 111
, 112
, and 113
can be obtained.
These equations have to be solved simultaneously, together with the
proper heat and mass balances as will be shown in chapter 6.
The population density balance eq.(4-4), can be simplified by
means of the following assumptions:
47
1. the crystallizer operates at steady state(~~ = 0).
2. the linear crystal growth rate vis independent of the crystal
size(v + v(~)). This is called McCabe's ~L law.
3. product crystals are removed without classification: n0= n.
Eq. (4-4) then becomes:
dn _!}_ V dR. = 1: (4-9)
If ncr is the population density of nuclei which are assumed to be
particles of critical size R.cr' integration of eq. (4-9) gives:
(4-10)
If the logarithm of n is plotted against R., a straight line with a
slope -1/v 1: results. From this slope the growth rate v can be deter
mined. The intercept at ~ = ~er is the nuclei density ncr
The nucleation rate J simply fellows from:
J = n .v er (4-11)
Timm and Cooper (115) determined crystal size distributions for differ-
ent systems in a laboratory stirred tank crystallizer eperating at
steady state. In spite of all the simplifications, eq. (4-10)describes
their data very well. Crystal size distributions from many other
systems, however, and particularly those obtained from industrial
crystallizers cannot satisfactorily be described(116, 11 7) by eq. (4-10).
Deviations especially occur at small crystal sizes. In the following
paragraphs the effects of "nonideal behavior" upon crystal size dis
tribution and average product size will be discussed briefly by scru
tinizing the simplifying assumptions that lead to eq. (4-9).
4.2 Size dependency of the growth rate
In chapter 3 it was pointed out that three basic steps are invol
ved in crystal growth: mass transfer, inbuilding of molecules into
the crystal lattice, and heat transfer. If heat or mass transfer are
rate determining steps, the crystal growth rate will generally be de
pendent upon crystal size. Only for very large crystals, when the
condition (E t 4;v 3) > 106 is satisfied, can it be deduced from eq.
(3-27) t hat heat and mass transfer coefficients are hardly dependent
on crystal size.
48
For very small crystals the transfer coefficients become large
and the growth rate is inbuilding controlled. However, even for in
building controlled growth the growth rate can be size dependent as
has been pointed out by Strickland-Constable(95): small crystals are
often formed in a dislocation-free state. Upon growing these crystals
may become imperfect as a result of which the growth rate increases.
Furthermore, if crystals are in the order of the critical size, the
growth rate will be reduced considerably due to the Gibbs-Thomson
effect described in chapter 3.2.
Several authors(118-123 ) have proposed empirica! size-dependent
growth rate equations. In order to be able to solve the differential
equations for the moments of the size distribution, simple correla
tions such as: v = c sa ~b, v = c v (l+a~)b, and v c v ( l+(a~)b ) er er
are used(118,119), in which a, bandcare constants, and ver is the
growth rate of nuclei. Other relationships are suggested by Canning
and Randolph ( 123) who use a polynomial expansion in ~ and by Estrin
and co-workers(1 20) who employ different size independent relation
ships in various size ranges. Senden(122) solved the differential
equations for the moments of the size distribution by using a growth
rate correlation of the form:
V = cl + c2/~ + c3/i2 (4-12)
in which cl, c2,and c3 are linear functions of the supercooling.
The advantage of using eq.(4-12) is that the Gibbs-Thomson effect
can be taken into account.
4.3 Classified product removal
In order to obtain narrow crystal size distributions many indus
trial crystallizers are provided with some kind of classification de
vice. In general, there are two types of classifying crystallizers
available. In the first type classification takes place in the crys
tallizer itself. The Oslo crystallizer is an example of this t ype.
Since supersaturation and therefore also growth rate and nucleation
rate change with position in the crystallizer, crystal size distri
butions obtained from this type of crystallizer are very difficult
to predict mathematically.
In the second type of classifying crystallizer classification
takes place by external means, such as hydrocyclones, sereens or elu
triators. The crystal size distribution of this type of crystallizer
has been described by several investigators ( 124-12 8) by using the
population balance concept for an ideally mixed crystallizer at stead y
state conditions. It has been found (124, 12 8) that the weight aver-
49
age crystal size produced from·classifying crystallizers is in
many cases smaller than from non-classifying crystallizers eperati ng
at the same production rate and suspension concentration. Classified
product removal should only be applied therefore, if narrow size dis
tributions are required.
4.4 Nuclei removal
A frequently employed method to increase partiele size in a
crystallizer is by fines destructien i.e . by reducing the net nucle
ation rate. This can either be achieved selectively by removing fines
from the crystallizer by some kind of elutriation device (l2 4,1 27 , 128)
and subsequently completely redissolving these fines, or in a non
selective type of fines trap where partial dissalution of the whole
population of crystals occurs (127 ,12 8).
By means of the population balance concept, Nauman and Szabo(l 27)
calculated for a size-independent dissalution rate that the selective
fines trap can give a dramatic impravement in crystal size, whereas
the non-selective type gives much less increase in crystal size. The
dissalution rate, however, is .size dependent and the non-selective
fines trap is in fact selective in the sense that the sm~llest cry s
tals have the largest dissalution rate.
Randolph(l24) showed that the amount of size impravement due to
a fines trap is dependent upon the nucleation sensivity as given by
the parameter i, defined by:
(4-13)
where c is a constant. For a given fraction of fines removed
Randolph calculated that the average partiele size increases with
decreasing value of i. This is due to the possibility of eperating
the crystallizer at a higher level of supersaturation.
4.5 Staging
A narrowing of the crystal size distribution can also be obtained
by using a series of staged vessels in addition to classification or
nuclei removal. The crystal size distribution from such a system c an
be calculated from known nucleation and growth rate kinet ics, and
from heat, mass, and population balances for each vessel. Crystal
size distribution from staged ideally-mixed vessels have been deter
mined mathematically by several investigators. The following cases
were described: size dependent(130 ) and size independent growth (5,124 ,
131,1 32) , supersaturations the same in each vessel (130,1 3 1) or
50
different(5,124,132), and nucleation only in the first tank
(130,131,133), or in every tank (116,124).
When nucleation or seeding only takes place in the first tank
narrower partiele size distributions are obtained than with nucleation
in every tank(133). Extreme narrowing can be obtained when classifi
cation takes place between the stages(l33). The application of stag
ing , however, has the disadvantage that mean partiele size(l24,131) • or production capacity(lJO) slightly decrease.
4.6 Non-ideally mixed tanks
One has to be very caretul in using the concept of an ideally
mixed tank if phenomena that can be very nonlinear, such . as nuclea
tion, occur. Especially those regions where supersaturation is brought
about by cooling or evaporation or where a supersaturated feed stream
enters the crystallizer have to be mixed well with the rest of the
suspension. Even at mixing times that are very small compared to the
mean residence time, local high supercoolings or supersaturations
cannot be prevented. These large 6C's can be the main souree of nu
cleation (l28) . In addition to this mixing effect,the residence time
distribution may vary considerably from that of an ideally mixed tank,
and the residence time distributions of solid phase and mother liquid
can be different.
One method that is commonly used to describe the effect of non
ideal mixing conditions upon residence time distribution and crystal
size distribution is based upon the assumption that the flow in the
crystallizer passes through various interconnected regions with plug
flow or ideally-mixed flow conditions(133,134). This type of method
can be useful in those cases where the physical picture clearly indi
cates regions with specific types of flow and specific conditibns
such as óC, X, and p.
Another approach to describe non-ideal mixing is by considering
the degree of micromixing of the suspension. Micromixing was first
describedbyDanckwerts(134) who considered the extreme case of com
plete microsegregation. Becker and Larson (133) applied Danckwert's
model to a crystallizing suspension. The flow through a continuous
crystallizer was assumed to be made up of many small volume elements
that do not intermix and that act as small batch crystallizers. The
residence time distribution of these volume elements was taken as that
of an ideally-mixed, stirred tank. For a nucleation rate that is first
order in supersaturation they calculated a larger mass average crystal
51
size than would be obtained from an ideally micromixed crystallizer.
Micromixing can also be described by computer simulation. The
mixing process is thereby simulated by volume elements that coalesce
andredisperse during their stay in the reactor. A variatien to this
approach was used by Senden(122). In his approach crystals are gener
ated in a volume element of the crystallizer with a probability de
pending upon the supercooling of that element. Every crystal has a
residence time assigned to it with a probability given by a certain
residence time distribution. Subsequently, the life of each crystal
is simulated as it comes in areas of various supercoolings where
growth or melting occurs.
4. 7 Crystal breakage
The effect of breakage on the crystal size distribution was stud
ied by Randolph(135). He accounted for breakage by means of a "birth"
function B and a "death" function De. For this case the population
balance eq. (4-4) then becomes:
<ln () no at+ ai(vn)- -r + De - B = 0 (4-14)
For the death function it is assumed that the fraction of crystals
that disappear out ~f a certain size range by breakage is linearly
proportional to the population density in that size range and propor
tional to the size of the crystals to a power m:
De = c n 9-m (4-15)
The birth function B depends upon the way crystals break. Three cases
were considered:
1. pure attrition model: the part that breaks off is very smal! and
is considered to have the critica! size; the change in size of the
mother crystal is negligible. For this case, the shape of the
crystal size distribution remains unchanged, but the average size
of the product crystals reduces because of a higher effective nu
cleation rate.
2. equal size model: when breakage occurs two pieces of equal size
result. This kind of breakage can change the crystal size distri
bution considerably, but is not very likely to occur.
3. random breakage model: from Randelph's results it can be concluded
that the effect of crystal breakage is to narrow the distribution
and to produce crystals of smaller average size. The distribution
becomes narrower with a higher percentage of crystals that break
and with a larger influence of crystal size on breakage probability
(larger m).
52
4.8 Crystal agqlomeration
Orcutt(136) determined size distributions of ice crystals formed
in a freeze desalination process in which cooling took place by an
evaporating secondary refrigerant. The size distributions were com
pared to size distributions from two mathematica! roodels descrihing
the proc ess, one with and one without partiele agglomeration. The
effect of agglomeration is accounted for in the population balance
by the rate Q ( i ) at which particles leave the size range ( i , i + d i )
by agg lomeration and by the rate A( i ) at which agglomerates enter
this size range. The rate Q ( i ) at which partic les leave the size
range ( i , i +di ) by agglomeration with particles of all sizes is given
by:
f F( i ;u) du (4-16)
where F( i ;u)di du is the rate at which particles in the size range
( i , i + d i ) agglomerate with snaller particles in the size range
(u,u + du). The integration has tobetaken over all possible sizes.
A( i ) can be expressed by:
A( i ) = 1/ 2 f F( i -u;u) du (4-17)
Because of the large number of unknown parameters in the theoretica!
roodels no definite conclusions could be made as to which model was
better to describe the experimental results.
A much simpler way to des c ribe agglomeration is by a computer
simulation technique, such as described by Senden (122) .
4 . 9 Dynamic behavier of crystallizers
4.9.1 Batch c~y s t alliza t ion
An adiabatic suspension of crystals of various sizes is not sta
ble from a thermadynamie point of view (137) . The suspension tends t o
ward a minimum free energy. At constant temperature and pressure this
change toward a thermodynamic equilibrium, which is called ageing or
ripening, occurs by decreasing the total crystal surface.
From eq.(3-5) it follows that a solution of temperature T canon
ly be in equilibrium with crystals of one size, i cr·
Crystals o f a size i > i cr have a greater chance that they will grow
than crystals of a size i < i cr· In an adiabatic suspension of small
and large crystals many large crystals will grow therefore at the ex
pense ó f small crystals that dissolve. As this process proceeds, the
total crystal surface area decreases and the temperature T of the
solution increases( 137). As a result, more and more crystals dissolve
53
until finally all of the crystals but one have disappeared. This
process of growth of large crystals and simultaneous dissalution o
small crystals is called Oswald-ripening.
The interfacial area of a crystal suspension can also decrease
by agglomeration of small particles followed by recrystallization
Ageing of a single crystal is a lso possible. Kahlwei t (i~; 8 J showed
that dendritic ammonium chloride crystals age in aqueous solutions
by dissalution of the side arms from their tips down to their roots.
The radii of the arms remain unchanged during this process.
The change of size distribution with time of an adiabatic batch
suspension of crystals has been described by several authors(137, 139-
141). For this case eq. (4-4) becomes:
(4-18)
Kampmann and Kahlweit(l40), and Wagner(141) solved this differentlal
equation for the limiting cases of diffusion controlled growth and
inbuilding controlled growth. Kampmann presented a numerical solution
for an entire precipitation. A stationary nucleation rate in the be
ginning of precipitation and an asymtotic ageing rate at the end ap
pear as limiting cases. Wagner only solved eq.(4-18) for an asymtotic
ageing rate given by:
dN d(R.cr) dt = - ncr~ (4-19)
where N is the total number of crystals in the system/unit volume.
4.9.2 Dynamio behavior of oontinuous orystallizers
It has been observed(142) that continuous crystallization pro
cesses can be unstable under certain conditions. As a result of this
unstable behavior,cyclic changes in prod'uction rate and crystal size
distribution might occur. The tendency to unstable behavier will be
elucidated by means of figure 4.1, in which the interrelation between
growth rate, nucleation rate, crystal size distribution, and super
saturation is schematically indicated. In this figure the external
process parameters are encircled.
Unstable behavier of continuous crystallizers is very often due
toa large value of the sensivity parameter i, defined in eq. (4-13).
A small increase in supersaturation for example leads to the formation
of an excess amount of nuclei. As these nuclei grow the supersatura
tion will decrease due to the increase in total crystal surface. This,
however, occurs with a considerable time lag since the nuclei have
54
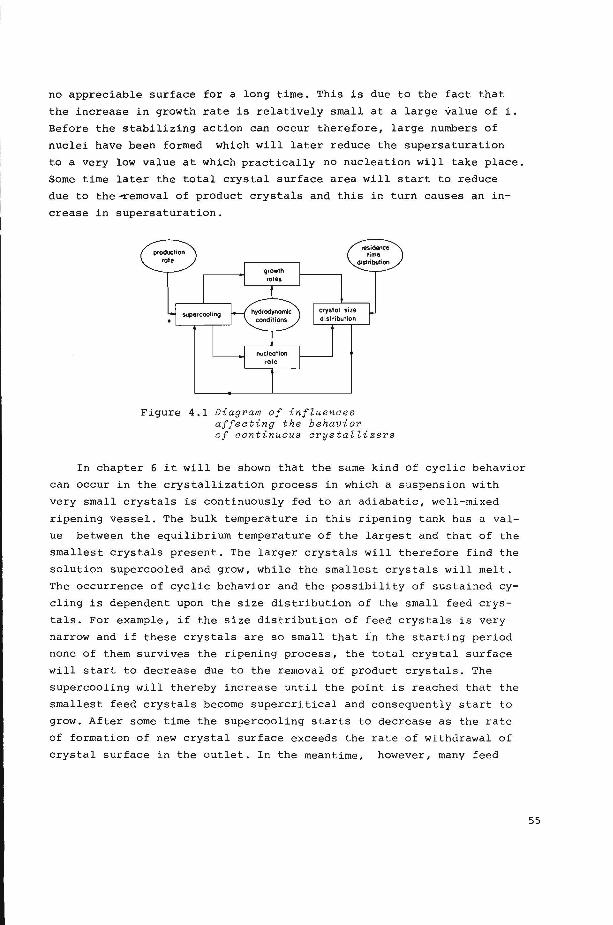
no appreciable surface for a long time. This is due to the fact that
the increase in growth rate is relatively small at a large value of i.
Before the stabilizing action can occur therefore, large numbers of
nuclei have been formed which will later reduce the supersaturation
to a very low value at which practically no nucleation will take place.
Some time later the total crystal surface area will start to reduce
due to the~emoval of product crystals and this in turn causes an in
crease in supersaturation.
Figure 4.1 Diagram of influences affecting the behavior of continuous crystallizers
In chapter 6 it will be shown that the same kind of cyclic behavier
can occur in the crystallization process in which a suspension with
very small crystals is continuously fed to an adiabatic, well-mixed
ripening vessel. The bulk temperature in this ripening tank has a val
ue between the equilibrium temperature of the largest and that of the
smallest crystals present. The larger crystals will therefore find the
solution supercocled and grow, while the smallest crystals will melt.
The occurrence of cyclic behavier and the possibility of sustained cy
cling is dependent upon the size distribution of the small feed crys
tals. For example, if the size distribution of feed crystals is very
narrow and if these crystals are so small that in the starting period
none of them survives the ripening process, the total crystal surface
will start to decrease due to the removal of product crystals. The
supercooling will thereby increase until the point is reached that the
smallest feed crystals become supercritical and consequently start to
grow. After some time the supercooling starts to decrease as the rate
of formation of new crystal surface exceeds the rate of withdrawal of
crystal surface in the outlet. In the meantime, however, many feed
55

crystals have started to grow as a result of the narrow distribution,
The supercooling may therefore decrease considerably until far below
the critica! supercooling of the smallest feed crystals. Due to the
product removal, the supercooling will subsequently increase again and
the whole process will repeat itself.
In chapter 6 it will be shown, theoretically, that for certain
feed crystal size distributions, steady state conditions can be reached,
At steady state conditions the number of feed crystals that survive per
unit time equals the number of crystals in the exit stream per unit
time if no nucleation occurs. For this case the population density
bftlance becomes:
(4-20)
in which nf = nf(i) is the population density of the feed crystals.
For the unsteady state period the variatien of crystal size dis
tribution with time can be calculated from:
(4-21)
The numerical solutions of eqs.(4-20) and (4-21) will be given in
chapter 6 for various feed crystal size distributions.
Several theoretica! studies(5.113.143-145.150) have been made to
determine the influence of eperating conditions on the tendency to un
stable behavier of crystallizers in which both nucleation and growth
occur. The dependenee of supersaturation upon nucleation rate seems
to have the largest influence(113.143.145). Sherwin(113) concluded
that for i > 22 the system is inherently unstable and the cycles are
not damped any more at all. For i < 22 damping occurs, although the
cyclic behavier may continue for a considerable time. Nyvlt and Mullin
(143) found that under certain circumstances -a self-sustained cycling
may occur ~t values of i as low as 3.8.
Other conclusions that can be drawn are:
- For a mixed product removal crystallizer the cycle period is in most
cases 3 to 5 times the average crystal residence time(113). Fora
crystallizer with classified outlet, cycle times of 6-8 < were found
(145).
- The relative amplitude of the cycles increases with increasing sen
sivity parameter i(113).
56
Instahilities tend to decrease the average crystal size and to widen
the distribution, although individual samples of product crystals
may show very narrow distributions(ll3).
- The stability of a crystallizer increases with increasing linear
growth rate and magma density(l4 2 ). Seeding also has a stahilizing
effect ( ll3,143,15 0 ).
- A crystallizer with classified product withdrawal tends toward un
damped cyclic behavier for values of the sensivity parameter as low
as 2 (15 0).
4.10 CONCLUSIONS
1. A mathematica! description of the crystal size distribution has
been given by means of the population density balance. The crystal
size distribution wi11 be characterized by its moments, eqs. (4-4)
(4-7).
2 . An exponentlal crysta1 size distribution has been derived from the
population density balance by means of the following simplifications:l
size independent growth rate, conditions of ideal mixing, no agglo-1
roeration or partiele breakage, no classification or nuclei removai,
steady state conditions, and no crystals in the feed stream.
3. The linear growth rate of crystals is only size independent if
growth is inbuilding controlled, the crystals are much larger than
the critical size, and that inbuilding mechanism or dislocation
density do not change wit h crystal size.
4. Classified product removal, crystal breakage, and staging usually
cause narrower crystal size distributions but a smaller average
crystal size .
5. Nuclei removal leads to a Iarger average partiele size. The amount
of si ze impervement depends. upon the nucleation sens i ti vi ty, eq .
(4-13).
6. A high degree of mixing even on a micro scale, can be a very impor
tant factor in reducing the nucleation rate.
7. Differential equations to describe unsteady state behavier of batch
and continuous crystallizers have been presented. It has been shown
that cyclic behavier may occur in continuous crystallizers. The
occurence of this type of behavier depends upon the nucle ation sen
sitivity parameter, or in case of crystallizers fed by a suspension
of crystals, upon the size distribution of the feed crystals.
57
CHAPTER 5
NUCLEATION AND GROWTH OF ICE CRYSTALS IN A CON~INUOUS STIRRED TANK CRYSTALLIZER WITH SUPERCOCLED FEED
5.1 Introduetion
Two different methods will be applied to determine the rate of
secondary nucleation of ice crystals in a well mixed suspension:
1) a direct method in which the nucleation rate is determined by
means of counting the nurnber of crystals per unit volurne of sus
pension at steady state condi t-.ions;
2) an indirect method in which nucleation rates are calculated from
data of the effective diameter of the product crystals and from
the growth kinetics.
The direct method will be applied to the crystallization of ice
crystals from water, while for ice crystals growing from dextrose
solutions the indirect method will be used. Since ice crystals that
are grown from 20-30 wt.% dextrose solutions are too small(~150~m),
application of the direct method would yield unreliable results.
Nualeation kinetias for ice crystals in dextrose solutions will
be determined by correlating the nucleation rates with the average
supercooling óTb and with the total crystal surface Atot"
For ice crystals in water nucleation kinetics will not be determined
since not enough data for óTb as well as for Atot are available to
yield a reliable nucleation correlation.
Inbuilding kinetias for ice crystal growth from dextrose solu
tions will be found by means of trial and error by matching experi
mentally determined growth rates to growth rates obtained by means
of a theoretica! model.
Inbuilding kinetics for ice crystal growth from water will also
be determined by this trial and error method. In this case, growth
rates have to be calculated first from the nucleation rate data.
By means of the growth. kinetics, crystal size distributions will
be calculated by numerical integration of the population balance.
These distributions will be compared to those calculated for size
independent linear growth rates, and also to experimentally obtained
crystal size distributions.
Subsequently, by means of the inbuilding kinetics that are ob
tained from the experiments and by means of inbuilding kinetics re
lationships presented in literature, growth rates of spherical ice
58

crystals will be calculated as a function of a large number of varia
bles.
Finally, a general analytica! model is presented for calculating
the bulksupercooling and the moments of the crystal size distribution
as a function of growth and nucleation kinetics. The results calcula
ted with the analytica! model for growth and nucleation kinetics that
will be determined in this chapter will be compared with the experi
mental results.
5.2 Experimental set-up
The experimental set-up is schematically indicated in figure 5.1.
storage tank
Figure 5.1 ExperimentaZ set-up
thermostated air box
I
From a storage tank a crystal-free solution that is kept a few degrees
above its freezing polnt is pumped through a heat exchanger to a
crystallizer with a volume of 2 liters. In the heat exchanger the so
lution is cooled to the desired supercooling. This crystallizer is
provided with a three-bladed propellor in an off-center position. In
order to be able to vary ~he magma density independently oféthe feed
supercooling, both a product suspension stream and a crystal free so
lution are withdrawn from the crystallizer. In the experiments with
59
water only a suspension stream left the crystallizer since the double
draw-off was then not yet provided for. The crystal-free solution is
pumped to the storage tank. The suspension is withdrawn semi-continu
ously by means of a pipe that can be moved in and out of the suspensionl
by means of a motor. This pipe is connected to a vacuum system. The
dip frequency is controlled by means of a level indicator that oper
atesthe motor. By means of this system the suspension volume in the
crystallizer can be kept constant within 2.5%. After the ice crystals
in the suspension have melted in a heat exchanger, the solution flows
to the storage tank. To compensate for the energy of mixing, the crys
tallizer is externally cooled by means of a cooling mantle, such that
it works adiabatically at the desired operating conditions. A thermo-. 0
stated air box, kept at -1.5 C, was placed around the crystallizer
assembly to facilitate the adiabatic adjustment.
5.3 Measuring technigues
5.3.1 Nualeation rate (direat measurement)
At steady state conditions the nucleation rate equals the total
number of crystals per unit volume of suspension (1!0
) divided by the
mean residence time of the ice crystals. The number density 110
was de
termined by counting the number of crystals present in a known suspen
sion volume taken from the crystallizer. The liquid in the sample was
separated from the crystals by means of a glass filter that was placed
in the thermostated air box at -1.5°C. The total number of ice crys
tals in the sample was counted by direct visual and photographic ob
servation. For every set of operating conditions ten samples were ta
ken. The values of 110
for these samples were averaged algebraically.
Simulation experiments with polystrene spheres indicated that the aver
age partiele concentratien in the samples deviated by not more than
20% from the average partiele concentratien in the crystallizer.
The ice crystals appeared to be approximately spherical. Some of
the crystals were present in the form of'agglomerates. It is not clear
whether these agglomerates were formed in the crystallizer or in the
sampling tube. For the det~rmination of 110
it was attempted to count
all the crystals, including the ones in the agglomerates. The direct
visual observation method gave more reliable results than counting
from photographs, because the crystals could be observed from differ
ent angles. Measurements of the average number concentratien 110
in
the time showed that 110
became approximately constant at times larger
than 3 T after the onset of crystallization. All measurements were
therefore made at times > 3 <. As mentioned before, this direct meas-
60
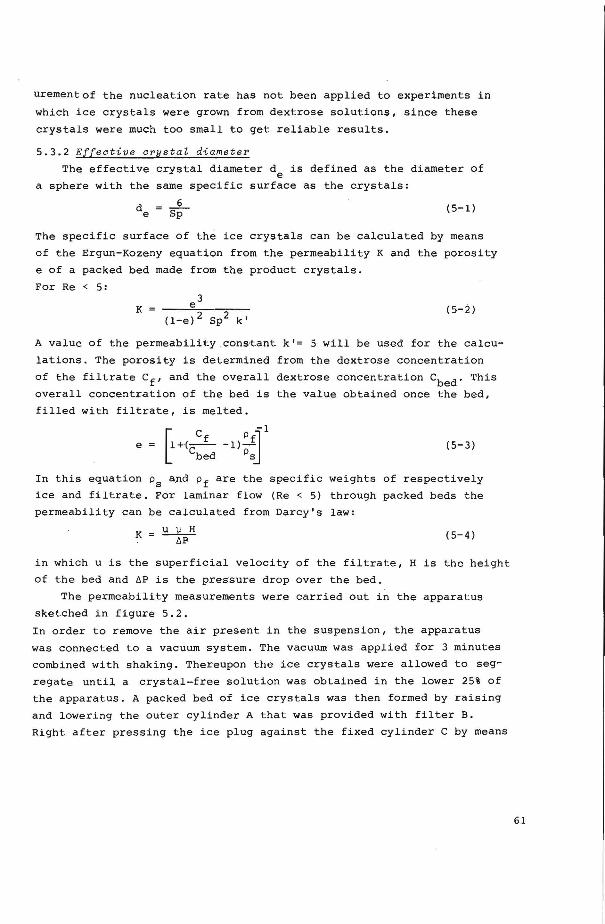
urementof the nucleation rate has notbeen applied to experiments in
which ice crystals were grown from dextrose solutions, since these
crystals were much too smal! to get reliable results.
5.3.2 E[[eative arystaZ diameter
The effective crystal diameter de is defined as the diameter of
a sphere with the same specific surface as the crystals:
(5-1)
The specific surface of the ice crystals can be calculated by means
of the Ergun-Kozeny equation from the permeability K and the porosity
e of a packed bed made from the product crystals.
For Re < 5:
K 3 e
(1-e) 2 sp2 k' (5-2)
A value of the permeability constant k'= 5 will be used for the calcu
lations. The porosity is determined from the dextrose concentratien
of the filtrate Cf' and the overall dextrose concentration Cbed" This
overall concentration of the bed is the value obtained once the bed,
filled with filtrate, is melted.
~ Cf p~- 1
e = 1+(-- -1)-Cbed ps
(5-3)
In this equation p5
and pf are the specific weights of respectively
ice and filtrate. For laminar flow (Re < 5) through packed beds the
permeability can be calculated from Darcy's law:
(5-4)
in which u is the superficial velocity of the filtrate, H is the height
of the bed and óP is the pressure drop over the bed.
The permeability measurements were carried out in the apparatus
sketched in figure 5.2.
In order to remove the air present in the suspension, the apparatus
was connected to a vacuum system. The vacuum was applied for 3 minutes
combined with shaking. Thereupon the ice crystals were allowed to seg
regate until a crystal-free solution was obtained in the lower 25% of
the apparat us. A packed bed of ice crystals was then formed by raising
and lowering the outer cylinder A that was provided with filter B.
Right after pressing the ice plug against the fixed cylinder C by means
61
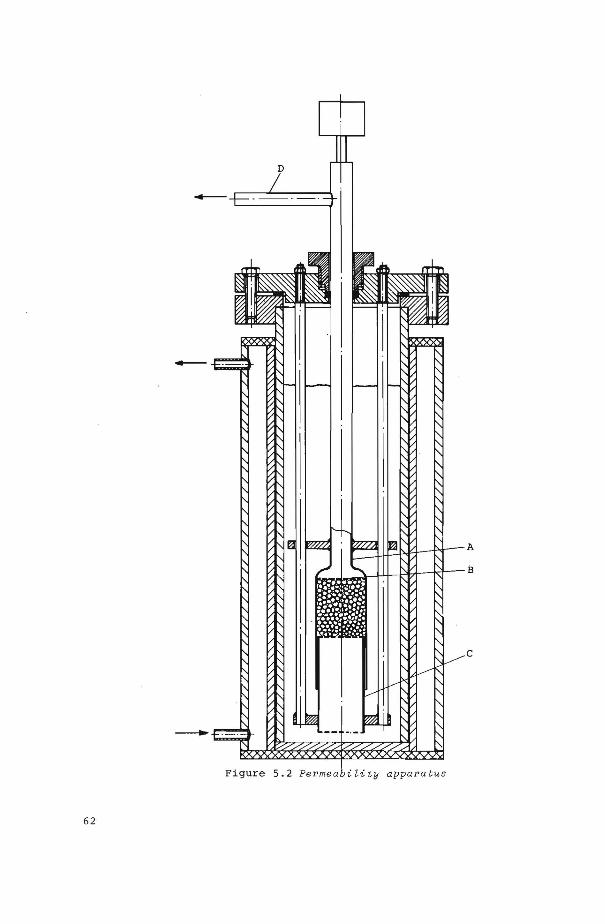
-lity apparatus
62
or a weight of 4 ki~ograms, a constant, but adjustable vacuum was ap
plied to tube D connecting the filter. The flow rate through the bed
was then measured. Since the effective diameter data contribute to a
considerable amount of information, possible sourees of errors for the
determination of d wil! be discussed in detail: e .
1. For the permability constant k' in eq. (5-2) a value of 5 is common
ly used in literature. Coulson{146) determined experimentally the
influence of porosity and partiele shape upon k'. He concluded that
over the range of e from 0.3-0 . 5, values for k' lie in the range of
3.2-5.8 for spheres, cubes, cylinders, and prisms, as we!l as plate s.
A relationship between k' and shape and si ze of the particle,s
was not found. Calculations that were carried out for some specific
orientations of the particles showed that with cylinders anq plates
wide variations of k' with orientation are theoretically possible .
These variations are only qualitatively in agreement with Coulsons
experimental data. It has also been suggested ( 4 7) that k' should be
dependent upon the partiele size distribution. Experiment s carried
out in our laboratory(147) with glass beads of various size distri
butions, however, showed k' to be independent of the partiele size
distribution.
2. The specific ·surface Spin eq. (5-2) is the total crystal surface
per unit crystal volume in contact with the solution. Non-spherical
particles can be arrange d in the bed in such a way that Sp is much
less than the total surface of all individual particles divided by
the total volume of the particles. This would yield a value of t he
effective diameter, determined from eq. (5-2) that is too high. The
magnitude of this deviation depends upon the way the bed is packed.
Sherwood (47 )found that beds formed by free settling disk-shaped ice
crystals yielded values of de t hat were probably a factor of 4 too
large. In our case, howe ver, t h e beds,we re always · formed in t he
same way without allowing the ice particles to orientate themselves.
There is no reason to believe therefore that the error in d d ue te , e crystal shape, crystal size distribution, and packing of the bed
exceeds t h e ·maximum value of about 20% found by Coulson ( 146 ).
3. In spite of the precautions that have bee n taken, it somet ime s
o ccurr edthat the poros i t y was not constant t hroughout t he bed due
to packing irregulaties or due to the presence of air bubbles.
Possible large errors due to these eventualities could usua l ly
be detected since most of the experiments were carried out in
duplicate.
63

5.3.3 SuperaooLing measurement
Temperatures of feed stream and suspension have been measured
by means of an N.T.C.thermistor. This thermistor is set as one arm
of a Wheatstone bridge. Because of the low voltage of about 0.1 volts
over the bridge, the heat generation in the thermistor is only in
the order of 10- 6 Watts(148). At this low heat generation we were
able to measure only temperature variations without being influenced
by velocity fluctuations of the medium surrounding the thermistor,
The thermistor was calibrated by means of a Beekman thermometer.
With the thermistor,temperatur~ differences could be measured with
an inaccuracy of only about 0.001°·c1. The feed supercqoling is
defined as the difference between the temperature of the suspension
and the temperature of the feed stream. The suspension supercooling
is measured by recording the temperature decrease after the feed
stream has been stopped. Figure 5.3 is a typical example of such a
recording.
feed stream off
Figure 5.3 TypiaaZ reaording for suspension superaooLing measurement
In most of the crystallization experiments with pure water the super
cooling has only been measured at one location in the middle of the
crystallizer. The last experiments with water showed(l?) that the
supercooling varied strongiy from one place to another, especially
at locations near the entrance of the feed stream. In the consecu
tive experiments with dextrose solutions, the supercooling was there
fore measured at at least 9 different locations in the crystallizer.
The bulksupercooling is calculated by algebraic averaging of the lo
cal mean supercoolings. The values of the local supercooling for
every experiment are given elsewhere(148). Forsome runs it was fur-
64
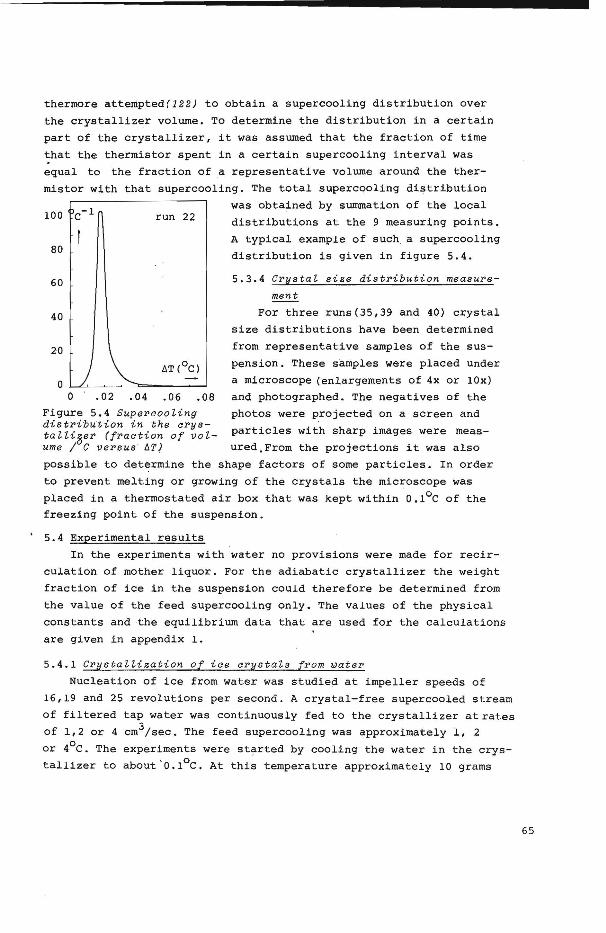
thermare atternpted(122) to obtain a supercooling distribution over
the crystallizer volume. To determine the distribution in a certain
part of the crystallizer, it was assumed that the fraction of time
that the thermistor spent in a certain supercooling interval was
equal to the fraction of a representati ve volume around the ther
mistor with that supercooling. The total supercooling distribution
run 22
80
60
40
.02 .04 .06 .08
Figure 5.4 Supercooling distribution in the crystalli~er (fraction of volume I C versus ÄT{
was obtained by summatien of the local
distributions at the 9 measuring points.
A typical example of such a supercooling
distribution is given in figure 5.4.
5.3.4 Crystal size distribution measure
ment
For three runs(35,39 and 40) crystal
size distributions have been determined
from representative samples of the sus
pension. These samples were placed under
a microscope (enlargements of 4x or 10x)
and photographed. The negatives of the
photos were projected on a screen and
particles with sharp images were meas
ured.From the projections it was also
possible to determine the shape factors of some particles. In order
to prevent melting or growing of the crystals the microscope was
placed in a therrnostated air box that was kept within 0.1°C of the
freezing point of the suspension.
5.4 Experimental results
In the experiments with water no provisions were made for recir
culation of mother liquor. For the adiabatic crystallizer the weight
fraction of ice in the suspension could therefore be deterrnined from
the value of the feed supercooling only. The values of the physical
constants and the equilibrium data that are used for the calculations
are given in appendix 1.
5.4.1 Crystallization of ice crystals from water
Nucleation of ice from water was studied at impeller speeds of
16,19 and 25 revolutions per second. A crystal-free supercocled stream
of filtered tap water was continuously fed to the crystallizer atrates
of 1,2 or 4 cm3;sec. The feed supercooling was approximately 1, 2
or 4°C. The experiments were started by cooling the water in the crys
tallizer toabout 'o.1°C. At this temperature approximately 10 grams
65

of seed crystals (ice spheres 0.5 mm in diameter) were added. Depend
ing upon the cooling rate, nucleation started at supercoolings of
0.01 to 0 . 2°C. Brightly sparkling needle-like crystals could then be
observed. The crystals were approximately 1-3 mm in length. Some of
the little dendrites were still attached to the seed crystals, but
most of them were freely suspended in the bulk of the liquid.
The experimental results are presented in table 5.1. In the col
umns 1, 2, and 3 the va lues of the eperating variables are compiled.
The average nucleation rates calculated from J = ~0/T are given in
column 4. Column 5 gives the standard deviations from the average
value of ~0 in %. Time averaged values of ~Tb measured at one point
in the crystallizer are presented in column 6. The supercooling dis
tributions that were obtained for only two runs are given elsewhere ( l?L
The results of the nucleation experiments are graphically represented
in the figures 5.5- 5.7. In figure 5.5 the nucleation rate J(cm- 3
sec- 1)is plottedas a function of the impeller speed nr(rps) with ~f and ~Tf as parameters. In most experiments J seems to go through a
minimum with nr. The strengest dependenee of J on nr is for large val
ues of ~Tf. Figure 5.6 gives J as a function of ~f with ~Tf and nr
as parameters. From this figure it can be concluded that J increases
with ~f more than linearly. In figure 5.7, J is plotted versus ~Tf.
Here, a less than linear increase of J with increasing ~Tf can be ob
served.
In order to determine the type_ of nucleation, an experiment was
carried out without the addition of seed crystals. The mean temperature
in the mixer was kept constant at approximately -0.5°c. Water of -4°C
was fed to the crystallizer at a rate of 1 cm3;sec. The crystallizer
was kept at t hese conditions for one hour. Nucleation did not occur at
any impeller speed between 16 and 25 rps. From this experiment it can
be concluded that nucleation occurring at average bulk supercoolings
of less than 0.5°C and feed supercoolings equal or less than 4°C must
be of the secondary type.
From the large variations in supercooling from one place to another
and the large fluctuations wi t h time, it can be concluded that mixing
of the supercocled feed stream with the suspension in the crystallizer
is certainly not ideal . In order to investigate the influence o f mix
ing upon the nucleation rate, experiments were performed in whi c h the
mixing performance was delibe rate ly altered by splitting up the feed
stream and introducinq it at 3 different locations. The exoeriments
66.
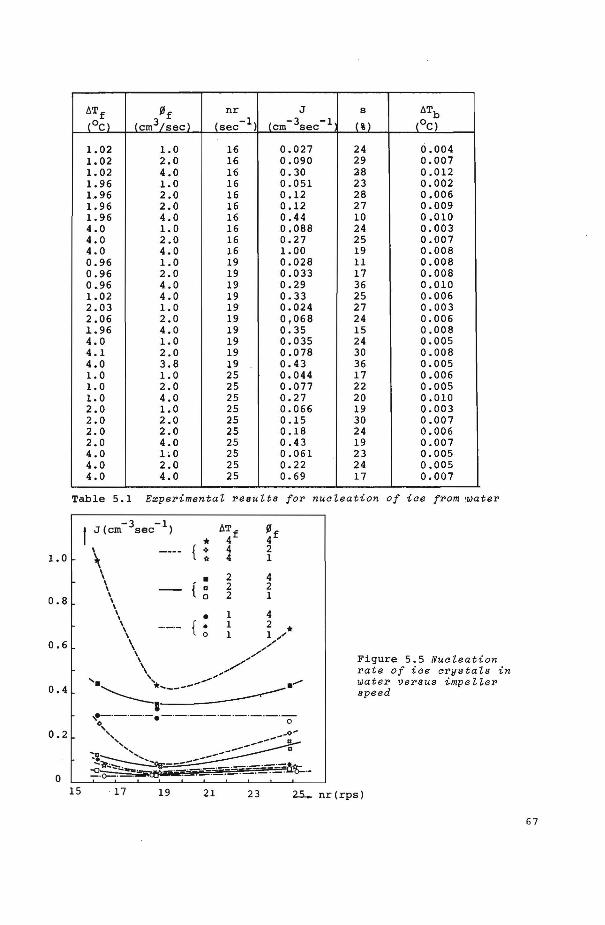
1.0
0.8
0.6
0.4
0.2
0
ATf ~f nr J s A Tb (OC) lcm3/sec) (sec- 1 ) (cm- 3sec- 1 (%) (OC)
1.02 1.0 16 0.027 24 0.004 1.02 2.0 16 0.090 29 0.007 1.02 4.0 16 0.30 28 0.012 1.96 1.0 16 0.051 23 0.002 1 .• 96 2.0 16 0.12 28 0.006 1.96 2.0 16 0.12 27 0.009 1. 96 4.0 16 0.44 10 0.010 4.0 1.0 16 0.088 24 0.003 4.0 2.0 16 0.27 25 0.007 4.0 4.0 16 1.00 19 0.008 0.96 1.0 19 0.028 11 0.008 0.96 2.0 19 0.033 17 0.008 0 •. 96 4.0 19 0.29 36 0.010 1.02 4.0 19 0.33 25 0.006 2.03 1.0 19 0.024 27 0. 003 2.06 2.0 19 0,068 24 0.006 1.96 4.0 19 0.35 15 0.008 4.0 1.0 19 0.035 24 0.005 4.1 2.0 19 0.078 30 0.008 4.0 3.8 19 0.43 36 0.005 1.0 1.0 25 0.044 17 0.006 1.0 2.0 25 0.077 22 0.005 1.0 4.0 25 0.27 20 0.010 2.0 1.0 25 0.066 19 0.003 2.0 2.0 25 0.15 30 0.007 2.0 2.0 25 0.18 24 0.006 2.0 4.0 25 0.43 19 0.007 4.0 1.0 25 0.061 23 0.005 4.0 2.0 25 0.22 24 0.005 4.0 4.0 25 0.69 17 0.007
Table 5.1 ExperimentaZ resuZts for nuaZeation of iae from ~water
15
-3 -1 I J(cm sec )
\ { \ \ \ \ \ \ \
• 2 2 2
~f 4 2 1
4 2 1
\ • 1 4 \, ___ {
0• 1 2 *
1 1 " .. \, ~/~~ \ "//
' ".-
'•'-----*====--------·"" I
,~-·-·-·-.-·-·-·-·-·-·-·-·0 ' ~',, ~-----: "':~::----___ ............... ~- ------'"lt.:..,.~---- . ·-·-:.::=~!1.-t.-~.--~· . .;.. .=-~ :-- .. ~'o-·-
Figure 5.5 NuaZeation rate of iae arystaZs in water versus impeZZer speed
· 17 19 21 23 25.- nr(rps)
67

1.0
0.8
0.6
0.4
0.2
0 0
1.2
1.0
0.8
0.6
0.4
0.2
0 0
-3 -1 J(cm sec )
• . 2 { 13 2
0 2
• --- { ~-
1 1 1
-3 -1 . J(cm sec )
t {
{
{
1
nr
16 19 25
16 19 25
16 19 25
* * • • 0 0
• 0 <>
2
2
n 16 4 16 2 16 1
19 4 19 2 19 1
25 4 25 2 25 1
3 4
f
I
3
Figure 5.6 NuaZeation rate of iae crystaZs in water versus feed rate
Figure 5.7 NucZea-tion rate of ice crystaZs in water versus feed super-cooZing

were carried out for nr = 19 rps, b.Tf = 2.0ue and fi!f = 4.0 cm3/sec.
Without splitting the feed stream a nucleation rate of 0.35 was found.
By varying the feed inlet location the nucleation rate varied between
the. extremes 0.30 and 0.67. By splitting the feed into three streams
the nucleation rate decreased to 0.26. At stirrer speeds below 15 rps
the crystals were not fully suspended. This poor mixing resulted in
such a high nucleation rate that the circulation of the suspension in
the crystallizer stopped completely.
In order to obtain a correlation for the nucleation rate one would
like to correlate J with the internal system variables b.Tb and the to
tal crystal surface area per unit volume Atot" Since Atot and b.Tb have
not been varied independently of each other, too few data are available
to obtain a reliable correlation.
5.4.2 Crystallization of iae arystals [rom dextrose solutions
The effective crystal diameter and the bulksupercooling have been
measured for various combinations of the following independent vari
ables eb' T, b.Tf, fi!f' and nr. The ranges in which these eperating vari
ables were changed are given in table 5.2.
~ariable changed between
b.Tf 1-2 oe fi!f 0.5-8 cm3/sec
T 400-4000 sec
eb 10-42 wt%
nr 15-27 rps
Table 5.2 Operatin~ variables
The measurements of de were always carried out at a time longer than
3 T after the onset of nucleation. ealculations that were carried out
to determine the variatien of the crystal size distribution with time
showed that in many cases values of de at 3 T were within 10% of the
steady state values(122J.although the distr~bution would still become
considerably wider after 3 T. The results of these calculations depend
ed 1 however, u pon the in i ti ai condi ti ons which cannot be known. By
determining the steady state value of de after 3 T probably only a
minor error is made due to the omission of the large crystal sizes
that would have been found at times > 3 T .
The results are compiled in table 5.3. The run number is indicated
in column 1. The independent variables,b.Tf, fi!f' T, eb, and nr are giv
en in the columns 2 through 6 respectively .
69
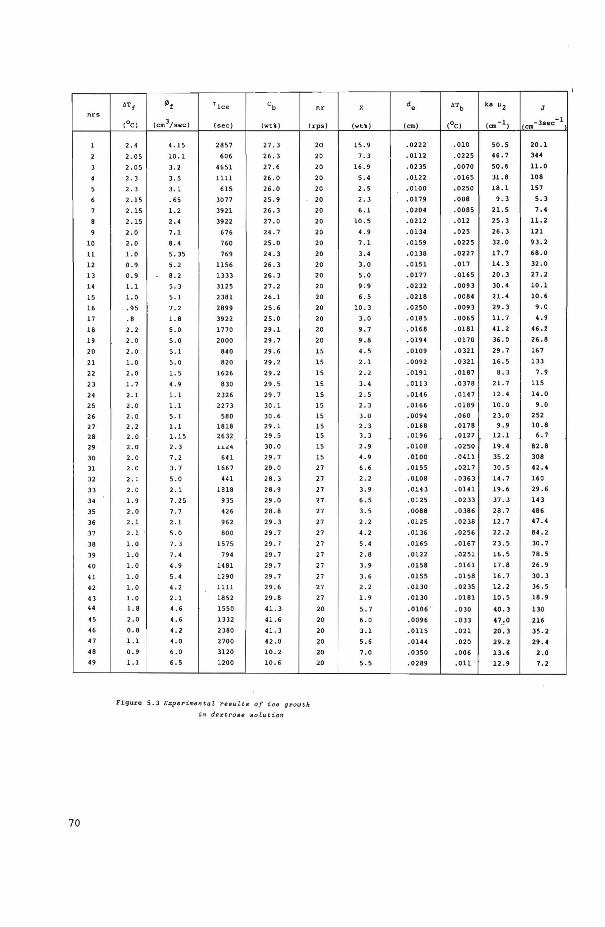
nrs
1
2
3
4
5
6
7
8
9
10
11
12
13
14
15
16
17
18
19
20
21
22
23
24
25
26
27
28
29
30
31
32
33
34
35
36
37
38
39
40
41
42
43 .. 45
46
47
48
49
70
OT f !llf T ice c b nr
(OC) (cm 3 /sec) (sec) (wt\) (rps)
2 . 4 4.15 2857 27.3
2 . 05 10.1 606 26 . 3
2. os 3. 2 4651 27.6
2. 3 3. 5 1111 26 .0
2. 3 3.1 615 26 .o 2.15 • 65 3077 25.9
2.15 1.2 3921 26 . 3
2 . 15 2.4 3922 27 .o 2.0 7 . 1 676 24 . 7
2. 0 8. 4 760 25.0
1.0 5. 35 769 24.3
0 . 9 5. 2 1156 26.3
o. 9 8. 2 1333 26 . 3
1.1 5. 3 3125 27 . 2
1.0 5.1 2381 26.1
. 95 7. 2 2899 25.6
. 8 1.8 3922 25.0
2. 2 5.0 1770 29.1
2 . 0 5.0 2000 29.7
2 . 0 5.1 840 29.6
1.0 5. 0 820 29.2
2 . 0 1.5 1626 29.2
1.7 4. 9 830 29.5
2.1 1.1 2326 29.7
2. 0 1.1 2273 30.1
2.0 5.1 580 30.6
2 .2 1.1 1818 29.1
2.0 1.15 2632 . 29.5
2.0 2. 3 .1.1..&:4 30.0
2 . 0 7. 2 641 29 . 7
2 .0 3 . 7 1667 29 . 0
2.1 5 . 0 441 28.3
2. 0 2.1 1818 28.9
1.9 7. 25 935 29 .o 2 . 0 7. 7 426 28.8
2.1 2.1 962 29.3
2.1 5. 0 800 29. 7
1.0 7. 3 1575 29. I
1.0 7. 4 794 29.7
1.0 4.9 1481 29.7
1.0 5. 4 12 90 29. 7
1.0 4. 2 1111 29.6
1.0 2.1 1852 29.8
1.8 4.6 1550 41.3
2.0 4.6 1332 41.6
0 . 8 4. 2 2380 41.3
1.1 4 . 0 2700 42 . 0
0. 9 6.0 3120 10 . 2
1.1 6 . 5 1200 10 . 6
Flgure 5.3 E:.:r;psl'i.m(ll1ta l resu.lts of i.ce f1l'OI.Jth
in de:z:tross solutioTI
20
20
20
20
20
20
20
20
20
20
20
20
20
20
20
20
20
20
20
15
15
15
15
15
15
15
15 15
15
15
27
27
27
27
27
27
27
27
27
27
27
27
27
20
20
20
20
20
20
x de OTb ka ~2 J
(OC) (an -1) -1
(wt\) !cm) cm -Jsec
15 . 9 .0222 . 010 50.5 20.1
7 . 3 .0112 . 0225 46 . 7 344
16 . 9 .0235 .0070 50.6 11.0
5 . 4 .0122 .0165 31.8 108
2. 5 . 0100 .0250 18.1 157
2. 3 .0179 .008 9. 3 5. 3
6.1 . 0204 .0085 21.5 7.4
10.5 .0212 .012 25.3 11.2
4.9 .0134 .025 26.3 121
7.1 .0159 .0225 32 . 0 93.2
3.4 .0138 . 0227 17.7 68.0
3.0 .0151 .017 14 . 3 32.0
5.0 .0177 .0165 20 . 3 27.2
9:9 .0232 .0093 30 . 4 10.1
6. 5 .0218 .0084 21.4 10 .6
10.3 .0250 .009 3 29.3 9 .o 3.0 .0185 . 0065 11.7 4.9
9. 7 • 0168 .0181 41.2 46.2
9.8 • 0194 . 0170 36.0 26.8
4. 5 .0109 . 0321 29.7 167
2 . 1 .0092 . 0321 16.5 133
2. 2 .0191 . 0187 8 . 3 7.9
3 . 4 .0113 . 0378 21.7 115
2. 5 .0146 • 0147 12.4 14 .o 2. 3 .0166 . 0189 10.0 9.0
3 . 0 . 0094 .060 23.0 252
2 . 3 .0168 .0178 9.9 10.8
3 . 3 .0196 .0121 12 . 1 6 . 7
2.9 .0108 .0250 19.4 82.8
4.9 . 0100 . 0411 35 . 2 308
6. 6 .0155 .0217 30.5 42.4
2.2 . 0108 • 0363 14.7 160
3. 9 .0143 .0141 19.6 29.6
6.5 .0125 .0233 37.3 143
3. 5 . 0088 .0386 28.7 486
2.2 .0125 .02 38 12.7 47.4
4.2 .0136 .0256 22.2 84.2
5.4 .0165 .0167 23.5 30.7
2 .8 .0122 .0251 16 . 5 78.5
3. 9 .0158 .0161 17.8 26.9
3 . 6 .0155 .0158 16.7 30.3
2 . 2 .0130 .0235 12 . 2 36.5
1.9 . 0130 . 0181 10 . 5 18.9
5. 7 .0106 . .030 40.3 130
6 .o .0096 . 033 47 .o 216
3.1 .0115 .021 20.3 35.2
5.6 .0144 .020 29.2 29.4
7.0 .0350 .006 13.6 2 .o 5.5 . 0289 .011 12 . 9 7. 2
I
The weight fraction of crystals X is calculated from a heat balance
over the adiabatic crystallizer:
(5-5)
in which cpf is the specific heat of the feed solution, and V is the
total suspension volume. X has also been determined directly by measur
ing the dextrose concentratien of the crystal-free solution and of the
suspension after melting. The values of X determined by the two methods
are averaged and compiled in column 7. The mean deviation from the aver
age values is 6%. The de-measurements for most runs were carried out
in duplicate. The average values of de are indicated in column 8. The
mean deviation from the average values is 2.9%. The bulksupercoolings
are compiled in column 9. The total crystal surface per unit volume of
suspension ka ~2 is calculated from:
(5-6)
Values of ka ~ 2 are given in column 10.
The experimental data will be plotted versus various eperating var
iables in the following figures. For the sake of clearness these data
wil1 be lumped into groups that will each be indicated in the figures
by means of one symbol. The following groups have been distinguished:
runs 1-17(Cb=26.0, nr=20), runs 18 and 19(Cb=29.4, nr=20), runs 20-30
(Cb=29.7, nr=l5), runs 31-43(Cb=29.5, nr=27), runs 44-47(Cb=41.5, nr=20),
and runs 48 and 49(Cb=l0.4, nr=20).
In figure 5.8 the effective crystal diameter is plotted versus the
mean crystal residence time. The parameters in this graphare the im
peller speed and the weight percentage of ice in the crystallizer (in
dicated for every data point). The effects of ~f and óTf appeared not
to be significant and these parameters are therefore not indicated.
Notwithstanding the scatter in data points it can be concluded from
tigure 5.8 that de increases less than linearly with increasing T. Fur
thermore de seems to increase slightly with increasing X. It can also
be concluded that at constant T and nr, de increases with decreasing
eb. From the data for nr=l5 and nr=27 it can be seen that de seems to
decrease with decreasing nr.
In figure 5.9 the bulksupercooling is plotted versus T, with nr and
eb as pa rameters. The influences of ~f' óTf, and X upon the relation
ship between óTb and T are negligible. Figure 5.9 clearly shows that
óTb increases with decreasing T. By camparing the data points for nr=
27 and nr=l5 at constant eb and T it can be seen that óTb increases on
ly slightly with decreasing nr. From the data for nr=20 it can be seen
that óTb increases considerably with increasing eb.
71
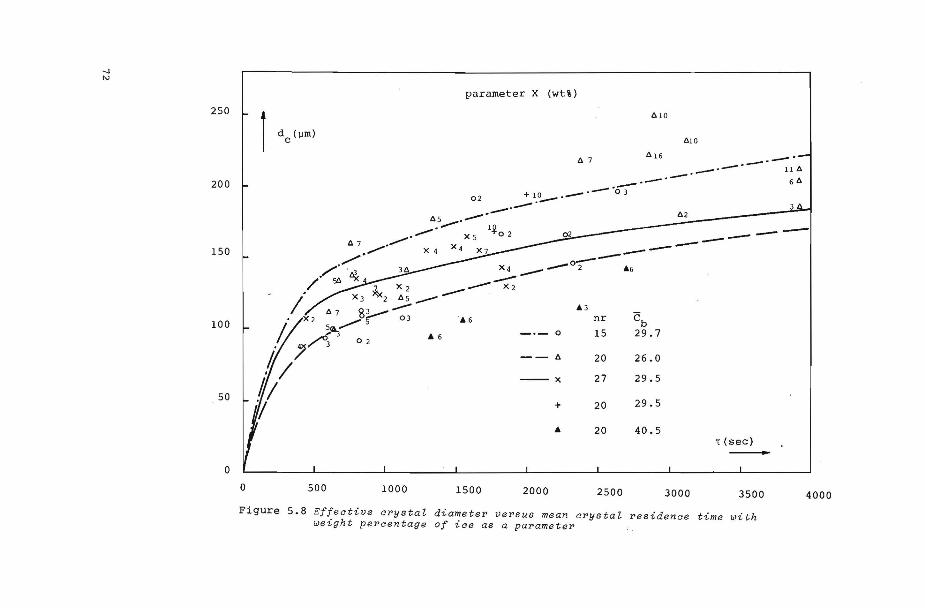
250
200
150
100
50
0
parameter X (wt%)
-· ------------ 116
.---·-· 66 .-·ÓJ 02 + 1~·----·-·
1 6 7
610
610
616
65 .--· • ....- 1.\1 --
........... -- X5 o2 --
0
67........... ----"...,. ~ /'. x4 __ _. 2 .t.G
/. 56 ~ --
------ X2 I s~--i X2 ~~ 5 03 .t. 6
,, ./0 0 2
.t.6
• /" 3
.11 I Ó/ 'V
500 1000 1500
.t.3 nr
0 15
20
--x 27
+ 20
20
2000 2500
26.0
29.5
29.5
40.5
3000
1:(sec) -3500
Figure 5.8 Effeative crystaZ diameter versus mean arystaZ residence time u>ith weight percentage of iae as a parameter
4000

__, w
0.05
0.04
0.03
0.02
0.01
0
nr eb -·- 0 15 29.7
20 26.0
27 29 . 5 l 20 29.5
T(sec) -0 500 1000 1500 2000 2500 3001 3500 4000
Figure 5.9 Bu~k superoooZing ve r sus mean orystáZ r e sidenoe t ime
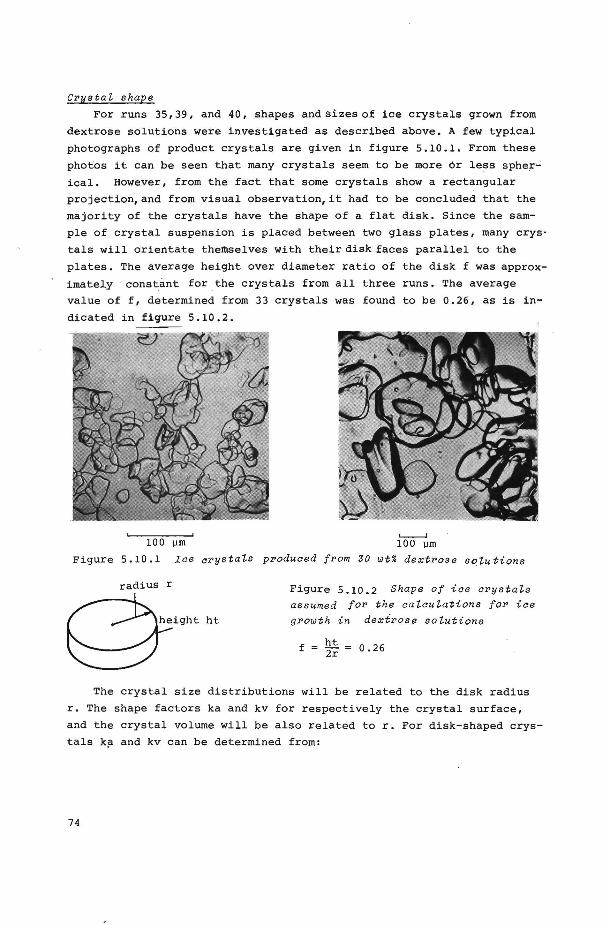
CrystaL shape
For runs 35, 39, and 40, shapes and si zes of ice crystals grown from
dextrose solutions were investigated as described above. A few typical
photographs of product crystals are given in figure 5.10.1. From these
photos it can be seen that many crystals seem to he more ór less spher
ical. However, from the fact that some crystals show a rectangular
projection,and from visual observation,it had to be concluded that the
majority of the crystals have the shape of a flat disk. Since the sam
ple of crystal suspension is placed between two glass plates, many crys
tals will orientate theltlselves with their disk faces parallel to the
plates. The average height over diameter ratio of the disk f was approx
imately constànt for _the crystals from all three runs. The average
value of f, determined from 33 crystals was found to be 0.26, as is in
dicated in figure 5.10.2.
100 \liD '----J
100 \liD
Figure 5.10.1 Ice crystats produced from 30 wt% dextrose SQtutions
radius r Figure 5.10.2 Shape of ice crystats
assumed for the catcutations for ice
growth in dextrose sotutions
f=~;=0.26
The crystal size distributions will be related to the disk radius
r. The shape factors ka and kv for respectively the crystal surface,
and the crystal volume will be also related to r. For disk-shaped crys
tals k,? and kv can be determined from:
74
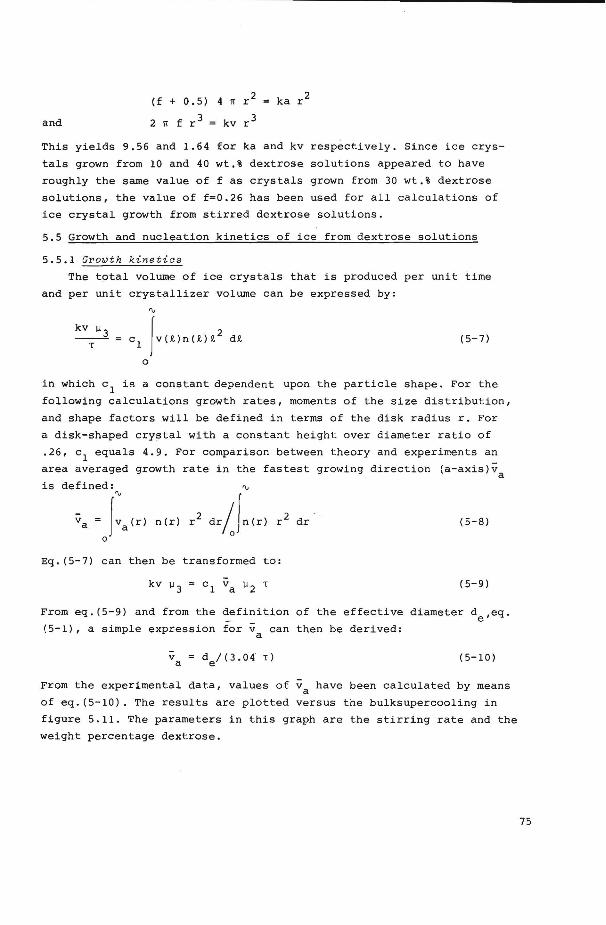
and
( f + 0. 5) 4 TT r 2
2 TT f r 3 = kv r 3
This yields 9.56 and 1.64 for ka and kv respectively. Since ice crys
tals grown from 10 and 40 wt.% dextrose solutions appeared to have
roughly the same value of f as crystals grown from 30 wt.% dextrose
solutions, the value of f=0.26 has been used for all calculations of
ice crystal growth from stirred dextrose solutions.
5.5 Growth and nucleation kinetics of ice from dextrose solutions
5.5.1 Growth kinetias
The total volume of ice crystals that is produced per unit time
and per unit crystallizer volume can be expressed by:
'V
c 1 jv(i)n(i)i2
di
0
(5-7)
in which c1
is a constant dependent upon the partiele shape. For the
following calculations growth rates, moments of the size distribution,
and shape factors will be defined in terms of the disk radius r. For
a disk-shaped crystal with a constant height over diameter ratio of
.26, c 1 equals 4.9. For comparison between theory and experiments an
area averaged growth rate in the fastest growing direction (a-axis)v a is defined: -v
v. = r:.(r) n(r) r2 dr;()n(r) r2 dr 0
(5-8)
Eq. (5-7) can then be transformed to:
(5-9)
From eq.(5-9) and from the definition of the effective diameter de,eq.
(5-1), a simple expression for v canthen be derived: a
(5-10)
From the experimental data, values of va have been calculat ed by means
of eq.(5-10). The results are plotted versus the bulksupercooling in
figure 5.11. The parameters in this graph are the stirring rate and the
weight percentage dextrose.
75

510 -5
nr eb 0 15 29.7
V (er:;/ sec)
I " {; 20 26.0
x 27 29.5
+ 20 29.5
• 20 10.4 10-s " • 20 ;o.5 /~/ • "
I {; , ,.h
/~~/ 0 0 " , ~ < 0 ,x o/x /a • " ~" 0 / {;{; ," /+<t /0
tf 0 ,x / .,I'/ o/R .~
i/66/ ~
llTb(°C) ~/
,// --6 " 10
10- 3 10- 2 10- 1
Figure 5.11 ExperimentaZZy determined area averaged growth rates of ice in dextrose solutions as a·function of bulk supercaoZing
From figure 5.11 it can be seen that the area averaged growth rateis
approximately linearly proportional to the bulksupercooling. Forther
more va increases with increasing stirring rate and with decreasing
dextrose concentration. From the experimental data the following corre
lations can be determined:
0.9110-4 LITb 0.91 for 15, ëb 29.7 V nr
a
2.9510-4 LITb l. 03 for 20, ëb 26.0 (5-ll) V nr
a
= l. 7310-4 LITb 0.97 for 27, ëb = 29.5 V nr = a
These experimentally determined growth rates wil! now be compared to
theoretica! values of the area averaged growth rates calculated by
means of the equations derived in chapter 3. Therefore the integrals
of eq.(5-8) are calculated numerically after solving population balance
eq. (4-4) for steady state conditions:
76
d(n(r)v(r)) d r
(5-12)
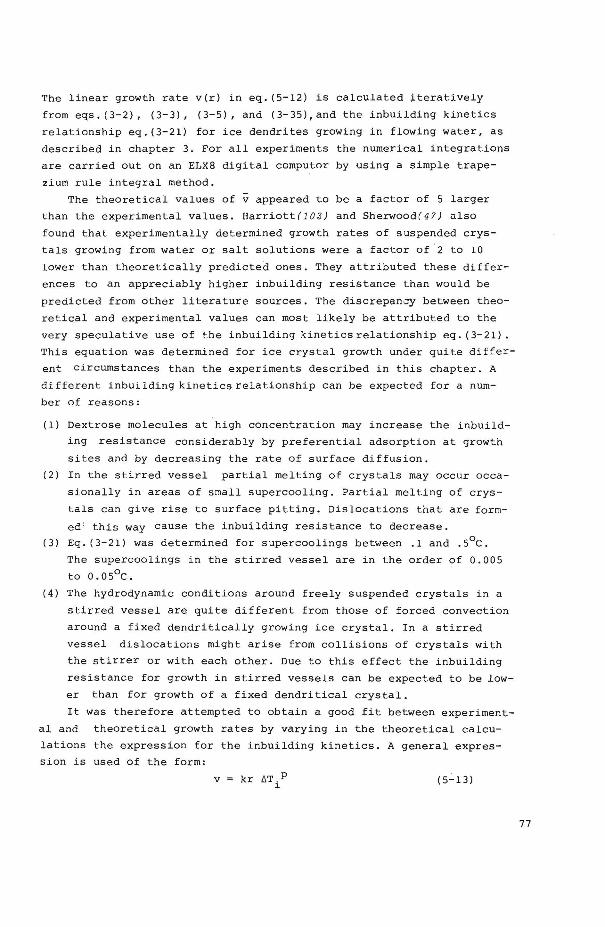
The linear growth rate v(r) in eq. (5-12) is calculated ~teratively
from eqs.(3-2), (3-3), (3-5), and (3-35),and the inbuilding kinetics
relationship eq.(3-21) for ice dendrites growing in flowing water, as
described in chapter 3. For all experiments the numerical integrations
are carried out on an ELX8 digital computor by using a simple trape
zium rule integral method.
The theoretical values of v appeared to be a factor of 5 larger
than the experimental values. Harriott(l03) and Sherwood(47) also
found that experimentally determined growth rates of suspended crys
tals growing from water or salt solutions were a factor of ·2 to 10
lower than theoretically predicted ones. They attributed these differ
ences to an appreciably higher inbuilding resistance than would be
predicted from other literature sources. The discrepancy between theo
retical and experimental values can most likely be attributed to the
very speculative use of the inbuilding kineticsrelationship eq. (3-21).
This equation was determined for ice crystal growth under quite differ
ent circumstances than the experiments described in this chapter. A
different inbuildingkineticsrelationship can be expected fora num
ber of reasons:
(1) Dextrose molecules at high concentratien may increase the inbuild
ing resistance considerably by preferential adsorption at growth
sites and by decreasing the rate of surface diffusion.
(2) In the stirred vessel partial melting of crystals may occur occa
sionally in areas of small supercooling. Partial melting of crys
tals can give rise to surface pitting. Dislocations that are form
ed' this way cause the inbuilding resistance to decrease.
(3) Eq. (3-21) was determined for supercoolings between .1 and .5°C.
The supercoolings in the stirred vessel are in the order of 0. 005
to 0.05°C.
(4) The hydrodynamic conditions around freely suspended crystals in a
stirred vessel are quite different from those of forced conveetien
around a fixed dendritically growing ice crystal. In a stirred
vessel dislocations might arise from collisions of crystals with
the stirrer or with each other. Due to this effect the inbuilding
resistance for growth in stirred vessels can be expected to be low
er than for growth of a fixed dendritical crystal.
It was therefore attempted to obtain a good fit between experiment
al and theoretical growth rates by varying in the theoretical calcu
lations the expression for the inbuilding kinetics. A general expres
sion is used of the form:
V= kr liT.P ~
(5-13)
77

By means of trial and error it has been found that the best agreement
between all experimental and theoretica! growth rates is obtained for
a value of the exponent p = 1 and a concentratien dependency of the
inbuilding rate constant kr. The values of kr for which the best fit
between experimental and theoretica! growth rates are obtained are
given in table 5.4 together with the appropiate values of nr and eb.
The number of experiments that have been used to obtain these average
kr values is indicated in the last column.
kr(cm/sec) nr(rps) eb (wt%) number of exps.
0.1510-3 15 29.7 11
0.2610-3 20 26.0 17
0.2010-3 27 29.5 13
0.6910-3 20 10.4 2
0.1810-3 20 29.4 2
0.8210-4 20 41.5 4
Table 5.4 VaLuea of the rate constant kr for firat order inbuiZding kinetica
In figure 5.12 the experimentally determined area averaged growth
rates are compared to the theoretica! ones calculated with the val
ues of kr from table 5. 4. From the data in table 5. 4 i t can be seen
that the inbuilding resistance increases slightly with decreasing
nr. The effect of dextrose concentratien on kr is graphically repre
sented in figure 5.13 on a semi-logarithmic scale. The relationship
between kr and eb for nr 20 can be approximated by:
(5-14)
From this equation it follows for the linear growth rate in the
a-axis direction:
(5-15)
A possible explanation for the decrease of kr with increasing eb has
already been suggested in chapter 3.3.3: if it is assumed that dex
trose molecules adsorb at the crystal surface, the fraction fr of the
total area available for growth, as given in eq. (3-7), will decrease
considerably with increasing eb. Furthermore, the diffusion coeffi
cient of water molecules in the solution near the interface also de
creases with increasing eb. Dextrose molecules will prevent screw
78
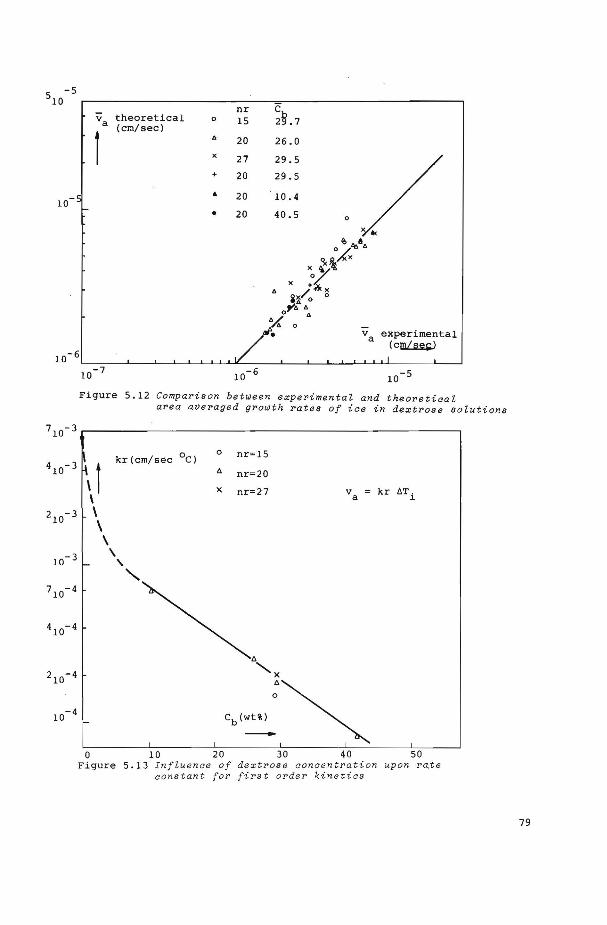
-5 510 r-------------------~--~--------------------~
10
va experimental (c~
Figure 5.12 Comparison between experimental and theoretical area averaged growth rates of ice in dextrose solutions
71o- 3 r------------------------------------------------.
d \ \ \ \
kr(cm/sec °C)
\
' '
0
x
nr=15
nr=20
nr=27 kr 6T. l.
0 10 20 30 40 50 Figure 5.13 Influence of dextrose concentrati on upon ra~e
constant for first orde r kinetics
79
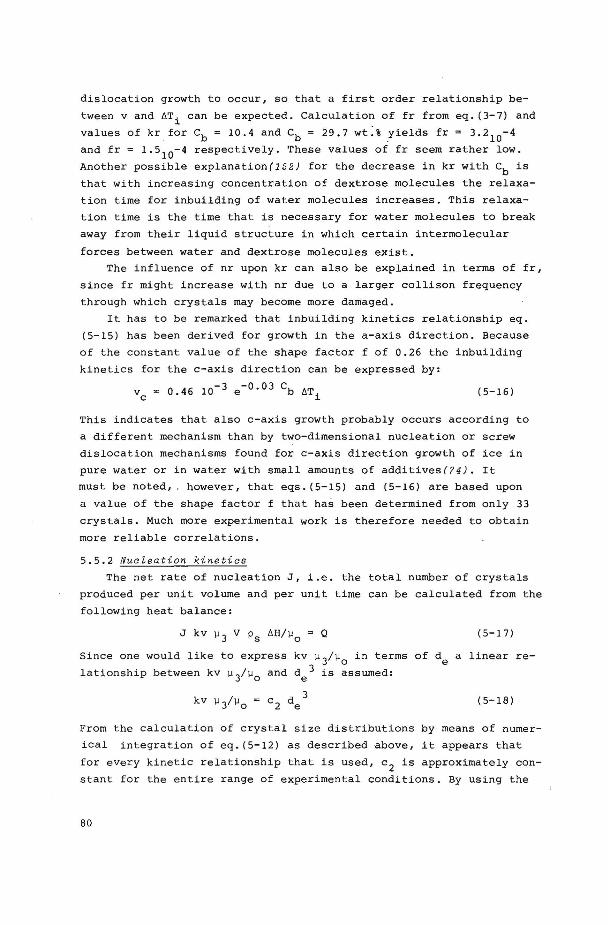
dislocation growth to occur, so that a first order relationship be
tween v and öTi can be expected. ealculation of fr from eq. (3-7) and
values of kr for eb= 10.4 and eb= 29.7 wt:% yields fr = 3.2 10-4
and fr = 1.510
-4 respectively. These values of fr seem rather low.
Another possible explanation(152J for the decrease in kr with eb is
that with increasing concentratien of dextrose molecules the relaxa
tion time for inbuilding of water molecules increases. This relaxa
tion time is the time that is necessary for water molecules to break
away from their liquid structure in which certain intermolecular
forces between water and dextrose molecules exist.
The influence of nr upon kr can also be explained in terms of fr,
since fr might increase with nr due to a larger collisen frequency
through which crystals may become more damaged.
It has to be remarked that inbuilding kinetics relationship eq.
(5-15) bas been derived for growth in the a-axis direction. Because
of the constant value of the shape factor f of 0.26 the inbuilding
kinetics for the c-axis direction can be expressed by:
(5-16)
This indicates that also c-axis growth probably occurs according to
a different mechanism than by two-dimensional nucleation or screw
dislocation mechanisms found for c-axis direction growth of ice in
pure water or in water with small amounts of additives(74). It
must be noted, . however, that eqs. (5-15) and (5-16) are based upon
a value of the shape factor f that has been determined from only 33
crystals. Much more experimental work is therefore needed to obtain
more reliable correlations.
5.5.2 Nuc ~ e ation ki netics
The net rate of nucleation J, i.e. the total number of crystals
produced per unit volume and per unit time can be calculated from the
following beat balance:
(5-17)
Since one would like to express kv ~ 3 ;~0 in terms of de a linear re
lationship between kv ~ 3;~0 and de 3 is assumed:
(5-18)
From the calculation of crystal size distributions by means of numer
ical integration of eq.(5-12) as described above, it appears that
for every kinetic relationship that is used, c2
is approximately con
stant for the entire range of experimental conditions. By using the
80
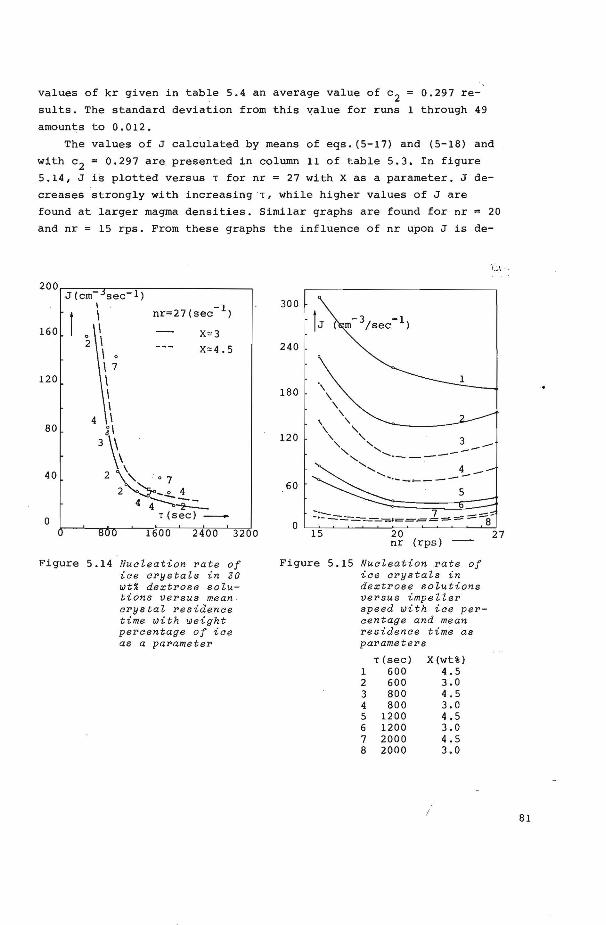
values of kr given in table 5.4 an average value of c 2 0.297 re
sults. The standard deviation from this value for runs 1 through 49
amounts to 0.012.
The values of J calculated by means of eqs. (5-17) and (5-18) and
with c 2 = 0.297 are presented in column 11 of table 5.3. In figure
5.14, J is plotted versus 1 for nr = 27 with X as a parameter. J de
creases strongly with increasing .,, while higher va1ues of Jare
found at larger magma densities. Similar graphs are found for nr = 20
and nr = 15 rps. From these graphs the influence of nr upon J is de-
200 J (cm- sec-1)
I -1 I nr=27 (sec )
160 I X:e3 0
I 2 X::o4.5 I 0
I 7 120 I
I I I
80 .!I
3\\
40 2 \' 0 7 2'~--2...4 40~
0 1(sec)-
1600 2400 3200
Figure 5.14 Nucleation rat e of ice crystaZs in JO wt% dextrose solutions versus mean crystaZ residence time with weight percentage of ice as a parameter
300
240
180
120
., \
\ \
\ \
\ ' '\ ' 3 ' ' ' ................ ______ _
1~\ '
''~~ 4 .......... ---..... _____ _
60
0
5
:::::-::__-:_-=----=---=--=•===2 == ==8-
15 20 27 nr (rps) --
Figure 5.15 Nuc leation rate of ice crystals i n de xtros e solutions versus i mpe Zler speed with ice percentage and mean r es idence time as parameters
1(sec) 1 600 2 600 3 800 4 800 5 1200 6 1200 7 2000 8 2000
X(wt%) 4.5 3.0 4.5 3.0 4.5 3 . 0 4.5 3.0
I 81
termined for various cornbinations of X and T. The results are given
in figure 5.15.
It is evident from figure 5.15 that the relative influence of the
stirrer speed on J is less than those of X and T. The minima in the
J-nr plots that occur at some cornbinations of X and T can, at least
partly, be ascribed to the effect of smaller bulksupercoolings for the
experiments with nr = 20, resulting in a lower nucleation rate. By
means of a crude estimation of the correction factor for this concen
tratien effect at nr = 20, values of J are obtained that decrease mo
notonously with nr in most cases. The decrease in J with increasing
nr can be ascribed to a better suspension of ice crystals at larger
stirring speeds. At values of nr < 14 rps, ice crystals float on the
surface of the solution and direct contact of the supercocled feed
stream with these crystals gives rise to the formation of dendritic
ice at extremely large nucleation rates. This effect of poor suspen
sion probably also explains the large nucleation rates of ice in water
at nr = 16, as can be seen from figure 5.4.
In chapter 2 it has been suggested that secondary nucleation occurE
by one or a combination of the following mechanisms:
l. Nucleation by breakage of dendrites from the crystal surf ace;
2. Nucleation by shearing off parts of a structured layer at the crys-
tal surface;
3. Nucleation by mechanica! breakage of crystals.
It was furthermore pointed out that the nucleation rate due to crystal
breakage linearly depends upon the power input of the impeller per
unit mass of suspension, which is proportional to the impeller speed
to the third power.
For nucleation of ice crystals from dextrose solutions or from
water, the influence of nr on J is not very large except for the lower
impeller speeds where the suspension effect becomes important. It can
be concluded therefore, that nucleation due to mechanism 3 can only
have a small eff~ct on the total nurnber of crystals formed. The power
required for nuclèatlon due to shearing-off dendrites or parts of the
structure layer is próbably much smaller than that required for break
a~e of crystals. It is possible therefore that already at the lowest
shear forces that are encountered, nucleation rates result that hardly
increase with further increase of the shear force as long as nucleation
mechanism 3 does not occur. Nucleation of ice crystals from solutions
at supercoolings in the order of 0.01°C is not likely to occur by mech
anisro 2 since the size of a critica! nucleus at these supercoolings
82
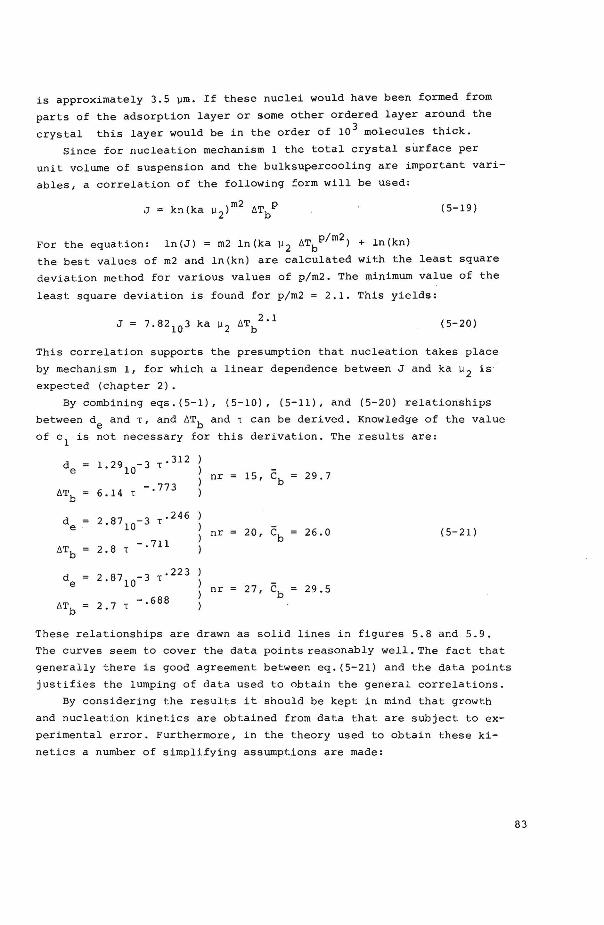
is approximately 3.5 ~m. If these nuclei would have been formed from
parts of the adsorption layer or some other ordered layer around the
crystal this layer would be in the order of 10 3 molecules thick.
Since for nucleation mechanism 1 the total crystal surface per
unit volurne of suspension and the bulksupercooling are important vari
ables, a correlation of the following form will be used:
J = kn(ka )m2 óT P 11 2 b (5-19)
For the equation: ln(J) = m2 ln(ka ~ 2 óTbp/m2
> + ln(kn)
the best values of m2 and ln(kn) are calculated with the least square
deviation method for various values of p/m2. The minimum value of the
least square deviation is found for p/m2 = 2.1. This yields:
(5-20}
This correlation supports the presurnption that nucleation takes place
by mechanism 1, for which a linear dependenee between J and ka ~ 2 is
expected (chapter 2}.
By cornbining eqs. (5-1), (5-10), (5-11}, and (5-20) relationships
between de and T, and óTb and T can be derived. Knowledge of the value
of c1
is not necessary for this derivation. The results are:
d e
d e
1.2910-3 T.312
6.14 T -. 773
2.8710-3 T.246
2.8 T -. 711
2.8710-3 T.223
2.7 T -.688
nr 15, ëb 29.7
nr 20, ëb 26.0 (5-21)
nr 27, ëb 29.5
These relationships are drawn as solid lines in figures 5.8 and 5.9.
The curves seem to cover the data points reasonably we1l.The fact that
generally there is good agreement between eq.(5-21) and the data points
justifies the lurnping of data used to obtain the general correlations.
By considering the results it should be kept in mind that growth
and nucleation kinetics are obtained from data that are subject to ex
perimental error. Furthermore, in the theory used to obtain these ki
netics a nurnber of simplifying assurnptions are made:
83

1. The effective diameter data may be wrong due to:
a) experimental errors in permeability and porosity measurements;
b) incorrect application of eqs.(5-2) and (5-4), as discussed in
chapter 5.3.2.
2. The bulksupercooling is obtained by linear averaging of 9 to 12
local bulksupercoolings. One of the measuring locations has always
been chosen close to the entrance of the supercocled feed stream.
It is questionable whether or not the temperature at 1 point out of·9 or
12 is a satisfactory representation of the temperature of the "cold
volume". Since the nucleation rate appears to be second order in
bulksupercooling, linear averaging is actually not allowed.
3. The population balance is solved by assuming a steady state crys
tal size distribution. Since the experiments were stopped at times
only slightly longer than 3 1 after the onset of nucleation, fully
steady state distributions are not reached.
4. Other assumptions are:
a) the crystal residence time distribution approaches that of an
ideal mixer and
b) no breakage of crystals occurs except for attrition giving rise
to nuclei in the order of the critica! size.
5.6 Growth and nucleation kinetics of ice from water
5.6.1 Growth kinetias
For every experiment with water only one local value of the sus
pension supercooling was measured. From the large variations in local
supercooling that were measured afterwards(l?) it can be concluded
that these single local values of 6Tb do not represent the average
bulksupercooling adequately. From the average values of 6Tb in the
experiments with dextrose solutions, it can be seen from figure 5.9
that 6Tb hardly varies with nr or X. In order to obtain a more reli
able value of 6Tb for the water experiments, therefore, the bulksuper
coolings obtained at one value of T and various combinations of X and
nr are averaged algebraically.
Growth kinetics for ice crystals suspended in water can be obtained
in a similar way as described in 5.5.1 for growth from dextrose solu
tions, i.e. by trying to match area averaged growth rates va calcula
ted from the experimental data, and from theory. Again, theoretica!
values of va are determined by numerical calculation of the integrals
of eq. (5-8) after solving the population balarice eq. (5-12). These cal
culations are carried out for various inbuilding kinetic relationships.
For all calculations, values of c 2 as defined by eq.(5-18), are deter
mined. For every c 2 , values of de can then be calculated from the nu-
84
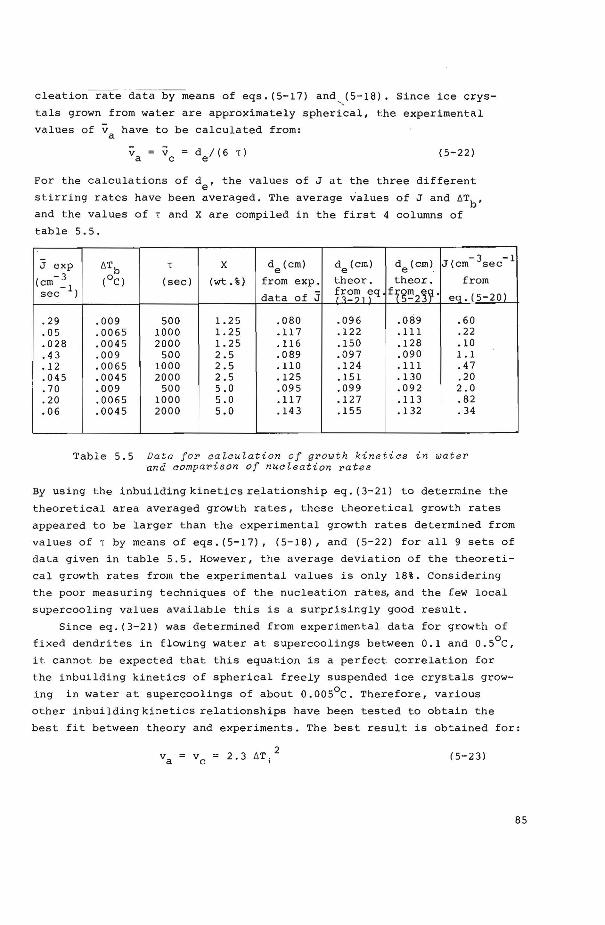
cleation rate data by means of eqs. (5-17) and ,_(S-18). Since ice crys
tals grown from water are approximately spherical, the experimental -values of va have to be calculated from :
(5-22)
For the calculations of de' the values of J at the three different
stirring rates have been averaged. The average values of J and óTb,
and the values of T and X are compiled in the first 4 columns of
table 5.5.
J exp d e(cm) de(cm) d (cm) J(cm- 3sec óTb T x e . (cm- 3 (OC) (sec) (wt.%) from exp. theor. theor. from
-1
-1
sec J data of J H~~,~q f?~~2~~· eq.(S-20)
.29
.os
.028
.43
.12
.045
.70
.20
.06
.009 500 1.25 .080 .096 .089 .60
.0065 1000 1. 25 .117 .122 .111 .22
.0045 2000 1. 25 .116 .150 .128 .10
.009 500 2.5 .089 .097 .090 1.1
.0065 1000 2.5 .110 .124 .111 .47
. 0045 2000 2.5 .125 .151 .130 .20
.009 500 5.0 .095 .099 .092 2.0
.0065 1000 5.0 .117 .127 .113 .82
.0045 2000 5.0 .14 3 .155 .132 .34
Table 5.5 Data f or aalau la tion of growt h ki n e tias i n water and aompari son of nualea t i on ra t es
By using the inbuilding kinetics relationship eq. (3-21) to determine t he
theoretica! area averaged growth rates, these theoretica! growth rates
appeared to be larger than the experimental growth rates determined from
values of T by means of eqs.(S-17), (5-18), and (5-22) for all 9 sets of
data given in table 5 . 5. However, t h e average deviation of the theoreti
ca! growth rates from the experimental values is only 18%. Considering
the poor measuring techniques of the nucleat ion rates, and t he few local
supercooling values available this is a surprisingly good result.
Since eq. (3-21) was determined from experimental data for growth of
fixed dendrites in flowing water at supercoolings between 0.1 and 0.5°C,
it cannot be expected that this equation is a perfect correlation for
the inbuilding kinetics of spherical freely suspended ice crystals grow
ing in wat er at supercoolings of about O.OOS0 c. Therefore, various
other inbuilding kinetic s relationships have been tested to obtain the
best fit between theory and experiments. The best result is obtained for:
( 5-23)
85

Values of de calculated by means of this equation are also given in ta
ble 5.5. The average difference between the theoretica! and experimental
values is 4.8%. The best first order kineticsrelationship that could be
found is: (5-24)"
In this case an average deviation of 8.5% results. As opposed to the
results with eq. (5-23) the differences between theoretica! and experi
mental growth rates found with eq. (5-24) are a function of óTb. Equa
tion(5-23) is therefore favorable.
For the conditions given in table 5.5 it can be calculated by means
of eq.(5-23) that the growth rate of ice crystals of 1 mm diameter,
freely suspended in water, is for 41 to 51% inbuilding controlled.
5.6.2 NucZeat i on kinetica
In order to obtain a nucleation correlation one would like to cor
relate values of J with average values of óTb, and with Atot or X.
Since for the crystallization experiments of ice from water only one
local value of óTb was measured for every experiment and X and óTb were
not varied independently of each other,a reliable nucleation correla
tion could not be obtained. It will only be attempted therefore,to
compare the nucleation rates from table 5.5 with nucleation rates cal
culated by means of correlation(5-20) for the nucleation rate of ice
crystals in dextrose solutions.
Values of ka ~ 2 were calculated from eq. (5-6) after calculating
de from the area averaged growth rates that were determined by means
of eq. (5-23) by the method described above. The values of J determined
from eq. (5-20) are compiled in the last column of table 5.5.
The calculated values of J appear to be much larger than the ex
perimental values. With some restrietion it can therefore be concluded
that the rate of secondary nucleation of ice crystals in dextrose so
lutions is larger than that in water at otherwise equal conditions. The
larger nucleation rate in dextrose solutions can possibly be explained
by the fact that ice crystals grown in dextrose solutions are v e ry
weak, as was pointed out already in chapter 3.3 . 2. Consequently, growth
blocks at the interface may easily be broken off.
Whether seconda~y nucleation in water takes place in the whole sus
pension volume or entirely in the cold spots cannot be concluded
since the average supercooling and the supercooling in the cold spot s
probably change in the same manner.
5.7 Crystal size distributions
5.7.1 Si ze di stribution s o f ice c ry s taZ s in dextrose solution s
The crystal size distributions that have been determined for runs
35, 39 and 40 are presented in figure 5.16. In these histograms the
86
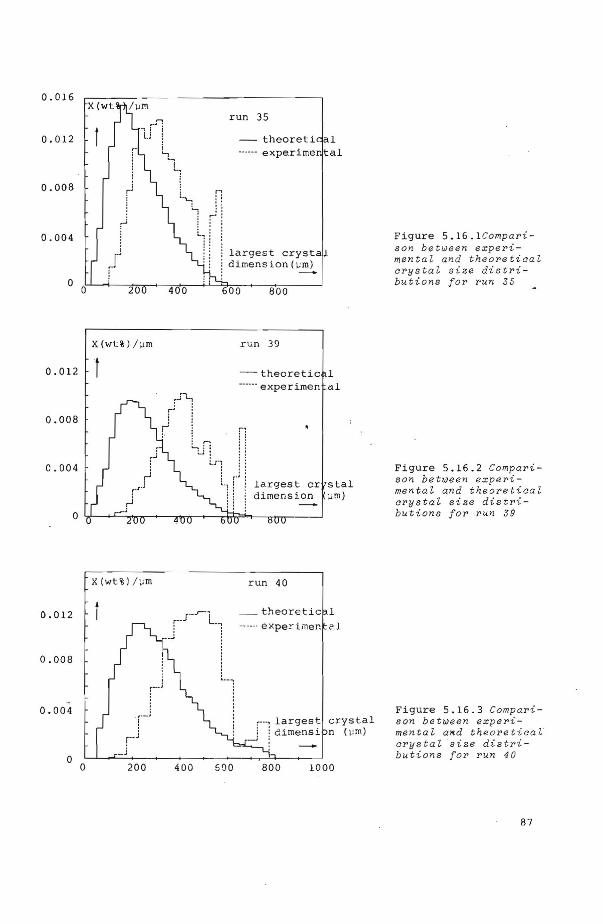
0.016
0.012
0.008
0 . 004
0
X(~l\:%) h m
0.012 t
0.008
0.004
0
X(wt%)/:.;m
0.012
0.008
0.004
0 0 200 400
run 35
- theoreti 1 ------ e xperime tal
larges t crysta dimens ion( ~Jm)
600 800
500
run 39
- t heoretic 1 ------ e xperimen a1
1argest er stal d imension ;;m)
run 40
__ theoretic 1
-----· e xper i men é'.l
r, largest crystal ! ! d imensi n ( l!m)
~~ .
800 1000
Figure 5.16 . 1Compari son between expe r i mental an d theor etical crysta l size distri bution s f or run 35
Figure 5.16 . 2 Comparis on between ex peri mentaZ and theo r et i cal c r ys ta l s i z e dist r i bution s f or run 39
Figure 5.16.3 Compari s on between experi mental a~d theo r eticaf cry stal size dis t ri butions fo r run 40
87
weight percentage ot crystals in a certain size interval is plotted
versus crystal size, i.e. the largest crystal dimension. The numbers
of crystals that have been measured are 251, 222, and 413 for runs 35,
39, and 40 respectively(14 8 ). These numbers are actually much too low
to obtain a reasonable distribution over 30 size intervals of 25 microns. These crystal size distributions are compared to theoretica!
size distributions determined by numerical integration of the popula
tion balance and eq.(5-14), as described above.
For all three runs the effective diameters determined from measu
ring the crystals are 1.35- 1.7 times the effective diameters deter
mined from the permeability measurements.
In all cases the experimentally observed crystal size distributions
appear to c ontain a much lower percentage of small crystals than the
theoretica! ones. Other investigators(4?, 16,151) also found a relative
ly low percentage of smal! crystals. One possible explanation for
this discrepancy is that, notwithstanding the accurate temperature con
trol in the sampling and microscopie techniques, still many of the
smal! crystals melt or grow before they are observed. Another reason
may be that several smal! crystals could not or not completely be ob
served under the microscope since they were covered by larger crystals.
Furthermore, some agglomerates could be observed that contained many
smal! crystals, a large number of which could not be measured.
The population densities that have been obtained from the popula
tion balance for inbuilding kinetics relationship eq. (5-14) are
plotted versus crystal size (disk radius) in figure 5.17 for runs 35,
37,and 40. Since the growth rate is almost completely inbuilding con
trolled, plotting the logarithm of the population density versus line
ar crys tal s ize yields a straight line, as has been described in c hap
ter 4.1. Only for very smal! crystals does the_curvature (Gibbs-Thomson)
effect become important, resulting in deviations from the straightlines.
From the slope of the line a nd the mean residence time, the average
growth r a te can be calculated · as described in chapter 4.1. The
nucleation rate can be found by multiplying this growth rate with the
population de nsity that is found at the intersect ien of t he extrapol
ated s tra i9ht line and the ordinate at the critica! crystal size, (eq.
(4-11)). The nucleation rates that have been calculated with this simple
method are only 6-10% lower t han the "co rrect" nucle ation rat es that
take the Gibbs-Thomson effect into account.
5.7 . 2 Si ze dist~i butions of iae a~ysta~s i n wate~
The simple method describe d above to dete rmine J from the popula
tion density plots cannot be applied for ice crystal growth from water,
as can be seen from figure 5.18. This population density plot is calcu-
88
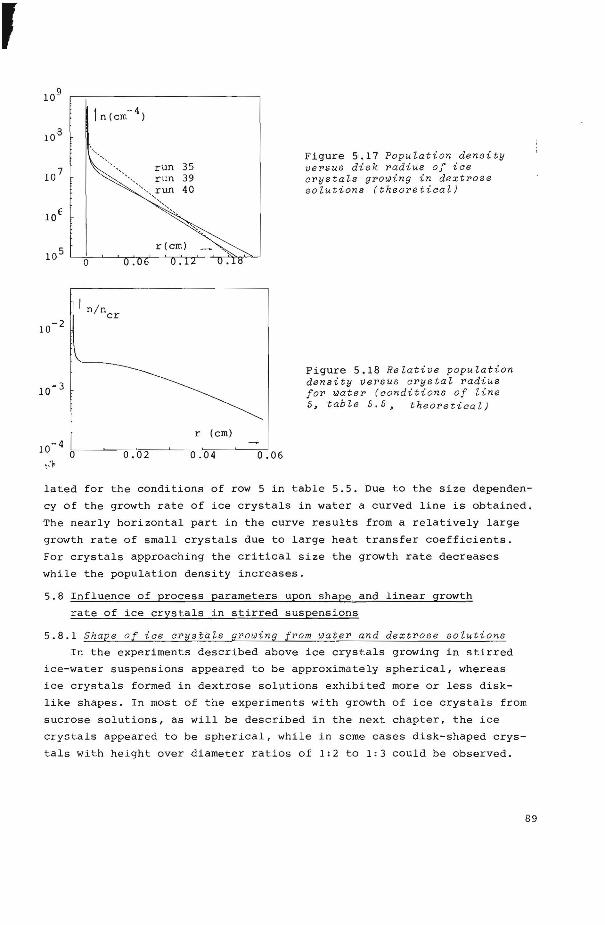
J
10 9
I n/n er
0.02
run 35 39 40
r (cm)
0. 04 0.06
Figure 5.17 PopuZation density ve~sus disk ~adius of ice c~ystaZs g~owing in dext~ose soZutions ( theo~eticaZ)
Figure 5.18 ReZative popuZation density ve~sus c~ystaZ ~adius fo~ wate~ (conditions of Zine 5, tab Ze 5. 5, theo~etical)
lated for the conditions of row 5 in table 5.5. Due to the size dependen
cy of the growth rate of ice crystals in water a curved line is obtained.
The nearly horizontal part in the curve results from a relatively large
growth rate of smal! crystals due to large heat transfer coefficients.
For crystals approaching the critica! size the growth rate decreases
while the population density increases.
5.8 Influence of process parameters upon shape and linear growth
rate of ice crystals in stirred suspensions
5.8.1 Shape of ice c~ysta~s growing [~om wate~ and dext~ose soZuti ons
In the experiments described above ice crystals growing in stirred
ice-water suspensions appeared to be approximately spherical, whereas
ice crystals formed in dextrose solutions exhibited more or less disk
like shapes . In most of the experiments with growth of ice crystals from
sucrose solutions, as will be described in the next chapter, the ice
crystals appeared to be spherical, while in some cases disk-shaped crys
tals with height over diameterratiosof 1:2 to 1:3 could be observed.
89
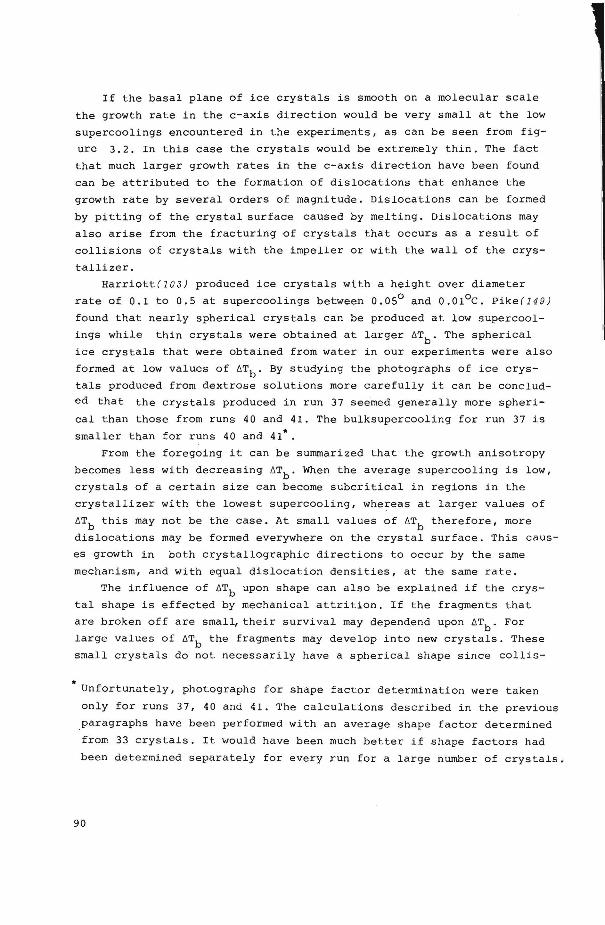
If the basal plane of ice crystals is smooth on a molecular scale
the growth rate in the c-axis direction would be very small at the low
supercoolings encountered in the experiments, as can beseen from fig
ure 3.2. In this case the crystals would be extremely thin. The fact
that much larger growth rates in the c-axis direction have been found
can be attributed to the formation of dislocations that enhance the
growth rate by several orders of magnitude. Dislocations can be formed
by pitting of the crystal surface caused by melting. Dislocations may
also arise from the fracturing of crystals that occurs as a result of
collisions of crystals with the impeller or with the wall of the crys
tallizer.
Harriott(103) produced ice crystals with a height over diameter
rate of 0.1 to 0.5 at supercoolings between 0.05° and 0.01°C. Pike(l49)
found that nearly spherical crystals can be produced at low supercool
ings while thin crystals were obtained at larger óTb. The spherical
ice crystals that were obtained from water in our experiments were also
formed at low values of óTb. By studying the photographs of ice crys
tals produced from dextrose solutions more carefully it can be conclud
ed that the crystals produced in run 37 see.med generally more spheri
cal than those from runs 40 and 41. The bulksupercooling for run 37 is
smaller than for runs 40 and 41*.
From the foregoing it can be summarized that the growth anisotropy
becomes less with decreasing óTb. When the average supercooling is low,
crystals of a certain size can become subcritical in regions in the
crystallizer with the lowest supercooling, whereas at larger values of
óTb this may not be the case. At smal! values of óTb therefore, more
dislocations may be formed everywhere on the crystal surface. This eaus
es growth in both crystallographic directions to occur by the same
mechanism, and with equal dislocation densities, at the same rate.
The influence of óTb upon shape can also be explained if the crys
tal shape is effected by mechanica! attrition. If the fragments that
are broken off are small, their survival may dependend upon óTb. For
large values of óTb the fragments may develop into new crystals. These
small crystals do not necessarily have a spherical shape since collis-
* Unfortunately, photographs for shape factor determination were taken
only for runs 37, 40 and 41. The calculations described in the previous
.paragraphs have been performed with an average shape factor determined
from 33 crystals. It would have been much better if shape factors had
been determined separately for every run fora large number of crystals;
90
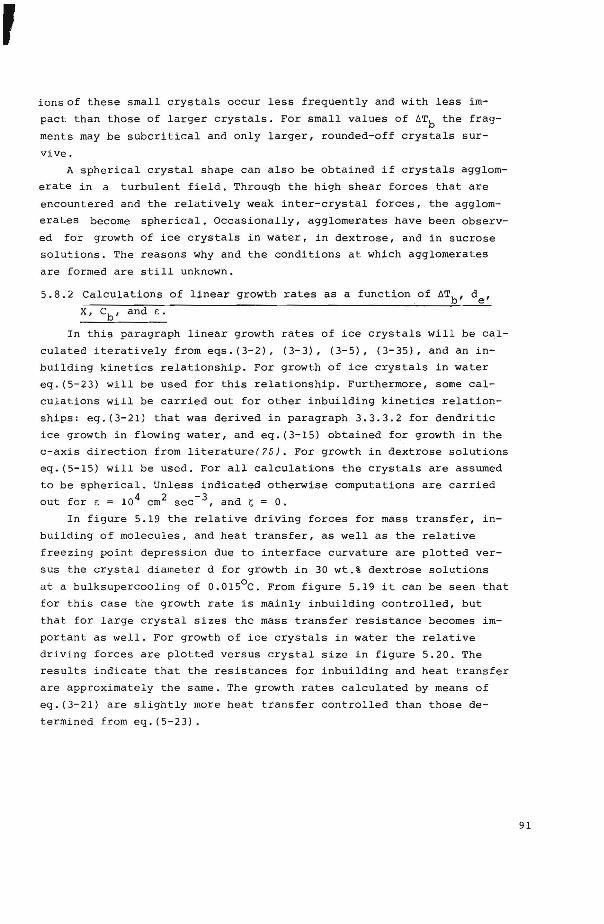
r ionsof these smal! crystals occur less frequently and with less im
pact than those of larger crystals. For smal! values of óTb the frag
ments may be subcritical and only larger, rounded-off crystals sur
vive.
A spherical crystal shape can also be obtained if crystals agglom
erate in a turbulent field. Through the high shear farces that are
encountered and the relatively weak inter-crystal farces, the agglom
erates become spherical. Occasionally, agglomerates have been observ
ed for growth of ice crystals in water, in dextrose, and in sucrose
solutions. The reasans why and the conditions at which agglomerates
are formed are still unknown.
5.8.2 Calculations of linear growth rates as a function of óTb, de,
x, eb, and E.
In this paragraph linear growth rates of ice crystals wil! be cal
culated iteratively from eqs. (3-2), (3-3), (3-5), (3-35), and an in
building kinetics relationship. For growth of ice crystals in water
eq. (5-23) wil! be used for this relationship. Furthermore, some cal
culations wil! be carried out for other inbuilding kinetics relation
ships: eq.(3-21) that was derived in paragraph 3.3.3.2 for dendritic
ice growth in flowing water, and eq.(3-15) obtained for growth in the
c-axis direction from literature(75J. For growth in dextrose so1utions
eq. (5-15) wi11 be used. For all calculations the crystals are assumed
to be spherical. Unless indicated otherwise computations are carried
out for E = 104 cm2 sec- 3 , and ç = 0.
In figure 5.19 the relative driving farces for mass transfer, in
building of molecules, and heat transfer, as wel! as the relative
freezing point depression due to interface curvature are plotted ver
sus the crystal diameter d for growth in 30 wt.% dextrose solut ions
at a bulksupercooling of 0.015°C. From figure 5.19 it can be seen that
for this case the growth rate is mainly inbuilding controlled, but
that for large crystal sizes the mass transfer resistance becomes im
portant as well. For growth of ice crystals in water the relative
driving forces are plotted versus crystal size in figure 5.20. The
results indicate that the resistances for inbuilding and heat transfer
are approximately the same. The growth rates calculated by means of
eq. (3-21) are slightly more heat transfer controlled than those de
termined fro m eq.( 5-23).
91
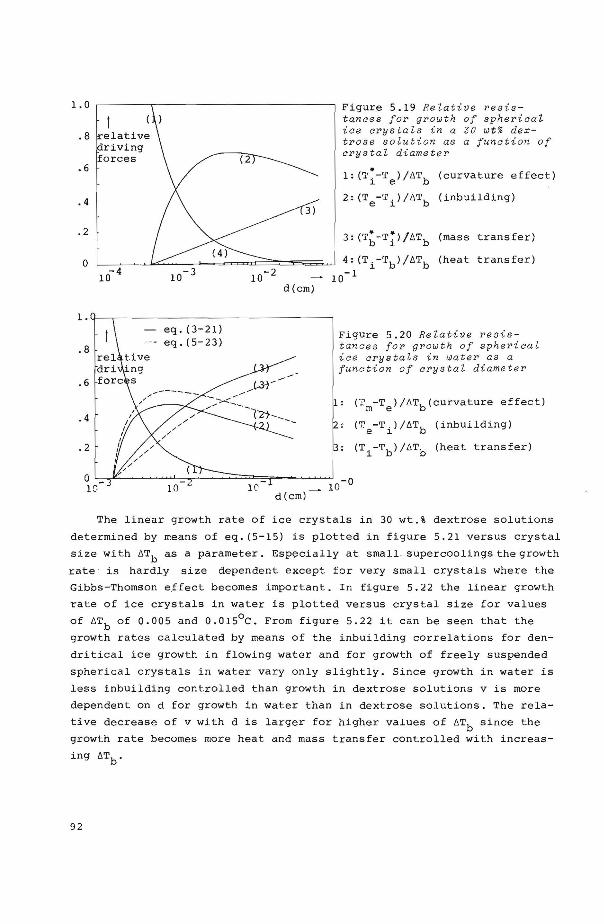
. 8
.6
. 4
• 2
eq. ( 3-21) eq.(S-23)
.... ------
3)
d(cm)
Figure 5.19 Relative res is tanaes for growth of spheriaal iae arystals in a JO wt% dextrose solution as a function of crystal diameter
1: (T~-T )/4Tb (curvature effect) ~ e
2: (Te-Ti)/4Tb (inbui1ding)
3: (T~-T~)/4Tb (mass transfer)
4: (Ti-Tb)/4Tb (heat transfer)
10- 1
Figure 5.20 Relative resistances for growth of spheriaal ice crystals in wat e r as a fun c tion of crystal diame t er
(?m-Te)/4Tb(curvature effect)
(~e-Ti)/4Tb (inbuilding)
(Ti-Tb)/4Tb (heat transfer)
The linear growth rate of ice crystals in 30 wt.% dextrose solutions
determined by means of eq. (S-15) is plotted in figure 5.21 versus crystal
size with 4Tb as a parameter. Especially at smal! . supercoolingsthegrowth
ra te · is hardly si ze dependent except for very smal! crystals where the
Gibbs-Thomson effect becomes important. In figure 5.22 the linear growth
rate of ice crystals in water is plotted versus crystal size for values
of 4Tb of 0.005 and 0.015°C. From figure 5.22 it can be seen that the
growth rates calculated by means of the inbuilding correlations for den
dritical ice growth in flowing water and for growth of freely suspended
spherical crystals in water vary only slightly. Since growth in water is
less inbuilding controlled than growth in dextrose solutions v is more
dependent on d for growth in water than in dextrose solutions. The rela
tive decrease of v with d is larger for higher values of 4Tb since the
growth rate becomes more heat and mass transfer controlled with increas
ing 4Tb.
92
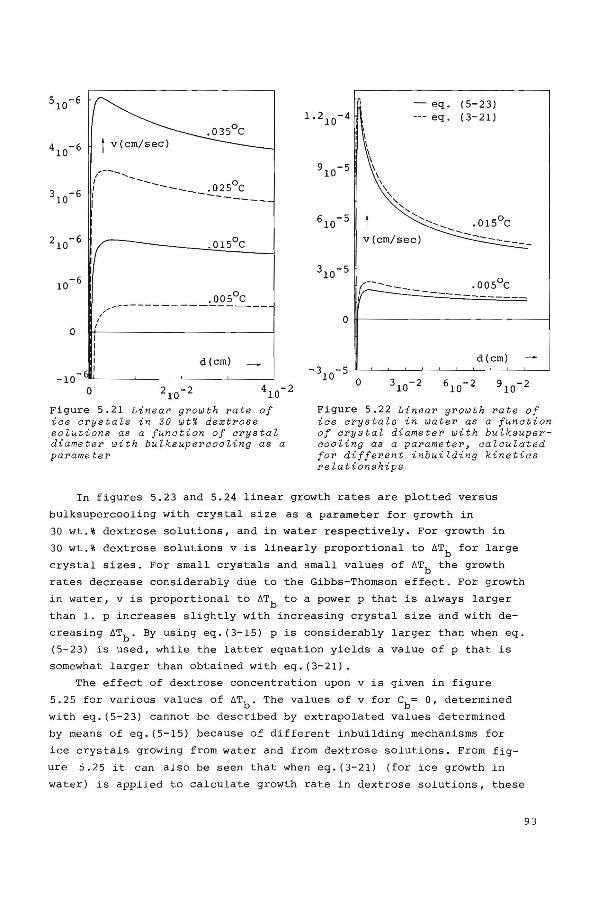
0
-10 0
/' I
I
.005°C -------------------
d(cm)
Figure 5.21 Linear growth rate of iae arysta~s in JO wt% dextrose so~utions as a fu n ation of arysta~ diameter with bu~ksupercooling as a paramete r
IÎ - eq. (5-23) --- eq . ( 3-21)
, ... ------, -----------
0 ~------------------------~
d(cm) -3 -5
10 0
Figure 5.22 Linear growth rate of iae crysta~s in water as a funation of crysta~ diameter with bulksupercoo~ing as a parameter, aa~aulated for different inbui~ding kinetias relationships
In figures 5.23 and 5.24 linear growth rates are plotted versus
bulksupercooling with crystal size as a parameter for growth in
30 wt.% dextrose solutions, and in water respectively. For growth in
30 wt.% dextrose solutions v is linearly proportional to öTb for large
crystal sizes. For small crystals and small values of öTb the growth
rates decrease considerably due to the Gibbs-Thomson effect. For growth
in water, vis proportional to öTb toa power p that is always larger
t han 1. p increases slightly with increasing crystal size and with de
creasing öTb. By using eq. (3-15) p is considerably larger than when eq.
(5-23) is used, while the latter equation yields a value of p that is
somewhat larger than obtained wi th eq. (3-21).
The effect of dextrose concentratien upon v is given in figure
5.25 for various values of öTb. The values of v for eb= 0, determined
with eq. (5-23 ) cannot be descr ibed by extrapolated values determined
by means of eq . (5-15) because of different inbuilding mechanisms for
ice crystals growing from water and from dextrose solutions. From fig
ure ::i.25 i t can al s o beseen t hat when eq. ( 3-21) (for ice growth in
water ) is applied to calculate growth rate in dextrose solutions, t hese
93
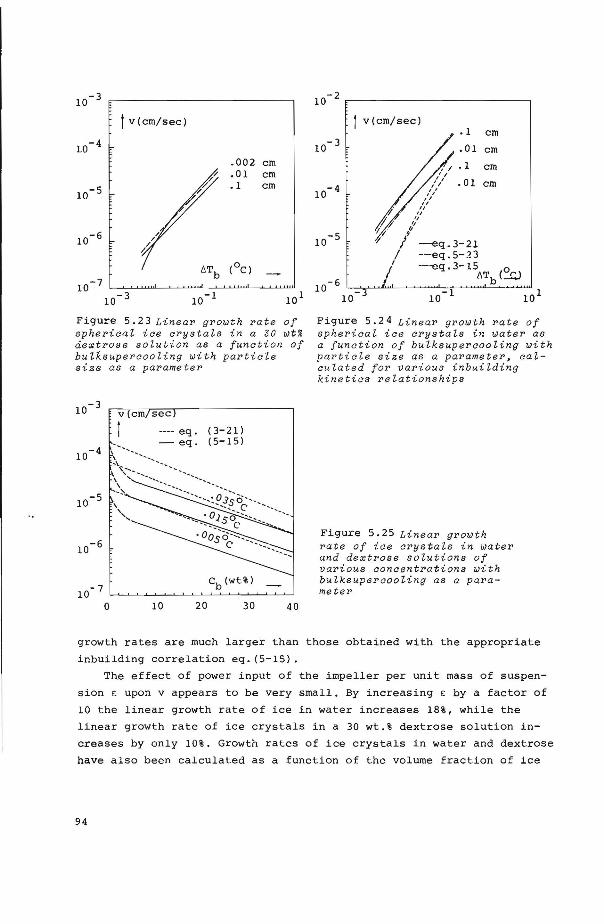
J v(cm/sec)
. 002 cm
.01 cm
.I cm
10 1
Figure 5.23 Linear growth rate of spherieal iee erystals in a JO wt% äe~trose soZu tion as a funetion of bulksupereooling with partiele size as a parameter
v(cm sec
I
eb (wt%)
IO 20 30 40
I0- 2
I v(cm/sec) .I cm
I0- 3 .OI cm
,'/ .1 cm 'I ', .OI
I0- 4 / I cm ,, ,, ,, " " " ,, ,, ,,
I0- 5 / --€q.3-2I I -·-eq. 5-23
I ··--cq. 3-15 I fiT(~ 10- 6 I b
10 10- 1 10 1
Figure 5.24 Linear growth rate of spherieaZ iee erystals in water as a tunetion of bulksupereooling with partiele size as a parameter, eaZeuZated for various inbuilding kineties reZationships
Figure 5.25 Linear growth rate of i ae arystaZs in water and dextrose solutions of various aoneentrations with buZksupereooZing as a parameter
growth rates are much larger than those obtained with the appropriate
inbuilding correlation eq. (5-15).
Th.e effect of power input of the impeller per unit mass of suspen
sion e upon v appears to be very small. By increasing E by a factor of
10 the linear growth rate of ice in water increases 18%, while the
linear growth rate of ice crystals in a 30 wt.% dextrose solution in
creases by only 10%. Growth rates of ice crystals in water and dextrose
have also been calculated as a function of the volume fraction of ice
94
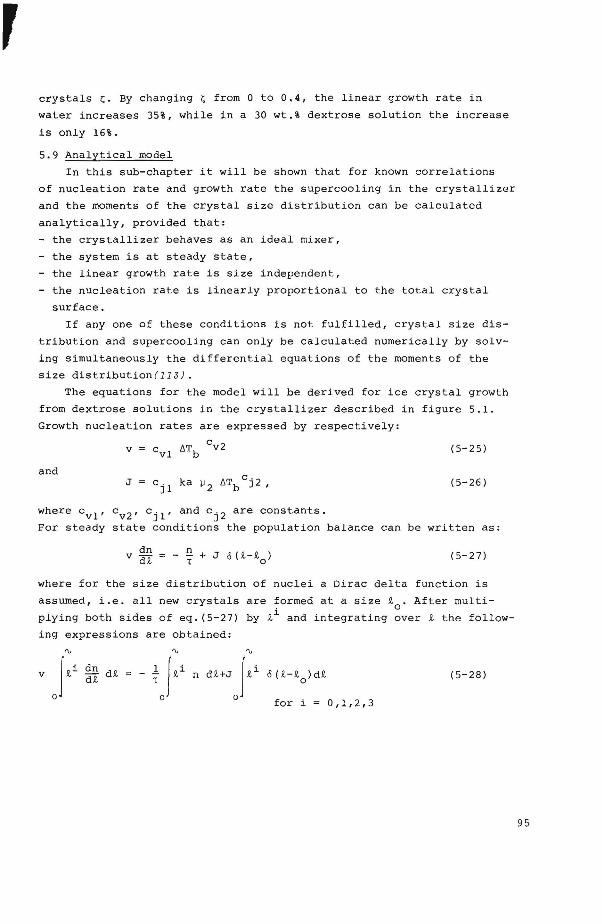
r crystals ç. By changing ç from 0 to 0.4, the linear growth rate in
water increases 35%, while in a 30 wt.% dextrose salution the increase
is only 16%.
5.9 Analytica! model
In this sub-chapter it will be shown that for known correlations
of nucleation rate and growth rate the supercooling in the crystallizer
and the moments of the crystal size distribution can be calculated
analytically, provided that:
- the crystallizer behaves as an ideal mixer,
- the system is at steady state,
the linear growth rate is size independent,
- the nucleation rate is linearly proportional to the total crystal
surface.
If any one of these conditions is not fulfilled, crystal size dis
tribution and supercooling can only be calculated numerically by solv
ing simultaneously the differential eguations of the moments of the
size distribution (113).
The eguations for the model will be derived for ice crystal growth
from dextrose solutions in the crystallizer described in figure 5.1.
Growth nucleation rates are expressed by respectively:
(5-25)
and (5-26)
where cv1 ' cv2 , cj 1 , and cj 2 are constants.
For steady state conditions the population balance can be written as:
v dn =- g + J ó ( ~- ~o) d~ t
(5-27)
where for the size distribution of nuclei a Dirac delta function i s
assumed, i.e. all new crystals are formed at a size ~ . After multi-. 0
plying both sides of eg. (5-27) by ~~ and integrating over ~ the follow-
ing expressions are obtained:
dn d~ d~
"' n d~+J ) ~ i
0
(5-28)
for i 0,1,2,3
95
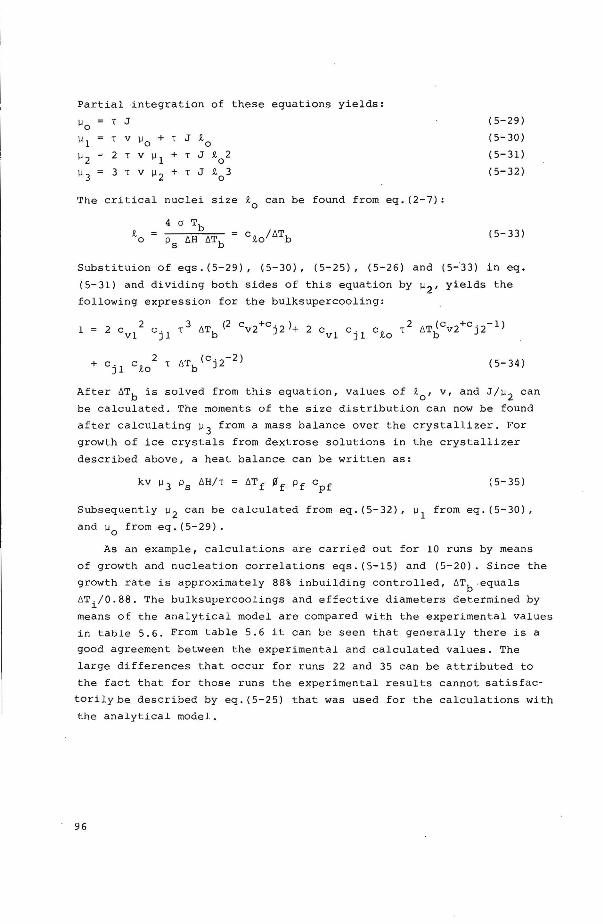
Partial ~ntegration of these equations yields:
llo 1 J
\11 1 V IJO + 1 J R, 0
112 2 1 V IJl + 1 J R, 2 0
113 3 1 V 11 2 + 1 J R, 0
3
The critica! nuclei size R-0
can be found from eq. (2-7):
R, o
(5-29)
(5-30)
(5-31)
(5-32)
(5-33)
Subs t ituion of eqs. (5-29), (5-30), (5-25), (5-26) and (5-'33) in eq.
(5-31) and dividing both sides of this equation by 112
, yields the
following expression for the bulksupercoolin g:
2 'Tb (cJ. 2-2) + cjl c R- 0 1 ._. ( 5-34)
After ATb is solved from this equation, values of R-0
, v, and J/11 2 can
be calculated. The moments of the size distribution can now be found
after calculating 113
from a mass balance over the crystalli zer. For
growth of ice crystals from dextrose solutions in the crystallizer
described above, a heat balance can be written as:
( 5-35)
Subsequently 11 2 can be calculated from eq. (5-32), 11 1 from eq. ( 5-30),
and 110
from eq. (5-29).
As an example, calculations are carried out for 10 runs by means
of growth and nucleation correlations eqs. (5-15) and (5-20). Since the
growth rateis approxi mately 88% inb uilding controlled, ATb .equals
ATi/ 0.88. The bulksupercoolings and effective diameters determined by
means of the analytica! model are compared with the experimental values
in table 5.6. From table 5.6 it can be seen that generally there is a
goed agreement between the experimental and calculated values. The
large differences that occur for runs 22 and 35 can be attributed to
the fac t that for these runs the e xperimental results cannot satisfac
torilybe described by eq.(5-25) that was used for t he calculat ions wi t h
the analytica! model.
96
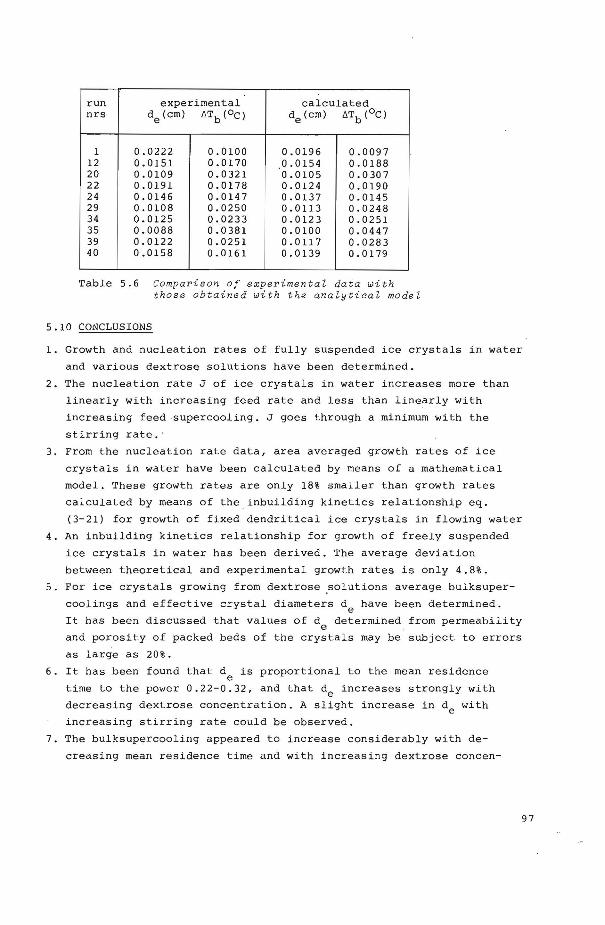
run experimental calculated nrs de(cm) /:"T (°C) de(cm) t"Tb(oC) b
1 0.0222 0.0100 0.0196 0.0097 12 0.0151 0.0170 0.0154 0.0188 20 0.0109 0.0321 0.0105 0. 0 30 7 22 0.0191 0.0178 0.0124 0.0190 24 0.0146 0.0147 0.0137 0.0145 29 0.0108 0.0250 0.0113 0.0248 34 0.0125 0.0233 0.0123 0.0251 35 0.0088 0.0381 0.0100 0.0447 39 0.0122 0.0251 0.0117 0.0283 40 0.0158 0.0161 0. 0139 0 .0 179
Table 5.6 CompaPison of expePimentaZ data with those obtained with the anaZyticaZ model
5.10 CONCLUSIONS
1 . Growth and nucleation rates of fully suspended ice crystals in water
and various dextrose solutions have been determined.
2. The nucleation rate J of ice crystals in water increases more than
linearly with increasing feed rate and less than linearly with
increasing feed supercooling. J goes through a minimum with the
stirring ra te. ·
3. From the nucleation rate data, area averaged growth rates of ice
crysta1s in water have been calculated by means of a mathematica!
model. These growth rates are only 18% smaller than growth rates
calculated by means of the inbuilding kinetics relationship eq.
(3-21) for growth of fixed dendritical ice crystals in flowing water
4. An inbuilding kinetics relationship for growth of freely suspended
ice crystals in water has been derived. The average deviation
between theoretica! and experimental growth rates is only 4.8%.
5. For ice crystals growing from dextrose .solutions average bulksuper
coolings and effective crystal diameters de have been determined.
It has been discussed that values of de determined from permeability
and porosity of packed beds of the crystals may be subject to errors
as large as 20%.
6. It has been found t hat de is proportional to the mean residence
time to the power 0 .22-0 .32 , and that de increases strongly with
decreasing dextrose concentration. A slight increase in de wi th
increasing stirring rate could be observed.
7. The bulksupercooling appeared to increase considerably wit h de
creasing mean residence time and with increasing dextrose concen-
97

tration, while a slight decrease has been found with increasing
stirring rate.
8. The area averaged growth rates calculated from the effective
diameter data appeared to be approximately linearly proportional
to the bulksupercooling.
9. The area averaged growth rates have been compared with t heoretica!
area averaged growth rates calculated by means of a mathematica!
model in which the population density balance is solved numerically.
A good fit between theory and experiments could only be obtained
by assuming first order inbuilding kinetics and a concentratien
dependency of the inbuilding rate constant.
10. The exponential decrease of the inbuilding rate constant with
dextrose .concentration has been explained in terms of an adsorption
of dextrose molecules at the crystal surface and of an interaction
of dextrose and water molecules in the boundary layer.
11. From de-data of ice crystals grown from dextrose solutions nuclea
tion rates have been calculated. The nucleation rates appeared to
decrease slightly with increasing stirring rate. Furthermore, a
large decrease in J could be observed with increasing mean residence
time and with decreasing magma density.
12. A nucleation rate correlation has been determined in which J is
linearly proportional to the total crystal surface per unit volume
of suspension and proportional to the bulksupercooling to the
power 2.1.
l3. Nucleation of ice in water and dextrose solutions most likely occurs
by breaking off dendrites from parent crystals. These dendrites
are probably formed in areas of large supercooling that arise from
non-instantaneous mixing of supercocled feed and crystal suspension.
With increasing stirring rate J decreases due to a larger degree
of mixing. However, in case of crystallization of ice from water
at large stirring rates an increase of J could be observed. This
increase is probably due to breaknge of parent crystals.
14. Ice crystals grown from water seem to be approximately spherical,
whereas ice crystals grown from dextrose solutions genera l ly ex
hibit the shape of a flat disk. The average height over diameter
ratio was found to be 0.26. The diffe rence in shape has been ex
plained by the fact that ice growth in wat er occurs at lower super
coolings.
15. An analytica! model has been derived by which under certain condi
tions supercooling and moments of the crystal size distribution can
98
be calculated for known growth and nucleation correlations. Bulksuper
coolings and effective crystal diameters calculated by means of the
model agree well with the experimental data.
99
CHAPTER 6
CRYSTALLIZATION OF ICE CRYSTALS IN A CONTINUOUS STIRRED RIPENING TANK FED WITH A SUSPENSION
OF SMALL CRYSTALS IN SUCROSE SOLUTIONS
6.1 Introduetion
In those cases where the nucleation rate is more dependent upon
supercooling than the linear growth rate, large crystals can only be
produced if supercoolings are kept smal! everywhere in the crystalliz
er. This is generally accornplished by applying srnall rates of heat
withdrawal and providing sirnultaneously an intense mixing of the bulk
of the suspension with regions of higher supercooling.
In this chapter a new process will be described in which in contra
distinction to cornrnon practice a high rate of heat withdrawal can be
applied without reducing the average crystal size. This is achieved
by separating the zones of nucleation and growth. Heat is withdrawn
frorn the systern only in the nucleation zone. By applying a large heat
flux, and a small mean residence time of crystals in the nucleation
zone, the supercooling and thus also the nucleation rate will be high
so that very small crystals will be formed. The apparatus in which the
nuclei are formed will be called crystallizer. The crystals produced
in the crystallizer are fed continuously to the growth zone, called
ripening tank. The volume of the suspension in the ripening tank is
kept constant. The smal! crystals are intensively mixed with a suspen
sionaf larger crystals that is present in the adiabatic ripening tank.
At every point in this tank the solution ternperature will adjust it
self to a value between the equilibrium ternperature of the smal! crys
tals and that of the larger ones. The larger crystals will consequently
grow at the expense of the smaller ones that melt. An advantage of'
this process is that regions of relatively large supercooling do not
exist since heat is actually withdrawn throughout the entire tank vol
urne by the tiny feed crystals that act as heat sinks. The ripening
tank can therefore be operated at an average bulksupercooling close
to the threshold value for secondary nucleation öTnuc
For this process effective diarneters(de) of crystals produced from
a 90 liter and an 800 liter ripening tank have been measured as a
function of the following eperating variables in the ripening tank:
mean crystal residence time(T), magma density(X), solute concentra
tion(Cb), and impeller speed(nr). Experiments have also ~een carried
out todetermine the effect of feed crystal size upon de. Fora nurnber
100
of runs crystal size distributions in the ripening tank have been
determined. Effective crystal diameters calculated from these distri
butions will be compared to values of de found from permeability
measurements.
Bulksupercoolings have not been measured because of experimental
difficulties. It is not possible,therefore, todetermine the growth
kinetics of sucrose solutions, as was done for the crystallization of
water from dextrose solutions described in chapter 5. In order to
still be able to predict the effect of process parameters upon de,
calculations have been carried out by means of an inbuilding kinetics
relationship for growth in a 35 wt.% dextrose solution. These calcula
tionshave been performed by numerièal integration of the population
balance for steady state conditions.
From the experimental results it appears that de fluctuates with
time. By means of a theoretica! model this unsteady state behavior of
de will be calculated by solving simultaneously the partial differen
tial equations for the moments cf the size distribution.
6.2. Experimental set-up
The experimental set-up is depicted diagrammatically in figure
6.1. A suspension with very small crystals that are produced in a
cooling crystallizer is continuously fed to a ripening tank where it
is mixed with a suspension of coarser crystals by means of a helical
screw agitator with variable speed situated in a baffled dra ft t ube.
After leaving the crystallizer through an electrically operated mag
netic valve, the product suspension is fed to a wash column in which
the concentrate is separated from the ice crystals. The construc tion
and performance of this wash column has been described by Vorstman
( 153) .
In order to provide a small residence time in the crystallizer
t he feed s t ream to t he crystallizer is mixe d wi t h a nearly crystal
free solution that is recycled from the ripening tank. This tank is
therefore provided with a filter. The crystals are continuously remov
ed from the filter by means of a seraping device. The speed of rota
tion ofthe seraper can be varied. The solution that is fed to t h e
crystallizer is approximately a t its freezing temperature and is ob-
tained from a storage tank. This storage tank is placed 3 meters above
the rest of the apparatus in order to prevent air from coming into the
system. Air-free operation is necessary to prevent possible loss of
volatiles in case of freeze concentration of food liquids and to pre
vent channellingin the wash column due to expanding air bubbles (15J ).
101
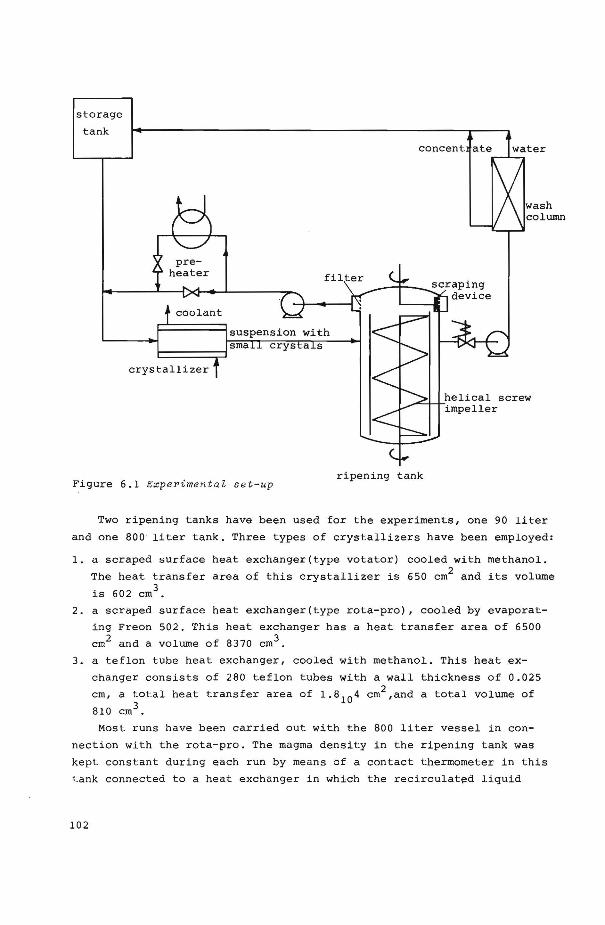
storage
tank
Figure 6.1 Experiment a l set-up ripening tank
Two ripening tanks have been used for the experiments, one 90 liter
and one 800 liter tank. Three types of crystallizers have been employed:
1. a scraped surface heat exchanger(type votator) cooled with methanol.
The heat transfer area of this crystallizer is 650 cm2 and its volume
is 602 cm3 .
2. a scraped surface heat exchanger(type rota-pro), cooled by evaporat
ing Freon 502. This heat exchanger has a heat transfer area of 6500
cm2 and a volume of 8370 cm3 .
3. a teflon tube heat exchanger, cooled with methanol. This heat ex
changer consistsof 280 teflon tubes with a wall thickness of 0.025 2 cm, a total heat transfer area of 1.810 4 cm ,and a total volume of
810 cm3 .
Most runs have been carried out with the 800 liter vessel in con
neetion with the rota-pro. The magma density in the ripening tank was
kept constant during each run by means of a contact thermometer in this
tank connected to a heat exchanger in which the recirculated liquid
102
could be heated to some degree before entering the rota-pro. The runs
with the 90 liter ripening tank have been made by using the votator or
the teflon tube heat exchanger. In these runs the magma density was kept
constant by manual adjustment of the rate of suspension withdrawal. In
order to prevent the teflon tube heat exchanger from freezing up too
much, it was thawed with warm methanol for three minutes every half
hour.
6.3 Measuring technigues
To determine the effective diameter de of product crystals, suspen
sion sampleswere taken from the ripening tank and permeability and
porosity of a packed bed of the crystals were determined by the same
method as described in chapter 5.3.2. Since the ripening tank is operat
ed essentially air-free, it is not necessary to remove air bubbles from
the suspension in the permeability apparatus.
For a number of runs crystal shapes and size distributions of
product crystals were measured by means of a microscope. The microscope
was placed in a thermostated air box as described in chapter 5.3.4. It
was also attempted to measure shape and size distribution of the tiny
feed crystals. Therefore, part of the suspension stream from crystalliz
er to ripening tank was conducted through a cell mounted onto the
microscope. Part of the bottorn of this cell was attached to the con
densor of the microscope and could be moved up and down. By suddenly
moving the bottorn upward to the top of the cell a number of crystals
from the suspension streaming through the cell could be caught between
top and bottorn plates. The crystals that were magnified 10 or 40 times
could then be focused on and photographed. All manipulations took place
outside the thermostated box, so that. the temperature in the box could
be kept within 0.1°C of the freezing point of the suspension.
6.4 Experimental results
6.4.1 E[[ective diameter of product arystals.
Most experiments were performed with aqueous sucrose solutions of
different concentrations. In two runs coffee extract was used instead
of the model solutions. For each run the effective diameter of the
product crystals was determined at several time intervals after a con
stant weight percentage of ice in the ripening tank had been establish
ed. The operating conditions for each run are summarized in table 6.1.
In columns 1,2,and 3 run number, type of crystallizer, and type of
ripening tank are indicated respectively. Column 4 gives the salution
that is concentrated and the average weight percentage of dissolved
103

..... 0 1-3 ....
P> tr ......
run type vol . eb '5o x w nr_ 1 ~T ' cryst. t/< nr e d5o CVd CVT cv x
(kg/hr) lm (sec) ma x data (sec)
e (%) (\) nr . cryst ripe. (wt\ ) (hrsl
(wt\) (sec ) (OC) ( cm) (\) tank
(1)
"' I A 90 32 . I 1.7 15 10 .8 1. 7 22 4.0 3.3 6 - .,_. - - -..... 2 A 90 32.2 2. 0 13.6 10.8 3.3 22 4.0 1.4 5 - - - - -t'j 3 A 90 32. 7 1.7 IS . I 10.8 1.7 22 4. 0 1.9 4 - - - - -!i
'1:::1 4 A 90 34. I 1.3 8.7 10. 8 2.5 22 4.0 3.8 5 - - - - -(I>
'"j 5 A 90 34. 7 1.2 6. 9 6.1 3.0 16.8 - 11.5 8 5.3 0. 0250 18.0 6 . 2 13.7
"'· ;;;) 6 A 90 38 . 4 3. 16 19.2 6.2 3 . 0 16.3 - 10. 5 20 5 .3 0. 0508 22.0 1 3 . 6 8 . 3 (I>
~
"" 7 A 90 39.5 2. 00 12.0 6. I 3 . 0 16.3 - 12.2 24 4 .9 0 .0298 18 . 2 4 . 3 12 .0
8 B 90 30.4 I. 29 12.9 9.9 3. 0 12.5 2 .o 1 2 . 5 16 5.7 0. 0306 22 . 4 4.0 9.6 p .,_. 9 B 90 29.7 2 .40 27.7 10.8 3. 0 8. 4 1.7 9.5 22 4. 9 0 .0522 9 .I 10.6 7. 0
'"j 10 B 9 0 30.5 0 . 75 5.5 7. 4 3. 0 7 . 2 1.7 32 .o 24 6 .1 0 . 02!8 26.8 10.6 10. 7 (I>
"' 11 c 800 28.9 0.83 9.0 97 .4 2 . 16 2 3.5 2.5 9 . 5 15 10.0 0.0187 7 .0 17.0 28.0
;: .,_. 12 c 800 30.2 0.82 5 . 5 60.6 2 . 16 23. 4 2. 7 12 . 7 17 10.0 0.0172 14 .5 6. 1 14. 5
"" "' I) c 800 33. 1 l. 56 13.9 79.2 2 .16 24.9 2.7 6. I 20 9.7 0.0299 9.9 1.0 1. 1
14 c 800 33 .2 I. 52 13.6 80.7 2 .16 25.4 2 . 7 8 .s 2 4 9.7 0 .0250 11.4 3.2 3. 4
IS c 800 30.8 2.95 30.0 85.0 2 .1 6 23.8 2.7 6.6 21 8.5 0.0445 43.0 3.7 0.5
16 c 800 30.6 3.12 29.3 80.0 2.16 23.3 2.7 7 . 0 20 8. 7 0 . 0520 33.0 0.8 2 . 4
17 c 800 30 . 3 l. 50 13 .5 73. 3 2 .1 6 21.4 2.5 5 . 0 14 9.9 0 .0348 8. 4 1.1 6.7
18 c 800 30.5 1.52 14.2 81.7 2. 16 22. 3 4.7 7. 2 12 9.8 0.0279 5.3 1.5 1. 4
19 c 800 30 .7 I. 50 10 .9 64.4 2 .16 24. 3 2 .5 6 . 7 20 10 .0 0 . 0247 17 .6 2.5 1.5
20 c 800 32. I l. 50 1 3.8 82 .! 2 . 16 19 .6 2.5 6. 0 19 9.8 0 . 0285 12.5 0.9 1.7
21 c 800 32 . 4 l. 50 13 .7 81.0 2.16 19.5 2 . 5 8 . 7 26 9.8 0.0300 11. 3 1.0 2 . 7
22 c 800 33. 3 I. 50 14.0 8 3.0 2.16 19.9 2.5 7.3 23 9.7 0.03!3 7 .0 1.0 2.4
23 c 800 31. I !. 55 14.1 79 . 7 !. 83 21.2 2.5 12 .8 21 I !. 4 0.0223 11.9 3 . 3 4 .0
24 c 800 31.5 !. 52 14.3 83.1 !. 33 21.2 2 . 5 9.8 16 13.2 0 .0203 5.7 1.6 2 . I
25 c 800 44.1 2.98 26.4 78.7 3 . 0 18.5 2.5 6.4 19 4.9 0.0320 10.8 3 . 0 2.4
26 c 800 42.9 2 . 24 26.6 !OS 3. 0 18.8 4.2 7 .6 17 5.1 0.0253 10. 5 0.8 3 .9
27 c 800 31.3 I. 49 14 .! 83.0 3 . 0 21.7 2.5 8 .0 13 7. 2 0 . 0472 35 .4 1.0 0 .7
28 c 800 32. I I. 49 1 3 .7 81.0 3 .0 22.1 2.5 8. 0 1 2 7.2 0 .0388 27 . 8 2 . 6 3 . 2
29 c 800 32.7 !. 49 14 .0 83.4 3 . 0 21.5 2.5 8.0 1 3 7.2 0 . 0363 14.4 1.5 4 . 1
30 c 800 33. 4. 2.63 26.5 86.0 3 . 0 18.9 2 . 5 4 .6 1 3 5.2 0.0204 8.8 2. 7 3 . 1
31 c 800 29 . 1. 4.0 2 31.5 65.8 3. 0 21.0 2.5 9.5 37 5.8 0.0377 16.2 1.9 3.7
32 c 80 0 38 . 2' 4.17 29 .2 59.6 3.0 20.5 2.5 6.6 27 5.0 0.0313 16.9 6.4 2. 4
33 B 90 33.0 !. 78 28.0 14.5 3.0 - - 5.8 14 s.o 0.04 48 I !. I 0.5 5.2
·coffee extrac t
• •experiments 1 through 4 have only been performed until the first maximum in de appeared
A ~ votator type crystallizer B = teflon tubes crystallizer C = rota-pro type crystal lizer
solids in the solution in the ripening tank. In column 5 the average
values of the mean residence time T of ice crystals in the ripening
tank are compiled. T has been calculated from the suspension volume
in the ripening tank and frequency and volume of the suspension take
offs. The weight percentage of ice crystals in the ripening tank X is
determined from the dissolved solids concentratien of the mother
liquid, and that of the suspension after melting. Average values of X
are given in column 6. The production rate W of ice crystals, calcu
iate~ :fromT and X is presentedincolumn 7. The stirrer speed nr is
given in column 8. In columns .9 and 10 the logarithmic mean tempera
ture difference óTlm in the coolin~ crystallizer, and the mean resi
dence time in this crystallizer are indicated respectively. The dura
tion ofthe experiment divided by T is given in column 11, while the
total nurnber of data points measured during the experiment is present
ed in column 12.
After the start-up period was ended, during which the effective
diameter of the product crystals gradually increased with time, de
started to fluctuate with time. These fluctuations continued during
the rest of the experiment. For runs 5 through 33 the start-up period
has not been considered. Examples for 3 typical runs(8,21, and 24)
are given in figure 6.2. It was attempted todetermine the frequency
of the fluctuations. These fluctuations, however, appeared to occur
at random. For some runs fluctuations in the order of 2-5 T seemed to
occur. The duration of the experiments was too short to obtain any
reliable data on the frequency of those major fluctuations.
Time averaged values of the effective diameter and values for the
deviation from the average have been determined for runs 5-33 by the
following method:
in a graph of de versus t/T for the main period (after start-up period)
such as in figure 6.2, horizontal lines are drawn for various values
of de. The fraction of the duration of the run during which the effec
tive diameter is smaller than a certain value of de is , plotted versus
that value. Cumulative distribution curves are made this way for
runs 5-33. As an example the curnulative distribution curves of the
runs from figure 6.~ are plotted in figure 6.3. The average value of
de is now defined as the value at the 50% line of the,cumulativedistri
bution curve.This average value will be referred to as d50
. In the
same way as is commonly employed to characterize crystal size distri
butions,the deviation from the average will be expressed by the coef
ficient of variatien CV for the effective diameter defined as:
105
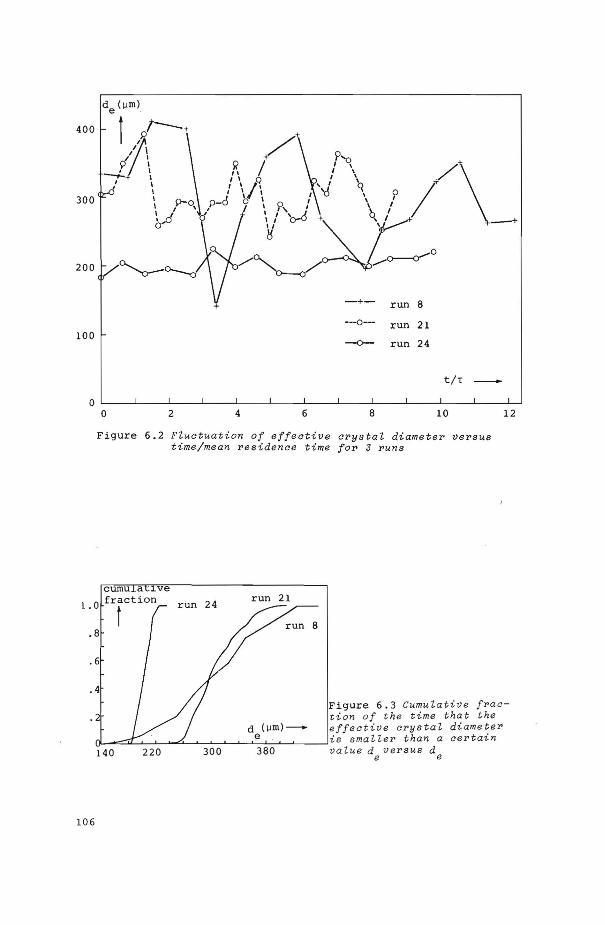
400
300
200
-+- run 8
---o-- run 21 100 -o-- run 24
t/T -0
0 2 4 6 8 10
Figure 6.2 FZuatuation of effeative arystaZ diameter versus time/mean residenae time for 3 runs
cumu a ~ve
1 . 0 frfction
.8
• 6
.4
run 24 run 21
8
12
Figure 6.3 CumuZativ e fraation of the time that the
106
d (~m)--- effeative arystaZ diameter ~--::::::ï:l~---'-""'"":L_....__......_~_.___,_:_~__._:__.__._ __ ....J is s ma n er t ha n a a er t a in
380 vaZue d versus d 140 220 300 e e
(6-1)
in which d84
and d16
are values of de at the 84% of 16% lines. Values
of CVde and d50
for runs 5 to 33 are given in columns 14 and 15 of
table 6 .1. Since for many runs T and X also fluctuated wi th time, coef
ficients of variatien for T and X, indicated by CVT and CVX respective
ly, have also been determined by the same method as for the effective
diameter. Values of CVT and CVX are compiled in columns 16 and 17
respective1y.
In tigure 6.4 the average effective diameter d 50 is plotted versus
T with the bulk concentratien of dissolved solids eb as parameter. The
data obtained with different types of crystallizers or with different
stirring rates are indicated with separate symbols. In figure 6.5 the
values of d50
are plotted versus crystal concentratien X. The effects
of x and T upon d50
appear to be quite similar.
From the data for runs 5 through 33 in table 6.1 and from figures
6.4 and 6.5 the following general qualitative conclusions can be drawn:
1. d5o increases less than linearly with increasing T at constant w. 2. d5o increases less than linearly with increasing x at constant w. 3. d5o increases with decreasing sucrose concentration.
4. d5o increases with increasing stirring rate.
5. d5o va lues for the three different types of crystallizers do not
differ much.
6. d 50 is smaller in coffee extract than in sucrose solutions of the
same dissolved solids concentration.
7. the coefficient of variatien of de generally increases with increas
ing stirring rate.
8. CVde seems to be independent of the coefficients of variatien of
T and X.
The influences will all be discussed at the end of this chapter
after the unsteady state and steady state roodels have been described.
6.4.2 Start-up period
Runs 1 through 4 are examples of preliminary experiments in which
only the start-up effect is studied. In the start-up peri?d during
which the weight percentage of ice in the crystallizer is already
constant,de is found to gradually increase with time. More details and
more experimental data are given elsewhere(154). The results of runs
l-4 are graphically presented in figure 6.6.
107
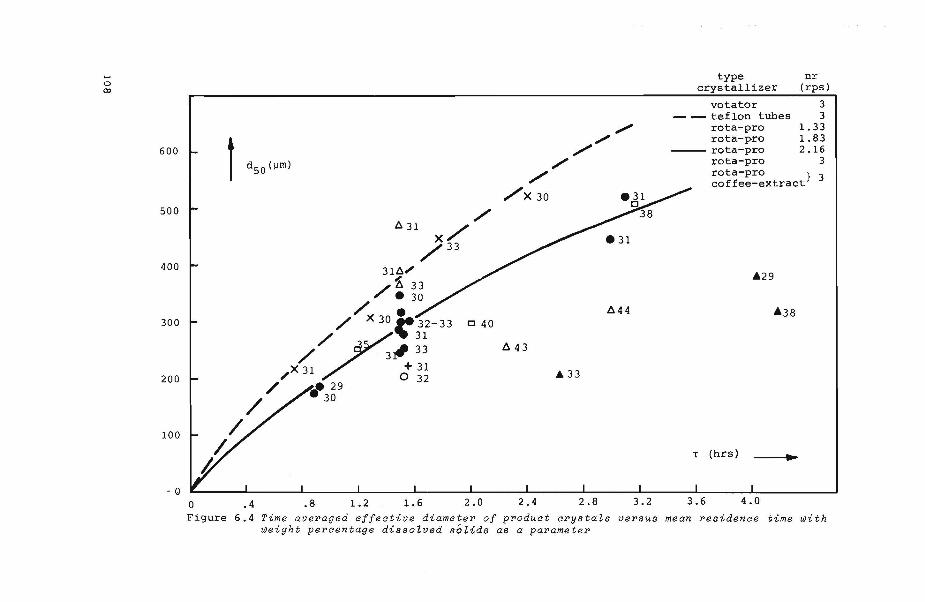
..... 0 Q)
600
500
400
300
200
100
- 0
~
0
/ /.
31~" '-
/ ~ 33 • 30
/ . / X 30 .. 32-33
~~31
/ . 3, 33
x 31 + 31
// •• 29 0 32
/ 30
• 4 .8 1.2 1.6
c 40
2.0
~44
~ 43
2.4 2.8 3.2
type crystallizer
votator - - teflon tubes
rota-pro rota-pro
--- rota-pro rota-pro
nr (rps)
3 3
1.33 1.83 2.16
3 rota-pro } 3 coffee-extract
T (hrs) .. 3.6 4.0
Figure 6.4 Time averaged effeative diameter of produet arysta~s versus mean residenae time with weight percentage disso~ved sÓ~ids as a parameter
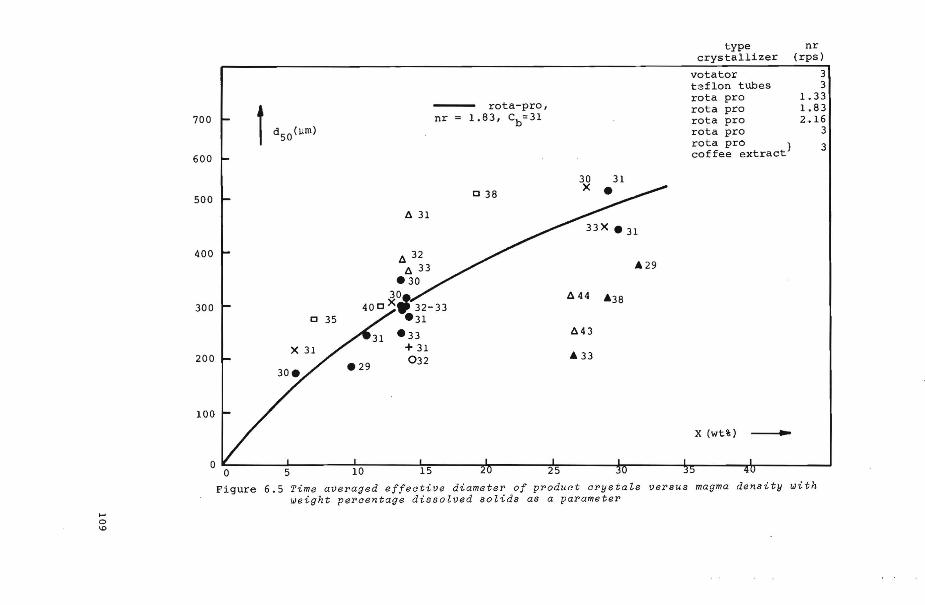
.... 0
"'
700
600
500
400
300
200
100
type nr crystallizer (rps)
votator 3 teflon tubes 3 rota pro 1. 33
f rota-pro, rota pro 1.83
nr 1.83, cbo:3I rota pro 2 .• 16 d50(llm) rota pro 3
rota pro } 3 coffee extract
30
c 38 x
A 31
.&29
t:. 44 A35
c 35 t:. 4 3
.. 33
X ( wt% ) ______..
Figure 6.5 Time ave raged effective diameter of product crystals versus magma density wi th weight percen t age disso lved solids as a parameter
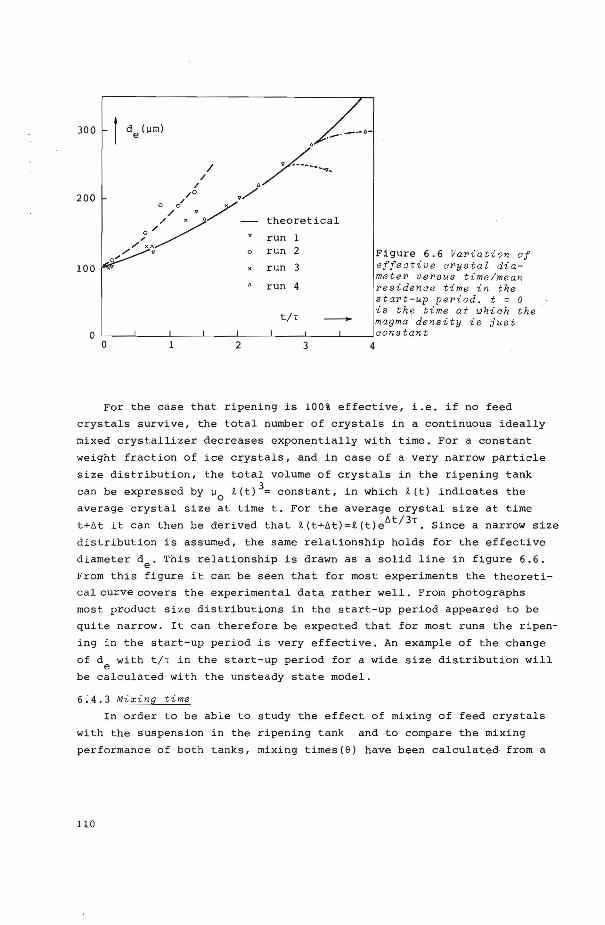
300
200
o"' 100
,t ~:-~. /t /
o /o/ v Yv / x . / t hE)oretical
/~:/ - .-run 1 / o run 2
run 3
run 4
t/T -
Figure 6.6 Var iation of e ffeative ar ystal dia me t er versus time/mean r e s i denae t i me in t h e s t a r t - u p p e r iod. t = 0 is t h e time at whiah t h e magma d en s ity i s j u s t
0 L---~-----L----~----~----L---~-----L----~aonstant 0 2 3 4
For the case that ripening is 100% effective, i.e. if no feed
crystals survive, the total number of crystals in a continuous ideally
mixed crystallizer decreases exponentially with time. For a constant
weight fraction of ice crystals, and in case of a very narrow partiele
size distribution, the t otal volume of cryst als in the ripening tank
can be expressed by ~0 i (t) 3= constant, in which i (t) indicates the
average crystal size at time t. For the average crystal size at time
t+llt it canthen be derived that i(t+llt)=i(t)ellt/3'. Since a narrow size
distribution is assumed, the same relationship holds for the effective
diameter de. This relationship is drawn as asolid line in figure 6.6.
From t his figure it can be seen that for most experiment s the the oreti
ca! curve covers the experimental data r a ther well. From pho tographs
most product size distributions in the start-up period a ppeared to be
quite narrow. It can therefore be expected that for most runs the ripen
ing in the start-up period is very effective. An example of the change
of d e with t / T in the start -up period for a wide size distribution will
be calc ulated wit h the unst eady state model .
6;4. 3 Mixing time
In order to be able to study the effect of mixing of feed crystals
with the suspension in the ripening tank and to compare the mixing
performance o f both tanks, mixing times ( e ) h ave been calculated· from a
110
graphof Novak and Rieger(155). They determined mixing times in a
vessel provided with a helical screw agitator in a draft tUbe. Their
results areplottedas the factor (nr·8) versus Reynolds number (nr Di 2
p/~). Values of ~ for the suspensions have been calculated from the
viscosity of the mother liquid and a correction factor for the effect
of the volume fraction of ice crystals in the suspension. The correction
factors have been calculated from a correlation determined by Thomas(l56h
Reynolds numbers for our experiments varied between 640 and 7600. Values
of the product (nr·8) determined from the graph of Novak and Rieger
varied only between 14.8 and 21.6. The calculated values of e .are compil
ed in column 13 of table 6.1. These values of e should not be considered
to be true mixing times for our ripening tanks since the geometry of our
tanks differed from those of Novak. They do however give an indication
of how the mixing time varies with nr. Since the geometrics of our two
tanks are quite similar it seems reasonable to compare 8-values of both
tanks.
6.4.4 Crysta~ shape
Shape cf produet arystals
For several runs shapes of ice crystals produced in the ripening
tank were observed under a microscope in the thermostated box. For most
of the runs the crystals appeared to have the shape of a sphere or of
a cube with rounded-off corners, as can be seen from some typical photo
graphs, figures 6.7.1 and 6.7.2. The surfaces of the crystals seemed
rather smooth although some kinds of etch pits or lines could usually be
observed. In some cases however, in which the magma density and the mean
residence time were small, disk-shaped crystals could be observed simil
ar to those found with the experiments described in chapter 5. An exam-·
ple isgiven in figure 6.7.3 (run 10). The·average height over diameter
ratio of the crystals in this photograph is approximately 1:2. As has
been discussed in chapter 5.8.1 the crystal shape becomes more plate
like with increasing bulksupercooling. For the conditions of run 10 a
relatively large value of öTb can be expected, as will be shown by means
of the steady state model.
In runs 9 and 33, crystals were observed that apparently consist
edof many small crystals. The overall shape of t~se conglomerat es was
spherical as can be seen from , figure 6.8. It is not yet clear why in
these runs conglomerates were formed. The variatien of de in runs 9 and
33 is much less than in runs 5 through 8 that were carried out with the
same crystallizer and the same ripening tank. By following the variatien
111
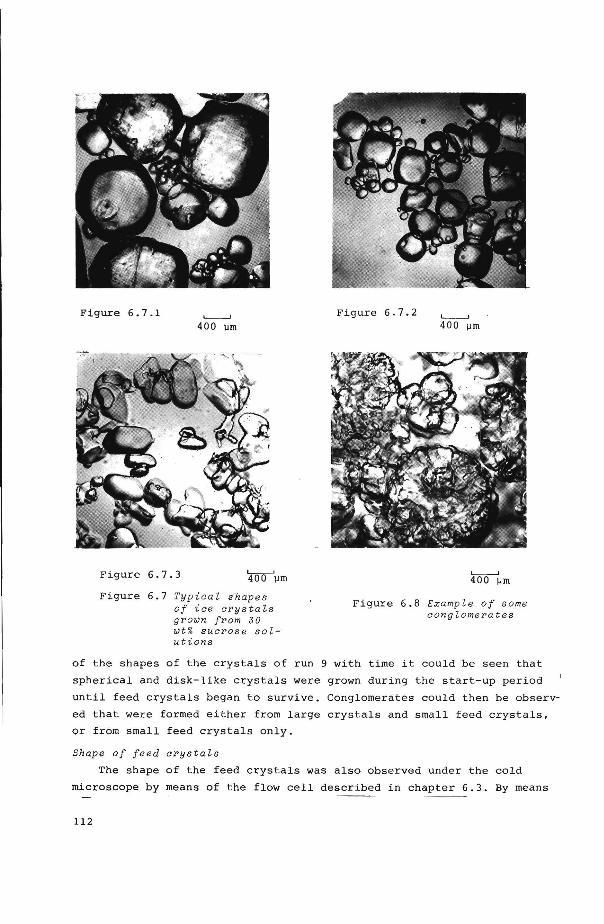
Figure 6.7.1
Figure 6.7.3
'--' 400 urn
L----' 400 urn
Figure 6.7 TypicaZ shape s o f ice crystals grown from 30 wt% s ucrose solutions
Figure 6.7.2 L.__._.l
400 urn
4oo"tm Figure 6.8 Example of some
conglomerates
of the shapes of the crystals of run 9 with time it could be seen that
spherical and disk-like crystals were grown during the start- up period
until feed crystals began to survive. Conglomerates could then be observ
ed that were formed either from large crystals and smal! feed crystals,
or from smal! feed crystals only.
Shape of feed crystal s
The shape of t he feed crystals was also observed under the cold
microscope by means of the flow cel! described in chapter 6.3. By means
112
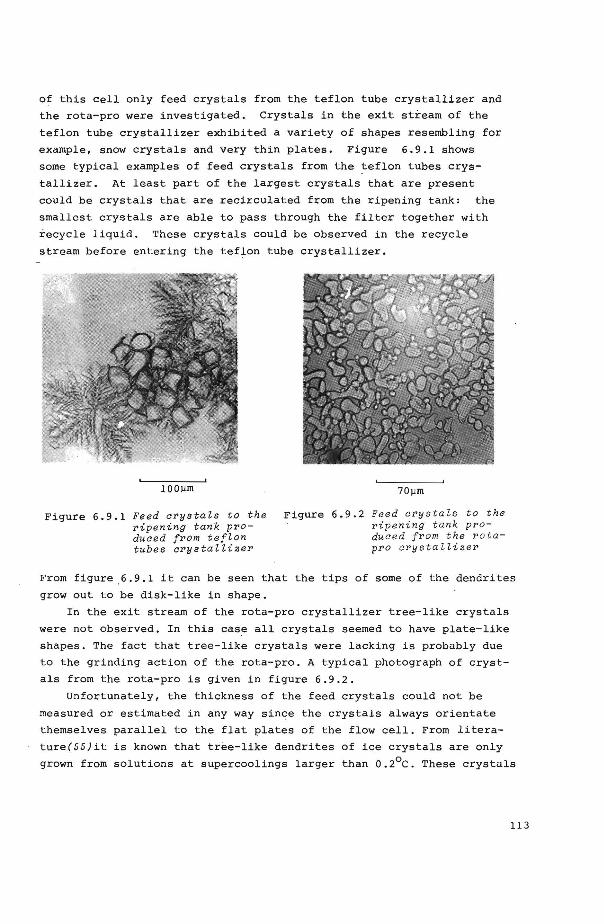
of this cel! only feed crystals from the teflon tube crystallizer ahd
the rota-pro were investigated. Crystals in the exit stream of the
teflon tube crystallizer exhibited a variety of shapes resembling for
example, snow crystals and very thin plates. Figure 6.9.1 shows
some typical examples of feed crystals from the teflon tubes crys
tallizer. At least part of the largest crystals that are present
could be crystals that are recirculated from the ripening tank: the
smallest crystals are able to pass through the filter together with
recycle liquid. These crystals could be observed in the recycle
stream before entering the teflon tube crystallizer.
lOO~m
Figure 6.9.1 Feed arystaZs to the ripening tank produaed from teflon tubes arystaZZizer
Figure 6.9.2 Feed arystaZs to the ripening tank produaed from the rotapro arystaZZizer
From figure ,6.9.1 it can be seen that the tips of some of the dendrites
grow out to be disk-like in shape.
In the exit stream of the rota-pro crystallizer tree-like crystals
were not observed. In this case all crystals seemed to have plate-like
shapes. The fact that tree-like crystals were lacking is probably due
to the grinding action of the rota-pro. A typical photograph of cryst
als from the rota-pro is given in figure 6.9.2.
Unfortunately, the thickness of the feed crystals could not be
measured or estimated in any way since the crystals always orientate
themselves parallel to the flat plates of the flow cell. From litera
ture(55)it is known that tree-like dendrites of ice crystals are only
grown from solutions at supercoolings larger than 0.2°C. These crystals
113
are believed to be very thin ( 55). Since crystals that are just born
are quite perfect, c-axis growth probably takes place by a . two dimen
sionalnucleation mechanism and therefore at very smal! growth rates
(eq.3-12). A-axis growth most likely occurs by a screw dislocation
mechanism and is therefore much faster then c-axis growth as has been
pointed out in chapter 3.
6.4.5 Crysta l size distribution
Fe e d c r ystal siz e d i s t r i bution
Quantitative measurements of the feed crystal size distribution
have not been made because of indefinable crystal shapes and ~izes and
the fact that the crystal size distribution seemed to change consider
ably for different samples. Some qualitative conclusions wil! be made,
however, concerning the influence of some process variables upon size
distribution and average size of the feed crystals. The following
conclusions are reached from observing photographs of feed crystals
produced from the rota- pro crystallizer:
1. by increasing the residence time in the crystalli zer by a factor
of 4 the average crystal size seemed to become slightly larger,
2. by conducting the feed stream to the crystallizer through a preheat
er the average crystal size decreased somewhat, while in general
the percentage of large crystals (probably crystals that slipped
through the filter in the ripening tank) decreased considerably,
3. at a lower evaporat ion temperature of freon the percentage of the
smallest crystals appeared to increase,
4. by increasing the sucrose concentratien from 30 to 43 wt.% the
average crystal size decreased by a factor of 2-3 (i.e.from about
6 to 15 ~m for the most commonly ohserved crystal size) .
Pr oduct crysta l s i z e di stri bution
For some runs size distributions of ice crystals in the ripehing
tank have been followed with time. In the star t-up period the crystals
increased gradually in size and the crystal size distribution appeared
to be quite narrow. From this fact it can be concluded that no feed
crystals survive the ripening process. Just befare the effective
crys t al diameter starts to level off a large number of smal! crystals
c an be observed in the product. As time proceeds and these crystals
have grown somewhat, i t can be observed that no new c r ystals appear
in the product until the next maximum in de.
Histograms of crystal size distributions that have been determined
from photographs for runs 8 and 10 are presented in figure 6 . 10. In
this figure t he fraction of the total number of crystals per ~m of the
114
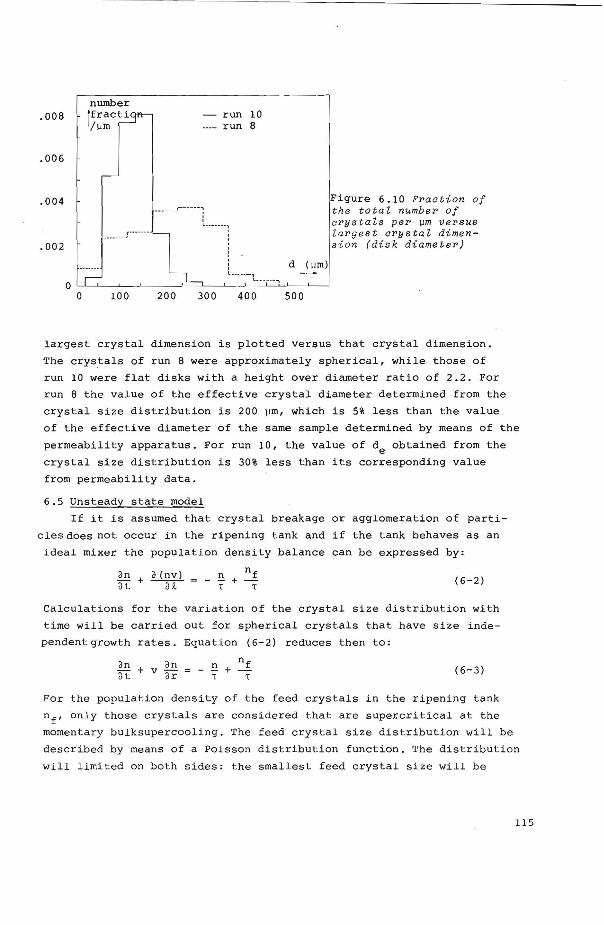
.008
.006
.004
.002
0 0
nurnber !frac~ run 10 /IJID run 8
-
r-~---- ... ------·· i ~------··:
_______ _r·------ L__ :
' '
I. ~ '------L------.
100 200 300 400
d
500
(pm)
Figure 6.10 Fraction of th e total number of arystals per um ve~sus larg e st arystal dimension (disk diameter)
largest crystal dimension is plotted versus that crystal dimension.
The crystals of run 8 were approximately spherical, while these of
run 10 were flat disks with a height over diameter ratio of 2.2. For
run 8 the value of the effective crystal diameter determined from the
crystal size distribution is 200 urn, which is 5% less than the value
of the effective diameter of the same sample determined by means of the
permeability apparatus. For run 10, the value of de obtained from the
crystal size distribution is 30% less than its corresponding value
from permeability data.
6.5 Unsteady state model
If it is assumed that crystal breakage or agglomeration of parti
clesdoes not occur in the ripening tank and if the tank behaves as an
ideal mixer the population density balance can be expressed by:
(6-2)
Calculations for the variatien of the crystal size distribution with
time will be carried out for spherical crystals that have size inde
pendentgrowth rates. Equation (6-2) reduces then to:
3n + V 3n = _ g + nf at ar 1 1
(6-3)
For the population density of the feed crystals in the ripening tank
nf, only those crystals are considered that are supercritical at the
momentary bulksupercooling. The feed crystal size distribution will be
described by means of a Poisson distribution function. The distribution
will limite d on bath sides: the smallest feed crystal size will be
115
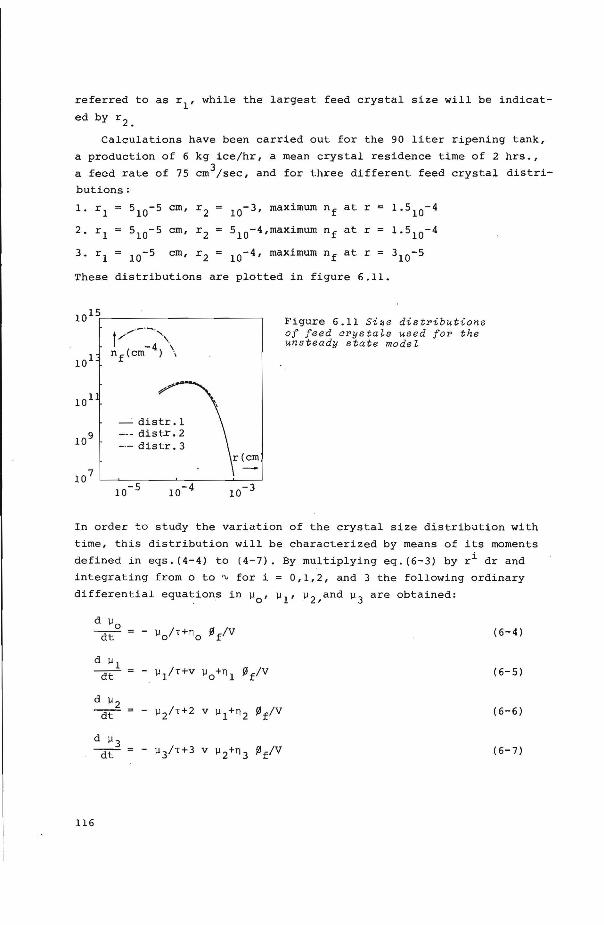
referred to as r1
, while the largest feed crystal size will be indicat
ed by r 2 .
Calculations have been carried out for the 90 liter ripening tank,
a production of 6 kg ice/hr, a mean crystal residence time of 2 hrs.,
a feed rate of 75 cm3/sec, and for three different feed crystal distri-
butions:
1. r1 510-5 cm, r2 10- 3 ' maximum nf at r = 1.510-4
2. rl 510-5 cm, r2 510
-4,maximum nf at r = 1.510-4
3. rl 10-5 cm, r2 10-4 ' maximum nf at r 310-5
These distributions are plotted in figure 6 .11.
1015r---------------------~ Figure 6.11 Si ze distri b utions of fe e d ary s ta ls used f or the unste ady s t a te mode l
--distr.! ··-- distr.2 -·-distr. 3
In order to study the variatien of the crystal size distribution with
time, this distribution will be characterized by means of its moments
defined in eqs. (4-4) to (4-7) . By multiplying eq.(6-3) by ri dr and
integrating from o to ~ for i= 0,1,2, and 3 the following ordinary
diffe rent ial equat ions in 110 , 11 1 , 11 2 , a nd 113
are obtained:
d 110 = - 110 /T+n 0 13f/V (6-4) --;rr-
d 111 - 11
1/T+v 110 +n 1 13f/ V (6-5) """dt
d 112 - 11 2 / T+2 V 11 1+n 2 J3f/V (6-6) --;rr-
d 113 - 11 3/T+3 V 11 2+n 3 J3f/V (6- 7) --;rr-
116
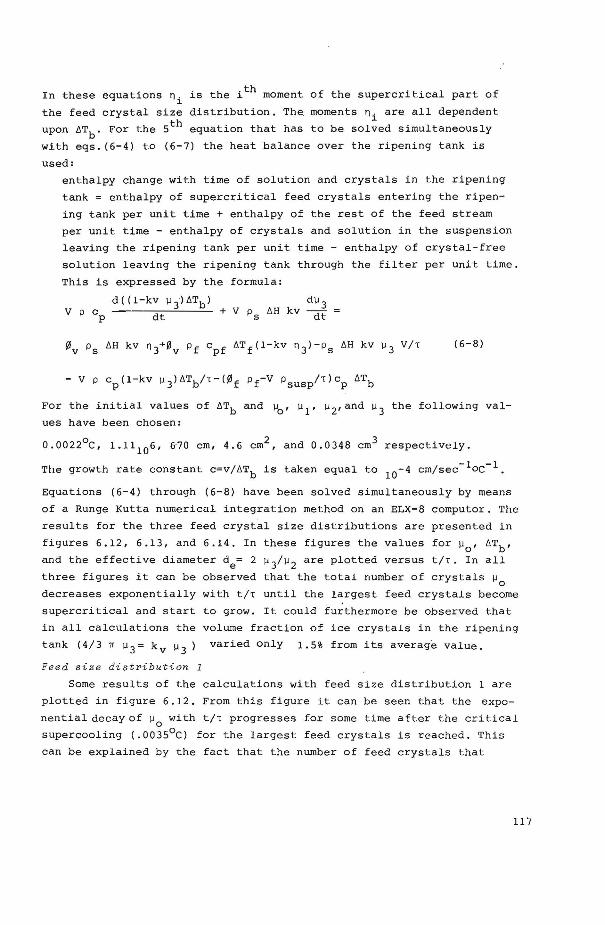
In these equations ~i is the ith moment of the supercritical part of
the feed crystal size distribution. The. moments ~i are all dependent th upon óTb. For the 5 equation that has to be solved simultaneously
with eqs. (6-4) to (6-7) the heat balance over the ripening tank is
used:
enthalpy change with time of solution and crystals in the ripening
tank = enthalpy of supercritical feed crystals entering the ripen
ing tank per unit time + enthalpy of the rest of the feed stream
per unit time - enthalpy of crystals and solution in the suspension
leaving the ripening tank per unit time - enthalpy of crystal-free
solution leaving the ripening tank through the filter per unit time.
This is expressed by the formula:
d((1-kv ~ 3)ATb) d~ 3 V P CP dt + V ps óH kv ~
(6-8)
For the initia! values of óTb and ~0 , ~ 1 , ~ 2,and ~ 3 the following val
ues have been chosen:
0.0022°C, 1.11106, 6·70 cm, 4.6 cm2 , and 0.0348 cm3 respectively.
The growth rate constant c=v/6Tb is taken equa1 to 10
-4 cm/sec- 1oc- 1
Equations (6-4) through (6-8) have been solved simultaneously by means
of a Runge Kutta numerical integration method on an ELX-8 computer. The
results for the three feed crystal size distributions are presented in
figures 6.12, 6.13, and 6.14. In these figures the values for ~0 , óTb,
and the effective diameter de= 2 ~ 3;~ 2 are plotted versus t/T. In all
three figures it can be observed that the total number of crystals ~0 decreases exponentially with t/T until the largest feed crystals become
supercri ti cal and start to grow. It could furthermor.e be observed that
in all calculations the volume fraction of ice crystals in the ripening
tank (4/3 1T ~ 3 = kv· ~ 3 ) varied only 1.5% from its average value.
Feed size distribution 1
Some results of the calculations with feed size distribution 1 are
plotted in figure 6.12. From this figure it can beseen that the expo
nential decay of ~0 wi th t/T progresses for some time af ter the cri ti cal
supercooling (.0035°C) for the largest feed crystals is reached. This
can be explained by the fact that the number of feed crystals that
117

10 UO
8
6
4
LITb
2
d 200 e
------------------------------- (urn)
150
100
50
t/1 0 L_ __ L_ ____ ~------~----~----~L_----~----~0
0
Figure 6.12
2 3 4 5
Calculated variations of total number of crystals
0 (in units of 105 ), bulksupercooling
(in 1o-3cJ, and effective crystal diameter (in urn) versus time/mean residence times for feed crystal size distribution 1
survive is low as a result of the wide distribution of feed crystals,
as can beseen from figure 6.11. As LITb increases further, the number
of feed crystals that start to grow becomes larger than the number of
crystals leaving the crystallizer and consequently u0
increases. As a
result of the increasing number of feed crystals that survive the total
crystal surface finally starts to increase. As a consequence the effec
tive crystaldiameter and the bulksupercooling start to decrease (since
X hardly varies at all) slightly until finally steady state conditions
are reached.
Feed size distribution 2
The results calculated for the second feed crystal size distribution
are presented in figure 6.13. From this figure it can be seen that upon
surpassing the critica! superc::ooling for the largest feed crystals
(0.007°C) a large number of them become supercritical as aresult of the
narrow feed crystal size distribution. This effect causes the total
number of crystals to increase almost immediately. The total crystal
surface increases right away too, thereby decreasing LITb very slightly
to a value at which the total number of crystals does not increase any
further. For this feed size distribution steady state conditions are
reached very soon. It has to be noted that LITb adjusts to a value that
118
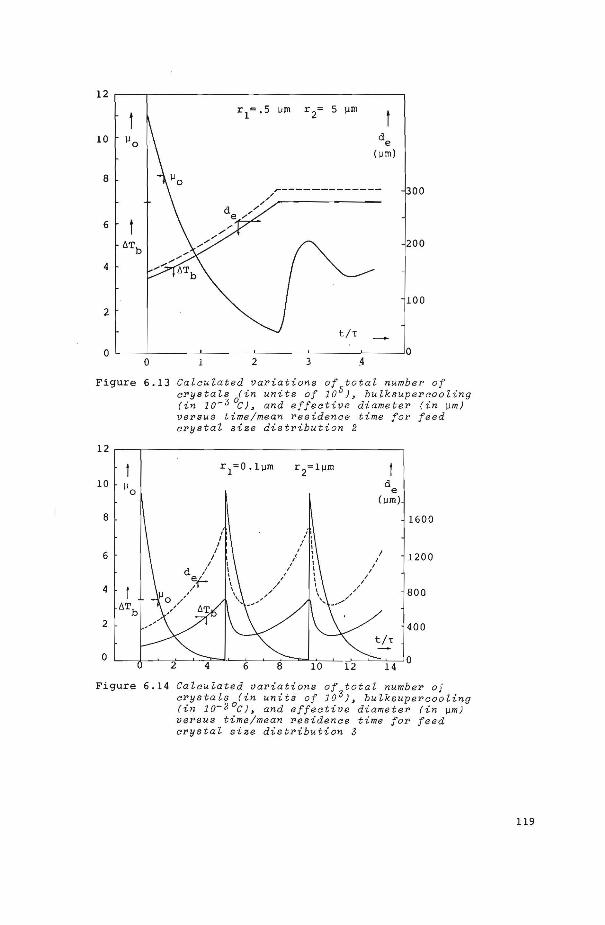
12
10 \lo
8 300
6
liTb 200
4
100 2
t/1
0 L_ __ L_ ____ ~-------L------~----~----~0
0
Figure 6.13
12
10 \lo
8
6
4
2
0 2
Figure 6.14
2 3 .4
Calculated variations of total number of crystal~ (in units of 10 5 ;, bulksupercooling (in Jo-3 °C) , and effective diameter (in )lm) versus time/mean residence time for feed crystal size distributi on 2
r1;0 .1)Jm r 2;1~m
d e (~m)
1600
I 1200 I
I I
I
I I
800 I
400
14 0
Calculated variations of total number oj c rystals (in units of 10 3;, bulksupercooling (in Jo-2°c), and effective diameter (in ~m) versus time/mean r e sidence time for feed crystal size distribution 3
119
is only 10-6 0 e above the critica! supercooling for the largest feed
crystals which is 0.007°e. Very smal! adjustments in this order of
magnitude are purely theoretica! since conditions of ideal mixing in
the ripening tank can never be reached. If for example,in practice,
variations in the order of 10-3 0 e would occur, a tremendous amount of
nuclei would survive and steady state conditions would not be obtained.
Feed siz e distribution J
The results of the calculations for feed crystal size distribution
3 are graphically represented in figure 6.14. From this figure it can
be seen that for this narrow distribution of very small feed crystals
a cyclic behavier of öTb and the moments of the crystal size distri
bution occurs .. In this case the total number of crystals increases by
several orders of magnitude when the critica! öTb(0.035°e) is surpassed.
When all these crystals start to grow the total crystal surface increas
es so much that öTb decreases again to far below its critica! value.
From the results of figure 6.14 it can be expected that an undamped
cyclic behavier occurs in this case.
By means of this model it is possible to determine the influence
of process conditions upon the time averaged effective diameter and
upon the coefficient of variation. Unfortunately, this could not be
done because of the large amount of computer time that simultaneous
solution of the partial differential equations requires. The influence
of process c onditions upon de has therefore been determined by means
of a much simpler model in which a steady state; crystal size distri
bution and a constant bulksupercooling is .assumed. This modeland the
results obtained with it will bedescribed in ' the next section.
6.6 Steady state · model
At steady state conditions the population density balance for the
c rysta ls in t he ripening tank can be written as:
d (n v) dr
n nf +-
T T (6-9)
An advantage of the steady state over the unsteady state model is that
eq.(6-9) can be solved directly by numerical integration. Furthermore,
a size de pendent growth rat e can be used without causing computational
difficulties . Since there are always ma n y cryst als t hat are close t o
the initial size, the growth rate of those crystals wil! certainly be
influenced by the Gibbs-Thomson effect as can be seen from figure 5.21.
Application of a size dependent growth rate is therefore more realistic .
120
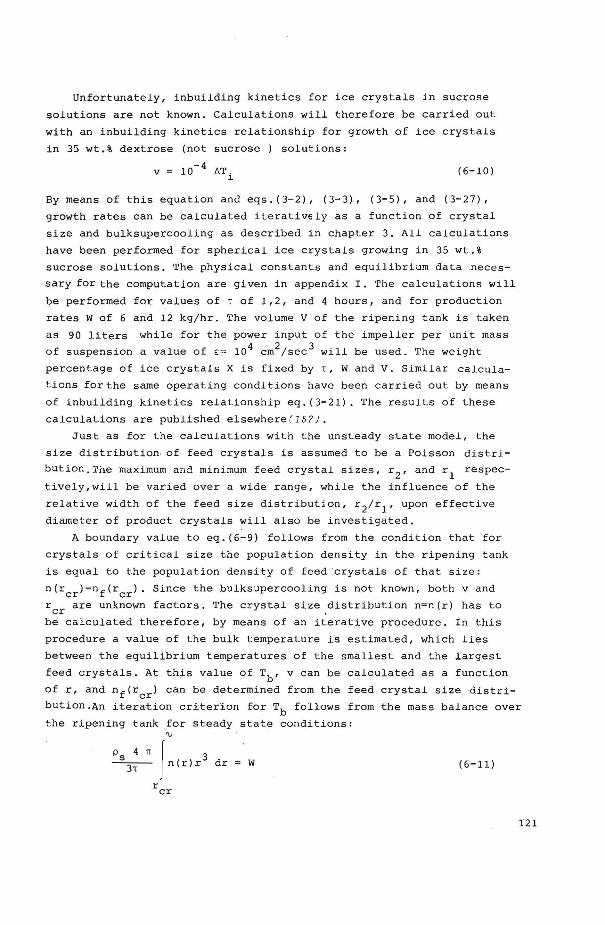
Unfortunately, inbuilding kinetics for ice crystals in sucrose
solutions are not known. Calculations wil! therefore be carried out
with an inbuilding kinetics relationship for growth of ice crystals
in 35 wt.% dextrose (not sucrose ) solutions:
V = (6-10)
By means of this equation and eqs.(3-2), (3-3), (3-5), and (3-27),
growth rates can be calculated i t eratively as a function of cry stal
size and bulksupercooling as described in chapter 3. All calculations
have been performed for spherical ice crystals growing in 35 wt.%
sucrose solutions. The physical constants and equilibrium data neces
sary for the computation are gi ven in appendix I. 'rhe calculations wil!
be performed for values of 1 of 1,2, and 4 hours, and for production
rates W of 6 and 12 kg/hr. The volume V of the ripening tank is taken
as 90 liters while for the power input of the i mpeller per unit mass
of suspension a value of E= 104 cm2;sec 3 will be used. The weight
percentage of ice crystals X is fixed by 1 , Wand V. Similar c alcu la
tions forthe same eperating conditions have been carried out by means
of inbuilding kinetics relationship eq.(3-21). The resu lts of these
calculations are published elsewhere(15 ?) .
Just as for the calculations with the unsteady state model, t he
size distribution- of feed crystals is assumed to be a Poisson d istri
b ution.rne maximum and minimum feed crysta l sizes, r 2 , a nd r1
r espec
tively,will be varied over a wide range, while the influe nce of t he
relative width of the feed size distribution, r 2; r 1 , upon effective
diameter of product crystals will also be investigated.
A boundary value to eq.(6-9) fellows from the condi t ion that for
crystals of critica! size the population density in the ripening tank
is equal to the population density of fee d crystals of that si ze :
n(rcr)=nf(rcr). Since the bulksupercooling is not known, bot h v a nd
rcr are unknown factors. The crystal size distribution n=n(r) has to
be calculated therefore, by means of an iterative procedure. In this
procedure a value of the bulk temperature is estimated, which lies
between the equilibrium temperatures of the smalle st and the largest
feed crystals. At this value of Tb, v can b e calculated as a function
of r, and nf(rcr) can be determined from the feed crystal size ·distri
bution.An iteration criterion for Tb fellows f r om the mass balance over
the ripening tank for steady state conditions:
"' Ps3:n /n(r)r3
r er
dr w ( 6-11)
121

The results of the calculations are summarized in table 6.2. The bulk
supercoolings that resulted at the given operating conditions . are also
indicated in this table. A graphical representation of the results is
given in figure 6.15.
f de (cm) r1=r
2/20
r1=r
2/40
def(cm)
/ /
/
Figure 6.15 Effective diamet of product crysta~s as a function of effective diamet. of feed crystaZs and of m~~n residence time for v = 10 I::.T.
7-
In this figure the crystal size distribution of the feed crystals is
characterized by the effective diameter of feed crystals def defined by: r2 r2
def= 2 I nf(r) r3
dr/ I nf(r) r2
dr (6-12)
In figure 6.15 the results are given for distributions of different
widths: r 2;r1 =20, and r 2/r1=40. The parameter in this figure is the
mean residence time of crystals in the ripening tank.
From figure 6.15 it can beseen that de goes through a minimum with
def· The increase of de with decreasing def at small values of def has
to be attributed to more effective ripening which causes the absolute
number of feed crystals that survive to decrease with decreasing def·
Providing that steady state conditions can be reached, the bulktempera- ·
ture willalways be between the equilibrium temperature of the smallest
122
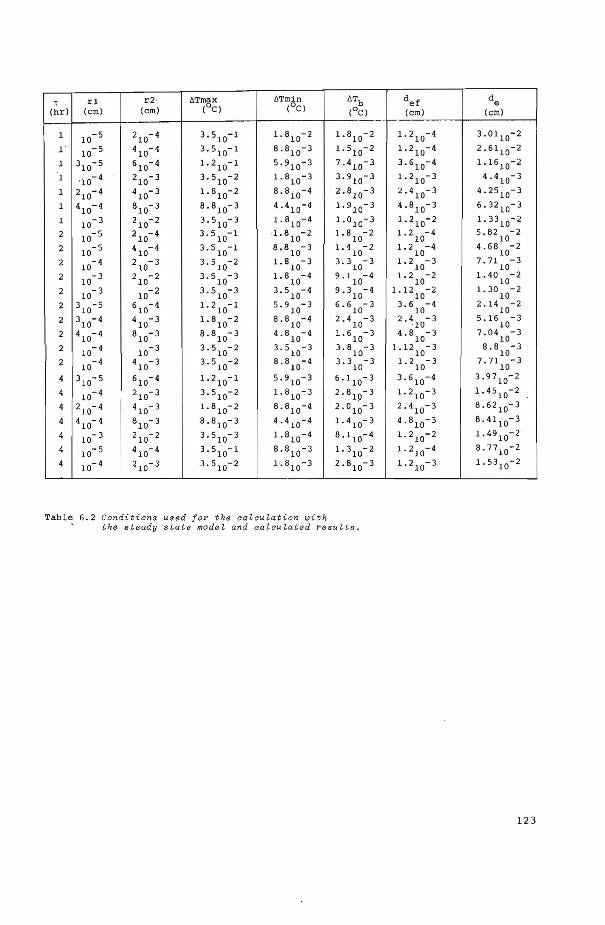
T r1 r2· liTmi\x ilTmin liTb def de (hrl (cm) (cm) ( C) (OC) (OC) (cm) (cm)
1 10- 5 210-4 3.510-1 1. 810-2 1.810-2 1.210-4 3.0110-2
1 10- 5 410-4 3.510-1 8.810-3 1. 510-2 1.210-4 2.6110-2
1 310-5 610-4 1.210-1 5.910-3 7.410-3 3.610-4 1.1610-2
1 ' 10- 4 210-3 3.510-2 1.810-3 3.910-3 1. 210-3 4 . 410-3
1 210-4 410-3 1.810-2 8.810-4 2.810-3 2.410-3 4 . 2510-3
1 410-4 810-3 8.810-3 4.410-4 1.910-3 4.810-3 6.3210-3
1 10- 3 210-2 3.510-3 1. 810-:4 1.010-3 1. 210-2 1.3310-2
2 10- 5 210-4 3.510-1 1.810-2 1.8 10
-2 1.2 -4 10
5.82 -2 10
2 10- 5 410-4 3.510-1 8 8 -3 • 10 1.4 10
-2 1.2 -4 10
4.68 10
-2
2 10
-4 2 -3 10 3.510-2 1.810-3 3.3
10 -3 1.2
10 -3 7.71 -3
10 2 10- 3 210-2 3.510-3 1.810-4 9.110-4 1.2
10 -2 l. 40
10 -2
2 10- 3 10- 2 3.510-3 3.510-4 9.3 -4 1.12 -2 l. 30 -2 10 10 10
2 \o-5 610-4 1.210-1 5.910-3 6.6 10
-3 3.6 -4 10
2.14 -2 10
2 310-4 4 -3 10 1.810-2 8.810-4 2.4
10 -3 2 . 4
· 10 -3 5.16 -3
10 2 410-4 8 -3
10 8.810-3 4.810-4 1.6 -3 10
4.8 10
-3 7.04 -3 10
2 10- 4 10- 3 3.510-2 3.510-3 3 . 8 10
-3 1.12 -3 10
8.8 10
-3
2 -4 410-3 3.510-2 8.810-4 3.3 -3 1.2 -3 7.71 -3 10 10 10 10
4 310-5 610-4 1.210-1 5.910-3 6.110-3 3.610-4 3.9710-2
4 10- 4 210-3 3.510-2 1. 810-3 2.810-3 1.210-3 1.4510-2
4 210-4 410-3 1.810-2 8.810-4 2.010-3 2.410-3 8.6210-3
4 410-4 810-3 8.810-3 4.410-4 1.410-3 4.810-3 8.4110-3
4 10- 3 210-2 3.510-3 1.810-4 8.110-4 1.210-2 l. 4910-2
4 10- 5 410-4 3.510-1 8.810-3 1.310-2 1.210-4 8. 7710-2
4 10- 4 210-3 3.510-2 1-.810-3 2.810-3 1. 210-3 1.5310-2
Tab1e 6.2 Conditions used for the ca~ cu~at ion wit h the steady state mode~ and ca ~cu ~ated resu~ ts.
123
and that of the larges~ feed crystals. It can beseen from table 6.2
that for very small values of def the bulktemperature approaches the
equilibrium temperature of the largest feed crystals, especially for
narrow feed size distributions. In this case the bulktemperature
decreases linearly proportional to the size of the feed crystals. The
driving force for growth increases therefore wtth decreasing feed
crystal size and subsequently the effective diameter of the product
crystals must increase.
When the feed crystals become so small, or when the feed crystal
size distribution becomes so narrow that the population density of the
largest feed crystals exceeds a certain value, steady state cannot be
attained. This critica! value of nf(r2 J depends upon T and X. For val
ues of nf(r2 ) larger than this critica! value eq.(6-11) cannot be
satisfied any more for any value of Tb that is between the equilibrium
temperatures of the smallestand largest feed crystals. It has to be
remarked however, that even in those cases where the model prediets
steady state conditions these conditions may be hard to maintain in
practice. A smal! upset in feed conditions for example,may result in
an enormous increase in the number of feed crystals that survive. For
large feed crystals de approaches def since the driving force for rip
ening becomes very small.
From table 6.2 and figure 6.15 it can be seen that at a constant
value of def the effective diameter of product crystals is larger for
narrower feed size distributions. This influence of the width of the
feed distribution becomes larger with decreasing def" For the condi
tions usedin the calculations the influence of the width of the feed
size distribution upon de becomes negligible for
than those corresponding to the minima in de.
values of def larger
From figure 6.15 it can also beseen that d increases with increas· e ing T . This incre ase is less than linear. For those cases in ·which the
bulk temperature approaches the equilibrium temperature of the largest
feed crystals an almest linear proportionality between de and T is
calculated with inbuilding kinetics relationship eq . (6-10). This linear
proportionality can be explained as fellows :
For 100% inbuilding controlled growth and i n case few very small feed
crystals s~vive, the area averaged growth r a te in e q. (5-8) can b e
expressed by: v = kr ~Tb= de/6< . Since in this case ~Tb is determined
by the size of the largest feed crystals only, de is linearly propor
tional toT for constant feed conditions.
124
By changing the production rate from 6 to 12 kg/hr at constant 1
and constant values of r1
and r 2 , the calculated values of de a nd 4Tb
remained exactly unchanged. This can be explained by the fact that at
constant 1, X changes linearly proportional to W. The ratio of the
number of crystals per unit volume in the ripening tank and in the feed
stream remains constant and, since ideal mixing is assumed, ripening
takes place at exactly the same rate.
6. 7 Discussion
In this section it will be attempted to explain the influences of
some process parameters upon d50
and CVde. Therefore the qualitative
conclusions that were drawn in section 6.4.1 will be disc ussed succe s-·
sively.
6.7.1 Effects of 1 and X upon a50
From figure 6.4 it can be seen that d 50 increases less than linear
ly with increasing 1. Since too many variables have been changed simul~
taneously d50
and 1 can only be correlated from the experimental results
of a few runs:
- the experimental data carried out with the rota-pro and for nr=1.83
rps can be correlated by: ct50= 21°· 75 (ct50
in ~mand 1 in hrs). This
correlation is indicated by the solid line in figure 6.4.
- the results obtained with the teflon tubes crystallizer and nr=3 rps
can be correlated with: d 50=2.71°· 75 . This correlation is indicat ed
in figure 6.4 by the broken line .
These less than linear relationships between d50
and 1 are in agreement
with the results of the mathematica! model for steady state conditions.
From figure 6.5 it can beseen that ct50
increases less than linear
ly with increasing X. The change o f d50
with X appears to be quite
similar to that of ct50 with 1. This is not surprising since W varied
only slightly for all the experiments carried out with the same cry stal
lizer ripening tank combination. For a constant value of W, X is line
arly proportional to 1.
By means of the steady state model that was described above it has
been calculated that at a constant value of 1, the effective diameter
does not change with X, since the production rate W changes linearly
proportional to X. In this mode l ideal mixing was assumed. In practice,
however, X might influence the mixing performance, and therefore also
d 50 . Values of the product (nr-8) calculated in chapter 6.4.3 varied
only slightly with X. For these calculations it was assumed that the
suspensions behave as Newtonian fluid. For the largest magma densi t ies
125
(38 vol.%) a deviation from Newtonian behavior may occur. X also
influences the values of heat and mass transfer coefficients as indicat
ed in figure 3.8. These influences have not been taken into account for
the calculations with the steady state model. Increasing X from 10 to
30 percent would increase the melting rate of subcritical crystals and
the growth rate of supercritical crystals by maximal 35%(for 100% mass
transfer controlled growth) . From the experimental data it appears that
the effect of X upon mixing performance and upon heat and mass transfer
coefficients must be small since d50
increases with X in a similar way
as with T at constant W.
6.7.2 Effect of eb upon d 50
From figure 6.4 it can beseen that d50
decreases with increasing
eb. Since eb has only be~ varied over a small range, and since various
eperating conditions were changed at the same time, not enough data are
available to correlate d 50 with eb. In the calculations with the math
ematica! roodels eb has not been varied. The change of d50
with eb will
only be discussed therefore,by means of qualitative considerations. By
increasing eb the following factors effect the ripening process:
1. the rate of melting of subcritical crystals decreases due to an
increasing mass transfer resistance,
2. the rate of growth of supercritical crystals decreases due to an
increasing mass transfer resistance,
3. the ratio growth rate/melting rate probably decreases due to an
increasing inbuilding resistance,
4. the size of feed crystals decreases.
As a result of the first 3 effects the effective diameter of the
product crystals will decrease with increasing eb. The last effect on
the other hand, will tend to increase de with increasing eb' providing
that the feed crystals are already smaller than the value corresponding
to the minimum in the appropriate de-def curve in figure 6.15.
From photographs of the feed crystals it can be concluded that the
largest dimension of these crystals decreases considerably with increas
ing eb. Nothing can be concluded, however, about the change of the
thickness of feed crystals with eb. It seems quite possible that the
thickness of these crystals is the dimension that determines whether
feed crystals are subcritical or not.
From the experimentally observed decrease of d 50 with increasing eb
it has to be concluded that the effect of the first 3 factors upon d50
is larger than that of the feed crystal size.
126
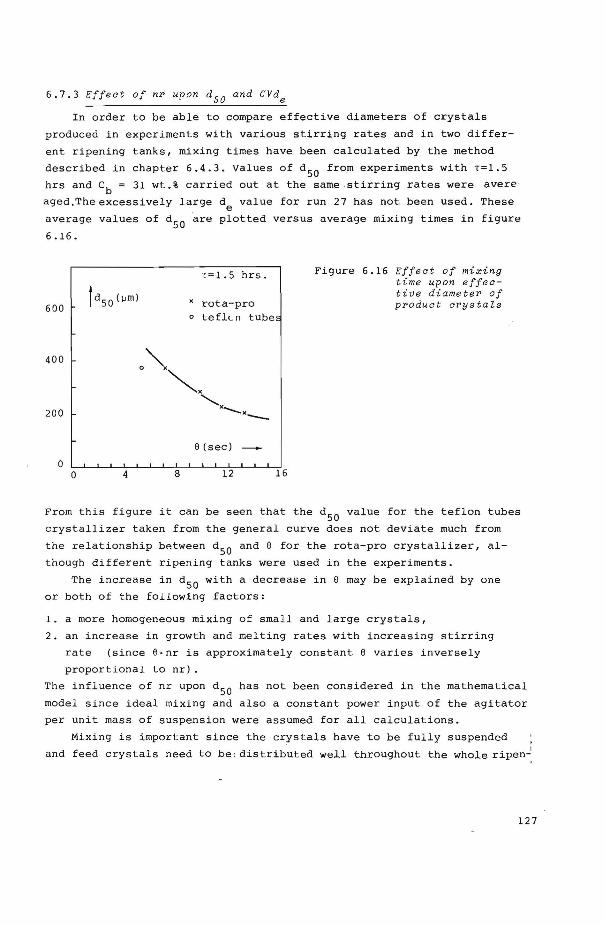
6.7.3 Effect of nP upon d 50 and CVde
In order to be able to compare effective diameters of crystals
produced in experiments with various stirring rates and in two differ
ent ripening tanks, mixing times have been calculated by the method
described in chapter 6.4.3. Values of d50
from experiments with T=1.5
hrs and eb= 31 wt.% carried out at the same -stirring rates were avere·
aged.Theexcessively large de value for run 27 has notbeen used. These
average values of d50
are plotted versus average mixing times in figure
6 .16.
600
400
200
0 0 4 8
T=1.5 hrs.
x rota-pro o teflL n tube~
El(sec)
12 16
Figure 6.16 Effect of mixing time u,pon effecti v e d i ame teP of pPoduc t c"f'ystals
From this figure it can be seen that the ct50
value for the teflon tubes
crystallizer taken from the general curve does not deviate much from
the relationship between d 50 and e for the rota-pro crystallizer, al
though different ripening tanks were used in the experiments.
The increase in d 50 with a decrease in e may be explained by one
or both of the following factors:
l. a more homogeneous mixing of smal! and large crystals,
2. an increase in growth and melting rates with increasing stirring
rate (since El·nr is approximately constant e varies inversely
proportional to nr) .
The influence of nr upon d 50 has not been considered in the mathematica!
model since ideal mixing and also a constant power input of the agitator
per unit mass of suspension were assumed for all calculations.
Mixing is important since the crystals have to be fully suspended
and feed crystals need to be: distributed well throughout the whole ripen~
127
ing tank in order to provide for optima! ripening conditions everywhere
in this tank. If, for example, a group with many feed crystals does not
mix with larger crystalsripeningwithin this group will occur such that
many more feed crystals wil! finally survive than when larger crystals
would have been present. In this latter case the bulktemperature ad
justs to a higher value so that the melting rate increases and fewer
crystals survive.
By increasing nr the power input E of the agitator per unit mass
of suspension increases considerably: E is approximately proportional
to nr to the power 3.5 for the experimental conditions encountered in
this study(155). According to eq.(3-35) heat and mass transfer coef
ficientsare proportional to E toa power 0.17-0.25. These coefficients
are therefore almost linearly proportional to nr. By increasing nr, the
melting rates of subcritical crystals and growth rates of supercritical
crystals (if not completely inbuilding controlled) will increase,
resulting in larger product crystals.
As the rate of disappearance increases with increasing nr, either
due to better mixing or due to a larger melting rate, the tendency to
unstable behavier will increase as wel!. If, for example, ripening is
very effective due to a large value of nr, the situation may arise
that the number of feed crystals that survives per unit time is small
er than the rate at which crystals leave the crystallizer. This gives
rise to an unstable situation as has been described in chapter 4.9.2.
The increase in the coefficient of variatien with increasing nr, as is
found in the experiments, may be explained by the increasing tendency
to unstable behavior.
6.7.4 Effect of type of crystallizer upon d 50
In chapters 6.4.4 and 6.4.5 it has been shown that shape and size
distribution of feed crystals produced in different types of crystal
lizersvary considerably. By means of the steady state model it was
clearly shown that de is generally strongly dependent upon the size
distribution of the feed crystals. It is rather surprising therefore
that the effective diameters of crystals produced from ripenings tanks
in combination with the three different types of crystallizers agree
wel! with each other, the more so since heat fluxes and residence times
in the crystallizers varied considerably in the different experiments.
A possible explanation can be the fact that the thickness of the feed
crystals may be independent of eperating conditions.If it is this
thickness that determines whether a feed crystal in the ripening tank
128
is subcritical or not, d50
may wel! be independent of the type of
crystallizer and its conditions.
The thickness of a feed crystal depends upon its initia! thickness
(size of a nucleus), the average growth rate in the c-axis direction,
and the residence time in the crystallizer. It has been pointed out
already many times before that newly formed ice crystals can be in a
perfect state and that the c-axis growth rate may be very smal!. It is
quite possible therefore that the product of average growth rate and
residence time is smal! compared to the thickness of a nucleus. The
initia! thickness of a crystal may therefore determine whether that
crystal is subcritical or not _in the ripening tank. Since new
crystals are formed continuously the supercooling in the crystal
lizer must be at least equal to the threshold value for secondary
nucleation 6Tnuc· It is quite possible that due to the presence of
a large crystal surface available for growth the supercooling wil!
never exceed 6Tnuc very much independently of eperating conditions
or type of crystallizers. The initia! crystal size may have been
approximately the same therefore, in all runs, which can explain
the fact that d50
is dependent upon the type of crystallizer and
its eperating conditions.
6.7.5 Experiments with coffee extract
The effective diameter of ice crystals produced from coffee
extract is smaller than that of crystals grown from sucrose sol
utions at the same concentratien of dissolved solids. This effect
cannot be attributed to mixing effects since values of 0 for coffee
extract are almost the same as in sucrose solutions. The most likely
explanation is that growth and melting rates of ice crystals in
coffee extract are lower than in sccrose solutions because of a
higher viscosity and lower diffusion coefficient in coffee extract.
The rate of ripening may therefore be lower than in sucrose sol
utions, resulting in smaller product crystals.
6.7.6 Effect of process conditions upon CVde
It can be expected that since the effective diameter of product
crystals is dependent upon 1, changes of 1 with time wil! also lead
to changes of de with time. This effect has indeed been found in
several runs (5,6,7,11,12,30,32). For these runs the frequency of the
fluctuations of d50
and 1 were approximately the same. For other runs
however, such as runs 27-29, large values of CVdewere found while
129
T and X were approximately constant.
partly be ascribed to errors made in
been discussed in sectien 5.3.2. The
Fluctuations in d can of course e the determination of d as has e maximum errors that can be ex-
pected give rise to a coefficient of variatien of approximately· 5-10%.
It is possible therefore that the smal! fluctuations that occur in
some runs(9,24,28, and 33) may only be due to experimental errors and
smal! fluctuations in 1. In other experiments for which larger fluc
tuations in de occur these fluctuations may result from unstable be
havior such as described in the third example of the unsteady state
model.
For some experiments with the rota-pro it has been attempt ed to
influence CVde by bypassing the preheater for 3 to 10 minutes every
hour. CVde did not change significantly in these experiments. In ex
periment 33 it was attempted to widen the feed size distribution by
continuously recycling about 10% of the feed crystals from the exit
of the teflon tubes crystallizer directly to the entrance of this
crystallizer. Photographs of the feed crystals showed that in this
case more large crystals could be observed t h an without recycling.
Only smal! fluctuations in the effective diameter of product crystals
occurred. These fluctuations were much smaller than for other runs
(8,10) with the teflon tubes crystallizer. By observing the product
crystals for this experiment it appeared that many conglomerates of
ice cry stals were present. Due to the fact that many feed c rystals
that would normally survive adhere to o t her crysta ls, t he incre a s e in
total crystal surface is less than would occur without conglomeration.
As a consequence, the bulksupercooling is less reduced and a more
apparent stable behavior results. Conglomeration however, is fatal
for the wash column operatien due to inclusion s of mother liquid in
the conglomerates. Therefore, the formation of conglomerate s has to
be preve nted.
6.8 CONCLUSIONS
1. Effective diameters de have been determined of ice crystals growing
from sucrose solutions and coffee extract in a continuous stirred
tank fed with a suspension of small c rystals. In many cases de
appea red to fluctua te with time conside rably.
130
2. Time averaged effective diameters d50
are-- proportional to the mean
crystal residence times to the power 0.75. A less than linear
proportionality is also predicted by means of a mathematica! model
for steady state conditions.
3. d50
appeared to increase with increasing s t irring rate, while at the
same time the relative magnitude of the fluctuations increased as
well. This has been explained by the fact that at a larger degree
of mixing of the smal! feed crystals with the suspension in the
ripening tank, more effective ripening occurs -which causes bath
d50
and the tendency to unst_able behavier to increase.
4. d50
decreased with increasing sucrose concentration, probably due
to decreasing growth and nucleation rates.
5. The experiments have been carried out with 3 different types of
crystallizers and 2 different ripening tanks. Although shape and
largest crystal dimension of feed crystals produced from the various
crystallizers appeared to be quite different, d50
-values for the
product cryst als hardly depend upon the type of crystallizer. This
has been attributed to the fact that d50
is possibly only dependent
upon the thickness of feed crystals and nat upon the other crystal
dimensions. Since in every crystallizer the supercooling probably
adjusts to the threshold value of nucleation, the thickness of the
feed crystals may be the same in all cases.
6. From the result s of the steady state model i t can be seen that for
very smal! feed crystals the effective product diameter de becomes
inversely proportional to the effective diameter of feed crystals
def" For lar ge values of def on the o ther hand the rat e of ripening
becomes very smal! and de varies almast linearly proportional to
def" 7. By mean s of t he uns tea d y stat e model the variatien with time of
supercooling and moments of the crystal size distribution have been
calculated. It has been shown that the tendency to unstable behav ier
incre~ses wit h decre asing feed cryst al size and with a narr owing o f
the feed crystal size distribution .
1 31
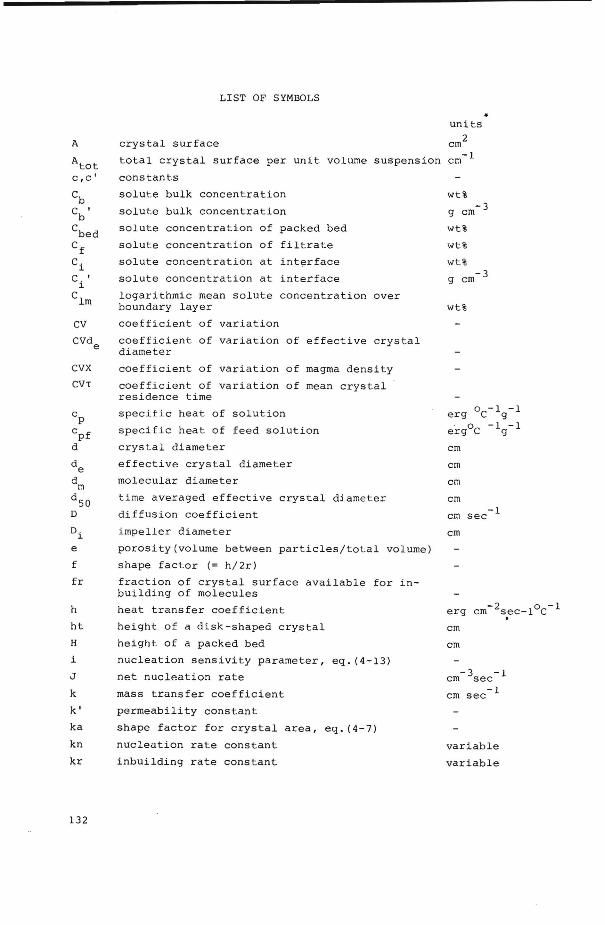
LIST OF SYMBOLS
• units
A crystal surface cm2
A tot c,c'
total crystal surface per unit volume suspension cm- 1
constants
eb
Cb'
solute bulk concentration
solute bulk concentration
cbed
Cf
ei
solute concentration of packed bed
solute concentration of filtrate
solute concentration at interface
C. I
l.
clm
solute concentration a t interface
logarithmic mean solute concentration over boundary layer
coefficient of variation
coefficient of variation of effective crystal
CVX
CVT
diameter
coefficient of variation of magma
coefficient of variation of mean residence time
specific heat of solution
specific heat of feed solution
crystal diameter
de effective crystal diameter
dm molecular diameter
density
crystal
d 50 time averaged effective crystal diameter
D diffusion coefficient
Di impeller diameter
e porosity(volume between particles/total volume)
f shape factor (= h/2r)
fr fraction of crystal surface available for inbuilding of molecules
h
ht
H
heat transfer coefficient
height of a disk-shaped crystal
height of a packed bed
i nucleation sensivity parameter, eq. (4-13)
J
k
net nucleation rate
mass transfer coefficient
k' permeability constant
ka shape factor for crystal area, eq. (4-7)
kn
kr
132
nucleation rate constant
inbuilding rate cons t ant
wt%
g cm- 3
wt%
wt%
wt%
g cm- 3
wt%
0 -1 -1 erg C g ergoC -1g-1
cm
cm
cm
cm
cm sec -1
cm
erg cm- 2~ec-1°c- 1
cm
cm
-3 -1 cm sec
cm sec- 1
variable
variable

kv shape factor for crystal volume,eq. (4-8)
K permeability
t crystal size
t er critica! crystal size
L size of primary eddies
n=n(t) population density
n0
population density in outlet stream
nf population density in feed stream
ncr population density of nuclei
n' number of molecules in a cluster
nr
Po
Q
r
re R
Re
Sc
Sh
Sp
t
T
T•
T e
Tf T . ~
T. • ~
T m u
u v=v(t)
stirring rate
solute mass flux
total mass flux
kinetic order
power input
power number
rate of heat withdrawal
crystal radius
effective crystal radius
gas constant
Reynolds number
Schrilidt (v /D) or
Sherwood (k d/D)
(v d / v)
Prandtl (~ c /À) number p
or Nusselt (h d/À)number
specific surface of crystals
time
temperature
equilibrium temperature
bulktemperature
equilibrium t emperature of a solution with solute concentratien eb
temperature of solution in equilibrium with a crystal
temperature of feed stream
interface temperature
equilibrium t emperature of a solution with solute concentrat ien ei freezing point of water
superficial ve locity
flow velocity
linear growth rate
linear growth rate perpendicular to crystallographic c-axis
2 cm
cm
cm
cm -4 cm -4 cm -4 cm -4 cm
-1 sec
g cm- 2sec- 1
g cm- 2sec- 1
erg sec- 1
cm
cm -1
sec oe
oe
oe
oe
oe
oe
oe
oe
oe
cm s e c - 1
cm sec- 1
cm sec -1
cm sec -1
1 3 3
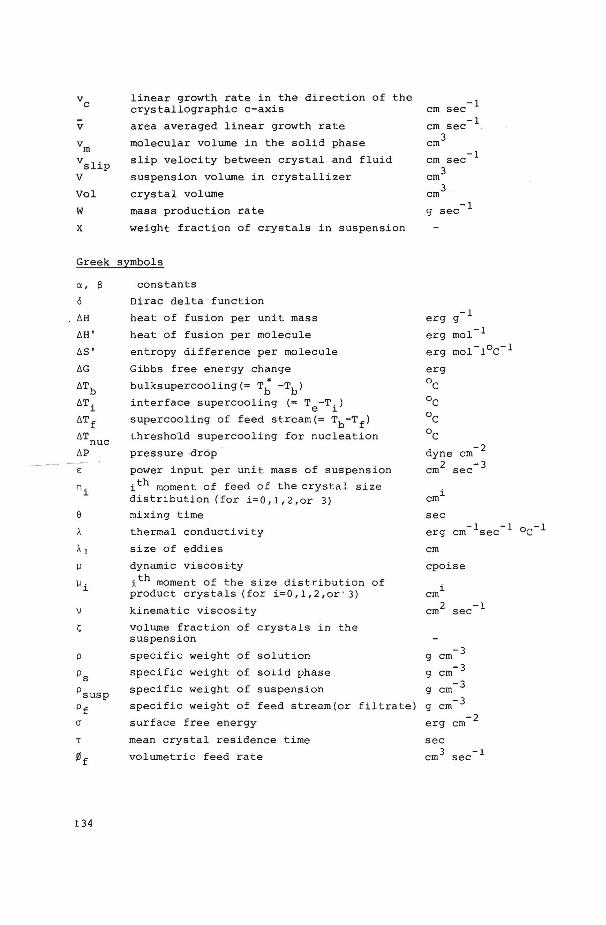
V
vm
vslip V
Vol
w
linear growth rate in the direction of the crystallographic c-axis
area averaged linear growth rate
molecular volume in the solid phase
slip velocity between crystal and fluid
suspension volume in crystallizer
crystal volume
mass production rate
-1 cm sec -1 cm sec
cm3
-1 cm sec
cm 3
cm 3
g sec- 1
X weight fraction of crystals in suspension
Greek symbols
Ct, B 6
l>H
l>H'
l>S'
l>G
l>Tb
l>Ti
l>Tf l>T nuc l>P
e:
ni
e À
)'I
u
ui
\)
ç
p
PS
0susp pf a
T
~f
134
constants
Dirac delta function
heat of fusion per unit mass
heat of fusion per molecule
entropy difference per molecule
Gibbs free energy change
bulksupercooling(= T~ -Tb)
interface supercooling (= Te-Ti)
supercooling of feed stream(= Tb-Tf)
threshold supercooling for nucleation
pressure ·drop ·
power input per unit mass of suspension
ith moment of feedof the crystal size distribution (for i=0,1,2,or 3)
mixing time
thermal conductivity
size of eddies
dynamic viscos~ty
ith moment of the size distribution of product crystals (for i=0,1,2,or'3)
kinematic viscosity
volume fraction of crystals in the suspension
specific weight of solution
specific weight of solid phase
specific weight of suspension
erg g- 1
erg mol- 1
dyne cm- 2
cm2 sec- 3
sec
cm
cpoise
i cm
cm 2 sec- 1
g cm- 3
g cm- 3
g cm- 3
specific weight of feed stream(or filtratel g cm- 3
surface free energy erg cm- 2
mean crystal residence time
volumetrie feed rate
~0 ~·
w
volumetrie output rate
difference in free energy per molecule between solid and liquid phase
molecular inbuilding frequency
• unless stated otherwise
cm3 sec-1
erg -1
sec
135
REPERENCES
l. Thijssen H.A. C., and Romijn J.G .; Proc.l3th International Congress on Refrigeration, paper no.9.0l, Washington D.C., sept. (1971).
2. Thijssen H.A.C.; J.Fd.Technol., (1970), 5, 211. 3 . Bridge R.C., Smith K.A., Johnson S., and-Rinne W.W.; Chem.
Eng.Progr.Symp.Ser.,(l97l), 67, no.l07, 212. 4. Brian P.L.T.; Mechanical Engineering, (1968), 90, 42. 5. Randolph A.D., and Larson M.A.; A.I.Ch.E.Journal, (1962) ,8,
no.5, 639. -6. Volmer M., and Weber A.; Z.Physik.Chem., (1925), 119, 277. 7. Becker R., and Döring R.; Ann.Physik, (1935), 24, 719. 8. Nyvlt J., and Gottfried J.; Coll.Czech.Chem.Comm., (1967),
32, 3459. 9. Nielsen A.E.; Kineties of Preeipitation, Pergamon Press,(l964).
10. Volmer M.; Z.Electrochem., (1929), 35, 555. 11. Sadek S.E.; Doctoral Thesis, M.I.T.~(l966). 12. Vonnegut B.; J.Appl.Phys., (1947), 18,593. 13. Fletcher N.H.; J.Atm.Sci., (1969), 26, 1 266 . 14. Edwards G.R., and Evans L.F.; Trans:Far.Soc., (1962), 58, 1649. 15. Melia T.P., and Moffitt W.P.; I.E .C .Fund., (1964), 3, ll3. 16 . Estrin J.; Res.Dev.Rept.no . 494, Office of Saline Water, U.S.
Dept.of the Interior, Washington, (1970). 17. Huige N.J.J., Thijssen H.A.C., and Schuurmans H.J.A.; Proc.
CHISA Symp., Marienbad, Czech., (1969). 18. Sherwood T.K., and Brian P.L.T.; Res.Dev.Rept.no.l79, Office
of Saline Water, U.S.Dept. of the Interior, Washington,(l966). 19. Denk E.G., and Botsaris G.D.; Proceedings I.C.C.G.3, Marseille,
France, (1971). 20. Lindenmeyer C.S. , and Chalmers B.; J.Chem.Phys. (1966) , 45,2804. 21. Ayerst R.P., and Phillips, M.I.; Proceedings Symp.Industria l
Crystallization, Inst.Chem.Engrs., London, (1969), 56. 22. Clontz N.A., and Mc.Cabe W.L.; Chem.Eng.Progr.Symp.Ser., (1971),
67, no.llO, 6. 23. Nyvlt J., and Gottfried J.; Coll.Czech.Chem.Comm., (1964), 29,
2283. --24. Powers H.E.C.; Ind.Chemist, (1963), 39, 351. 25. Leichkis D.L., and Mikhailov N.V.; Sov .Phys.Doklady, (1970),
14, 1226. 26. Shor S.M. ; Doctoral Thesis, Iowa State University, (1970). 27. Johnson R.T.; Doctoral Thesis, North Carolina State University,
(1970). 28. Mullin J.W.; Chem. and Ind. (1971), no.9, 237. 29. Cayey N.W. and Estrin J.; I.E.C.Fund. (1967), 6, 17 . 30. Shabalin K.N., and Inyushkin G.V.; Growth of Crysta~s , N.N.Sheftal,
ed., Consultants Bureau, New York, (1968), 6a, 12. 31. Melia T.P., and Moffitt W.P.; J .Coll.Sci., (1964), 19, 433. 32. Lal D.P., Mason R.E.A., and Strickland Constable R.~, J.Crystal
Growth, (1969), 5, l. 33. Matusevich N.L.;-Growth of Crysta~s , N.N.Sheftal, ed. , Consul
tants Bureau, New York, (1959), l, 952. 34. Baranov G.P., Matusevich L.N., and Smolin A.N.; Chem.Petro.Eng.,
(1968) 1 6, 463. 35. Matusevich L.N.; Theor.Found.Chem.Eng., (1968 ), I, 419.
136

36. Matusevich L.N., and Elinova N.P.; J.Appl.Chem.U.S.S.R., (1964), 37, 2279.
37. Saranov G.P., and Matusevich L.N.; J.Appl.Chem.U.S.S.R., (1967), 40, 2147.
38. Thijssen H.A.C., Vorstman M.A.G., and Roels J.A.; J.Crystal Growth, (1970), 3, 4, 355.
39. ValiG.; Scientific-Report MW-58, Mc.Gill Univ., AlberLa,Canada, ( 1968).
40. Nyvlt J.; J .Crystal Growth, (1968), ]., _!, 377. 41. Mullin J.W., and Raven K.O.; Nature, (1962), 195, 35. 42. Mullin J.W., Chakraborty M., and Mehta K.; J.Appl.Chem., (1970),
20, 367. 43. Mitsuda H., Miyake L., and Nakai T.; Int.Chem . Eng., (1968),
8. 733. 44. Ting H.H., and McCabe W.L.; Ind . Eng.Chem., (1934), 26, 1201. 45. Bransom S.H., Brown D.E., and Heeley G.P.; Proceedings Symp.
Industrial Crystallization, Inst.Chem.Engrs., Londen, (1969),45. 46. Rosen H.N.; Ooctoral Thesis, Northwestern University, Evanston,
Illinois, (1969). 47. Sherwood T.K., Brian P.L.T., and Margelis G.; Res.Oev.Rept.,
no.474, Office of Saline Water, U.S. oept.of the Interior, Washington, (1970).
48. Ayerst R.P., Phillips M.I., and Strickland-Constable R.F.; Proceedings I.C.C.G. 3, Marseille, France, (1971).
49. Strickland-Constable R.F.; Kineti cs and Mechan ism of Crysta~~ization , Academie Press, Londen, (1968).
50. Ottens E.P.K ., Janse A.H. and de Jong E.J.; Proceedings I.C.C.G. 3, Marseille, France, (1971).
51. Timm o.c. and Cocper T.R.; A.I.Ch.E.Journal, (1971), 17, 285. 52. Macklin W.C., and Ryan B.F.; J.Atm.Sci., (1965 ) , 22,452. 53. Macklin W.C., and Ryan B.F.; Phil.Mag., (1966), 1~ 847. 54. Pruppacher H.R.; J.Glaciology (1967), il• 651. --55. Hallett J.; J .Atm.Sci. (1964), 21, 671. 56. Arakawa K.; J.Fac.Sci., Hokkaido-univ., Japan, (1954), Ser.II
4. 311. 57 . Fernandez R., and Barduhn A.J.; Oesalination, (1967), 3, 330. 58. Farrar J., and Hamilton W.S.; Res.Oev.Rept., no.l27, Office of
Saline Water, U.S.Oept. of the Interior, Washington (1964). 59. Huige N.J.J., and Thijssen H.A.C.; Proceedings Symp.Industrial
Crystallization, Inst.Chem.Engrs., Londen, (1969), 69. 60. Kawasaki S., and Umano S.; Rept.Govt.Chem.Ind., Res.Inst.Tokyo,
(1962), 57, 485 . 61. TurnbullD.; J.Appl.Phys., (1950), 21, 1022. 62. Fletc her N.H.; J.Chem.Phys., (1959), 30, 1473. 63. Hardy S.C., and Coriell S.R.; J.Crystal Growth (1970), 7, 147. 64. Ketcham W.M.; Ooctoral Thesis, University of Washington~ (1968 ) . 65. Hillig W.B., and Turnbull 0.; J.Chem.Phys., (1956), 24, 914. 66. Frank F.C., Burton W.K., and Cabrera N.; Phil.Trans.Royal Soc.
Londen, (1951), 243, 40. 67. Hillig W.B.; Growth and perfection of crysta~ s, eds. ooremus R.H.
Roberts B.W . , and Turnbull o.; Wiley, New York, (1958), 350. 68. Volroer M. and Marder M. ; Z.Phys.Chem. (1931), A 154, 97. 69. Kaischew R., and Stranski I.N.; Z.Phys.Chem. (1934), A 170, 295. 70. Hillig W.B.: in Kinet ic s of high temperature processes-,-
Kingery W.O. ed, Wiley, New York, (1959) ,127. 71 . Frenkel J.; Phys.Z.Sovjet Union, (1932), 1, 498. 72. Wilsen H.A.; Phil.Mag., (1900), ~. 238.-
137
73. Cahn W.B.; Acta Met., (1960), 8, 554. 74. Michaels A.S., Brian P.L.T., and Sperry P.R.; J.Appl . Phys.,
(1966) t 371 4649 • 75. Sperry P-:-R.; Doctoral Thesis, M.I.T., ·(1965). 76. Ketcham W.M.; J.Crystal Growth, (i969) 1:!, 113. 77. Walton J.H., and Judd R.C.; J.Phys.Chem., (1914), 18, 722. 78. Tarnrnann G., and BÜchner A.; Z.für Anorg. und allgeffi:Chem.,
(1935) 1 222, 12, 79. Kost W. ;---z:-für Electrochem., (1953), 57, 431. 80. Pruppacher H.R.; Z.für Naturforschung~(l967), 22a, 895. 81. Yang L.C., and Good W.B.; J.Geogr.Res., (1966), 71, 2465. 82. Lindenmeyer C.S.,; Orrok G.T., Jackson K.A., and Chalmers B.;
J.Chem.Phys., (1957), 46, 822. 83. Lindenmeyer C.S., and-chalmers B.; J.Chem.Phys., (1966), !2,
280'7. 84. Pruppacher H.R.; J.Chem.Phys., (1967), 47, 1807. 85. Pruppacher H.R.; J.Coll. and Interf.Sci., (1967), 25, 285. 86. Ryan B.F., and Macklin W.C.; J.Crystal Growth, (1968), ~, 337. 87. Ryan B.F.; J.Crystal Growth, (1969), 5, 284. 88. Macklin W.C., and Ryan B.F.; Phil.Mag~, (1968), 17, 83. 89. Bolling G.F., and Tiller W.A.; J.Appl.Phys., (1961), 32, 2587. 90. Ivantsov G.P.; G~ow th of c~ysta~ s , N. N.Sheftal ed., Consultants
Bureau, New York, (1968), 6a, 12. 91. Horvay G., and Cahn J.W.; Acta Met., (1961), 2, 695. 92. Temkin D.E.; Dokla dy Akad.Nauk., S.S.S.R., (1960), 132, 609. 93. Tr ividi R.; Scripta Met., (1969), 3, 631. --94. Buckley H.E.; Cr>ysta~ G~owth , Wfley, New York, (1958), 30 4. 95. Strickland-Constable R.F.; Proceedings A.I.Ch.E.Symp.on Nucle
ation Phenomena in Growing Crystal Systems, Denver,(l970). 96. Sears G.W.; in: G~owth an d Pe~fe c tion o f C~ysta ~s , eds. Doremus
R.H., Roberts B.W., and Turnbull D.; Wiley, New York, (1958), 441.
97. Keey R.B., and Glen J.B.; Can.J.Chem.Fng., (1964), 42, 227. 98. Sc hwartzberg H.G., and Treybal R.E.; Ind.Eng.Chem.Fund., (1968),
7' l. 99. ÏÜnze J.O.; Tu~bu ~ence, Mc .Graw llill, New York, (1959).
100. de Graauw J.; Doctoral Thesis, Delft Technica! University, The Netherlands, (1968).
101. Barker J.J., and Treybal R.E.; A.I.Ch.E.Journal, (196 0) , 6, 289. 102. Sykes P., and Gomezplata A.; Can.J.Chem. Eng·., (1967), _12,-189. 103. Harriott P.; A.I.Ch.E.Journal, (1962), 8, 93. 104. Rushton J.H., Costich E.W., and Everett-H.J.~ Chem.Eng.Progr.,
(1950) 1 461 3951 467 • 10 5 . Calderbank P.H., a nd Moo-Young M.B.; Chem.Eng.Sci., (1961), l!.
39 . 106. Brian P.L.T., Hales H.B . , and Sherwood T.K.; A.I.Ch.E . Journal,
(1969), 15. 727. 107. Levich V~.; Physicoche mi cal Hyd~odynamics, Prentice Hall, (1962) 108. Middleman S.; A.I.Ch.E.Journal, (1965), 11, 750. 109. Huige N.J.J.; report Eindhoven TechnicallUniversity, The Nether
lands , (19 7 0) . 110. Rowe P.N., and K.T.Clax ton, Trans.Ins t.Chem.Engrs., (1965), 43, .
T321. -111. Harr iott P.; appendix 1, document 6958,Arne rican Document ation
Institute, Library of Congress,Washington 25, o.c. 112. Cornish A.R.H.; Trans.Inst.Chem.Engrs., (1965), 43,T332. 113. Sherwin M.B., Shinnar R., and Katz S. ; Chem.Eng~rogr.Symp.Ser.,
(1969), 65, no.95, 59.
138
114. Hu1burt H.M., and Katz S.; Chem.Eng.Sci., (1964), 19, 555. 115. Timm D.C., and Cocper T.R.; A.I.Ch.E.Journa1, (197IT, 17, 285. 116. Bennett R.C.; Chem.Eng.Progr., (1962), 58, 76. 117. Canning T.F.; Chem.Eng.Progr., (1970), 66, 80. 118. Bransom S.H.; Brit.Chem.Eng., (1960), s:-838. 119. Abegg C.F.; Doctoral Thesis, Iowa State Un~versity, (1966). 120. Estrin J., Sauter W.A., and Karshina G.W.; A.I.Ch.E.Journa1,
(1969) 1 15, 289. 121. Abegg C.~, Stevens J.D., and Larson M.A.; A.I.Ch.E.Journa1,
(1968) 1 14, 118. 122. Senden MJM.G.; m.s.thesis, Eindhoven Technica1 University,
The Netherlands, (1971). 123. Canning T.F., and Rando1ph A.D.; A.I.Ch.E.Journal, (1967),
13, 5. 124. Rando1ph A.D.; A.I.Ch.E.Journa1, (1965), 11, 427. 125. Saeman W.C.; A.I.Ch . E.Journa1, (1956), 2,l07. 12 6 . Larson M.A., and Rando1ph A.D.; Chem.Eng.Progr.Symp.Ser.,
(1969), 65, no.95, l. 127. Nauman E:B., and Szabo T.T.; Chem.Eng.Progr.Symp.Ser., (1971),
67, no.llO, 108. 128. Han e.o., and Shinnar R . ; A.I.Ch.E.Journa1, (1968), 14, 612. 129. Skrivanek J., and Nyvlt J.; Coll.Czech.Chem.Comm., (1968), 33,
2799. --130. Nyvlt J., and Skrivanek J.; Co1l.Czech.Chem.Comm., (1964),
29, 10. 131. Robinson J.N., and Roberts J.E.; Can.J.Chem.Eng., (1957),
35, 105. 132. Randolph A.D., Deepak C., and Iskandar M.; A.I.Ch.E.Journal,
(1968) 1 14, 827 • 133. Becker G;w., and Larsen M.A .; Chem.Eng.Progr.Symp.Ser., (1969),
6 5, no. 9 5, 14 . 134. Dankwerts P.V.; Chem.Eng.Sci., (1958), 8, 93. 135. Randolph A.D.; I.E.C.Fund ., (l969), 8, 58. 136. Orcutt J.C.; Desalination (1969), 7~ 75. 137. Nielsen A.E.; Croata Chem.Acta, (1970), 42, 319. 138. Kahlweit M.; Scripta Met.,(1968), l• 251:-139. Kampmann L., and Kah1weit M.; Ber.Bunsengese1lschaft, (1967),
71, 79. 140. Kampmann L., and Kahlweit M.; Ber.Bunsengesellschaft, (1970),
74, 456. 141. WagnerC.; Z.Electrochem., (1961), 65,581. 142. Mi1ler P., and Saeman W.C.; Chem.En~Progr., (1947), 43, 667. 143. Nyvlt J., and Mu1lin J.W.; Chem.Eng.Sci., (1970), 25,l31. 144. Le i S .J., Shinnar R., and Katz S.; A.I.Ch.E.Journa~ (1971),
17, 1 459 . 145. Timm D.C., and Larsen M.A.; A.I.Ch.E.Journal, (1968), 14, 452. 146. Coulson J.M.; Trans.Inst.Chem.Engrs., (1949), 27, 237. 147. Vriens v.A.J., and Lambriehts M.W.; students report, Eindhoven
Technica! University, The Netherlands, (1971). 148. Bierhuizen P.F.P., m.s. thesis, Eindhoven Technica! University,
The Nether1ands, (1971). 149. Pike J.W.; Proceedings Int.Conf.on Desa1ination, Washington D.C.,
(19 66) 1 173. 150. Sherwin M., Shinnar R., and Katz S.; Chem.Eng.Progr.Symp.Ser.,
(1969), 65, no.95, 75. 151. Schneider-G.R., Newton P.R. and Sheehan D.F.; Res.Dev.Rept.no.
408, Office of Saline Water, U.S.Dept.of the Interior, Washington, (1969).
139
152. Bennema P.; private communication, Delft Technica! University. 153. Vorstman M.A.G.; to be published in 1972 in:de Ingenieur. 154. Nievergeld P.G.M.; m.s.thesis, Eindhoven Technica! University,
( 1970) . 155. Novak V., and Rieger F.; Trans.Inst.Chem.Engrs., (1969),47,T 335. 156. Thomas D.G.; A.I.Ch.E.Journa1, (1963),9, 310. --157. Huige N.J.J., and Thijssen H.A.C.; J.-Crystal Growth,
(1972) 1 .!1.1 .ll1 483.
BIOGRAPHICAL NOTICE
Nico Huige was born on January 22, 1942 in Goes, The Netherlands.
Following a secondary education at the H.B.S. in Goes, he began
his studies in the chemica! engineering department at the Technische
Hogeschool in Eindhoven. Graduate work leading to the title of
"scheikundig ingenieur" was performed under the guidance of prof.
dr. K. Rietema. This degree was officially granted in March 1967.
From December 1965 to February 1967 he studied in the chemica!
engineering department at Northwestern University in Evanston,
Illinois. This study led to a master of science degree. Since
March 1967 Mr. Huige has been at the Technische Hogeschool in
Eindhoven as a "wetenschappelijk medewerker" (research assistant)
in the department of "Fysische Technologie'; under the direction
of prof. dr. ir. H.A.C. Thijssen.
140

APPENDIX
Equilibrium data and physiaal aonstants used in the aalaulations
dextrose solutions • viscosity specific d~ff. conc~
diss. solids equil )I specific temp T• weight p \1 heat CP coeff. D
(wt%) (°C) (g cm- 3 ) (poise) 2 -1 . 0 -1 -1 (cm sec ) (erg C g )
0 0 1.000 0.0170 4.17107 3.5610-6 10 -1.10 1.038 0.0236 3.93107 2.8419-6 20 -2.48 1.076 0.0362 3.70107 2.1210-6
30 -4.35 1.114 0.0683 3.48107 1.4910-6 40 -7.00 1.142 0.1500 3.27107 0.9710-6
sucrose solutiona
10 -0.62 1.040 0.0243 3.89107 2.1210-6
20 -1.44 1. 086 0 . 0387 3.64107 1.6610-6
30 -2.62 1.134 0.0710 3.39107 1.2310-6 40 -4.45 1.185 0.1700 3.14107 0.8210-6
tnermaJ.
~~~~Îc~ sec°C)
5.58104
5.33104
5.06i04
4.76104
4.43104
5.22104
4.98104
4.58104
4.25104
gas constant R surface free energy a molecular diameter d specific weight ice mp : heat of fusion óH s:
8.315lo7 erg gmo1- 1oc- 1
20 erg cm-2 3.85 1o-8 cm 0.918 g cm- 3 3.3510 7 erg g-1
e (cm2sec- 3 ) in stirred tank crystallizer: e (nr=15) = 0.42104; e(nr=20)= 10 4; E (nr=27) = 2. 46104; e (cm2sec-3) in ripening tank: E (nr=3) = 104;
• all physical data are given at the freezing point of the solution