Effect of impurities on pentacene island nucleation
16
Published as PRB 77, 205328 (2008) 1 Effect of impurities on pentacene island nucleation By B. R. Conrad, Elba Gomar-Nadal, W. G. Cullen, A. Pimpinelli † , T. L. Einstein, E. D. Williams Physics Department and Materials Research Science and Engineering Center, University of Maryland College Park, MD 20742-4111, USA † Also at LASMEA, UMR 6602 CNRS/Université Blaise Pascal -- Clermont 2,F-63177 Aubière, France Corresponding author: [email protected] Pentacenequinone (PnQ) impurities have been introduced into a pentacene source material in a controlled manner to quantify the relative effects of the impurity content on grain boundary structure and thin film nucleation. Atomic force microscopy (AFM) has been employed to directly characterize films grown using 0.0-7.5% PnQ by weight in the source material. Analysis of the distribution of capture zones areas of submonolayer islands as a function of impurity content shows that for large PnQ content the critical nucleus size for forming a Pn island is smaller than for low PnQ content. This result indicates a favorable energy for formation of Pn-PnQ complexes, which in turn suggests that the primary effect of PnQ on Pn mobility may arise from homogeneous distribution of PnQ defects. Pac Numbers: 68.65.-k, 05.10.Gg, 73.63.-b, 68.35.bm, 68.55.-a
Transcript of Effect of impurities on pentacene island nucleation

Published as PRB 77, 205328 (2008) 1
Effect of impurities on pentacene island nucleation By B. R. Conrad, Elba Gomar-Nadal, W. G. Cullen, A. Pimpinelli†, T. L. Einstein, E. D.
Williams
Physics Department and Materials Research Science and Engineering Center,
University of Maryland
College Park, MD 20742-4111, USA † Also at LASMEA, UMR 6602 CNRS/Université Blaise Pascal -- Clermont 2,F-63177
Aubière, France
Corresponding author: [email protected]
Pentacenequinone (PnQ) impurities have been introduced into a pentacene source
material in a controlled manner to quantify the relative effects of the impurity content on
grain boundary structure and thin film nucleation. Atomic force microscopy (AFM) has
been employed to directly characterize films grown using 0.0-7.5% PnQ by weight in the
source material. Analysis of the distribution of capture zones areas of submonolayer
islands as a function of impurity content shows that for large PnQ content the critical
nucleus size for forming a Pn island is smaller than for low PnQ content. This result
indicates a favorable energy for formation of Pn-PnQ complexes, which in turn suggests
that the primary effect of PnQ on Pn mobility may arise from homogeneous distribution
of PnQ defects.
Pac Numbers: 68.65.-k, 05.10.Gg, 73.63.-b, 68.35.bm, 68.55.-a

Published as PRB 77, 205328 (2008) 2
The study of organic materials, particularly the various roles of morphology and impurity
doping, remains an active subject for device physics, materials design, and applied
statistical mechanics.1-3 Studies of the most promising organic electronic semiconductor,
pentacene (Pn), have shown that its transport properties are sensitively dependent on
crystalline quality4, 5 and thin film preparation: for the work here, observations that low
concentrations of impurities significantly affect film nucleation and growth, electronic
transport, and electronic signal noise are of particular interest 6-9. Extensive studies of the
initial stages of pentacene film growth 3, 10-15 have shown that it follows the classical
picture of nucleation, island growth, aggregation and coalescence that was developed for
the growth of inorganic films.16-20 In later stages of growth, the two-dimensional
domains formed from island coalescence serve as the basis for three-dimensional growth
due to an Ehrlich-Schwoebel energy barrier that slows diffusion from higher to lower
layers of the film 5, 7, 21. Scaling analysis has proven powerful for evaluating island
nucleation and grain boundary formation in such growth systems.17, 19, 20, 22 In particular,
recent investigations using the Wigner surmise, which relates growth processes to
universal aspects of fluctuations, have yielded significant improvements in physical
understanding. 17, 20 We have measured changes in the capture zone distributions for Pn
films grown in the presence of low impurity concentrations, and use the Wigner analysis
to demonstrate that the underlying cause is an impurity-induced decrease in the number
of molecules required to form a critical nucleus.
The experiments were performed by introducing controlled amounts of the chemical
impurity – 6,13-pentacenequinone (PnQ) – into pentacene (Pn). The solid mixtures were
prepared by mechanically mixing under a dry nitrogen atmosphere. A series of films were

Published as PRB 77, 205328 (2008) 3
prepared on highly doped Si (100) wafers with 300nm thermally grown oxide pre-cleaned
using standard procedures7 based on many years of experience in preparing atomically
cleaned Si samples23, 24. The source materials were increased to the deposition
temperature (195ºC) over a 15 minute interval. Deposition was performed at 0.09 Å/s at
10-7 Torr pressure, with the substrate at room temperature. The compositions tested
covered a range of added PnQ from weight percentage +0.0 to 7.5%, equivalent to added
PnQ number fractions ranging from 0.000 to 0.068. The added impurity supplements the
natural impurity level of commercial Pn, which is approximately 0.7% by weight or a
number fraction of 0.006, as determined previously.5, 7 To prepare materials with lower
impurity content, source material was heated to a temperature slightly lower than its
sublimation temperature for at least one hour prior to the thin film deposition. Previous
measurements have shown that this treatment reduces the absolute source PnQ number
fraction to less than 0.001 7 , and yields sample mobilities as high as those obtained with
Pn purified using gradient-sublimed material. The source concentration values used to
quantify our results are the added number fraction plus the natural impurity level. This
represents a readily reproducible quantity, but will not represent the absolute
concentration in the thin film, due to the larger sublimation rate of PnQ than Pn at any
given source temperature. Two film thicknesses were grown, submonolayer and 50 nm
thick, with two different growths for each thickness. The film morphology was
characterized using tapping-mode AFM. The islands in the submonolayer thin-films are
quantified in image processing by setting a height threshold to account for substrate
height distribution. A limit is also placed on the minimum areal island size to account for
image noise. Voronoi polygons (Wigner-Seitz cells) are then calculated from the island

Published as PRB 77, 205328 (2008) 4
nucleation data. For thick films the grain sizes were found by using automated routines
to outline the irregularly shaped grains and measure their areas.
AFM images of a subset of the prepared submonolayer films as a function of the
source number fraction of the PnQ impurity of the source material are shown in Fig 1. As
the impurity content of the source material is increased, the films display PnQ phase-
separation growth, characterized by the appearance of tall islands (that appear as white
areas in the AFM images). Previous studies have shown that these tall islands are
crystalline PnQ.2, 6, 7, 25 Sample AFM images of thick films, displayed in Fig. 2, show that
increasing concentration of PnQ during growth causes an abrupt change for PnQ number
fractions larger than 0.008 in the ultimate grain sizes and local structure of the bulk film.
There is substantial local variation in the shape and sizes of the grains across a sample.
The sizes of the pentacene grains were thus measured as averages over three or more
images for each deposition and, as Fig. 4a and Table I show, both the thick-film average
pentacene grain size and the submonolayer average island size decrease abruptly when
the impurity concentration reaches a number fraction ~0.008 PnQ. For grain size
determination, the tall PnQ growths were excluded. This decrease is concurrent with
large variations in individual grain size as well as the PnQ phase separation shown in Fig.
2. Substantially decreased electrical transport performance begins well before the
observable morphological changes and the region where grain size is decreasing
coincides with a further factor-of-four decrease in the material’s mobility.7 Several
mechanisms by which impurities could be incorporated into the pentacene film and limit
transport have been proposed in the literature, including changes in chemical bonds,
disruption of the crystalline structure within a grain, and impurity accumulation at the
Published as PRB 77, 205328 (2008) 5
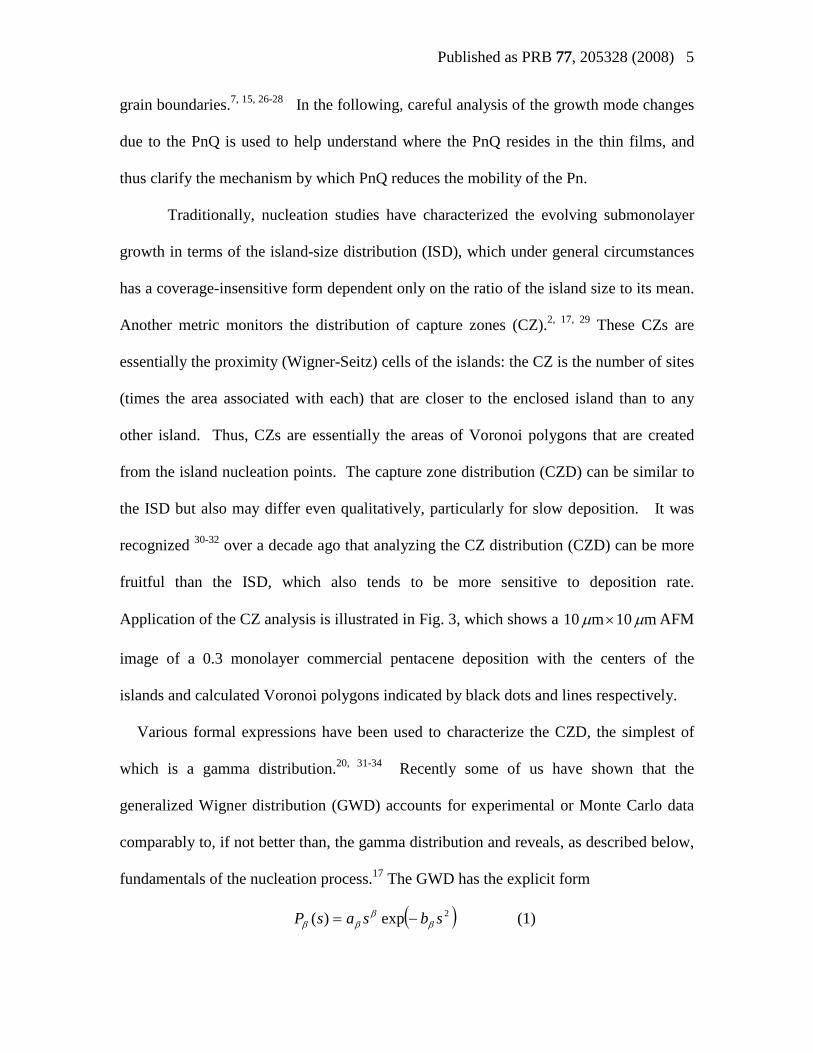
grain boundaries.7, 15, 26-28 In the following, careful analysis of the growth mode changes
due to the PnQ is used to help understand where the PnQ resides in the thin films, and
thus clarify the mechanism by which PnQ reduces the mobility of the Pn.
Traditionally, nucleation studies have characterized the evolving submonolayer
growth in terms of the island-size distribution (ISD), which under general circumstances
has a coverage-insensitive form dependent only on the ratio of the island size to its mean.
Another metric monitors the distribution of capture zones (CZ).2, 17, 29 These CZs are
essentially the proximity (Wigner-Seitz) cells of the islands: the CZ is the number of sites
(times the area associated with each) that are closer to the enclosed island than to any
other island. Thus, CZs are essentially the areas of Voronoi polygons that are created
from the island nucleation points. The capture zone distribution (CZD) can be similar to
the ISD but also may differ even qualitatively, particularly for slow deposition. It was
recognized 30-32 over a decade ago that analyzing the CZ distribution (CZD) can be more
fruitful than the ISD, which also tends to be more sensitive to deposition rate.
Application of the CZ analysis is illustrated in Fig. 3, which shows a m 10 m 10 µµ × AFM
image of a 0.3 monolayer commercial pentacene deposition with the centers of the
islands and calculated Voronoi polygons indicated by black dots and lines respectively.
Various formal expressions have been used to characterize the CZD, the simplest of
which is a gamma distribution.20, 31-34 Recently some of us have shown that the
generalized Wigner distribution (GWD) accounts for experimental or Monte Carlo data
comparably to, if not better than, the gamma distribution and reveals, as described below,
fundamentals of the nucleation process.17 The GWD has the explicit form
( )2exp)( sbsasP ββ
ββ −= (1)

Published as PRB 77, 205328 (2008) 6
where s is the CZ area normalized by the mean CZ area. The exponent β is the only free
parameter, and its value is directly related to the critical nucleus size (see below), while
aβ and bβ are (β-dependent) constants determined by normalization and unit mean,
respectively.35 A representative example of the fit of a CZD by the GWD is shown in
Fig. 4b. The inset of Fig 4b and Table I give the exponent β as a function of the level of
source impurity PnQ content. We find β = 4.97 ± 0.26 for the CZD for number fractions
between 0.008 and 0.052, indicated by the solid line. The CZDs at lower concentrations
of PnQ have exponent β = 6.65 ± 0.26. The width of the distribution36
1)2()1( −+= ββσ b , follows the opposite trend with σ = 0.260 ± 0.004 for 008.0>N
and σ = 0.295 ± 0.007 for 008.0≤N . In contrast, if we fit the ISDs with the GWD, the
average value of β (and the corresponding width of the distribution) is insensitive to
added impurity content, as summarized in Table 1.
In two dimensions the characteristic exponent β = i + 1, where i is the critical
nucleus size (i.e., i + 1 is the number of adspecie particles in the smallest stable island).
The values of the exponent β, therefore indicate a change in the critical nucleus size, from
i ~ 6 when the impurity content is small, to i ~ 4, when the impurity content is large.
In a study of the ISDs of pure Pn films of fractional coverages 0.18 and 0.42, Ruiz
et al. found that the ISD of the two overlayer densities collapsed onto a single scaling
curve in normalized island size. Using Amar and Family's semiempirical expression,19
they showed that the critical nucleus was decidedly larger than a point island or a dimer.
While their distribution was notably noisier than that in our Fig. 4b, their least-squares fit
gave i = 3, to be compared with the value 3.8 ± 0.2 reported in Table 1. The comparison
is as expected, because the values of i predicted by ISDs are consistently lower than those

Published as PRB 77, 205328 (2008) 7
obtained from CZDs. Both Monte Carlo simulations and experiments, especially those on
Pn11, have shown that the CZD is more robust than the ISD. Fig. 3 of Ref. 11 provides a
convincing illustration: The CZD is insensitive to the deposition rate (relative to surface
diffusion); for rapid deposition of Pn the ISD is comparable to the CZD, but for slower
deposition the ISD rises more rapidly to a maximum at smaller normalized size11. When
fit with the GWD, Eq. 1, such behavior corresponds to a smaller value of i.
A plausible explanation for the dependence of critical nucleus size on impurity
content would be the existence of preferential interaction between PnQ and Pn molecules,
allowing small clusters to form with greater stability. This mechanism would be likely to
result in the inclusion of a low density of PnQ within the grains of Pn, providing an
explanation for the strong decrease in mobility observed at very low number density of
PnQ,7 even though the grain boundary distribution has not changed observably. While
models for Pn transport have focused on grain boundary defects and impurities,28, 37, 38
impurities within the grain could also cause gap states and thus charge traps,26, 27 or
generate hole scattering similar to that at grain boundaries.28 Some experimental
evidence suggests that trap states are homogeneously distributed in Pn thin films,39, 40
although no attempt has yet been made to correlate these observations with impurity
content.
The stabilization of the critical nucleus size above a PnQ number density of
~0.008 is consistent with the coexistence of a disordered and crystalline phase of PnQ,
with an equilibrium density in the disordered phase of ~0.008, as previously reported7.
The complete absorption of excess PnQ into the crystalline phase would occur when the
diffusion length of a PnQ molecule is larger than the separation of PnQ islands. This

Published as PRB 77, 205328 (2008) 8
suggests that sequential, rather than mixed, deposition of Pn and PnQ may directly reveal
density-dependent nucleation of islands. Figs. 5a and 5b show a m 20 m 20 µµ × AFM
image and a m 10 m 10 µµ × enlargement, respectively, of the same image of a film grown
by depositing 3.6 Å of PnQ followed by 3.2 Å of Pn. Areas near large PnQ crystallites
contain a lower density of larger Pn islands than locations far away from the large PnQ
crystallites. This suggests that the nucleation of pure PnQ crystallites lowered the local
density of PnQ to the equilibrium density, while areas where PnQ crystallites did not
nucleate were left with a local excess of molecular PnQ, which enhanced the nucleation
of Pn islands. In addition, it is possible that a preferential interaction between Pn and PnQ
would cause Pn near PnQ islands to coat the PnQ crystallites, thus reducing the Pn
density available to form islands. It is not possible to differentiate between these two
possibilities with the stated series of experiments nor are the effects mutually exclusive.
In summary, the morphology of co-deposited submonolayer films has been
analyzed in terms of the capture zone and island size distributions. The distributions are
well described using the generalized Wigner distribution. The greater sensitivity of the
capture zone distribution to growth processes reveals that the critical nucleus size for Pn
island formation decreases for source-PnQ number fractions larger than ~0.006, from i ~
6 (fitting parameter = 5.65 ± 0.25) at lower PnQ density to i ~ 4 (fitting parameter = 3.97
± 0.26), suggesting PnQ enhances the formation of molecular complexes that can serve as
nucleation sites. Increased impurity doping primarily results in continued phase-
separation with diffusion driven differences in nucleation density.
Work at the University of Maryland was supported by NSF-MRSEC Grant DMR
05-20471 and use of MRSEC SEFs, by the LPS and by NIST under contract

Published as PRB 77, 205328 (2008) 9
#70NANB6H6138, with research infrastructure supported by the UMD-CNAM and the
UMD NanoCenter. Visits to Maryland by A.P. were supported by a CNRS Travel Grant,
and T.L.E. was partially supported by DOE CMSN grant DEFG0205ER46227.

Published as PRB 77, 205328 (2008) 10
Figures
Figure 1: (Color online) AFM images ( m 10 m 10 µµ × ) of 0.3 ML Pn/PnQ films on
SiO2 with varying source PnQ number fractions.

Published as PRB 77, 205328 (2008) 11
Figure 2: (Color online) AFM images ( m 10 m 10 µµ × ) of 50 nm Pn/PnQ films on
SiO2 with source materials containing varying PnQ number fractions. Note the varying
grain size and morphology.

Published as PRB 77, 205328 (2008) 12
Figure 3: (Color online) An example ( m 10 m 10 µµ × ) AFM image of commercial Pn.
The island centers and Voronoi polygons are indicated by black dots and lines,
respectively.

Published as PRB 77, 205328 (2008) 13
Figure 4: (Color online) a) Average thick film grain area as a function of the number
fraction of PnQ content of the source material. b) An example of the normalized CZ area
histogram. The solid line is the generalized Wigner surmise distribution fit with β= 5.27
± 0.19. The inset is the capture zone fitting parameter ρ as a function of the number
fraction of PnQ content of the source material.

Published as PRB 77, 205328 (2008) 14
Figure 5: (Color online) a) A ( m 20 m 20 µµ × ) AFM of image of a sample with 3.6Å
PnQ deposition followed by a 3.2Å Pn deposition illustrating larger islands near the large
topological features. b) A ( m 10 m 10 µµ × ) zoom-in of Fig. 5a.
Table 1: The average submonolayer island size in μm2 (AIS), mean capture zone area in
μm2 (MCZ), capture zone distribution Wigner exponent β (CZD-β), the island size
distribution Wigner exponent β (ISD-β), and average thick film grain size in μm2 (AGS)
as a function of the number fraction of PnQ.
PnQ Number Fraction
Average Island Area
(AIS)
Capture Zone Area
(MCZ)
Capture Zone
Exponent -β
Island Area
Exponent -β
Average Grain Area
(AGS) 0.000 0.12±0.06 0.36±0.11 6.8±0.4 3.8±0.2 1.2±0.4 0.006 0.12±0.04 0.30±0.08 6.5±0.4 4.4±0.3 1.2±0.5 0.008 0.12±0.04 0.31±0.09 5.2±0.3 3.6±0.2 1.4±0.5 0.011 0.036±0.016 0.13±0.04 5.3±0.2 3.9±0.2 0.29±0.11 0.018 0.065±0.022 0.22±0.06 4.9±0.2 3.9±0.2 0.29±0.12 0.041 0.068±0.026 0.26±0.08 4.6±0.4 4.1±0.4 0.17±0.07 0.052 0.083±0.029 0.30±0.09 4.9±0.4 4.2±0.4 0.10±0.05

Published as PRB 77, 205328 (2008) 15
References
1 R. Ruiz, D. Choudhary, B. Nickel, et al., Chemistry of Materials 16, 4497 (2004). 2 D. L. Gonzalez and G. Tellez, Physical Review E 76, 011126 (2007). 3 R. Ruiz, B. Nickel, N. Koch, et al., Physical Review Letters 91, 136102(1 (2003). 4 J. Pflaum, J. Niemax, and A. K. Tripathi, Chemical Physics 325, 152 (2006). 5 O. D. Jurchescu, J. Baas, and T. T. M. Palstra, Applied Physics Letters 84, 3061
(2004). 6 I. Salzmann, S. Duhm, R. Opitz, et al., Applied Physics Letters 91, 051919
(2007). 7 E. Gomar-Nadal, B. R. Conrad, W. G. Cullen, et al., Journal of Physical
Chemistry C In Press doi:10.1021/jp711622z (2008). 8 B. R. Conrad, W. Yan, W. G. Cullen, et al., Applied Physics Letters 91, 242110
(2007). 9 A. C. Mayer, A. Kazimirov, and G. G. Malliaras, Physical Review Letters 97,
105503 (2006). 10 R. Ruiz, B. Nickel, N. Koch, et al., Physical Review B 67, 125406(1 (2003). 11 S. Pratontep, M. Brinkmann, F. Nüesch, et al., Physical Review B 69, 165201(1
(2004). 12 M. Brinkmann, S. Pratontep, and C. Contal, Surface Science 600, 4712 (2006). 13 A. C. Mayer, R. Ruiz, H. Zhou, et al., Physical Review B 73, 205307 (2006). 14 J. T. Sadowski, G. Sazaki, S. Nishikata, et al., Physical Review Letters 98,
046104(1 (2007). 15 S. Verlaak, C. Rolin, and P. Heremans, Journal of Physical Chemistry B 111, 139
(2007). 16 J. A. Venables, G. D. T. Spiller, and M. Hanbucken, Reports on Progress in
Physics 47, 339 (1984). 17 A. Pimpinelli and T. L. Einstein, Physical Review Letters 99, 226102 (2007). 18 J. A. Venables, Surface Science 299/300, 798 (1994). 19 J. G. Amar and F. Family, Physical Review Letters 74, 2066 (1995). 20 F. Arciprete, E. Placidi, V. Sessi, et al., Applied Physics Letters 89, 041904
(2006). 21 A. C. Mayer, R. Ruiz, H. Zhou, et al., Physical Review B 73, 205307(1 (2006). 22 J. W. Evans, P. A. Thiel, and M. C. Bartelt, Surface Science Reports 61, 1 (2006). 23 V. Tsai, X. S. Wang, E. D. Williams, et al., Applied Physics Letters 71, 1495
(1997). 24 K. Thurmer, D. J. Liu, E. D. Williams, et al., Physical Review Letters 83, 5531
(1999). 25 P. Parisse, S. Picozzi, and L. Ottaviano, Organic Electronics 8, 498 (2007). 26 J. E. Northrup and M. L. Chabinyc, Physical Review B 68, 041202 (2003). 27 L. Tsetseris and S. T. Pantelides, Physical Review B 75, 153202 (2007). 28 S. Verlaak and P. Heremans, Physical Review B 75, 115127 (2007). 29 A. Pimpinelli, H. Gebremariam, and T. L. Einstein, Physical Review Letters 95,
246101 (2005). 30 J. A. Blackman and P. A. Mulheran, Physical Review B 54, 11681 (1996). 31 P. A. Mulheran and J. A. Blackman, Physical Review B 53, 10261 (1996).

Published as PRB 77, 205328 (2008) 16
32 P. A. Mulheran and J. A. Blackman, Philosophical Magazine Letters 72, 55 (1995).
33 M. Brinkmann, S. Graff, and F. Biscarini, Physical Review B 66, 165430 (2002). 34 M. Brinkmann, F. Biscarini, C. Taliani, et al., Physical Review B 61, 16339
(2000). 35 M. Giesen and T. L. Einstein, Surface Science 449, 191 (2000). 36 T. L. Einstein and O. Pierre-Louis, Surface Science 424, L299 (1999). 37 R. A. Street, D. Knipp, and A. R. Völkel, Applied Physics Letters 80, 1658
(2002). 38 S. Verlaak, V. Arkhipov, and P. Heremans, Applied Physics Letters 82, 745
(2003). 39 E. M. Muller and J. A. Marohn, Advanced Materials 17, 1410 (2005). 40 W. L. Kalb, F. Meier, K. Mattenberger, et al., Physical Review B 76, 184112
(2007).