Novel N, C doped Ti(IV)-oxides as Pt-free catalysts for the O2 reduction reaction
43
This is the author’s version of a work that was accepted for publication in Electrochimica Acta Changes resulting from the publishing process, such as peer review, editing, corrections, structural formatting, and other quality control mechanisms, may not be reflected in this document. Changes may have been made to this work since it was submitted for publication. A definitive version was subsequently published in: Electrochimica Acta 146, pages 335-345, 11/2014 DOI: 10.1016/j.electacta.2014.08.056 url: http://www.sciencedirect.com/science/article/pii/S001346861401679X
Transcript of Novel N, C doped Ti(IV)-oxides as Pt-free catalysts for the O2 reduction reaction

This is the author’s version of a work that was accepted for publication in Electrochimica Acta
Changes resulting from the publishing process, such as peer review, editing, corrections, structural
formatting, and other quality control mechanisms, may not be reflected in this document. Changes
may have been made to this work since it was submitted for publication. A definitive version was
subsequently published in:
Electrochimica Acta 146, pages 335-345, 11/2014
DOI: 10.1016/j.electacta.2014.08.056
url: http://www.sciencedirect.com/science/article/pii/S001346861401679X

2
Novel N, C doped Ti(IV)-oxides as Pt-free catalysts for the O2
reduction reaction
C. Gebauera, J. Fischer
a, M. Wassner
b, T. Diemant
a, J. Bansmann
a, N. Hüsing
b
and R.J. Behma *
a: Institute of Surface Chemistry and Catalysis, Ulm University, D-89069 Ulm, Germany
b: Materials Chemistry, Salzburg University, A-5020 Salzburg, Austria
*Author to whom correspondence should be addressed: [email protected]

3
Abstract
The potential of novel, carbon and nitrogen doped Ti-oxides for application as Pt-free catalyst
for the oxygen reduction reaction (ORR) in polymer electrolyte fuel cell cathodes was sys-
tematically investigated in model studies under well defined reaction conditions. Ti oxide was
prepared by a sol-gel process; doping of titania with N and C was performed via reactive
incorporation during the sol-gel processing and the subsequent calcination step, using the
Ti-alkoxide precursor and urea, which is added during the sol-gel synthesis, as carbon source
and urea also as nitrogen source. Optimizing the chemical composition of the catalyst was
performed by varying the calcination temperature or the amount of urea. Characterization of
the resulting material by X-ray photoelectron spectroscopy (XPS) identified Ti–O–C, Ti–O–N
and O–Ti–N building blocks, providing clear evidence for the incorporation of N and C into
the TiOx lattice; the concentrations of the species depend on the calcination temperature and
on the amount of urea added. Doping with nitrogen was found to significantly improve the
ORR performance compared to non-doped TiOx, with the extent depending on the calcination
temperature and the N : Ti ratio. Correlations between ORR activity and the lattice
composition and crystallinity are discussed. Finally, the activity for oxidation / reduction of
the ORR intermediate hydrogen peroxide was tested, yielding similar trends but less
pronounced effects than obtained for the ORR.
Keywords: Electrocatalysis; O2 reduction; doped oxide, titania; XPS
Resubmitted to Electrochim. Acta: 06.08.2014
* Author to whom correspondence should be addressed, email: [email protected]

4
1. Introduction
Improving the performance and lowering the costs of catalysts for the oxygen reduction
reaction (ORR) compared to state-of-the-art catalysts is one of the biggest tasks in fuel cell
electrocatalysis research. In addition to improving the performance of Pt based catalysts [1],
strategies for developing completely Pt-free catalysts have been pursued as well. A number of
different groups of catalytically active materials were studied in detail. The first one includes
different carbon based materials such as carbon nanotubes (CNT) [2,3], graphitic [4] as well
as graphene [5-7] related materials which are mostly modified by incorporation of metal and
non-metal dopants. A second group consists of metal complexes involving macromolecular
ligands such as porphyrines and phthalocyanines coordinating group 8 and group 9 (Fe, Co)
metal centers [8-10]. In a third approach, transition metal oxides such as TiO2, ZrO2, HfO2,
Nb2O5 and Ta2O5 were investigated, in particular by Ota and coworkers, who had
systematically studied the ORR activity of massive metal oxide based electrodes, which were
prepared by sputtering or thermal oxidation, either of pure oxides [11-13] or doped metal
oxides [14-17]. More recently, also highly dispersed metal oxide based materials have been
investigated as fuel cell cathode catalysts [18,19]. It should be noted that these materials are
attractive also as support material for Pt catalysts because of their corrosion stability in
oxygen containing environments, in particular when comparing with the easily oxidizable
carbon based materials [20]. Although these alternative materials show promising ORR
characteristics, their performance is still well below that of standard Pt/C catalysts. This is
particularly true for the metal oxide based materials, where in addition to the catalytic activity
also the electric conductivity requires improvement.
The promising results obtained so far on metal oxide based electrode materials caused us to
start a systematic study, which aims at the development of novel metal oxide based materials
for the ORR in fuel cell cathode applications, either as catalytically active material itself (‘Pt-

5
free catalyst’) or as support material for highly active supported Pt catalysts (‘Pt-poor
catalyst’). In the present contribution we report on the ORR performance of a series of carbon
and nitrogen doped TiOx materials and its relation to specific features in the chemical
composition of these materials, following earlier reports by Doi et al. [21], Ishihara et al. [14]
and Chisaka et al. [17] who proposed oxynitride species as catalytically active for the ORR.
First results of this study on the use of these materials as support material for Pt catalysts have
been published recently [22].
The TiOx materials were prepared via an aqueous sol-gel route based on the approach by
Chen et al. [23]. Carbon and nitrogen doping can at least in principle be achieved by different
routes. It can be incorporated by reactive magnetron sputtering at elevated temperatures, using
N2 as pure nitrogen source [14,21]. Applying this to the present TiOx samples, the high
temperatures required for the sputtering process would lead to a transformation in the crystal
structure and to a thermally induced loss of the co-dopant carbon. Similar problems apply for
doping by heat treatment with gaseous ammonia [24,25]. Looking for lower reaction
temperatures, nitrogen can be incorporated by reaction of the oxide in ammonia solution
[25,26], by reaction with urea [27-29] or by using an organic N-source such as triethylamine
(TEA) [30,31]. Using urea as nitrogen and carbon source, the sol-gel process is followed by a
subsequent calcination step in order to decompose the N source molecule and incorporate the
nitrogen into the TiOx lattice. Here the reaction conditions are milder than in the above cases.
If an alkoxide Ti-precursor and urea are used during the synthesis, no additional carbon
source is necessary [32], although both were described as not being sufficiently efficient for
the carbon incorporation. This lack of carbon can be compensated by using tetra-butyl
ammonium hydroxide (TBAH) [23] as an additional C source.
In this work, we present results of a detailed study on the influence of the calcination
temperature during the subsequent calcination step and of the initial composition on the ORR

6
activity, focusing on the chemical composition of the samples and the incorporation of
nitrogen and carbon into the titania network. We used urea as nitrogen source during the sol-
gel synthesis and no additional carbon source in addition to the Ti-alkoxide precursor.
Subsequent calcination results in different thermal decomposition products of urea [33] and
various N- and C-containing TiOx species, which together with the respective temperature
ranges for formation and decomposition were evaluated by simultaneous thermal analysis
(combined thermogravimetric (TGA) and differential thermal (DTA) analysis) [34,35] and by
detailed X-ray photoelectron spectroscopy (XPS) measurements in the relevant element
regions. Changes in the crystallinity, which was only partially formed at the used calcination
temperatures of the samples were checked by X-ray diffraction (XRD), the focus of the
present paper lies, however, on the influence of the chemical composition.
In addition to the ORR activity, we also evaluated the activity of these materials for the
reductive or oxidative decomposition of H2O2, considering the possibility of H2O2 formation
in the ORR and the destructive effects of H2O2 on the stability of membrane and electrode
[36,37]. This is of interest for application of these materials as catalytically active supports for
Pt-based catalysts, which are known to produce small amounts of H2O2 at high overpotentials
[38].
In the following we will, after a brief description of the synthesis procedures and the
experimental methods, first present the results of the STA and XPS characterization of the
carbon and nitrogen doped TiOx materials obtained by this synthesis approach (sections 3.1,
3.2). Subsequently we evaluate the electrocatalytic activity of these materials for the oxygen
reduction reaction and relate this to the nitrogen and carbon containing groups present in the
doped materials (section 3.3). Finally, we evaluate the activity of these materials for the
reduction and oxidation of H2O2 (section 3.4)

7
2. Experimental
2.1. Synthesis
For the synthesis of N, C co-doped titania we used the well known method of incorporating N
via the decomposition of urea (OC(NH2)2). More precisely, we followed the approach of
Chen et al. [23], but used titanium n-butoxide (Ti(O(CH2)3CH3)4) both as Ti-precursor and as
C containing reagent rather than adding tetrabutyl ammonium hydroxide as external carbon
source as done in ref. [23]. Briefly, urea (9.0 g, Sigma Aldrich) was dissolved in water
(Millipore MilliQ, 18.2 MΩ cm, 100 ml, 0.15 M) and the Ti-precursor (13.1 g = 0.04 M,
Sigma Aldrich, molar ratio M(Ti) : M(N) = 2 : 15) was added dropwise under vigorous
stirring. After continuous stirring over night (ca. 12 h) and aging of the gel (24 h), the
synthesis product (TiO2-(x+y)NxCy) was dried at 80°C for 12 h.
For the calcination procedure, an aliquot of the resulting white powder was placed into a
porcelain crucible and put into a muffle furnace, which was heated up (0.5°C min-1
) from
room temperature to the desired temperature (175, 200, 225, 250, 300, 350 and 400°C) under
a N2 atmosphere, kept at this temperature for 3 h and then cooled down slowly. For each
annealing / XPS measurement we used a fresh oxide sample. The same synthesis and
calcination procedures were applied for the two other N : Ti molar ratios (5:2, 30:2),
modifying the amount of urea.
2.2. Simultaneous thermal analysis (STA)
The thermogravimetric analysis of the uncalcined synthesis product was performed in a
Netzsch STA 449 F3 system under Ar in the temperature window from 25 to 1000°C (heating
rate 10°C min-1
), simultaneously monitoring the mass loss (TGA) and the heat release
(differential thermoanalysis - DTA).
2.3. XPS characterization

8
The XPS measurements were performed with a Physical Electronics PHI 5800 Multi ESCA
System, using monochromatized Al-Kα radiation (1486.6 eV). All spectra were obtained at an
electron emission angle of 45°, the angle of the incoming X-rays (with respect to the surface
normal) was also 45°. The pass energy was set to 93.90 eV (29.35 eV) for survey (detail)
spectra, respectively. In order to compensate for charging effects, the sample was neutralized
with electrons from a flood gun (currents between 3 µA and 20 µA).
The binding energies of the XPS signals were calibrated by using the C(1s) signal at 284.8 eV
as internal reference. The XPS samples were prepared via pipetting a catalyst dispersion on a
clean Si wafer and subsequent drying to fabricate a thin catalyst film. This film consisted of
the same amount of catalyst material on the same geometric area as used for the thin film
electrode preparation (see next section). The Si wafer was pre-treated by sequential cleaning
in MilliQ water, in concentrated potassium hydroxide solution and in concentrated sulfuric
acid. By using a Si wafer instead of the commonly used carbon tape as substrate for the
powder we avoided the interference of this carbon signal with the C1s signal of the C-dopant.
Depending on the perfection of the film layer preparation, the underlying Si substrate (with a
thin SiO2 overlayer on top) was visible in the XP spectra. For the calculation of the atom
concentrations, the intensity in the O(1s) signal was corrected by subtraction of the SiO2
contribution.
The deconvolution of the XPS peaks was performed using a commercial software (CasaXPS),
employing a Shirley background subtraction and Gaussian / Lorentzian symmetric line
profiles for all the species.
2.4. Electrode preparation and electrochemical measurements:
The electrode was prepared by pipetting an aqueous suspension of the synthesized material
(20 µl of a 2 mg ml-1
suspension) onto a mirror polished glassy carbon (GC) disc (Sigradur G

9
from Hochtemperatur Werkstoffe, d = 6 mm) and subsequent drying under a N2 stream.
Afterwards, the electrode film was covered with the same amount of a diluted aqueous Nafion
solution (Sigma Aldrich, perfluorinated ion-exchange resin, 10 wt.% dispersion in water) and
dried again. The resulting Nafion film is sufficiently stable to keep the catalyst layer on the
glassy carbon substrate under rotation in the electrolyte, but thin enough to avoid additional
diffusion limitations [39]. The geometric area of the electrochemically accessible part of the
electrode is 0.28 cm2. The experiments were performed in a rotating disk electrode (RDE)
setup, with the electrode film on the GC disc as working electrode, a Pt wire as counter
electrode and a saturated calomel electrode (SCE) as reference electrode. In the following, all
potentials will be quoted versus that of a reversible hydrogen electrode (RHE). The potential
was controlled by a bi-potentiostat (Pine Instruments AFRDE5). The supporting electrolyte,
0.5 M H2SO4 (Merck suprapur, Millipore MilliQ, 18.2 mΩ cm), was bubbled with N2 gas
(5N, Westfalen Gas) during the whole experiment. Cyclic voltammetry measurements in base
electrolyte (BCV) were performed at a scan rate of 10 mV s-1
in the potential range of 0.06 V
to 1.2 V. The potentiodynamic electrocatalytic measurements in O2 saturated (MTI Gase,
N 6.0) supporting electrolyte were performed at 10 mV s-1
scan rate at a rotation rate of
1600 rpm. The electrooxidation and -reduction of peroxide was investigated in N2 saturated
0.5 M H2SO4 solution upon addition of 300 µl of 35% H2O2 solution (AppliChem, pure)
under similar conditions as described before (10 mV s-1
, 1600 rpm, same potential window).
This low amount of peroxide did not change the electrolyte pH, which would result in an
additional shift of the onset potential [40].
3. Results and Discussion
3.1. Nitrogen doping of TiOx
Nitrogen was incorporated into the titania network by reaction of TiOx with gaseous
ammonia, which was formed during the thermal decomposition of urea, and the subsequent

10
formation of cyanuric acid and ammelide. Since NH3 is formed at different reaction steps, the
optimal temperature(s) for the subsequent calcination steps had to be determined first. This
was carried out by thermogravimetric analysis (TGA) and especially by differential thermal
analysis (DTA). DTA measurements of the uncalcined synthesis product (Figure 1) showed
several distinct endothermic steps which are related to the corresponding weight losses in the
TGA response.
In the DTA signal (dashed red line), two endothermic processes (1) and (2) occur at ca. 150°C
and ca. 220°C, where the first one is attributed to the decomposition of urea to isocyanic acid
and the formation of biuret (Figure 2 a) at 150°C. The 220°C signal is related to the formation
of cyanuric acid and ammelide (Figure 2 b). Both steps are accompanied by the release of
NH3, as had been demonstrated earlier [34,35]. Step (3) in Figure 1 (360 to 510°C) is related
to the decomposition and polymerization of cyanuric acid and ammelide. This is followed by
the decomposition of these species above 550°C, which is reflected by the steep increase (4)
in the DTA and the continuous loss of mass in the TGA [33-35]. The release of NH3 gas is
more obvious in the gravimetric signal (black line), where the mass loss is most pronounced
at steps (1) and (2), with a Δm of about 45%. An additional weight loss between 300 and
500°C (20%) supports the idea of a further release of ammonia during the oligomerization and
polymerization process. The same is true for the last significant decrease in the TG signal by
10% above 550°C when the oligo- / polymeric products decompose. Overall, the
thermogravimetric and DTA measurements fully support the dissociation of urea into the
NH3, which acts as direct N source for the incorporation of nitrogen into the titania network in
a temperature range of 175°C to 400°C.
3.2. XPS characterization
The presence of carbon and nitrogen species in the sample (initial Ti : N ratio: M(Ti) : M(N)
= 2 : 15), more specific in the surface near regions of the modified TiOx samples, and their

11
incorporation into the titania network after different calcination temperatures were quantified
using XPS. Survey spectra (not shown) reveal the presence of C, O, N and Ti as main
components. Figure 3 shows the development of the surface concentrations of these four
elements in the respective samples after calcination to different temperatures. The oxygen
content increases from ~43 at.% after drying in air (12 h) at 80°C to ~53 at.% after calcination
at 225°C and then stays almost constant for the higher annealing temperatures. The total
amount of carbon-containing species on the sample surfaces (25 - 30%) as well as the content
of Ti-related species (15 – 20 at.%) seems to be nearly independent of the calcination
temperature, apart of a small increase when going from non-annealed material (dried at 80°C)
to the calcined samples.
Finally, the nitrogen content in the samples shows a strong decrease with increasing
calcination temperature; above 80°C the nitrogen content in the sample drops from about
18 at.% (at 80°C) to only 3 – 4 at.% in the temperature regime up to 300°C. For even higher
calcination temperatures, we observe a further decrease to a value of about 1%. The trend to
smaller nitrogen contents in the samples observed after annealing to higher temperature fits
perfectly to the findings and conclusions of the thermal analysis presented before, where the
weight loss during annealing of the samples, which occurred mainly in two temperature
regions around 175 - 200°C and above 300°C was associated with the release of gaseous
ammonia [34,35].
In a next step, we inspect the detail spectra in the C(1s) and N(1s) region to gain more insight
into the appearance and disappearance of certain carbon- and nitrogen-containing species
which are relevant for the decomposition process of urea and the incorporation of these
species into the titania lattice. A similar evaluation of the detail spectra of the O(1s) and
Ti(2p) peaks, which is less important for the understanding of this process, is given in the
supplementary data (Fig.A.1, A.2).

12
3.2.1 C(1s) region
Figure 4 shows the detail XP spectra of the C(1s) region from the uncalcined material (80°C)
and from samples annealed to various temperatures from 175 to 400°C (temperatures given in
the figure), where each annealing step was performed on a fresh sample. For comparison, we
added the result of a measurement on a TiO2 sample, which was prepared in a similar way as
the N-doped materials, but without addition of urea and applying a final annealing step to
500°C. These spectra were deconvoluted using five individual components representing
carbon atoms in different chemical environments. The C(1s) region is dominated by a
pronounced peak component at 284.8 eV, which is attributed to carbon atoms in hydrocarbon
species (C–H and/or C–C bonded) [41,42]. This component was also used for calibrating the
binding energy (BEs) scale, and thus to correct for sample charging. The validity of this
calibration was cross-checked by comparison with the BE of the Ti(2p3/2) peak, which for all
samples appeared at 458.7 eV, except for the uncalcined material, where due to the
incomplete decomposition of the Ti alkoxide precursor after drying at 80°C a double peak
structure is observed with peaks at 458.7 and 460.5 eV. The Ti(2p3/2) BE of the calcined
materials is in excellent agreement to previous findings for various TiO2 samples, where a
“mean value” of 458.7 eV was reported [43].
The next peak appears at 286.1 eV, a binding energy which is characteristic for C atoms with
a single bond to an oxygen atom (C–O) [42]. In the non-annealed sample (dried at 80°C), this
component is attributed to the C atom attached to the oxygen atom of the alkoxide chain of
the Ti-precursor. Upon annealing to temperatures above 175°C, this peak is exclusively
assigned to C atoms, which are inserted into the TiO2 lattice, since the alkoxide (see above),
here butanolate, starts to evaporate at 118°C. Thus, in the annealed samples this peak can be
used as indicator for the incorporation of the carbon species into TiO2. The component at
287.3 eV is attributed to the carbon atom in an isocyanate species (N–C=O) [42], which is

13
formed as a side product in the decomposition of urea and can react further to biuret at
elevated temperatures (Figure 2). Finally, the signals at 288.9 eV and 290.5 eV are attributed
to adsorbed CO2 and carbonate species, respectively, where both species originate from CO2
adsorbed from air.
The evolution of the concentrations of these species with increasing annealing temperature is
shown in Figure 5. For the non-annealed sample (80°C), the CO2,ad and carbonate species
amount to ~41% of the C(1s) intensity, the hydrocarbon (C-H) component contributes ~30%,
the C–O species 23%, and the isocyanate species 6%. For the annealed samples, the picture
changes dramatically. The contribution of the C–H peak increases more and more, growing
first to ~60% for annealing temperatures between 200 and 300°C, and then to almost 90% for
surfaces annealed to higher temperatures. At the same time, the fraction of the CO2,ad
component decreases significantly, e.g., to only slightly more than half of the initial content
when going from the non-annealed sample to the one obtained after calcination at 175°C. In
the temperature regime between 200 and 300°C the component stays more or less constant,
and finally for even higher annealing temperatures it decreases again steeply. The relative
amount of the C–O component (Ti-O-C) remains almost constant after annealing to 175°C (at
28%), and decreases after annealing to temperatures between 200 and 300°C, reaching values
between 15 and 20%. Also for this component, heating to 350 or 400°C results in a
significantly lower peak intensity with less than half of the amount present after annealing to
300°C, to about 6%. At the same time, the isocyanate component, which has a stable
contribution of ~7% up to 300°C, vanishes completely, indicating that no further carbon or
nitrogen is incorporated into the titania surface (for nitrogen incorporation see also next
section). This is in good agreement with the TGA data (Figure 1) and the reaction scheme
(Figure 2), if at temperatures above 400°C further loss of mass results only from the

14
polymerization of the urea decomposition products cyanuric acid and ammelide, and not from
loss of carbon and nitrogen dopants.
3.2.2 N(1s) region
Detail XP spectra of the N(1s) region of the uncalcined material and of the C, N-doped TiO2
samples after annealing to increasing temperature are displayed in Figure 6. Again, the
topmost spectrum was recorded on a pure titania sample. The spectra of the uncalcined
sample can be fitted by two peaks at 399.9 and 401.4 eV, respectively. The component at
lower BE (399.9 eV), which comprises ~55% of the intensity of the N(1s) signal, is attributed
to nitrogen atoms in the N-donor urea and its decomposition/condensation products [44] like,
e.g., biuret and isocyanate. These are subsumed in the following as the N–C=O component
[45], although [46] this peak most probably also includes (small) contributions from Nad
atoms which are formed by dissociative adsorption of N2 molecules from air (see below). The
peak at higher BE (with ~45% of the N(1s) intensity for the uncalcined sample) is tentatively
assigned to nitrogen atoms of protonated NH2 groups of urea [47,48], while free ammonium
has a higher BE (see next paragraph). For the annealed samples, the main peak (N–C=O),
which was assigned to urea and its decomposition and further reaction products isocyanic
acid, biuret and ammelide, is again located at 399.9 eV. The peak of the ammonium
component, now resulting from liberated NH4+ formed from NH3 in acidic environment,
appears at 402.8 eV. Additionally, a third component is detected between these two peaks at
401.3 eV, which is tentatively attributed to an oxynitride compound (such as a Ti–O–N
species) [49]. This nitrogen-containing species reflects the incorporation of nitrogen into the
TiO2 lattice [49]. After annealing at 300°C, the peak attributed to ammonia (at 402.8 eV) has
vanished. For even higher annealing temperatures, 350 and 400°C, a new signal appears with
low intensity at a BE of ~398.2 eV . This species is assigned to an O–Ti–N species [29],
where the N atom is directly bound to the Ti atom as a result of the reaction of NH3 at these

15
elevated temperatures. The total nitrogen concentration has dropped to below 1%. The
remaining peak is most probably not related to the initial addition of urea, since a similar peak
is also observed for a TiO2 powder, which was synthesized without addition of any nitrogen
source. We tentatively attribute this contribution to Nad atoms, which are formed by
dissociative adsorption of N2 molecules from air during the synthesis of the material or during
its storage under air. It may be noted that a similar N(1s) peak is also found in the detail
spectra of commercially available P25 titania powder (not shown for sake of brevity).
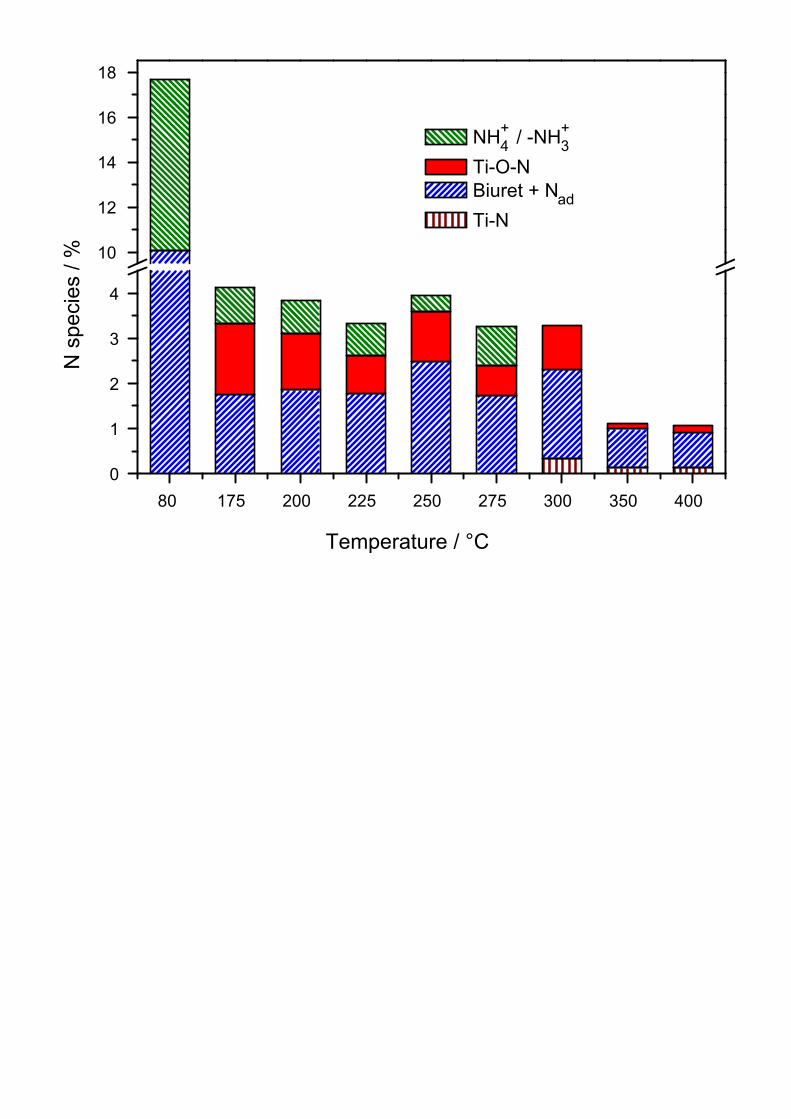
The evolution of the atomic concentrations of the different N species in the surface region is
displayed in detail in Figure 7. As already discussed with Figure 3, the total N concentration
decreases in two steps, the first one occurring upon calcination at 175°C and the second, less
pronounced one upon calcination at above 300°C. These steps reflect the decomposition /
condensation of urea and the final decomposition of its condensation products, respectively.
Both processes involve the release of ammonia from the material. This is also reflected by the
development of the components of the N(1s) peak, which shows for the 175°C calcined
material a steep decrease of the intensity of the ammonium peak to only a quarter of the value
before calcination. Annealing at temperatures above 300°C leads to complete loss of the
ammonium related peak. The Ti–O–N N(1s) peak at 401.3 eV remains stable at ~1 at.% for
the samples with annealing temperatures between 175 and 250°C. Its intensity is lower for
samples annealed at higher temperatures; the concentration of the related component is
~0.5 at.% after annealing at 275 and 300°C and <0.1 at.% after even higher calcination
temperatures, which directly reflects the decrease of the degree of N doping with temperature.
Finally, the samples calcined at temperatures of 350 and 400°C additionally show a small
peak component at a lower binding energy of ~398.2 eV, which is attributed to direct bonding
of N to the Ti atoms in the lattice (see above). The concentration of this species is, however,
with ~0.1 at.% similarly low as that of the remaining Ti–O–N species at these temperatures.

16
Doubling the amount of urea added in the synthesis and subsequent calcination to 250°C leads
to an almost six times higher content of the total N(1s) signal in the surface. The contribution
of the desired Ti–O–N species at 401.3 eV is increased by a factor of two compared to the
discussed sample above.
In combination, the XPS findings from the C1s and N1s regions indicate that i) incorporation
of carbon and nitrogen into the TiOx lattice, as evidenced by the presence of Ti–O–C and
Ti-O–N species, requires annealing temperatures of at least 200°C, that ii) these processes are
most efficient for calcination at 250 – 300°C, and that iii) for higher temperatures the
concentration of these species is increasingly lower again, and they are essentially absent for
calcination at temperatures of 350°C and above.
3.3 Electrocatalytic reduction of molecular oxygen
Prior to the measurements in O2-saturated electrolyte, the thin film electrodes of the different
titania based materials were characterized electrochemically in N2-saturated base electrolyte
(Supplementary data: Fig.A.3). The resulting cyclic voltammograms also provide the
background current which has to be subtracted from the current response during the oxygen
reduction reaction (ORR) (Figure 8, ring-disc measurement in supplementary data Fig.A.4).
The background subtracted and geometric surface area normalized ORR current traces are
shown in figure 8, the onset behavior of the reaction is illustrated on a larger scale in the inset.
Obviously, both, the oxygen reduction current density in the potential range of 0.20 to 0.40 V
and the onset potential (| j(O2)-j(N2) | > 1.0 µA cm-2
) for the ORR vary with the applied
calcination temperature. The modified TiOx shows an improved ORR activity, compared to
pure TiO2 (dots). A closer look at the calcination temperature dependence indicates an
optimum pre-treatment temperature of 250°C for TiO(2-x+y)NxCy. Here, the oxygen reduction
onset is located at about 0.60 V, equivalent to a decrease in overpotential by 0.40 V compared

17
to pure titania and by 0.09 V with respect to the uncalcined or the 200°C calcined TiO2-
(x+y)NxCy samples, respectively. Higher calcination temperatures of 300 or 400°C do not
improve the activity any further, as evident from the almost similar onset potentials. The same
trend is reflected in the current density at 0.4 V, which is three times higher for the 250°C
calcined TiO2-(x+y)NxCy sample than for the uncalcined and the 200°C calcined TiO2-(x+y)NxCy
samples, respectively and double as high as obtained for the samples calcined at 300 or
400°C. The resulting current densities (at 0.4 V) are rather similar to the ones determined in
the work of the Ota group for TaOxNy as well as for ZrOxNy [11,14,17,21]. The onset
potential was even improved by almost 0.05 V compared to the latter materials, since those
authors defined this as the potential where the absolute current density reached a value larger
than 0.1 µA cm-2
.
From the XPS analysis (Figures 4 / 5 and 6 / 7), the different catalysts can be categorized into
three groups based on the dominant nitrogen species they are containing in addition to the
N–C=O species with a N(1s) signal at 399.9 eV. The first group, where nitrogen and carbon
are mainly present as NH4+ species and bound to oxygen atoms (N–C=O and C=O),
respectively, includes the uncalcined and the 200°C calcined sample. These materials are
characterized by ORR activities close to those of the TiO2 electrode. A second group,
consisting of the samples calcined at 300 or 400°C, is characterized by small amounts of
Ti–O–N and Ti–N, whereas the Ti–O–C group has already disappeared. The ORR activity of
this group is slightly higher than that of the previous one. The third group is represented by
the TiO2-(x+y)NxCy_250 material, where the same nitrogen containing group is present as after
calcination at 200°C, but in a two times higher amount, and also the Ti–O–C group is still
present. This material exhibits the highest current density (-3.8 µA cm-2
) at 0.4 V and the
most positive ORR onset potential (0.60 V). Based on this classification, we tentatively
propose that an improved ORR activity originates from the incorporation of nitrogen and
18
carbon into the titania network in the specific forms of Ti–O–N and Ti–O–C, respectively.
The interaction of the modified TiOx with molecular oxygen and the subsequent dissociation
can be tentatively explained by the presence of specific defect sites created by the
incorporation of nitrogen in the titania surface region, similar to proposals of other groups for
the ORR on modified transition metal oxides [14,17,21,50]. Non-modified oxidic model
surfaces can also be active when surface defects are generated in a sufficient amount. It is
well known from UHV studies on TiO2 single crystal surfaces that surface defects promote
the adsorption and dissociation of O2 [51-54]. Surface defects are generated by preparation
methods such as sputtering [11,12] or annealing of a Ti metal sample in an O2 atmosphere
[13]. Both procedures results in higher current densities for pure titania than obtained in the
present work. Considering that the 500°C calcined TiO2 sample still contains a significant
number of defects, there must be other factor limiting the ORR activity of this sample.
Although N modification caused a clear improvement of the ORR activity compared to TiO2,
the ORR performance is not comparable to that of the commonly used carbon supported Pt
catalysts or of massive Pt electrodes, which exhibit onset potentials of around 1.0 V [38]. The
lower activity of the metal oxide catalyst can be related to two effects, i) to the lack of
sufficiently active surface sites required for dissociative adsorption of oxygen, and ii) to the
low conductivity of the semiconducting titania based materials. The latter results in an
apparent broadening of the kinetic region of the ORR current trace. This is in fact observed
for the present materials, which do not reach the mass transport controlled current region in
the applied potential range while for Pt electrodes this is reached at approximately 0.70 V. In
principle it is possible to improve the conductivity by mixing the oxide material with carbon
[16,55]. This reduces, however, the high corrosion stability of these materials, which is one of
the main advantages of titania and other transition metal oxides compared to carbon.
Therefore, this route appears to be little attractive.
19
The ORR activity can also be improved by using higher amounts of urea, which results in
different N to Ti ratios (Figure 9, ring-disc measurement in supplementary data Fig.A.5). This
is demonstrated by a series of oxynitrides that were prepared using different urea : Ti-
precursor ratios. Since the previous ORR measurements (Figure 8) had shown that the highest
ORR activity was obtained at a calcination temperature of about 250°C, we applied the same
calcination conditions. The blue curve in Figure 9 represents the current response of TiO2-
(x+y)NxCy_250°C which had already been shown in Figure 8, with the same N : Ti ratio (of 15
: 2). A lower N : Ti ratio of 5 : 2 causes a decrease of the ORR activity, reflected by a
decrease of the current density at 0.40 V to -2.1 µA cm-2
(compared to -3.8 µA cm-2
for the 15
: 2 sample) and a down-shift of the onset potential to 0.49 V (compared to 0.60 V). A further
lowering of the nitrogen content to a 1 : 1 (N : Ti) ratio leads to a further decrease of the
ORR activity, reaching essentially the behavior of pure TiO2 (not shown). In contrast,
increasing the initial N : Ti ratio to 30 : 2 results in a significant increase in ORR activity, as
evidenced by a doubling of the current density at 0.40 V compared to that of the reference
sample (15 : 2) and a significant up-shift of the onset potential to 0.75 V. Also in this case,
however, only low current densities are obtained and the mass transport controlled region was
not reached in the present potential range.
The data seem to indicate that even higher N contents would be beneficial. Because of the
limited solubility of urea, however, a further increase of the N amount significantly above the
highest N : Ti ratio of 30 : 2 is not possible via this synthesis route. Although about 1 g ml-1
urea can be dissolved in water, the addition of the Ti-precursor causes precipitation of urea
during the sol gel synthesis. Therefore, a further increase of the N : Ti ratio is possible only by
other procedures such as the thermal reaction of the oxide with gaseous ammonia [24,25,56]
or the addition of ammonia solution during the oxide synthesis [26,57].

20
In total, these data clearly indicate that the incorporation of C and in particular of N into the
TiOx surface lattice, as evidenced by the presence of Ti–O–C and Ti–O–N species in the XPS
data, leads to a significant improvement of the ORR activity.
3.4. Hydrogen peroxide oxidation / reduction
In addition to the overall ORR activity we also evaluated the activity of the TiO2-(x+y)NxCy
materials for H2O2 reduction, which is of interest to decrease the amount of H2O2 that may
have been formed via the non-dissociative 2 electron pathway during the ORR. This could
also indicate whether these materials would be suitable Pt supports with an additional
catalytic activity for H2O2 removal. Figure 10 displays the hydrogen peroxide reduction /
oxidation current densities after subtraction of the voltammetric response in the supporting
electrolyte saturated with nitrogen.
In the positive-going potential direction the beginning of peroxide oxidation to O2 is indicated
by the anodic current density, which starts at a potential of about 0.80 V and then increases
continuously. Comparing the oxynitride samples calcined at different temperature, the activity
for H2O2 oxidation does not show the same trend with calcination temperature as observed
during the ORR (see Figure 8). First of all, pure TiO2 is electrocatalytically active, which was
not the case for the ORR. Here it should be noted that it is well known that titania
decomposes H2O2, which can be formed during water photolysis, via dehydrogenation under
O2 production [58,59]. Obviously, this reaction also can occur without the UV-light induced
photoexcitation in a pure electrocatalytic reaction.
Similar differences between ORR and the H2O2 oxidation activity are observed also for the N,
C doped Ti-based materials. For the uncalcined as well as the 200°C calcined sample the O2
formation from H2O2 is very low. Considering the low surface area of these materials, with

21
7 m2 g
-1 compared to 24 m
2 g
-1 for the more active pure TiO2, we tentatively attribute their
lower H2O2 oxidation activity to their much lower surface area.
Going to materials exposed to higher calcination temperatures, the highest activity is again
obtained for the material calcined at 250°C, similar to our findings for the ORR. But this time,
the TiO2-(x+y)NxCy_300 electrode shows almost the same behavior. In a simple picture one
may explain this discrepancy by a lower impact of the N,C doping and the related formation
of surface defects, assuming that this is less important for H2O2 oxidation, which does not
require O-O bond breaking, than for O2 reduction, where the latter step is necessary. In that
case, the similar surface area of the two samples, TiO2-(x+y)NxCy_250°C and
TiO2-(x+y)NxCy_300°C, results in similar H2O2 oxidation activities, while the lower doping
level of the TiO2- (x+y)NxCy_300°C electrode results in a lower ORR activity compared to the
TiO2-(x+y)NxCy_250°C sample.
Similar trends as described above for the positive-going scan are found also in the negative-
going scan for the reduction of peroxide, which involves an O–O dissociation step. This is
better visible in a magnified view in Figure 10b. The H2O2 reduction current densities are
much smaller than the oxidation current densities. Obviously, the activity of the TiOx
materials for H2O2 reduction is much lower than that for H2O2 oxidation. This can again be
explained by the lower activity for O-O bond breaking of these materials, which is required
for H2O2 reduction but not for its oxidation. Moreover, O2 produced via H2O2 oxidation at
potentials above 0.85 V may interact with the same reactive sites on these TiOx based
catalysts as hydrogen peroxide. The reduction of O2 may be responsible for the additional
increase of the cathodic current density at around 0.35 V for pure TiO2 and at 0.45 V for TiO2-
(x+y)NxCy_250°C and _300°C showed in the magnified presentation in Figure 10b. In that
case, the current plateau reached at potentials <0.25 V could be caused by transport
limitations in the ORR due to the low O2 bulk concentration.

22
We evaluated the influence of the N-doping level also for the electrocatalytic reaction of H2O2
(Figure 11). We again relate the small differences in peroxide oxidation currents (positive-
going potential direction) between the low N : Ti molar ratio material (5 : 2) and the pure
titania mainly to the higher specific surface area of TiO2, which causes an increased oxygen
evolution. Following the above interpretation, for the H2O2 reduction one would expect
counteracting effects of the lower surface area and the higher defect density (doping level) for
the N, C doped TiOx samples, which results in a similar current density for the
TiO(2-x+y)NyCy_15:2 and the pure TiO2 sample (Figure 11b).
For the catalysts with higher N contents, we find an increase in current density compared to
that obtained on TiO2 for both the oxidation and the reduction reaction. The effect is more
pronounced for the reduction than the oxidation reaction, but in both cases significantly less
than obtained for the ORR. This resembles the findings for the effects caused by the
calcination temperature (see Figure 10), where the effects were also much lower than for the
ORR, but larger for the H2O2 reduction than for the H2O2 oxidation reaction. This supports
the interpretation given above according to which the closer similarity between H2O2
reduction and the ORR compared to H2O2 oxidation and ORR is due to the O–O bond
breaking required in both reduction reactions, whereas for H2O2 oxidation this is not required
and the reaction is more facile and less affected by the surface defect density.
In total, the results obtained for the H2O2 reduction show similar trends as obtained for the
ORR, which is attributed to the fact that both reactions involve O–O bond breaking where the
density of surface defects and hence the extent of (near surface) doping plays an important
role. For H2O2 oxidation, in contrast, the surface area seems to play a more important role
than in the previous cases, which we attribute to a more facile H2O2 oxidation, where surface
defects are not necessarily required for the reaction to proceed. Finally, an additional cathodic
current signal at potentials < 0.40 V is attributed to the reduction of O2, which has been

23
formed as product from the H2O2 oxidation at high potentials (above 0.8 V) in the preceding
positive-going scan and which even under rotation is not fully removed from the porous TiOx
film electcrodes.
4. Conclusions
In summary, we have explored the potential of chemically and structurally well defined N,C
doped titania materials, which were prepared via a sol-gel synthesis in an aqueous urea
solution, as Pt-free catalysts for the oxygen reduction reaction. The catalyst performance was
optimized by varying the temperature of the calcination process required for the thermal
decomposition of urea between 200°C and 400°C and the initial N : Ti molar ratio.
Based on STA and XPS analysis, three different temperature ranges could be distinguished. In
the first one (up to 175°C) decomposition products of urea were formed under release of NH3,
which acts as reactive species for nitrogen doping. XPS analysis of the various calcined
materials confirmed the presence of nitrogen- as well as of carbon containing species, the
latter developed from the titanium alkoxide precursor. In this range of calcination
temperatures we find NH4+ and adsorbed CO2 signals, in addition to the dominant N(1s) and
C(1s) signals of adsorbed N and biuret (399.9 eV) and of hydrocarbons (284.8 eV),
respectively. Incorporation of N and C into the TiOx lattice is just starting at an annealing
temperature of about 175°C. In the second range, for calcination temperatures up to 250°C
and 300°C, where the urea decomposition is complete and the decomposition products are
further oligomerized under liberation of NH3, the two features in the N(1s) and C(1s) regions
attributed to Ti–O–N groups (N(1s)) and Ti–O–C groups (C(1s)) become more pronounced,
whereas the concentrations of the NH4+ and CO2,ad species become increasingly lower. In the
third range, for even higher calcination temperatures, the intensities of the Ti–O–N groups
(N(1s)) and Ti–O–C groups (C(1s)) get increasingly lower again. At the upper calcination

24
limit (400°C), these signals are almost completely absent, <1 at.% and <0.2 at.% for the
related C(1s) and N(1s) signals, respectively. In this range, the formation of a direct O–Ti–N
bond is indicated by a N(1s) signal at 398.2 eV. Finally, raising the amount of urea leads to an
increase of the Ti–O–N content roughly by the same factor as the increase in urea.
The electroreduction of oxygen, as indicated by the onset potential and by the current density
at 0.4 V, showed an increasing activity with increasing calcination temperature up to 250°C,
whereas higher temperatures caused the activity to decrease again. The higher activity was
attributed to the presence of the Ti–O–N and Ti–O–C groups. A similar trend was observed
for the reductive or oxidative removal of H2O2, which is an undesired reaction intermediate in
the oxygen reduction reaction. Increasing the molar N : Ti ratio by increasing the amount of
urea up to the dissolution limit further improved the ORR activity.
Overall, C,N-doping led to a significant improvement in the ORR activity compared to pure
TiO2, making this a promising approach. Nevertheless, the performance of the modified
titanium oxide is still far from that of state-of-the-art Pt-based ORR catalysts. Systematic
optimization of the doping strategies and the defect structure of the materials is expected to
result in further improvement.
Acknowledgement
This work was supported by the Ministry of Science, Research and the Arts of the State of
Baden-Württemberg through the “MINT” program and the Daimler AG as well as by the
Deutsche Forschungsgemeinschaft (Be 1201/18-2) and the FWF Wissenschaftsfond (I 1259 –
N28). The authors are grateful to D. Mannes (Institute of Inorganic Chemistry II, Ulm
University) for thermogravimetric analysis.
Appendix A. Supplementary data

25
References
[1] H.A. Gasteiger and N.M. Markovic, Just a dream--or future reality?, Science, 324
(2009) 48-49.
[2] J.D. Wiggins-Camacho and K.J. Stevenson, Mechanistic discussion of the oxygen
reduction reaction at nitrogen-doped carbon nanotubes, J. Phys. Chem. C, 115 (2011)
20002-20010.
[3] C. Venkateswara Rao and Y. Ishikawa, Activity, selectivity, and anion-exchange
membrane fuel cell performance of virtually metal-free nitrogen-doped carbon nanotube
electrodes for oxygen reduction reaction, J. Phys. Chem. C, 116 (2012) 4340-4346.
[4] H. Tominaga, W. Ikeda, and M. Nagai, The active site structure of nitrided and
oxynitrided graphite as a cathode catalyst in a fuel cell, Phys. Chem. Chem. Phys., 13
(2011) 2659-2662.
[5] H.R. Byon, J. Suntivich, and Y. Shao-Horn, Graphene-based non-noble-metal catalysts
for oxygen reduction reaction in acid, Chem. Mater., 23 (2011) 3421-3428.
[6] L. Zhang and Z. Xia, Mechanisms of oxygen reduction reaction on nitrogen-doped
graphene for fuel cells, J. Phys. Chem. C, 115 (2011) 11170-11176.
[7] J. Liang, Y. Jiao, M. Jaroniec, and S.Z. Qiao, Sulfur and nitrogen dual-doped
mesoporous graphene electrocatalyst for oxygen reduction with synergistically
enhanced performance, Angew. Chem., 124 (2012) 11664-11668.
[8] J.M. Ziegelbauer, T.S. Olson, S. Pylypenko, F. Alamgir, C. Jaye, P. Atanassov, and S.
Mukerjee, Direct spectroscopic observation of the structural origin of peroxide
generation from Co-based pyrolyzed porphyrins for ORR applications, J. Phys. Chem.
C, 112 (2008) 8839-8849.
[9] A. Morozan, S. Campidelli, A. Filoramo, B. Jousselme, and S. Palacin, Catalytic
activity of cobalt and iron phthalocyanines or porphyrins supported on different carbon
nanotubes towards oxygen reduction reaction, Carbon, 49 (2011) 4839-4847.
[10] S. Sun, N. Jiang, and D. Xia, Density functional theory study of the oxygen reduction
reaction on metalloporphyrins and metallophthalocyanines, J. Phys. Chem. C, 115
(2011) 9511-9517.

26
[11] Y. Liu, A. Ishihara, S. Mitsushima, N. Kamiya, and K. Ota, Zirconium oxide for PEFC
cathodes, Electrochem. Solid-State Lett., 8 (2005) A400-A402.
[12] Y. Liu, A. Ishihara, S. Mitsushima, N. Kamiya, and K. Ota, Transition metal oxides as
DMFC cathodes without platinum, J. Electrochem. Soc., 154 (2007) B664-B669.
[13] J.H. Kim, A. Ishihara, S. Mitsushima, N. Kamiya, and K. Ota, Catalytic activity of
titanium oxide for oxygen reduction reaction as a non-platinum catalyst for PEFC,
Electrochim. Acta, 52 (2007) 2492-2497.
[14] A. Ishihara, S. Doi, S. Mitsushima, and K. Ota, Tantalum (oxy)nitrides prepared using
reactive sputtering for new nonplatinum cathodes of polymer electrolyte fuel cell,
Electrochim. Acta, 53 (2008) 5442-5450.
[15] A. Ishihara, M. Tamura, K. Matsuzawa, S. Mitsushima, and K. Ota, Tantalum oxide-
based compounds as new non-noble cathodes for polymer electrolyte fuel cell,
Electrochim. Acta, 55 (2010) 7581-7589.
[16] Y. Ohgi, A. Ishihara, K. Matsuzawa, S. Mitsushima, K.i. Ota, M. Matsumoto, and H.
Imai, Oxygen reduction reaction on tantalum oxide-based catalysts prepared from TaC
and TaN, Electrochim. Acta, 68 (2012) 192-197.
[17] M. Chisaka, A. Ishihara, K. Suito, K.i. Ota, and H. Muramoto, Oxygen reduction
reaction activity of nitrogen-doped titanium oxide in acid media, Electrochim. Acta, 88
(2013) 697-707.
[18] R. Ohnishi, Y. Takahashi, A. Takagaki, J. Kubota, and K. Domen, Niobium oxides as
cathode electrocatalysts for platinum-free polymer electrolyte fuel cells, Chem. Lett., 37
(2008) 838-839.
[19] J. Seo, D. Cha, K. Takanabe, J. Kubota, and K. Domen, Highly-dispersed Ta-oxide
catalysts prepared by electrodeposition in a non-aqueous plating bath for polymer
electrolyte fuel cell cathodes, Chem. Commun., 48 (2012) 9074-9076.
[20] K.H. Kangasniemi, D.A. Condit, and T.D. Jarvi, Characterization of Vulcan
electrochemically oxidized under simulated PEM fuel cell conditions, J. Electrochem.
Soc., 151 (2004) E125-E132.
[21] S. Doi, A. Ishihara, S. Mitsushima, N. Kamiya, and K. Ota, Zirconium-based
compounds for cathode of polymer electrolyte fuel cell, J. Electrochem. Soc, 154 (2007)
B362-B369.

27
[22] C. Gebauer, Z. Jusys, M. Wassner, N. Hüsing, and R.J. Behm, Membrane fuel cell
cathode catalysts based on titanium oxide supported platinum nanoparticles,
ChemPhysChem, (2014) online available, DOI: 10.1002/cphc.201402019.
[23] D. Chen, Z. Jiang, J. Geng, Q. Wang, and D. Yang, Carbon and nitrogen co-doped TiO2
with enhanced visible-light photocatalytic activity, Ind. Eng. Chem. Res., 46 (2007)
2741-2746.
[24] H. Irie, Y. Watanabe, and K. Hashimoto, Nitrogen-concentration dependence on
photocatalytic activity of TiO2-xNx powders, J. Phys. Chem. B, 107 (2003) 5483-5486.
[25] R. Nakamura, T. Tanaka, and Y. Nakato, Mechanism for visible light responses in
anodic photocurrents at N-Doped TiO2 film electrodes, J. Phys. Chem. B, 108 (2004)
10617-10620.
[26] C.L. Bianchi, G. Cappelletti, S. Ardizzone, S. Gialanella, A. Naldoni, C. Oliva, and C.
Pirola, N-doped TiO2 from TiCl3 for photodegradation of air pollutants, Catal. Today,
144 (2009) 31-36.
[27] P.S. Yap, T.T. Lim, M. Lim, and M. Srinivasan, Synthesis and characterization of
nitrogen-doped TiO2/AC composite for the adsorption-photocatalytic degradation of
aqueous bisphenol-A using solar light, Catal. Today, 151 (2010) 8-13.
[28] G.B. Soares, B. Bravin, C.M.P. Vaz, and C. Ribeiro, Facile synthesis of N-doped TiO2
nanoparticles by a modified polymeric precursor method and its photocatalytic
properties, Appl. Catal. B, 106 (2011) 287-294.
[29] D. Mitoraj and H. Kisch, The nature of nitrogen-modified titanium dioxide
photocatalysts active in visible light, Angew. Chem. Int. Ed., 47 (2008) 9975-9978.
[30] C. Burda, Y. Lou, X. Chen, A.C.S. Samia, J. Stout, and J.L. Gole, Enhanced nitrogen
doping in TiO2 nanoparticles, Nano Lett., 3 (2003) 1049-1051.
[31] F. Spadavecchia, G. Cappelletti, S. Ardizzone, C.L. Bianchi, S. Cappelli, C. Oliva, P.
Scardi, M. Leoni, and P. ermo, Solar photoactivity of nano-N-TiO2 from tertiary amine:
role of defects and paramagnetic species, Appl. Catal. B, 96 (2010) 314-322.
[32] Y. Park, W. Kim, H. Park, T. Tachikawa, T. Majima, and W. Choi, Carbon-doped TiO2
photocatalyst synthesized without using an external carbon precursor and the visible
light activity, Appl. Catal. B, 91 (2009) 355-361.

28
[33] H.L. Fang and H.F.M. DaCosta, Urea thermolysis and NOx reduction with and without
SCR catalysts, Appl. Catal. B, 46 (2003) 17-34.
[34] P.M. Schaber, J. Colson, S. Higgins, D. Thielen, B. Anspach, and J. Brauer, Thermal
decomposition (pyrolysis) of urea in an open reaction vessel, Thermochim. Acta, 424
(2004) 131-142.
[35] L. Stradella and M. Argentero, A study of the thermal decomposition of urea, of related
compounds and thiourea using DSC and TG-EGA, Thermochim. Acta, 219 (1993) 315-
323.
[36] K. Hongsirikarn, X. Mo, J. Goodwin, and S. Creager, Effect of H2O2 on Nafion®
properties and conductivity at fuel cell conditions, J. Power Sources, 196 (2011) 3060-
3072.
[37] V.O. Mittal, H.R. Kunz, and J.M. Fenton, Membrane degradation mechanisms in
PEMFCs, J. Electrochem. Soc., 154 (2007) B652-B656.
[38] U.A. Paulus, T.J. Schmidt, H.A. Gasteiger, and R.J. Behm, Oxygen reduction on a high-
surface area Pt/Vulcan carbon catalyst: a thin-film rotating ring-disk electrode study, J.
Electroanal. Chem., 495 (2001) 134-145.
[39] T.J. Schmidt, H.A. Gasteiger, G.D. Stäb, P.M. Urban, D.M. Kolb, and R.J. Behm,
Characterization of high-surface area electrocatalysts using a rotating disk electrode
configuration, J. Electrochem. Soc., 145 (1998) 2354-2358.
[40] P. Westbroek and E. Temmerman, Mechanism of hydrogen peroxide oxidation reaction
at a glassycarbon electrode in alkaline solution, J. Electroanal. Chem., 482 (1999) 40-
47.
[41] B.J. Bachman and M.J. Vasile, Ion bombardment of polyimide films, J.Vac. Sci.
Technol. A, 7 (1989) 2709-2716.
[42] D. Briggs and J.T. Grant, Surface analysis by Auger and X-ray photoelectron
spectroscopy, I.M Publications and Surface Spectra Ltd., 2003.
[43] U. Diebold, The surface science of titanium dioxide, Surf. Sci. Rept., 48 (2003) 53-229.
[44] T.H. Lee and J.W. Rabalais, X-ray photoelectron spectra and electronic structure of
some diamine compounds, J. Electron. Spectrosc. Relat. Phenom., 11 (1977) 123-127.
29
[45] D.N. Hendrickson, J.M. Hollander, and W.L. Jolly, Nitrogen ls electron binding
energies. Correlations with molecular orbital calculated nitrogen charges, Inorg. Chem.,
8 (1969) 2642-2647.
[46] T. Yoshida, K. Yamasaki, and S. Sawada, An X-ray photoelectron spectroscopic study
of biuret metal complexes, Bull. Chem. Soc. Jpn., 51 (1978) 1561-1562.
[47] J.S. Stevens, S.J. Byard, C.C. Seaton, G. Sadiq, R.J. Davey, and S.L.M. Schroeder,
Crystallography aided by atomic core-level binding energies: proton transfer versus
hydrogen bonding in organic crystal structures, Angew. Chem., 123 (2011) 10090-
10092.
[48] J.S. Stevens, S.J. Byard, C.C. Seaton, G. Sadiq, R.J. Davey, and S.L.M. Schroeder,
Proton transfer and hydrogen bonding in the organic solid state: a combined
XRD/XPS/ssNMR study of 17 organic acid-base complexes, Phys. Chem. Chem. Phys.,
16 (2014) 1150-1160.
[49] J.A. Rengifo-Herrera, K. Pierzchała, A. Sienkiewicz, L. Forró, J. Kiwi, J.E. Moser, and
C. Pulgarin, Synthesis, characterization, and photocatalytic activities of nanoparticulate
N, S-Codoped TiO2 having different surface-to-volume ratios, J. Phys. Chem. C, 114
(2010) 2717-2723.
[50] A. Ishihara, K. Lee, S. Doi, S. Mitsushima, N. Kamiya, M. Hara, K. Domen, K. Fukuda,
and K. Ota, Tantalum oxynitride for a novel cathode of PEFC, Electrochem. Solid-State
Lett., 8 (2005) A201-A203.
[51] S. Wendt, R. Schaub, J. Matthiesen, E.K. Vestergaard, E. Wahlström, M.D. Rasmussen,
P. Thostrup, L.M. Molina, E. Laegsgaard, I. Stensgaard, B. Hammer, and F.
Besenbacher, Oxygen vacancies on TiO2(110) and their interaction with H2O and O2: a
combined high-resolution STM and DFT study, Surf. Sci., 598 (2005) 226-245.
[52] Y. Du, N.A. Deskins, Z. Zhang, Z. Dohnalek, M. Dupuis, and I. Lyubinetsky, Formation
of O adatom pairs and charge transfer upon O2 dissociation on reduced TiO2(110), Phys.
Chem. Chem. Phys., 12 (2010) 6337-6344.
[53] Z.T. Wang, Y. Du, Z. Dohnálek, and I. Lyubinetsky, Direct observation of site-specific
molecular chemisorption of O2 on TiO2(110), J. Phys. Chem. Lett., 1 (2010) 3524-3529.
[54] Z.T. Wang, N. Aaron Deskins, and I. Lyubinetsky, Direct imaging of site-specific
photocatalytical reactions of O2 on TiO2(110), J. Phys. Chem. Lett., 3 (2011) 102-106.

30
[55] M. Chisaka, Y. Suzuki, T. Iijima, and Y. Sakurai, Effect of synthesis route on oxygen
reduction reaction activity of carbon-supported hafnium oxynitride in acid media, J.
Phys. Chem. C, 115 (2011) 20610-20617.
[56] H. Irie, S. Washizuka, N. Yoshino, and K. Hashimoto, Visible-light induced hydro-
philiccity on nitrogen-substituted titanium dioxide films, Chem. Commun., (2003) 1298-
1299.
[57] X. Cheng, X. Yu, and Z. Xing, Enhanced photoelectric property and visible activity of
nitrogen doped TiO2 synthesized from different nitrogen dopants, Appl. Surf. Sci., 268
(2013) 204-208.
[58] J. Yi, C. Bahrini, C. Schoemaecker, C. Fittschen, and W. Choi, Photocatalytic decom-
position of H2O2 on different TiO2 surfaces along with the concurrent generation of HO2
radicals monitored using cavity ring down spectroscopy, J. Phys. Chem. C, 116 (2012)
10090-10097.
[59] C.M. Lousada, A.J. Johansson, T. Brinck, and M. Jonsson, Mechanism of H2O2
decomposition on transition metal oxide surfaces, J. Phys. Chem. C, 116 (2012) 9533-
9543.

31
Figure Captions
Figure 1 Gravimetric (black line) and differential thermal analysis of uncalcined
TiO2-(x+y)NxCy (dashed red line) (initial molar ratio M(N) : M(Ti) = 15 : 2, heating
rate 10°C min-1
, going from 20 to 1000°C under Ar).
Figure 2 Reaction scheme describing a) the thermal decomposition of urea to biuret and b)
the further reaction of urea to cyanuric acid and of cyanuric acid to ammelide,
respectively, under release of NH3 and H2O.
Figure 3 Surface composition of N,C-doped TiO2 samples (initial molar ratio M(N) : M(Ti)
= 15 : 2) after calcination at different temperatures as deduced from XPS
measurements. The fractions of carbon, nitrogen, oxygen and titanium in the
surface region were determined from the peak areas of the C(1s), N(1s), O(1s), and
Ti(2p) signals, respectively.
Figure 4 Detail XP spectra (black symbols) of the C(1s) region of the N,C-doped TiO2
samples after drying at 80°C (initial molar ratio M(N) : M(Ti) = 15 : 2, uncalcined
sample) or after calcination to different temperatures as indicated in the figure. For
comparison we show, in the topmost part, a spectrum of a similarly prepared TiO2
sample (without urea addition). Thin colored lines indicate the fitted contributions
from individual components (see text).
Figure 5: Contribution of the different carbon-containing species to the total atom
concentration in the surface region.
Figure 6: Detail XP spectra (black symbols) of the N(1s) region of the N,C-doped TiO2
samples after drying at 80°C (initial molar ratio M(N) : M(Ti) = 15 : 2, uncalcined
sample) or after calcination at different temperatures. For comparison we show a
spectrum of a similarly prepared TiO2 sample (without urea addition) in the
topmost part. Thin colored lines indicate the fitted contributions from individual
components (see text).
Figure 7: Contribution of the different nitrogen-containing species to the total atom
concentration in the surface region.
32
Figure 8: a) Background subtracted ORR current response (geometric electrode surface area
normalized current density) of pure TiO2 (dots) and N, C doped TiOx (initial molar
ratio M(N) : M(Ti) = 15 : 2) calcined at the temperatures indicated (colored lines),
b) magnified view of the potential range around the onset potential (positive-going
scan, 10 mV s-1
, 1600 rpm, O2-sat. 0.5 M H2SO4).
Figure 9: a) ORR current response (geometric electrode surface area normalized current
density) of N, C doped TiOx (colored line) with different molar N : Ti ratios in the
used in the synthesis (ratios are given in the figure) and pure TiO2 (dots) and b)
magnified view of the potential range around and below the onset potential
(positive-going scan, 10 mV s-1
, 1600 rpm, O2-sat. 0.5 M H2SO4).
Figure 10: a) Current response (geometric electrode surface area normalized current density)
for H2O2 electrooxidation / electroreduction on pure TiO2 (dots) and on N, C
doped TiOx (initial molar ratio M(N) : M(Ti) = 15 : 2) calcined at the temperatures
indicated (colored lines). b) Magnified presentation of the cathodic currents
(positive-going scan, 10 mV s-1
, 1600 rpm, 300 µl H2O2 (35 %) in N2-sat. 0.5 M
H2SO4).
Figure 11: a) Current response (geometric electrode surface area normalized current density)
for H2O2 electrooxidation / electroreduction on pure TiO2 (circles) and on N, C
doped TiOx (colored line) with different N : Ti ratios in the synthesis. b) Magnified
presentation of the cathodic currents (positive-going scan, 10 mV s-1
, 1600 rpm,
300 µl H2O2 (35 %) in N2-sat. 0.5 M H2SO4).

100 200 300 400 500 600 700 800 900 1000
20
30
40
50
60
70
80
90
100
0.0
0.5
1.0
1.5
2.0
2.5
3.0
(4)
(2)
(1)
TG
/ %
Temperature / °C
(3)
DT
A / m
W m
g-1

O
O
NH2H2 N
O
NH
H2 N
O
NH2H2 N NH2
+ COHN
2 + NH3
O
NH
H2 N
O
NH2H2 N
O
NH2+
NH3
O
NH2H2 N3 HN NH
HN
O
OO+ 3 NH3
+ H2ON N
N
OH
OHHO
+ NH3
a)
b)
COHN
urea isocyanic acid
urea
urea
urea
isocyanic acid
biuret
biuret
cyanuric acid
cyanuric acid ammelide
N N
N
OH
OHHO
HN NH
HN
NH
OO
N N
N OHHO
NH2
T
T
T
T
T

80 200 250 300 350 400
0
10
20
30
40
50
60
O(1s)
C(1s)
Ti(2p)
N(1s)
Ele
menta
l C
om
positio
n / %
Temperature / °C

292 290 288 286 284 282
Binding energy / eV
XP
S in
tensity / a
.u.
2000 cps TiO2
400 °C
350 °C
300 °C
275 °C
250 °C
225 °C
200 °C
175 °C
80 °C

80 175 200 225 250 275 300 350 400
0
10
20
30
40 C-H C-O
N-C=O CO2
carbonate
C s
pecie
s / %
Temperature / °C

406 404 402 400 398 396
Binding energy / eV
XP
S in
ten
sity /
a.u
.
x 1/3
200 cpsTiO2
400 °C
350 °C
300 °C
275 °C
250 °C
225 °C
200 °C
175 °C
80 °C
80 175 200 225 250 275 300 350 400
0
1
2
3
4
10
12
14
16
18
NH+
4 / -NH
+
3
Ti-O-N
Biuret + Nad
Ti-N
N s
pecie
s / %
Temperature / °C

-30
-20
-10
0
TiO2
TiO2-(x+y)NxCy _uncalc.
TiO2-(x+y)NxCy _200°C
TiO2-(x+y)NxCy _250°C
TiO2-(x+y)NxCy _300°C
TiO2-(x+y)NxCy _400°C
j / µ
A c
m-2 geo
0.2 0.4 0.6 0.8 1.0 1.2
-4
-3
-2
-1
0
E / V vs. RHE
a)
b)

-60
-40
-20
0
M(N) : M(Ti) = 0 : 1
M(N) : M(Ti) = 5 : 2
M(N) : M(Ti) = 15 : 2
M(N) : M(Ti) = 30 : 2
j / µ
A c
m-2 geo
0.2 0.4 0.6 0.8 1.0 1.2
-4
-3
-2
-1
0
E / V vs. RHE
a)
b)

0
20
40
60
80 TiO2
TiO2-(x+y)NxCy_uncalc.
TiO2-(x+y)NxCy_200°C
TiO2-(x+y)NxCy_250°C
TiO2-(x+y)NxCy_300°C
TiO2-(x+y)NxCy_400°C
j / µ
A c
m-2 geo
0.2 0.4 0.6 0.8 1.0 1.2
-8
-6
-4
-2
0
E / V vs. RHE
a)
b)

0
20
40
60
80
M(N) : M(Ti) = 0 : 1
M(N) : M(Ti) = 5 : 2
M(N) : M(Ti) = 15 : 2
M(N) : M(Ti) = 30 : 2
j / µ
A c
m-2 geo
0.2 0.4 0.6 0.8 1.0 1.2
-8
-6
-4
-2
0
E / V vs. RHE
a)
b)


![Synthesis and Structure of trans-[O2(Im)4Tc]Cl•2H,O, trans-[O2(1-meIm1)4Tc]Cl•3H2O and Related Compounds](https://static.fdokumen.com/doc/165x107/63398ee975188717130476f6/synthesis-and-structure-of-trans-o2im4tccl2ho-trans-o21-meim14tccl3h2o.jpg)