Novel Data Acquisition Method for Interference Suppression in Dual-Channel SAR
14
Progress In Electromagnetics Research, Vol. 144, 79–92, 2014 Novel Data Acquisition Method for Interference Suppression in Dual-Channel SAR Xiao-Hong Lin * , Guo-Yi Xue, and Pei-Guo Liu Abstract—Various interference sources either intentional or unintentional can mask the synthetic aperture radar (SAR) signals and cause image degradation. With a novel data acquisition mode, a new method based on dual-channel SAR is applied to suppress the interference. Using the received dual-channel data, the two-dimensional location of the interference source can be estimated and then the interference can be removed via a Two-Channel-Cancelation method. By establishing a linear model of the interference-removed signal, the SAR image is reconstructed based on compressed sensing (CS) theory. Our method requires only a minor change to the traditional SAR system hardware while obtains a higher resolution. Simulation results are shown to demonstrate the validity of the proposed method. 1. INTRODUCTION Synthetic aperture radar (SAR) can obtain high resolution images of illuminated scene under all weather circumstances, and it has been widely used in both civil remote sensing and military surveillance [1]. However, there exist various kinds of interferences, such as radio-frequency interference (RFI) and artificial interference [2,3]. The RFI mainly comes from communication and television networks, while the artificial interference is generated by a military jammer. Also, these interferences are classified into two categories: 1) noncoherent interference; 2) coherent interference [4]. The noncoherent interference raises the noise level of SAR image to bury the targets of interest. In coherent interference, military jammer simulates target echoes or retransmits intercepted signals to cover the true target, then generates false targets in the scene, which affect the enemy commander’s ability to judge the situation of the battlefield. Since the existence of these interferences would seriously degrade the quality of SAR imagery, SAR should embed the ability to detect and suppress the interferences. At present, the suppression frameworks generally utilize the different characteristics between SAR and the interference in the following four aspects: 1) Signal form. [5] fits a multi-parameter model of the interference to the measured data and then coherently subtracting it. For nonstationary interference signals, this method is difficult to implement due to complicated model and high-dimensional parameter estimation. Based on a alteration of SAR transmitted signal, pulse diversity technologies are now widely applied to counter digital radio frequency memory (DRFM) repeat jammer [6–8], however they are incapable of suppressing the high-power noncoherent interference effectively. 2) Time-frequency domain. [4] utilizes wavelet to represent the instantaneous frequency of SAR received signal and designs a filter to filter the corresponding wavelet coefficients of the interference components. However, it requires the interference has good concentration in the time-frequency plane. In [9], the narrow band interference is obtained and canceled by subtracting different range subband spectra of the SAR image, but it is not suitable for removing wideband interference. Received 12 November 2013, Accepted 10 December 2013, Scheduled 17 December 2013 * Corresponding author: Xiao-Hong Lin ([email protected]). The authors are with the School of Electronic Science and Engineering, National University of Defense Technology, Changsha 410073, China.
Transcript of Novel Data Acquisition Method for Interference Suppression in Dual-Channel SAR
Progress In Electromagnetics Research, Vol. 144, 79–92, 2014
Novel Data Acquisition Method for Interference Suppressionin Dual-Channel SAR
Xiao-Hong Lin*, Guo-Yi Xue, and Pei-Guo Liu
Abstract—Various interference sources either intentional or unintentional can mask the syntheticaperture radar (SAR) signals and cause image degradation. With a novel data acquisition mode, anew method based on dual-channel SAR is applied to suppress the interference. Using the receiveddual-channel data, the two-dimensional location of the interference source can be estimated and thenthe interference can be removed via a Two-Channel-Cancelation method. By establishing a linear modelof the interference-removed signal, the SAR image is reconstructed based on compressed sensing (CS)theory. Our method requires only a minor change to the traditional SAR system hardware while obtainsa higher resolution. Simulation results are shown to demonstrate the validity of the proposed method.
1. INTRODUCTION
Synthetic aperture radar (SAR) can obtain high resolution images of illuminated scene under all weathercircumstances, and it has been widely used in both civil remote sensing and military surveillance [1].However, there exist various kinds of interferences, such as radio-frequency interference (RFI) andartificial interference [2, 3]. The RFI mainly comes from communication and television networks, whilethe artificial interference is generated by a military jammer. Also, these interferences are classified intotwo categories: 1) noncoherent interference; 2) coherent interference [4]. The noncoherent interferenceraises the noise level of SAR image to bury the targets of interest. In coherent interference, militaryjammer simulates target echoes or retransmits intercepted signals to cover the true target, then generatesfalse targets in the scene, which affect the enemy commander’s ability to judge the situation of thebattlefield. Since the existence of these interferences would seriously degrade the quality of SAR imagery,SAR should embed the ability to detect and suppress the interferences.
At present, the suppression frameworks generally utilize the different characteristics between SARand the interference in the following four aspects:1) Signal form. [5] fits a multi-parameter model of the interference to the measured data and
then coherently subtracting it. For nonstationary interference signals, this method is difficultto implement due to complicated model and high-dimensional parameter estimation. Based ona alteration of SAR transmitted signal, pulse diversity technologies are now widely applied tocounter digital radio frequency memory (DRFM) repeat jammer [6–8], however they are incapableof suppressing the high-power noncoherent interference effectively.
2) Time-frequency domain. [4] utilizes wavelet to represent the instantaneous frequency of SARreceived signal and designs a filter to filter the corresponding wavelet coefficients of the interferencecomponents. However, it requires the interference has good concentration in the time-frequencyplane. In [9], the narrow band interference is obtained and canceled by subtracting different rangesubband spectra of the SAR image, but it is not suitable for removing wideband interference.
Received 12 November 2013, Accepted 10 December 2013, Scheduled 17 December 2013* Corresponding author: Xiao-Hong Lin ([email protected]).The authors are with the School of Electronic Science and Engineering, National University of Defense Technology, Changsha 410073,China.
80 Lin, Xue, and Liu
3) Space domain. Interferences can be removed using adaptive beamforming and space-time adaptiveprocessing techniques [10–13]. These techniques work by forming the null adaptively in theinterference direction to minimize interference. Nevertheless, many spatial degrees of freedom(DOF) may be required to attain full rejection whilst maintaining low sidelobes.
4) Polarization domain. In [14], the differences between SAR echo and coherent interference inpolarization domain are analyzed and a method for discrimination and suppression of coherentinterference in Doppler domain is proposed. However, it have limited performance in noncoherentinterference suppression.
With the above analysis, a simplified SAR system with capacity in eliminating various types ofinterference would be potentially valuable in applications. To achieve this, a new interference suppressiontechnique for dual-channel SAR is developed in this paper. First, we introduce a novel data acquisitionmethod that requires only a minor change to the traditional SAR system hardware to work. At somerandomly selected slow times, the new system receives SAR echoes contaminated with interference,while collecting only interference at the other slow times. The collected interferences are utilized toestimate the direction of arrival (DOA) angle of the interference source at the randomly selected slowtimes. Then, based on phase compensation in range frequency domain, the interference received at therandomly selected slow times can be removed via a Two-Channel-Cancelation (TCC) method. It will bedemonstrated that the Signal-to-Interference ratio (SIR) is improved greatly by TCC operation. Finally,a linear model of the interference-removed signal is established and the SAR image is reconstructed basedon the compressed sensing (CS) theory.
The remainder of this paper is organized as follows: Section 2 gives a basic introduction of CSprinciple. In Section 3, we introduce our data acquisition method and derive the imaging models inthe presence of interference. Section 4 proposes a least square method to obtain the two-dimensionallocation of interference source and then the interference can be removed using dual-channel data. InSection 5, we use the interference-removed data to construct SAR image based on CS theory. Thesimulation results are listed in Section 6, and the paper is summarized in Section 7.
2. BASIS THEORY OF COMPRESSED SENSING
Before going into further explanations about our method, it is necessary to provide some backgroundknowledge of compressed sensing (CS).
CS is a new theory which is available to reconstruct the sparse or compressible signals from farfewer measurements than required by Shannon-Nyquist sampling theorem. Assume that a discretesignal vector xN×1 is sparse on a basis matrix ΨN×N . x is represented as
x = Ψα (1)
where α ∈ RN is the weighting coefficient with K nonzero elements and K a measure of the sparsity ofx.
According to CS theory, x is measured by a linear projections y = Φx where Φ ∈ CM×N withM ¿ N . It makes sense that only M samples of x need to be measured instead of N . In a matrixnotation, y is presented as
y = Φx = ΦΨα = Θα (2)
where Θ = ΦΨ ∈ CM×N . Since M < N , this equation is an ill-posed problem and has infinitely manysolutions. However, in CS theory, the sparse signal can be exactly reconstructed when the matrix Θhas the Restricted Isometry Property (RIP) which requires:
(1− δk) ‖ α ‖2≤‖ Θα ‖2≤ (1 + δk) ‖ α ‖2 (3)
where δk ∈ (0, 1) is a minimal constant and α the sparse coefficient vector. It is proved that RIP canbe achieved with high probability when Φ is a random matrix [15].
Known the observed measurement y and the measured matrix Θ, the sparse vector α can bereconstructed by searching for the solution with a l1 minimization criterion expressed as
min ‖ α ‖1 s.t y = Θα (4)
Progress In Electromagnetics Research, Vol. 144, 2014 81
if noise is taken into account, the above problem is changed into:minλ ‖ α ‖1 s.t ‖ y −Θα ‖2< ε (5)
where λ is a weighted coefficient, and ε bounds the amount of noise in measured data.Computation of (4) and (5) are both convex problems. Recently, there is a variety of sparse
approximation algorithms for solving such problems such as basis pursuit (BP) [16] and orthogonalmatching pursuit (OMP) [17].
3. DUAL-CHANNEL SAR IMAGING MODEL
3.1. Signal Model and Interference Model
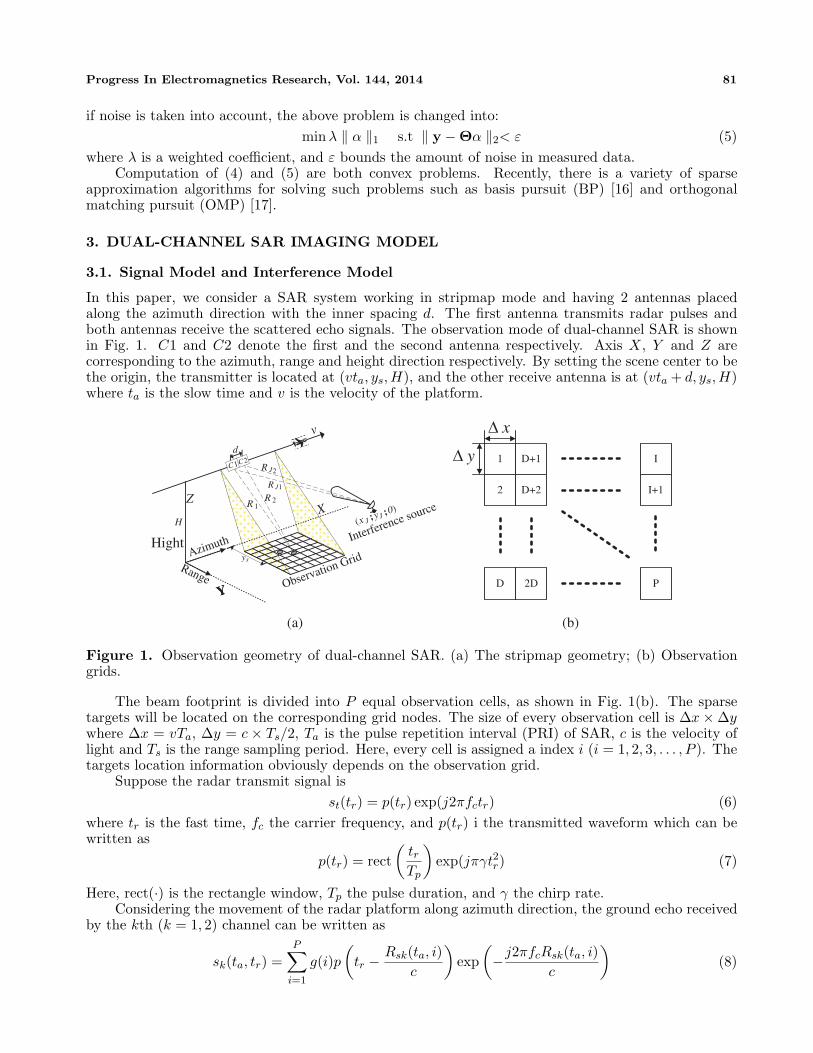
In this paper, we consider a SAR system working in stripmap mode and having 2 antennas placedalong the azimuth direction with the inner spacing d. The first antenna transmits radar pulses andboth antennas receive the scattered echo signals. The observation mode of dual-channel SAR is shownin Fig. 1. C1 and C2 denote the first and the second antenna respectively. Axis X, Y and Z arecorresponding to the azimuth, range and height direction respectively. By setting the scene center to bethe origin, the transmitter is located at (vta, ys,H), and the other receive antenna is at (vta + d, ys,H)where ta is the slow time and v is the velocity of the platform.
H
v
Range
Azimuth
(x J ;yJ ;
0)X
YY
Z
C1C2
R 1R 2
Observation Grid
R J1
R J2
Hightys
d
Interference source
1 D+1 I
I+1
P
2 D+2
D 2D
x∆
y∆
(a) (b)
Figure 1. Observation geometry of dual-channel SAR. (a) The stripmap geometry; (b) Observationgrids.
The beam footprint is divided into P equal observation cells, as shown in Fig. 1(b). The sparsetargets will be located on the corresponding grid nodes. The size of every observation cell is ∆x×∆ywhere ∆x = vTa, ∆y = c × Ts/2, Ta is the pulse repetition interval (PRI) of SAR, c is the velocity oflight and Ts is the range sampling period. Here, every cell is assigned a index i (i = 1, 2, 3, . . . , P ). Thetargets location information obviously depends on the observation grid.
Suppose the radar transmit signal isst(tr) = p(tr) exp(j2πfctr) (6)
where tr is the fast time, fc the carrier frequency, and p(tr) i the transmitted waveform which can bewritten as
p(tr) = rect(
trTp
)exp(jπγt2r) (7)
Here, rect(·) is the rectangle window, Tp the pulse duration, and γ the chirp rate.Considering the movement of the radar platform along azimuth direction, the ground echo received
by the kth (k = 1, 2) channel can be written as
sk(ta, tr) =P∑
i=1
g(i)p(
tr − Rsk(ta, i)c
)exp
(−j2πfcRsk(ta, i)
c
)(8)
82 Lin, Xue, and Liu
where g(i) is the average backscattering coefficient of the corresponding discrete cell, and Rsk(ta, i) isrepresented as follow
Rs1(ta, i) = 2R1(ta, i)Rs2(ta, i) = R1(ta, i) + R2(ta, i)
(9)
where R1(ta, i) =√
(vta − xi)2 + y2i + H2 is the range from C1 to the target located at (xi, yi, 0) and
R2(ta, i) =√
(vta + d− xi)2 + y2i + H2 the distance between C2 and this target.
Assume there exists a interference sources at (xJ , yJ , 0), as shown in Fig. 1(a). The ranges fromC1 and C2 to the interference source are RJ1(ta) and RJ2(ta), respectively. In a far-field condition,RJ2(ta)−RJ1(ta) ≈ d sin(θJ(ta)) where θJ(ta) is the direction of arrival (DOA) angle of the interferencesignal [18]. Then, the interference signal received by C2 can be expressed as
z2(ta, tr) = z1
(ta, tr − d sin (θJ(ta))
c
)(10)
where z1(ta, tr) is the received interference signal in the first channel.
3.2. Data Acquisition
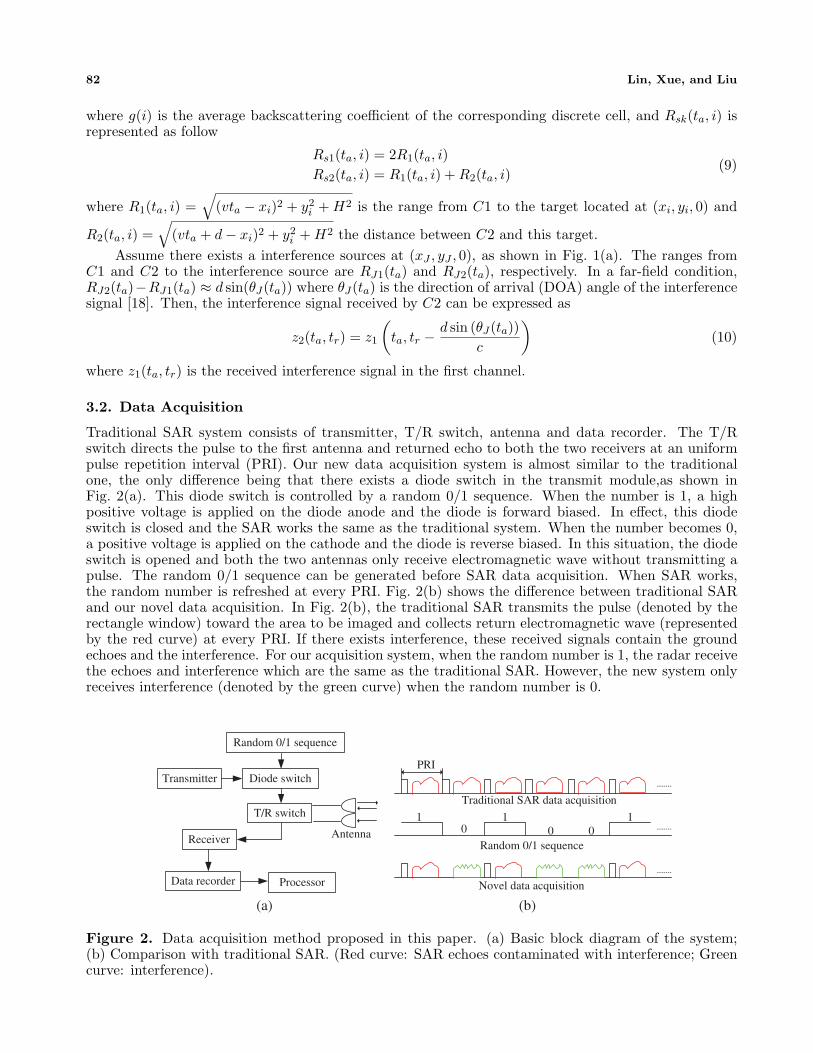
Traditional SAR system consists of transmitter, T/R switch, antenna and data recorder. The T/Rswitch directs the pulse to the first antenna and returned echo to both the two receivers at an uniformpulse repetition interval (PRI). Our new data acquisition system is almost similar to the traditionalone, the only difference being that there exists a diode switch in the transmit module,as shown inFig. 2(a). This diode switch is controlled by a random 0/1 sequence. When the number is 1, a highpositive voltage is applied on the diode anode and the diode is forward biased. In effect, this diodeswitch is closed and the SAR works the same as the traditional system. When the number becomes 0,a positive voltage is applied on the cathode and the diode is reverse biased. In this situation, the diodeswitch is opened and both the two antennas only receive electromagnetic wave without transmitting apulse. The random 0/1 sequence can be generated before SAR data acquisition. When SAR works,the random number is refreshed at every PRI. Fig. 2(b) shows the difference between traditional SARand our novel data acquisition. In Fig. 2(b), the traditional SAR transmits the pulse (denoted by therectangle window) toward the area to be imaged and collects return electromagnetic wave (representedby the red curve) at every PRI. If there exists interference, these received signals contain the groundechoes and the interference. For our acquisition system, when the random number is 1, the radar receivethe echoes and interference which are the same as the traditional SAR. However, the new system onlyreceives interference (denoted by the green curve) when the random number is 0.
Transmitter
Receiver
Data recorder Processor
Antenna
T/R switch
Diode switch
Random 0/1 sequence
1 10 0 0
1
PRI
Random 0/1 sequence
Traditional SAR data acquisition
Novel data acquisition
(a) (b)
Figure 2. Data acquisition method proposed in this paper. (a) Basic block diagram of the system;(b) Comparison with traditional SAR. (Red curve: SAR echoes contaminated with interference; Greencurve: interference).

Progress In Electromagnetics Research, Vol. 144, 2014 83
In this paper, the azimuth time when SAR transmits a pulse is denoted as tat, and the azimuthtime when SAR only receive interference signal is represented as tar. Ignoring the propagation effect ofthe electromagnetic, the complete signals received by the kth receiver can be expressed as follow
ek(ta, tr) =
sk(ta, tr) + zk(ta, tr) if ta = tat
zk(ta, tr) if ta = tar(11)
4. INTERFERENCE SUPPRESSION USING DUAL-CHANNEL DATAS
4.1. Removing Interference
From (10) and (11), at the slow time tat, the output of SAR in the range frequency domain is representedby
E1(tat, fr) = S1(tat, fr) + Z1(tat, fr) (12)
E2(tat, fr) = S2(tat, fr) + exp(−j2πfr
d sin (θJ(tat))c
)Z1(tat, fr) (13)
where Ek, Sk and Zk denote the range spectrum of the total received signal, real echoes and interferencesignal in the kth channel, respectively. According to the above two formulas, the interference can beremoved by a Two-Channel-Cancelation (TCC) method based on phase compensation, if θJ(tat) isknown. After TCC processing, the residual echoes will become
E2(tat, fr)− β(tat, fr)E1(tat, fr) = S2(tat, fr)− β(tat, fr)S1(tat, fr) (14)
where β(tat, fr) = exp (−j2πfrd sin (θJ(tat)) /c). Based on this formula, the illuminated scene canbe reconstructed via CS, which will be discussed in Section 5. However, θJ(ta) is unknown. InSubsection 4.2, we will derive these DOAs in high precision, utilizing the data received at the slowtime tar.
4.2. Two Dimensional Location of Interference Source
According to the geometrical relationship between SAR and the interference source, as shown in Fig. 3,a formula can be obtained as
tan (θJ(tar)) =vtar − xJ√yJ
2 + H2= Qtar + b (15)
where Q = v/√
y2J + H2, b = −xJ/
√y2
J + H2 and θJ(tar) can be estimated by these methods [19–21].It should be noted that tan(θJ(tar)) form a straight line with slope Q and intercept b for real DOAvalues θJ(tar). However, for the estimated DOA values θJ(tar), tan(θJ(tar)) will fluctuate around thisstraight line. In order to obtain the DOAs of the interference source at the slow time tat, an operation
v
(x J ; yJ ; 0)Interference source
X
Y
Z
ys
scene
Tθ Jθ
H
yJ
| vt a | |vt a − x J |
Figure 3. The geometry between SAR and the interference source.
84 Lin, Xue, and Liu
called linear least-squares fitting is carried out to a set of (tar, tan(θJ(tar))) data pairs. Then, we willobtain a fitting straight line whose slope Q and intercept b can be expressed as [22]
Q =tartan − tar · tan
tar2 − tar
2 (16)
b =tar
2 · tan − tar · tartan
tar2 − tar
2 (17)
respectively, where symbols with an overline denote average values and tan = tan(θJ(tar)). Since theleast-squares solutions are unbiased, consistent and effective, it means that the estimated parametershave the highest probability to be correct and will converge toward the true values when the azimuthsample number of the interference increases. From Q and b, the two-dimensional location of the jammercan be realized, and the corresponding coordinate can be derived as
xJ = −vb
Q(18)
yJ =
√v2
Q2−H2 (19)
Then, sin (θJ (tat)) can be estimated by
sin(θJ (tat)
)=
vtat − xJ√(xJ − vtat)
2 + y2J + H2
(20)
Now, we can remove the interference signal using the method proposed in Subsection 4.1.
4.3. Suppression Performance Analysis
Actually, due to the estimation error of sin (θJ (tat)), the interference will not be removed completely.Next, we will analyze the change of the Signal-to-Interference ratio (SIR) after TCC processing. Forsimplicity, in this subsection, we ignore the indexes related to fr and tat.
After TCC, the residual signal can be expressed as follow
∆E = E2 − β(θJ)E1 = S2 − β(θJ)S1 +(β(θJ)− β(θJ)
)Z1 (21)
Approximately, we can regard the real echoes as the signal transmitted by a source located in the centerof the illuminated scene. Then, the echoes have the same property with the interference describedby (10). Now, ∆E can be rewritten as
∆E =(β(θT )− β(θJ)
)S1 +
(β(θJ)− β(θJ)
)Z1 (22)
We define SIR before TCC as SIRorig = |S1/Z1|2. Then, after TCC, the SIR becomes
SIRTCC = ϑ · SIRorig =
∣∣∣∣∣β(θT )− β(θJ)
β(θJ)− β(θJ)
∣∣∣∣∣2
SIRorig (23)
where ϑ is the SIR improvement factor.In general, the SAR bandwidth B ¿ fc. For DOA determination with no ambiguity, it requires
that the antenna spacing d ≤ λ/2 where λ is the carrier wavelength of SAR [18]. Here, we set d to bea typical value λ/2. Then, β(θ) ≈ exp (−j2πd sin(θ)/λ) = exp(−jπ sin(θ)) and ϑ can be rewritten as
ϑ =
∣∣∣∣∣∣exp
(−jπ sin(θT )−sin(θJ )
2
)− exp
(jπ sin(θT )−sin(θJ )
2
)
exp(−jπ sin(θJ )−sin(θJ )
2
)− exp
(jπ sin(θJ )−sin(θJ )
2
)∣∣∣∣∣∣
2
×∣∣∣∣∣∣exp
(−jπ sin(θT )+sin(θJ )
2
)
exp(−jπ sin(θJ )+sin(θJ )
2
)∣∣∣∣∣∣
2
=
∣∣∣∣∣∣sin
(π2
(sin(θT )− sin(θJ)
))
sin(
π2
(sin(θJ)− sin(θJ)
))∣∣∣∣∣∣
2
=
∣∣∣∣∣∣sin
(π2
(sin(θT )− sin(θJ)
))
sin(π cos
(θJ+θJ
2
)sin
(θJ−θJ
2
))∣∣∣∣∣∣
2
(24)
Progress In Electromagnetics Research, Vol. 144, 2014 85
For side-looking SAR, sin(θT ) ≈ 0. When the estimation error ∆θJ = |θJ − θJ | ¿ 1, we have
ϑ ≈∣∣∣∣∣∣
sin(π
2sin
(θJ
))
sin(π
2cos(θJ)
(θJ − θJ
))∣∣∣∣∣∣
2
≈∣∣∣∣∣∣sin
(π
2sin(θJ)
)
π
2cos(θJ)∆θJ
∣∣∣∣∣∣
2
(25)
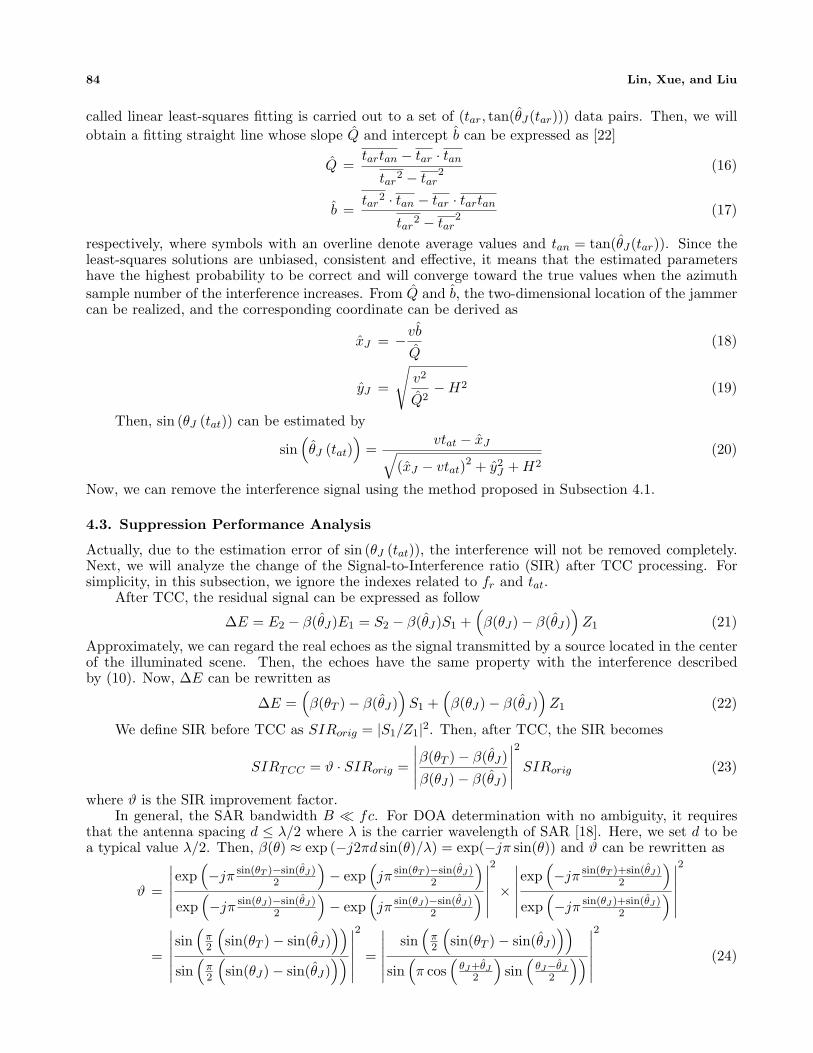
Figure 4 shows the SIR improvement factors under different DOA estimation errors. It can be seenthat ϑ improves greatly when the DOA estimation accuracy becomes higher. In addition, when θJ getslarger, the improvement factor also grows higher.
In theory, we can obtain a satisfied DOA estimation accuracy using the method proposed inSubsection 4.2, when SAR receives enough interference signals. That is to say, after TCC processing,the interference can be removed effectively.
10-5
10-4
10-3
10-2
10-1
0
20
40
60
80
100
DOA estimation error (rad)
Imp
rov
emen
t fa
ctor
(dB
)
θJ = π/ 6
θJ = π/ 4
θJ = π/ 3
Figure 4. The SIR improvement factor versus the DOA estimation error.
5. SAR IMAGE RECONSTRUCTION BASED ON CS
After TCC processing, the SAR image is unable to be obtained via the traditional imaging algorithms.However, we can reconstruct the sparse scene based on CS theory.
In order to use CS, a linear measurement model of the interference-removed signals should becreated firstly.
5.1. The Linear Model for Interference-Removed Signal
In practice, the range and azimuth times are discrete due to the sampling process. The 2-D discretetime SAR echoes sk(tat, tr) can be written as sk(ta,m, tr,n), m = 1, 2, . . . ,M , n = 1, 2, . . . , N where Mis the number of azimuth samples and N is the number of samples for each pulse.
(8) can be expressed in matrix form as
sk = Akg (26)
where sk is an MN × 1 vector, Ak an MN × P matrix, and g the P × 1 scattering coefficient vector.Here, g is sparse and only K(K ¿ P ) of its components is nonzero or greater than zero. In the aboveexpression,
sk =[sk(ta,1, tr,1), . . . , sk(ta,1, tr,N ), sk(ta,2, tr,1), . . . , sk(ta,2, tr,N ), . . . , sk(ta,M , tr,1), . . . , sk(ta,M , tr,N )]T(27)
Letφ(ta,m, tr,n, i) = p(tr,n −Rsk(ta,m, i)/c) exp (−j2πfcRsk(ta,m, i)/c)) (28)
Then, the projection matrix can be expressed as
Ak =[a(ta,1, tr,1), . . . ,a(ta,1, tr,N ),a(ta,2, tr,1), . . . ,a(ta,2, tr,N ), . . . ,a(ta,M , tr,1), . . . ,a(ta,M , tr,N )]T (29)
86 Lin, Xue, and Liu
wherea(ta,m, tr,n) = [φ(ta,m, tr,n, 1), φ(ta,m, tr,n, 2), . . . , φ(ta,m, tr,n, P )] (30)
Also, Sk(tat, fr) can be rewritten as
Sk = Ωsk = ΩAkg (31)
where Ω is a MN ×MN matrix represented as follow
Ω =
F 0 · · · 00 F · · · 0
0 0. . . 0
0 0 · · · F
(32)
Here, F is a N × N discrete Fourier transformation (DFT) matrix with the (p, q)th entity given by1/√
N exp (−j2πpq/N).Similarly, (14) can be expressed in a matrix form as
E2 −BE1 = S2 −BS1 = (ΩA2 −BΩA1)g (33)
where Ek is a MN × 1 vector and has a similar construction to Sk; B is a MN ×MN matrix definedas
B =
B1 0 0 · · · 00 B2 0 · · · 0...
.... . .
......
0 0 0 BM−1 00 0 0 0 BM
(34)
where Bm is a N ×N matrix defined as
Bm =
β(ta,m, fr,1) 0 · · · 00 β(ta,m, fr,2) · · · 0...
.... . .
...0 0 · · · β(ta,m, fr,N )
(35)
Here, β(ta,m, fr,n) is the 2-D discrete form of β(tat, fr).
Random 0/1 sequence
Raw echo contaminated
by interferenceInterference signal
0 1
Two dimensional location
of interference source
Remove interference
Create linear model for
interference-removed signal
Signal reconstruction
based on L1 norm
Sparse targets 2-D imaging
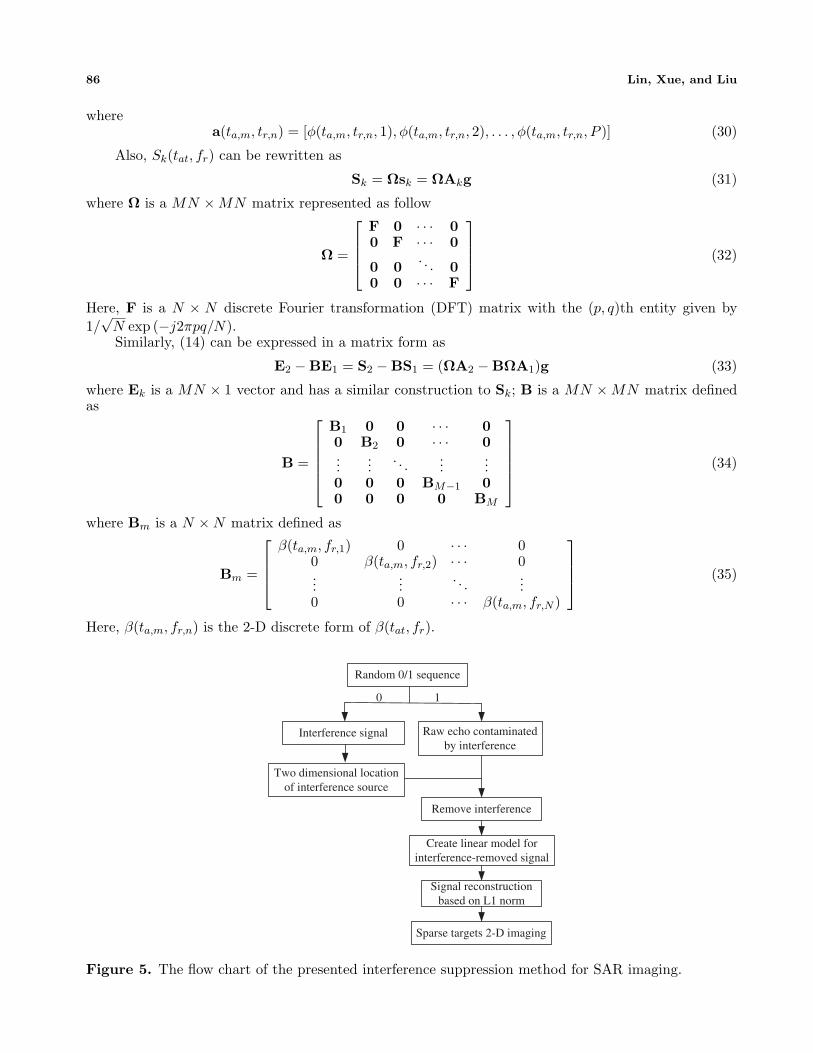
Figure 5. The flow chart of the presented interference suppression method for SAR imaging.
Progress In Electromagnetics Research, Vol. 144, 2014 87
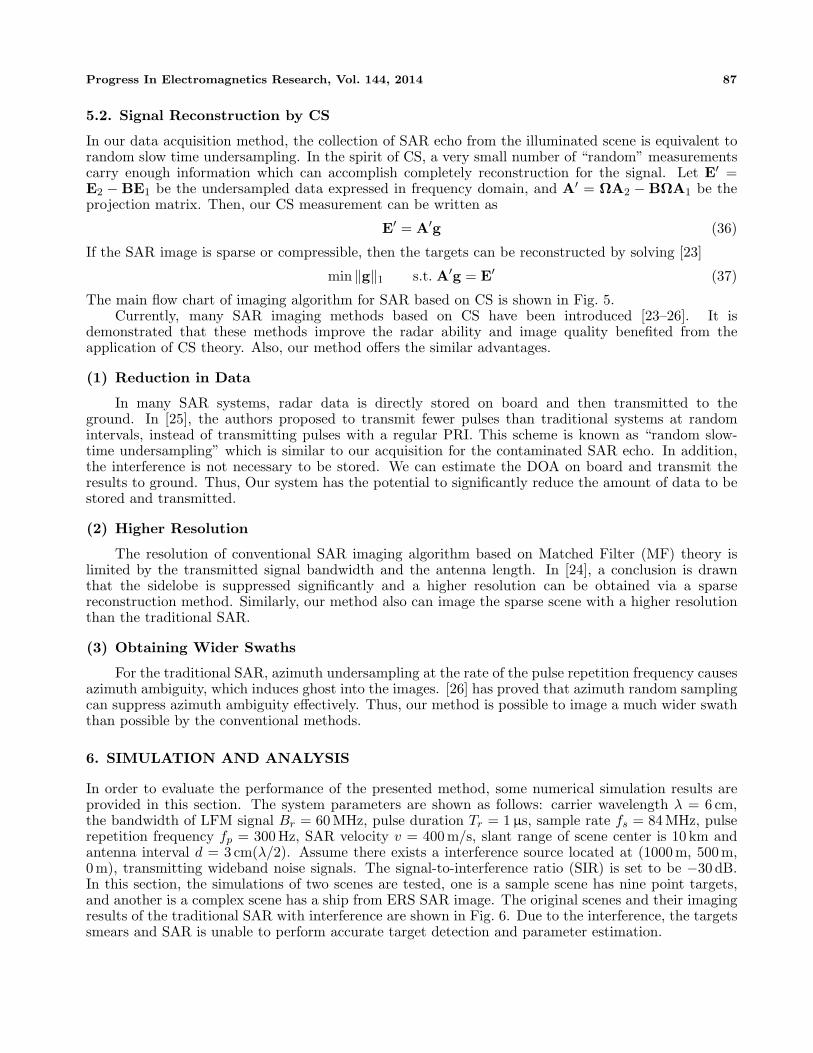
5.2. Signal Reconstruction by CS
In our data acquisition method, the collection of SAR echo from the illuminated scene is equivalent torandom slow time undersampling. In the spirit of CS, a very small number of “random” measurementscarry enough information which can accomplish completely reconstruction for the signal. Let E′ =E2 −BE1 be the undersampled data expressed in frequency domain, and A′ = ΩA2 −BΩA1 be theprojection matrix. Then, our CS measurement can be written as
E′ = A′g (36)
If the SAR image is sparse or compressible, then the targets can be reconstructed by solving [23]
min ‖g‖1 s.t. A′g = E′ (37)
The main flow chart of imaging algorithm for SAR based on CS is shown in Fig. 5.Currently, many SAR imaging methods based on CS have been introduced [23–26]. It is
demonstrated that these methods improve the radar ability and image quality benefited from theapplication of CS theory. Also, our method offers the similar advantages.
(1) Reduction in Data
In many SAR systems, radar data is directly stored on board and then transmitted to theground. In [25], the authors proposed to transmit fewer pulses than traditional systems at randomintervals, instead of transmitting pulses with a regular PRI. This scheme is known as “random slow-time undersampling” which is similar to our acquisition for the contaminated SAR echo. In addition,the interference is not necessary to be stored. We can estimate the DOA on board and transmit theresults to ground. Thus, Our system has the potential to significantly reduce the amount of data to bestored and transmitted.
(2) Higher Resolution
The resolution of conventional SAR imaging algorithm based on Matched Filter (MF) theory islimited by the transmitted signal bandwidth and the antenna length. In [24], a conclusion is drawnthat the sidelobe is suppressed significantly and a higher resolution can be obtained via a sparsereconstruction method. Similarly, our method also can image the sparse scene with a higher resolutionthan the traditional SAR.
(3) Obtaining Wider Swaths
For the traditional SAR, azimuth undersampling at the rate of the pulse repetition frequency causesazimuth ambiguity, which induces ghost into the images. [26] has proved that azimuth random samplingcan suppress azimuth ambiguity effectively. Thus, our method is possible to image a much wider swaththan possible by the conventional methods.
6. SIMULATION AND ANALYSIS
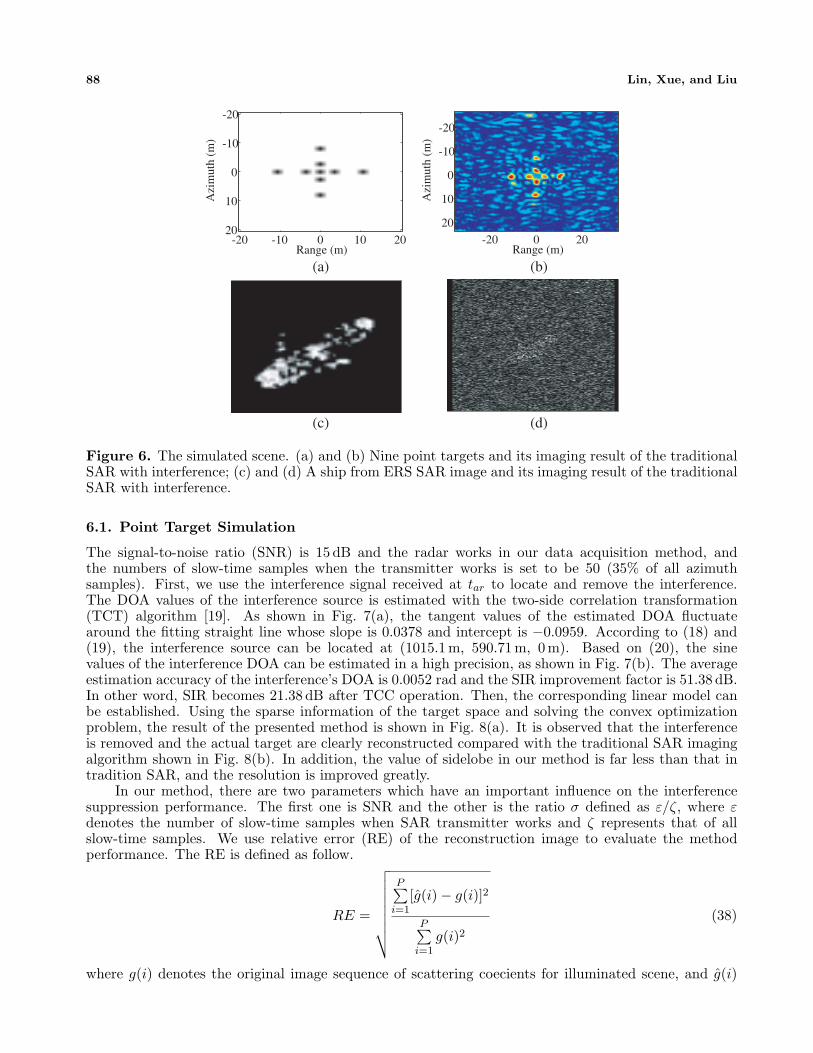
In order to evaluate the performance of the presented method, some numerical simulation results areprovided in this section. The system parameters are shown as follows: carrier wavelength λ = 6 cm,the bandwidth of LFM signal Br = 60 MHz, pulse duration Tr = 1 µs, sample rate fs = 84 MHz, pulserepetition frequency fp = 300 Hz, SAR velocity v = 400 m/s, slant range of scene center is 10 km andantenna interval d = 3 cm(λ/2). Assume there exists a interference source located at (1000 m, 500m,0m), transmitting wideband noise signals. The signal-to-interference ratio (SIR) is set to be −30 dB.In this section, the simulations of two scenes are tested, one is a sample scene has nine point targets,and another is a complex scene has a ship from ERS SAR image. The original scenes and their imagingresults of the traditional SAR with interference are shown in Fig. 6. Due to the interference, the targetssmears and SAR is unable to perform accurate target detection and parameter estimation.
88 Lin, Xue, and Liu
Range (m)
Azi
mu
th (
m)
-20 -10 0 10 20
-20
-10
0
10
20
Range (m)
Azi
mu
th (
m)
-20 0 20
-20
-10
0
10
20
(a) (b)
(c) (d)
Figure 6. The simulated scene. (a) and (b) Nine point targets and its imaging result of the traditionalSAR with interference; (c) and (d) A ship from ERS SAR image and its imaging result of the traditionalSAR with interference.
6.1. Point Target Simulation
The signal-to-noise ratio (SNR) is 15 dB and the radar works in our data acquisition method, andthe numbers of slow-time samples when the transmitter works is set to be 50 (35% of all azimuthsamples). First, we use the interference signal received at tar to locate and remove the interference.The DOA values of the interference source is estimated with the two-side correlation transformation(TCT) algorithm [19]. As shown in Fig. 7(a), the tangent values of the estimated DOA fluctuatearound the fitting straight line whose slope is 0.0378 and intercept is −0.0959. According to (18) and(19), the interference source can be located at (1015.1m, 590.71m, 0m). Based on (20), the sinevalues of the interference DOA can be estimated in a high precision, as shown in Fig. 7(b). The averageestimation accuracy of the interference’s DOA is 0.0052 rad and the SIR improvement factor is 51.38 dB.In other word, SIR becomes 21.38 dB after TCC operation. Then, the corresponding linear model canbe established. Using the sparse information of the target space and solving the convex optimizationproblem, the result of the presented method is shown in Fig. 8(a). It is observed that the interferenceis removed and the actual target are clearly reconstructed compared with the traditional SAR imagingalgorithm shown in Fig. 8(b). In addition, the value of sidelobe in our method is far less than that intradition SAR, and the resolution is improved greatly.
In our method, there are two parameters which have an important influence on the interferencesuppression performance. The first one is SNR and the other is the ratio σ defined as ε/ζ, where εdenotes the number of slow-time samples when SAR transmitter works and ζ represents that of allslow-time samples. We use relative error (RE) of the reconstruction image to evaluate the methodperformance. The RE is defined as follow.
RE =
√√√√√√√√
P∑i=1
[g(i)− g(i)]2
P∑i=1
g(i)2(38)
where g(i) denotes the original image sequence of scattering coecients for illuminated scene, and g(i)

Progress In Electromagnetics Research, Vol. 144, 2014 89
-0.2 -0.1 0 0.1 0.2 0.3
-0.11
-0.105
-0.1
-0.095
-0.09
-0.085
Slow time ta(s)
tan (θ
J(t
a))
Fitting line
The estimated values at tar
-0.2 -0.1 0 0.1 0.2 0.3 -0.11
-0.105
-0.1
-0.095
-0.09
-0.085
Real values
The estimated values at tat
sin (θ
J(t
a))
Slow time ta(s)
(a) (b)
Figure 7. The estimated DOA values of the interference source. (a) Tangent values of the estimatedDOA at slow time tar; (b) Sine values of the estimated DOA at slow time tat.
Range (m)
Azi
muth
(m
)
-10 0 10
-10
-5
0
5
10
Range (m)
Azi
muth
(m
)
-10 0 10
-10
-5
0
5
10
(a) (b)
Figure 8. The imaging result of the nine point targets. (a) The proposed method; (b) The traditionalSAR without interference.
10 20 30 40 500
0.2
0.4
0.6
Rela
tive e
rror
SNR (dB)
σ=0.20
σ=0.35
σ=0.50
0 0.2 0.4 0.6 0.80
1
2
3
Rela
tive e
rror
SNR=30dB
SNR=20dB
SNR=10dB
SNR=5dB
σ
(a) (b)
Figure 9. The relative error of target reconstruction by the proposed method. (a) The RE versus SNRunder different σ; (b) The RE versus the ratio σ under different SNR.
is the reconstructed one. Apparently, the lower the value of RE is, the better the performance will be.Fig. 9 shows the RE of the constructed image versus the different ratio σ and different SNR. At eachSNR level or ratio σ, 100 independent trial are performed. In Fig. 9(a), the result demonstrates that themethod performance deteriorates with the decreases of SNR. It is because that the CS reconstruction issensitive to noise [24]. In our simulations, the targets were still reconstructed correctly but with somefalse targets coming out when SNR is 5 dB. Fig. 9(b) plots the RE of the proposed method at differentratio σ under different SNR. It is observed that RE becomes smaller when the ratio σ increases, and asatisfied imaging result can be obtained when σ is more than 0.2.
90 Lin, Xue, and Liu
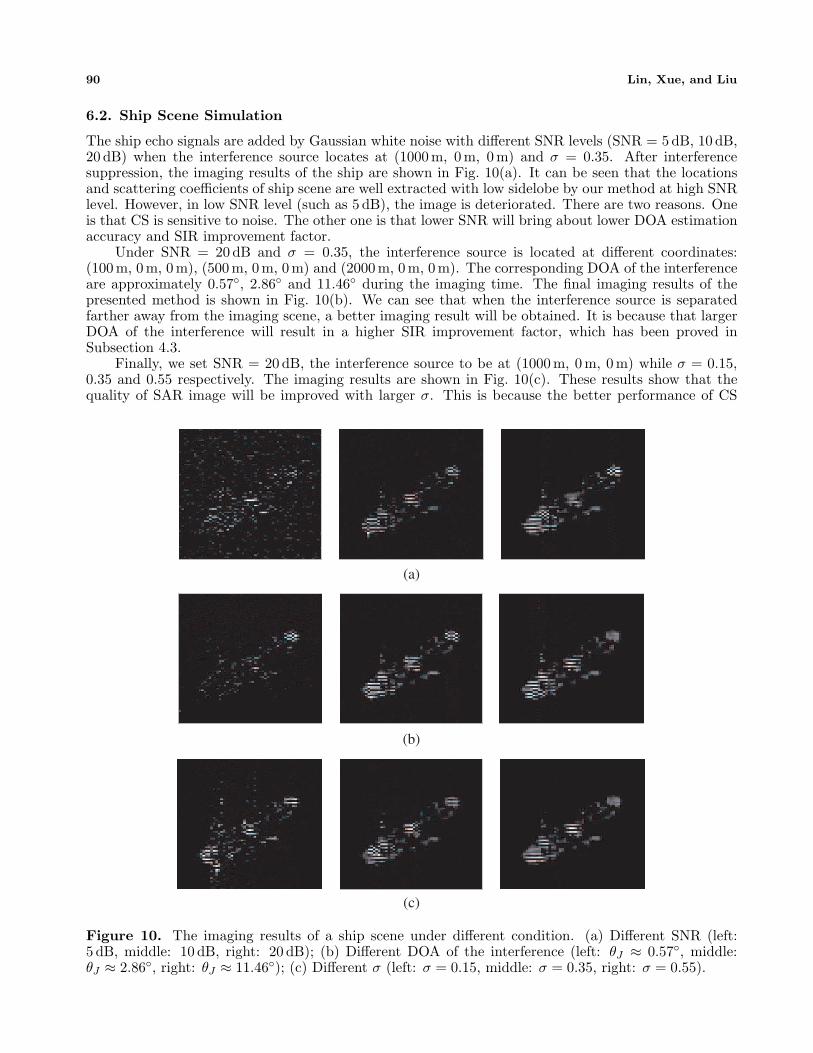
6.2. Ship Scene Simulation
The ship echo signals are added by Gaussian white noise with different SNR levels (SNR = 5 dB, 10 dB,20 dB) when the interference source locates at (1000m, 0 m, 0 m) and σ = 0.35. After interferencesuppression, the imaging results of the ship are shown in Fig. 10(a). It can be seen that the locationsand scattering coefficients of ship scene are well extracted with low sidelobe by our method at high SNRlevel. However, in low SNR level (such as 5 dB), the image is deteriorated. There are two reasons. Oneis that CS is sensitive to noise. The other one is that lower SNR will bring about lower DOA estimationaccuracy and SIR improvement factor.
Under SNR = 20 dB and σ = 0.35, the interference source is located at different coordinates:(100m, 0m, 0 m), (500 m, 0m, 0 m) and (2000 m, 0m, 0 m). The corresponding DOA of the interferenceare approximately 0.57, 2.86 and 11.46 during the imaging time. The final imaging results of thepresented method is shown in Fig. 10(b). We can see that when the interference source is separatedfarther away from the imaging scene, a better imaging result will be obtained. It is because that largerDOA of the interference will result in a higher SIR improvement factor, which has been proved inSubsection 4.3.
Finally, we set SNR = 20dB, the interference source to be at (1000m, 0 m, 0m) while σ = 0.15,0.35 and 0.55 respectively. The imaging results are shown in Fig. 10(c). These results show that thequality of SAR image will be improved with larger σ. This is because the better performance of CS
(a)
(b)
(c)
Figure 10. The imaging results of a ship scene under different condition. (a) Different SNR (left:5 dB, middle: 10 dB, right: 20 dB); (b) Different DOA of the interference (left: θJ ≈ 0.57, middle:θJ ≈ 2.86, right: θJ ≈ 11.46); (c) Different σ (left: σ = 0.15, middle: σ = 0.35, right: σ = 0.55).

Progress In Electromagnetics Research, Vol. 144, 2014 91
relies on the larger number of measurements [24]. In other words, the larger the number of echo samplesare, the more scattering centers can be reconstructed.
7. CONCLUSION
Image degradation due to various interferences is an important problem in SAR imaging, which can notneglected during SAR image analysis. With a novel data acquisition mode, this paper has proposeda new interference suppression method for dual-channel SAR. Compared to conventional interferencesuppression approaches, the proposed method can obtain the two-dimensional location of the interferencesource, which is an important information for Electronic Counter Counter Measures. In addition,reduction in data, higher resolution and wider swaths can be achieved. However, there exist twoconstraints for this method. First, the illuminated scene should be sparse or compressible. Second,there is only one interference source located in the sidelobe region. In the future, we will extend thiswork to remove multiple interferences with multi-channel SAR.
ACKNOWLEDGMENT
The authors would like to thank the reviewers for their excellent comments, which are of great help inimproving this paper.
REFERENCES
1. Chan, Y. K. and V. C. Koo, “An introduction to synthetic aperture radar (SAR),” Progress InElectromagnetics Research B , Vol. 2, 27–60, 2008.
2. Liu, Q., J. Dong, X. Wang, S. Xing, and B. Pang, “An efficient SAR jammer with direct radiofrequency processing (Drfp),” Progress In Electromagnetics Research, Vol. 137, 293–309, 2013.
3. Wu, X., D. Dai, and X. Wang, “Study on SAR jamming measures,” IET International Conferenceon Radar Systems, 176–179, Edinburgh, England, 2007.
4. Zhou, F., R. Wu, M. Xing, and Z. Bao, “Interference suppression algorithm for SAR based on time-frequency transform,” IEEE Transaction on Geoscience and Remote Sensing, Vol. 49, 3765–3779,2011.
5. Lord, R. T. and M. R. Inggs, “Efficient RFI suppression in SAR using LMS adaptive filter integratedwith range/Doppler algorithm,” Electronic Letter , Vol. 35, 629–630, 1999.
6. Soumekh, M., “SAR-ECCM using phase-perturbed LFM chirp signals and DRFM repeat jammerpenalization,” IEEE Transactions on Aerospace and Electronic Systems, Vol. 42, 191–205, 2006.
7. Lu, G., B. Tang, and G. Gui, “Deception ECM signals cancellation processor with joint time-frequency pulse diversity,” IEICE Electronics Express, Vol. 8, 1608–1613, 2011.
8. Li, W., X. L. Wang, and X. M. Wang, “Anti-jamming techniques for synthetic aperture radar,”Proc. IEEE International Geoscience and Remote Sensing Symposium, 605–608, 2009.
9. Feng, J., H. Zheng, Y. Deng, and D. Gao, “Application of subband spectral cancellation for SARnarrow-band interference suppression,” IEEE Geoscience and Remote Sensing Letters, Vol. 9, 190–193, 2012.
10. Guerci, Space-time Adaptive Processing for Radar , Artech House, 2003.11. Paine, A. S., “An adaptive beamforming technique for countering synthetic aperture radar (SAR)
jamming threats,” IEEE 2007 Radar Conference, 630–634, 2007.12. Rosenberg, L. and D. Gray, “Anti-jamming techniques for multichannel SAR imaging,” IEE
Proceedings: Radar, Sonar and Navigation, Vol. 153, 234–242, 2006.13. Rosenberg, L. and D. Gray, “Constrained fast-time STAP for interference Suppression in
multichannel SAR,” IEEE Transaction on Aerospace and Electronic Systems, Vol. 49, 1792–1805,2013.
14. Dai, D. H., X. S. Wang, S. P. Xiao, and Y. Z. Li, “Discrimination and suppression of active-decoysjamming in PolSAR,” Acta Electronica Sinica, Vol. 9, 1779–1783, 2007.
92 Lin, Xue, and Liu
15. Baraniuk, R., “Compressive sensing,” IEEE Signal Processing , Vol. 24, No. 4, 118–121, 2007.16. Candes, E. J., J. Romberg, and T. Tao, “Robust uncertainty principles: Exact signal reconstruction
from highly incomplete frequency information,” IEEE Transaction on Information Theory, Vol. 52,489–509, 2006.
17. Tropp, J. A., “Greed is good: Algrorithm results for sparse approximation,” IEEE Transaction onInformation Theory , Vol. 50, 2231–2242, 2004.
18. Chen, Z. Z., G. Gokeda, and Y. Q. Yu,, Introduction to Direction-of-arrival Estimation , ArtechHouse, 2010.
19. Valaee, S. and P. Kabal, “Wideband array processing using a two-sided correlation transformation,”IEEE Transactions on Signal Processing, Vol. 43, 160–172, 1995.
20. Reddy, V. V., B. Ng, Y. Zhang, and A. W. Khong, “DOA estimation of wideband sources withoutestimating the number of sources,” Signal Processing , Vol. 92, 1032–1043, 2012.
21. Liu, C., F. Liu, and S. Zhang, “A novel direction-of-arrival estimation method for widebandsignals,” Signal, Image and Video Processing, Vol. 6, 141–145, 2012.
22. Cantrell, C., “Technical Note: Review of methods for linear least-squares fitting of data andapplication to atmospheric chemistry problems,” Atmospheric Chemistry and Physics, Vol. 8, 5477–5487, 2008.
23. Yang, J., J. Thompson, X. Huang, T. Jin, and Z. Zhou, “Segmented reconstruction for compressedsensing SAR imaging,” IEEE Transaction on Geoscience and Remote Sensing, Vol. 51, 4214–4225,2013.
24. Wei, S.-J., X.-L. Zhang, J. Shi, and G. Xiang, “Sparse reconstruction for SAR imaging based oncompressed sensing,” Progress In Electromagnetics Research, Vol. 109, 63–81, 2010.
25. Vishal, M. P., R. E. Glenn, M. H. Dennis, and C. Rama, “Compressed synthetic aperture radar,”IEEE Journal of Selected Topic in Signal Processing, Vol. 4, 244–254, 2010.
26. Yu, Z. and M. Liu, “Suppressing azimuth ambiguity in spaceborne SAR images based on compressedsensing,” Science China: Information Sciences, Vol. 55, 1830–1837, 2012.