Pitfalls of surgical technique for coronary artery bypass surgery
Upload
independentCategory
view
1download
0
NOVEL CLASSIFICATION OF CORONARY ARTERY
DISEASE USING HEART RATE VARIABILITY ANALYSIS
SUMEET DUA*,§, XIAN DU*, VINITHA SREE S† and THAJUDIN AHAMED V. I‡
*Department of Computer Science, Louisiana Tech University
600 W Arizona Ave, Ruston, LA 71272, USA
†School of Mechanical and Aerospace Engineering
Nanyang Technological University, Singapore 639798
‡Department of Electronics and Communication Engineering
Government Engineering College
Wayanad, Kerala, India 670644§[email protected]
Received 15 May 2012
Accepted 15 June 2012
Published 21 August 2012
Coronary artery disease (CAD) is a leading cause of death worldwide. Heart rate variability
(HRV) has been proven to be a non-invasive marker of the autonomic modulation of the heart.
Nonlinear analyses of HRV signals have shown that the HRV is reduced signi¯cantly in patientswith CAD. Therefore, in this work, we extracted nonlinear features from the HRV signals using
the following techniques: recurrence plots (RP), Poincare plots, and detrended °uctuation
analysis (DFA). We also extracted three types of entropy, namely, Shannon entropy (ShanEn),
approximation entropy (ApEn), and sample entropy (SampEn). These features were subjectedto principal component analysis (PCA). The signi¯cant principal components were evaluated
using eight classi¯cation techniques, and the performances of these techniques were evaluated to
determine which presented the highest accuracy in classifying normal and CAD classes. We
observed that the multilayer perceptron (MLP) method resulted in the highest classi¯cationaccuracy (89.5%) using our proposed technique.
Keywords: Coronary artery disease; heart rate variability; feature extraction; feature signi¯-cance; principal component analysis; supervised classi¯cation.
1. Introduction
Coronary artery disease (CAD), also called coronary heart disease, is a heart con-
dition in which plaque collects inside the coronary arteries that supply the heart
muscle with nutrients and oxygen. CAD is the leading cause of death in the United
States. The disease resulted in 405,309 deaths in 2008 and every year, about 785,000
Americans have a ¯rst heart attack.1 Most people a®ected by CAD do not show
any symptoms when the disease is in the early stage. As the disease progresses, the
Journal of Mechanics in Medicine and Biology
Vol. 12, No. 4 (2012) 1240017 (19 pages)
°c World Scienti¯c Publishing Company
DOI: 10.1142/S0219519412400179
1240017-1
J. M
ech.
Med
. Bio
l. D
ownl
oade
d fr
om w
ww
.wor
ldsc
ient
ific
.com
by W
SPC
on
08/2
2/12
. For
per
sona
l use
onl
y.

built-up plaque ruptures, limiting blood °ow to the heart muscle. CAD is the most
common cause of sudden cardiac death. Therefore, early detection of this condition
could help reduce the alarming mortality rate associated with this disease.
The electrocardiogram (ECG), a technique that records the electrical activity of
the heart over time, is commonly used for detecting CAD. However, 50% to 75% of
patients with CAD do not show symptoms in ECGs.2 Another technique, the ex-
ercise stress test, has limited use because of its low sensitivity and because not all
patients can reach the target heart rate required for the test.3 Several other clinical
diagnostic techniques, such as single-photon emission computed tomography, ra-
dionuclide exercise myocardial perfusion imaging, positron emission tomography,
cardiac magnetic resonance imaging, and multi-slice computed tomography are also
available. Each of these techniques has at least one limitation, such as lower sensi-
tivity, speci¯city, higher cost, longer examination time, and/or injection of radio-
active material. Thus, the development and research of non-invasive diagnostic
techniques are becoming more extensive because these techniques are less expensive,
safer, and more accessible to a wide range of patients. Non-invasive techniques are
also more capable of detecting CAD at early stages when luminal obstructions are
not visible yet.
One such non-invasive technique makes use of is the heart rate variability (HRV),
which measures the variation in the heart rate from beat to beat. HRV has proven to
be a non-invasive marker of the autonomic modulation of heart. Using this method,
the heart rate (HR) time series is computed by measuring time intervals between
consecutive R peaks (tr�r), expressed in seconds, of the QRS complex of the ECG
signal. The resulting time series is referred to as an RR interval time series. The
sequence of numbers that results is the series of instantaneous time periods, and the
instantaneous HR, expressed in beats per minute, is computed as HR¼ 60/tr�r. A
plot of the instantaneous HR gives the HRV signal. The assessment of HRV has been
shown to aid in the clinical diagnosis of and intervention strategies for treating
cardiological and non-cardiological diseases, including dilated cardiomyopathy,
congestive heart failure, fetal distress conditions, obstructive sleep apnea, stroke,
depression, other psychological factors, and diabetic neuropathy.4�10
A decrease in the HRV indicates some type of cardiac or autonomic dysfunction.
Reduced barore°ex sensitivity has been shown to be related to CAD, and reduced
vagal activity, i.e., altered HRV, has been observed in patients with CAD.11,12 The
circadian rhythm of HRV has been demonstrated to be reduced in patients with
CAD.13 The reduction of low-frequency power has also been observed to correlate
with the angiographic severity of CAD.14 Spectral analysis indicating a reduction in
high-frequency power has also been reported.15,16 The time and frequency domain
measures of HRV are lower in patients with chronic or subacute CAD than in
healthy subjects.17 However, these methods are sensitive to noise and hence, may not
always provide an accurate and clear categorization of healthy and CAD patients. A
noise detection and elimination strategy for acoustic detection in CAD was proposed
by Zia et al.18 The cardiovascular system is complex, and studies performed under
S. Dua et al.
1240017-2
J. M
ech.
Med
. Bio
l. D
ownl
oade
d fr
om w
ww
.wor
ldsc
ient
ific
.com
by W
SPC
on
08/2
2/12
. For
per
sona
l use
onl
y.
the assumption that it is a nonlinear system have shown that HRV is signi¯cantly
reduced in patients with CAD. Therefore, many studies have used nonlinear tech-
niques to analyze the HRV signal. For comparison, a more detailed presentation of
the results obtained in other CAD studies is given in the discussion section of this
paper.
For this work, we extracted nonlinear features from the HRV signals using the
following techniques: recurrence plots (RP), Poincare plots, and detrended °uctua-
tion analysis (DFA). We also extracted three types of entropy, namely, Shannon
entropy (ShanEn), approximation entropy (ApEn), and sample entropy (SampEn).
These features were subjected to principal component analysis (PCA) to extract
signi¯cant orthogonal features derived from the existing feature set. These signi¯cant
principal components were later subjected to eight classi¯cation techniques, and the
performances of these techniques were evaluated to determine which classi¯er pre-
sents the highest accuracy for classifying samples to the corresponding normal and
CAD classes. The paper is organized as follows: Section 2 contains a description of
the data used for this work. Section 3 contains a brief description of our preprocessing
method. The methodology is given in Sec. 4, and the subsequent explanation of the
results and a comparison with the previous literature can be found in Sec. 5. Our
discussion is located in Sec. 6, and our conclusions are provided in Sec. 7.
2. Data
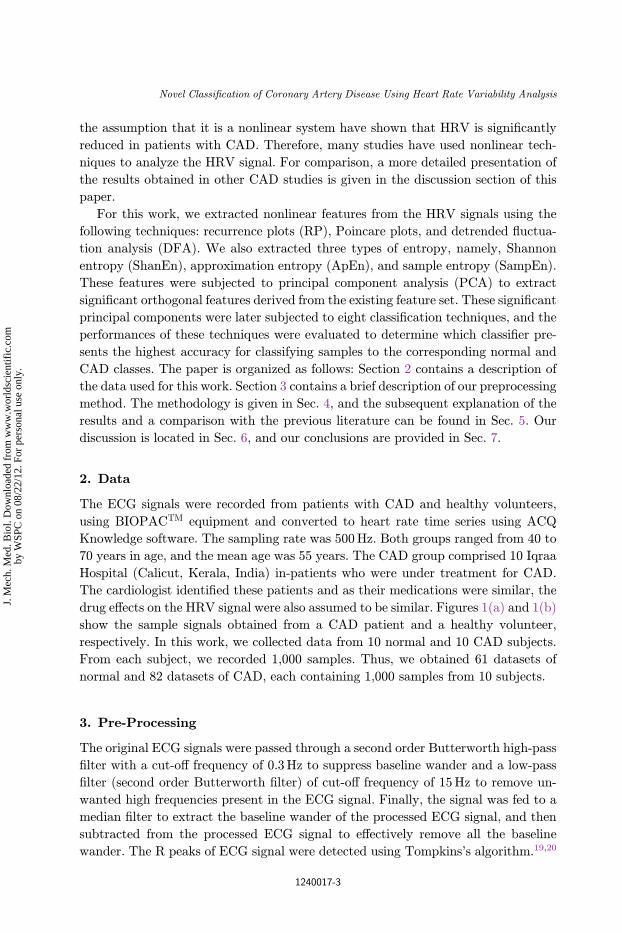
The ECG signals were recorded from patients with CAD and healthy volunteers,
using BIOPACTM equipment and converted to heart rate time series using ACQ
Knowledge software. The sampling rate was 500Hz. Both groups ranged from 40 to
70 years in age, and the mean age was 55 years. The CAD group comprised 10 Iqraa
Hospital (Calicut, Kerala, India) in-patients who were under treatment for CAD.
The cardiologist identi¯ed these patients and as their medications were similar, the
drug e®ects on the HRV signal were also assumed to be similar. Figures 1(a) and 1(b)
show the sample signals obtained from a CAD patient and a healthy volunteer,
respectively. In this work, we collected data from 10 normal and 10 CAD subjects.
From each subject, we recorded 1,000 samples. Thus, we obtained 61 datasets of
normal and 82 datasets of CAD, each containing 1,000 samples from 10 subjects.
3. Pre-Processing
The original ECG signals were passed through a second order Butterworth high-pass
¯lter with a cut-o® frequency of 0.3Hz to suppress baseline wander and a low-pass
¯lter (second order Butterworth ¯lter) of cut-o® frequency of 15Hz to remove un-
wanted high frequencies present in the ECG signal. Finally, the signal was fed to a
median ¯lter to extract the baseline wander of the processed ECG signal, and then
subtracted from the processed ECG signal to e®ectively remove all the baseline
wander. The R peaks of ECG signal were detected using Tompkins's algorithm.19,20
Novel Classi¯cation of Coronary Artery Disease Using Heart Rate Variability Analysis
1240017-3
J. M
ech.
Med
. Bio
l. D
ownl
oade
d fr
om w
ww
.wor
ldsc
ient
ific
.com
by W
SPC
on
08/2
2/12
. For
per
sona
l use
onl
y.

4. Methodology
This section contains brief descriptions of the extracted nonlinear features and PCA.
It also provides a description of the eight classi¯ers that were evaluated.
4.1. Feature extraction
The following section contains a description of the di®erent feature extraction
techniques employed.
4.1.1. Recurrence plots (RP)
Recurrence quanti¯cation analysis (RQA) is a popularmethod used for nonlinear data
analysis. In a state space trajectory of a dynamical system, RQA can be used to
quantify the number and duration of recurrences. A cross recurrence plot (CRP)
reveals all the times at which the phase space trajectory of the ¯rst dynamical system
visits approximately the same area in the phase space that the phase space trajectory of
the second dynamical system is located. Webber and Zbilut,21 Zbilut and Webber,22
and Marwan et al.23 developed measures for the quanti¯cation of RP. Some of these
measures include recurrence rate (REC), determinism (DET), laminarity (LAM),
mean diagonal line length (Lmean), trapping time (TT ), longest diagonal line (Lmax),
longest vertical line (Vmax), and entropy (ENTR). In thiswork, theRQA features found
to be signi¯cant are REC, DET, and Lmean. These features are de¯ned as follows. In
these de¯nitions,N represents the number of pointsRi;j on the phase space trajectory,
Nv represents the number of vertical lines in the recurrence plot, Nl represents the
number of diagonal lines in the RP, and P(l ) and P(v) represent the histogram of the
line lengths of the diagonal and vertical lines, respectively. Figure 2 shows the typical
RP of CAD and normal heart plots.
0 100 200 300 400 500 600 700 800 900 1000406080
100120140
---> Sample
--->
Hea
rt r
ate
(BP
M)
(a)
0 100 200 300 400 500 600 700 800 900 1000406080
100120140
---> Sample
--->
Hea
rt r
ate
(BP
M)
(b)
Fig. 1. HRV signals of (a) a CAD patient and (b) a healthy volunteer.
S. Dua et al.
1240017-4
J. M
ech.
Med
. Bio
l. D
ownl
oade
d fr
om w
ww
.wor
ldsc
ient
ific
.com
by W
SPC
on
08/2
2/12
. For
per
sona
l use
onl
y.

The recurrence rate is the percentage or density of the recurrence points in a
recurrence plot and is given by
REC ¼ 1
N2
XNi;j¼0
Ri;j: ð1Þ
Determinism is the fraction of recurrence points forming diagonal lines of minimal
length lmin. DET indicates the predictability of the system, as denoted below:
DET ¼PN
l¼lminlPðlÞPN
i;j Ri;j
: ð2Þ
The mean diagonal line length is the mean length of the diagonal lines and is
given by
Lmean ¼PN
l¼lminlP ðlÞPN
l¼lminP ðlÞ : ð3Þ
4.1.2. Poincare plots
The Poincare plot, a technique taken from nonlinear dynamics, portrays the nature
of RR interval °uctuations. In this technique, each RR interval is plotted as a
function of the previous RR interval. This plot may be analyzed quantitatively by
calculating the standard deviations of the distances of the R�RðiÞ to the lines y ¼ x
and y ¼ �xþ 2R�Rm, where R�Rm is the mean of all R�RðiÞ. The standard
(a) (b)
Fig. 2. Recurrence plots (RP) for heart rate signals. (a) CAD and (b) normal.
Novel Classi¯cation of Coronary Artery Disease Using Heart Rate Variability Analysis
1240017-5
J. M
ech.
Med
. Bio
l. D
ownl
oade
d fr
om w
ww
.wor
ldsc
ient
ific
.com
by W
SPC
on
08/2
2/12
. For
per
sona
l use
onl
y.

deviations are referred to as SD1 and SD2, respectively. SD1 is related to the fast
beat-to-beat variability in the data, while SD2 describes the longer-term variability
of R�RðiÞ.24 Figure 3 shows the typical recurrence plots of CAD and normal heart
plots.
4.1.3. Detrended °uctuation analysis (DFA)
Detrended °uctuation analysis (DFA) is used to quantify the fractal scaling
properties of short RR interval signals. This technique is a modi¯cation of the root-
mean-square analysis of random walks applied to non-stationary signals.25 The root-
mean-square °uctuation of an integrated and detrended time series F ðnÞ is measured
at di®erent observation windows and plotted against the size of the observation
window n on a log�log scale.26 Two parameters are determined from this technique.
The ¯rst of these parameters is the slope of the line relating logFðnÞ to logn (called
�); the second parameter is the dimension of the time series (D).
4.1.4. Approximate entropy (ApEn)
Approximate entropy (ApEn), proposed by Acharya et al. and Piscus,26,27 is the
logarithmic likelihood that the trends of the data patterns that are close to each
other will remain close when compared with the next pattern. Thus, ApEn is a
measure of data regularity. A greater likelihood of high regularity results in smaller
ApEn values, and vice versa. Consider a time series xðnÞ, n ¼ 1; 2; . . . ;N . A series of
patterns of length e (called the embedding dimension which is the smallest integer for
which the patterns do not intersect with each other) is derived from xðnÞ. ApEn is
given by
ApEnðe; r;NÞ ¼ 1
ðN � eþ 1ÞXN�eþ1
i¼1
logCei ðrÞ �
1
ðN � eÞXN�e
ði�1ÞlogCeþ1
i ðrÞ; ð4Þ
(a) (b)
Fig. 3. Poincare plots for heart rate signals (a) CAD and (b) Normal.
S. Dua et al.
1240017-6
J. M
ech.
Med
. Bio
l. D
ownl
oade
d fr
om w
ww
.wor
ldsc
ient
ific
.com
by W
SPC
on
08/2
2/12
. For
per
sona
l use
onl
y.

where the index r is a ¯xed parameter which sets the tolerance of the comparison and
Cei ðrÞ is the correlation integral given by
Cei ðrÞ ¼
1
ðN � eþ 1ÞXN�eþ1
j�i
�ðr� jjxi � xjjjÞ: ð5Þ
For this work, r was set to be 0.2 times the standard deviation of the time series,
and e was chosen to be 10.
4.1.5. Sample entropy (SampEn)
Sample entropy (SampEn), proposed by Richman and Moorman, is the negative
natural logarithm of an estimate of the conditional probability that patterns of
length e that match point-wise within a tolerance r also match at the next point.28
Larger values of SampEn correspond to more irregularity in the data and vice versa.
In sample entropy calculation, runs of points matching within the tolerance r are
performed until there is no match, while the count of template matches are stored in
counters AðkÞ and BðkÞ for all lengths k up to e. SampEn is given by the formula
SampEnðk; r;NÞ ¼ InAðkÞ
Bðk� 1Þ ; ð6Þ
where k ¼ 0; 1; . . . ; e-1 and Bð0Þ ¼ N , the length of the input series.
4.1.6. Shannon's entropy (ShanEn)
Spectral entropy (SEN), a normalized form of Shannon's entropy, uses the amplitude
components of the power spectrum of the EEG signal for entropy calculations.29,30 It
quanti¯es the spectral complexity of the time series. Entropy is computed by mul-
tiplying the power in each frequency pf by the logarithm of the same power and then
multiplying the result by �1. The total ShanEn entropy is the sum of entropy
computed over the entire frequency range31 and is given by
ShanEn ¼Xf
pf log1
pf: ð7Þ
4.1.7. Short-range scaling exponent (�1)
The total length of the HR signal (N) is integrated
yðkÞ ¼Xki¼1
½HRðiÞ �HRavg�; ð8Þ
where HRðiÞ is the ith heart rate signal and HRavg is the average heart rate of N
samples. Next, the integrated time series is divided into boxes of equal length n, a
least-squares line is ¯t to the data. The y-coordinate of the straight line segments is
given by ynðkÞ. The root mean square °uctuation of this integrated and detrended
Novel Classi¯cation of Coronary Artery Disease Using Heart Rate Variability Analysis
1240017-7
J. M
ech.
Med
. Bio
l. D
ownl
oade
d fr
om w
ww
.wor
ldsc
ient
ific
.com
by W
SPC
on
08/2
2/12
. For
per
sona
l use
onl
y.

heart rate data is calculated by
F ðnÞ ¼ffiffiffiffiffiffiffiffiffiffiffiffiffiffiffiffiffiffiffiffiffiffiffiffiffiffiffiffiffiffiffiffiffiffiffiffiffiffiffiffiffiffiffiffiffiffiffi1=N
XNk¼1
½yðkÞ � ynðkÞ�2vuut : ð9Þ
This computation is repeated over all the box sizes to provide a relationship
between FðnÞ, and box size n. In this study, the box size is ranged from 4 to�300
beats.
A linear relationship on a double-log graph indicates the presence of scaling
ðF ðnÞ � naÞ. The slope of the line relating logF ðnÞ to logðnÞ to depicts the scaling
exponent ð�Þ which describes the correlation properties of the entire heart rate series.
The short-range scaling exponent (�1) was evaluated over periods of 4 to 13 beats.
The value of �1 implies the fractal behavior of the time series.
4.1.8. Correlation dimension (D2)
D2 is de¯ned to obtain a quantitative measure of the nature of trajectory, and the
ranges of D2 are di®erent for various heart diseases.6 The D2 of the attractor is given
by:
D2 ¼ limr!0
logCðrÞlogðrÞ ; ð10Þ
where the correlation integral C(r) is given by
CðrÞ ¼ 1
N2
XNx¼1
XNy¼1;x 6¼y
�ðr� jXx �XyjÞ; ð11Þ
where Xx, Xy ! points of the trajectory in the phase space,
N ! is the number of data points in phase space,
r ! radial distance around each reference point Xi, and
� ! is the Heaviside function.
4.2. Principal components analysis
Principal components analysis (PCA) is a feature extraction technique that trans-
forms a high-dimensional dataset to a low-dimensional orthogonal feature (eigen-
vector) space while retaining the maximum variance of the original high dimensional
dataset. Typically, each orthogonal feature is referred to as a principal component.
The ¯rst principal component captures the most signi¯cant variance in the dataset.
The second principal component is directionally perpendicular to the ¯rst principal
component that contains the next signi¯cant variance with respect to the ¯rst
principal component. Principal components are ranked by their corresponding
Eigenvalues, which are scalar representations of the degree of variance within the
corresponding principal components.
S. Dua et al.
1240017-8
J. M
ech.
Med
. Bio
l. D
ownl
oade
d fr
om w
ww
.wor
ldsc
ient
ific
.com
by W
SPC
on
08/2
2/12
. For
per
sona
l use
onl
y.

Given an n-dimensional numeric dataset, each dimension represents a coordinate
of the n-dimensional data space. Our objective here is to transform the coordinate
space from the n-dimensional space to another desired coordinate data space (of
lower dimension), based on the underlying distribution of data points in the dataset.
With the application of PCA, the subsequent set of coordinates for each data
point is generated to represent the underlying variance distribution. In Fig. 4, we
present the PCA work°ow, which includes the following steps:32
(1) Calculating covariance matrix : Subtract the data mean in all dimensions to
produce a data set with a zero mean, and then calculate the covariance matrix.
(2) Extracting eigenvalues and eigenvectors : Subject the covariance matrix to
decomposition that results in a matrix of eigenvectors in an n-dimensional space,
which consists of a set of n principal components in n dimensions, and their
corresponding eigenvalues.
(3) Sorting eigenvectors : Rank the eigenvectors according to eigenvalue, starting
from the highest value and moving to the lowest value.
(4) Selecting signi¯cant eigenvectors : Select the most signi¯cant eigenvectors
based on their corresponding eigenvalues, and project the given data on the
selected eigenvectors (or principal components).
In the above steps, the number of selected principal components depends on the
percentage of the total variances re°ected by their corresponding Eigenvalues. The
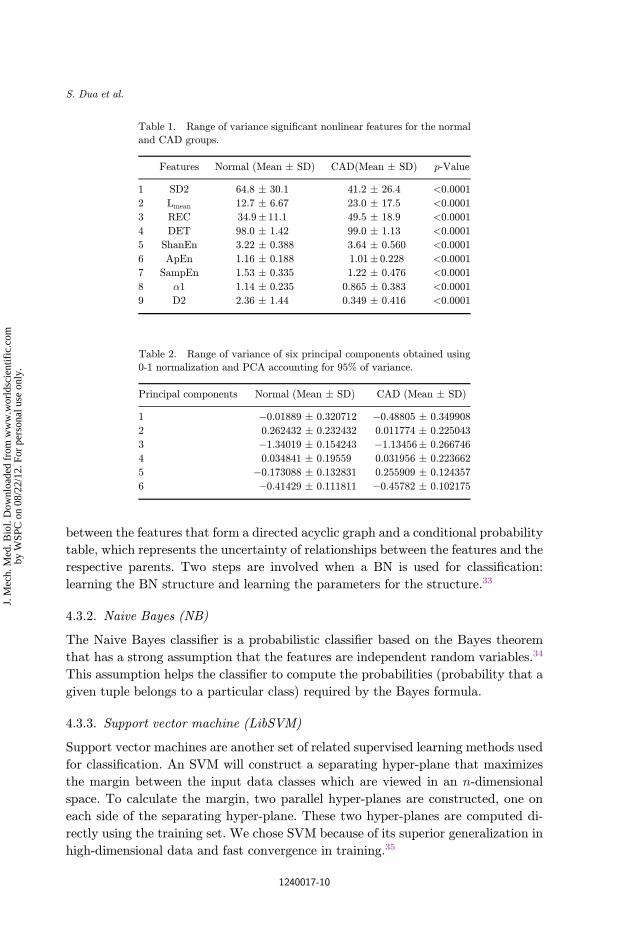
total variance of the dataset is equal to the sum of all eigenvalues. In this work,
the original CAD dataset consisted of nine signi¯cant nonlinear features that are
listed in the next section (Table 1). We subjected these nonlinear features to PCA
and selected the six most signi¯cant principal components which account for 95% of
the variance of the nonlinear-feature dataset. The obtained principal components are
shown in Table 2.
4.3. Classi¯ers
The following section enumerates and provides an brief overview of the classi¯ers
employed in this study.
4.3.1. Bayesian network (BN)
A Bayesian network (BN) is a graphical model that encodes probabilistic relation-
ships among the features. A BN consists of a set of features and a set of directed edges
Fig. 4. The work°ow of the PCA method for obtaining principal components.
Novel Classi¯cation of Coronary Artery Disease Using Heart Rate Variability Analysis
1240017-9
J. M
ech.
Med
. Bio
l. D
ownl
oade
d fr
om w
ww
.wor
ldsc
ient
ific
.com
by W
SPC
on
08/2
2/12
. For
per
sona
l use
onl
y.
between the features that form a directed acyclic graph and a conditional probability
table, which represents the uncertainty of relationships between the features and the
respective parents. Two steps are involved when a BN is used for classi¯cation:
learning the BN structure and learning the parameters for the structure.33
4.3.2. Naive Bayes (NB)
The Naive Bayes classi¯er is a probabilistic classi¯er based on the Bayes theorem
that has a strong assumption that the features are independent random variables.34
This assumption helps the classi¯er to compute the probabilities (probability that a
given tuple belongs to a particular class) required by the Bayes formula.
4.3.3. Support vector machine (LibSVM)
Support vector machines are another set of related supervised learning methods used
for classi¯cation. An SVM will construct a separating hyper-plane that maximizes
the margin between the input data classes which are viewed in an n-dimensional
space. To calculate the margin, two parallel hyper-planes are constructed, one on
each side of the separating hyper-plane. These two hyper-planes are computed di-
rectly using the training set. We chose SVM because of its superior generalization in
high-dimensional data and fast convergence in training.35
Table 1. Range of variance signi¯cant nonlinear features for the normal
and CAD groups.
Features Normal (Mean � SD) CAD(Mean � SD) p-Value
1 SD2 64.8 � 30.1 41.2 � 26.4 <0.0001
2 Lmean 12.7 � 6.67 23.0 � 17.5 <0.0001
3 REC 34.9� 11.1 49.5 � 18.9 <0.0001
4 DET 98.0 � 1.42 99.0 � 1.13 <0.0001
5 ShanEn 3.22 � 0.388 3.64 � 0.560 <0.0001
6 ApEn 1.16 � 0.188 1.01� 0.228 <0.0001
7 SampEn 1.53 � 0.335 1.22 � 0.476 <0.0001
8 �1 1.14 � 0.235 0.865 � 0.383 <0.0001
9 D2 2.36 � 1.44 0.349 � 0.416 <0.0001
Table 2. Range of variance of six principal components obtained using0-1 normalization and PCA accounting for 95% of variance.
Principal components Normal (Mean � SD) CAD (Mean � SD)
1 �0.01889 � 0.320712 �0.48805 � 0.349908
2 0.262432 � 0.232432 0.011774 � 0.225043
3 �1.34019 � 0.154243 �1.13456� 0.266746
4 0.034841 � 0.19559 0.031956 � 0.223662
5 �0.173088 � 0.132831 0.255909 � 0.124357
6 �0.41429 � 0.111811 �0.45782 � 0.102175
S. Dua et al.
1240017-10
J. M
ech.
Med
. Bio
l. D
ownl
oade
d fr
om w
ww
.wor
ldsc
ient
ific
.com
by W
SPC
on
08/2
2/12
. For
per
sona
l use
onl
y.

4.3.4. Sequential minimal optimization (SMO)
Sequential minimal optimization (SMO) is an algorithm that increases the speed of
SVM training.36 We implemented the Platt's SMO algorithm for this work.
4.3.5. Arti¯cial neural network (ANN)�multilayer perceptron (MLP)
For this work, the ANN�MLP classi¯er was trained using the back propagation
algorithm. ANN�MLP works in the following way: once the network is designed and
weights are initialized, the training by this algorithm is performed in three stages ���the feed-forward of the input features, the back-propagation of the error between the
network output and desired output, and the adjustment of the weights. These stages
are repeated iteratively until the mean square error between the network output and
desired output is less than a pre-set threshold. The weight update is used to maximize
the rate of error reduction, and, hence, it is called a \gradient descent" algorithm.37
4.3.6. Radial basis function (RBF)
An RBF network is a type of ANN algorithm that generally has three layers ��� an
input layer, a hidden layer with a non-linear RBF activation function, and a linear
output layer. A radial basis function is a real-valued function that has a value that
depends only on the distance from the origin or from a center. Such a function �
should also satisfy the relationship �ðxÞ ¼ �ðjjxjjÞ.
4.3.7. Random forest
The random forest classi¯er uses a group of decision trees and generates class labels
for data points by combining the outputs of the individual trees. Each tree is grown
using a subset of the possible features. During classi¯cation, each tree \votes" for one
of the classes, and the most popular class is assigned.38,39
4.3.8. Classi¯cation and regression trees (CART)
CART is a non-parametric decision tree-based learning technique. The model pro-
duces a classi¯cation tree if the target variable is categorical or a regression tree if the
target variable is numeric. In our work, a classi¯cation tree was produced and then
used for classi¯cation.
5. Results
This section contains a presentation of the range of nonlinear features obtained from
both classes of data and the subsequent classi¯cation results.
5.1. Signi¯cant nonlinear features and extracted PCA features
The dataset comprised 61HRV signals from the normal group and 82 from the CAD
group. The nonlinear features described in the previous section were extracted from
Novel Classi¯cation of Coronary Artery Disease Using Heart Rate Variability Analysis
1240017-11
J. M
ech.
Med
. Bio
l. D
ownl
oade
d fr
om w
ww
.wor
ldsc
ient
ific
.com
by W
SPC
on
08/2
2/12
. For
per
sona
l use
onl
y.

these signals. The t-test was applied to select those features that were signi¯cantly
di®erent from the others. We determined that a p-value of less than 0.0001 indicates
that the feature is signi¯cant. Table 1 lists the variance (Mean� Standard Deviation
(SD)) of the signi¯cant nine features for the two groups. It can be seen that these
features have a p-value of less than 0.0001. Subsequently, PCA was employed on
these features (after 0-1 normalization), and the top six principal components were
determined. The top six principal components accounted for 95% of the variance.
Table 2 presents the range of variance captured by these principal components for
the normal and CAD groups.
5.2. Classi¯cation results
The eight classi¯cation techniques that were described in the previous section were
evaluated on the selected features to compare the performance of these techniques.
We employed ¯ve-fold cross validation to select training and testing datasets. The
classi¯ers studied were BN, NB, LibSVM, ANN-MLP, RBF, SMO, random forest,
and CART. In Table 3, we list the settings of parameters for each classi¯cation
method.
We evaluated the performance of classi¯ers using the overall classi¯cation accu-
racy and the true positive rate (TPR) for diagnosing CAD. Accuracy is the pro-
portion of the correctly classi¯ed samples from the total number of samples. TPR or
sensitivity is the probability that the classi¯er will predict a positive result for a
patient with CAD. In Figs. 5 and 6, we illustrate the classi¯cation accuracies and
TPR of the CAD recognition obtained using eight classi¯ers for easy comparison. We
consider those classi¯cation methods that have both evaluation metrics ranking in
Table 3. Parameters used in classi¯ers.
Methods Parameters used
BN Estimator algorithm: Simple Estimator with alpha¼ 0.5; Algorithm for searching
network structure: Hill climbingNB Minimum number of instances: 0; Use Kernel estimator: No; Use supervised
discretization: No
LibSVM SVM type: C-SVC; Kernel type: Radial basis function: Exp (-gamma*ju� vj2); Costparameter: 1; Kernel degree: 3; Weights of classes: Neutral (1)
ANN-MLP Hidden layers: 4; Learning rate: 0.3; Momentum applied to the weights during
updating: 0.2; Normalize the class to be between �1 andþ 1; Seed used to initialize
the random number generator: 0; Number of epochs to train through: 500; Per-centage size of the validation set: 0; Validation threshold to terminate validation
test: 20
RBF Clustering seed: 1; Minimum standard deviation: 0.1; Number of clusters: 2; Ridgevalue: 1.0e-8
SMO Kernel: polynomial; Complexity parameter C: 1.0; Epsilon for round-o® error: 1.0e-12
Random Forest Maximum tree depth: unlimited; Number of trees: 10; Random number seed: 1
CART Heuristic; Minimal number of observations at the terminal nodes: 2; Number of folds inthe internal cross-validation: 5; Random number seed: 1; Percentage of the training
set size: 1; Pruning decision: 1SE rule minimal cost-complexity pruning: yes
S. Dua et al.
1240017-12
J. M
ech.
Med
. Bio
l. D
ownl
oade
d fr
om w
ww
.wor
ldsc
ient
ific
.com
by W
SPC
on
08/2
2/12
. For
per
sona
l use
onl
y.

the top three in the tested classi¯cation methods to be the best. It is evident from the
Figs. 5 and 6 that the ANN�MLP presents the highest classi¯cation accuracy of
89.5%, followed by the NB classi¯er (86.7%). The TP rate is also high for both
classi¯ers (90.2%).
6. Discussion
Babaoglu et al. employed binary particle swarm optimization (BPSO) and genetic
algorithm techniques to select useful features from exercise stress testing data
Fig. 6. TPR for the CAD class: 1: BN; 2: NB; 3: LibSVM; 4: ANN-MLP; 5: RBF; 6: SMO; 7: random
forest; 8: CART.
Fig. 5. Classi¯cation accuracies: 1: BN; 2: NB; 3: LibSVM; 4: ANN-MLP; 5: RBF; 6: SMO; 7: randomforest; 8: CART.
Novel Classi¯cation of Coronary Artery Disease Using Heart Rate Variability Analysis
1240017-13
J. M
ech.
Med
. Bio
l. D
ownl
oade
d fr
om w
ww
.wor
ldsc
ient
ific
.com
by W
SPC
on
08/2
2/12
. For
per
sona
l use
onl
y.

obtained from 480 patients.40 Using SVM as a classi¯er, they obtained 81.46% ac-
curacy (for the BPSO technique) in CAD detection. In another study by the same
group, the authors used PCA for dimension reduction on the same dataset and
obtained an accuracy of 79.71% with the SVM classi¯er.41 However, as indicated
earlier, exercise stress testing has its own limitations and hence, obtaining a good
representative dataset using this test is di±cult.
Karimi et al. presented a technique using wavelet analysis and ANNs for analyzing
heart sounds to detect CAD.42 They detected normal classes with 90% accuracy and
CAD classes with 85% accuracy. Arafat et al. studied the use of combined uncertainty
methods (fuzzy and probabilistic) in the diagnosis of CAD using ECG stress signals,
and they observed an accuracy of around 80%.43 Zhao and Ma proposed a technique
based on the empirical mode decomposition-teager energy operator for feature ex-
traction and back propagation neural network as the classi¯er to detect CAD from
heart murmur signals, and they achieved an accuracy of roughly 85%.44
Several studies have also been conducted to evaluate the e±ciency of nonlinear
features in detecting CAD. The normal fractal properties of RR interval dynamics
that were analyzed using DFA were found to be decreased in CAD patients.45 Such
decreased values were also observed in our study (� and D have low values in the
case of CAD patients, as indicated in Table 1). A study by Antanavicius et al. on
the nonlinear dynamics analysis of ECG signals indicated that recurrences per-
centage, mutual information, fractal dimension, and embedding dimension error
were good quantitative descriptors of °uctuations that were signi¯cantly di®erent in
108 CAD patients and 54 patients without CAD.46 Nonlinear features such as the
scaling exponent, correlation dimension, entropy measures, and various prediction/
approximation methods were proposed to di®erentiate between patients with CAD
and healthy subjects in addition to the traditional measures of HRV.47�49 Some of
these features that were extracted in our work were also found to be signi¯cantly
di®erent (Table 1).
The ECG signals obtained from three recumbent positions, the supine, left lateral,
and right lateral positions have been studied.50�52 In one such study, Kim et al.
developed a multi-parametric measure for classifying normal subjects (20 cases) from
patients su®ering from two types of CAD (64 cases) ��� angina pectoris (AP) and
acute coronary syndrome (ACS).50 The measure was constructed using multiple
discriminant analysis of several linear and nonlinear parameters extracted from the
HRV signal. The authors obtained accuracies of 75.0%, 72.5%, and 84.6% for the
control, AP, and ACS groups, respectively. In a similar study, Lee et al.51 used
several linear and nonlinear HRV parameters in classi¯ers to detect CAD. In a test
group of 99 CAD patients and 94 normal patients, the authors found that the SVM
classi¯er presented the highest accuracy (almost 90%) using features from all three
recumbent positions. In a similar study performed by the same group,52 the highest
classi¯cation accuracy (88.33%) was obtained using the linear and nonlinear HRV
features (extracted from the ECG signals obtained in the three recumbent positions)
and the SVM classi¯er. Here, the authors classi¯ed normal cases from AP and ACS
S. Dua et al.
1240017-14
J. M
ech.
Med
. Bio
l. D
ownl
oade
d fr
om w
ww
.wor
ldsc
ient
ific
.com
by W
SPC
on
08/2
2/12
. For
per
sona
l use
onl
y.

categories, unlike in their earlier study,51 in which they had only classi¯ed normal
and CAD groups. In 2008,53 this group included the carotid arterial wall thickness54
in addition to HRV features and observed a classi¯cation accuracy of around 85% to
90% for the SVM classi¯er.
A literature study, such as the one summarized above, indicated that (1) the
highest accuracy of almost 90% was obtained using techniques that used the ECG
signals obtained in three recumbent positions, thereby increasing the processing time
and energy, (2) some techniques used the exercise stress testing data, which cannot
be obtained from patients of lower level of physical ¯tness, and (3) it is necessary to
develop a technique that uses the general recorded ECG signals and still presents
equal or higher accuracies than the existing methods. Therefore, we developed a
technique that utilized the general ECG signals, extracted HRV based nonlinear
features, and used the signi¯cant features to evaluate several classi¯ers. We obtained
89.5% accuracy for detecting CAD using the simple MLP classi¯er. This accuracy is
almost equal to the highest accuracy recorded in the literature. In addition, the
proposed technique overcomes the dataset limitations indicated in points (1) and (2)
above. Thus, the proposed technique demonstrates the powerful capability of the
nonlinear features and the simple PCA technique in di®erentiating normal from
CAD patients. Our future work would include improving our current methodology to
determine features and classi¯ers that can di®erentiate various sub-groups of CAD,
namely, angina pectoris (AP) and acute coronary syndrome (ACS).
7. Conclusions
CAD is a serious illness that has a high mortality rate and does not present itself at
its early stages. Therefore, simple, cost-e®ective, non-invasive, and e±cient diag-
nostic techniques can be used to detect this disease in its early stages in a wide
population. Kurt et al. used several demographic and medical history-based para-
meters in several classi¯ers to detect the presence of CAD.55 On analyzing their
technique in 1,245 subjects, they obtained an accuracy of 79.1% and an AUC value of
0.783 for the multilayer perceptron classi¯er. Other studies on CAD detection are
based on applying data-mining techniques on various heart-related signals. In this
paper, a technique based on HRV signals derived from ECG signals was presented.
ECG acquisition is a commonly available technique, and calculating the HRV signals
is fast and simple. From these HRV signals, we extracted simple nonlinear features
and subjected them to PCA, which is another easily implementable statistical
method that can determine the projections, as in this work. We observed that when
these projections are used in a commonly available multilayer perceptron classi¯er, a
classi¯cation accuracy that is higher than those observed in published CAD studies
was obtained. We feel that the technique is of clinical signi¯cance as it can be easily
implemented and provides good classi¯cation accuracy. Future work may include
researching other features for improving the accuracy and conducting studies on a
wider range of the population.
Novel Classi¯cation of Coronary Artery Disease Using Heart Rate Variability Analysis
1240017-15
J. M
ech.
Med
. Bio
l. D
ownl
oade
d fr
om w
ww
.wor
ldsc
ient
ific
.com
by W
SPC
on
08/2
2/12
. For
per
sona
l use
onl
y.

Acknowledgements
This research was supported in part by U.S. National Science Foundation (NSF)
award numbers EPS-0701491 and EPS-1003897.
References
1. Heart Disease Facts, Retrieved February 20, 2012, from http://www.cdc.gov/heart-disease/facts.htm.
2. Silber EN, Katz LN, Heart Disease, New York: Macmillan Publishing Co., 1975.3. San Roman JA, Vilacosta I, Castillo JA, Rollan MJ, Hernandez M, Peral V, Garcimartín
I, de la Torre MM, Fern�andez-Avil�es F, Selection of the optimal stress test for thediagnosis of coronary artery disease, Heart 80(4):370�376, 1998.
4. Isler Y, Kuntalp M, Combining classical HRV indices with wavelet entropy measuresimproves to performance in diagnosing congestive heart failure, Comput Biol Med37:1502�1510, 2007.
5. Schumann A, Wessel N, Schirdewan A, Osterziel KJ, Voss A, Potential of featureselection methods in heart rate variability analysis for the classi¯cation of di®erentcardiovascular diseases, Stat Med 21(15):2225�2242, 2002.
6. Acharya UR, Kannathal N, Krishnan SM, Comprehensive analysis of cardiac health usingheart rate signals, Physiol Meas 25:1139�1151, 2004.
7. Gujjar AR, Sathyaprabha TN, Nagaraja D, Thennarasu K, Pradhan N, Heart ratevariability and outcome in acute severe stroke: Role of power spectral analysis, NeurocritCare 1(3):347�354, 2004.
8. Carney RM, Freedland KE, Stein PK, Skala JA, Ho®man P, Ja®e AS, Change in heartrate and heart rate variability during treatment of depression in patients with coronaryartery disease, Psychosom Med 62:639�647, 2000.
9. Horsten M, Ericson M, Perski A, Wamala SP, Gusta®son KS, Gomer KO, Psychologicalfactors and heart rate variability in healthy women, Psychosom Med 61(1999):49�57,1997.
10. Chourasia V, Tiwari A, Fetal heart rate variability analysis from phonocardiographicrecordings, J Mech Med Biol 11(5):1315�1331, 2011.
11. Eckberg DL, Drabinsky M, Braunwald E, Defective cardiac parasympathetic control inpatients with heart disease, N Engl J Med 283:877�883, 1971.
12. Airaksinen KEJ, Ikäheimo MJ, Linnaluoto MK, Niemelä M, Takkunen JT, Impairedvagal heart rate control in coronary artery disease, Br Heart J 58:592�597, 1987.
13. Huikuri HV, Niemelä MJ, Ojala S, Rantala A, Ikäheimo A, Airaksinen KEJ, Circadianrhythms of frequency domain measures of heart rate variability in healthy subjects andpatients with coronary artery disease: E®ects of arousal and upright posture, Circulation90:121�126, 1994.
14. Hayano J, Sakakibara Y, Yamada A, Ohte N, Fujinami T, Yokoyama K, Watanabe Y,Takata K, Decreased magnitude of heart rate spectral components in coronary arterydisease: Its relation to angiographic severity, Circulation 81:1217�1224, 1990.
15. Lavoie KM, Fleet RP, Laurin C, Arsenault A, Miller SB, Bacon SL, Heart rate variabilityin coronary artery disease patients with and without panic disorder, Psychiatry Res128(3):289�299, 2004.
16. Nikolopoulos S, Alexandridi A, Nikolakeas S, Manis G, Experimental analysis of heartrate variability of long-recording electrocardiograms in normal subjects and patients withcoronary artery disease and normal left ventricular function, J Biomed Inf 36:202�217,2003.
S. Dua et al.
1240017-16
J. M
ech.
Med
. Bio
l. D
ownl
oade
d fr
om w
ww
.wor
ldsc
ient
ific
.com
by W
SPC
on
08/2
2/12
. For
per
sona
l use
onl
y.

17. Bigger JT Jr., Fleiss JL, Steinman RC, Rolnitzky LM, Schneider WJ, Stein PK, RRvariability in healthy, middle-aged persons compared with patients with chronic coronaryheart disease or recent acute myocardial infarction, Circulation 91:1936�1943, 1995.
18. Zia MK, Gri®el B, Semmlow J, Fridman V, Saponieri C, Noise detection and eliminationfor improved acoustic detection of coronary artery disease, J Mech Med Biol12(2):1240007 (17 pp), 2012.
19. Pan J, Tompkins WJ, A real-time QRS detection algorithm, IEEE Trans Biomed Eng32(3):230�236, 1985.
20. Wariar R, Eswaran C, Integer coe±cient bandpass ¯lter for the simultaneous removalof baseline wander, 50 and 100 Hz interference from the ECG, Med Biol Eng Comput29(3):333�336, 1991.
21. Webber Jr. CL, Zbilut JP, Dynamical assessment of physiological systems and statesusing recurrence plot strategies, J Appl Physiol 76:965�973, 1994.
22. Zbilut JP, Webber Jr. CL, Embeddings and delays as derived from quanti¯cation ofrecurrence plots, Phys Lett A 171:199�203, 1992.
23. Marwan N, Wessel N, Meyerfeldt U, Schirdewan A, Kurths J, Recurrence plot basedmeasures of complexity and its application to heart rate variability data, Phys Rev E66(2):026702, 2002.
24. Tulppo MP, Makikallio TH, Takala TES, Seppanen T, Huikuri HV, Quantitative beat-to-beat analysis of heart rate dynamics during exercise, Am J Physiol 271:H244�H252,1996.
25. Huikuri HV, Makikallio TH, Peng CK, Goldberger AL, Hintze U, Moller M, Fractalcorrelation properties of R-R interval dynamics and mortality in patients with depressedleft ventricular function after an acute myocardial infarction, Circulation 101:47�53,2000.
26. Acharya UR, Joseph PK, Kannathal N, Lim CM, Suri JS, Heart rate variability: Areview, J Med Biol Eng Comput 44(12):1031�1051, 2006.
27. Pincus SM, Approximate entropy as a measure of system complexity, Proc Nat Acad Sci88:2297�2301, 1991.
28. Richman JS, Moorman JR, Physiological time-series analysis using approximate entropyand sample entropy, Am J Physiol 278(6):H2039�H2049, 2000.
29. Shannon CE, A mathematical theory of communication, Bell Syst Tech J 27:379�423,1948.
30. Fell J, Roschke J, Discrimination of sleep stages: A comparison between spectral andnonlinear EEG measures, Electroencephalogr Clin Neurophysiol 98(5):401�410, 1966.
31. Kannathal N, Lim CM, Acharya UR, Sadasivan PK, Entropies for detection of epilepsy inEEG, Comput Methods Programs Biomed 80(3):187�194, 2005.
32. Ian HW, Eibe F, Data Mining: Practical Machine Learning Tools and Techniques.Morgan Kaufmann, San Francisco, CA, 2005.
33. Solares C, Sanz AM, Di®erent Bayesian network models in the classi¯cation of remotesensing images, Intelligent Data Engineering and Automated Learning ��� IDEAL, LectNotes Comput Sci 4881:10�16, 2007.
34. Han J, Kamber M, Pei J, Data Mining: Concepts and Techniques, Morgan Kaufmann,San Francisco, CA, 2005.
35. Chowriappa P, Dua S, Kanno J, Thompson HW, Protein structure classi¯cation based onconserved hydrophobic residues, IEEE/ACM Trans Comput Biol Bioinf 6(4):639�651,2009.
36. Platt J, Fast Training of Support Vector Machines using Sequential Minimal Optimi-zation, in Schoelkopf B, Burges C, Smola A (eds.), Adv Kernel Methods ��� SupportVector Learning, MIT Press, Cambridge, MA, 1999.
Novel Classi¯cation of Coronary Artery Disease Using Heart Rate Variability Analysis
1240017-17
J. M
ech.
Med
. Bio
l. D
ownl
oade
d fr
om w
ww
.wor
ldsc
ient
ific
.com
by W
SPC
on
08/2
2/12
. For
per
sona
l use
onl
y.

37. Platt J, Machines using sequential minimal optimization, in Schoelkopf B, Burges C,Smola A (eds.), Adv Kernel Methods ��� Support Vector Learning, MIT Press,Cambridge, MA, 1999.
38. Wasserman PD, Advanced Methods in Neural Computing, Van Nostrand Reinhold,New York, 1993.
39. Qi Y, Seetharaman JK, Joseph ZB, Random forest similarity for protein-protein interactionprediction for multiple sources, Pac Symp Biocomput 10:531�542, 2005.
40. Babaoglu I, Findik O, Bayrak M, E®ects of principle component analysis on assessment ofcoronary artery diseases using support vector machine, Expert Syst Appl 37:2182�2185,2010.
41. Babaoglu I, Findik O, Ulker E, A comparison of feature selection models utilizing binaryparticle swarm optimization and genetic algorithm in determining coronary artery diseaseusing support vector machine, Expert Syst Appl 37:3177�3183, 2010.
42. Karimi M, Amirfattahi R, Sadri S, Marvasti SA, Noninvasive detection and classi¯cationof coronary artery occlusions using wavelet analysis of heart sounds with neural networks,Med Appl Signal Proc 3rd IEE International Seminar, pp. 117�120, 2005.
43. Arafat S, Dohrmann M, Skubic M, Classi¯cation of coronary artery disease stress ECGsusing uncertainty modeling, Comput Int Methods Appl, 2005.
44. Zhao Z, Ma C, An intelligent system for noninvasive diagnosis of coronary artery diseasewith EMD-TEO and BP neural network, in Int Workshop on Education Technology andTraining and International Workshop on Geoscience and Remote Sensing, 2:631�635,2008.
45. Karamanos K, Nikolopoulos S, Manis G, Alexandridi A, Hizanidis K, Nikolakeas S, Blockentropy analysis of heart rate variability signals, Int J Bifurcation Chaos 16(7):2093�2101,2006.
46. Antanavicius K, Bastys A, Bluzas J, Gargasas L, Kaminskiene S, Urbonaviciene G,Vainoras A, Nonlinear dynamics analysis of electrocardiograms for detection of coronaryartery disease, Comput Methods Programs Biomed 92(2):198�204, 2008.
47. Manis G, Nikolopoulos S, Alexandridi A, Davos C, Assessment of the classi¯cationcapability of prediction and approximation methods for HRV analysis, Comput Biol Med37:642�654, 2007.
48. Laitio TT, Huikuri HV, Makikallio TH, Jalonen J, Kentala ESH, Helenius H, Pullisaar O,Hartiala J, Seheinin H, The breakdown of fractal heart rate dynamics predicts prolongedpostoperative myocardial ischemia, Anesth Analg 98:1239�1244, 2004.
49. Qtsuka K, Corn�elissen G, Halberg F, Circadian rhythmic fractal scaling of heart ratevariability in health and coronary artery disease, Clin Cardiol 20(7):631�638, 2009.
50. Kim W, Jin S, Park Y, Choi H, A study on development of multi-parametric measure ofheart rate variability diagnosing cardiovascular disease, IFMBE Proc 14(22):3480�3483,2007.
51. Lee HG, Noh KY, Ho K, Mining biosignal data: Coronary artery disease diagnosis usinglinear and nonlinear features of HRV, emerging technologies in knowledge discovery anddata mining, Lect Notes Comput Sci 4819:218�228, 2009.
52. Lee HG, KimWS, Noh KY, Shin JH, Yun U, Ryu KH, Coronary artery disease predictionmethod using linear and nonlinear feature of heart rate variability in three recumbentpostures, Inf Syst Front 11:419�431, 2009.
53. Lee HG, Noh KY, Ryu KH, A data mining approach for coronary heart diseasepredictionusing HRV features and carotid arterial wall thickness, Int Conf Biomed Eng Inf1:200�206, 2008.
S. Dua et al.
1240017-18
J. M
ech.
Med
. Bio
l. D
ownl
oade
d fr
om w
ww
.wor
ldsc
ient
ific
.com
by W
SPC
on
08/2
2/12
. For
per
sona
l use
onl
y.

54. Chen C, Liaw A, Breiman L, Using Random Forest to Learn Imbalanced Data, Berkley,CA: Department of Statistics, University of Berkeley, Technical report tr-666, 2004.
55. Kurt I, Ture M, Kurum T, Comparing performances of logistic regression, classi¯cationand regression tree, and neural networks for predicting coronary artery disease, ExpertSyst Appl 34:366�374, 2008.
Novel Classi¯cation of Coronary Artery Disease Using Heart Rate Variability Analysis
1240017-19
J. M
ech.
Med
. Bio
l. D
ownl
oade
d fr
om w
ww
.wor
ldsc
ient
ific
.com
by W
SPC
on
08/2
2/12
. For
per
sona
l use
onl
y.

Journal of Mechanics in Medicine and BiologyThe first Journal to Publish Original Research Articles in ALL Fields of Mechanics in Medicine and BiologyPrev.
This Journal
Print ISSN: 0219-5194 Online ISSN: 1793-6810
Online Ready
Current Issue
Available Issues
Journal Information
Aims & ScopeEditorial BoardSample IssueAbstracted & Indexed inPrice InformationOnline Order FormContact JMMB
Authors
Note to authorsGuidelines for ContributorsWorldSciNet OPEN ACCESSEthical Policy
Announcement
Impact Factor 2012
We are happy to announce that JMMB's IF has increased by 0.209, from 0.468 in 2011 to 0.758 in 2012
Add to Favorites | Citation Alert | View Abstracts | Send to Citation Mgr
Select All
Site Tools
Recommend to library Alert me on new issues Add journal to favorites
(What is this?)
Related
Related BooksBiomechanical Systems TechnologyAn Introductory Text To Bioengineering
Related LinksMedical and Life SciencesJournalsBiomedical Engineering BooksAsia Pacific Biotech News
THE IMPACT OF THE NUMBER OF TEARS IN PATIENT-SPECIFIC STANFORD TYPE B AORTIC DISSECTING ANEURYSM: CFD SIMULATION WAN NAIMAH WAN AB NAIM, POO BALAN GANESAN, ZHONGHUA SUN, KAHAR OSMAN, EINLY LIMJournal of Mechanics in Medicine and Biology Online ReadyAbstract | PDF (2040 KB) | PDF Plus (488 KB)
EXPERIMENTAL METHODS FOR THE BIOMECHANICAL INVESTIGATION OF THE HUMAN SPINE: A REVIEW NICOLA BRANDOLINI, LUCA CRISTOFOLINI, MARCO VICECONTIJournal of Mechanics in Medicine and Biology Online ReadyAbstract | PDF (811 KB) | PDF Plus (766 KB)
A PARAMETRIC NUMERICAL INVESTIGATION OF LOCAL HAEMODYNAMICS IN THE END-TO-SIDE ANASTOMOSIS OF CERVICAL-TO-PETROUS BYPASS BASED ON REAL GEOMETRY OF INTERNAL CAROTID ARTERY GAO ZHEN, YANG LIN, LU GANG, DAI PEI-DONG, ZHANG XIAO-LONG, ZHANG TIAN-YU, CHI FANG-LUJournal of Mechanics in Medicine and Biology Online ReadyAbstract | PDF (1423 KB) | PDF Plus (882 KB)
OPTIMAL RESPIRATORY CONTROL SIMULATION AND COMPARATIVE STUDY OF HYPERCAPNIC VENTILATORY RESPONSES TO EXTERNAL DEAD SPACE LOADING SHYAN-LUNG LIN, NAI-REN GUO, TSUNG-CHI CHENJournal of Mechanics in Medicine and Biology Online ReadyAbstract | PDF (1102 KB) | PDF Plus (899 KB)
EFFECT OF ALUMINA ADDITION ON MECHANICAL BEHAVIOR AND FRACTURE PROPERTIES OF ALL-CERAMICS ZIRCONIA DENTAL MATERIALS DONGJIAO ZHANG, DAWEI SONG, YUNMAO LIAO, XINMIN CHEN, MIN WANGJournal of Mechanics in Medicine and Biology Online ReadyAbstract | PDF (1531 KB) | PDF Plus (600 KB)
EXPERIMENTAL VALIDATION OF A MEAN FILED MODEL OF MINERALIZED COLLAGEN FIBER ARRAYS AT TWO LEVELS OF HIERARCHY EWA M. SPIESZ, ANDREAS G. REISINGER, PAUL ROSCHGER, PHILIPPE K. ZYSSETJournal of Mechanics in Medicine and Biology Online ReadyAbstract | PDF (2090 KB) | PDF Plus (286 KB)
PASSIVE COUNTERPULSATION: BIOMECHANICAL RATIONALE AND CLINICAL VALIDATION IVAN CORAZZA, GIOVANNI MELANDRI, SAMUELE NANNI, EMANUELA MARCELLI, LAURA CERCENELLI, DAVID BIANCHINI, FABIO VAGNARELLI, ROMANO ZANNOLIJournal of Mechanics in Medicine and Biology Vol. 13, No. 05Abstract | PDF (713 KB) | PDF Plus (257 KB)
PROGRESS IN PHYSIOLOGICAL ACOUSTICS FUYIN MA, JIU HUI WU, HAIYUN HOUJournal of Mechanics in Medicine and Biology Vol. 13, No. 05Abstract | PDF (753 KB) | PDF Plus (255 KB)
EFFECT OF FLOW ACCELERATION ON DEFORMATION AND ADHESION DYNAMICS OF CAPTURED CELLS L. HE, Z. Y. LUO, F. XU, B. F. BAIJournal of Mechanics in Medicine and Biology Vol. 13, No. 05Abstract | PDF (2042 KB) | PDF Plus (451 KB)
BONE CELLS UNDER MICROGRAVITY PENG SHANG, JIAN ZHANG, AIRONG QIAN, JINGBAO LI, RUI MENG, SHENGMENG DI, LIFANG HU, ZHONGZE GUJournal of Mechanics in Medicine and Biology Vol. 13, No. 05Abstract | PDF (665 KB) | PDF Plus (308 KB)
PREFACE Feng Xu, Tian Jian Lu, Romano ZannoliJournal of Mechanics in Medicine and Biology Vol. 13, No. 05Abstract | PDF (40 KB) | PDF Plus (41 KB)
BIOMECHANICAL APPROACH TO THE CLINICAL TREATMENT OF PULMONARY ARTERIAL HYPERTENSION
Most Recent Most Read Most Cited Most Emailed
11/26/2013http://www.worldscientific.com/worldscinet/jmmb

Home All Publications All Journals Journal of Mechanics in Medicine and Biology JMMB Aims and Scope
Journal of Mechanics in Medicine and BiologyThe first Journal to Publish Original Research Articles in ALL Fields of Mechanics in Medicine and Biology
Imperial College Press | Global Publishing | Asia-Pacific Biotech News | Innovation MagazineLabcreations Co | World Century | WS Education | Meeting Matters | National Academies Press
Copyright© 2013 World Scientific Publishing Co. All rights reserved. Powered by Atypon® Literatum
> > > >
Prev.
This Journal
Print ISSN: 0219-5194 Online ISSN: 1793-6810
Online Ready
Current Issue
Available Issues
Journal Information
Aims & ScopeEditorial BoardSample IssueAbstracted & Indexed inPrice InformationOnline Order FormContact JMMB
Authors
Note to authorsGuidelines for ContributorsWorldSciNet OPEN ACCESSEthical Policy
Aims & Scope
This journal has as its objective the publication and dissemination of original research (even for "revolutionary concepts that contrast with existing theories" & "hypothesis") in all fields of engineering-mechanics that includes mechanisms, processes, bio-sensors and bio-devices in medicine, biology and healthcare. The journal publishes original papers in English which contribute to an understanding of biomedical engineering and science at a nano- to macro-scale or an improvement of the methods and techniques of medical, biological and clinical treatment by the application of advanced high technology.
Journal's Research Scopes/Topics Covered (but not limited to):
• Artificial Organs, Biomechanics of Organs.• Biofluid Mechanics, Biorheology, Blood Flow Measurement Techniques, Microcirculation,
Hemodynamics.• Bioheat Transfer and Mass Transport, Nano Heat Transfer.• Biomaterials.• Biomechanics & Modeling of Cell and Molecular.• Biomedical Instrumentation and Biosensors.• Biomedical Signal Processing Techniques.• Bio-Microelectromechanical Systems, Microfluidics.• Bio-Nanotechnology and Clinical Application.• Bird and Insect Aerodynamics.• Cardiovascular/Cardiac mechanics.• Cardiovascular Systems Physiology/Engineering.• Cellular and Tissue Mechanics/Engineering.• Computational Biomechanics/Physiological Modelling, Systems Physiology.• Clinical Biomechanics.• Hearing Mechanics.• Human Movement and Animal Locomotion.• Implant Design and Mechanics.• Mathematical modeling.• Mechanobiology of Diseases.• Mechanics of Medical Robotics.• Muscle/Neuromuscular/Musculoskeletal Mechanics and Engineering.• Neural- & Neuro-Behavioral Engineering.• Orthopedic Biomechanics.• Reproductive and Urogynecological Mechanics.• Respiratory System Engineering.• Sports Mechanics, Joint Mechanics, RSA, Motion Analysis.• Therapeutic Physics and Rehabilitation Engineering.• Other topics that implicate 'mechanics' in medicine, biology and healthcare.
Papers may be theoretical (including computational), experimental or both. The journal will publish occasional Book Reviews, Letter to Editors, Technical Notes, Rapid Communications as well as Review Papers, of advance in a specific aspect of engineering-mechanics research in medicine, biology and healthcare. We welcome 'First paper's in answering the waiting expectation of our young colleagues/community. Special issues with cutting-edge, new frontiers, niche topics and in collaboration with international conferences/symposia are also welcome.
Site Tools
Recommend to library Alert me on new issues Add journal to favorites
(What is this?)
5 Most Read Articles
• MATERIAL PROPERTIES OF ADULT RAT SKULLVol. 11 , Iss. 05
• EFFECTS OF MOBILE PHONE RADIATION ON CARDIAC HEALTHVol. 11 , Iss. 05
• NUMERICAL SIMULATION OF CELL ADHESION AND DETACHMENT IN MICROFLUIDICSVol. 13 , Iss. 01
• CLINICAL USE OF FUNCTIONAL ELECTRICAL STIMULATION FOR CORRECTION OF FOOT DROP: A COMPARISON BETWEEN SUBACUTE AND CHRONIC STROKE PATIENTSVol. 11 , Iss. 05
• BIOCOMPATIBILITY AND MECHANICAL PROPERTY OF LARS ARTIFICIAL LIGAMENT WITH TISSUE INGROWTHVol. 12 , Iss. 01
See more...
Related
Related BooksBiomechanical Systems TechnologyAn Introductory Text To Bioengineering
Related LinksMedical and Life SciencesJournalsBiomedical Engineering BooksAsia Pacific Biotech News
11/26/2013http://www.worldscientific.com/page/jmmb/aims-scope
Copyright © 2022 FDOKUMEN