Reframing the “Sea”: A Critical Study of Toru Takemitsu’s Toward the Sea
Upload
independentCategory
view
3download
0
ARTICLE IN PRESS
0967-0637/$ - see
doi:10.1016/j.ds
�CorrespondiAires, Argentina
E-mail addre
Deep-Sea Research I 54 (2007) 1815–1840
www.elsevier.com/locate/dsri
Northwestern Weddell Sea deep outflow into the Scotia Seaduring the austral summers of 2000 and 2001 estimated by
inverse methods
Barbara C. Francoa,�, Mauricio M. Mataa, Alberto R. Piolab,c, Carlos A.E. Garciaa
aDepartamento de Fısica, Fundac- ao Universidade Federal do Rio Grande, Caixa Postal 474, 96201-900 Rio Grande, RS, BrazilbDepartamento Oceanografıa, Servicio de Hidrografıa Naval, Av. Montes de Oca 2124, C1270ABV Buenos Aires, ArgentinecDepartamento de Ciencias de la Atmosfera y los Oceanos, FCEN, Universidad de Buenos Aires, Buenos Aires, Argentine
Received 23 October 2006; received in revised form 14 June 2007; accepted 20 June 2007
Available online 26 June 2007
Abstract
The northward outflow of cold, dense water from the Weddell Sea into the world ocean basins plays a key role in
balancing the global heat budget. We estimate the geostrophic flow patterns in the northwestern Weddell Sea using box
inverse methods applied to quasi-synoptic hydrographic data collected during the Brazilian DOVETAIL 2000 and 2001
austral summer cruises. The analysis is focused on the variations of the deep Weddell Sea outflow into the Scotia Sea
within boxes that bound the main deep gaps over the South Scotia Ridge. To determine the geostrophic volume transports
in each box, mass, salt, and heat are conserved within neutral density layers that are not in contact with the atmosphere.
Implementing the inverse model and using property anomaly equations weighted by the flow estimate uncertainty our
results are consistent with those reported in the literature. A bottom triangle extrapolation method is introduced, which
improves the estimated property fluxes through hydrographic sections. In the austral summer of 2000 the transports of
Weddell Sea Deep Water (WSDW) through the Philip Passage, Orkney Passage, and southwestern Bruce Passage are
0.0170.01, 1.1570.33, and 1.0370.23 Sv (1 Sv ¼ 106m3 s�1, 40 is northward), respectively. After extrapolation within
bottom triangles these transports increase to 0.1270.03, 3.4871.81, and 1.2072.16 Sv. Analysis of the hydrographic data
reveal distinct oceanographic conditions over the Philip Passage region, with evidence of mesoscale meanders, warmer and
saltier Warm Deep Water (WDW) and colder WSDW observed in 2001 than in 2000. Despite these differences the WSDW
transport does not present a significant variation between 2000 and 2001. The WSDW transports through the Philip
Passage in 2001 are 0.01270.001 and 0.11370.001 Sv after extrapolation within bottom triangles. The circulation derived
from the inversion in the austral summer of 2001 suggests a sharp weakening of the barotropic cyclonic flow in the Powell
Basin, which may be due to northerly and northeasterly winds associated with an atmospheric low-pressure center located
west of the Antarctic Peninsula. We suggest that similar variations in atmospheric forcing may explain changes in the
intensity of the cyclonic flow observed in the northwestern Weddell Sea and Powell Basin.
r 2007 Elsevier Ltd. All rights reserved.
Keywords: Northwestern weddell sea; Weddell sea deep water; Inverse methods; DOVETAIL; Deep outflow variations
front matter r 2007 Elsevier Ltd. All rights reserved.
r.2007.06.003
ng author. Departamento Oceanografıa, Servicio de Hidrografıa Naval, Av. Montes de Oca 2124, C1270ABV, Buenos
. Tel.: +5411 43012590.
ss: [email protected] (B.C. Franco).
ARTICLE IN PRESSB.C. Franco et al. / Deep-Sea Research I 54 (2007) 1815–18401816
1. Introduction
The Antarctic region represents an importantscientific record of past climate and its variationsthrough the evolutionary history of the Earth.Formation, sinking, and northward transport ofdeep and bottom waters in the Southern Ocean playa key role in the global thermohaline circulation.Dense waters originating in the Southern Oceanspread in the ocean basins further north andcontribute to the global heat and freshwaterbudgets. Recent studies suggest that part of thedense outflow exported from the Weddell Sea intothe Scotia Sea upwells because of the highturbulence in this region, which acts as a ‘blender’to mix ocean water masses. As the Scotia Sea maybe a significant contributor to the ‘missing mixing’required to balance the global ocean overturningcirculation (e.g. Heywood et al., 2002), it isimportant to better quantify how much dense deepwater enters the basin through the South ScotiaRidge, which separates the Weddell Sea from theScotia Sea. In addition, improved estimates of thenorthward transport of deep Southern Ocean waterswill lead to a better understanding of global climateand its variability.
Antarctic Bottom Water (AABW, yo0 1C) is thedensest water mass associated with the thermoha-line circulation of the world ocean (Orsi et al.,1999). AABW is produced in the southwestern andwestern Weddell Sea in the Atlantic sector and inthe Enderby Land coast and the western Ross Sea inthe Indian–Pacific sector (Whitworth et al., 1998).Based on the oceanic chlorofluoro-carbon budget,Orsi et al. (1999) diagnosed that 60% of thecircumpolar production of AABW occurs in theAtlantic sector. Several studies suggest that the deepoutflows from the Weddell Sea represent the mostimportant contributions to the ventilation of theoceans (Deacon, 1933; Reid and Lynn, 1971;Mantyla and Reid, 1983; Yaremchuk et al., 1998;Schroder and Fahrbach, 1999; Muench andHellmer, 2002). However, recent studies suggestthat the Ross Sea and Adelie Land coast are alsosignificant regions of AABW formation, possibly aslarge as the Weddell Sea (Rintoul, 1998; Bindoffet al., 2000).
Several studies attempted to map the outflowroutes of the deep and bottom waters formed in theWeddell Sea and to quantify the transports thatconnect the Weddell Sea to the world ocean basins(see Rintoul, 1991; Locarnini et al., 1993; Orsi et al.,
1999; Gordon et al., 2001; Naveira Garabato et al.,2002a, b; Matano et al., 2002; Schodlok et al., 2002).Estimates of Weddell Sea Deep Water (WSDW)outflow from the Weddell Sea through the SouthScotia Ridge are 6.771.7, 4.770.7, and 6.4 Sv(1 Sv ¼ 106m3 s�1, e.g. Naveira Garabato et al.,2002a; Schodlok et al., 2002). The bulk of thesetransports (4.370.6, 5.670.1 and 4.2 Sv, respec-tively) occur through the Orkney Passage, which isthe deepest gap on the ridge. Nevertheless, deepwater outflow estimates through some of the maindeep gaps of the ridge present a wide range ofvariation. For instance, WSDW outflow estimatesthrough the Philip Passage are 0.770.4, �0.170.3,and 2.2 Sv (e.g. Naveira Garabato et al., 2002a;Schodlok et al., 2002). These discrepancies can beattributed to sampling differences, methodologies offlow analysis, or real-time variability. Robertsonet al. (2002) pointed out that the warming trend ofWSDW, in recent decades is comparable to theglobal averaged surface-water warming (Levituset al., 2000). Their study suggests that the deepwater warming in the Weddell Sea has importantimplications for AABW formation, pack ice melt-ing, regional ocean–atmosphere heat transfer, andthe global thermohaline circulation. Given thedifferences in transport estimates through the SouthScotia Ridge and the reported variations in water-mass properties in the Weddell Sea (Fahrbach et al.,1998; Robertson et al., 2002; Schroder et al., 2002),we wish to further investigate the deep outflowthrough the ridge and its associated variability.
The oceanographic conditions of the Weddell Seawere the focus of several international programscarried out during the 1980s and 1990s (Gordon andHuber, 1984; Fahrbach et al., 1994; Gammelsrodet al., 1994). The Deep Ocean Ventilation ThroughAntarctic Intermediate Layers (DOVETAIL) Pro-gram (Muench and Hellmer, 2002) was designed tomap the routes and quantify the rates of deep andbottom waters recently ventilated in the WeddellSea and exported across the Weddell–Scotia Con-fluence. As part of the Brazilian contribution toDOVETAIL, two cruises were conducted during theaustral summers of 2000 and 2001 focused onmonitoring the variability of the thermohalinestructure in the northwestern Weddell Sea. Thiswork aims to describe the water mass characteristicsand circulation and to estimate the outflow of deepwaters through the main deep gaps of theSouth Scotia Ridge during summer 2000 and 2001.It provides the first snapshots of these deep
ARTICLE IN PRESSB.C. Franco et al. / Deep-Sea Research I 54 (2007) 1815–1840 1817
geostrophic transports from two subsequentsummers based on quasi-synoptic observations.
2. Weddell Sea general oceanography
The large-scale circulation in the Weddell Sea isdominated by the cyclonic Weddell Gyre (WG), thelargest subpolar cyclonic circulation in the SouthernOcean. Circumpolar Deep Water (CDW) flowingwithin the Antarctic Circumpolar Current (ACC) isentrained into the WG near a broad bathymetricdiscontinuity in the Southwest Indian Ridge locatedbetween 25 and 321E (Orsi et al., 1993). Afterentering the WG, CDW is transported westwardnear the Antarctic continent and is cooled andfreshened gradually by the contact with surface andshelf waters. The modified CDW is referred to asWarm Deep Water (WDW, e.g. Carmack andFoster, 1975; Foster and Carmack, 1976). Othermajor water masses within the WG are: AntarcticSurface Waters (AASW), WSDW, and Weddell SeaBottom Water (WSBW). The last two are varietiesof AABW: WSDW has �0.7 1Coyo0 1C, andWSBW has yo�0.7 1C. Dense water productionin the Weddell Sea is predominantly a result ofocean/atmosphere and/or ocean/ice-shelf heat andfreshwater exchanges. Different heat and saltexchange processes resulting from ocean/ice-shelfinteractions are presumably responsible for thedense water production, which occurs over thebroad southern and western continental shelves andshelf breaks (Foster and Carmack, 1976; Foldviket al., 1985). Once formed, the dense waters flowdown the adjoining continental slopes as densitycurrents. These dense ‘plumes’ interleave withambient deep water masses or form broad, sheet-like bottom layers that can be up to several hundredmeters thick and in places extend over most of thecontinental slope (Gordon et al., 1993; Gordon,1998). The dense sheet of bottom water flowsnorthward along the western rim of the WeddellSea, adjacent to the Antarctic Peninsula, and isfurther modified en route by additional sourcesalong the Peninsula, such as from the Larsen IceShelf (Fahrbach et al., 1995; Muench and Gordon,1995).
As these dense flows reach the northeastern tip ofthe Antarctic Peninsula, slope currents deeper thanabout 2000m are constrained primarily by bottomtopography to continue eastward along the south-ern flank of the South Scotia Ridge (e.g. Foster andCarmack, 1976; Orsi et al., 1993). Subject to
seasonal and interannual variations, the plumesplits, with part following a cyclonic path aroundPowell Basin and the remainder proceeding directlytoward the South Orkney Plateau (Gordon et al.,2001). A shallow fraction of this flow exits into theScotia Sea from the northern Powell Basin (Nowlinand Zenk, 1988), while a deeper fraction enters theScotia Sea through passages in the South ScotiaRidge east of the South Orkney Islands. This deeperfraction then flows either to the Atlantic Ocean(Locarnini et al., 1993) or eastward to the abyssalplain of the Indian Ocean (Naveira Garabato et al.,2002b). The coldest components, which representfractions of two different water types, WSDW andthe less dense part of WSBW, are prevented by thebottom topography from exiting the Weddell Basinacross the Ridge (Orsi et al., 1993, 1999). The SouthSandwich Trench is the only route sufficiently deepto allow northward penetration of denser portionsof WSBW. Nevertheless, the bottom topographyand the potential vorticity balance force most ofWSBW to recirculate back into the Weddell Sea(Georgi, 1981). Significant portions of modifiedshelf waters, near the Antarctic Peninsula, flownorthward, contribute to the ventilation of theBransfield Strait basins, and proceed to the South-west Pacific (Gordon et al., 2000). Thus, bottomtopography is a major factor in determiningthe pathways through which dense water, formedin the Weddell Sea, can escape into the Scotia Sea.The constraint applies throughout the water col-umn: the weak stratification in this region implies asignificant barotropic component that steers theflow along constant f/H contours, as required bypotential vorticity conservation (Muench andHellmer, 2002).
Export of AABW over the South Scotia Ridge hasbeen recently recognized as an important outflowfrom the Weddell Sea (Naveira Garabato et al.,2002b). In spite of its importance, because of thescattered sampling in the region, there are few andhighly variable estimates of these deep flows. Locar-nini et al. (1993) estimated a northward geostrophictransport of 1.5 Sv of the AABW (relative to 1500m)through the Orkney Passage, the deepest gap of theridge. Short-term current measurements north of theridge (Gordon et al., 2001) and the detection ofAABW flowing over the ridge at other locations(Locarnini et al., 1993; Naveira Garabato et al.,2002a) suggest that the above estimate may not berepresentative of the total AABW export over theridge. According to Naveira Garabato et al. (2002b),

ARTICLE IN PRESSB.C. Franco et al. / Deep-Sea Research I 54 (2007) 1815–18401818
the different exit routes of AABW from the WeddellSea are related to two distinct regional forms ofAABW, as reported by Carmack and Foster (1975):WSDW can flow over the ridge in regions where thedense WSBW cannot (e.g. Naveira Garabato et al.,2002a). Naveira Garabato et al. (2002b) analyzedAABW formation in the central Weddell Sea(WSDW/WSBW) and its export (as WSDW) overthe South Scotia Ridge. Using Lowered AcousticDoppler Profiler (LADCP) data they estimated a fulldepth geostrophic transport of 2277Sv over the ridgeand a WSDW outflow of 6.771.7Sv. When a boxinverse model using non-synoptic hydrographic datawas applied, these transports decreased to 776 and4.770.7Sv, respectively. The latter WSDW outflow isa factor of 4 larger than the 1.5 Sv estimated byLocarnini et al. (1993) and is closer to the 6.4 Svobtained by Schodlok et al. (2002) using a numericalsimulation. The inverse model diagnosed that9.773.7Sv of AABW (5.873Sv of WSDW and3.970.8Sv of WSBW) are formed in the Weddell Seaand about 48% of that flows across the ridge while theremainder flows eastward south of the ridge.
3. Data set and methods
3.1. Hydrographic data
During the austral summers of 2000 and 2001 twooceanographic cruises, referred to as ARXVIII andARXIX, were carried out in the northwesternWeddell Sea on board the RV ARY RONGEL.Hydrographic data were collected using a Sea-Bird
Fig. 1. Locations of the hydrographic stations occupied during the aust
boxes for ARXVIII (�, sections I to V, 2000) and ARXIX (%, sect
ETOPO5.
911plus CTD system and an SBE 32 carrouselequipped with 12 5-L bottles. Data processing andcalibration procedures are described in Schroder et al.(2002) for the ARXVIII cruise. In both cruises dataaccuracies were 2mK (temperature), 2 dbar (pres-sure), and 0.003 (salinity) (H. Hellmer, pers. comm.,2005). During both cruises, hydrographic sectionswere occupied bounding the main deep gaps over theSouth Scotia Ridge, and the height of the CTD abovethe bottom was monitored using a Datasonicaltimeter, providing observations to about 10m fromthe sea floor. The sampling was designed to encloseportions of the northwestern Weddell Sea that allowapplication of box inverse models to determine thefull-depth geostrophic transport through the gaps ofthe ridge (Fig. 1). Two boxes were constructed usingthe ARXVIII data. One box bounds the PhilipPassage (I) and the southern Powell Basin (II), whilethe other box bounds the Orkney Passage (III), theregion southwest of Bruce Passage (IV) and part ofthe northern edge of the WG (V). Extensive sea icecoverage during the summer of 2001 prevented thereoccupation of hydrographic stations in the southernPowell Basin and in the Orkney and Bruce Passages.Thus, only one box was constructed using ARXIXdata, with sections occupied over the Philip Passage(VI) and the central Powell Basin (VII).
3.2. Inverse method and bottom triangle
extrapolation
Inverse methods combine oceanographic obser-vations with oceanic models, which are based on
ral summers of 2000 and 2001. Stations selected to compose closed
ions VI and VII, 2001) are shown. Bottom topography is from

ARTICLE IN PRESSB.C. Franco et al. / Deep-Sea Research I 54 (2007) 1815–1840 1819
physical laws of fluid dynamics, aimed to determinefactors of the ocean circulation. In the inversetheory the ocean is assumed in geostrophic andhydrostatic balance to resolve the mesoscale andlarge-scale circulation. The baroclinic component ofthe geostrophic velocity is computed through thethermal wind equation, while the barotropic com-ponent is estimated by the inverse model discretizedin a set of linear equations of flow property con-servation, permitting the determination of theabsolute velocity (Wunsch, 1977; Roemmich,1981). An essential factor of the inverse theory isthe linearity, which allows explicit expressions toresolve inverse problems (Bennett, 1992). The boxinverse theory and methods have been thoroughlydiscussed by Wunsch (1977, 1978, 1996). In thiswork, the DOBOX 4.2 software package (Morgan,1994) was used.
The study of ocean flow in regions of slopingbottom includes uncertainties, mainly on the deepflow, which depend on the consideration or not ofthe bottom triangles and of the approach used toextrapolate the velocity and properties within thetriangles. Some studies extrapolate property valueswithin the bottom triangles as described by Wunsch(1996), Ganachaud (1999), and Roemmich andWunsch (1985). The baroclinic geostrophic velocityis computed through the extrapolated data, and thebaroclinic transport is calculated integrating thevelocity within the triangle. We tested severalextrapolation methods suggested in the literature(e.g. Roemmich and Wunsch, 1985; Wunsch, 1996;Ganachaud, 1999). However, extrapolation inseveral station pairs led to abrupt property gradi-ents, unrealistic y/S characteristics and/or densityinversions. The ‘constant slope’ (isotherm sloping)method suggested by Ganachaud (1999) producedthe most realistic results, mainly because, unlikeothers methods, it considers the deep gradients atshallow stations. This consideration allows extra-polation of the dense near-bottom water character-istics from the shallow station. Bottom triangleextrapolation methods can only supply an approx-imation of the flow between the shallow and thedeep station. Property fluxes associated with narrowbottom flows between stations cannot be properlyquantified. In this work, potential temperature andsalinity were linearly extrapolated within the bot-tom triangles using the deepest 50m of the shallowstation. The procedure is based on the quasi-linearmixing line of WDW–WSDW–WSBW in y/S space.Linear y and S extrapolations were considered
unrealistic when the resulting water mass differedfrom the regional y/S distributions observed alongeach transect. Extrapolations were not carried outwhen, at a given potential temperature, extrapolatedsalinity differed from the observed values by 40.01.At any given y most extrapolated salinities fellwithin 0.005 of the observed values. Whenever thelinear y/S extrapolations led to unrealistic watermass characteristics in y/S values, the bottom valuesof the shallow station were used for extrapolation.The extrapolations were carried out up to half thedepth of the bottom triangle. In addition toproducing realistic water mass characteristics, inmost cases the extrapolation procedure led to anearly linear baroclinic geostrophic velocity withinthe bottom triangle. The baroclinic geostrophicvelocity was computed relative to the sea surface.When the extrapolation procedure led to inver-sions of baroclinic velocity, no extrapolation wascarried out.
4. Export of the deep flow in the northwestern
Weddell Sea
4.1. Layer definitions
Following Naveira Garabato et al. (2002b) theboundaries between the main water masses wereselected based on neutral density (gn) surfaces(Jackett and McDougall, 1997). The neutral densitysurfaces have been thoroughly used in inversemodels and, according to Naveira Garabato et al.(2003), these surfaces are the most appropriatewater mass boundaries for studies of ocean circula-tion. Neutral density values of 28.00, 28.26, and28.40 kgm�3 were selected as the AASW/WDW,WDW/WSDW, and WSDW/WSBW interfaces,respectively (Table 1). The first of these gn valuesmarks the boundary between the Upper and LowerCDW sublayers in Drake Passage (e.g. NaveiraGarabato et al., 2002a). As the southern boundaryof the ACC coincides with the poleward edge ofUpper CDW sublayer (e.g. Orsi et al., 1995), thisboundary is a reasonable approximation to thedensity of the lightest CDW injected into the easternWG from the ACC and later transformed to WDW.The value of gn ¼ 28.26 kgm�3 separates WSDWfrom the ACC in the Scotia Sea (e.g. NaveiraGarabato et al., 2002a) whereas in the northernWeddell Sea gn ¼ 28.40 kgm�3 coincides with they ¼ �0.7 1C isotherm, which was originally definedas the WSDW/WSBW boundary by Carmack and
ARTICLE IN PRESS
Table 1
Model layer definitions and equivalence with the main water
masses
Layer boundary Upper interface gn (kgm�3) Water mass
1 Surface AASW
2 27.90
3 28.00 WDW
4 28.10
5 28.20
6 28.26 WSDW
7 28.31 LWSDW
8 28.40 WSBW
9 Bottom
B.C. Franco et al. / Deep-Sea Research I 54 (2007) 1815–18401820
Foster (1975). Recent studies have shown that lowerWSDW (LWSDW) is too dense to overflow theGeorgia Passage east of the Scotia Sea, which isanother WSDW pathway out of the Weddell basin(e.g. Arhan et al., 1999; Naveira Garabato et al.,2002a). Thus, we subdivide WSDW into an Upperand Lower layer at gn ¼ 28.31 kgm�3. In additionto these four water mass boundaries, becauseWDW occupies most of the water column in thePhilip Passage, we partitioned WDW into threelayers separated by gn ¼ 28.10 and 28.20 kgm�3.Finally, parts of AASW are in contact with theatmosphere and sea ice, inducing non-conservationof temperature and salinity; we therefore defined anadditional interface (gn ¼ 27.90 kgm�3) subdividingAASW in two layers, and we excluded theuppermost layer from the property conservationequations.
4.2. Cruise ARXVIII (2000)
4.2.1. Box over the Powell Basin
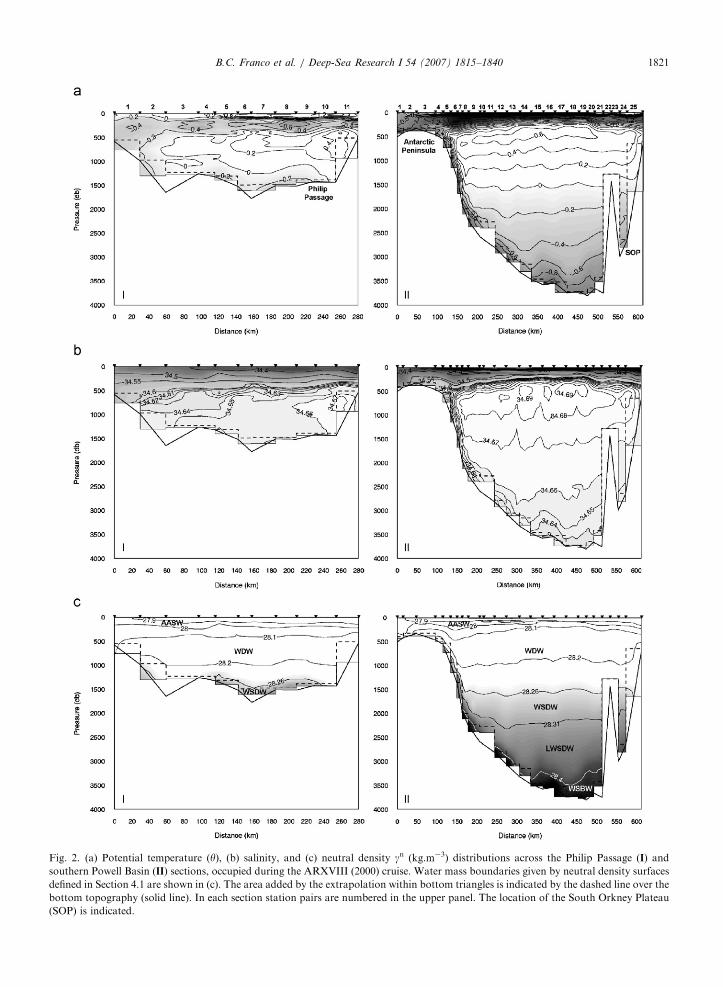
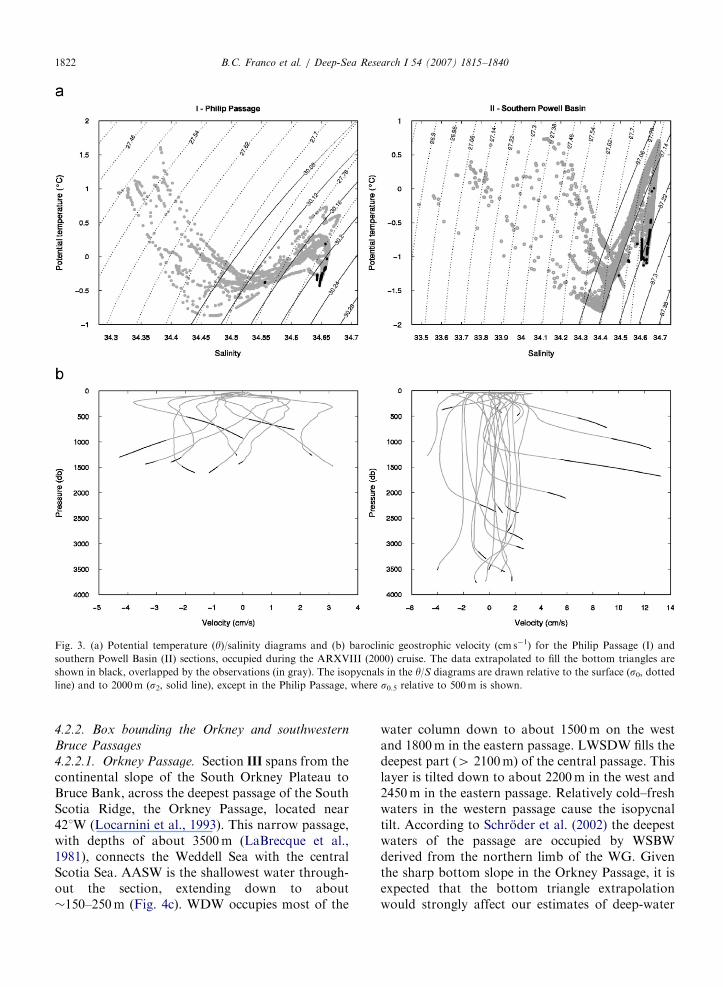
4.2.1.1. Philip Passage. Section I over the PhilipPassage (�481W), located within the Weddell–Scotia Confluence, bounds the Powell Basin tothe north. AASW is the warmest and shallowestwater mass throughout the section, extendingdown to about 200m (Fig. 2a and c). WDW,characterized by mid-depth potential temperatureand salinity maxima, extends to approximately1300m. In this layer warm (y40.4 1C) and salty(S434.67) waters are located in the eastern part ofthe Philip Passage (Fig. 2a and b). WSDW forms anear-bottom layer along the sloping topography,mostly on the central part of the section (Fig. 2c).The neutral density surface gn ¼ 28.26 kgm�3,
which characterizes the top of WSDW, is closer tothe y ¼ �0.2 1C isotherm than to the y ¼ 0 1Cisotherm, which suggests deep mixing generated inthis region. In most station pairs the linear propertyextrapolation within the bottom triangles leads torealistic y/S characteristics, except for the eastern-most pair, where the constant extrapolation of thedeepest observations at the shallow station is used(Fig. 3a). The extrapolations lead to an increase ofup to 2 cm s�1 of baroclinic geostrophic velocities(Fig. 3b).
4.2.1.2. Southern Powell Basin. Section II runsfrom the tip of the Antarctic Peninsula in an east-southeast direction down the continental slope intothe deep Weddell Sea, continuing to the southernentrance of the Powell Basin in a more easterly andnortherly direction toward the continental slope ofthe South Orkney Plateau (Fig. 1). The regioncovered by the section resolves the water massescirculating within the Powell Basin (see Fahrbachet al., 1994, 2001; Gordon et al., 2001; vonGyldenfeldt et al., 2002). The isopleth tilt ofWDW relative to the bottom indicates a dominantcyclonic circulation in the Powell Basin, with inflowalong the continental slope off the AntarcticPeninsula and the return flow along the westernslope of the South Orkney Plateau (Fig. 2a and b).This is in agreement with the results of Schroderet al. (2002). AASW occupies the shallowest depths�100–200m, and, in the two westernmost stations,it extends down to about 400m (Fig. 2c). WDWextends along the continental slope of the peninsulaand rises in the central section to approximately1500m. LWSDW fills most of the water columnbelow 2000m. The cold and fresh lens hugging thecontinental slope of the Antarctic Peninsula marksthe newly formed WSBW (e.g. Absy, 2003; Schroderet al., 2002). WSBW flows eastward within thenorthern limb of the WG. The linear propertyextrapolation method within the bottom trianglesleads to results in agreement with the typical watermass properties in most station pairs. However,because of the large property gradients observed atstation pairs 1, 6, 8, 9, and 12, the deepest y and S
observations at the shallow stations were used(Fig. 3a). Because of inversions in the baroclinicvelocity, no extrapolation was applied at stationpair 23. The baroclinic geostrophic velocity calcu-lated with the extrapolated data increases to1–3 cm s�1, except in the easternmost station pair,where it increases to �7 cm s�1 (Fig. 3b).
ARTICLE IN PRESS
Fig. 2. (a) Potential temperature (y), (b) salinity, and (c) neutral density gn (kg.m�3) distributions across the Philip Passage (I) and
southern Powell Basin (II) sections, occupied during the ARXVIII (2000) cruise. Water mass boundaries given by neutral density surfaces
defined in Section 4.1 are shown in (c). The area added by the extrapolation within bottom triangles is indicated by the dashed line over the
bottom topography (solid line). In each section station pairs are numbered in the upper panel. The location of the South Orkney Plateau
(SOP) is indicated.
B.C. Franco et al. / Deep-Sea Research I 54 (2007) 1815–1840 1821
ARTICLE IN PRESS
Fig. 3. (a) Potential temperature (y)/salinity diagrams and (b) baroclinic geostrophic velocity (cm s�1) for the Philip Passage (I) and
southern Powell Basin (II) sections, occupied during the ARXVIII (2000) cruise. The data extrapolated to fill the bottom triangles are
shown in black, overlapped by the observations (in gray). The isopycnals in the y/S diagrams are drawn relative to the surface (s0, dottedline) and to 2000m (s2, solid line), except in the Philip Passage, where s0.5 relative to 500m is shown.
B.C. Franco et al. / Deep-Sea Research I 54 (2007) 1815–18401822
4.2.2. Box bounding the Orkney and southwestern
Bruce Passages
4.2.2.1. Orkney Passage. Section III spans from thecontinental slope of the South Orkney Plateau toBruce Bank, across the deepest passage of the SouthScotia Ridge, the Orkney Passage, located near421W (Locarnini et al., 1993). This narrow passage,with depths of about 3500m (LaBrecque et al.,1981), connects the Weddell Sea with the centralScotia Sea. AASW is the shallowest water through-out the section, extending down to about�150–250m (Fig. 4c). WDW occupies most of the
water column down to about 1500m on the westand 1800m in the eastern passage. LWSDW fills thedeepest part (4 2100m) of the central passage. Thislayer is tilted down to about 2200m in the west and2450m in the eastern passage. Relatively cold–freshwaters in the western passage cause the isopycnaltilt. According to Schroder et al. (2002) the deepestwaters of the passage are occupied by WSBWderived from the northern limb of the WG. Giventhe sharp bottom slope in the Orkney Passage, it isexpected that the bottom triangle extrapolationwould strongly affect our estimates of deep-water

ARTICLE IN PRESS
Fig. 4. (a) Potential temperature (y), (b) salinity, and (c) neutral density gn (kgm�3) distributions across the Orkney Passage (III),
southwestern Bruce Passage (IV), and northern limb of the Weddell Gyre (V) sections, occupied during the ARXVIII (2000) cruise. Water
mass boundaries given by neutral density surfaces defined in Section 4.1 are shown. The area added by the extrapolation within bottom
triangles is indicated by the dashed line over the bottom topography (solid line). In each section station pairs are numbered in the upper
panels. The location of the South Orkney Plateau (SOP) is indicated.
B.C. Franco et al. / Deep-Sea Research I 54 (2007) 1815–1840 1823
transport. Constant y and S extrapolation withinthe bottom triangles was applied at station pairs 3and 5. Because of the large depth difference betweenstations at pair 1, on which the extrapolationgenerates unrealistic y/S characteristics, we choseonly in this case to limit the linear extrapolation to adepth shallower than half the height of the bottomtriangle. This procedure leads to a realistic y/Sdistribution (Fig. 5a). The baroclinic geostrophic
velocities calculated with the extrapolated dataincrease up to 4.5 cm s�1 (Fig. 5b).
4.2.2.2. Southwestern Bruce Passage. Section IV
runs southeastward from the continental slope ofBruce Bank to the deep southwestern Bruce Passage(�381W) and continues toward the shallow depthsof Jane Bank. AASW occupies the upper layer to�150m, reaching 241m in the northern station

ARTICLE IN PRESS
Fig. 5. (a) Potential temperature (y)/salinity diagrams and (b) baroclinic geostrophic velocity (cm s�1) for the Orkney Passage (III),
southwestern Bruce Passage (IV), and northern limb of the Weddell Gyre (V) sections, occupied during the ARXVIII (2000) cruise. The
data extrapolated to fill the bottom triangles are shown in black, overlapped by the observations (gray). The isopycnals in the y/S diagrams
are drawn relative to the surface (s0, dotted line) and to 2000m (s2, solid line).
B.C. Franco et al. / Deep-Sea Research I 54 (2007) 1815–18401824
(Fig. 4c). WDW occupies a mid-depth layer toabout 1600m. At deeper levels LWSDW fills thedeepest part of the passage, and WSBW is presentonly in the deepest station (below 3837m). Thehighly linear y/S relationship between WDW andWSDW leads to realistic results in most stationpairs when linear property extrapolation is used(Fig. 5a). Constant extrapolation of near-bottomvalues of y and S was applied only at station pair 5,and no extrapolation was carried out at station pair1 because it leads to baroclinic velocity inversions.The baroclinic geostrophic velocities calculatedwith the extrapolated data increase up to 2 cm s�1
(Fig. 5b).
4.2.2.3. Northern limb of the WG. Section V runssoutheastward from the continental slope of theSouth Orkney Plateau toward the deep WeddellBasin, covering part of the northern limb of theWG. Potential temperature and salinity distribu-tions reveal a cold and fresh bottom layer on bothsides of Endurance Ridge (Fig. 4a and b). Accord-ing to Schroder et al. (2002), these water mass
properties are characteristic of the Weddell Seainterior. The section resolves the eastward outflowfrom the Powell Basin and, in deeper layers, fromthe northwestern limb of the WG (Gordon et al.,2001; von Gyldenfeldt et al., 2002). AASW occupiesthe upper layer to �140m (Fig. 4c). Below theAASW layer, WDW is tilted along the continentalslope of the plateau and rises at the center-southernsection to about 1500m. Below 2000m most of thestations in this section present LWSDW. WSBW isobserved over the bottom within the northern limbof the Weddell Gyre. The linear y and S extrapola-tion within the bottom triangles was applied at allstation pairs (Fig. 5a). The baroclinic geostrophicvelocities calculated with the extrapolated dataincrease up to 4 cm s�1 (Fig. 5b).
4.2.3. Inverse solutions and WSDW outflow
The low stratification and reduced baroclinicshear in the northwestern WG lead to a circulationdominated largely by narrow barotropic jets(Gordon et al., 2001; Naveira Garabato et al.,2002b). Usually, in areas of weak stratification the

ARTICLE IN PRESSB.C. Franco et al. / Deep-Sea Research I 54 (2007) 1815–1840 1825
oceanic currents are strongly steered by the bottomtopography. The western WG circulation is domi-nated by boundary currents that flow northwardnearly parallel to the isobaths over the continentalslope (Fahrbach et al., 1994). Over and near thecontinental slopes the flow direction is verticallycoherent throughout the water column, but in theinterior, where the flow is weak and variable, thereare some reversals (Fahrbach et al., 1994). Instan-taneous current measurements (LADCP) also sug-gest the largely barotropic component of velocity inthe area (Gordon et al., 2001; Naveira Garabatoet al., 2002b). Naveira Garabato et al. (2003)pointed out that the circulation into the WG cannotbe reasonably approximated with a level of nomotion because it is dominated by narrow, largelybarotropic jets. In addition, other inverse analysesused direct velocity measurements and concludedthey have no significant impact on the solution (e.g.Gille, 1999). In the inverse theory the barotropicvelocity is well defined in the model equations until,as the solution rank increases, the noise in thesolution also increases. Thus, there is a tradeoffbetween the number of equations used in theinversion and the stability of the solution(Roemmich, 1981). Since our boxes are not in theWG interior, to investigate the above-mentionedissues, in this work we estimated the geostrophicvelocity relative to the deepest common depth ateach station pair and searched for barotropicsolutions that best agreed with the bottom velocitypatterns described in the literature. To improve theconditioning of the inverse model, resulting inhigher rank model equation matrix and hence largerbarotropic solutions, in this work we attempted toreduce the noise in the solutions by considering theflow uncertainties in the set of equations.
There are several sources of noise in the inversecalculation, but the most significant are derivedfrom internal wave activity, ageostrophic flows, andbottom triangle extrapolations (e.g. Ganachaud,1999). Time variability in non-synoptic studiescan also lead to significant flow uncertainties(Roemmich and Wunsch, 1985; Rintoul, 1991;Macdonald, 1993). During the ARXVIII cruise,the hydrographic stations that bound the PowellBasin were occupied in 15 days, from 24 January to7 February 2000, and the Orkney and southwesternBruce Passages and the northern WG stations weresampled in 7 days, from 30 January to 5 February2000. We have no information on the impact ofmesoscale variability in the region over these time
scales; thus this possible source of uncertainty wasnot evaluated. However, these time scales span thespring-neap tidal interval, and interactions betweenstrong barotropic tidal currents and bottom slopesmay induce tidal conversion to internal waves in theregion (see Naveira Garabato et al., 2004; Padmanet al., 2006). Since we calculate the transport withinthe bottom triangles, in this work only the flowuncertainties induced by internal waves, tides, andEkman ageostrophic dynamics and their impact onthe solutions were estimated. The internal wave flowuncertainties were calculated using the Garrett–Munk spectrum scaled by the appropriate ratio ofthe Coriolis parameter (see Ganachaud, 1999; e.g.Garrett and Munk, 1979; Munk, 1981). The tidalflow uncertainties were estimated according to meantidal velocities simulated by Padman et al. (2006).Ekman transport flow uncertainties were estimatedfollowing Naveira Garabato et al. (2002b). Stationspacing larger than the internal deformation radiusin the northwestern Weddell Sea, which variesbetween 10 and 15 km, could introduce propertyflux errors in our estimates. However, the ratherscattered sampling in the region does not allow us toassess the possible impact of this error source on thefinal transport estimates.
4.2.3.1. Model configuration. To determine thegeostrophic volume transports in each box, mass,salt, and heat were assumed to be conserved withinlayers not in direct contact with the atmosphere.The internal wave flow estimate uncertaintiesare71.7 Sv (Section 4.2.3). Tidal flow uncertaintyestimates were calculated and applied only in theboxes over the Powell Basin, since over the Orkneyand Bruce Passages the tidal current velocity isexpected to be weak (Padman et al., 2006). Tidalmean absolute velocities of 8 cm s�1 estimated in thePhilip Passage (Padman et al., 2006) lead to a tidalflow uncertainty of 0.03 Sv. Ekman transportestimate uncertainties are70.2 Sv based on thevalues of 0.5–0.6 Sv reported over a larger area ofthe South Scotia Ridge (e.g. Naveira Garabatoet al., 2003). Each equation was normalized with thelayer property mean and each column was normal-ized with the station pair area. The total watercolumn equations were weighted by the flowestimate uncertainties (i.e., Ekman+internal wavesand tides), and each layer below the surface layer,was weighted by the internal wave and tideuncertainty, distributed throughout the watercolumn (70.22 Sv in each layer). This procedure
ARTICLE IN PRESSB.C. Franco et al. / Deep-Sea Research I 54 (2007) 1815–18401826
was applied because of the limited knowledge on thebehavior of internal waves in the region, the lowstratification throughout the water column, and theinfluence of the bottom topography, which inducesconversion of strong barotropic tidal currents tointernal waves (Padman et al., 2006). In the boxover the Orkney and Bruce Passages, where the tidesare weak, only the Ekman and internal wave flowuncertainties were considered. The first two stationpairs in the Powell Basin off the Antarctic Peninsulapresent a nearly linear y/S distribution, character-istic of shelf waters in this region. Recent studieshave shown that these shelf waters in the westernPowell Basin are steered toward the BransfieldStrait (Schodlok et al., 2002; von Gyldenfeldt et al.,2002). Since our observations do not resolve theshelf water outflow to the Bransfield Strait, weexcluded these shallow waters from the mass andproperty flux conservation equations. In the boxenclosing the Orkney Passage, southwestern BrucePassage and the northern limb of the WG weassumed that the flow within the box is conserved.The row- and column-weighted system of equationsin each box was solved by singular value decom-position (Lanczos, 1961; Wunsch, 1978, 1996).
4.2.3.2. Solutions. In each box we configured sixmodels. The models test the combined effects ofproperty conservation, property anomaly conserva-tion, flow uncertainties, and bottom triangle trans-ports. Property anomaly conservation reduces theimpact of noisy mass-flux divergences on theproperty-flux divergences, effectively resulting in ahigher rank model equation matrix (McIntosh andRintoul, 1997; Ganachaud, 1999; Naveira Garabatoet al., 2003). To formulate the conservation ofpotential temperature and salinity anomalies, the
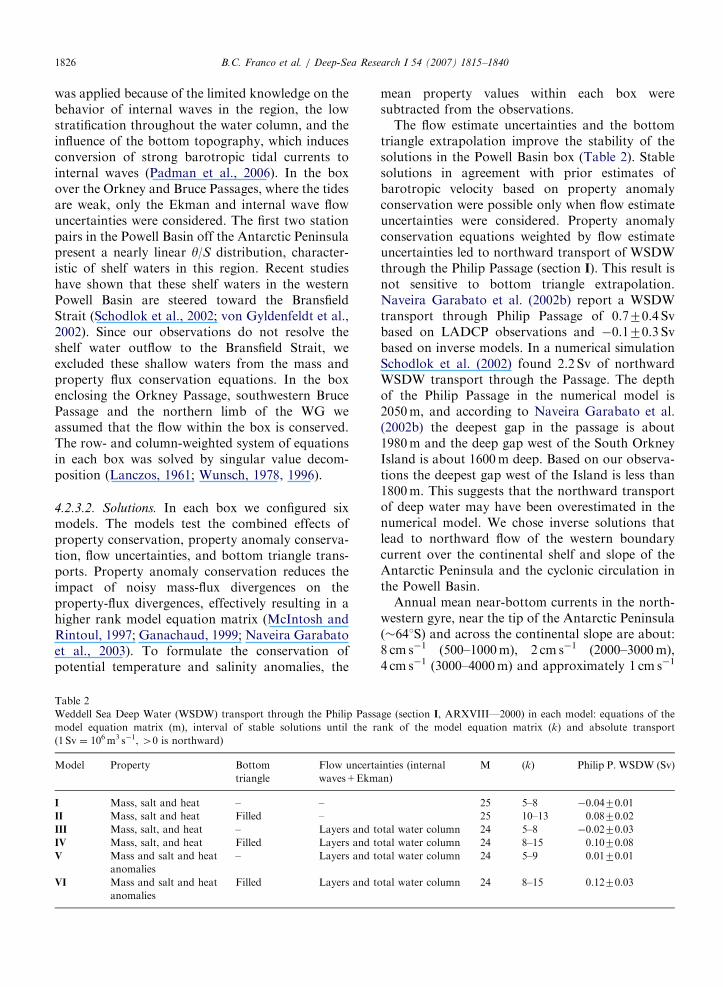
Table 2
Weddell Sea Deep Water (WSDW) transport through the Philip Passa
model equation matrix (m), interval of stable solutions until the r
(1 Sv ¼ 106m3 s�1, 40 is northward)
Model Property Bottom
triangle
Flow uncerta
waves+Ekm
I Mass, salt and heat – –
II Mass, salt and heat Filled –
III Mass, salt, and heat – Layers and t
IV Mass, salt, and heat Filled Layers and t
V Mass and salt and heat
anomalies
– Layers and t
VI Mass and salt and heat
anomalies
Filled Layers and t
mean property values within each box weresubtracted from the observations.
The flow estimate uncertainties and the bottomtriangle extrapolation improve the stability of thesolutions in the Powell Basin box (Table 2). Stablesolutions in agreement with prior estimates ofbarotropic velocity based on property anomalyconservation were possible only when flow estimateuncertainties were considered. Property anomalyconservation equations weighted by flow estimateuncertainties led to northward transport of WSDWthrough the Philip Passage (section I). This result isnot sensitive to bottom triangle extrapolation.Naveira Garabato et al. (2002b) report a WSDWtransport through Philip Passage of 0.770.4 Svbased on LADCP observations and �0.170.3 Svbased on inverse models. In a numerical simulationSchodlok et al. (2002) found 2.2 Sv of northwardWSDW transport through the Passage. The depthof the Philip Passage in the numerical model is2050m, and according to Naveira Garabato et al.(2002b) the deepest gap in the passage is about1980m and the deep gap west of the South OrkneyIsland is about 1600m deep. Based on our observa-tions the deepest gap west of the Island is less than1800m. This suggests that the northward transportof deep water may have been overestimated in thenumerical model. We chose inverse solutions thatlead to northward flow of the western boundarycurrent over the continental shelf and slope of theAntarctic Peninsula and the cyclonic circulation inthe Powell Basin.
Annual mean near-bottom currents in the north-western gyre, near the tip of the Antarctic Peninsula(�641S) and across the continental slope are about:8 cm s�1 (500–1000m), 2 cm s�1 (2000–3000m),4 cm s�1 (3000–4000m) and approximately 1 cm s�1
ge (section I, ARXVIII—2000) in each model: equations of the
ank of the model equation matrix (k) and absolute transport
inties (internal
an)
M (k) Philip P. WSDW (Sv)
25 5–8 �0.0470.01
25 10–13 0.0870.02
otal water column 24 5–8 �0.0270.03
otal water column 24 8–15 0.1070.08
otal water column 24 5–9 0.0170.01
otal water column 24 8–15 0.1270.03
ARTICLE IN PRESS
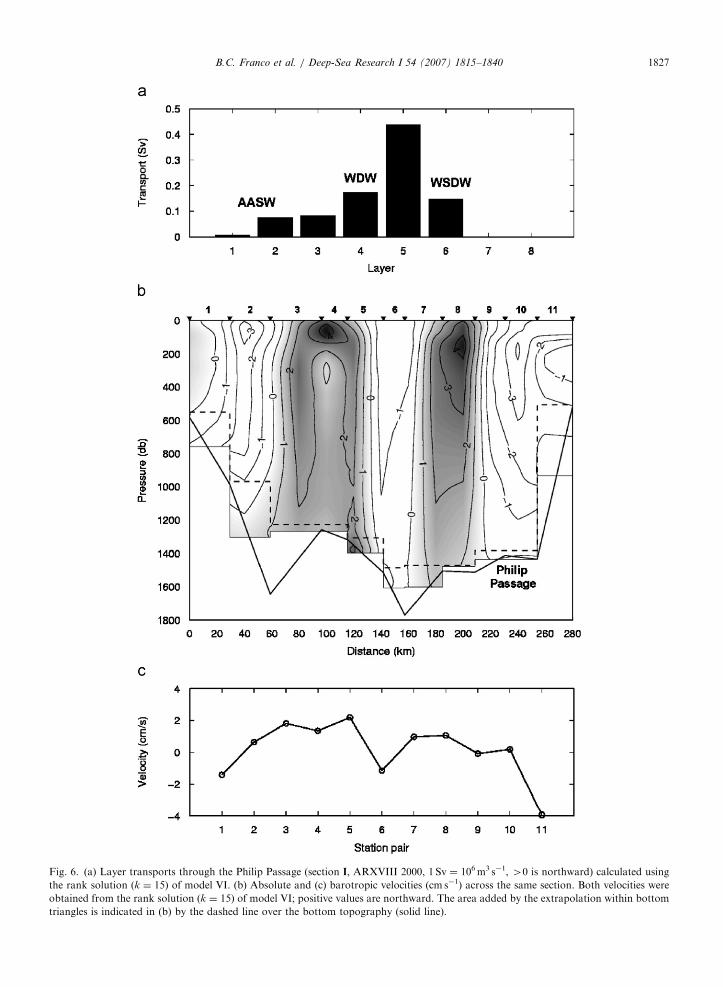
Fig. 6. (a) Layer transports through the Philip Passage (section I, ARXVIII 2000, 1 Sv ¼ 106m3 s�1, 40 is northward) calculated using
the rank solution (k ¼ 15) of model VI. (b) Absolute and (c) barotropic velocities (cm s�1) across the same section. Both velocities were
obtained from the rank solution (k ¼ 15) of model VI; positive values are northward. The area added by the extrapolation within bottom
triangles is indicated in (b) by the dashed line over the bottom topography (solid line).
B.C. Franco et al. / Deep-Sea Research I 54 (2007) 1815–1840 1827
ARTICLE IN PRESSB.C. Franco et al. / Deep-Sea Research I 54 (2007) 1815–18401828
below 4000m (Fahrbach et al., 1994). Comparedwith these observations, the best solutions are foundin model VI (Table 2), which presents similarbarotropic velocities. Our solution shows a narrowcountercurrent over the continental slope of theAntarctic Peninsula flowing at about 500m with abarotropic velocity of �2 cm s�1. A similar south-ward current flowing along uniform potentialvorticity contours at 400–600m is observed in anumerical simulation (Matano et al., 2002). Theeasternmost flow of warm (y4 0.4 1C) and salty(S 4 34.67) WDW through the Philip Passage issouthward, entering the Powell Basin (Fig. 6b). Thisis in agreement with LADCP observations (NaveiraGarabato et al., 2002b). According to Matano et al.(2002), less than 1 Sv from the Scotia Sea enterthrough the eastern Powell Basin. Other studiessuggest that a net outflow from the Powell Basinenters the Scotia Sea through the Philip Passage(Nowlin and Zenk, 1988; von Gyldenfeldt et al.,2002). Our model VI leads to 0.1270.03 Sv ofWSDW and 0.8470.11 Sv of full-depth northwardflow through the Philip Passage.
In the Orkney (section III) and southwestern Bruce(section IV) Passages, box inverse solutions consistentwith prior results were found only when using thebottom triangle extrapolation and property anomalyequations weighted by the flow estimate uncertaintywere used (Table 3). Reported WSDW transportsthrough Orkney Passage are 4.370.6Sv, based onLADCP observations and 5.670.1Sv, based oninverse models (e.g. Naveira Garabato et al., 2002b).These results are in close agreement with thesimulation of Schodlok et al. (2002), which produces4.2Sv of WSDW northward flow through thepassage. Studies have suggested that the coldestvariety of WSDW found in the Scotia Sea entersthrough the Orkney Passage (Wust, 1933; Locarniniet al., 1993). Thus, the Orkney Passage is suggested as
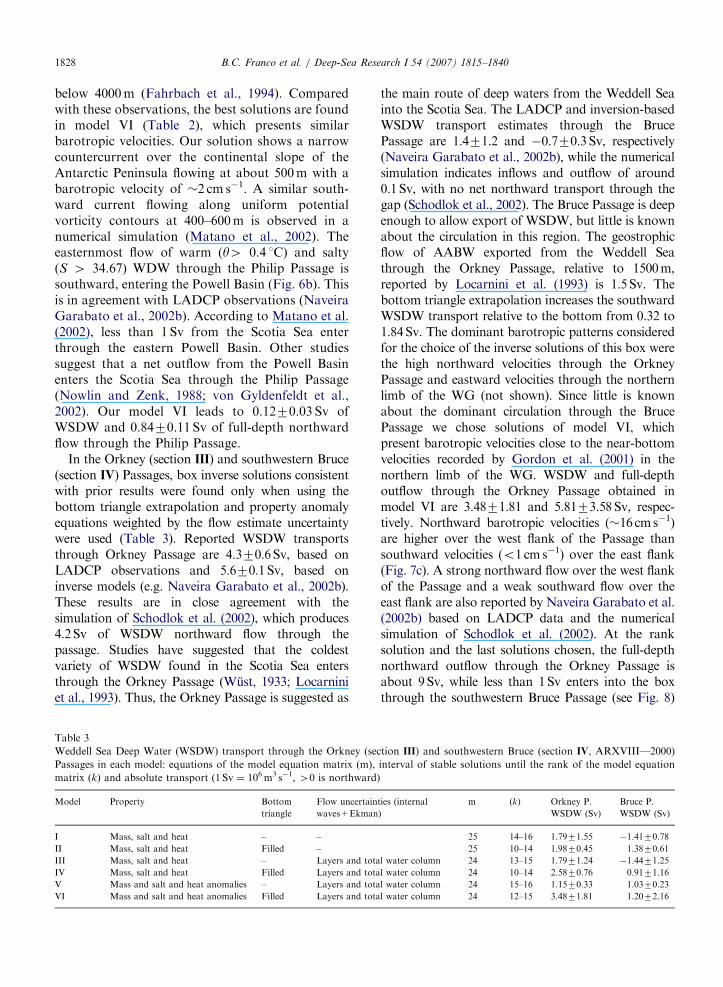
Table 3
Weddell Sea Deep Water (WSDW) transport through the Orkney (se
Passages in each model: equations of the model equation matrix (m),
matrix (k) and absolute transport (1 Sv ¼ 106m3 s�1, 40 is northward
Model Property Bottom
triangle
Flow uncertain
waves+Ekman
I Mass, salt and heat – –
II Mass, salt and heat Filled –
III Mass, salt and heat – Layers and tota
IV Mass, salt and heat Filled Layers and tota
V Mass and salt and heat anomalies – Layers and tota
VI Mass and salt and heat anomalies Filled Layers and tota
the main route of deep waters from the Weddell Seainto the Scotia Sea. The LADCP and inversion-basedWSDW transport estimates through the BrucePassage are 1.471.2 and �0.770.3Sv, respectively(Naveira Garabato et al., 2002b), while the numericalsimulation indicates inflows and outflow of around0.1Sv, with no net northward transport through thegap (Schodlok et al., 2002). The Bruce Passage is deepenough to allow export of WSDW, but little is knownabout the circulation in this region. The geostrophicflow of AABW exported from the Weddell Seathrough the Orkney Passage, relative to 1500m,reported by Locarnini et al. (1993) is 1.5 Sv. Thebottom triangle extrapolation increases the southwardWSDW transport relative to the bottom from 0.32 to1.84Sv. The dominant barotropic patterns consideredfor the choice of the inverse solutions of this box werethe high northward velocities through the OrkneyPassage and eastward velocities through the northernlimb of the WG (not shown). Since little is knownabout the dominant circulation through the BrucePassage we chose solutions of model VI, whichpresent barotropic velocities close to the near-bottomvelocities recorded by Gordon et al. (2001) in thenorthern limb of the WG. WSDW and full-depthoutflow through the Orkney Passage obtained inmodel VI are 3.4871.81 and 5.8173.58Sv, respec-tively. Northward barotropic velocities (�16 cms�1)are higher over the west flank of the Passage thansouthward velocities (o1 cms�1) over the east flank(Fig. 7c). A strong northward flow over the west flankof the Passage and a weak southward flow over theeast flank are also reported by Naveira Garabato et al.(2002b) based on LADCP data and the numericalsimulation of Schodlok et al. (2002). At the ranksolution and the last solutions chosen, the full-depthnorthward outflow through the Orkney Passage isabout 9Sv, while less than 1Sv enters into the boxthrough the southwestern Bruce Passage (see Fig. 8)
ction III) and southwestern Bruce (section IV, ARXVIII—2000)
interval of stable solutions until the rank of the model equation
)
ties (internal
)
m (k) Orkney P.
WSDW (Sv)
Bruce P.
WSDW (Sv)
25 14–16 1.7971.55 �1.4170.78
25 10–14 1.9870.45 1.3870.61
l water column 24 13–15 1.7971.24 �1.4471.25
l water column 24 10–14 2.5870.76 0.9171.16
l water column 24 15–16 1.1570.33 1.0370.23
l water column 24 12–15 3.4871.81 1.2072.16

ARTICLE IN PRESS
Fig. 7. (a) Layer transports through the Orkney Passage (section III, ARXVIII 2000, 1 Sv ¼ 106m3 s�1,40 is northward) calculated using
the rank solution (k ¼ 15) of model VI. (b) Absolute and (c) barotropic velocities (cm s�1) across the same section. Both velocities were
obtained from the rank solution (k ¼ 15) of model VI; positive values are northward. The area added by the extrapolation within bottom
triangles is indicated in (b) by the dashed line over the bottom topography (solid line).
B.C. Franco et al. / Deep-Sea Research I 54 (2007) 1815–1840 1829
ARTICLE IN PRESS
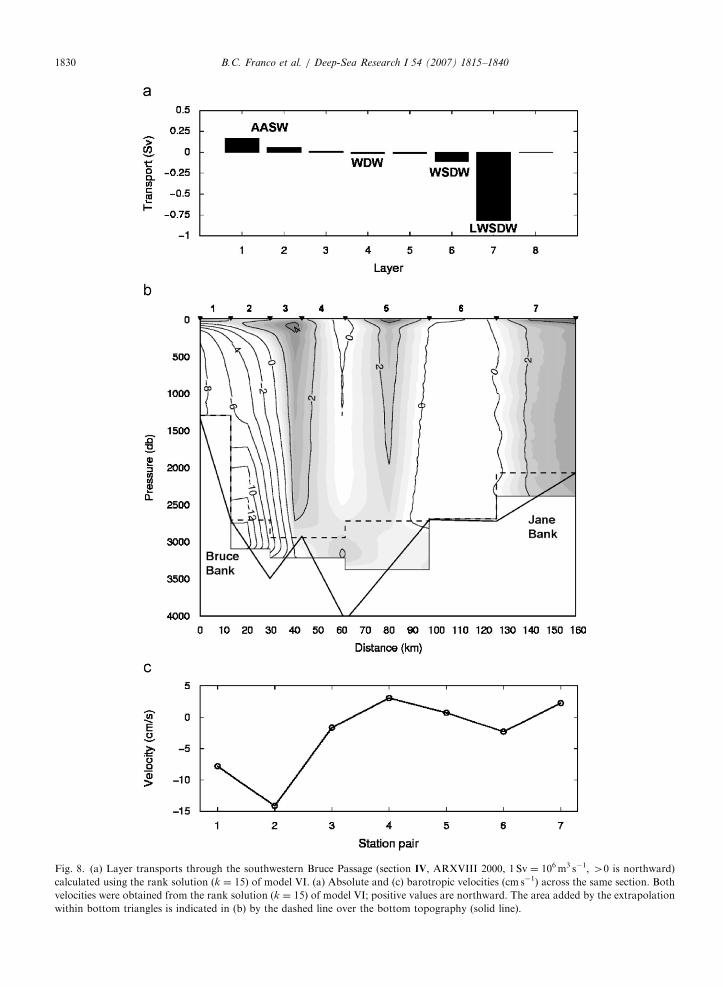
Fig. 8. (a) Layer transports through the southwestern Bruce Passage (section IV, ARXVIII 2000, 1 Sv ¼ 106m3 s�1, 40 is northward)
calculated using the rank solution (k ¼ 15) of model VI. (a) Absolute and (c) barotropic velocities (cm s�1) across the same section. Both
velocities were obtained from the rank solution (k ¼ 15) of model VI; positive values are northward. The area added by the extrapolation
within bottom triangles is indicated in (b) by the dashed line over the bottom topography (solid line).
B.C. Franco et al. / Deep-Sea Research I 54 (2007) 1815–18401830
ARTICLE IN PRESS
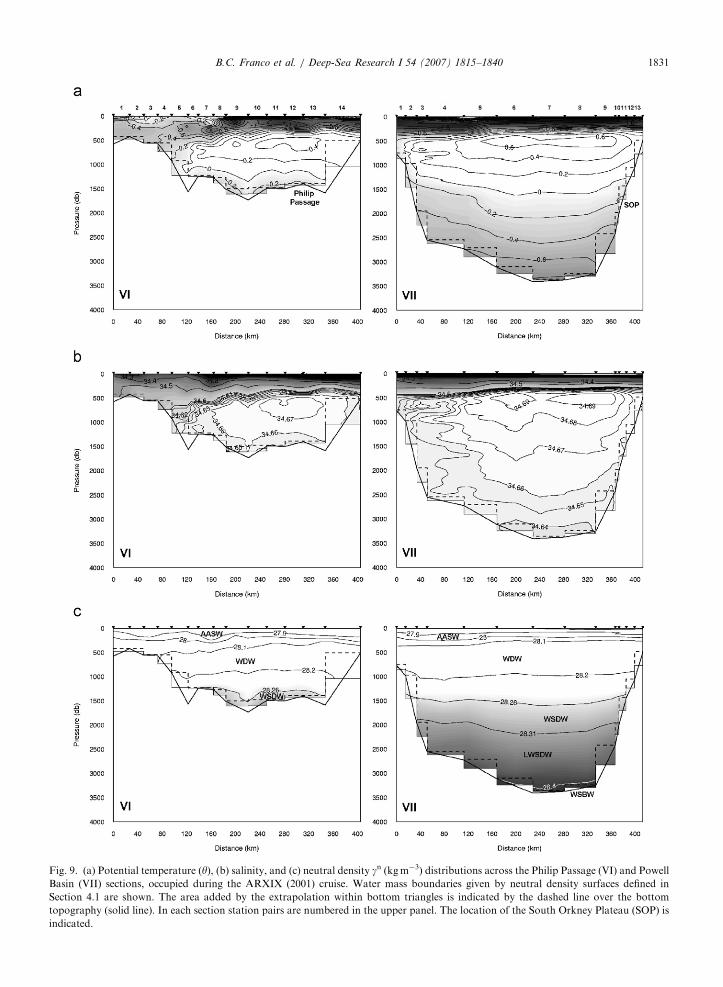
Fig. 9. (a) Potential temperature (y), (b) salinity, and (c) neutral density gn (kgm�3) distributions across the Philip Passage (VI) and Powell
Basin (VII) sections, occupied during the ARXIX (2001) cruise. Water mass boundaries given by neutral density surfaces defined in
Section 4.1 are shown. The area added by the extrapolation within bottom triangles is indicated by the dashed line over the bottom
topography (solid line). In each section station pairs are numbered in the upper panel. The location of the South Orkney Plateau (SOP) is
indicated.
B.C. Franco et al. / Deep-Sea Research I 54 (2007) 1815–1840 1831

ARTICLE IN PRESS
Fig. 10. (a) Potential temperature (y)/salinity diagrams and (b) baroclinic geostrophic velocity (cm s�1) for the Philip Passage (VI) and
Powell Basin (VII) sections, occupied during the ARXIX (2001) cruise. The data extrapolated to fill the bottom triangles are shown in
black, overlapped by the observations (in gray). The isopycnals in the y/S diagrams are drawn relative to the surface (s0, dotted line) and
to 2000m (s2, solid line), except in the Philip Passage, where s0.5 relative to 500m is shown.
B.C. Franco et al. / Deep-Sea Research I 54 (2007) 1815–18401832
and about 8.5 Sv flow eastward through the northernlimb of the WG (not shown). In model VI the full-depth flow through the northern limb of the WG is9.2571.01Sv. These results are in close agreementwith the numerical simulations of Matano et al.(2002). They report a full-depth northward flow of9Sv over the Orkney and southwestern BrucePassages, while 22Sv flow eastward over a larger areabetween the South Orkney Plateau and 651S, crossingthe northern limb of the WG at 451W. The limitedknowledge about the dominant circulation throughthe southwestern Bruce Passage prevents us from
applying constrains to the range of solutions in thisregion, leading to higher flow variances.
4.3. Cruise ARXIX (2001)
4.3.1. Box over the Powell Basin
4.3.1.1. Philip Passage. Section VI over the PhilipPassage reoccupied the positions of the hydro-graphic stations sampled during the ARXVIII(2000), with three additional stations taken towardthe Bransfield Strait in the western end of thesection (Fig. 1). AASW is the shallowest water mass

ARTICLE IN PRESSB.C. Franco et al. / Deep-Sea Research I 54 (2007) 1815–1840 1833
throughout the section down to about 200m(Fig. 9c). In this layer colder (yo 1.4 1C) watersthan found in the previous summer are located inthe central-eastern part of the Philip Passage(Fig. 9a). WDW extends down to about 1300m,with warm (y4 0.4 C) and salty (S 4 34.67) waterslocated in the central-eastern part of the passageand occupying a larger area throughout the watercolumn compared to the previous summer (Fig. 9aand b). Furthermore, warmer (0.2 1Coyo0.4 1C)and saltier (34.66oSo34.67) waters also occupied alarger area in the summer of 2001. As in theprevious summer, WSDW is observed in deeperlayers along the sloping topography, mostly onthe central gap of the section, and the neutraldensity surface gn ¼ 28.26 kgm�3 is closer to they ¼ �0.2 1C isotherm than to the y ¼ 0 1C isotherm.In most station pairs the linear property extrapola-tion within the bottom triangles leads to realistic y/Sresults, except on station pairs 1 and 10, where aconstant extrapolation of the deepest observationsat the shallow stations are used (Fig. 10a). Theextrapolations lead to an increase of up to 2 cm s�1
in baroclinic geostrophic velocities (Fig. 10b).
4.3.1.2. Powell Basin. Section VII runs northeast-ward from the continental slope off the northern tipof the Antarctic Peninsula into the deep PowellBasin, and then follows a more easterly andnortherly direction over the continental slope ofthe South Orkney Plateau (Fig. 1). AASW isobserved occupying the shallowest depths �200m(Fig. 9c). WDW extends along the continentalslopes around the basin and deepens in the centralsection to about 1500m. LWSDW fills most ofthe deep layers. WSBW fills the bottom of thecentral Powell Basin down from about 3200m.
Table 4
Weddell Sea Deep Water (WSDW) transport through the Philip Passa
model equation matrix (m), interval of stable solutions until the ra
(1 Sv ¼ 106m3 s�1, 40 is northward)
Model Property Bottom
Triangle
Flow uncerta
waves+Ekm
I Mass, salt and heat – –
II Mass, salt and heat Filled –
III Mass, salt and heat – Layers and t
IV Mass, salt and heat Filled Layers and t
V Mass and salt and heat
anomalies
– Layers and t
VI Mass and salt and heat
anomalies
Filled Layers andto
The baroclinic shear in the basin seems to bedominated by the deepest density gradients huggingthe bottom topography, which would promote ananticyclonic circulation. The linear property extra-polation method within the bottom triangles leadsto realistic y/S distributions in most station pairs,except the easternmost pair, where a constantextrapolation of the deepest observations at theshallow station is applied (Fig. 10a). The baroclinicgeostrophic velocities calculated with the extrapo-lated data increase up to 2 cm s�1 (Fig. 10b).
4.3.2. Inverse solutions and WSDW outflow
During the ARXIX cruise the hydrographicstations that bound the Powell Basin box werecarried out in 7 days, from 22 to 28 January 2001.Thus, in this box the flow estimate uncertaintiesdiscussed and determined in Section 4.2.3 wereapplied.
4.3.2.1. Model configuration. Each equation andcolumn was weighted as described in Section4.2.3.1. Recent studies suggest intense mixing inthe western Philip Ridge region, associated withwaters derived from the Bransfield Strait (see vonGyldenfeldt et al., 2002). Given the flow uncertaintyin this region, a relative weight 0.5 is assigned forthe three westernmost station pairs in section VI.
4.3.2.2. Solutions. As observed in the Powell Basininversions in 2000, the flow estimate uncertaintiesand the bottom triangle extrapolations improve thestability of the 2001 solutions (Table 4). Thedominant barotropic pattern considered for thechoice of the inverse solutions was a cycloniccirculation in the Powell Basin. The best solu-tions are found in model VI. Baroclinic shears
ge (section VI, ARXIX—2001) in each model: equations of the
nk of the model equation matrix (k) and absolute transport
inties (internal
an)
m (k) Philip P. WSDW (Sv)
25 5–10 0.0370.01
25 11–12 0.0670.02
otal water column 24 5–10 0.0370.01
otal water column 24 8–11 0.0770.01
otal water column 24 8–15 0.01270.001
tal water column 24 8–12 0.11370.001
ARTICLE IN PRESS
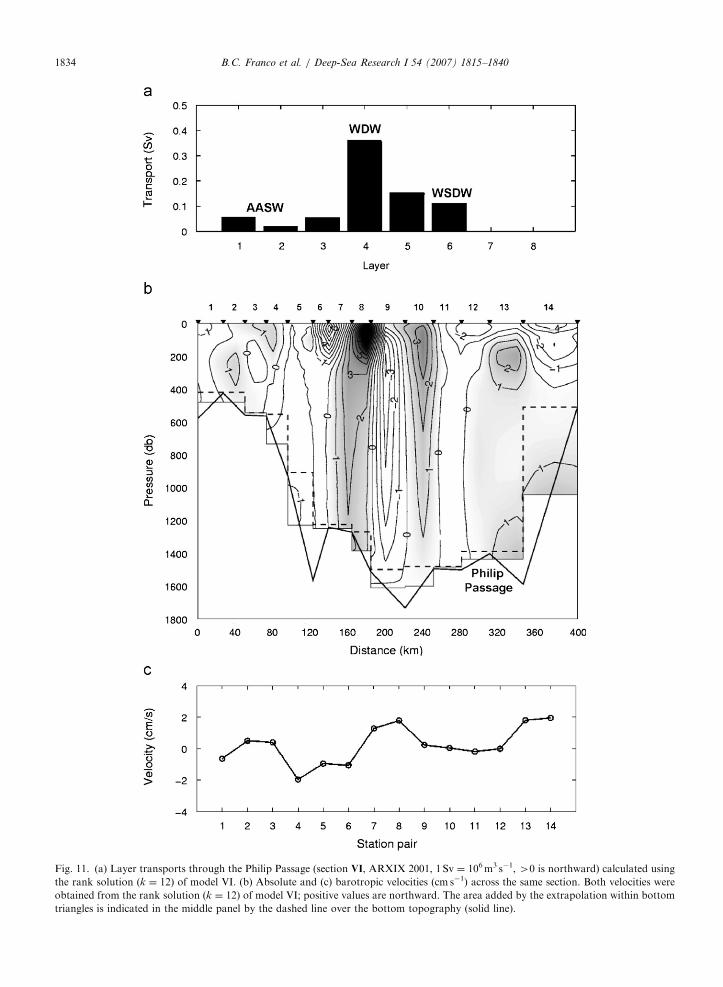
Fig. 11. (a) Layer transports through the Philip Passage (section VI, ARXIX 2001, 1 Sv ¼ 106m3 s�1, 40 is northward) calculated using
the rank solution (k ¼ 12) of model VI. (b) Absolute and (c) barotropic velocities (cm s�1) across the same section. Both velocities were
obtained from the rank solution (k ¼ 12) of model VI; positive values are northward. The area added by the extrapolation within bottom
triangles is indicated in the middle panel by the dashed line over the bottom topography (solid line).
B.C. Franco et al. / Deep-Sea Research I 54 (2007) 1815–18401834
ARTICLE IN PRESSB.C. Franco et al. / Deep-Sea Research I 54 (2007) 1815–1840 1835
reveal a strong meandering over the Philip Passage(section VI), with absolute velocities reaching about8–10 cm s�1 at station pairs 7 and 8 (Fig. 11b).WSDW and full-depth outflow through the PhilipPassage obtained in model VI are 0.11370.001 and0.7270.06 Sv, respectively. Therefore, WSDW out-flow in the summer of 2001 is similar to the0.1270.03 Sv estimated in the summer of 2000. Incontrast, the circulation derived from the inversionin the summer of 2001 suggests a sharp weakeningof the barotropic cyclonic flow in the Powell Basin.Barotropic velocities lower than 1 cm s�1 occupymost of the section over the basin and increase
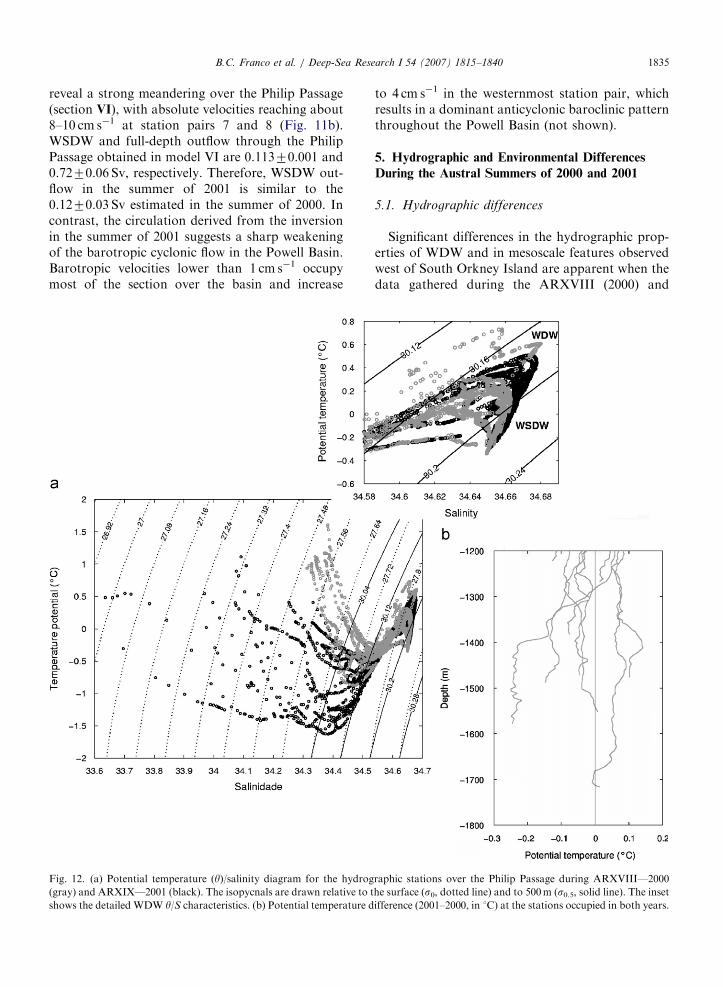
Fig. 12. (a) Potential temperature (y)/salinity diagram for the hydrog
(gray) and ARXIX—2001 (black). The isopycnals are drawn relative to t
shows the detailed WDW y/S characteristics. (b) Potential temperature d
to 4 cm s�1 in the westernmost station pair, whichresults in a dominant anticyclonic baroclinic patternthroughout the Powell Basin (not shown).
5. Hydrographic and Environmental Differences
During the Austral Summers of 2000 and 2001
5.1. Hydrographic differences
Significant differences in the hydrographic prop-erties of WDW and in mesoscale features observedwest of South Orkney Island are apparent when thedata gathered during the ARXVIII (2000) and
raphic stations over the Philip Passage during ARXVIII—2000
he surface (s0, dotted line) and to 500m (s0.5, solid line). The inset
ifference (2001–2000, in 1C) at the stations occupied in both years.

ARTICLE IN PRESSB.C. Franco et al. / Deep-Sea Research I 54 (2007) 1815–18401836
ARXIX (2001) cruises are compared. Von Gylden-feldt et al. (2002) suggested that the complextopography to the north of Powell Basin can inducemeandering and eddies. Several studies have docu-mented hydrographic variations of WDW proper-ties in the Weddell Sea (see Meredith et al., 2001;Robertson et al., 2002; Schroder et al., 2002;Fahrbach et al., 2004). Von Gyldenfeldt et al.(2002) pointed out a recent WDW warming trendover the Philip Passage in the northern PowellBasin. Colder and fresher surface waters areobserved across the hydrographic section over thePhilip Passage taken during the summer of 2001than in 2000 (Fig. 12a). Warmer and saltier WDWand colder WSDW were also observed in 2001 thanin 2000 (Fig. 12a and b). The WDW potentialtemperature maximum is approximately 0.2 1Chigher and approximately 0.02 saltier in 2001 thanin the previous summer. WSDW below about1300m was up to 0.25 1C colder in the summer of2001 (Fig. 12b). The warmest WDW (y � 0.73 1C)observed in the Philip Passage in 2000 was in theeastern passage (Fig. 2a). According to the circula-tion derived from the inversion these waters flowsouthward through the Philip Passage, whichsuggests mixing with warmer waters from the ScotiaSea (see Fig. 9b).
Fig. 13. Sea-level pressure (hPa, upper panels) and sea-surface wind
(December–February) of 2000 (left) and 2001 (right).
5.2. Atmospheric conditions
Sea-level pressure (SLP) and sea-surface windstress data from the National Center for Environ-mental Prediction/National Center for AtmosphericResearch (NCEP/NCAR) Reanalysis Project(Kalnay et al., 1996) were used to characterizethe large-scale atmospheric conditions in summer(December–February) of 2000 and 2001. SLP dataare supplied by NOAA-CIRES Climate DiagnosticsCenter (http://www.cdc.noaa.gov) over a 2.51� 2.51grid. Monthly mean sea-surface wind stress data areprovided by NOAA-CDAS1 and obtained throughthe International Research Institute for Climate andSociety (IRI/LDEO Climate Data Library, http://ingrid.ldeo.columbia.edu). During the summer of2000 a low SLP center (o981 hPa) located east ofthe Antarctic Peninsula induced northwesterlywinds over the northwestern Weddell Sea and thePowell Basin (Fig. 13). In contrast, during thefollowing summer, northerly and northeasterlywinds, associated with a low-pressure center locatedwest of the Peninsula, are observed. Anomalousatmospheric patterns periodically reaching theWeddell Sea from the west are known to perturbthe sea ice circulation and distribution (Venegas andDrinkwater, 2001). Since the oceanic flow is largely
stress vectors (Pa, lower panels) during the austral summers
ARTICLE IN PRESS
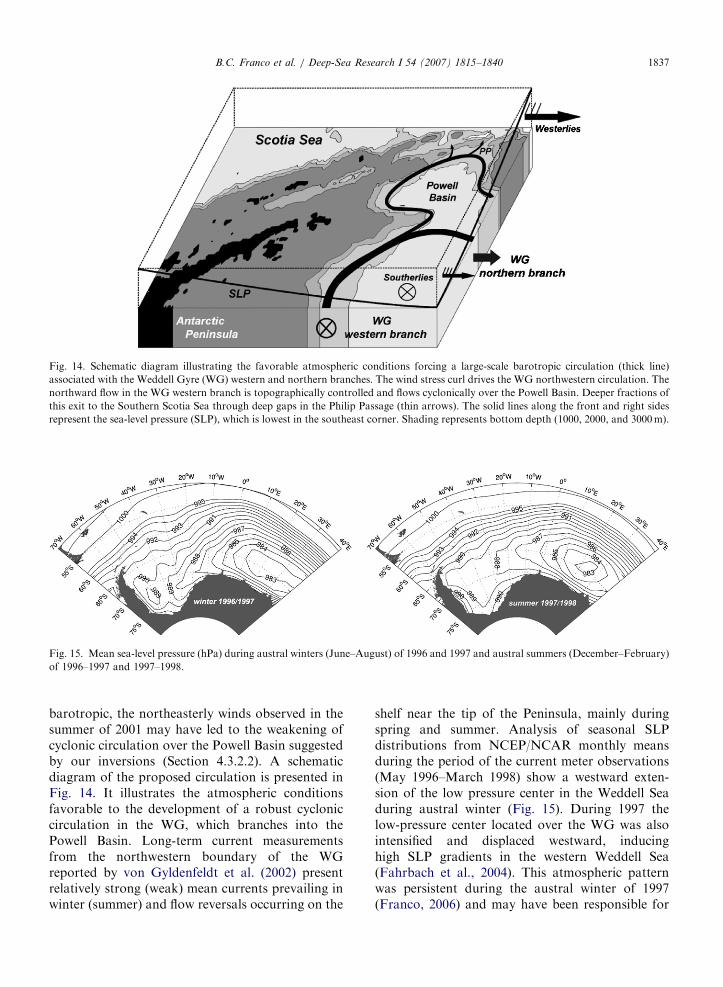
Fig. 14. Schematic diagram illustrating the favorable atmospheric conditions forcing a large-scale barotropic circulation (thick line)
associated with the Weddell Gyre (WG) western and northern branches. The wind stress curl drives the WG northwestern circulation. The
northward flow in the WG western branch is topographically controlled and flows cyclonically over the Powell Basin. Deeper fractions of
this exit to the Southern Scotia Sea through deep gaps in the Philip Passage (thin arrows). The solid lines along the front and right sides
represent the sea-level pressure (SLP), which is lowest in the southeast corner. Shading represents bottom depth (1000, 2000, and 3000m).
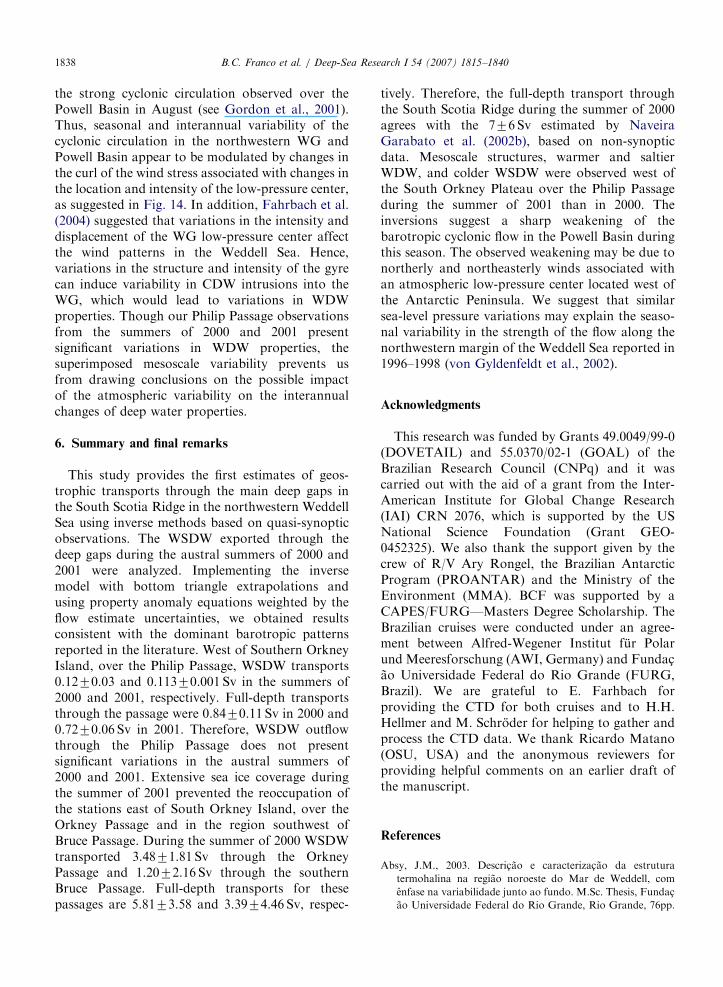
Fig. 15. Mean sea-level pressure (hPa) during austral winters (June–August) of 1996 and 1997 and austral summers (December–February)
of 1996–1997 and 1997–1998.
B.C. Franco et al. / Deep-Sea Research I 54 (2007) 1815–1840 1837
barotropic, the northeasterly winds observed in thesummer of 2001 may have led to the weakening ofcyclonic circulation over the Powell Basin suggestedby our inversions (Section 4.3.2.2). A schematicdiagram of the proposed circulation is presented inFig. 14. It illustrates the atmospheric conditionsfavorable to the development of a robust cycloniccirculation in the WG, which branches into thePowell Basin. Long-term current measurementsfrom the northwestern boundary of the WGreported by von Gyldenfeldt et al. (2002) presentrelatively strong (weak) mean currents prevailing inwinter (summer) and flow reversals occurring on the
shelf near the tip of the Peninsula, mainly duringspring and summer. Analysis of seasonal SLPdistributions from NCEP/NCAR monthly meansduring the period of the current meter observations(May 1996–March 1998) show a westward exten-sion of the low pressure center in the Weddell Seaduring austral winter (Fig. 15). During 1997 thelow-pressure center located over the WG was alsointensified and displaced westward, inducinghigh SLP gradients in the western Weddell Sea(Fahrbach et al., 2004). This atmospheric patternwas persistent during the austral winter of 1997(Franco, 2006) and may have been responsible for
ARTICLE IN PRESSB.C. Franco et al. / Deep-Sea Research I 54 (2007) 1815–18401838
the strong cyclonic circulation observed over thePowell Basin in August (see Gordon et al., 2001).Thus, seasonal and interannual variability of thecyclonic circulation in the northwestern WG andPowell Basin appear to be modulated by changes inthe curl of the wind stress associated with changes inthe location and intensity of the low-pressure center,as suggested in Fig. 14. In addition, Fahrbach et al.(2004) suggested that variations in the intensity anddisplacement of the WG low-pressure center affectthe wind patterns in the Weddell Sea. Hence,variations in the structure and intensity of the gyrecan induce variability in CDW intrusions into theWG, which would lead to variations in WDWproperties. Though our Philip Passage observationsfrom the summers of 2000 and 2001 presentsignificant variations in WDW properties, thesuperimposed mesoscale variability prevents usfrom drawing conclusions on the possible impactof the atmospheric variability on the interannualchanges of deep water properties.
6. Summary and final remarks
This study provides the first estimates of geos-trophic transports through the main deep gaps inthe South Scotia Ridge in the northwestern WeddellSea using inverse methods based on quasi-synopticobservations. The WSDW exported through thedeep gaps during the austral summers of 2000 and2001 were analyzed. Implementing the inversemodel with bottom triangle extrapolations andusing property anomaly equations weighted by theflow estimate uncertainties, we obtained resultsconsistent with the dominant barotropic patternsreported in the literature. West of Southern OrkneyIsland, over the Philip Passage, WSDW transports0.1270.03 and 0.11370.001 Sv in the summers of2000 and 2001, respectively. Full-depth transportsthrough the passage were 0.8470.11 Sv in 2000 and0.7270.06 Sv in 2001. Therefore, WSDW outflowthrough the Philip Passage does not presentsignificant variations in the austral summers of2000 and 2001. Extensive sea ice coverage duringthe summer of 2001 prevented the reoccupation ofthe stations east of South Orkney Island, over theOrkney Passage and in the region southwest ofBruce Passage. During the summer of 2000 WSDWtransported 3.4871.81 Sv through the OrkneyPassage and 1.2072.16 Sv through the southernBruce Passage. Full-depth transports for thesepassages are 5.8173.58 and 3.3974.46 Sv, respec-
tively. Therefore, the full-depth transport throughthe South Scotia Ridge during the summer of 2000agrees with the 776 Sv estimated by NaveiraGarabato et al. (2002b), based on non-synopticdata. Mesoscale structures, warmer and saltierWDW, and colder WSDW were observed west ofthe South Orkney Plateau over the Philip Passageduring the summer of 2001 than in 2000. Theinversions suggest a sharp weakening of thebarotropic cyclonic flow in the Powell Basin duringthis season. The observed weakening may be due tonortherly and northeasterly winds associated withan atmospheric low-pressure center located west ofthe Antarctic Peninsula. We suggest that similarsea-level pressure variations may explain the seaso-nal variability in the strength of the flow along thenorthwestern margin of the Weddell Sea reported in1996–1998 (von Gyldenfeldt et al., 2002).
Acknowledgments
This research was funded by Grants 49.0049/99-0(DOVETAIL) and 55.0370/02-1 (GOAL) of theBrazilian Research Council (CNPq) and it wascarried out with the aid of a grant from the Inter-American Institute for Global Change Research(IAI) CRN 2076, which is supported by the USNational Science Foundation (Grant GEO-0452325). We also thank the support given by thecrew of R/V Ary Rongel, the Brazilian AntarcticProgram (PROANTAR) and the Ministry of theEnvironment (MMA). BCF was supported by aCAPES/FURG—Masters Degree Scholarship. TheBrazilian cruises were conducted under an agree-ment between Alfred-Wegener Institut fur Polarund Meeresforschung (AWI, Germany) and Fundac-ao Universidade Federal do Rio Grande (FURG,Brazil). We are grateful to E. Farhbach forproviding the CTD for both cruises and to H.H.Hellmer and M. Schroder for helping to gather andprocess the CTD data. We thank Ricardo Matano(OSU, USA) and the anonymous reviewers forproviding helpful comments on an earlier draft ofthe manuscript.
References
Absy, J.M., 2003. Descric- ao e caracterizac- ao da estrutura
termohalina na regiao noroeste do Mar de Weddell, com
enfase na variabilidade junto ao fundo. M.Sc. Thesis, Fundac-
ao Universidade Federal do Rio Grande, Rio Grande, 76pp.
ARTICLE IN PRESSB.C. Franco et al. / Deep-Sea Research I 54 (2007) 1815–1840 1839
Arhan, M., Heywood, K.J., King, B.A., 1999. The deep waters
from the Southern ocean at the entry to the Argentine Basin.
Deep-Sea Research II 46 (1–2), 475–499.
Bennett, A.F., 1992. Inverse Methods in Physical Oceanography.
Cambridge University Press, Cambridge, UK, 346pp.
Bindoff, N.L., Rintoul, S.R., Massom, R., 2000. Bottom water
formation and polynyas in Adelie land, Antarctica. Papers
and Proceedings of the Royal Society of Tasmania 133,
51–56.
Carmack, E.C., Foster, T.D., 1975. On the flow of water out of
the Weddell Sea. Deep-Sea Research 22 (11), 711–724.
Deacon, G.E.R., 1933. A general account of the hydrology of the
South Atlantic Ocean. Discovery Reports 7, 171–238.
Fahrbach, E., Rohardt, G., Schroder, M., Strass, V., 1994.
Transport and structure of the Weddell Gyre. Annales
Geophysicae 12, 840–855.
Fahrbach, E., Rohardt, G., Scheele, N., Schroder, M., Strass, V.,
Wisotzki, A., 1995. Formation and discharge of deep and
bottom water in the northwestern Weddell Sea. Journal of
Marine Research 53, 515–538.
Fahrbach, E., Schroder, M., Klepikov, A., 1998. Circulation and
water masses in the Weddell Sea. In: Physics of Ice-Covered
Seas, Lecture Notes from a Summer School in Savonlinna,
Finland, 6–17 June, 1994. Helsinki University Press.
Fahrbach, E., Harms, S., Rohardt, G., Schroder, M., Woodgate,
R.A., 2001. Flow of bottom water in the northwestern
Weddell Sea. Journal of Geophysical Research 106,
2761–2778.
Fahrbach, E., Hoppema, M., Rohardt, G., Schroder, M.,
Wisotzki, A., 2004. Decadal-scale variations of water mass
properties in the deep Weddell Sea. Ocean Dynamics 54,
77–91.
Foldvik, A., Gammelsrod, T., Torresen, T., 1985. Circulation
and water masses on the southern Weddell Sea shelf. In:
Jacobs, S.S. (Ed.), Oceanology of the Antarctic Continental
Shelf Antarctic Research Series, Vol. 43. American Geophy-
sical Union, Washington, DC, pp. 5–20.
Foster, T.D., Carmack, E.C., 1976. Frontal zone mixing and
Antarctic Bottom Water formation in the southern Weddell
Sea. Deep-Sea Research 23 (4), 301–317.
Franco, B.C., 2006. Exportac- ao de aguas profundas na regiao
noroeste do Mar de Weddell, Antartica: Enfase na variabi-
lidade temporal. M.Sc. Thesis, Fundac- ao Universidade
Federal do Rio Grande, Rio Grande do Sul, Rio Grande,
142pp.
Gammelsrod, T., Foldvik, A., Nost, O.A., Skagsetil, O.,
Anderson, L.G., Fogelqvist, E., Olsson, K., Tanhua, T.,
Jones, E.P., Osterhus, S., 1994. Distribution of water masses
on the continental shelf in the southern Weddell Sea. In:
Johannessen, O.M., Muench, R.D., Overland, J.E. (Eds.),
The Polar Oceans and their Role in Shaping the Global
Environment: The Nansen Centennial Volume, Vol. 85.
Geophysical Monograph, AGU, Washington, pp. 959–979.
Ganachaud, A., 1999. Large scale oceanic circulation and fluxes
of freshwater, heat, nutrients and oxygen. Ph.D. Thesis,
Massachusetts Institute of Technology/Woods Hole Oceano-
graphic Institution, Cambridge, MA, 267pp.
Garrett, C., Munk, W.H., 1979. Internal waves in the ocean.
Annual Review of Fluid Mechanics 11, 339–369.
Georgi, D.T., 1981. Circulation and bottom waters in the
southwestern South Atlantic. Deep-Sea Research 28 (9A),
959–979.
Gille, S.T., 1999. Mass, heat, and salt transport in the south-
eastern Pacific: a circumpolar Current inverse model. Journal
of Geophysical Research 104, 5191–5209.
Gordon, A.L., 1998. Western Weddell Sea thermohaline strati-
fication. In: Jacobs, S.S., Weiss, R.F. (Eds.), Ocean, Ice and
Atmosphere: Interactions at the Antarctic Continental
Margin. Antarctic Research Series, Vol. 75. American
Geophysical Union, Washington DC, pp. 215–240.
Gordon, A.L., Huber, B.A., 1984. Thermohaline stratification
below the Southern Ocean sea ice. Journal of Geophysical
Research 89, 641–648.
Gordon, A.L., Huber, B.A., Hellmer, H.H., Field, A., 1993. Deep
and bottom water of the Weddell Sea’s western rim. Science
262, 95–97.
Gordon, A.L., Mensch, M., Dong, Z., Smethie Jr., W.M., de
Betterncourt, J., 2000. Deep and bottom waters of the
Bransfield Strait eastern and central basins. Journal of
Geophysical Research 105, 11337–11346.
Gordon, A.L., Visbeck, M., Huber, B., 2001. Export of Weddell
Sea deep and bottom water. Journal of Geophysical Research
106, 9005–9018.
Heywood, K.J., Naveira Garabato, A.C., Stevens, D.P., 2002.
High mixing rates in the abyssal Southern Ocean. Nature 415,
1011–1014.
Jackett, D.R., McDougall, T.J., 1997. A neutral density variable
for the World’s Oceans. Journal of Physical Oceanography
27, 237–263.
Kalnay, E., Kanamitsu, M., Kistler, R., Collins, W., Deaven, D.,
Gandin, L., Iredell, M., Sha, S., White, G., Woollen, J., Zhu,
Y., Chelliah, M., Ebisuzaki, W., Higgins, W., Janowiak, J.,
Mo, K.C., Ropelewski, C., Wang, J., Leetmaa, A., Reynolds,
R., Jenne, R., Joseph, D., 1996. The NCEP/NCAR 40-year
reanalysis project. Bulletin of the American Meteorological
Society 77, 437–471.
LaBrecque, J.L., Rabinowitz, P.D., Brenner, C., 1981. General
Bathymetric chart of the Oceans (GEBCO 5:16). Canadian
Hydrographic Office, Ottawa, Canada.
Lanczos, C., 1961. Linear Differential Operators. Van Nostrand,
Princeton, NJ, 564pp.
Levitus, S., Antonov, J.I., Boyer, T.B., Stephens, C., 2000.
Warming of the World Ocean. Science 287, 2225–2229.
Locarnini, R.A., Whitworth III, T., Nowlin Jr., W.D., 1993. The
importance of the Scotia Sea on the outflow of Weddell Sea
Deep Water. Journal of Marine Research 51, 135–153.
Macdonald, A.M., 1993. Property fluxes at 301S and their
implications for the Pacific–Indian throughflow and the
global heat budget. Journal of Geophysical Research 98,
6851–6868.
Mantyla, A.W., Reid, J.L., 1983. Abyssal characteristics of
the World Oceans waters. Deep-Sea Research 30 (8A),
805–833.
Matano, R.P., Gordon, A.L., Muench, R.D., Palma, E.D., 2002.
A numerical study of the circulation in the northwestern
Weddell Sea. Deep-Sea Research II 49 (21), 4827–4841.
McIntosh, P.C., Rintoul, S.R., 1997. Do box inverse models
work? Journal of Physical Oceanography 27, 291–308.
Meredith, M.P., Naveira Garabato, A.C., Steves, D.P.,
Heywood, K.J., Sanders, R.J., 2001. Deep and bottom waters
in the eastern Scotia Sea: rapid changes in properties and
circulation. Journal of Physical Oceanography 31, 2157–2168.
Morgan, P.P., 1994. Box inverse modelling with DOBOX 4.2.
CSIRO Marine Laboratories Report 225, 26pp.

ARTICLE IN PRESSB.C. Franco et al. / Deep-Sea Research I 54 (2007) 1815–18401840
Muench, R.D., Gordon, A.L., 1995. Circulation and transport of
water along the western Weddell Sea margin. Journal of
Geophysical Research 100, 18503–18515.
Muench, R.D., Hellmer, H.H., 2002. The international DOVE-
TAIL program. Deep-Sea Research II 49 (21), 4711–4714.
Munk, W.H., 1981. Internal waves. In: Warren, B.A., Wunsch,
C. (Eds.), Evolution of Physical Oceanography, Scientific
surveys in honor of Henry Stommel. MIT Press, Cambridge,
MA, pp. 264–291.
Naveira Garabato, A.C., Heywood, K.J., Stevens, D.P., 2002a.
Modification and pathways of Southern Ocean deep waters in
the Scotia Sea. Deep-Sea Research I 49 (4), 681–705.
Naveira Garabato, A.C., McDonagh, E.L., Stevens, D.P.,
Heywood, K.J., Sanders, R.J., 2002b. On the export of
Antarctic Bottom Water from the Weddell Sea. Deep-Sea
Research II 49 (21), 4715–4742.
Naveira Garabato, A.C., Stevens, D.P., Heywood, K.J., 2003.
Water mass conversion, fluxes, and mixing in the Scotia Sea
diagnosed by an inverse model. Journal of Physical Oceano-
graphy 33, 2565–2587.
Naveira Garabato, A.C., Polzin, K.L., King, B.A., Heywood,
K.J., Visbeck, M., 2004. Widespread intense turbulent mixing
in the Southern Ocean. Science 303, 210–213.
Nowlin Jr., W.D., Zenk, W., 1988. Westward bottom currents
along the margin of the South Shetland Island Arc. Deep-Sea
Research 35 (2), 269–301.
Orsi, A.H., Nowlin Jr., W.D., Whitworth III, T., 1993. On the
circulation and stratification of the Weddell Gyre. Deep-Sea
Research I 40 (1), 169–203.
Orsi, A.H., Whitworth III, T., Nowlin Jr., W.D., 1995. On the
meridional extent and fronts of the Antarctic Circumpolar
Current. Deep-Sea Research I 42 (5), 641–673.
Orsi, A.H., Johnson, G.C., Bullister, J.L., 1999. Circulation,
mixing, and production of Antarctic Bottom Water. Progress
in Oceanography 43, 55–109.
Padman, L., Howard, S., Muench, R., 2006. Internal tide
generation along the South Scotia Ridge. Deep-Sea Research
II 53 (1–2), 157–171.
Reid, J.L., Lynn, R.J., 1971. On the influence of the Norwegian-
Greenland and Weddell seas upon the bottom waters of the
Indian and Pacific oceans. Deep-Sea Research 18, 1063–1088.
Rintoul, S.R., 1991. South Atlantic interbasin exchange. Journal
of Geophysical Research 96, 2675–2692.
Rintoul, S.R., 1998. On the origin and influence of Adelie Land
Bottom Water. In: Jacobs, S.S., Weiss, R.F. (Eds.), Ocean, Ice,
and Atmosphere. Interactions at the Antarctic Continental
Margin. Antarctic Research Series, vol. 75, pp. 151–171.
Robertson, R., Visbeck, M., Gordon, A.L., Fahrbach, E., 2002.
Long-term temperature trends in deep waters of the Weddell
Sea. Deep-Sea Research II 49 (21), 4791–4806.
Roemmich, D., 1981. Circulation of the Caribbean Sea: A well-
resolved inverse problem. Journal of Geophysical Research
86, 7993–8005.
Roemmich, D., Wunsch, C., 1985. Two transatlantic sections:
meridional circulation and heat flux in the subtropical
North Atlantic Ocean. Deep-Sea Research 32 (6),
619–664.
Schodlok, M.P., Hellmer, H.H., Beckmann, A., 2002. On the
transport, variability and origin of dense water masses
crossing the South Scotia Ridge. Deep-Sea Research. II 49
(21), 4807–4825.
Schroder, M., Fahrbach, E., 1999. On the structure and the
transport in the eastern Weddell Gyre. Deep-Sea Research II
46 (1–2), 501–527.
Schroder, M., Hellmer, H.H., Absy, J.M., 2002. On the near-
bottom variability in the northwestern Weddell Sea. Deep-Sea
Research.II 49 (21), 4767–4790.
Venegas, S.A., Drinkwater, M.R., 2001. Sea ice, atmosphere and
upper ocean variability in the Weddell Sea, Antarctica.
Journal of Geophysical Research 106, 16747–16766.
von Gyldenfeldt, A.-B., Fahrbach, E., Garcia, M.A., Schroder,
M., 2002. Flow variability at the tip of the Antarctic
Peninsula. Deep-Sea Research II 49 (21), 4743–4746.
Whitworth III, T., Orsi, A.H., Kim, S.-J., Nowlin Jr., W.D.,
Locarnini, R.A., 1998. Water masses and mixing near the
Antarctic Slope Front. In: Jacobs, S.S., Weiss, R.F. (Eds.),
Ocean, Ice, and Atmosphere: Interactions at the Antarctic
Continental Margin. Antarctic Research Series, vol. 75,
pp. 1–27.
Wunsch, C., 1977. Determining the general circulation of the
oceans: A preliminary discussion. Science 196, 871–875.
Wunsch, C., 1978. The North Atlantic general circulation west of
501W determined by inverse methods. Reviews of Geophysics
and Space Physics 16, 583–620.
Wunsch, C., 1996. The ocean circulation inverse problem.
Cambridge University Press, Cambridge, 437pp.
Wust, G., 1933. Das Bodenwasser und die Gliederung der
Atlantischen Tiefsee. Wissenschaftliche Ergebnisse der
Deutschen Atlantischen Expedition auf dem Forschungs-
und Vermessungsschiff ‘‘Meteor’’ 1925–1927, 6, 1–106.
Yaremchuk, M., Nechaev, D., Schroter, J., Fahrbach, E., 1998. A
dynamically consistent analysis of circulation and transports
in the southwestern Weddell Sea. Annales Geophysicae 16,
1024–1038.
Copyright © 2022 FDOKUMEN