Report Summers Birla Sunlife Copy
116
WELINGKAR INSTITUTE OF MANAGEMENT DEVELOPMENT & RESEARCH SUMMER PROJECT ON “PORTFOLIO ANALYSIS & MANAGEMENT” BY ALEKH VAGRECHA PGDM 2010 – 12 TRIMESTER IV SPECIALISATION: FINANCE ROLL NO: 138 1
Transcript of Report Summers Birla Sunlife Copy

WELINGKAR INSTITUTE OF MANAGEMENT DEVELOPMENT & RESEARCH
SUMMER PROJECT
ON
“PORTFOLIO ANALYSIS & MANAGEMENT”
BY
ALEKH VAGRECHA
PGDM 2010 – 12 TRIMESTER IV
SPECIALISATION: FINANCE
ROLL NO: 138
1
ACKOWLEDGEMENT
It is my great pleasure and privilege to acknowledge the valuable
guidance and support; I received in the preparation of this
project report.
I wish to express my sincere gratitude and thankfulness to Mr.
Vinod Subramanian, Business Partner, Birla Sun Life Insurance
Company Ltd. Who obliged me a chance to complete my summer
training at this esteemed Organization.
I am extremely thankful to the officers and staff of Birla Sun
Life Insurance Company Ltd. For their Kind Cooperation and
immense help, without their support and valuable guidance my
project would have never seen the light of the day.
This note of thanks would be incomplete if I do not thank my co-
trainees from Welingkar, K.C.College & Fr.Agnel College with whom
I have worked in groups during the project and advisors of Birla
Sunlife Insurance with whom I have worked during last stage of
the project & has learned valuable things from them and Academic
2

Development Cell (ADC) & faculty members, who always encourage us
to do challenging tasks.
I am deeply indebted to my parents and friends for providing me
all necessary help in completing my project.
3

INDEX
SR.NO DESCRIPTION PAGENO.
1. ABOUT BIRLA SUNLIFE INSURANCE 42. INTRODUCTION TO INDIAN INSURANCE INDUSTRY
2.1 HISTORY 52.2 PLAYERS IN THE INDIAN INSURANCE SECTOR 62.3 ROLE OF IRDA 82.4 TYPE OF INSURANCE POLICIES 82.5 INTRODUCTION TO ULIPS 10
3. EXECUTIVE SUMMARY 124. RESEARCH METHODOLOGY 135. PORTFOLIO ANALYSIS & MANAGEMENT 16
5.1 WHAT IS PORTFOLIO MANAGEMENT 165.2 MAGNIFIER FUND 185.3 MAXIMISER FUND 19
6. SECURITY ANALYSIS 206.1 Larsen & Toubro6.1.1 ABOUT THE COMPANY 226.1.2 KEY FUNDAMENTALS 246.1.3 TREND ANALYSIS 276.1.4 BALANCE SHEET ANALYSIS 366.2 AXIS BANK6.2.1 ABOUT THE COMPANY 386.2.2 KEY FUNDAMENTALS 396.2.3 TREND ANALYSIS 426.3 BALANCE SHEET ANALYSIS 50
7. COMPETITOR ANALYSIS (ULIPs COMPARISION)7.1 INTRODUCTION TO BSIL CLASSIC LIFE PLAN 527.2 COMPARISION WITH COMPETITION 547.3 INTRODUCTION TO BSIL PLATINUM ADVANTAGE PLAN 67
4
7.4 COMPARISION WITH COMPETITION 688. ULIPs Vs MUTUAL FUNDS
8.1 INTRODUCTION TO BSIL FORESIGHT PLAN 768.2 RETURNS COMPARISION OF FORESIGHT Vs. MUTUAL FUND
79
9. SUMMARY & CONCLUSIONS 8210. RECOMMENDATIONS 8311. REFERENCES & BIBILOGRAPHY 84
1.ABOUT BIRLA SUNLIFE INSURANCE
Established in 2000, Birla Sun Life Insurance Company Limited
(BSLI) is a joint venture between the Aditya Birla Group, A
US $30 billion corporation, anchored by an extraordinary force
of 130,000 employees, belonging to 40 different nationalities
operating in 27 countries across six continents and Sun Life
Financial Inc, leading international financial services
organization from Canada. The local knowledge of the Aditya
Birla Group combined with the domain expertise of Sun Life
Financial Inc., offers a formidable protection for its
customers' future. With an experience of over 10 years, BSLI
has contributed significantly to the growth and development of
the life insurance industry in India and currently ranks
amongst the top 6 private life insurance companies in the
country.
Known for its innovation and creating industry benchmarks,
BSLI has several firsts to its credit. It was the first Indian
Insurance Company to introduce "Free Look Period" and the same
5

was made mandatory by IRDA for all other life insurance
companies. Additionally, BSLI pioneered the launch of Unit
Linked Life Insurance plans amongst the private players in
India. To establish credibility and further transparency, BSLI
also enjoys the prestige to be the originator of practice to
disclose portfolio on monthly basis. BSLI offer the complete
bouquet of insurance products viz. pure term plan, life stage
products, health plan, retirement plan & Unit Linked Insurance
Plans (ULIPs) etc.
Add to this, the extensive reach through its network of 600
branches and 1, 47,900 empanelled advisors. This impressive
combination of domain expertise, product range, reach and ears
on ground, helped BSLI cover more than 2.4 million lives since
it commenced operations and establish a customer base spread
across more than 1500 towns and cities in India. BSLI has
ensured that it has lowest outstanding claims ratio of 0.00%
for FY 2010-11.. Such services are well supported by sound
financials that the Company has. The AUM of BSLI stood at
19725 crs as on April 30, 2011, while the company has a robust
capital base of Rs. 2450 crs.
2. INTRODUCTION TO INDIAN INSURANCE INDUSTRY2.1 HISTORY
Insurance in India has its history dating back till 1818, when
Oriental Life Insurance Company was started by Europeans in
6
Kolkata to cater to the needs of European community. Pre-
independent era in India saw discrimination among the life of
foreigners and Indians with higher premiums being charged for
the latter. It was only in the year 1870, Bombay Mutual Life
Assurance Society, the first Indian insurance company covered
Indian lives at normal rates.
At the dawn of the twentieth century, insurance companies
started mushrooming up. In the year 1912, the Life Insurance
Companies Act, and the Provident Fund Act were passed to
regulate the insurance business. The Life Insurance Companies
Act, 1912 made it necessary that the premium rate tables and
periodical valuations of companies should be certified by an
actuary. However, discrimination still existed between Indian
and foreign companies. The oldest existing insurance company
in India is National Insurance Company Ltd, which was founded
in 1906 and is doing business even today. The Insurance
industry earlier consisted of only two state insurers: Life
Insurers i.e. Life Insurance Corporation of India and General
Insurers i.e. General Insurance Corporation of India.
This millennium has seen insurance come a full circle in a
journey extending to nearly 200 years. The process of re-
opening of the sector had begun in the early 1990s and the
last decade and more has seen it been opened up substantially.
In 1993, the Government set up a committee under the
chairmanship of RN Malhotra, former Governor of RBI, to
propose recommendations for reforms in the insurance sector.
7
The objective was to complement the reforms initiated in the
financial sector. The committee submitted its report in 1994
wherein, among other things, it recommended that the private
sector be permitted to enter the insurance industry. They
stated that foreign companies be allowed to enter by floating
Indian companies, preferably a joint venture with Indian
partners.
Following the recommendations of the Malhotra Committee
report, in 1999, the Insurance Regulatory and Development
Authority (IRDA) was constituted as an autonomous body to
regulate and develop the insurance industry. The IRDA was
incorporated as a statutory body in April, 2000. The key
objectives of the IRDA include promotion of competition so as
to enhance customer satisfaction through increased consumer
choice and lower premiums, while ensuring the financial
security of the insurance market.
The IRDA opened up the market in August 2000 with the
invitation for application for registrations. Foreign
companies were allowed ownership of up to 26%. The Authority
has the power to frame regulations under Section 114A of the
Insurance Act, 1938 and has from 2000 onwards framed various
regulations ranging from registration of companies for
carrying on insurance business to protection of policyholders’
interests. In December, 2000, the subsidiaries of the General
Insurance Corporation of India were restructured as
8
independent companies and at the same time GIC was converted
into a national re-insurer. Parliament passed a bill de-
linking the four subsidiaries from GIC in July, 2002.
The insurance sector is a colossal one and is growing at a speedy
rate of 15-20%. Together with banking services, insurance services
add about 7% to the country’s GDP. A well-developed and evolved
insurance sector is a boon for economic development as it provides
long- term funds for infrastructure development at the same time
strengthening the risk taking ability of the country.
2.2 PLAYERS IN THE INDIAN INSURANCE SECTOR
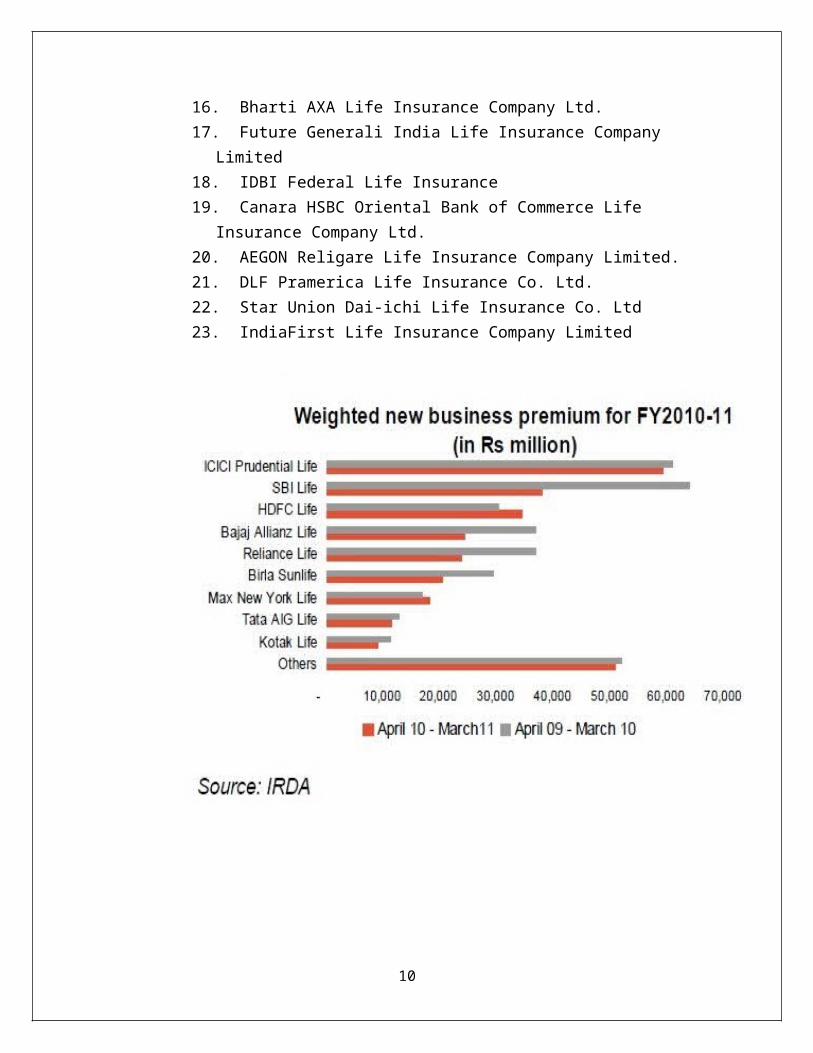
Today there are 24 general insurance companies including the
ECGC and Agriculture Insurance Corporation of India and
23 life insurance companies operating in the country.
1. Bajaj Allianz Life Insurance Company Limited2. Birla Sun Life Insurance Co. Ltd 3. HDFC Standard Life Insurance Co. Ltd 4. ICICI Prudential Life Insurance Co. Ltd 5. ING Vysya Life Insurance Company Ltd.6. Life Insurance Corporation of India7. Max New York Life Insurance Co. Ltd 8. Met Life India Insurance Company Ltd.9. Kotak Mahindra Old Mutual Life Insurance Limited10. SBI Life Insurance Co. Ltd 11. Tata AIG Life Insurance Company Limited 12. Reliance Life Insurance Company Limited.13. Aviva Life Insurance Company India Limited14. Sahara India Life Insurance Co, Ltd.15. Shriram Life Insurance Co, Ltd.
9
16. Bharti AXA Life Insurance Company Ltd. 17. Future Generali India Life Insurance Company
Limited 18. IDBI Federal Life Insurance19. Canara HSBC Oriental Bank of Commerce Life
Insurance Company Ltd. 20. AEGON Religare Life Insurance Company Limited. 21. DLF Pramerica Life Insurance Co. Ltd.22. Star Union Dai-ichi Life Insurance Co. Ltd23. IndiaFirst Life Insurance Company Limited
10
2.3 ROLE OF IRDA
The Insurance Regulatory and Development Authority Act of 1999
brought about several crucial policy changes in the insurance
sector of India. It led to the formation of the Insurance
Regulatory and Development Authority (IRDA) in 2000.
The goals of the IRDA are to safeguard the interests of
insurance policyholders, as well as to initiate different
policy measures to help sustain growth in the Indian insurance
sector.
IRDA has notified Protection of Policyholders Interest
Regulations 2001 to provide for: policy proposal documents in
easily understandable language; claims procedure in both life
and non-life; setting up of grievance redressal machinery;
speedy settlement of claims; and policyholders' servicing. The
Regulation also provides for payment of interest by insurers
for the delay in settlement of claim.
The insurers are required to maintain solvency margins so that
they are in a position to meet their obligations towards
policyholders with regard to payment of claims. It is
obligatory on the part of the insurance companies to disclose
clearly the benefits, terms and conditions under the policy.
The advertisements issued by the insurers should not mislead
the insuring public. All insurers are required to set up
proper grievance redress machinery in their head office and at
11
their other offices. The Authority takes up with the insurers
any complaint received from the policyholders in connection
with services provided by them under the insurance contract.
2.4 TYPES OF INSURANCE POLICIES
Taking out a life insurance policy covers the risk of dying
early, by providing for your family in the event of your
death. It also manages the risk of retirement providing an
income for you in non-earning years. Choosing the right policy
type with the coverage that is right for you therefore becomes
critical.
There are a variety of policies available in the market,
ranging from Term Endowment and Whole Life Insurance, to Money
Back Policies, ULIPs, and Pension plans. Let's see what each
of these is about, so that you can consider the one that best
suits you.
Term Insurance
Term Insurance, as the name implies, is for a specific period,
and has the lowest possible premium among all insurance plans.
You can select the length of the term for which you would like
coverage, up to 35 years.
Payments are fixed and do not increase during your term
period. In case of an untimely death, your dependents will
receive the benefit amount specified in the term life
12
insurance agreement. You can customize Term life insurance
with the addition of riders, such as Child, Waiver of Premium,
or Accidental Death.
Endowment Insurance
Endowment Insurance is ideal if you have a short career path,
and hope to enjoy the benefits of the plan (the original sum
and the accumulated bonus) in your life time.
Endowment plans are especially useful when you retire; by
buying an annuity policy with the sum received, it generates a
monthly pension for the rest of your life.
Whole Life Insurance
Whole Life Policies have no fixed end date for the policy;
only the death benefit exists and is paid to the named
beneficiary. The policy holder is not entitled to any money
during his or her own lifetime, i.e., there is no survival
benefit. This plan is ideal in the case of leaving behind an
estate.
Primary advantages of Whole Life Insurance are guaranteed
death benefits, guaranteed cash values, and fixed and known
annual premiums.
Money-Back Plan
In a Money-Back plan, you regularly receive a percentage of
the sum assured during the lifetime of the policy. Money-Back
13
plans are ideal for those who are looking for a product that
provides both - insurance cover and savings.
It creates a long-term savings opportunity with a reasonable
rate of return, especially since the payout is considered
exempt from tax except under specified situations.
ULIP
Unit-linked Insurance Plans (ULIPs), introduced by the private
players, are hugely popular, because they combine the benefits
of life insurance policies with mutual funds. A certain part
of the premium is invested in listed equities/debt
funds/bonds, and the balance is used to provide for life
insurance and fund management expenses.
Pension Plan
Insurance companies offer two kinds of pension plans -
endowment and unit linked. Endowment plans invest in fixed
income products, so the rates of return are very low.
Unit-linked plans are more flexible. You can stop contributing
after 10 years and the fund will keep compounding your corpus
till the vesting date. You can opt for higher exposure in the
stock market for your plan if your risk appetite allows it.
Lower risk options like balanced funds are also offered.
Riders: Comprehensive coverage
14
In addition to the insurance plan of your choice, you might
want to consider additional risk covers, in which case you can
you can opt for riders: additional benefits that can be
purchased with an insurance policy.
Examples of riders include the Term rider, the Accidental
Death Benefit rider, and the Critical Illness rider. Choosing
the right set of riders ensures a comprehensive insurance
cover.
2.5 INTRODUCTION TO ULIPS (UNIT LINKED INSURANCE PLANS)
The introduction of Unit Linked Insurance Plans has possibly
been the single largest innovation in the field of life
insurance .It has addressed and overcome many difficulties and
concerns that customers had about life insurance – liquidity,
flexibility, and transparency. These benefits are possible
because ULIPs are differently structured products and leave
many choices to the policyholder. They are structured such
that the protection (insurance) element and the savings
element (investment) can be distinguish and hence managed
according to one’s specific needs, offering flexibility and
transparency. Thus we can say it is such a product that takes
care of multiple needs. ULIPs are also called as “Bundled
Policies”.
There were some factors which gave entry for ULIPs in the
insurance market: - Firstly was the arrival of private of
private players, and ULIPs were the most significant
15
innovation done by them, and secondly was the decline of
assured returns in endowment plans. Early the market of ULIPs
was taken up Birla Sun Life as they were the first to
introduce such product in the market. These are the insurance
plans which are attached to Units. The premium amount received
in this policy, some part is used in investment of funds and
remaining is used for insurance cover.
ULIPs are remarkably similar to, mutual fund in terms of
structure and functioning: premium payments are converted into
units and net asset value (NAV) is declared regularly.
Investors have an option of choosing their fund according to
their risk taking ability. They disclose all the material
facts most frequent and consistent (often quarterly or half-
yearly) .Also investor has a fairly good idea about expenses.
The expenses which are considered are as follows:-
1) Mortality Rate: - These are charged by the life insurance
company to cover the risk of an eventuality to the
individual.
2) Administration, sales/marketing Charges: - All life insurance
companies incur certain expenses on regular basis. Agent’s
commission, sales & marketing expenses and overhead costs
incurred to run the day to day basis are some examples.
3) Fund Management Charges: - These charges are levied by the
insurance company to cover the expenses incurred by them on
managing Ulip monies.
16
4) Ulip-fund Switch Charges: - These charges are borne by the
individuals when they decide to switch their, money from one
type of fund to another.
5) Top-up Charges: A certain percentage is deducted from the top-up
amount to recover the expenses incurred on managing the same.
ULIPs are very different from the traditional policies because
they are based on some fundamentals of Mutual funds as
different types of funds which are created wherein the
premiums which are received on the policy these are invested
in these funds basically these funds are of following types:-
a) Equity (Aggressive/Growth) Funds:-Such funds invest a major
portion in equity markets. They are therefore considered to
be high on risk parameter.
b) Debt Funds: - These types of funds invest the premium
money in debt instruments like g-secs, bonds and AAA rated
securities. Such funds are low risk in nature.
c) Balanced Funds: - This fund is combination of growth &
debt fund. This means its portfolio consists of both
equities and debt instruments. The risk for this fund is
moderate.
d) Money Market/Liquid Funds:- Such a fund invests the premium
money in short term liquid instruments like bank deposits
and money market instruments.
17
The features of ULIPs are as follows:-
a) Flexibility: - Flexibility in choosing your own funds how you
would like to invest your own money.
b) Transparency: - It discloses all your material facts, i.e.
you know where your money is been invested.
c) Liquidity: - Here you can withdraw certain amount from your
Units which have been collected.
d) Tax Benefits: - tax benefits are available under Section
80C subject to a maximum limit of Rs 100,000.
The other features of ULIPs are like, life protection which
can be adjustable, many investment options, benefits like
disability, critical illness, surgeries, and also financial
planning etc.
3 EXECUTIVE SUMMARY
The project on Portfolio Management and analysis was carried out
with BSLI. The objective of this project was to primarily
understand the various funds of Birla Sunlife & analyzing the 18
performance of various scrip involved in the portfolio & to
suggest whether the company is missing out on any performing
company as an investment option. The project also helped us in
understanding the past performance of the companies & the impact
companies had during recession. After going through the balance
sheet we also tried to analyze whether the company is able to
survive any recession in near future & what will be the impact on
them.
In the second part of the project dealt with ULIP comparison of
various players. For this product brochures of different life
insurance companies were referred. Also the company website was
used to find out the performance of the various funds. Fund
comparison was done to find out why a particular fund has
performed better than the other. This part was done was going
through each company in the portfolio & it’s since inception
returns & decrease in stock price during recession & increase of
stock price after the recession. In this part we also compared
highest NAV products of major competitors & tried to analyze the
NAV pattern of all the mutual funds as well as insurance funds.
Highest NAV products performance was evaluated as compared to
mutual funds. IRR calculation & analysis of each product based on
IRR was done.
In the third part of the project we analyzed the different
investment options available and to compare them with the mutual
19
fund investments. For the purpose of analyzing the investment
pattern and selecting effective and beneficial schemes of mutual
funds different available schemes were thoroughly analyze &
insurance can be used as an investment option was proved.
4 RESEARCH METHODOLOGY
4.1 Research Brief:
The first stage involved initial discussion between the various
team members and the company in order to identify the research
objectives (Rationale of the research), which is the most
difficult step in the research process.
4.2 Research Design:
Research design is the arrangement of condition for collection
and analysis of data in a manner that aims to combine relevance
to the research purpose with the economy in procedure. It is the
blueprints for collection, measurement and analysis of data.
4.2.1 Type of Research: Analytical Research
20
Under the analytical research, the researcher has to use facts or
information already available and analyze the facts and
information to make a critical evaluation of the material. The
research is designed to study the performance of insurance
companies in the post-liberalization era. Under this type the
researcher has to use the facts and information already available
and analyze them to make evaluation of the market. In analytical
research the researcher has to use the facts already available,
and analyse these to make the critical evaluation data of the
material.
The methodology followed for research is as following:
1. Survey of concerned literature
2. Collecting data:
Quantitative
Qualitative
3. After the collection of data the raw data is processed through
editing, loading, classification and tabulation to make analysis
of the data of information
After the analysis the finding are drawn and
recommendations/conclusion are made.
The research design which help to answer the following questions:
Why the study is being made?
From where the data needed can be collected?
21
4.2.2 Data Collection:
1. Primary Data:
These include the survey or questionnaire method, telephonic
interview as well as the personal interview methods of data
collection
2. Secondary Data:
The secondary data as it has always been important for the
completion of any report provides a reliable, suitable, adequate
and specific knowledge.
Secondary data is a data, which is collected from various
sources. Secondary data is not a fresh data so it has its own
limitations like: Time Constraints, Accuracy and Applicability.
The sample size for measuring the performance for life insurance
companies is as follows:
This study is based on analysis the performance of different life
insurance company in India, LIC is the major player in the
market, there are 23 other life insurance companies operating in
the country. Thus the size of the universe is 24.
Out of these 16 companies, 4 companies are selected; in these one
is Public Company and other Three are Private Companies:
Birla Sunlife insurance
Life Insurance Corporation of India
Bajaj Allianz life insurance
ING Vysya life insurance
Analysis pattern
22
After the data is collected and editing, the next job of the
researcher is to present it systematically. The collected data is
so large, complex and unarranged that it can’t be processed
without arranging it according to same characteristics.
The following statistical and analytical tools have been used:
Graph:
Various plans offered by the companies.
Net Asset Value of Companies major Plans.
Market Share of the companies.
Data has been collected from the Fact sheet of the various
insurance funds & mutual fund schemes & used those data s
for the research. In fact sheet past returns were given of
different funds.
5 PORTFOLIO ANALYSIS & MANAGEMENT
5.1 What is Portfolio Management?
An investor considering in securities is faced with the
problem of choosing from among a large number of securities.
His choice depends upon the risk return characteristics of
individual securities. He would attempt to choose the most
desirable securities and like to allocate his funds over this
group of securities. Again he is faced with problem of
deciding which securities to hold and how much to invest in
each. The investor faces an infinite number of possible
portfolios or groups of securities. The risk and return
characteristics of portfolios differ from those of individual
23

securities combining to form a portfolio. The investor tries
to choose the optimal portfolio taking into consideration the
risk return characteristics of all possible portfolios
The first phase of the project involved analyzing the existing
fund portfolios underlying different insurance products
offered by Birla Sun life Insurance. The analysis involved
analyzing the performance of the funds (portfolios)
considering parameters such as asset size, asset allocation,
returns generated over specific time periods w.r.t. Benchmark
Index etc.
Phases of Portfolio Management
1. Security Analysis
2. Portfolio Analysis
3. Portfolio Selection
4. Portfolio Revision
5. Portfolio Evaluation
1. Security Analysis
(a) Fundamental analysis: This analysis concentrates on the
fundamental factors affecting the company such as EPS (Earning
per share) of the company, the dividend payout ratio,
competition faced by the company, market share, quality of
management etc.
(b) Technical analysis: The past movement in the prices of
shares is studied to identify trends and patterns and then
tries to predict the future price movement. Current market
24

price is compared with the future predicted price to determine
the mispricing. Technical analysis concentrates on price
movements and ignores the fundamentals of the shares.
(c) Efficient market hypothesis: This is comparatively more
recent approach. This approach holds that market prices
instantaneously and fully reflect all relevant available
information. It means that the market prices will always be
equal to the intrinsic value.
2. Portfolio Analysis
A portfolio is a group of securities held together as
investment. It is an attempt to spread the risk all over. The
return & risk of each portfolio has to be calculated
mathematically and expressed quantitatively. Portfolio
analysis phase of portfolio management consists of identifying
the range of possible portfolios that can be constituted from
a given set of securities and calculating their risk for
further analysis.
3. Portfolio Selection
The goal of portfolio construction is to generate a portfolio
that provides the highest returns at a given level of risk.
Harry Markowitzh portfolio theory provides both the conceptual
framework and the analytical tools for determining the optimal
portfolio in a disciplined and objective way.
4. Portfolio Revision
25
The investor/portfolio manager has to constantly monitor the
portfolio to ensure that it continues to be optimal. As the
economy and financial markets are highly volatile dynamic
changes take place almost daily. As time passes securities
which were once attractive may cease to be so. New securities
with anticipation of high returns and low risk may emerge.
5. Portfolio Evaluation
Portfolio evaluation is the process, which is concerned with
assessing the performance of the portfolio over a selected
period of time in terms of return & risk. The evaluation
provides the necessary feedback for better designing of
portfolio the next time around.
6. Measurement of risk
Risk refers to the possibility that the actual outcome of an
investment will differ from the expected outcome. In other
words we can say that risk refers to variability or
dispersion. Whenever we calculate the mean returns of an
investment we also need to calculate the variability in the
returns.
The first phase of the project involved analyzing the existing
fund portfolios underlying different insurance products
offered by Birla Sun life Insurance. The analysis involved
analyzing the performance of the funds (portfolios)
considering parameters such as asset size, asset allocation,
returns generated over specific time periods w.r.t. Benchmark
Index etc.
26
The funds selected for analysis include
Magnifier Fund (50-90% Equity) and Maximiser Fund (80-100%
Equity)
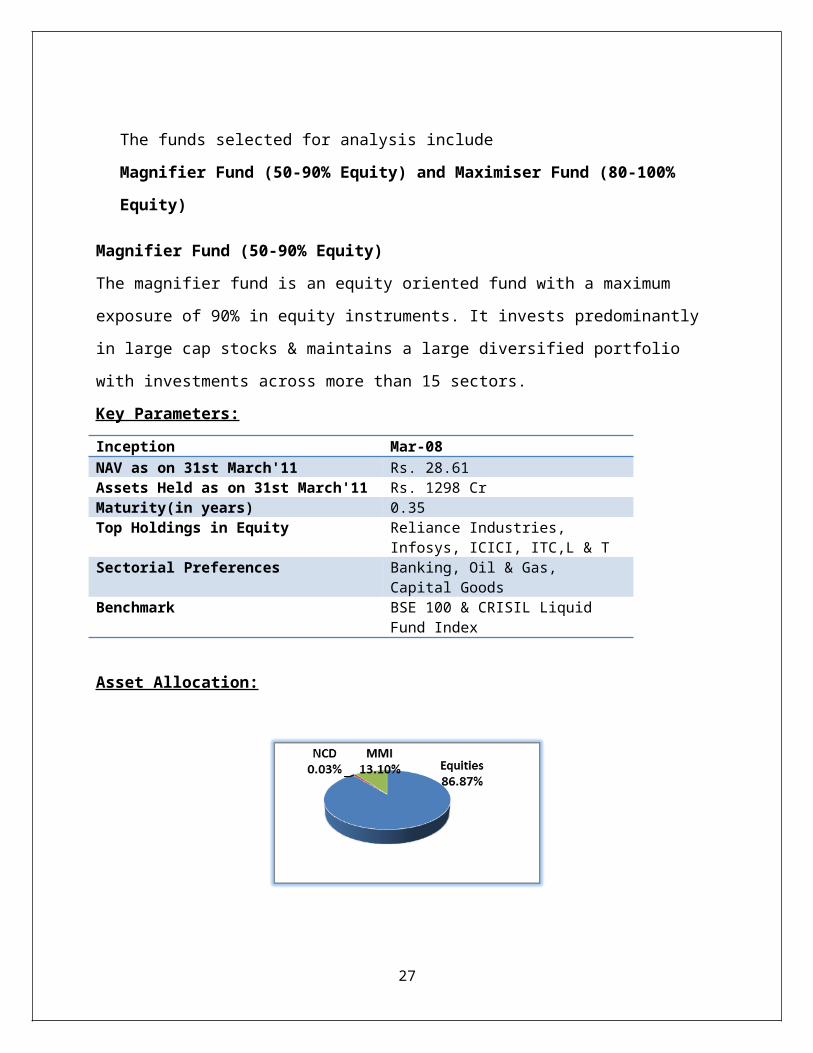
Magnifier Fund (50-90% Equity)
The magnifier fund is an equity oriented fund with a maximum
exposure of 90% in equity instruments. It invests predominantly
in large cap stocks & maintains a large diversified portfolio
with investments across more than 15 sectors.
Key Parameters:
Inception Mar-08NAV as on 31st March'11 Rs. 28.61Assets Held as on 31st March'11 Rs. 1298 CrMaturity(in years) 0.35Top Holdings in Equity Reliance Industries,
Infosys, ICICI, ITC,L & TSectorial Preferences Banking, Oil & Gas,
Capital GoodsBenchmark BSE 100 & CRISIL Liquid
Fund Index
Asset Allocation:
27
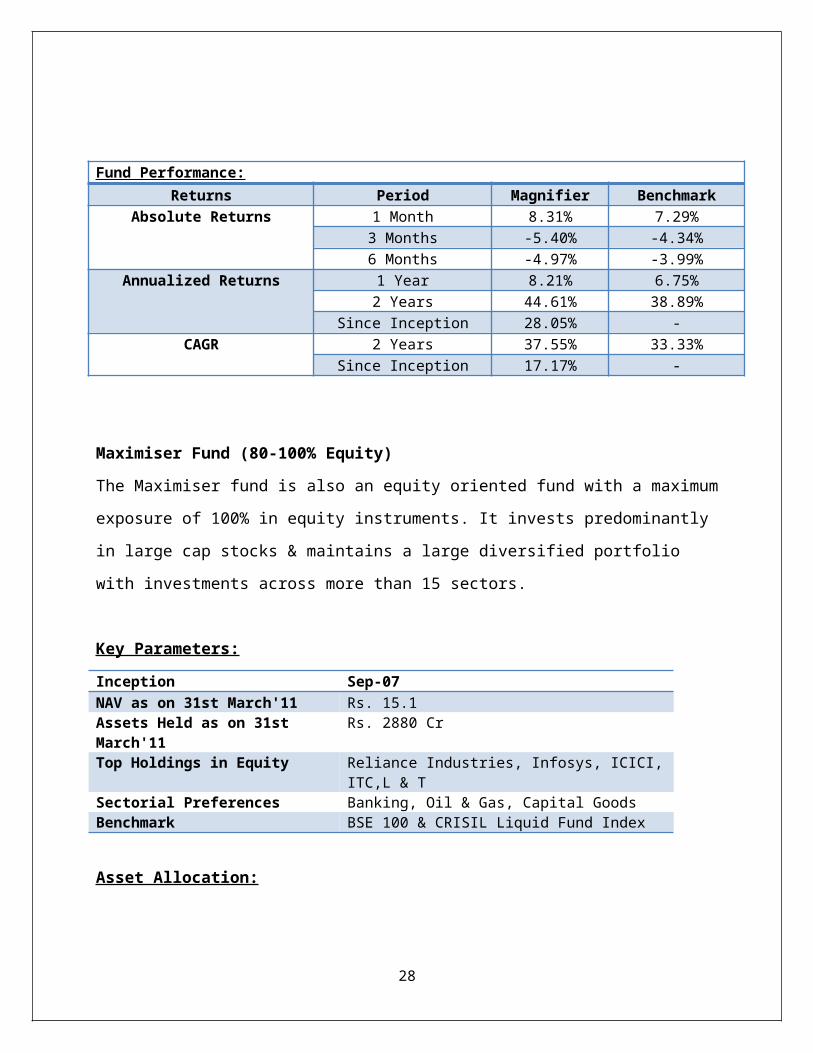
Fund Performance:Returns Period Magnifier Benchmark
Absolute Returns 1 Month 8.31% 7.29%3 Months -5.40% -4.34%6 Months -4.97% -3.99%
Annualized Returns 1 Year 8.21% 6.75%2 Years 44.61% 38.89%
Since Inception 28.05% -CAGR 2 Years 37.55% 33.33%
Since Inception 17.17% -
Maximiser Fund (80-100% Equity)
The Maximiser fund is also an equity oriented fund with a maximum
exposure of 100% in equity instruments. It invests predominantly
in large cap stocks & maintains a large diversified portfolio
with investments across more than 15 sectors.
Key Parameters:
Inception Sep-07NAV as on 31st March'11 Rs. 15.1Assets Held as on 31st March'11
Rs. 2880 Cr
Top Holdings in Equity Reliance Industries, Infosys, ICICI,ITC,L & T
Sectorial Preferences Banking, Oil & Gas, Capital GoodsBenchmark BSE 100 & CRISIL Liquid Fund Index
Asset Allocation:
28
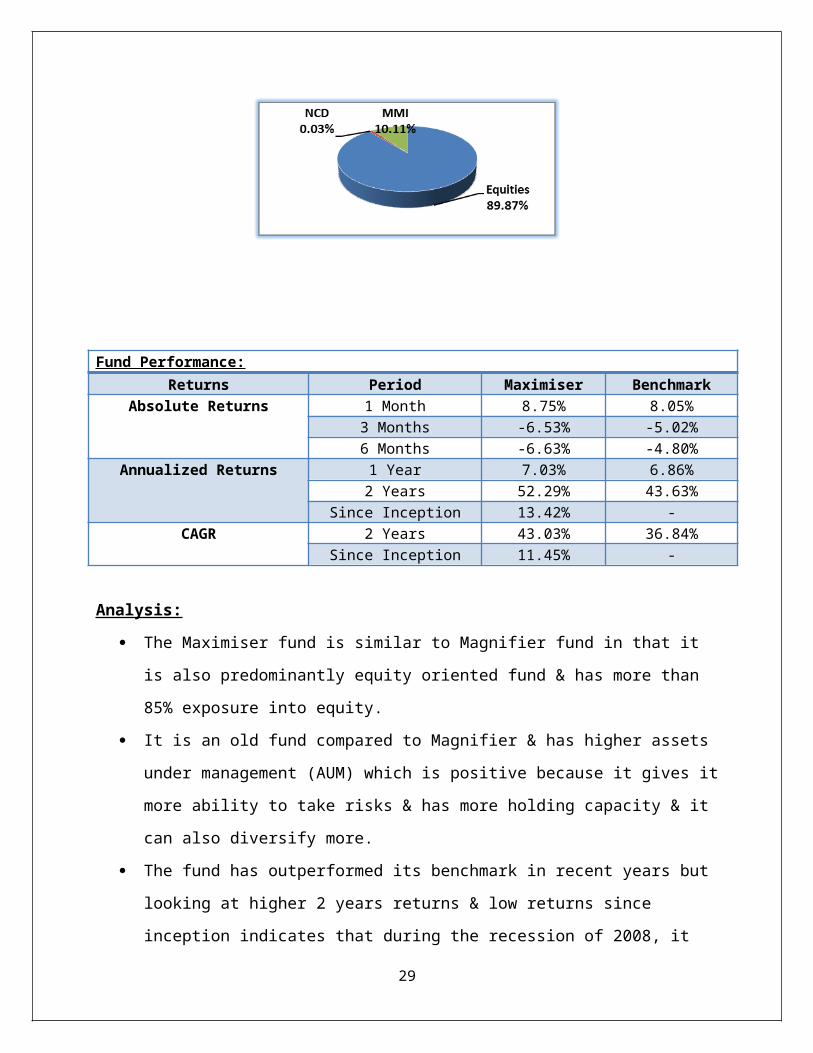
Fund Performance:Returns Period Maximiser Benchmark
Absolute Returns 1 Month 8.75% 8.05%3 Months -6.53% -5.02%6 Months -6.63% -4.80%
Annualized Returns 1 Year 7.03% 6.86%2 Years 52.29% 43.63%
Since Inception 13.42% -CAGR 2 Years 43.03% 36.84%
Since Inception 11.45% -
Analysis:
The Maximiser fund is similar to Magnifier fund in that it
is also predominantly equity oriented fund & has more than
85% exposure into equity.
It is an old fund compared to Magnifier & has higher assets
under management (AUM) which is positive because it gives it
more ability to take risks & has more holding capacity & it
can also diversify more.
The fund has outperformed its benchmark in recent years but
looking at higher 2 years returns & low returns since
inception indicates that during the recession of 2008, it
29
has underperformed by a wider margin but has recovered
quickly in the past 2 years.
Its CAGR return since launch is lower than Magnifier & but
has given higher returns compared to Magnifier in the past
two years indicating that the fund is more volatile compared
to Magnifier.
6 SECURITY ANALYSIS
After analyzing the fund portfolios 2 sectors & scrip in that
sector which was (or could be) the part of the existing
portfolios were analyzed in details to review the performance
of the sector & scrip over past 3 years.
The basic concept of analyzing the company & understanding was
to get these following details:
What factors affected the company which resulted in increase
or decrease in its stock price?
Which sectors were impacted during recession?
30
In which companies we should increase the exposure & why?
Performance of the company & growth of stock price in three
years
Find the recovery period of companies after recession
Finding the stock fluctuation in past three years
Balance sheet analysis of the company
Which companies can survive another recession if double dip
occurs in near future?
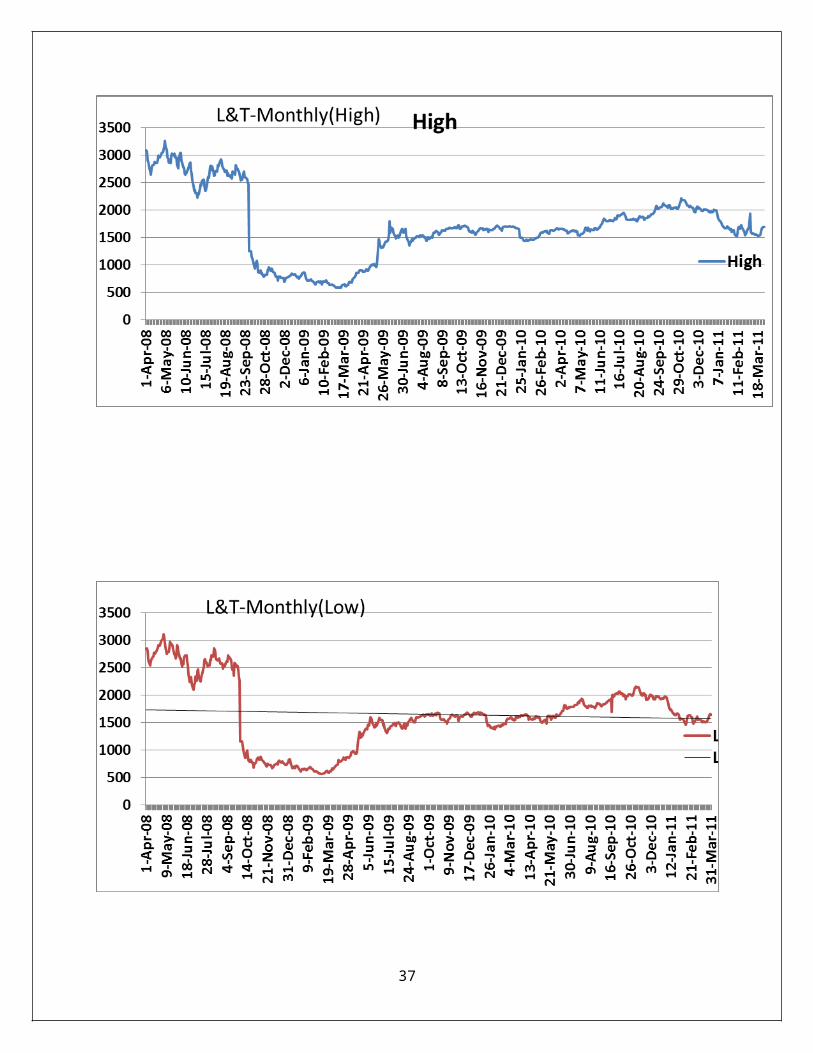
The following data was collected & analyzed in detail.
The everyday Open, High, Low & Close price, Volume traded
of the scrip from 1st April 2008 to 31st March 2011
recorded on the stock exchanges was collected.
The Weekly, Fortnightly, Monthly, Quarterly, Semi-
Annually, Annually averages were then calculated in the
excel sheet.
The data was also plotted on a line graph to analyze the
trend in the stock over the three year period
The All-time High & All-time low of the stock over a
three year period was found out & probable reasons behind
the same were explored.
Also any significant rise or downfall in the stock was
found & probable reasons were explored.
31
Every Pyramid (Rise & subsequent fall) & Inverted Pyramid
(fall & subsequent rise) pattern on the plotted graph
were highlighted & also analyzed.
Also the recovery period of the stock in days was
calculated i.e. the time stock took to recover the global
recession of 2008.
The detailed Balance Sheet analysis of the stock was
carried out to judge whether the company under analysis
will be able to recover another recession in the future
if it were to happen.
The Sectors & Scrip under the sector selected for study was:
SECTOR SCRIP
Banking Axis BankCapital Goods Larsen & toubro
6.1.1 L&T:
About the Company:
L&T Ltd. is an $11.7 B company, providing a range of
engineering solutions to the energy and environment sectors.
32
Larsen & Toubro Limited (L&T) is a technology, engineering,
construction and manufacturing company. It is one of the
largest and most respected companies in India's private
sector.
More than seven decades of a strong, customer-focused
approach and the continuous quest for world-class quality
have enabled it to attain and sustain leadership in all its
major lines of business.
L&T has an international presence, with a global spread of
offices. A thrust on international business has seen
overseas earnings grow significantly. It continues to grow
its overseas manufacturing footprint, with facilities in
China and the Gulf region.
L&T believes that progress must be achieved in harmony with
the environment. A commitment to community welfare and
environmental protection are an integral part of the
corporate vision. L&T has diversified business portfolio and it operates through
its different operating divisions
which include:
Engineering & Construction Projects
EPC Power
Heavy Engineering
Engineering, Construction & Contracts33
Electrical & Electronics
Machinery & Industrial Products
IT and Integrated Engineering Services
Financial Services
L&T, one of the India’s largest Engineering Companies, was
incorporated in February 1946. It
was converted into a public limited company in 1950. L&T, along
with its group companies,
provides integrated design, engineering, procurement,
construction and project management
services to various sectors. The company is present in multiple
operating segments such as
Engineering & Construction (E&C), Electrical & Electronics (E&E),
Machinery & Industrial
Products (MIP) and others. It has exposure to infrastructure BOT
projects in roads, ports and
real estate. Through its subsidiaries like L&T Finance, L&T
Infrastructure Finance and L&T
Infotech, L&T has also diversified into financial services and
the IT/ITeS sector. The E&C
division of L&T undertakes engineering design and construction of
buildings, factories,
infrastructure, industrial and power transmission & distribution,
while the E&E segment is
34

engaged in manufacturing of electrical standard products, systems
and equipment. The MIP
division of L&T is focused on manufacturing industrial valves,
construction and hydraulic
equipment, machinery for mining, paper and rubber processing
industry.
L&T is regarded as the preeminent infrastructure major – often
referred to as the ‘builder of
the India of the 21st century’. Its achievements across sectors
include:
Hydrocarbon projects executed in India, the Middle East and
South East Asia
Power projects executed in India, the Gulf and Sri Lanka.
The world’s largest coal gasifier made in India and exported
to China
The world’s biggest EO Reactor for a petrochemical complex
in the Gulf
The world’s largest FCC (Fluid Catalytic Cracker)
Regenerator for a refinery
Asia’s highest viaduct
Infrastructure projects in Jordan, U.A.E. and South East
Asia
The world’s longest limestone conveyor
India’s widest range of switchgear
A wide range of construction and mining equipment
35
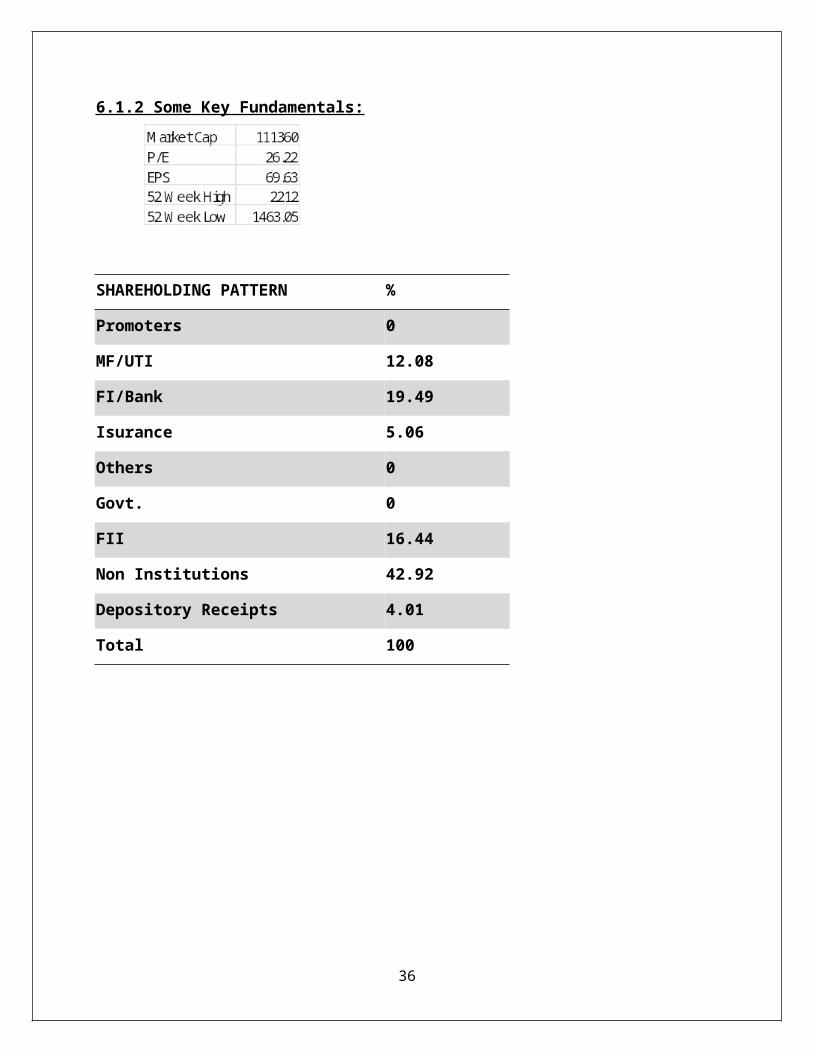
6.1.2 Some Key Fundamentals:
36
SHAREHOLDING PATTERN %
Promoters 0
MF/UTI 12.08
FI/Bank 19.49
Isurance 5.06
Others 0
Govt. 0
FII 16.44
Non Institutions 42.92
Depository Receipts 4.01
Total 100
37

38
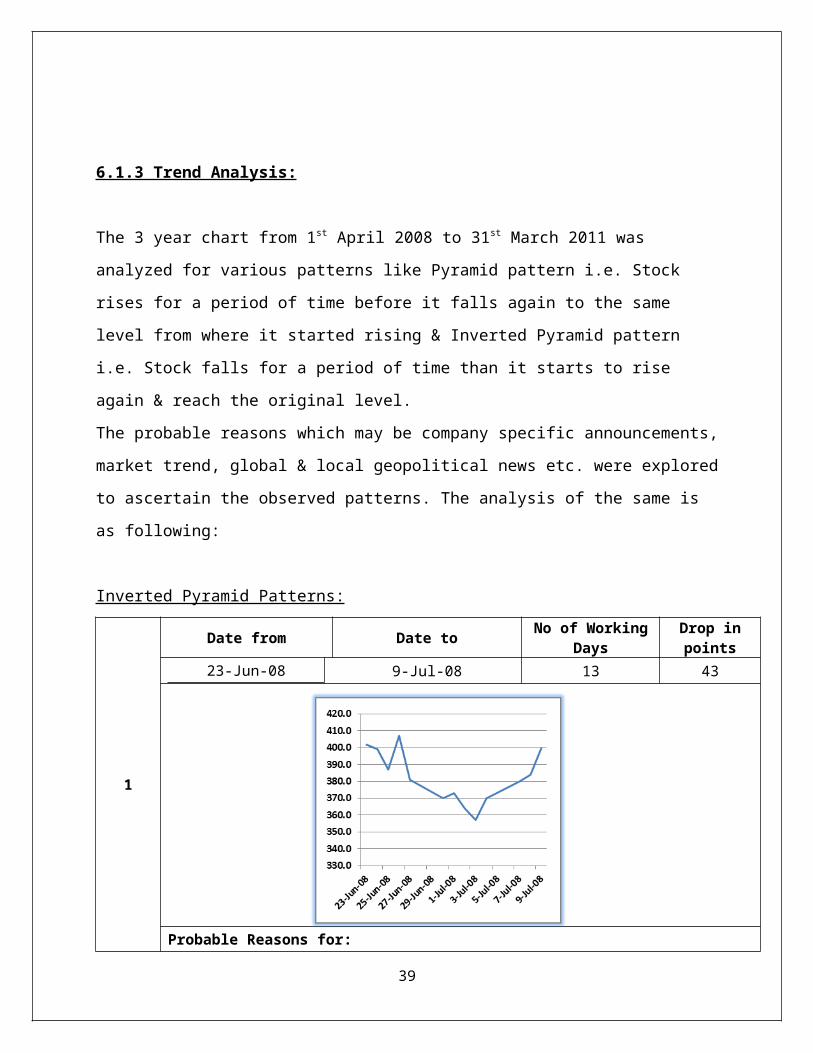
6.1.3 Trend Analysis:
The 3 year chart from 1st April 2008 to 31st March 2011 was
analyzed for various patterns like Pyramid pattern i.e. Stock
rises for a period of time before it falls again to the same
level from where it started rising & Inverted Pyramid pattern
i.e. Stock falls for a period of time than it starts to rise
again & reach the original level.
The probable reasons which may be company specific announcements,
market trend, global & local geopolitical news etc. were explored
to ascertain the observed patterns. The analysis of the same is
as following:
Inverted Pyramid Patterns:
1
Date from Date to No of WorkingDays
Drop inpoints
23-Jun-08 9-Jul-08 13 43
Probable Reasons for:
39
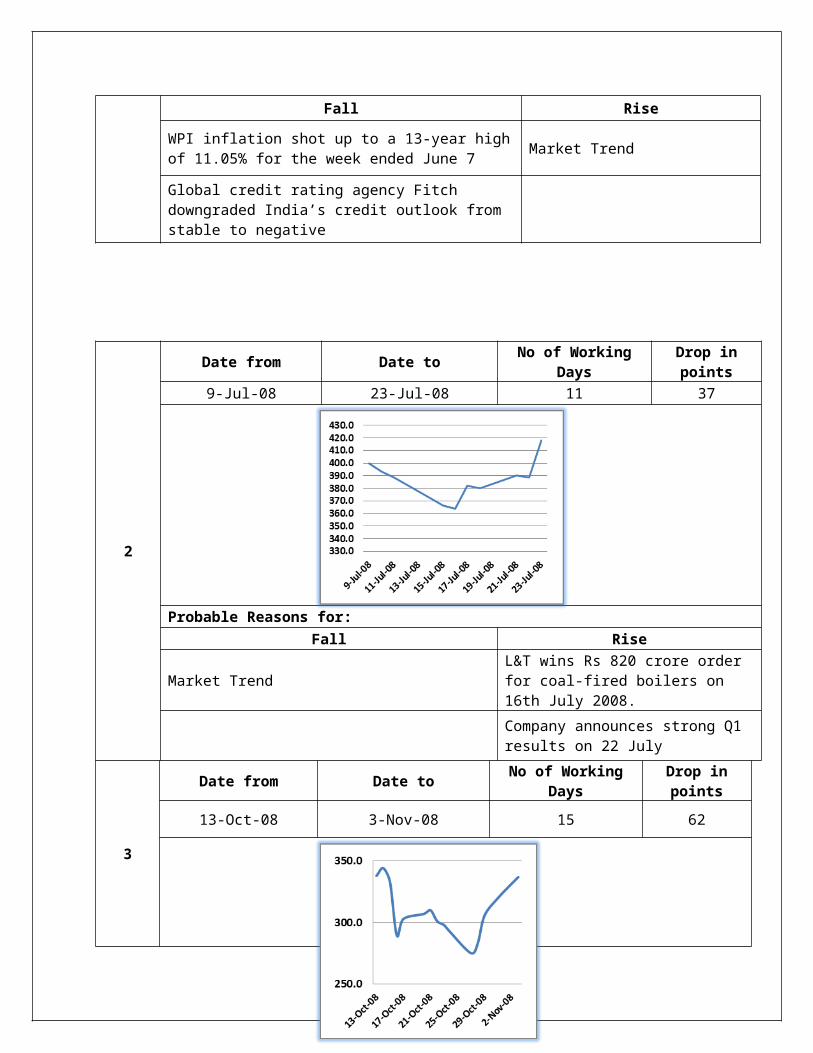
Fall Rise
WPI inflation shot up to a 13-year highof 11.05% for the week ended June 7 Market Trend
Global credit rating agency Fitch downgraded India’s credit outlook from stable to negative
2
Date from Date to No of WorkingDays
Drop inpoints
9-Jul-08 23-Jul-08 11 37
Probable Reasons for:Fall Rise
Market TrendL&T wins Rs 820 crore order for coal-fired boilers on 16th July 2008.
Company announces strong Q1 results on 22 July
3
Date from Date to No of WorkingDays
Drop inpoints
13-Oct-08 3-Nov-08 15 62
40
Probable Reasons for:
Fall Rise
Announces subdued Q2 results Market Trend
Global markets meltdown
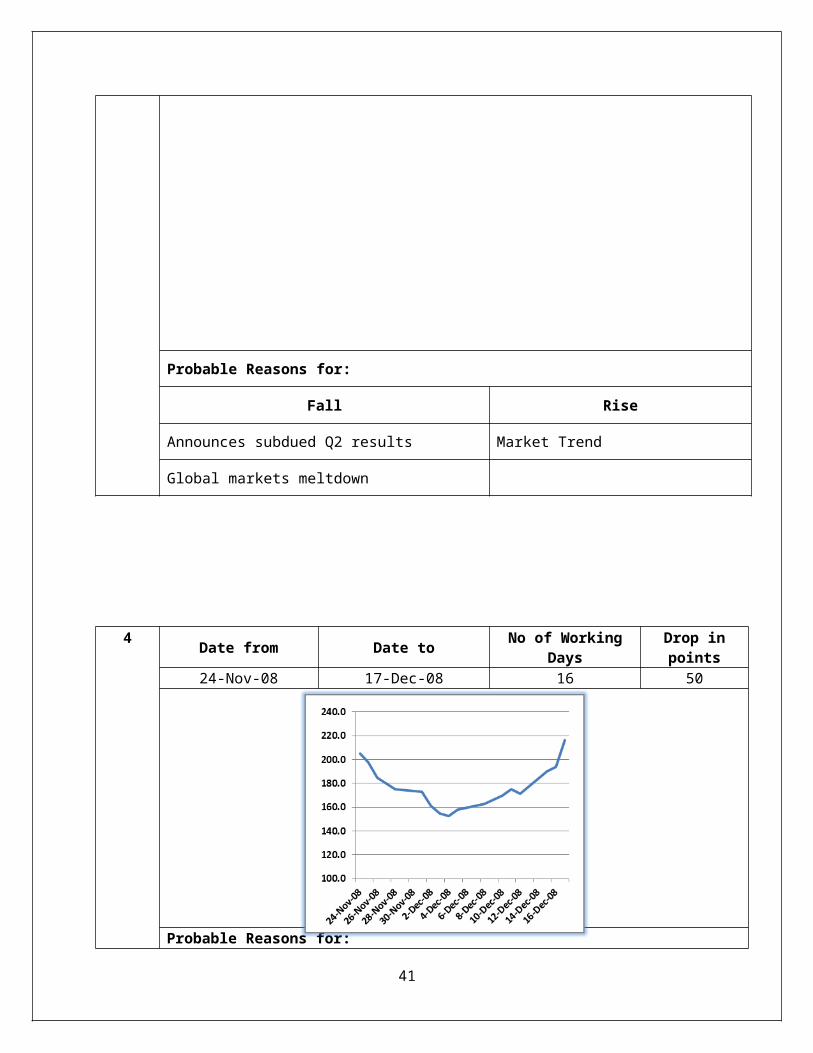
4 Date from Date to No of WorkingDays
Drop inpoints
24-Nov-08 17-Dec-08 16 50
Probable Reasons for:
41

Fall RiseManagement concerns over orders not flowing in Market Trend
Market Trend
5
Date from Date to No of WorkingDays
Drop inpoints
21-May-09 2-Jun-09 9 39
Probable Reasons for:Fall Rise
Market Trend Market Trend
6
Date from Date to No of WorkingDays
Drop inpoints
11-Dec-09 24-Dec-09 10 25
42
Probable Reasons for:Fall Rise
Various Analysts concernsovervaluation of the stock Market Trend
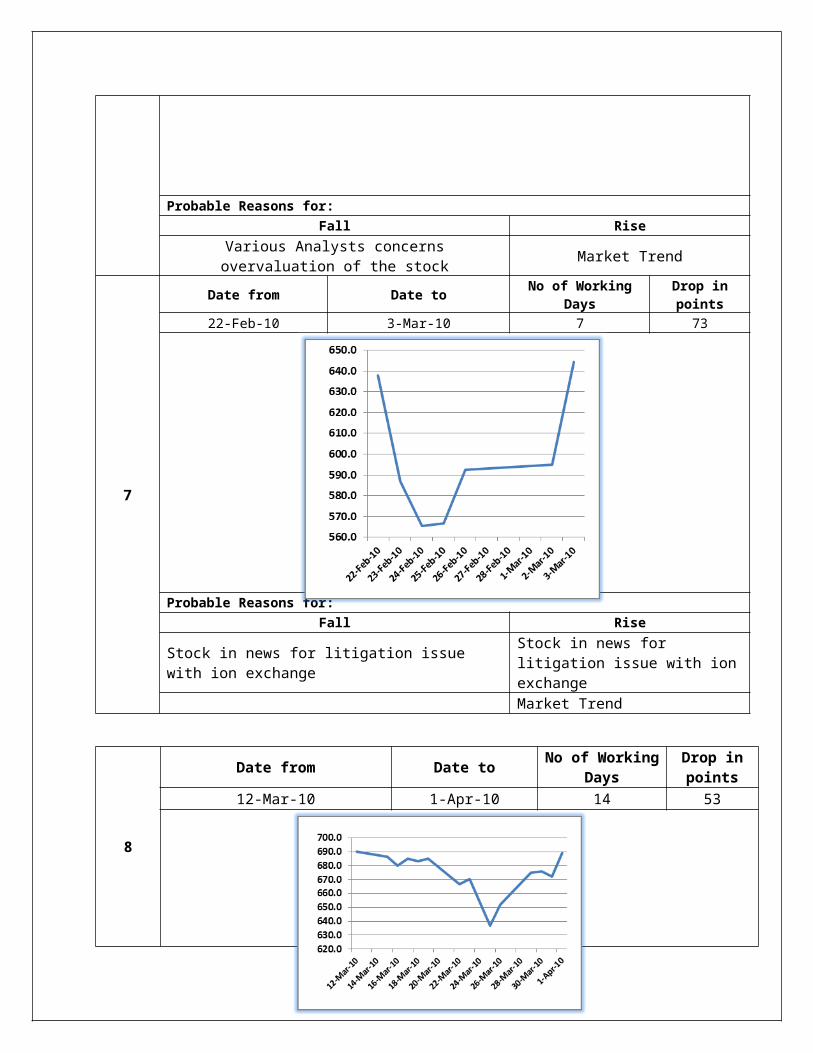
7
Date from Date to No of WorkingDays
Drop inpoints
22-Feb-10 3-Mar-10 7 73
Probable Reasons for:Fall Rise
Stock in news for litigation issue with ion exchange
Stock in news for litigation issue with ionexchange
Market Trend
8
Date from Date to No of WorkingDays
Drop inpoints
12-Mar-10 1-Apr-10 14 53
43
Probable Reasons for:Fall Rise
Market Trend Strong IIP Nos
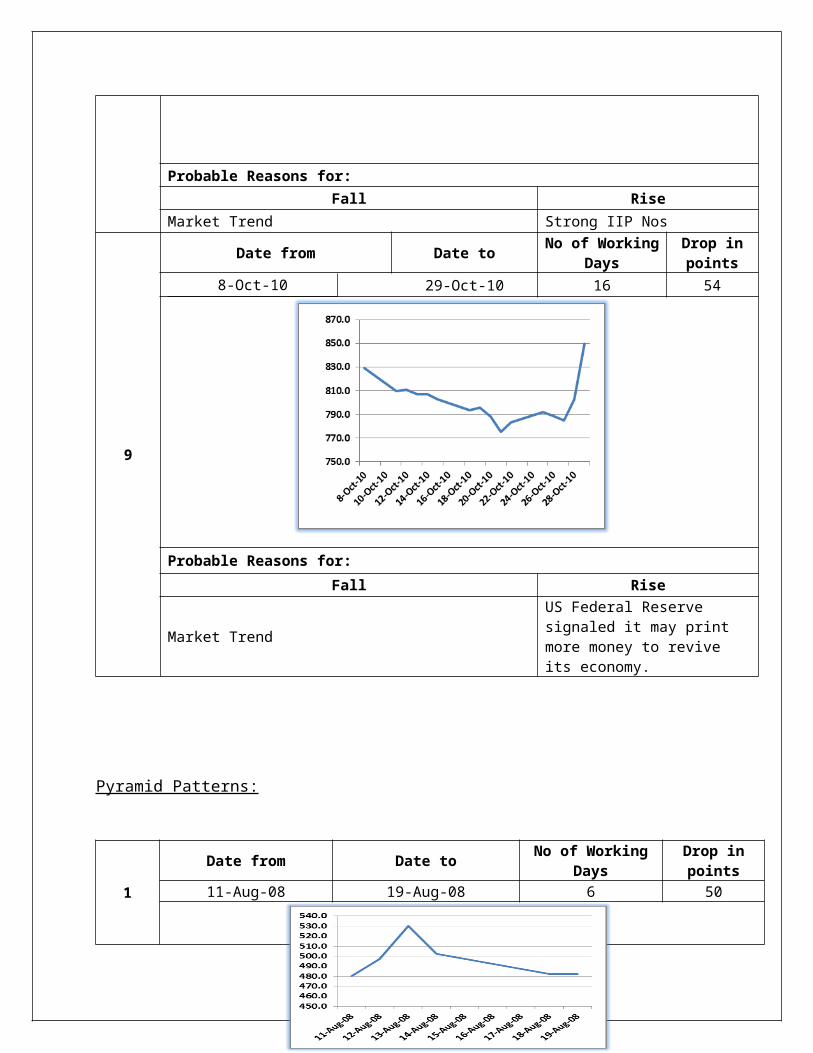
9
Date from Date to No of WorkingDays
Drop inpoints
8-Oct-10 29-Oct-10 16 54
Probable Reasons for:Fall Rise
Market Trend
US Federal Reserve signaled it may print more money to revive its economy.
Pyramid Patterns:
1
Date from Date to No of WorkingDays
Drop inpoints
11-Aug-08 19-Aug-08 6 50
44
Probable Reasons for:Rise Fall
Market Trend Market Trend
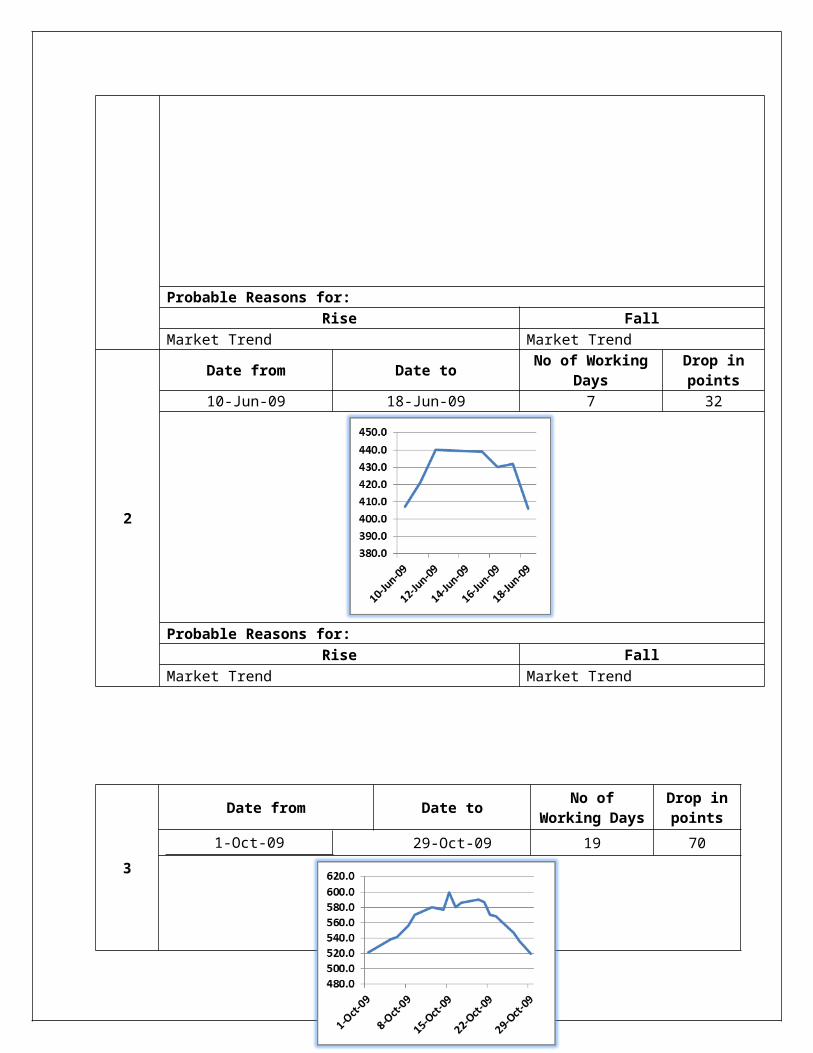
2
Date from Date to No of WorkingDays
Drop inpoints
10-Jun-09 18-Jun-09 7 32
Probable Reasons for:Rise Fall
Market Trend Market Trend
3
Date from Date to No ofWorking Days
Drop inpoints
1-Oct-09 29-Oct-09 19 70
45
Probable Reasons for:Rise Fall
Market TrendL&T net profit declines 4.99% in the September 2009 quarter
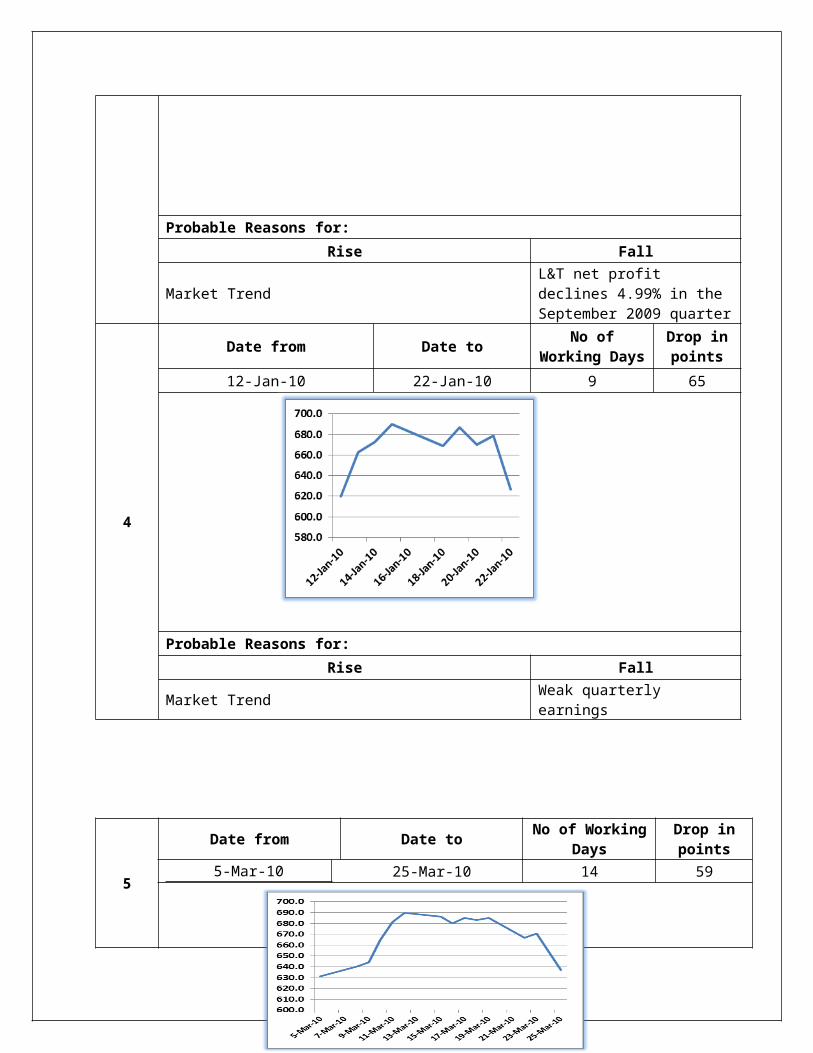
4
Date from Date to No ofWorking Days
Drop inpoints
12-Jan-10 22-Jan-10 9 65
Probable Reasons for:Rise Fall
Market Trend Weak quarterly earnings
5
Date from Date to No of WorkingDays
Drop inpoints
5-Mar-10 25-Mar-10 14 59
46
Probable Reasons for:Rise Fall
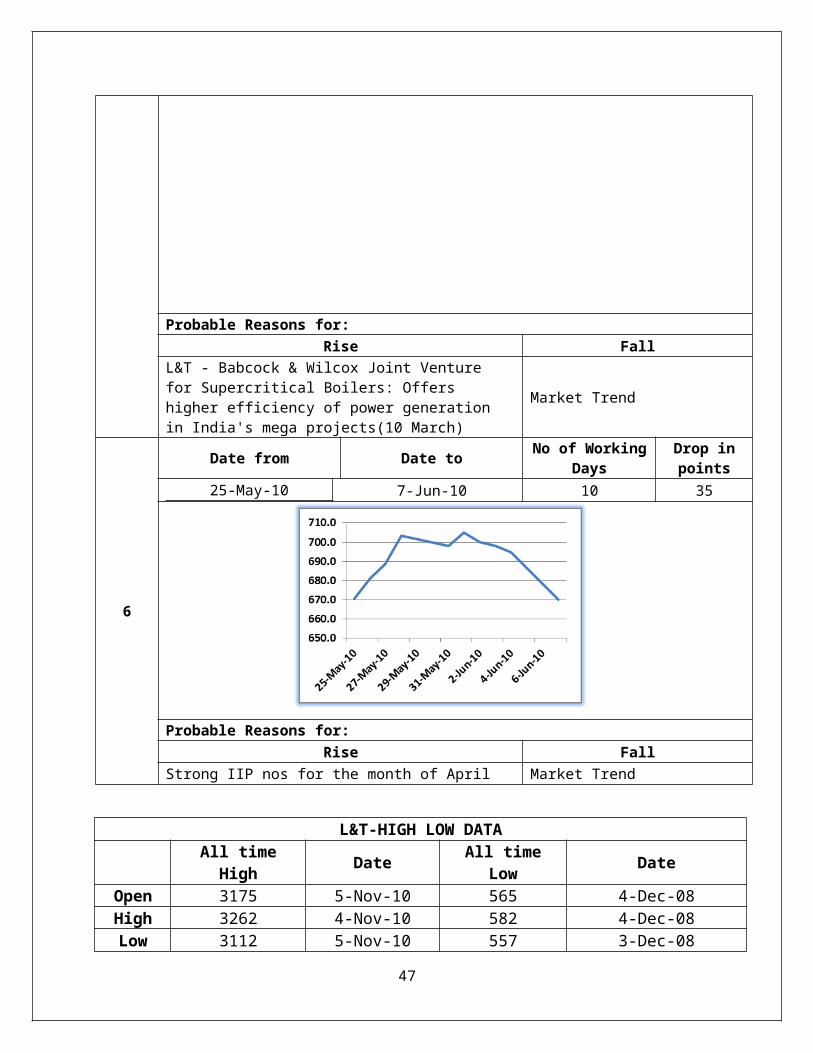
L&T - Babcock & Wilcox Joint Venture for Supercritical Boilers: Offers higher efficiency of power generation in India's mega projects(10 March)
Market Trend
6
Date from Date to No of WorkingDays
Drop inpoints
25-May-10 7-Jun-10 10 35
Probable Reasons for:Rise Fall
Strong IIP nos for the month of April Market Trend
L&T-HIGH LOW DATA
All time
High Date All timeLow Date
Open 3175 5-Nov-10 565 4-Dec-08High 3262 4-Nov-10 582 4-Dec-08Low 3112 5-Nov-10 557 3-Dec-08
47
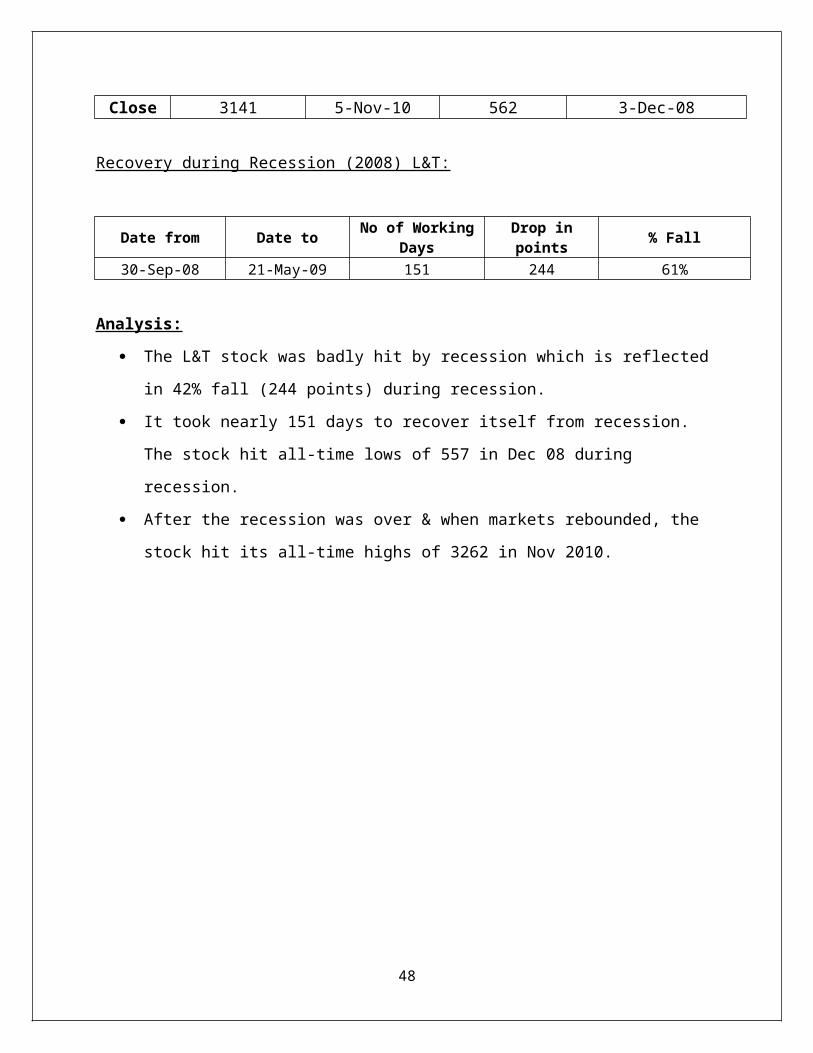
Close 3141 5-Nov-10 562 3-Dec-08
Recovery during Recession (2008) L&T:
Date from Date to No of WorkingDays
Drop inpoints % Fall
30-Sep-08 21-May-09 151 244 61%
Analysis:
The L&T stock was badly hit by recession which is reflected
in 42% fall (244 points) during recession.
It took nearly 151 days to recover itself from recession.
The stock hit all-time lows of 557 in Dec 08 during
recession.
After the recession was over & when markets rebounded, the
stock hit its all-time highs of 3262 in Nov 2010.
48
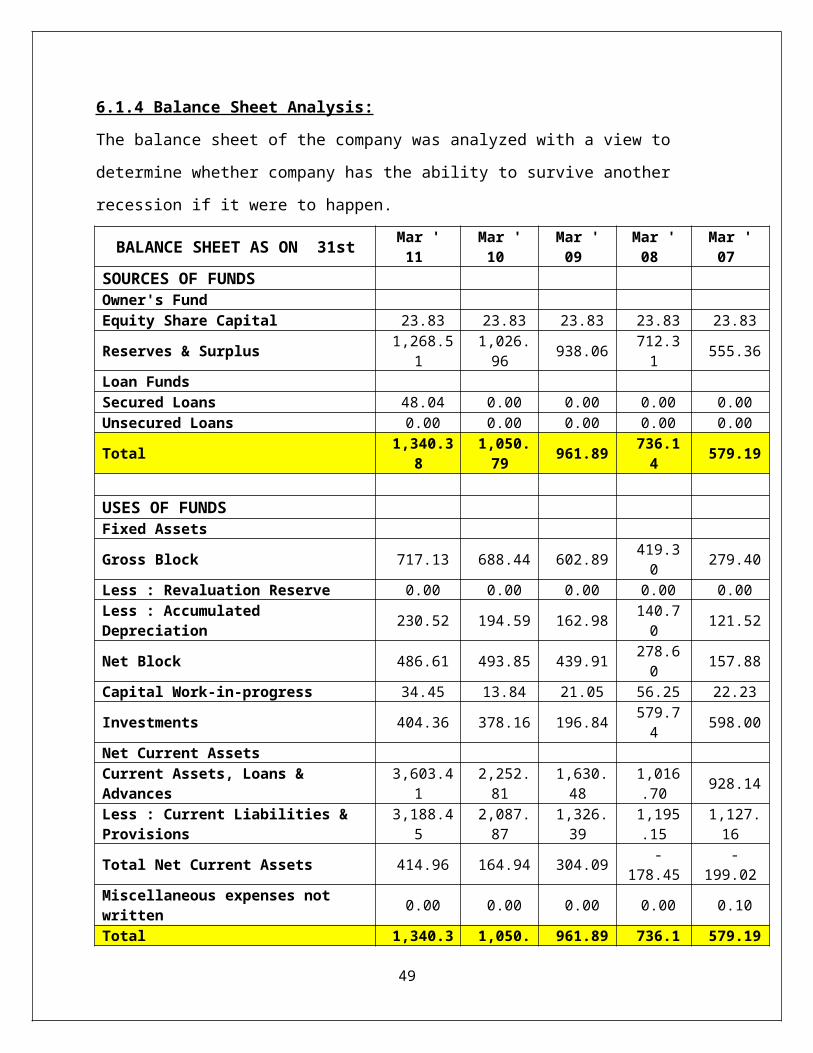
6.1.4 Balance Sheet Analysis:
The balance sheet of the company was analyzed with a view to
determine whether company has the ability to survive another
recession if it were to happen.
BALANCE SHEET AS ON 31st Mar '11
Mar '10
Mar '09
Mar '08
Mar '07
SOURCES OF FUNDS Owner's Fund Equity Share Capital 23.83 23.83 23.83 23.83 23.83
Reserves & Surplus 1,268.51
1,026.96 938.06 712.3
1 555.36
Loan Funds Secured Loans 48.04 0.00 0.00 0.00 0.00Unsecured Loans 0.00 0.00 0.00 0.00 0.00
Total 1,340.38
1,050.79 961.89 736.1
4 579.19
USES OF FUNDS Fixed Assets
Gross Block 717.13 688.44 602.89 419.30 279.40
Less : Revaluation Reserve 0.00 0.00 0.00 0.00 0.00Less : Accumulated Depreciation 230.52 194.59 162.98 140.7
0 121.52
Net Block 486.61 493.85 439.91 278.60 157.88
Capital Work-in-progress 34.45 13.84 21.05 56.25 22.23
Investments 404.36 378.16 196.84 579.74 598.00
Net Current Assets Current Assets, Loans & Advances
3,603.41
2,252.81
1,630.48
1,016.70 928.14
Less : Current Liabilities & Provisions
3,188.45
2,087.87
1,326.39
1,195.15
1,127.16
Total Net Current Assets 414.96 164.94 304.09 -178.45
-199.02
Miscellaneous expenses not written 0.00 0.00 0.00 0.00 0.10
Total 1,340.3 1,050. 961.89 736.1 579.19
49

8 79 4Note : Number of Equity shares outstanding (in Lacs)
1,191.56
1,191.56
1,191.56
1,191.56
1,191.56
Mar '11
Mar '10
Mar '09
Mar '08 Mar ' 07
Sales 4,883.23
3,185.47
3,264.35
3,204.17 2,173.03
Operating Profit 566.09 384.11 414.42 409.58 279.08Net Profit / Loss 382.42 141.44 287.29 280.78 187.80EPS (in Rs.) 32.09 11.87 24.11 23.57 15.76
KEY RATIOS Mar '11
Mar '10
Mar '09
Mar '08
Mar '07
PROFITABILITY RATIOS Operating Margin (%) 10.79 11.12 15.93 12.50 13.63Gross Profit Margin (%) 9.88 9.80 14.89 11.81 12.73Net Profit Margin (%) 7.87 4.46 9.09 8.69 8.80Reported Return On Net Worth (%) 29.59 13.46 29.86 38.14 32.43
LEVERAGE RATIOS Long Term Debt / Equity 0.00 0.00 0.00 0.00 0.00Total Debt/Equity 0.03 0.00 0.00 0.00 0.00Owners fund as % of total Source 96.41 100.00 100.00 100.00 100.00
Fixed Assets Turnover Ratio 6.88 4.59 5.29 7.78 7.57
LIQUIDITY RATIOS Current Ratio 1.13 1.08 1.23 0.85 0.82Quick Ratio 1.03 0.94 1.01 0.67 0.57Inventory Turnover Ratio 17.77 12.95 12.20 16.81 8.10
Analysis:
50
It is almost a debt free company with strong operating
performance over the years. Its net sales have grown @CAGR
of 18% & its Net profit & EPS has grown @ CAGR of 15% over
the last five years.
It has been able to maintain its profit margin even during
times of recession due to prudent cost management
initiatives taken by the company.
It has been able to generate strong positive operating cash
flows even during the time of the recession.
It also has high inventory turnover ratio compared to
industry which indicates that company is able to generate
sales quickly.
It has provided high ROCE compared to its peers indicating
the strong management capabilities to generate return on the
capital employed.
6.2 AXIS BANK:
6.2.1 About the Company:
51

AXIS BANK is a state-of-the-art high quality, customer
centric, service driven, private Indian Bank catering to the
“Future Businesses of India”
Since inception, AXIS BANK has tried to play a catalytic
role in bridging the infrastructure and knowledge gap in
various Sunrise sectors of the economy. As part of the
differentiated strategy, AXIS BANK has had a strong focus on
Development Banking, as is evident from the cutting-edge
work that the Bank has done in the area of Food &
Agribusiness, Infrastructure, Microfinance, and
Sustainability which in most cases has been first-of-its
kind in India.
In a short span of 6 years, AXIS BANK has fructified into a
‘“Full Service Commercial Bank” that has steadily built
Corporate and Institutional Banking, Financial Markets,
Investment Banking, Corporate Finance, Branch Banking,
Business and Transaction Banking, and Wealth Management
business lines across the country, and is well equipped to
offer a range of products and services to corporate and
retail customers.
AXIS BANK offers a full-range of client-focused corporate
banking services, including working capital finance,
specialized corporate finance, trade and transactional
services, treasury risk management services, investment
banking solutions and liquidity management solutions among
others to a highly focused client base.
52
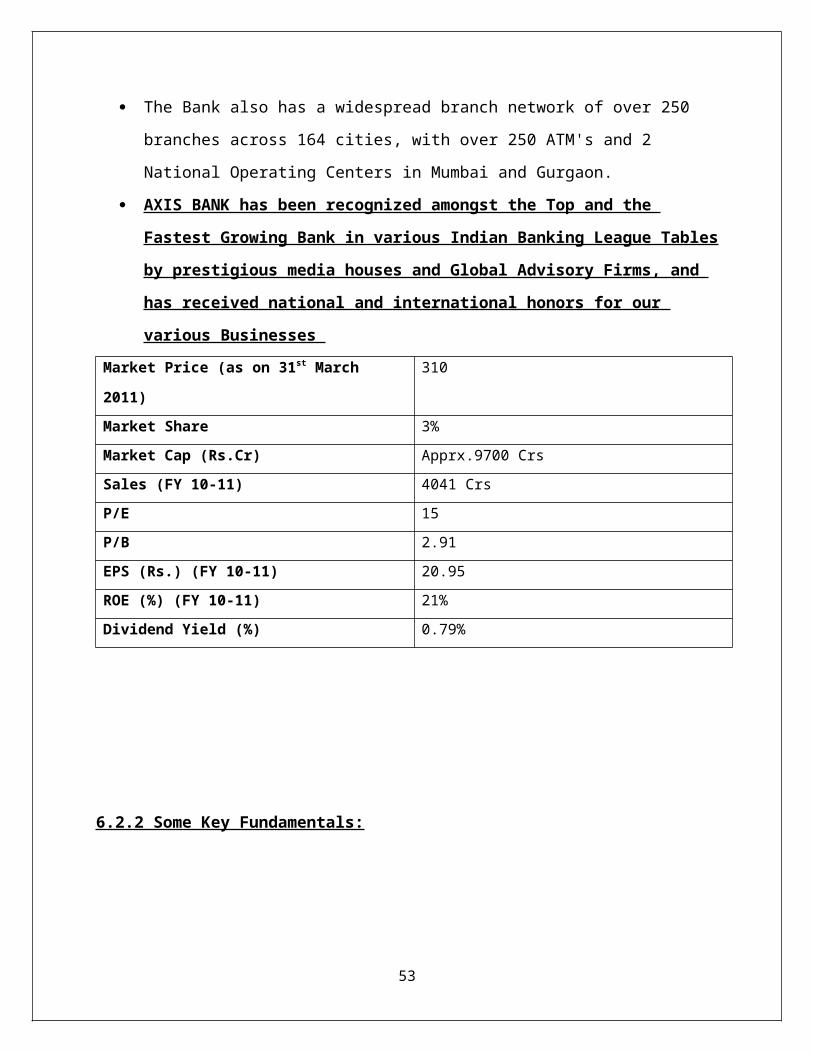
The Bank also has a widespread branch network of over 250
branches across 164 cities, with over 250 ATM's and 2
National Operating Centers in Mumbai and Gurgaon.
AXIS BANK has been recognized amongst the Top and the
Fastest Growing Bank in various Indian Banking League Tables
by prestigious media houses and Global Advisory Firms, and
has received national and international honors for our
various Businesses Market Price (as on 31st March
2011)
310
Market Share 3%Market Cap (Rs.Cr) Apprx.9700 CrsSales (FY 10-11) 4041 CrsP/E 15P/B 2.91EPS (Rs.) (FY 10-11) 20.95ROE (%) (FY 10-11) 21%Dividend Yield (%) 0.79%
6.2.2 Some Key Fundamentals:
53
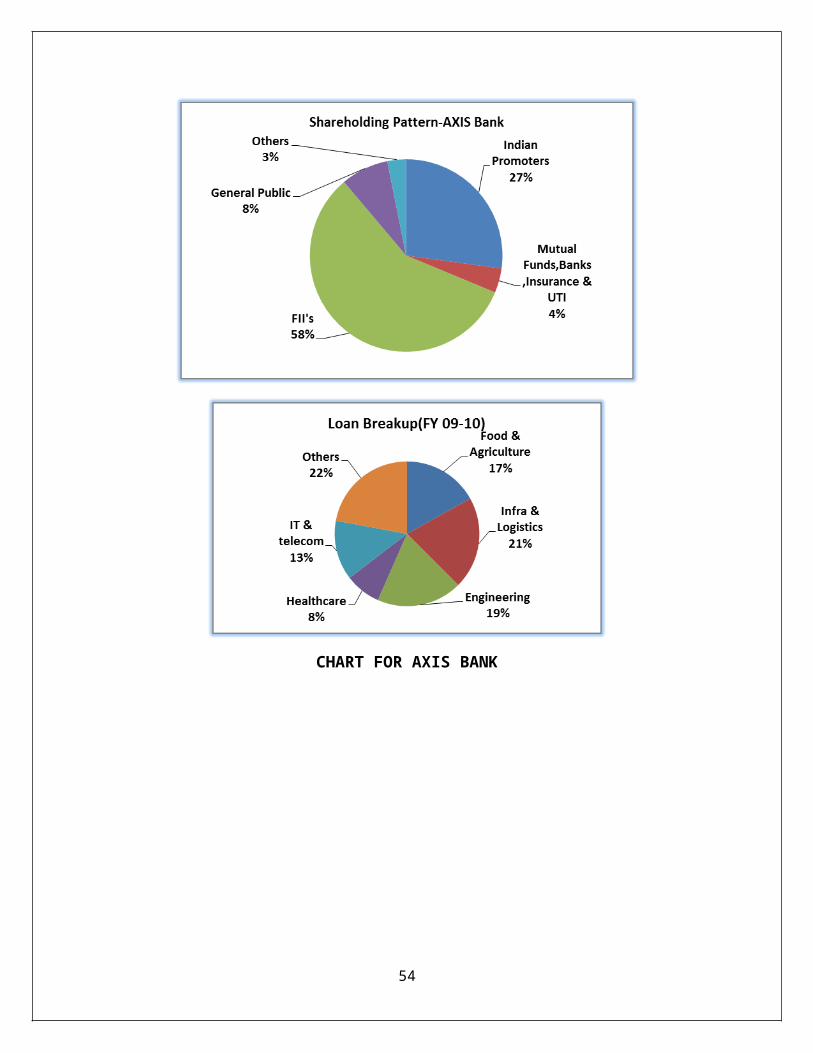
CHART FOR AXIS BANK
54
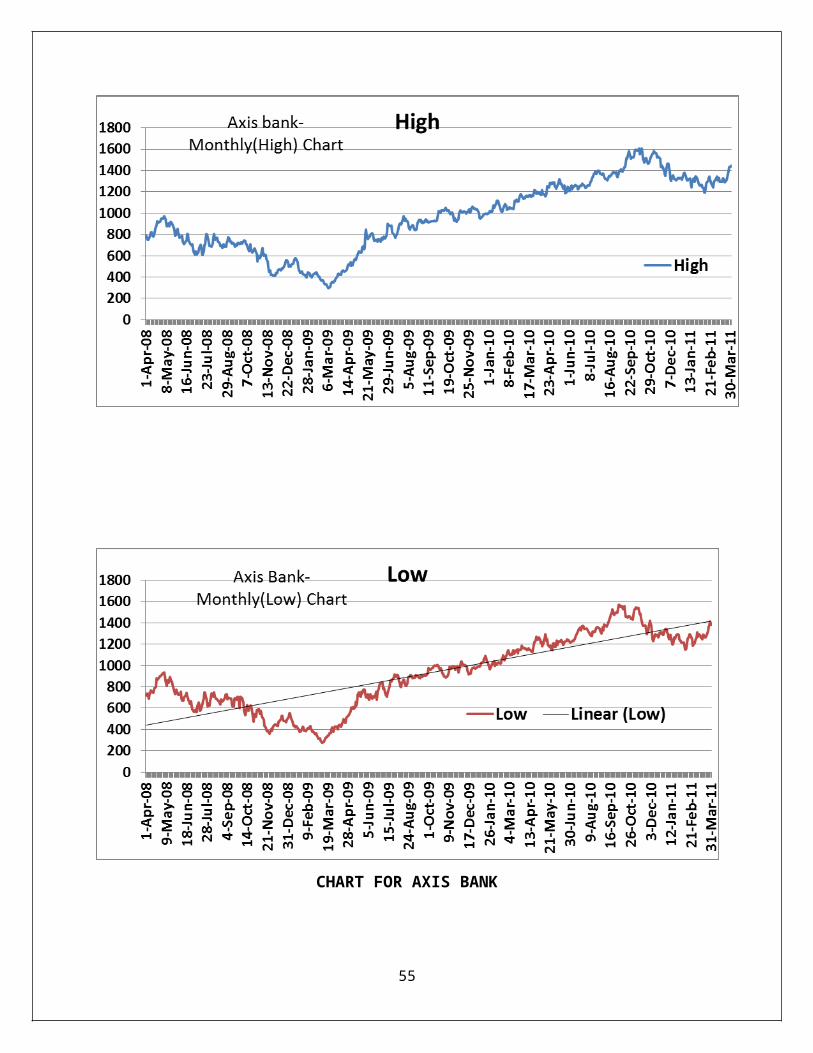
CHART FOR AXIS BANK
55
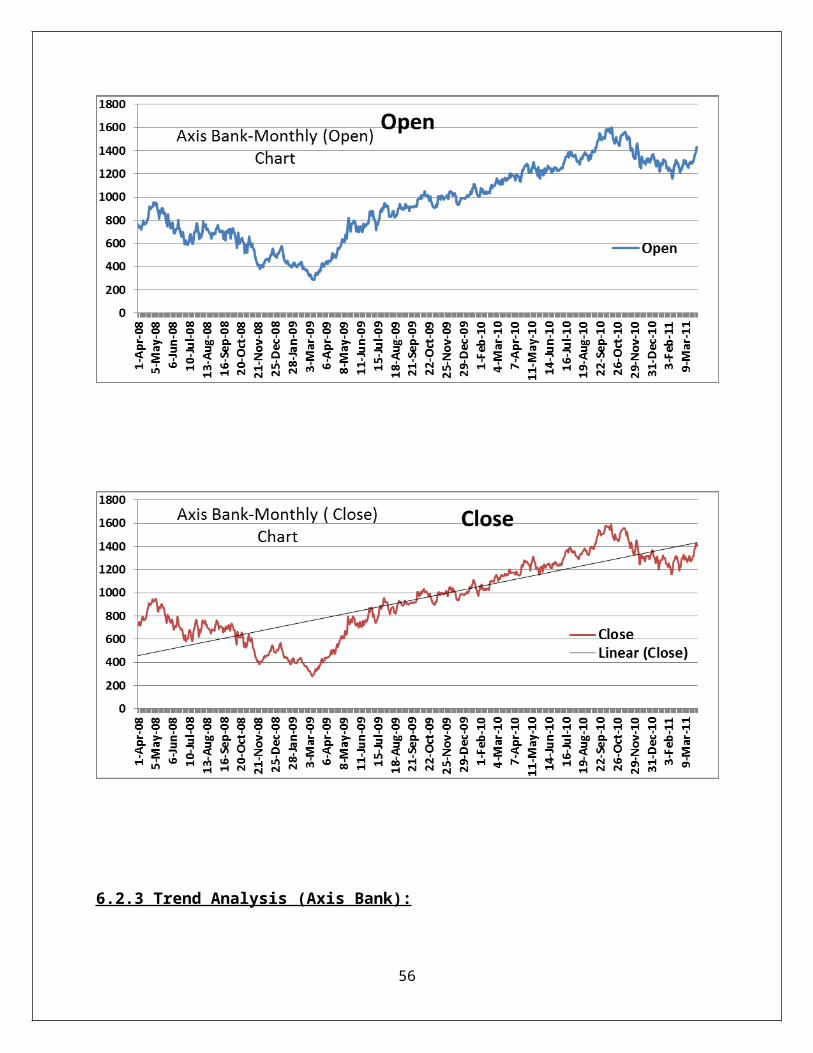
6.2.3 Trend Analysis (Axis Bank):
56
The 3 year chart from 1st April 2008 to 31st March 2011 was
analyzed for various patterns like Pyramid pattern i.e. Stock
rises for a period of time before it falls again to the same
level from where it started rising & Inverted Pyramid pattern
i.e. Stock falls for a period of time than it starts to rise
again & reach the original level.
The probable reasons which may be company specific announcements,
market trend, global & local geopolitical news etc. were explored
to ascertain the observed patterns. The analysis of the same is
as following:
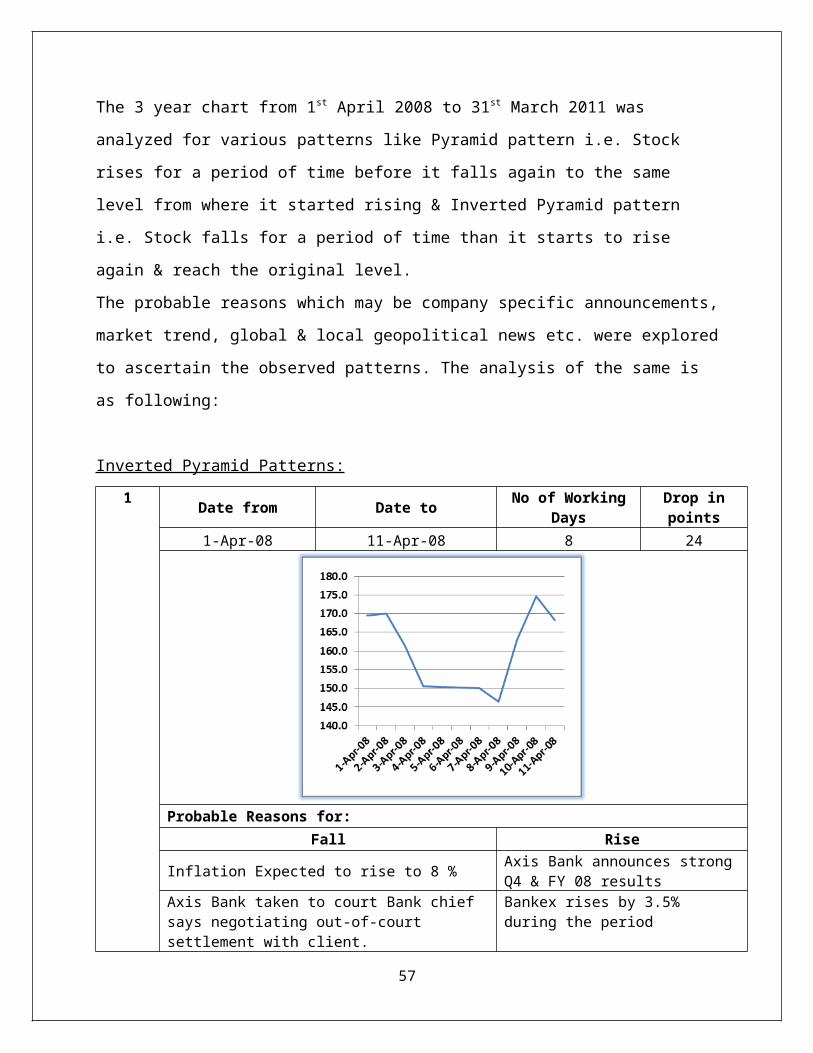
Inverted Pyramid Patterns:1 Date from Date to No of Working
DaysDrop inpoints
1-Apr-08 11-Apr-08 8 24
Probable Reasons for:Fall Rise
Inflation Expected to rise to 8 % Axis Bank announces strongQ4 & FY 08 results
Axis Bank taken to court Bank chief says negotiating out-of-court settlement with client.
Bankex rises by 3.5% during the period
57
Stock in a technical downtrend
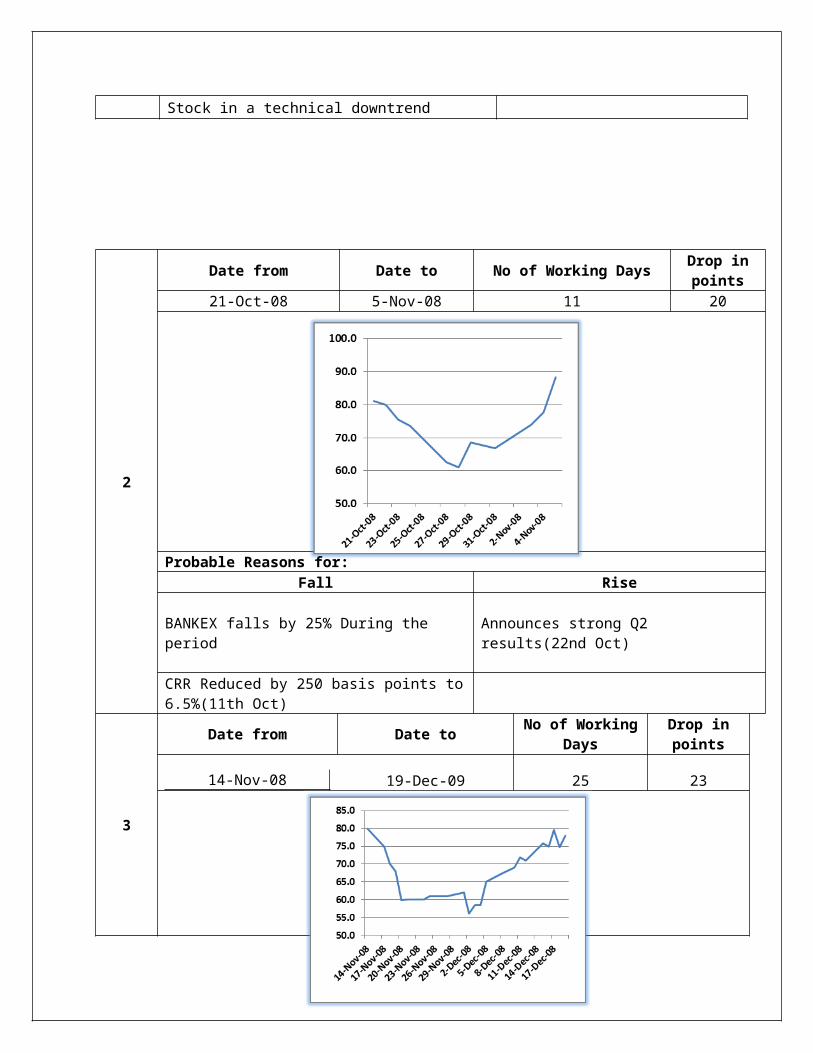
2
Date from Date to No of Working Days Drop inpoints
21-Oct-08 5-Nov-08 11 20
Probable Reasons for:Fall Rise
BANKEX falls by 25% During the period
Announces strong Q2 results(22nd Oct)
CRR Reduced by 250 basis points to6.5%(11th Oct)
3
Date from Date to No of WorkingDays
Drop inpoints
14-Nov-08 19-Dec-09 25 23
58
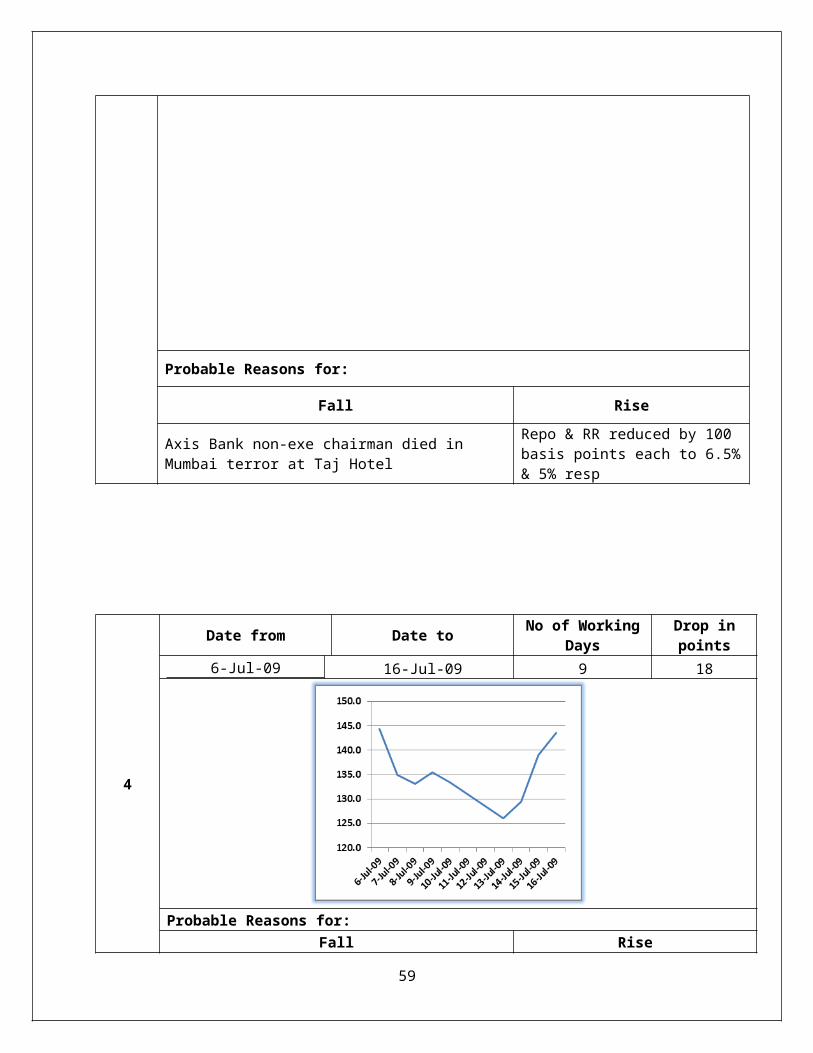
Probable Reasons for:
Fall Rise
Axis Bank non-exe chairman died in Mumbai terror at Taj Hotel
Repo & RR reduced by 100 basis points each to 6.5%& 5% resp
4
Date from Date to No of WorkingDays
Drop inpoints
6-Jul-09 16-Jul-09 9 18
Probable Reasons for:Fall Rise
59
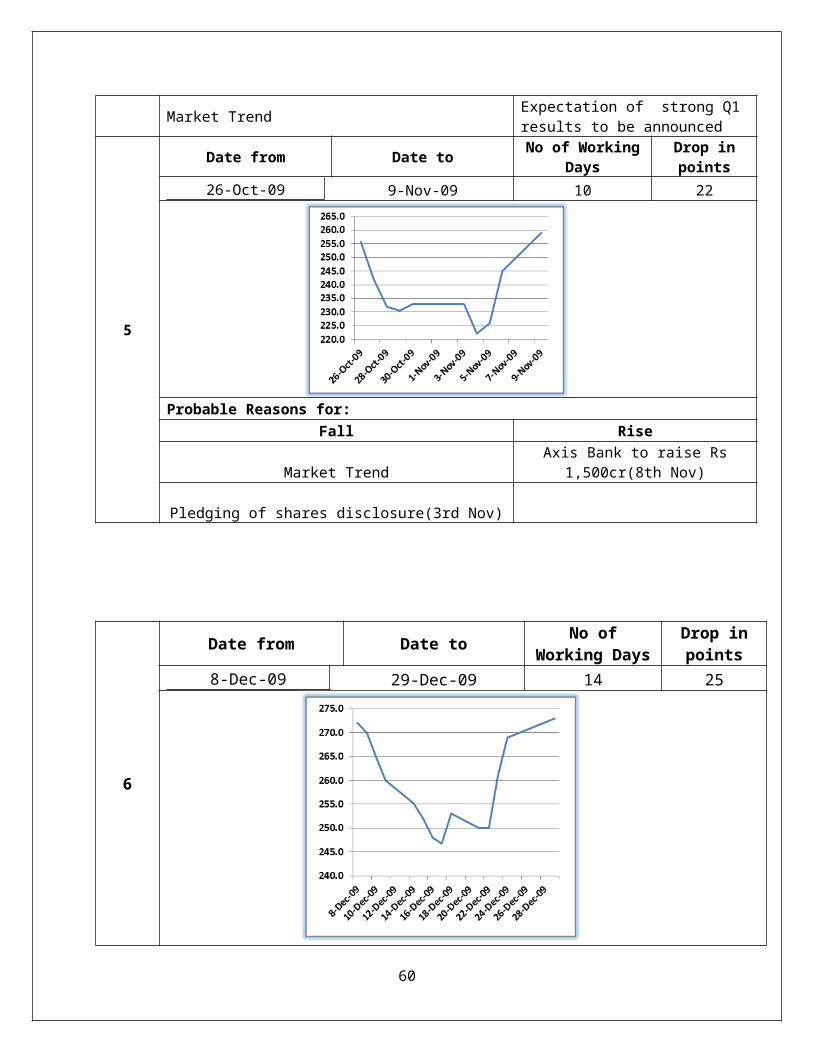
Market Trend Expectation of strong Q1 results to be announced
5
Date from Date to No of WorkingDays
Drop inpoints
26-Oct-09 9-Nov-09 10 22
Probable Reasons for:Fall Rise
Market TrendAxis Bank to raise Rs
1,500cr(8th Nov)
Pledging of shares disclosure(3rd Nov)
6
Date from Date to No ofWorking Days
Drop inpoints
8-Dec-09 29-Dec-09 14 25
60
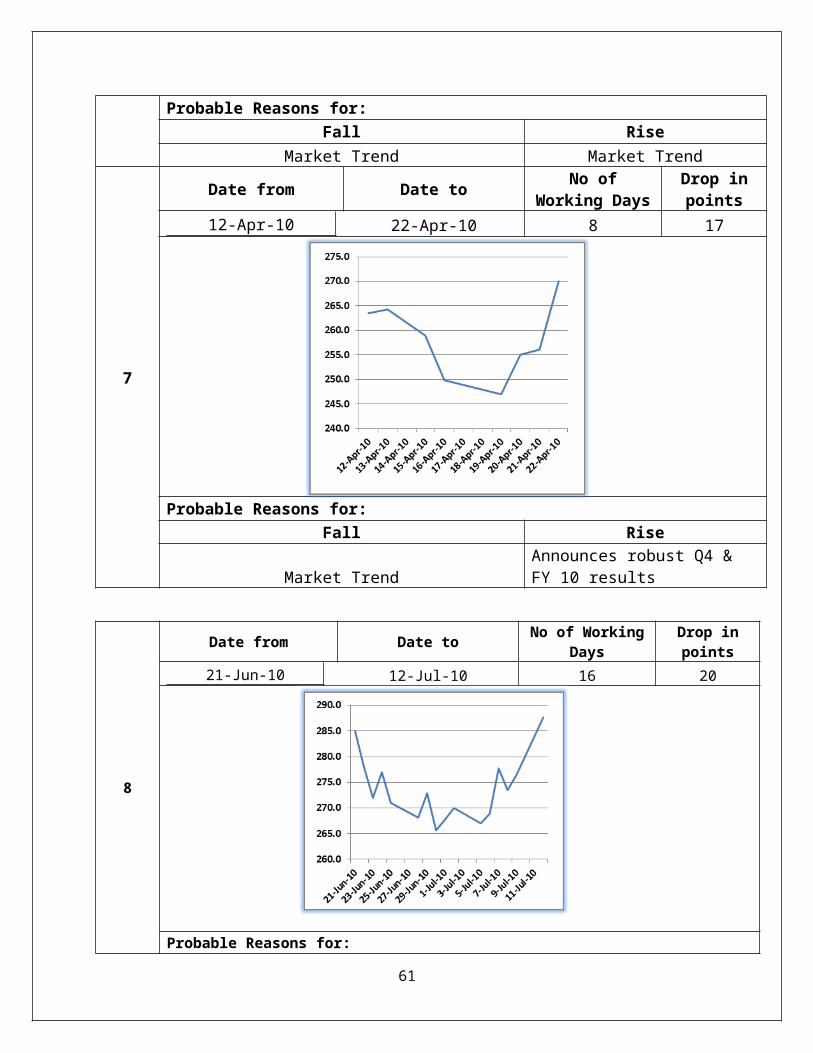
Probable Reasons for:Fall Rise
Market Trend Market Trend
7
Date from Date to No ofWorking Days
Drop inpoints
12-Apr-10 22-Apr-10 8 17
Probable Reasons for:Fall Rise
Market TrendAnnounces robust Q4 & FY 10 results
8
Date from Date to No of WorkingDays
Drop inpoints
21-Jun-10 12-Jul-10 16 20
Probable Reasons for:
61
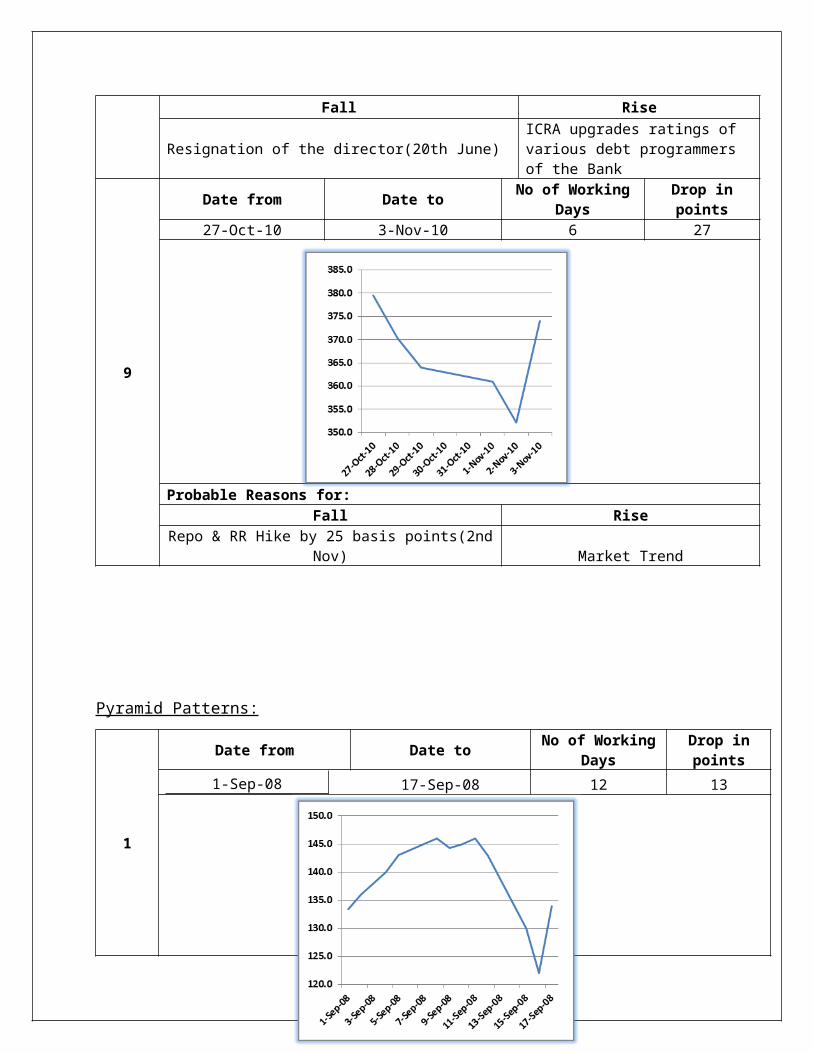
Fall Rise
Resignation of the director(20th June)ICRA upgrades ratings of various debt programmers of the Bank
9
Date from Date to No of WorkingDays
Drop inpoints
27-Oct-10 3-Nov-10 6 27
Probable Reasons for:Fall Rise
Repo & RR Hike by 25 basis points(2ndNov) Market Trend
Pyramid Patterns:
1
Date from Date to No of WorkingDays
Drop inpoints
1-Sep-08 17-Sep-08 12 13
62
Probable Reasons for:Rise Fall
Market Trend Market TrendAllotment of shares under ESOPS(8th Sep)
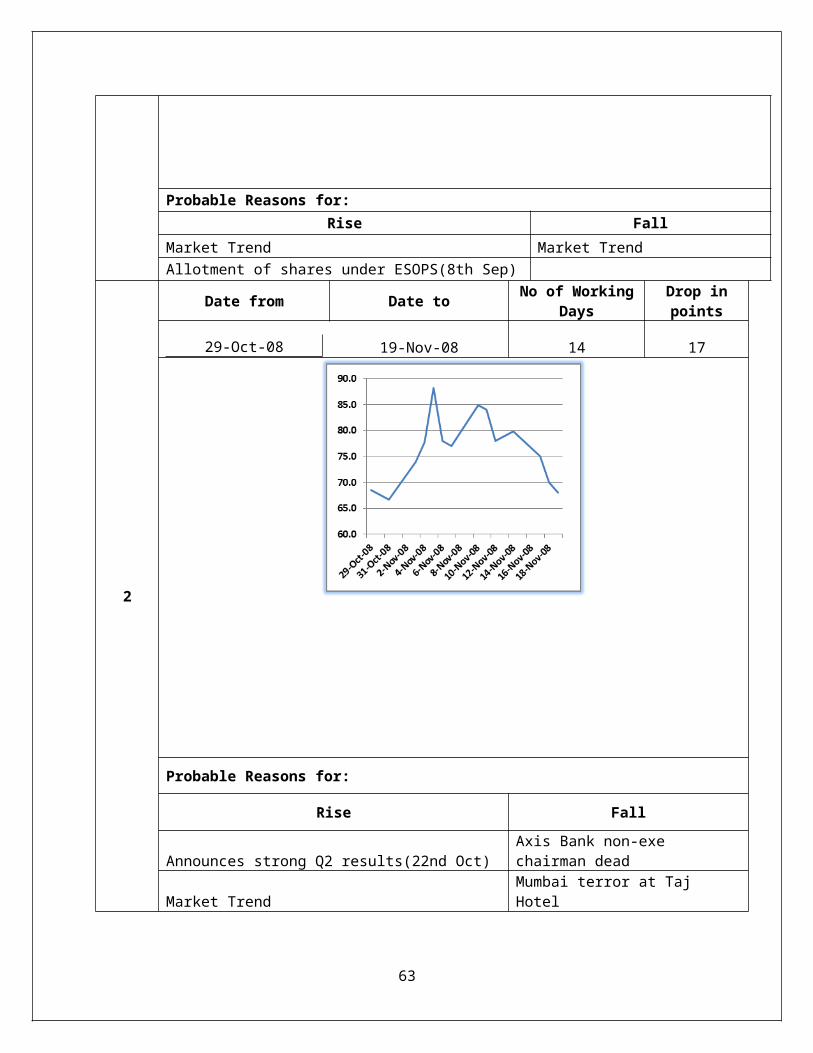
2
Date from Date to No of WorkingDays
Drop inpoints
29-Oct-08 19-Nov-08 14 17
Probable Reasons for:
Rise Fall
Announces strong Q2 results(22nd Oct)Axis Bank non-exe chairman dead
Market TrendMumbai terror at Taj Hotel
63
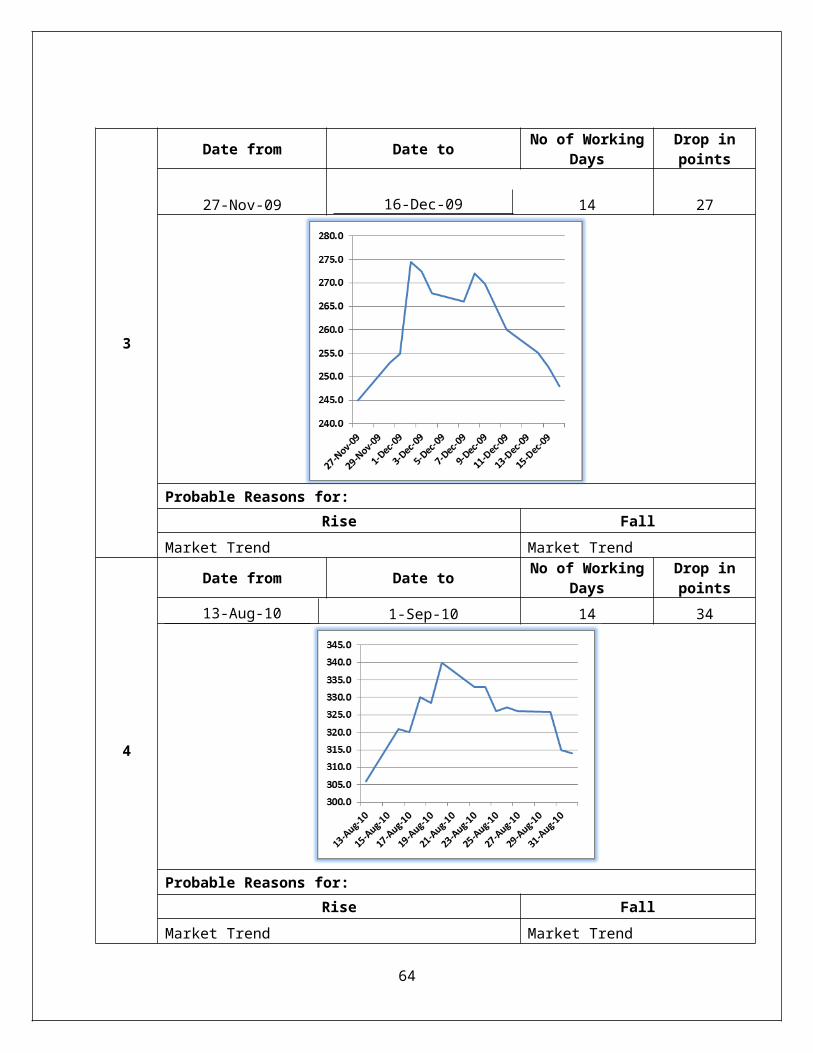
3
Date from Date to No of WorkingDays
Drop inpoints
27-Nov-09 16-Dec-09 14 27
Probable Reasons for:Rise Fall
Market Trend Market Trend
4
Date from Date to No of WorkingDays
Drop inpoints
13-Aug-10 1-Sep-10 14 34
Probable Reasons for:Rise Fall
Market Trend Market Trend
64

5
Date from Date to No of WorkingDays
Drop inpoints
20-Oct-10 2-Nov-10 10 29
Probable Reasons for:
Rise Fall
Strong Q2 results on 20th OctRepo & RR Hike by 25 basispoints(2nd Nov)
AXIS BankAll timeHigh Date
All-timeLow Date
Open 1600 27-Oct-10 287 9-Mar-09High 1608 1-Nov-10 296 9-Mar-09Low 1571 5-Nov-10 278 9-Mar-09Close 1588 26-Oct-10 281 9-Mar-09
Recovery Period during Recession (2008):
Date from Date to No of WorkingDays
Drop inpoints % Fall
22-Sep-08 20-May-09 155 100 71%
65
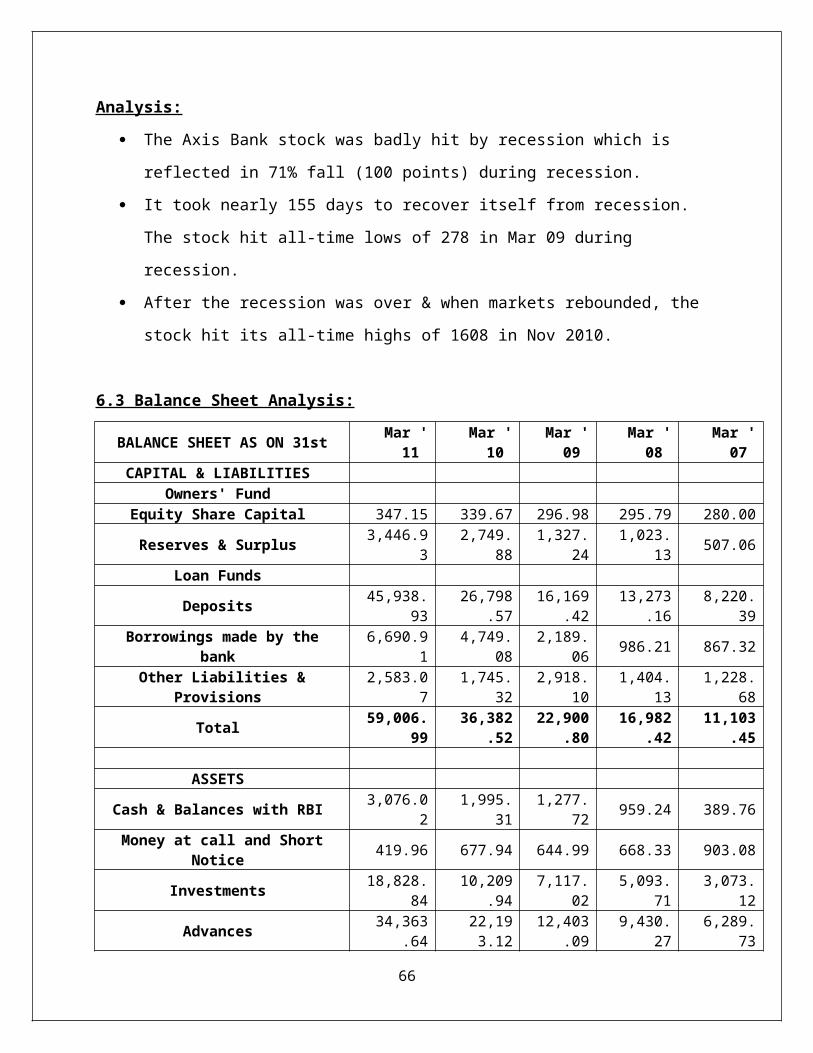
Analysis:
The Axis Bank stock was badly hit by recession which is
reflected in 71% fall (100 points) during recession.
It took nearly 155 days to recover itself from recession.
The stock hit all-time lows of 278 in Mar 09 during
recession.
After the recession was over & when markets rebounded, the
stock hit its all-time highs of 1608 in Nov 2010.
6.3 Balance Sheet Analysis:
BALANCE SHEET AS ON 31st Mar '11
Mar '10
Mar '09
Mar '08
Mar '07
CAPITAL & LIABILITIES Owners' Fund
Equity Share Capital 347.15 339.67 296.98 295.79 280.00
Reserves & Surplus 3,446.93
2,749.88
1,327.24
1,023.13 507.06
Loan Funds
Deposits 45,938.93
26,798.57
16,169.42
13,273.16
8,220.39
Borrowings made by thebank
6,690.91
4,749.08
2,189.06 986.21 867.32
Other Liabilities &Provisions
2,583.07
1,745.32
2,918.10
1,404.13
1,228.68
Total 59,006.99
36,382.52
22,900.80
16,982.42
11,103.45
ASSETS
Cash & Balances with RBI 3,076.02
1,995.31
1,277.72 959.24 389.76
Money at call and ShortNotice 419.96 677.94 644.99 668.33 903.08
Investments 18,828.84
10,209.94
7,117.02
5,093.71
3,073.12
Advances 34,363.64
22,193.12
12,403.09
9,430.27
6,289.73
66
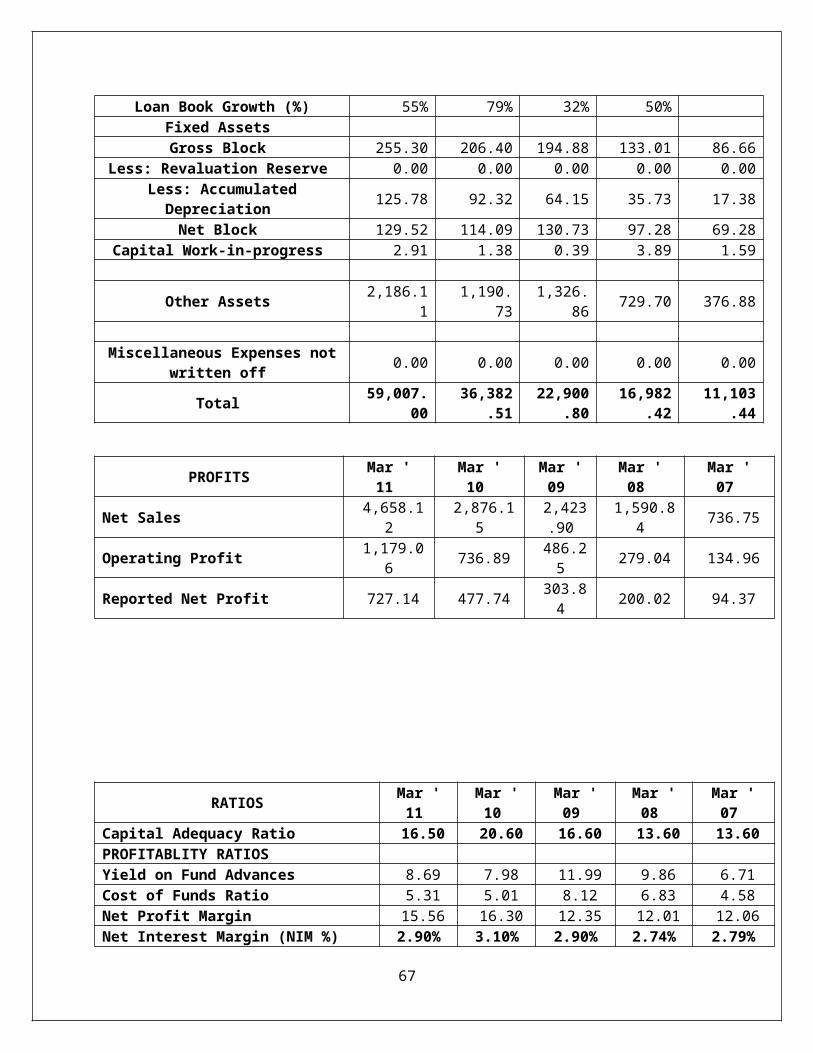
Loan Book Growth (%) 55% 79% 32% 50% Fixed Assets Gross Block 255.30 206.40 194.88 133.01 86.66
Less: Revaluation Reserve 0.00 0.00 0.00 0.00 0.00Less: AccumulatedDepreciation 125.78 92.32 64.15 35.73 17.38
Net Block 129.52 114.09 130.73 97.28 69.28Capital Work-in-progress 2.91 1.38 0.39 3.89 1.59
Other Assets 2,186.11
1,190.73
1,326.86 729.70 376.88
Miscellaneous Expenses not
written off 0.00 0.00 0.00 0.00 0.00
Total 59,007.00
36,382.51
22,900.80
16,982.42
11,103.44
PROFITS Mar '11
Mar '10
Mar '09
Mar '08
Mar '07
Net Sales 4,658.12
2,876.15
2,423.90
1,590.84 736.75
Operating Profit 1,179.06 736.89 486.2
5 279.04 134.96
Reported Net Profit 727.14 477.74 303.84 200.02 94.37
RATIOS Mar '11
Mar '10
Mar '09
Mar '08
Mar '07
Capital Adequacy Ratio 16.50 20.60 16.60 13.60 13.60PROFITABLITY RATIOS Yield on Fund Advances 8.69 7.98 11.99 9.86 6.71Cost of Funds Ratio 5.31 5.01 8.12 6.83 4.58Net Profit Margin 15.56 16.30 12.35 12.01 12.06Net Interest Margin (NIM %) 2.90% 3.10% 2.90% 2.74% 2.79%
67
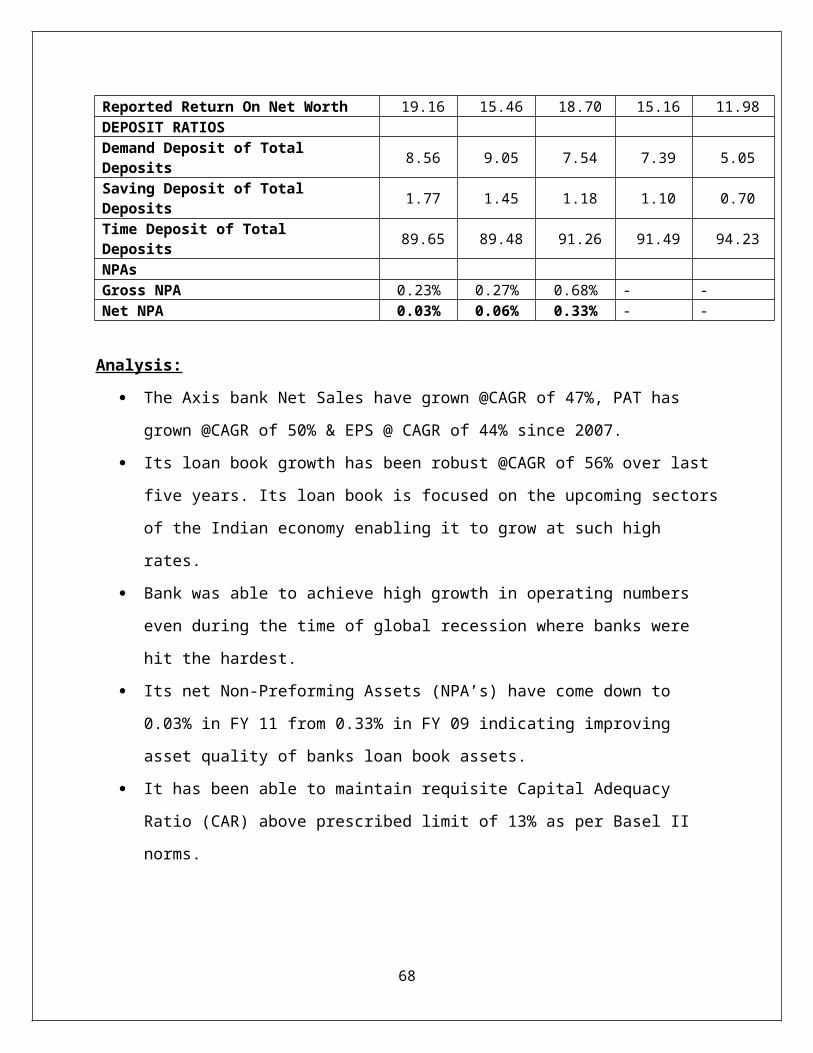
Reported Return On Net Worth 19.16 15.46 18.70 15.16 11.98DEPOSIT RATIOS Demand Deposit of Total Deposits 8.56 9.05 7.54 7.39 5.05
Saving Deposit of Total Deposits 1.77 1.45 1.18 1.10 0.70
Time Deposit of Total Deposits 89.65 89.48 91.26 91.49 94.23
NPAs Gross NPA 0.23% 0.27% 0.68% - -Net NPA 0.03% 0.06% 0.33% - -
Analysis:
The Axis bank Net Sales have grown @CAGR of 47%, PAT has
grown @CAGR of 50% & EPS @ CAGR of 44% since 2007.
Its loan book growth has been robust @CAGR of 56% over last
five years. Its loan book is focused on the upcoming sectors
of the Indian economy enabling it to grow at such high
rates.
Bank was able to achieve high growth in operating numbers
even during the time of global recession where banks were
hit the hardest.
Its net Non-Preforming Assets (NPA’s) have come down to
0.03% in FY 11 from 0.33% in FY 09 indicating improving
asset quality of banks loan book assets.
It has been able to maintain requisite Capital Adequacy
Ratio (CAR) above prescribed limit of 13% as per Basel II
norms.
68

The bank has achieved various accolades for his superior
performance over the past few years which put the bank in
the league of high quality private banks in India.
Conclusion:
Based on the above analysis we can conclude that if another
recession were to happen considering the superior operating
performance on key parameters which bank has demonstrated in
the recent years, it will be able to survive another
recession.
69
7 COMPETITORS ANALYSIS (ULIPs COMPARISION):
This phase of the project involved comparing one of the most successful ULIP product under BSLI i.e. BSLI Classic Life Planstable with the existing similar products of competitors in the marketplace.
After identifying the similar product of competitors & collection of relevant data, the detail comparison was carriedconsidering all the parameters mentioned above. The competitors selected for the study included LIC, Baja Allianz & ING Vysya.
7.1 INTRODUCTION TO BSLI CLASSIC WHOLE LIFE PLAN
While one works hard towards achieving ambitions, one also
wishes to save for a comfortable retirement. And want a plan
that gives you the flexibility to manage your savings. The
BSLI Classic Life Plan gives complete control over the
investments by directing premiums to range of 10 Investment
Funds along with a range of rider options to give the security
of financial protection.
This plan offers:
Flexibility of directing your savings in 10 Investment
Funds, as per risk appetite
Choice of Pay Term
Whole life cover
Enhanced financial security for loved ones
70
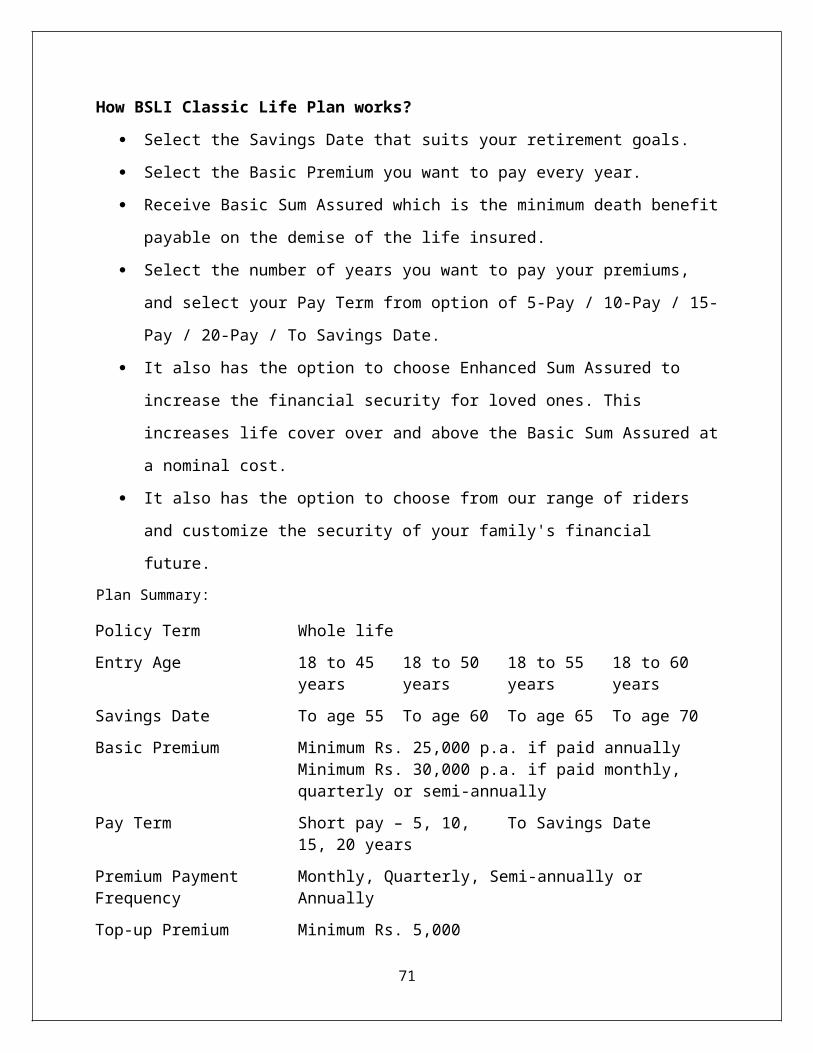
How BSLI Classic Life Plan works?
Select the Savings Date that suits your retirement goals.
Select the Basic Premium you want to pay every year.
Receive Basic Sum Assured which is the minimum death benefit
payable on the demise of the life insured.
Select the number of years you want to pay your premiums,
and select your Pay Term from option of 5-Pay / 10-Pay / 15-
Pay / 20-Pay / To Savings Date.
It also has the option to choose Enhanced Sum Assured to
increase the financial security for loved ones. This
increases life cover over and above the Basic Sum Assured at
a nominal cost.
It also has the option to choose from our range of riders
and customize the security of your family's financial
future.Plan Summary:
Policy Term Whole lifeEntry Age 18 to 45
years18 to 50 years
18 to 55 years
18 to 60 years
Savings Date To age 55 To age 60 To age 65 To age 70Basic Premium Minimum Rs. 25,000 p.a. if paid annually
Minimum Rs. 30,000 p.a. if paid monthly, quarterly or semi-annually
Pay Term Short pay – 5, 10, 15, 20 years
To Savings Date
Premium Payment Frequency
Monthly, Quarterly, Semi-annually or Annually
Top-up Premium Minimum Rs. 5,000
71
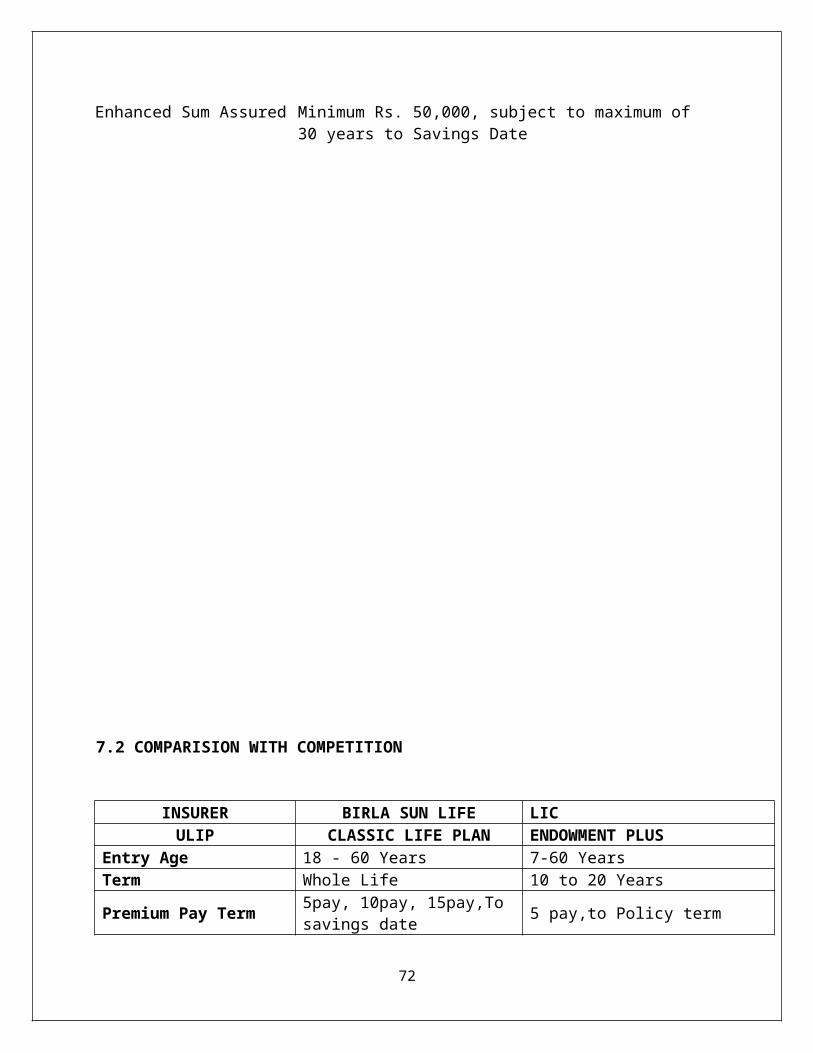
Enhanced Sum Assured Minimum Rs. 50,000, subject to maximum of 30 years to Savings Date
7.2 COMPARISION WITH COMPETITION
INSURER BIRLA SUN LIFE LICULIP CLASSIC LIFE PLAN ENDOWMENT PLUS
Entry Age 18 - 60 Years 7-60 YearsTerm Whole Life 10 to 20 Years
Premium Pay Term 5pay, 10pay, 15pay,To savings date 5 pay,to Policy term
72
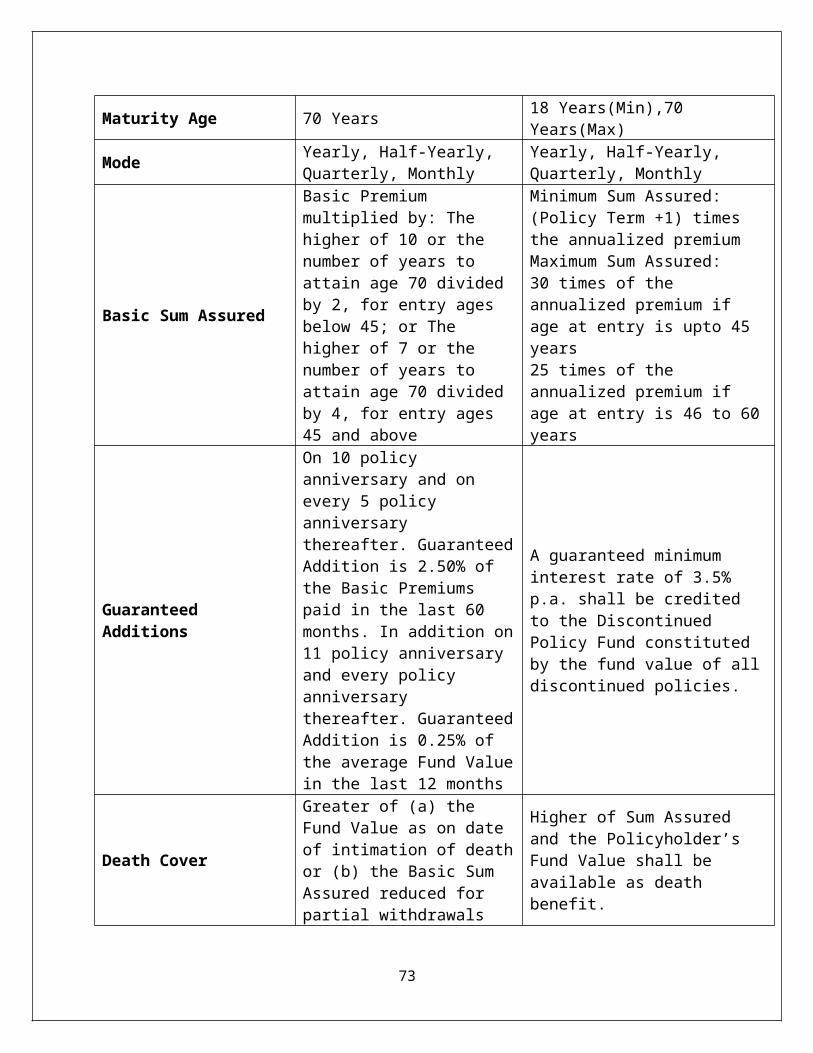
Maturity Age 70 Years 18 Years(Min),70 Years(Max)
Mode Yearly, Half-Yearly, Quarterly, Monthly
Yearly, Half-Yearly, Quarterly, Monthly
Basic Sum Assured
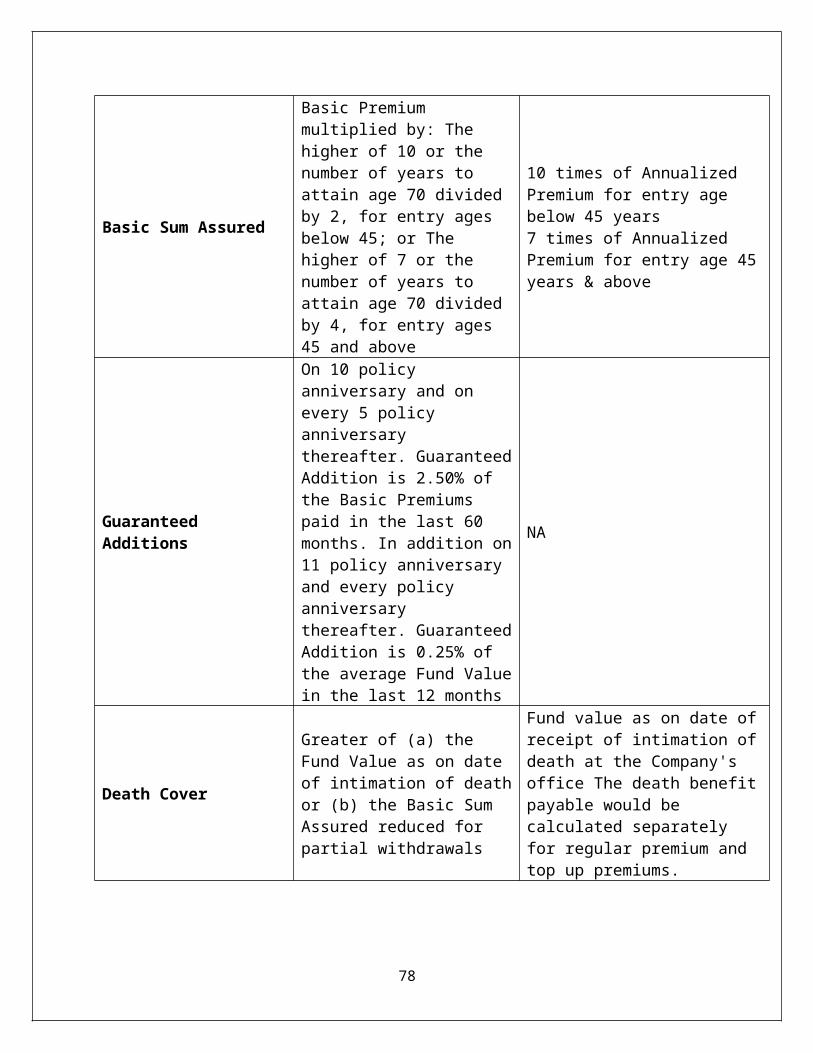
Basic Premium multiplied by: The higher of 10 or the number of years to attain age 70 divided by 2, for entry ages below 45; or The higher of 7 or the number of years to attain age 70 divided by 4, for entry ages45 and above
Minimum Sum Assured: (Policy Term +1) times the annualized premium Maximum Sum Assured:30 times of the annualized premium if age at entry is upto 45 years25 times of the annualized premium if age at entry is 46 to 60years
Guaranteed Additions
On 10 policy anniversary and on every 5 policy anniversary thereafter. GuaranteedAddition is 2.50% of the Basic Premiums paid in the last 60 months. In addition on11 policy anniversary and every policy anniversary thereafter. GuaranteedAddition is 0.25% of the average Fund Valuein the last 12 months
A guaranteed minimum interest rate of 3.5% p.a. shall be credited to the Discontinued Policy Fund constituted by the fund value of alldiscontinued policies.
Death Cover
Greater of (a) the Fund Value as on date of intimation of deathor (b) the Basic Sum Assured reduced for partial withdrawals
Higher of Sum Assured and the Policyholder’s Fund Value shall be available as death benefit.
73
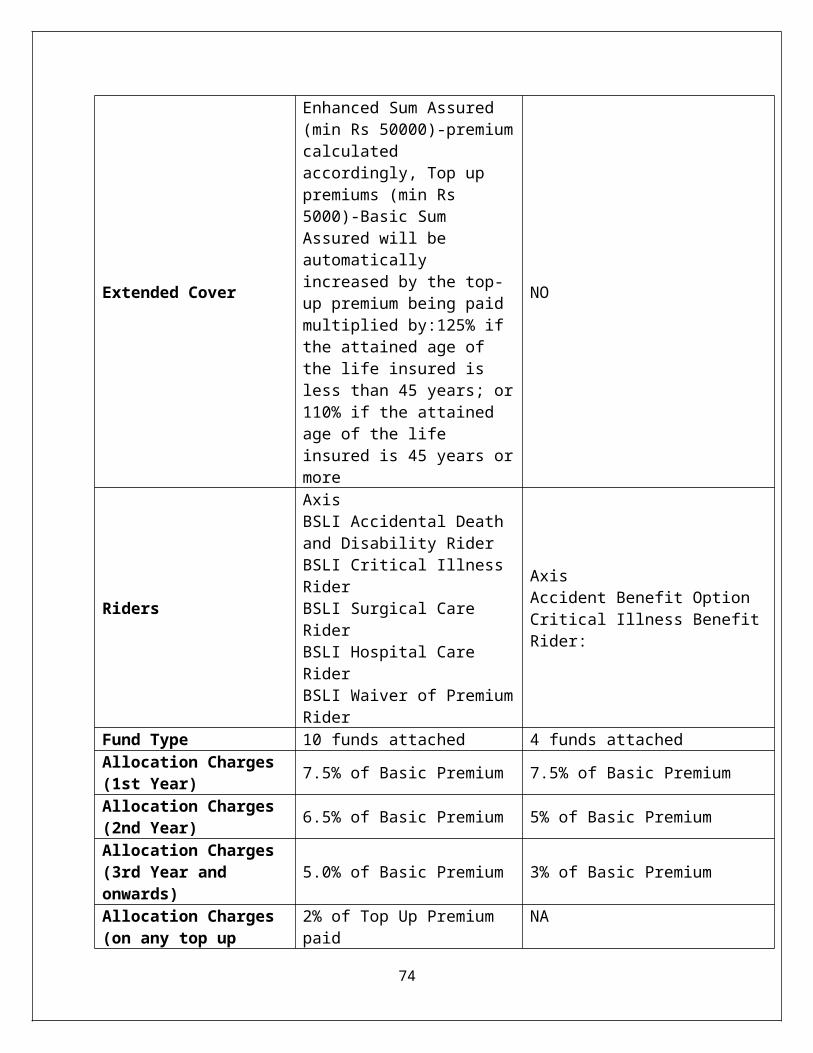
Extended Cover
Enhanced Sum Assured (min Rs 50000)-premiumcalculated accordingly, Top up premiums (min Rs 5000)-Basic Sum Assured will be automatically increased by the top-up premium being paid multiplied by:125% if the attained age of the life insured is less than 45 years; or110% if the attained age of the life insured is 45 years ormore
NO
Riders
Axis BSLI Accidental Death and Disability RiderBSLI Critical Illness RiderBSLI Surgical Care RiderBSLI Hospital Care RiderBSLI Waiver of PremiumRider
Axis Accident Benefit Option Critical Illness BenefitRider:
Fund Type 10 funds attached 4 funds attachedAllocation Charges (1st Year) 7.5% of Basic Premium 7.5% of Basic Premium
Allocation Charges (2nd Year) 6.5% of Basic Premium 5% of Basic Premium
Allocation Charges (3rd Year and onwards)
5.0% of Basic Premium 3% of Basic Premium
Allocation Charges (on any top up
2% of Top Up Premium paid
NA
74
premium)
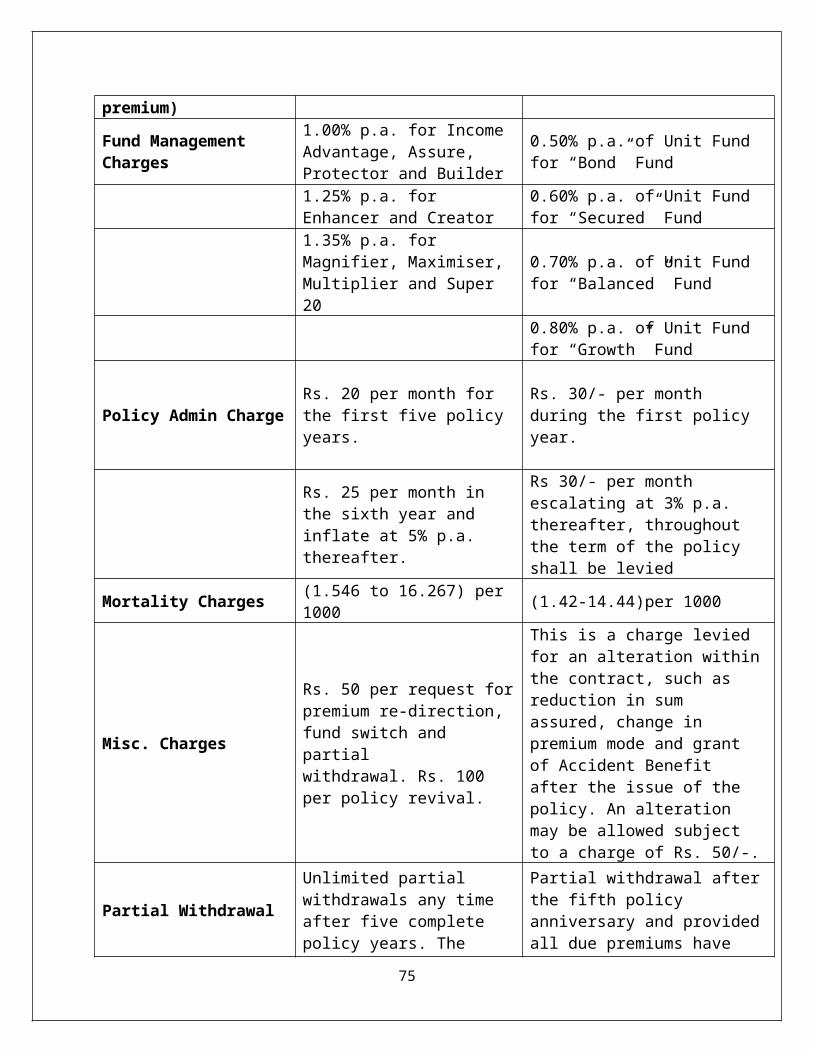
Fund Management Charges
1.00% p.a. for Income Advantage, Assure, Protector and Builder
0.50% p.a. of Unit Fund for “Bond” Fund
1.25% p.a. for Enhancer and Creator
0.60% p.a. of Unit Fund for “Secured” Fund
1.35% p.a. for Magnifier, Maximiser, Multiplier and Super 20
0.70% p.a. of Unit Fund for “Balanced” Fund
0.80% p.a. of Unit Fund for “Growth” Fund
Policy Admin ChargeRs. 20 per month for the first five policy years.
Rs. 30/- per month during the first policy year.
Rs. 25 per month in the sixth year and inflate at 5% p.a. thereafter.
Rs 30/- per month escalating at 3% p.a. thereafter, throughout the term of the policy shall be levied
Mortality Charges (1.546 to 16.267) per 1000 (1.42-14.44)per 1000
Misc. Charges
Rs. 50 per request forpremium re-direction, fund switch and partialwithdrawal. Rs. 100 per policy revival.
This is a charge levied for an alteration withinthe contract, such as reduction in sum assured, change in premium mode and grant of Accident Benefit after the issue of the policy. An alteration may be allowed subject to a charge of Rs. 50/-.
Partial Withdrawal
Unlimited partial withdrawals any time after five complete policy years. The
Partial withdrawal afterthe fifth policy anniversary and providedall due premiums have
75
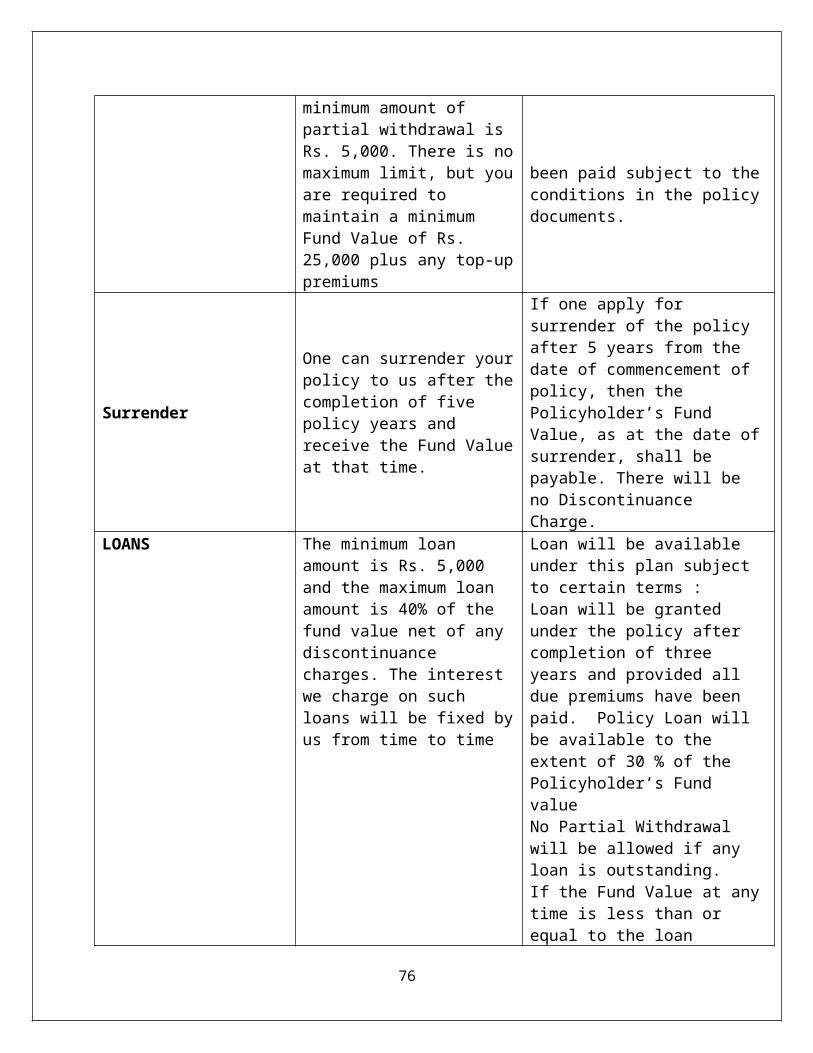
minimum amount of partial withdrawal is Rs. 5,000. There is nomaximum limit, but youare required to maintain a minimum Fund Value of Rs. 25,000 plus any top-uppremiums
been paid subject to theconditions in the policydocuments.
Surrender
One can surrender yourpolicy to us after thecompletion of five policy years and receive the Fund Valueat that time.
If one apply for surrender of the policy after 5 years from the date of commencement of policy, then the Policyholder’s Fund Value, as at the date ofsurrender, shall be payable. There will be no Discontinuance Charge.
LOANS The minimum loan amount is Rs. 5,000 and the maximum loan amount is 40% of the fund value net of any discontinuance charges. The interest we charge on such loans will be fixed byus from time to time
Loan will be available under this plan subject to certain terms : Loan will be granted under the policy after completion of three years and provided all due premiums have been paid. Policy Loan will be available to the extent of 30 % of the Policyholder’s Fund value No Partial Withdrawal will be allowed if any loan is outstanding. If the Fund Value at anytime is less than or equal to the loan
76
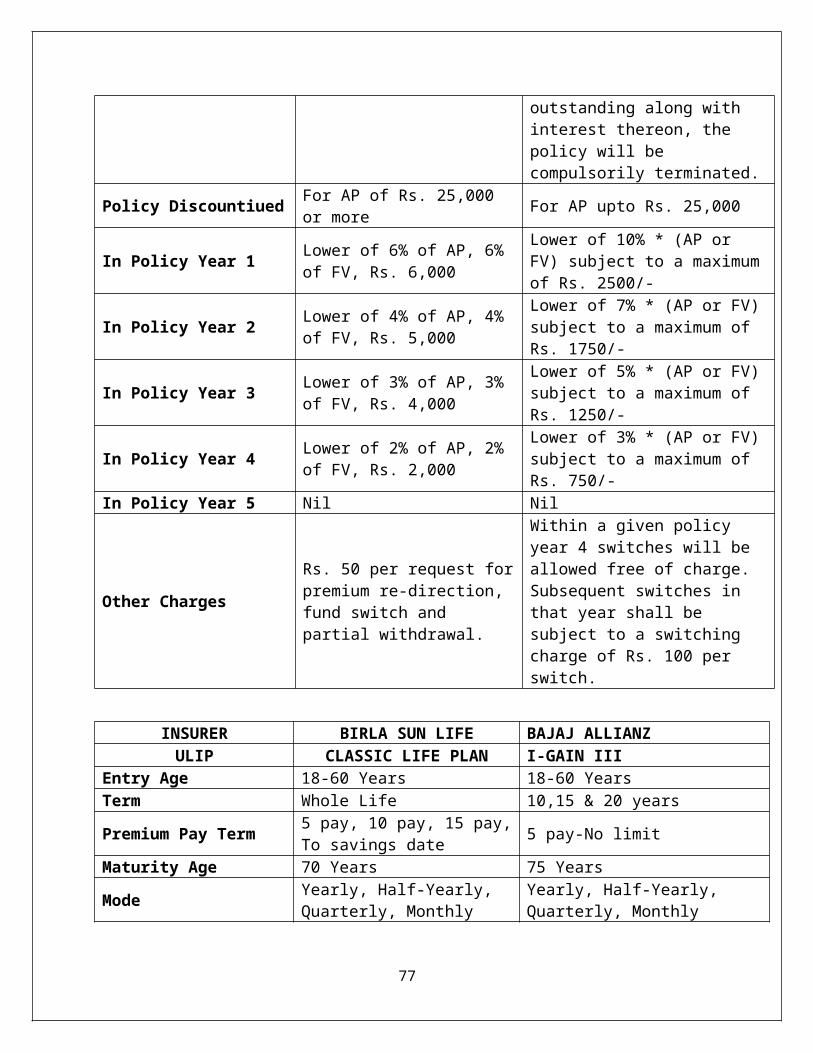
outstanding along with interest thereon, the policy will be compulsorily terminated.
Policy Discountiued For AP of Rs. 25,000 or more For AP upto Rs. 25,000
In Policy Year 1 Lower of 6% of AP, 6% of FV, Rs. 6,000
Lower of 10% * (AP or FV) subject to a maximumof Rs. 2500/-
In Policy Year 2 Lower of 4% of AP, 4% of FV, Rs. 5,000
Lower of 7% * (AP or FV)subject to a maximum of Rs. 1750/-
In Policy Year 3 Lower of 3% of AP, 3% of FV, Rs. 4,000
Lower of 5% * (AP or FV)subject to a maximum of Rs. 1250/-
In Policy Year 4 Lower of 2% of AP, 2% of FV, Rs. 2,000
Lower of 3% * (AP or FV)subject to a maximum of Rs. 750/-
In Policy Year 5 Nil Nil
Other Charges
Rs. 50 per request forpremium re-direction, fund switch and partial withdrawal.
Within a given policy year 4 switches will be allowed free of charge. Subsequent switches in that year shall be subject to a switching charge of Rs. 100 per switch.
INSURER BIRLA SUN LIFE BAJAJ ALLIANZULIP CLASSIC LIFE PLAN I-GAIN III
Entry Age 18-60 Years 18-60 YearsTerm Whole Life 10,15 & 20 years
Premium Pay Term 5 pay, 10 pay, 15 pay,To savings date 5 pay-No limit
Maturity Age 70 Years 75 Years
Mode Yearly, Half-Yearly, Quarterly, Monthly
Yearly, Half-Yearly, Quarterly, Monthly
77
Basic Sum Assured
Basic Premium multiplied by: The higher of 10 or the number of years to attain age 70 divided by 2, for entry ages below 45; or The higher of 7 or the number of years to attain age 70 divided by 4, for entry ages45 and above
10 times of Annualized Premium for entry age below 45 years7 times of Annualized Premium for entry age 45years & above
Guaranteed Additions
On 10 policy anniversary and on every 5 policy anniversary thereafter. GuaranteedAddition is 2.50% of the Basic Premiums paid in the last 60 months. In addition on11 policy anniversary and every policy anniversary thereafter. GuaranteedAddition is 0.25% of the average Fund Valuein the last 12 months
NA
Death Cover
Greater of (a) the Fund Value as on date of intimation of deathor (b) the Basic Sum Assured reduced for partial withdrawals
Fund value as on date ofreceipt of intimation ofdeath at the Company's office The death benefitpayable would be calculated separately for regular premium and top up premiums.
78
Extended Cover
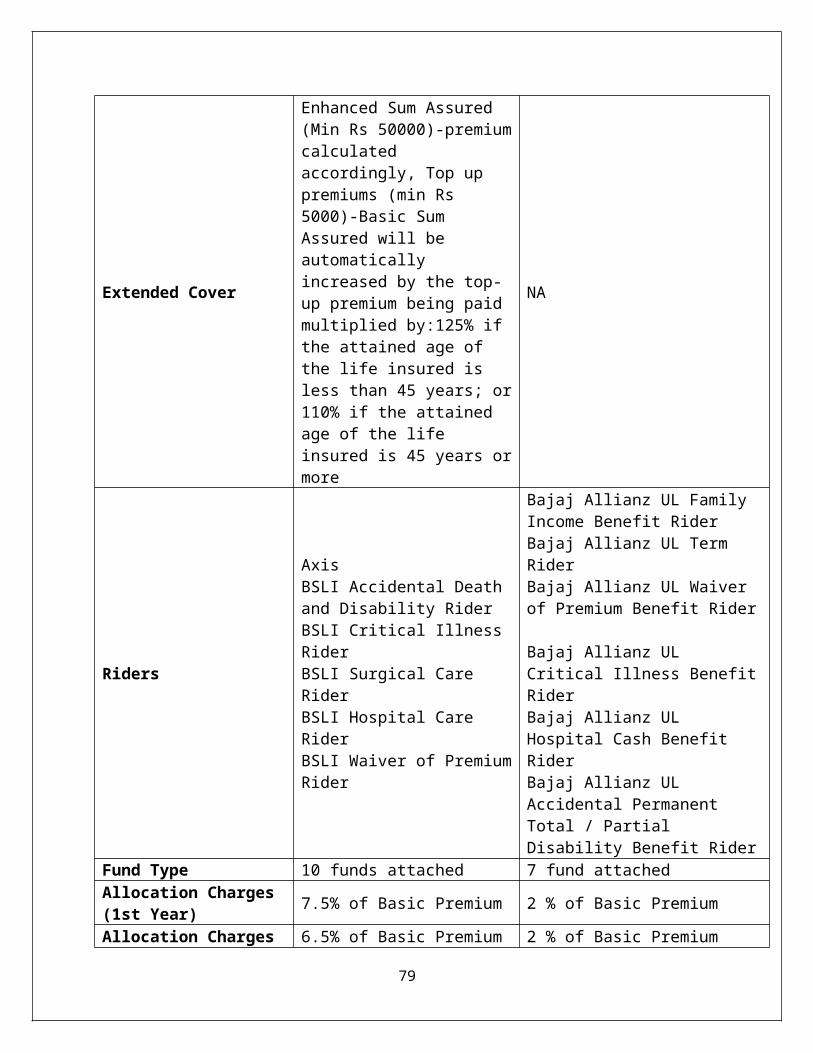
Enhanced Sum Assured (Min Rs 50000)-premiumcalculated accordingly, Top up premiums (min Rs 5000)-Basic Sum Assured will be automatically increased by the top-up premium being paid multiplied by:125% if the attained age of the life insured is less than 45 years; or110% if the attained age of the life insured is 45 years ormore
NA
Riders
Axis BSLI Accidental Death and Disability RiderBSLI Critical Illness RiderBSLI Surgical Care RiderBSLI Hospital Care RiderBSLI Waiver of PremiumRider
Bajaj Allianz UL Family Income Benefit RiderBajaj Allianz UL Term RiderBajaj Allianz UL Waiver of Premium Benefit Rider
Bajaj Allianz UL Critical Illness BenefitRider Bajaj Allianz UL Hospital Cash Benefit Rider Bajaj Allianz UL Accidental Permanent Total / Partial Disability Benefit Rider
Fund Type 10 funds attached 7 fund attachedAllocation Charges (1st Year) 7.5% of Basic Premium 2 % of Basic Premium
Allocation Charges 6.5% of Basic Premium 2 % of Basic Premium
79
(2nd Year)Allocation Charges (3rd Year and onwards)
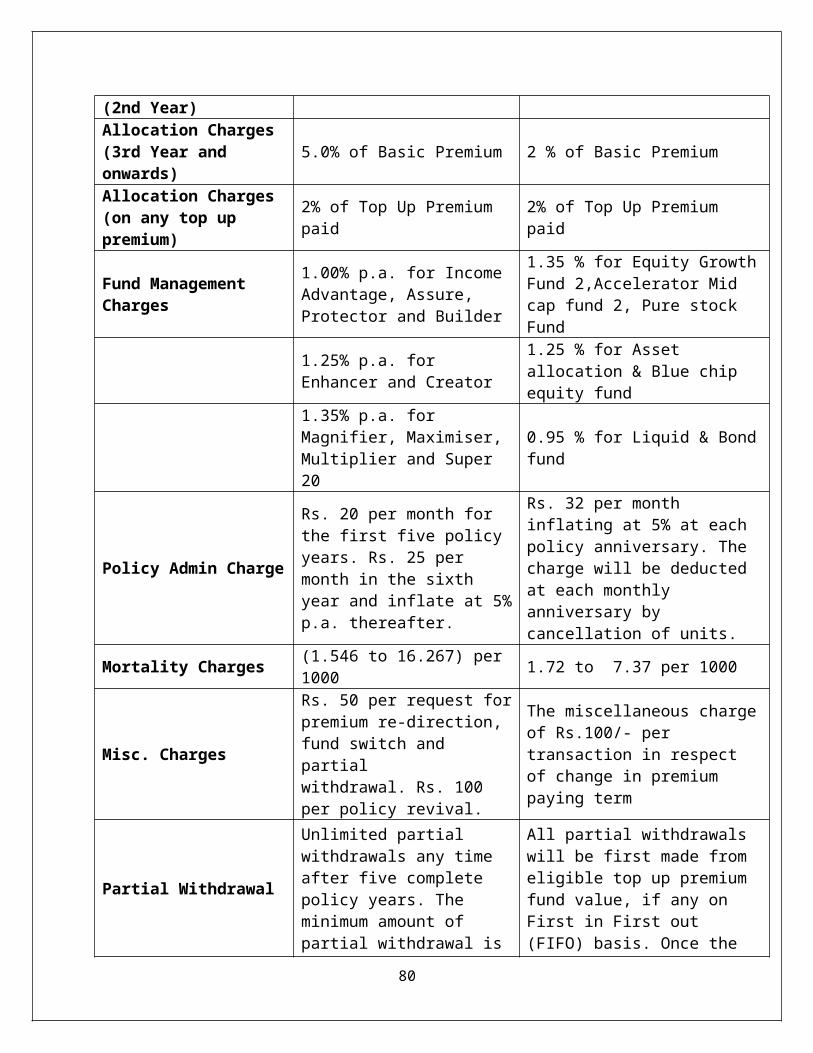
5.0% of Basic Premium 2 % of Basic Premium
Allocation Charges (on any top up premium)
2% of Top Up Premium paid
2% of Top Up Premium paid
Fund Management Charges
1.00% p.a. for Income Advantage, Assure, Protector and Builder
1.35 % for Equity GrowthFund 2,Accelerator Mid cap fund 2, Pure stock Fund
1.25% p.a. for Enhancer and Creator
1.25 % for Asset allocation & Blue chip equity fund
1.35% p.a. for Magnifier, Maximiser, Multiplier and Super 20
0.95 % for Liquid & Bondfund
Policy Admin Charge
Rs. 20 per month for the first five policy years. Rs. 25 per month in the sixth year and inflate at 5%p.a. thereafter.
Rs. 32 per month inflating at 5% at each policy anniversary. The charge will be deducted at each monthly anniversary by cancellation of units.
Mortality Charges (1.546 to 16.267) per 1000 1.72 to 7.37 per 1000
Misc. Charges
Rs. 50 per request forpremium re-direction, fund switch and partialwithdrawal. Rs. 100 per policy revival.
The miscellaneous chargeof Rs.100/- per transaction in respect of change in premium paying term
Partial Withdrawal
Unlimited partial withdrawals any time after five complete policy years. The minimum amount of partial withdrawal is
All partial withdrawals will be first made from eligible top up premium fund value, if any on First in First out (FIFO) basis. Once the
80
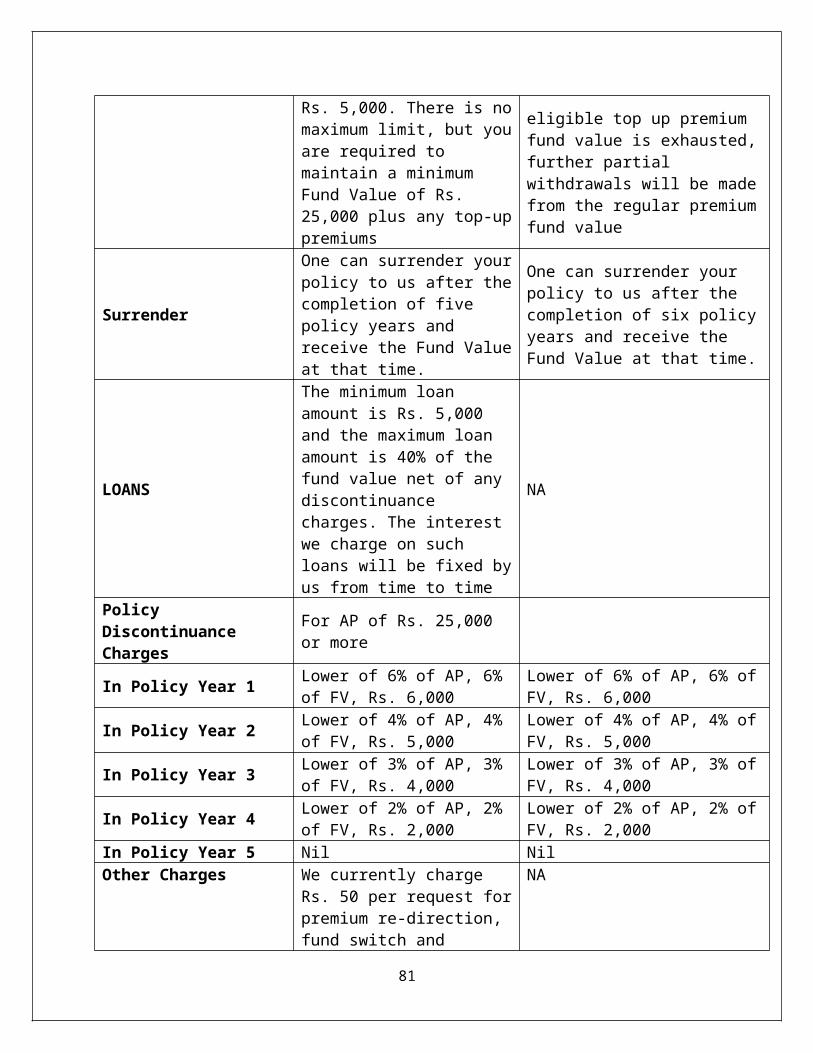
Rs. 5,000. There is nomaximum limit, but youare required to maintain a minimum Fund Value of Rs. 25,000 plus any top-uppremiums
eligible top up premium fund value is exhausted,further partial withdrawals will be madefrom the regular premiumfund value
Surrender
One can surrender yourpolicy to us after thecompletion of five policy years and receive the Fund Valueat that time.
One can surrender your policy to us after the completion of six policyyears and receive the Fund Value at that time.
LOANS
The minimum loan amount is Rs. 5,000 and the maximum loan amount is 40% of the fund value net of any discontinuance charges. The interest we charge on such loans will be fixed byus from time to time
NA
Policy Discontinuance Charges
For AP of Rs. 25,000 or more
In Policy Year 1 Lower of 6% of AP, 6% of FV, Rs. 6,000
Lower of 6% of AP, 6% ofFV, Rs. 6,000
In Policy Year 2 Lower of 4% of AP, 4% of FV, Rs. 5,000
Lower of 4% of AP, 4% ofFV, Rs. 5,000
In Policy Year 3 Lower of 3% of AP, 3% of FV, Rs. 4,000
Lower of 3% of AP, 3% ofFV, Rs. 4,000
In Policy Year 4 Lower of 2% of AP, 2% of FV, Rs. 2,000
Lower of 2% of AP, 2% ofFV, Rs. 2,000
In Policy Year 5 Nil NilOther Charges We currently charge
Rs. 50 per request forpremium re-direction, fund switch and
NA
81
partial withdrawal.
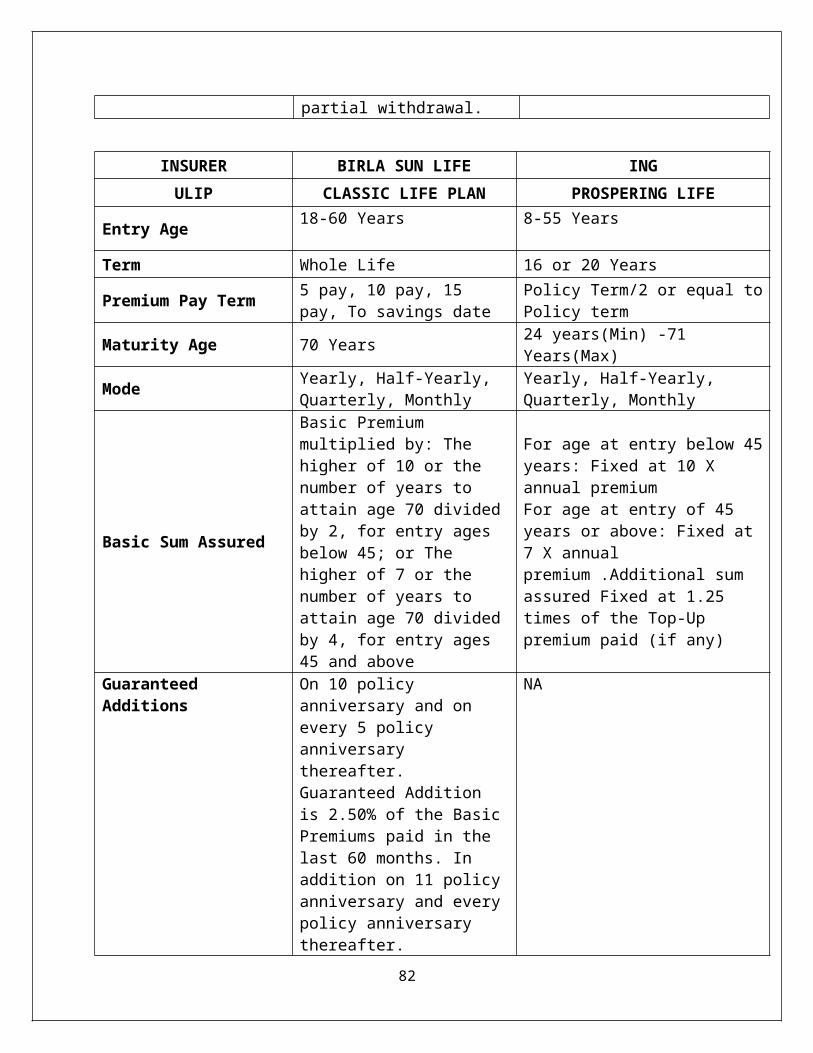
INSURER BIRLA SUN LIFE INGULIP CLASSIC LIFE PLAN PROSPERING LIFE
Entry Age 18-60 Years 8-55 Years
Term Whole Life 16 or 20 Years
Premium Pay Term 5 pay, 10 pay, 15 pay, To savings date
Policy Term/2 or equal toPolicy term
Maturity Age 70 Years 24 years(Min) -71 Years(Max)
Mode Yearly, Half-Yearly, Quarterly, Monthly
Yearly, Half-Yearly, Quarterly, Monthly
Basic Sum Assured
Basic Premium multiplied by: The higher of 10 or the number of years to attain age 70 dividedby 2, for entry ages below 45; or The higher of 7 or the number of years to attain age 70 dividedby 4, for entry ages45 and above
For age at entry below 45years: Fixed at 10 X annual premiumFor age at entry of 45 years or above: Fixed at 7 X annual premium .Additional sum assured Fixed at 1.25 times of the Top-Up premium paid (if any)
Guaranteed Additions
On 10 policy anniversary and on every 5 policy anniversary thereafter. Guaranteed Addition is 2.50% of the BasicPremiums paid in the last 60 months. In addition on 11 policyanniversary and everypolicy anniversary thereafter.
NA
82
Guaranteed Addition is 0.25% of the average Fund Value inthe last 12 months
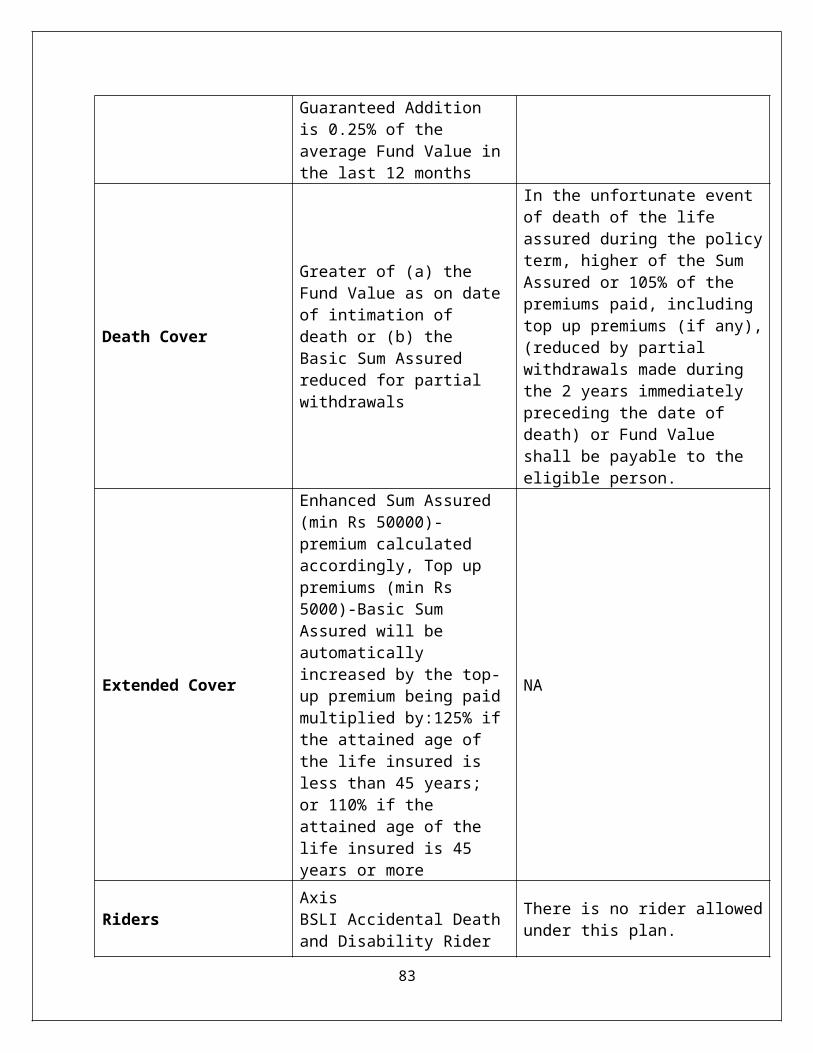
Death Cover
Greater of (a) the Fund Value as on dateof intimation of death or (b) the Basic Sum Assured reduced for partial withdrawals
In the unfortunate event of death of the life assured during the policyterm, higher of the Sum Assured or 105% of the premiums paid, including top up premiums (if any),(reduced by partial withdrawals made during the 2 years immediately preceding the date of death) or Fund Value shall be payable to the eligible person.
Extended Cover
Enhanced Sum Assured (min Rs 50000)-premium calculated accordingly, Top up premiums (min Rs 5000)-Basic Sum Assured will be automatically increased by the top-up premium being paidmultiplied by:125% ifthe attained age of the life insured is less than 45 years; or 110% if the attained age of the life insured is 45 years or more
NA
RidersAxis BSLI Accidental Deathand Disability Rider
There is no rider allowedunder this plan.
83
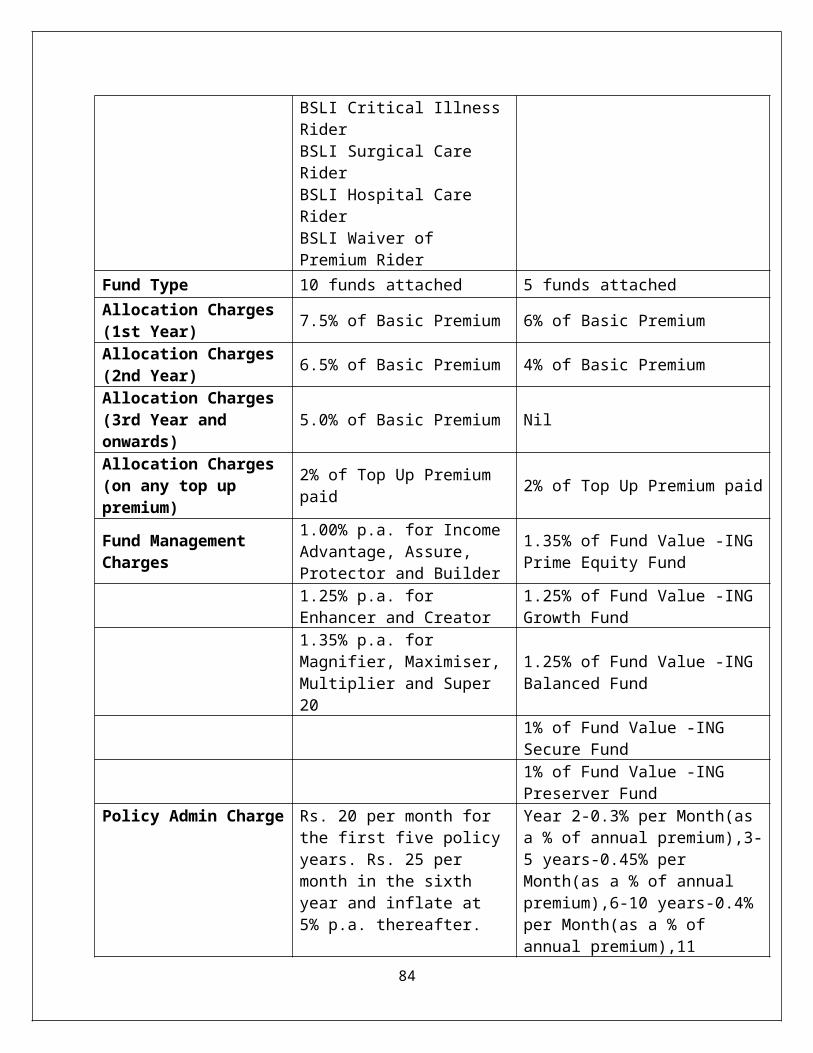
BSLI Critical IllnessRiderBSLI Surgical Care RiderBSLI Hospital Care RiderBSLI Waiver of Premium Rider
Fund Type 10 funds attached 5 funds attachedAllocation Charges (1st Year) 7.5% of Basic Premium 6% of Basic Premium
Allocation Charges (2nd Year) 6.5% of Basic Premium 4% of Basic Premium
Allocation Charges (3rd Year and onwards)
5.0% of Basic Premium Nil
Allocation Charges (on any top up premium)
2% of Top Up Premium paid 2% of Top Up Premium paid
Fund Management Charges
1.00% p.a. for IncomeAdvantage, Assure, Protector and Builder
1.35% of Fund Value -ING Prime Equity Fund
1.25% p.a. for Enhancer and Creator
1.25% of Fund Value -ING Growth Fund
1.35% p.a. for Magnifier, Maximiser,Multiplier and Super 20
1.25% of Fund Value -ING Balanced Fund
1% of Fund Value -ING Secure Fund
1% of Fund Value -ING Preserver Fund
Policy Admin Charge Rs. 20 per month for the first five policyyears. Rs. 25 per month in the sixth year and inflate at 5% p.a. thereafter.
Year 2-0.3% per Month(as a % of annual premium),3-5 years-0.45% per Month(as a % of annual premium),6-10 years-0.4% per Month(as a % of annual premium),11
84

onwards-0.3% per month
Mortality Charges (1.546 to 16.267) per1000
(1.08 to 14.12) Age -20 to 60 Years per 1000 of sum at risk
Misc. Charges
Rs. 50 per request for premium re-direction, fund switch and partialwithdrawal. Rs. 100 per policy revival.
No charges for premium re-direction, fund switchand partialwithdrawal.
Partial Withdrawal
Unlimited partial withdrawals any time after five complete policy years. The minimum amount of partial withdrawal isRs. 5,000. There is no maximum limit, butyou are required to maintain a minimum Fund Value of Rs. 25,000 plus any top-up premiums
The Partial Withdrawal Benefit is available for a minimum amount of Rs. 5,000 and a maximum amount equal to 25% of the Fund Value, subject to Fund Value after each such withdrawal not beingless than 1.5 times the one full years’ annual regular premium. The policyholder will be allowed to make any partial withdrawals from the Top-up contributions only after completion of 5 years from the date of remittance/realization ofTop-up contribution. The Partial Withdrawals made during the 24 months preceding the date of death, shall be reduced from the Sum Assured payableunder the policy.
85
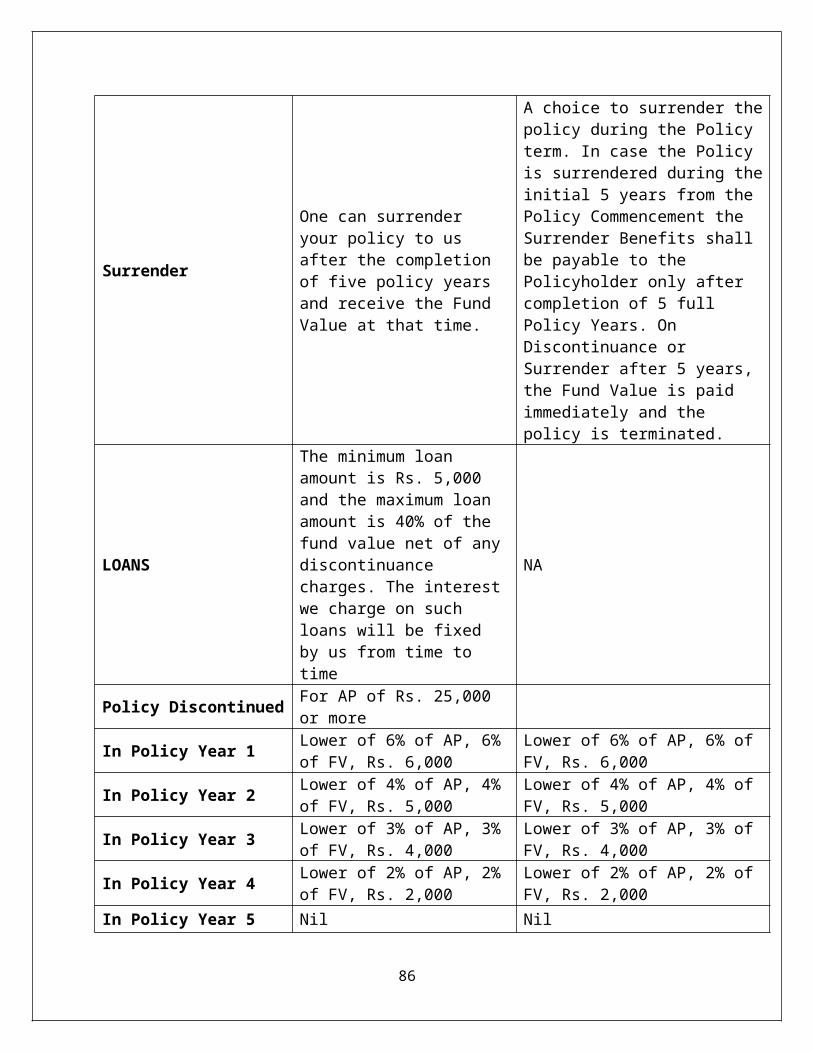
Surrender
One can surrender your policy to us after the completion of five policy years and receive the Fund Value at that time.
A choice to surrender thepolicy during the Policy term. In case the Policy is surrendered during theinitial 5 years from the Policy Commencement theSurrender Benefits shall be payable to the Policyholder only after completion of 5 full Policy Years. On Discontinuance or Surrender after 5 years, the Fund Value is paid immediately and the policy is terminated.
LOANS
The minimum loan amount is Rs. 5,000 and the maximum loan amount is 40% of the fund value net of anydiscontinuance charges. The interestwe charge on such loans will be fixed by us from time to time
NA
Policy Discontinued For AP of Rs. 25,000 or more
In Policy Year 1 Lower of 6% of AP, 6%of FV, Rs. 6,000
Lower of 6% of AP, 6% of FV, Rs. 6,000
In Policy Year 2 Lower of 4% of AP, 4%of FV, Rs. 5,000
Lower of 4% of AP, 4% of FV, Rs. 5,000
In Policy Year 3 Lower of 3% of AP, 3%of FV, Rs. 4,000
Lower of 3% of AP, 3% of FV, Rs. 4,000
In Policy Year 4 Lower of 2% of AP, 2%of FV, Rs. 2,000
Lower of 2% of AP, 2% of FV, Rs. 2,000
In Policy Year 5 Nil Nil
86
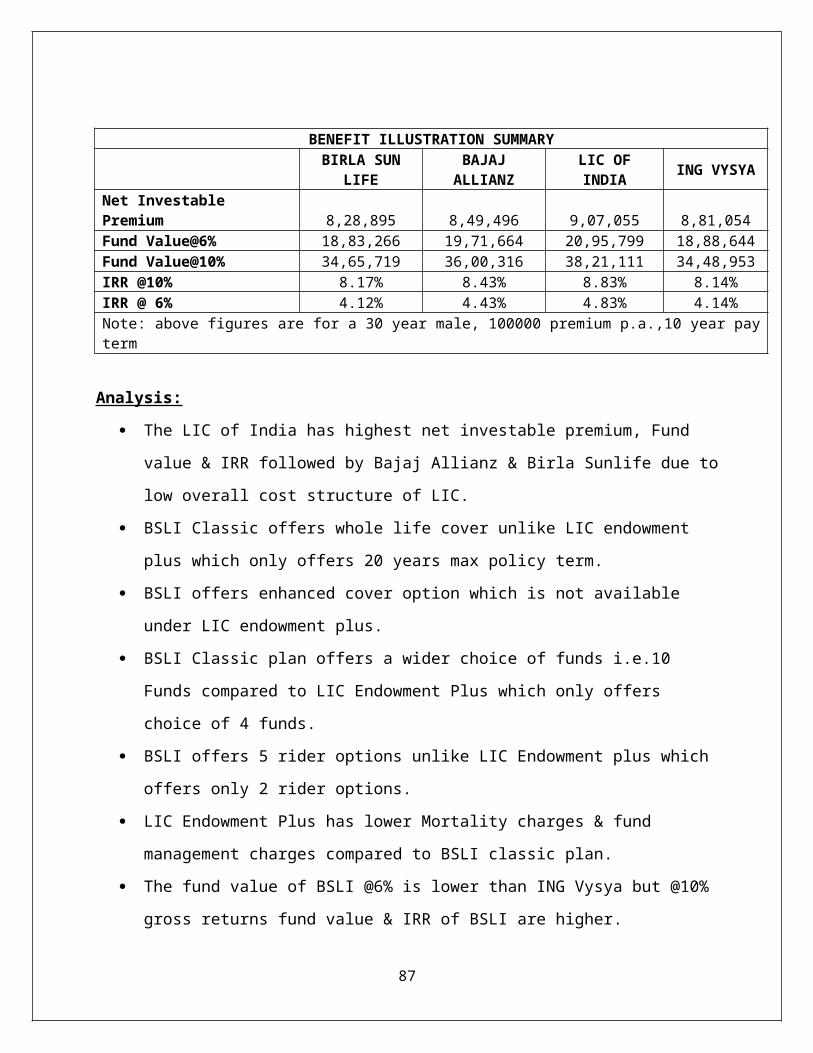
BENEFIT ILLUSTRATION SUMMARY
BIRLA SUN
LIFEBAJAJ
ALLIANZLIC OFINDIA ING VYSYA
Net Investable Premium 8,28,895 8,49,496 9,07,055 8,81,054Fund Value@6% 18,83,266 19,71,664 20,95,799 18,88,644Fund Value@10% 34,65,719 36,00,316 38,21,111 34,48,953IRR @10% 8.17% 8.43% 8.83% 8.14%IRR @ 6% 4.12% 4.43% 4.83% 4.14%Note: above figures are for a 30 year male, 100000 premium p.a.,10 year payterm
Analysis:
The LIC of India has highest net investable premium, Fund
value & IRR followed by Bajaj Allianz & Birla Sunlife due to
low overall cost structure of LIC.
BSLI Classic offers whole life cover unlike LIC endowment
plus which only offers 20 years max policy term.
BSLI offers enhanced cover option which is not available
under LIC endowment plus.
BSLI Classic plan offers a wider choice of funds i.e.10
Funds compared to LIC Endowment Plus which only offers
choice of 4 funds.
BSLI offers 5 rider options unlike LIC Endowment plus which
offers only 2 rider options.
LIC Endowment Plus has lower Mortality charges & fund
management charges compared to BSLI classic plan.
The fund value of BSLI @6% is lower than ING Vysya but @10%
gross returns fund value & IRR of BSLI are higher.
87
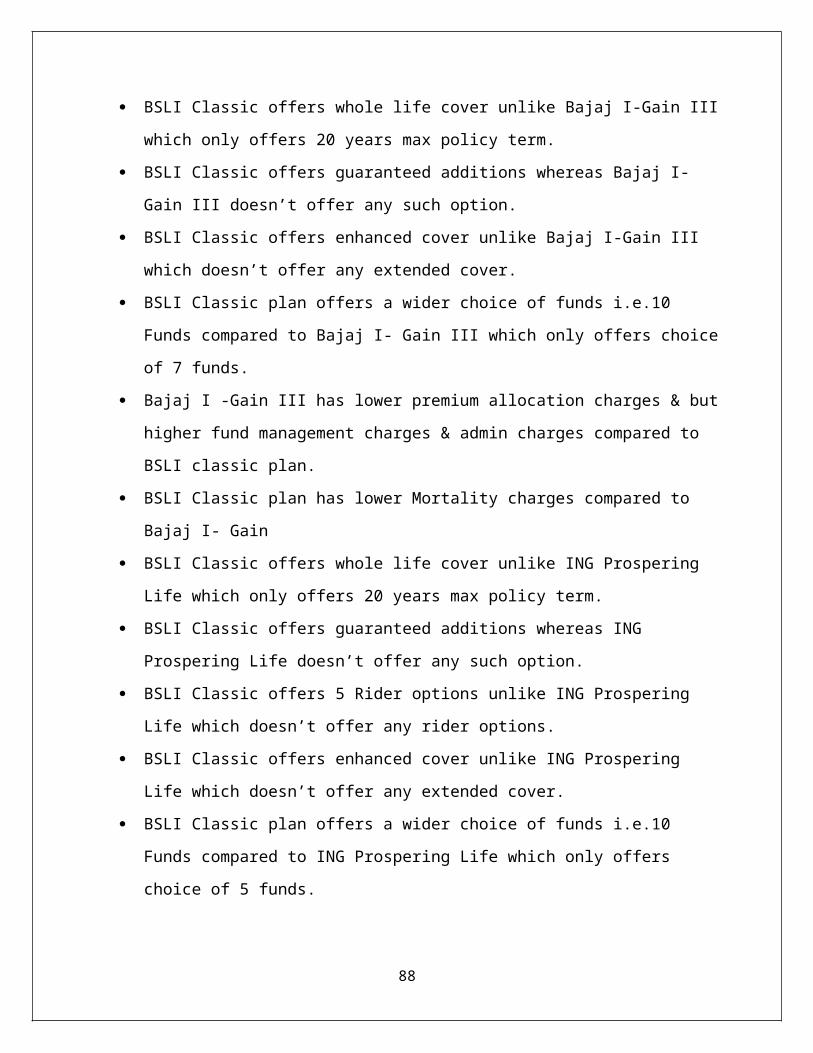
BSLI Classic offers whole life cover unlike Bajaj I-Gain III
which only offers 20 years max policy term.
BSLI Classic offers guaranteed additions whereas Bajaj I-
Gain III doesn’t offer any such option.
BSLI Classic offers enhanced cover unlike Bajaj I-Gain III
which doesn’t offer any extended cover.
BSLI Classic plan offers a wider choice of funds i.e.10
Funds compared to Bajaj I- Gain III which only offers choice
of 7 funds.
Bajaj I -Gain III has lower premium allocation charges & but
higher fund management charges & admin charges compared to
BSLI classic plan.
BSLI Classic plan has lower Mortality charges compared to
Bajaj I- Gain
BSLI Classic offers whole life cover unlike ING Prospering
Life which only offers 20 years max policy term.
BSLI Classic offers guaranteed additions whereas ING
Prospering Life doesn’t offer any such option.
BSLI Classic offers 5 Rider options unlike ING Prospering
Life which doesn’t offer any rider options.
BSLI Classic offers enhanced cover unlike ING Prospering
Life which doesn’t offer any extended cover.
BSLI Classic plan offers a wider choice of funds i.e.10
Funds compared to ING Prospering Life which only offers
choice of 5 funds.
88
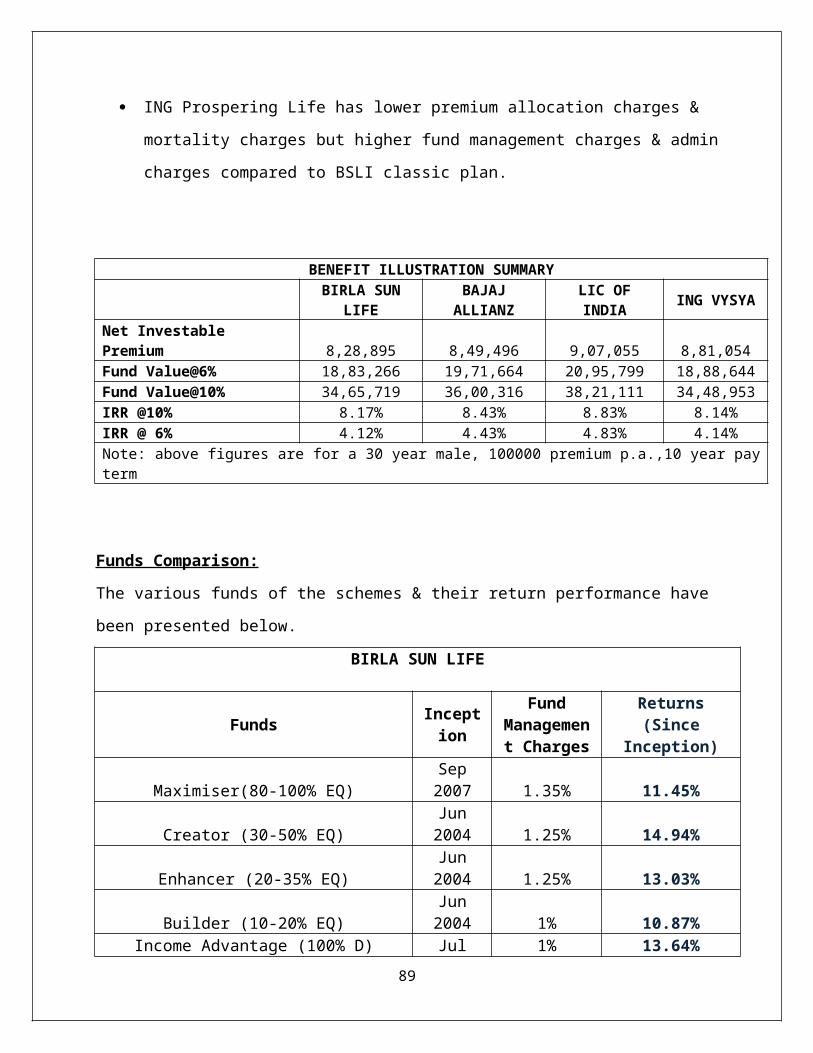
ING Prospering Life has lower premium allocation charges &
mortality charges but higher fund management charges & admin
charges compared to BSLI classic plan.
BENEFIT ILLUSTRATION SUMMARY
BIRLA SUN
LIFEBAJAJ
ALLIANZLIC OFINDIA ING VYSYA
Net Investable Premium 8,28,895 8,49,496 9,07,055 8,81,054Fund Value@6% 18,83,266 19,71,664 20,95,799 18,88,644Fund Value@10% 34,65,719 36,00,316 38,21,111 34,48,953IRR @10% 8.17% 8.43% 8.83% 8.14%IRR @ 6% 4.12% 4.43% 4.83% 4.14%Note: above figures are for a 30 year male, 100000 premium p.a.,10 year payterm
Funds Comparison:
The various funds of the schemes & their return performance have
been presented below.
BIRLA SUN LIFE
Funds Inception
FundManagement Charges
Returns(Since
Inception)
Maximiser(80-100% EQ)Sep2007 1.35% 11.45%
Creator (30-50% EQ)Jun2004 1.25% 14.94%
Enhancer (20-35% EQ)Jun2004 1.25% 13.03%
Builder (10-20% EQ)Jun2004 1% 10.87%
Income Advantage (100% D) Jul 1% 13.64%89
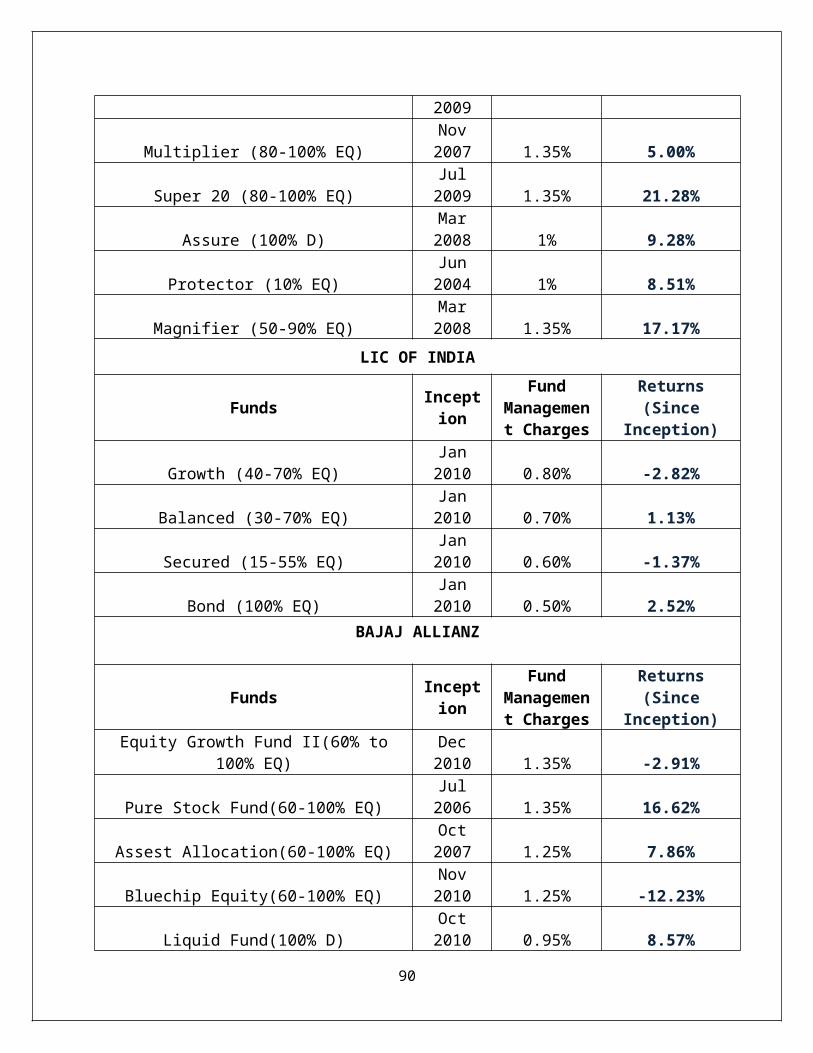
2009
Multiplier (80-100% EQ)Nov2007 1.35% 5.00%
Super 20 (80-100% EQ)Jul2009 1.35% 21.28%
Assure (100% D)Mar2008 1% 9.28%
Protector (10% EQ)Jun2004 1% 8.51%
Magnifier (50-90% EQ)Mar2008 1.35% 17.17%
LIC OF INDIA
Funds Inception
FundManagement Charges
Returns(Since
Inception)
Growth (40-70% EQ)Jan2010 0.80% -2.82%
Balanced (30-70% EQ)Jan2010 0.70% 1.13%
Secured (15-55% EQ)Jan2010 0.60% -1.37%
Bond (100% EQ)Jan2010 0.50% 2.52%
BAJAJ ALLIANZ
Funds Inception
FundManagement Charges
Returns(Since
Inception)Equity Growth Fund II(60% to
100% EQ)Dec2010 1.35% -2.91%
Pure Stock Fund(60-100% EQ)Jul2006 1.35% 16.62%
Assest Allocation(60-100% EQ)Oct2007 1.25% 7.86%
Bluechip Equity(60-100% EQ)Nov2010 1.25% -12.23%
Liquid Fund(100% D)Oct2010 0.95% 8.57%
90

Bond FundOct2010 0.95%
Accelator Mid Cap FundJan2010 1.25% 13.85%
ING VYSYA
Funds Inception
FundManagement Charges
Returns(Since
Inception)
ING PrimeEquity(100% EQ)Jan2010 1.35% 5.07%
ING Growth Fund(60% EQ)Nov2004 1.25% 12.13%
ING Balanced Fund(40% EQ)Nov2004 1.25% 10.0%
ING Secure Fund(20% EQ)Nov2004 1% 8.73%
ING Preserver Fund(100% D)Jan2010 1% 11.91%
Analysis:
Magnifier has given highest returns compared to other funds
in its category followed by Pure Stock fund of Bajaj
Allianz.
Most of the funds under BSLI have given good risk adjusted
returns over a long term period.
Most of the competitor’s funds are recently launched & have
not been able to generate comparable returns.
91
7.3 INTRODUCTION TO BSLI PLATINUM ADVANTAGE PLAN
This Plan gives the advantage to choose from 2 Investment Options
– Guaranteed Option and Self-Managed Option. With the Guaranteed
Option investments in the Platinum Advantage Fund are safeguarded
from any downsides in the capital markets. And it also offers
options to enhance the financial security of loved ones, at a
nominal additional cost. This plan offers a 10-year plan with a
5-year Pay Term.
How BSLI Platinum Advantage Plan works:
1. Choose the Basic Premium one wants to pay annually for 5
years
2. Choose Investment Option from Self-managed Option or
Guaranteed Option
3. Choose the Enhanced Sum Assured to increase the financial
protection of your loved ones
4. Choose from range of riders and safeguard family's financial
future
Investment Options:
Self-Managed Option:
The Self-Managed Option gives the complete access to invest
premiums in well-established suite of 10 Investment Funds,
ranging from 100% debt to 100% equity. One can choose from our
range of 10 Investment Funds, to suit one’s risk appetite
92
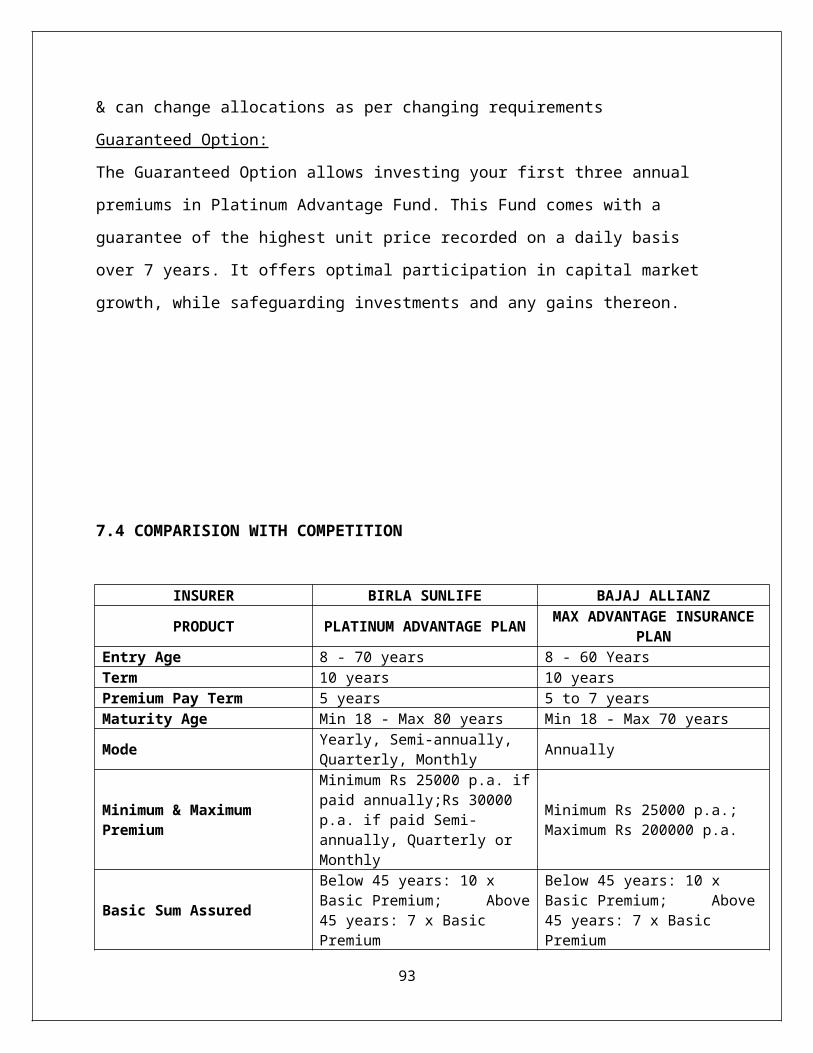
& can change allocations as per changing requirements
Guaranteed Option:
The Guaranteed Option allows investing your first three annual
premiums in Platinum Advantage Fund. This Fund comes with a
guarantee of the highest unit price recorded on a daily basis
over 7 years. It offers optimal participation in capital market
growth, while safeguarding investments and any gains thereon.
7.4 COMPARISION WITH COMPETITION
INSURER BIRLA SUNLIFE BAJAJ ALLIANZ
PRODUCT PLATINUM ADVANTAGE PLAN MAX ADVANTAGE INSURANCEPLAN
Entry Age 8 - 70 years 8 - 60 YearsTerm 10 years 10 yearsPremium Pay Term 5 years 5 to 7 yearsMaturity Age Min 18 - Max 80 years Min 18 - Max 70 years
Mode Yearly, Semi-annually, Quarterly, Monthly Annually
Minimum & Maximum Premium
Minimum Rs 25000 p.a. ifpaid annually;Rs 30000 p.a. if paid Semi-annually, Quarterly or Monthly
Minimum Rs 25000 p.a.; Maximum Rs 200000 p.a.
Basic Sum Assured
Below 45 years: 10 x Basic Premium; Above45 years: 7 x Basic Premium
Below 45 years: 10 x Basic Premium; Above45 years: 7 x Basic Premium
93
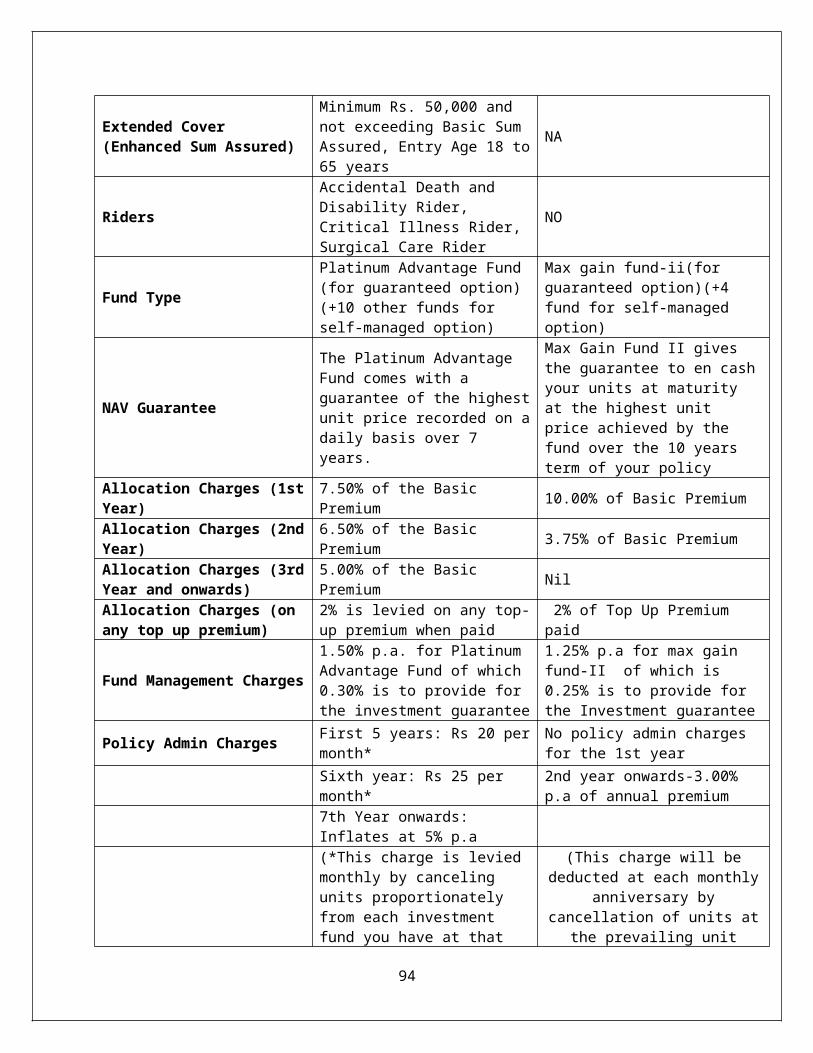
Extended Cover (Enhanced Sum Assured)
Minimum Rs. 50,000 and not exceeding Basic Sum Assured, Entry Age 18 to65 years
NA
Riders
Accidental Death and Disability Rider, Critical Illness Rider, Surgical Care Rider
NO
Fund Type
Platinum Advantage Fund (for guaranteed option) (+10 other funds for self-managed option)
Max gain fund-ii(for guaranteed option)(+4 fund for self-managed option)
NAV Guarantee
The Platinum Advantage Fund comes with a guarantee of the highestunit price recorded on adaily basis over 7 years.
Max Gain Fund II gives the guarantee to en cashyour units at maturity at the highest unit price achieved by the fund over the 10 years term of your policy
Allocation Charges (1stYear)
7.50% of the Basic Premium 10.00% of Basic Premium
Allocation Charges (2ndYear)
6.50% of the Basic Premium 3.75% of Basic Premium
Allocation Charges (3rdYear and onwards)
5.00% of the Basic Premium Nil
Allocation Charges (on any top up premium)
2% is levied on any top-up premium when paid
2% of Top Up Premium paid
Fund Management Charges
1.50% p.a. for Platinum Advantage Fund of which 0.30% is to provide for the investment guarantee
1.25% p.a for max gain fund-II of which is 0.25% is to provide for the Investment guarantee
Policy Admin Charges First 5 years: Rs 20 permonth*
No policy admin charges for the 1st year
Sixth year: Rs 25 per month*
2nd year onwards-3.00% p.a of annual premium
7th Year onwards: Inflates at 5% p.a
(*This charge is levied monthly by canceling units proportionately from each investment fund you have at that
(This charge will bededucted at each monthly
anniversary bycancellation of units at
the prevailing unit
94
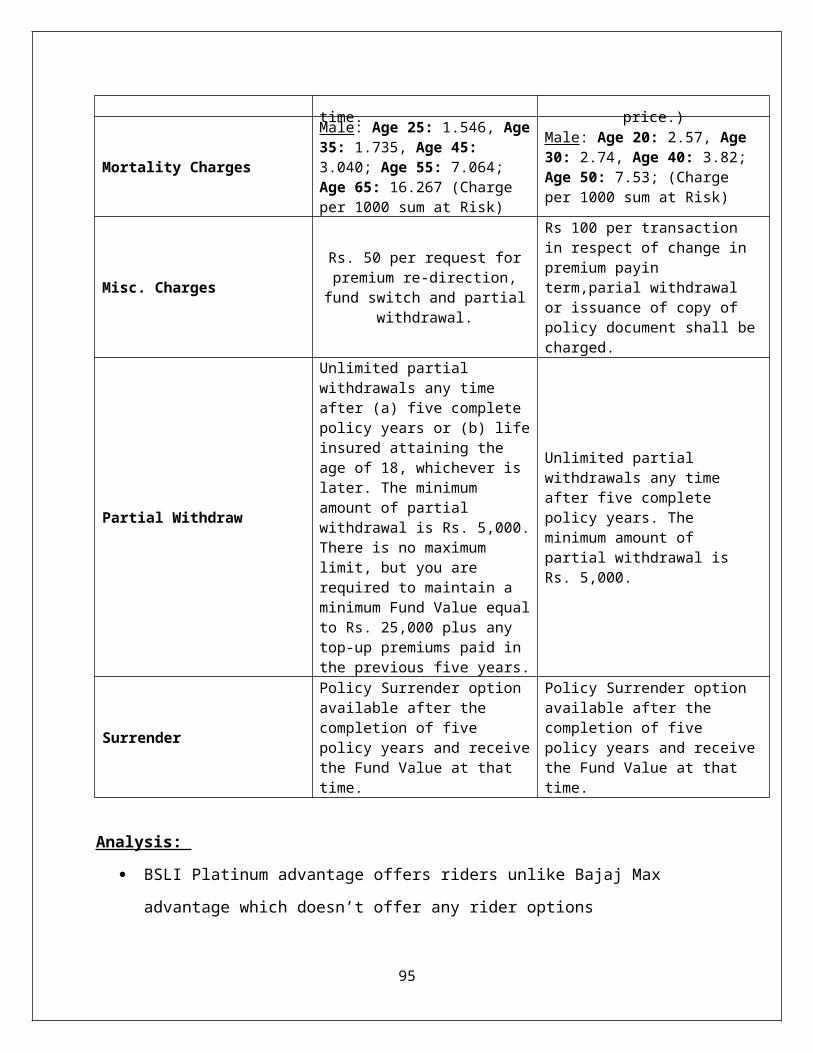
time. price.)
Mortality Charges
Male: Age 25: 1.546, Age35: 1.735, Age 45: 3.040; Age 55: 7.064; Age 65: 16.267 (Charge per 1000 sum at Risk)
Male: Age 20: 2.57, Age 30: 2.74, Age 40: 3.82; Age 50: 7.53; (Charge per 1000 sum at Risk)
Misc. Charges
Rs. 50 per request forpremium re-direction,
fund switch and partialwithdrawal.
Rs 100 per transaction in respect of change in premium payin term,parial withdrawal or issuance of copy of policy document shall becharged.
Partial Withdraw
Unlimited partial withdrawals any time after (a) five complete policy years or (b) lifeinsured attaining the age of 18, whichever is later. The minimum amount of partial withdrawal is Rs. 5,000.There is no maximum limit, but you are required to maintain a minimum Fund Value equalto Rs. 25,000 plus any top-up premiums paid in the previous five years.
Unlimited partial withdrawals any time after five complete policy years. The minimum amount of partial withdrawal is Rs. 5,000.
Surrender
Policy Surrender option available after the completion of five policy years and receivethe Fund Value at that time.
Policy Surrender option available after the completion of five policy years and receivethe Fund Value at that time.
Analysis:
BSLI Platinum advantage offers riders unlike Bajaj Max
advantage which doesn’t offer any rider options
95
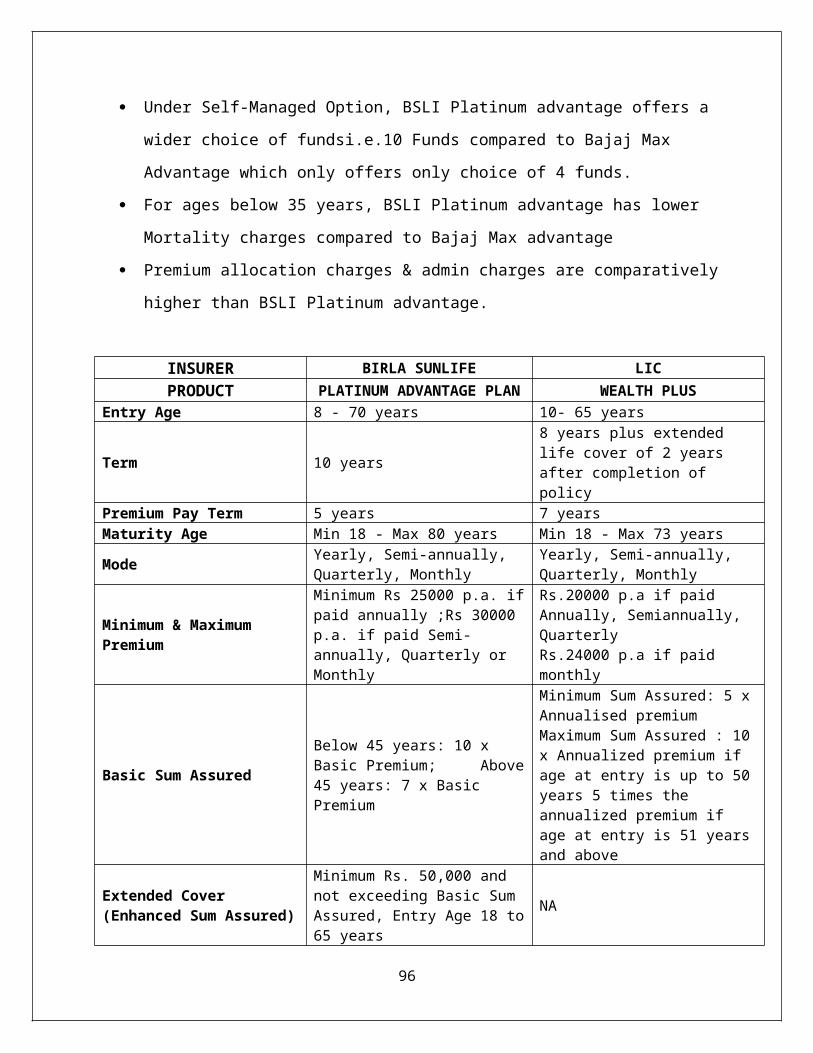
Under Self-Managed Option, BSLI Platinum advantage offers a
wider choice of fundsi.e.10 Funds compared to Bajaj Max
Advantage which only offers only choice of 4 funds.
For ages below 35 years, BSLI Platinum advantage has lower
Mortality charges compared to Bajaj Max advantage
Premium allocation charges & admin charges are comparatively
higher than BSLI Platinum advantage.
INSURER BIRLA SUNLIFE LICPRODUCT PLATINUM ADVANTAGE PLAN WEALTH PLUS
Entry Age 8 - 70 years 10- 65 years
Term 10 years
8 years plus extended life cover of 2 years after completion of policy
Premium Pay Term 5 years 7 yearsMaturity Age Min 18 - Max 80 years Min 18 - Max 73 years
Mode Yearly, Semi-annually, Quarterly, Monthly
Yearly, Semi-annually, Quarterly, Monthly
Minimum & Maximum Premium
Minimum Rs 25000 p.a. ifpaid annually ;Rs 30000 p.a. if paid Semi-annually, Quarterly or Monthly
Rs.20000 p.a if paid Annually, Semiannually, Quarterly Rs.24000 p.a if paid monthly
Basic Sum Assured
Below 45 years: 10 x Basic Premium; Above45 years: 7 x Basic Premium
Minimum Sum Assured: 5 xAnnualised premium Maximum Sum Assured : 10x Annualized premium if age at entry is up to 50years 5 times the annualized premium if age at entry is 51 yearsand above
Extended Cover (Enhanced Sum Assured)
Minimum Rs. 50,000 and not exceeding Basic Sum Assured, Entry Age 18 to65 years
NA
96
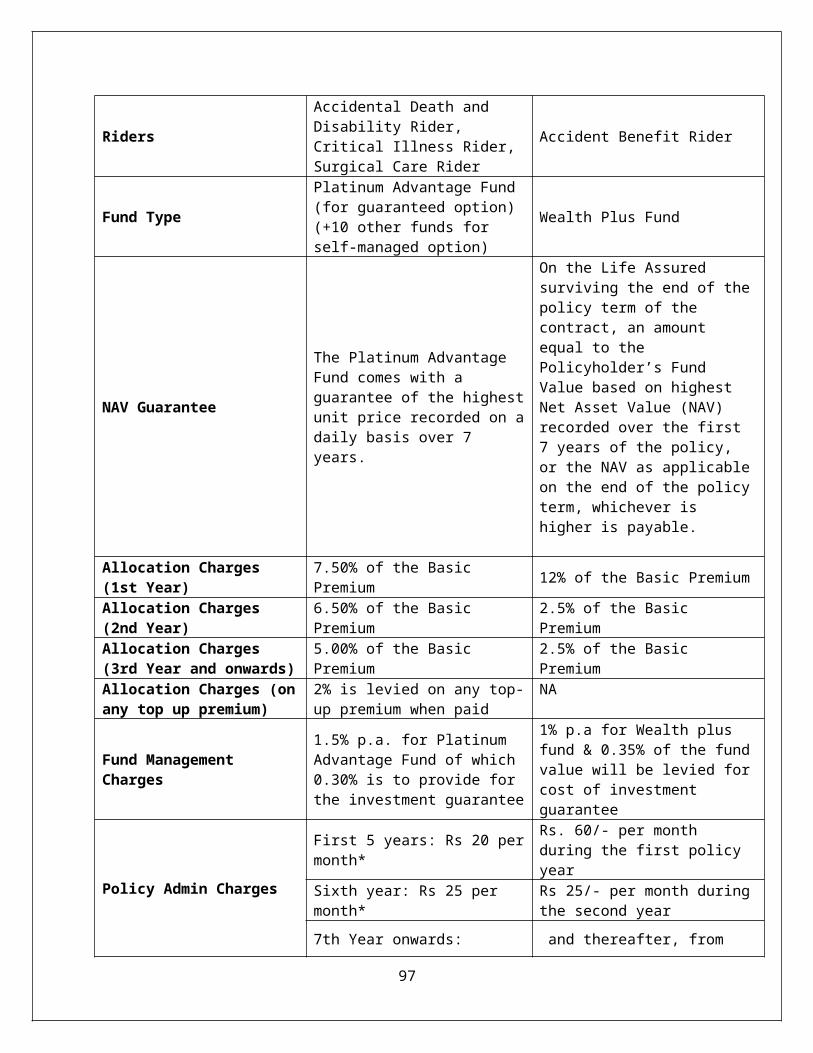
Riders
Accidental Death and Disability Rider, Critical Illness Rider, Surgical Care Rider
Accident Benefit Rider
Fund Type
Platinum Advantage Fund (for guaranteed option) (+10 other funds for self-managed option)
Wealth Plus Fund
NAV Guarantee
The Platinum Advantage Fund comes with a guarantee of the highestunit price recorded on adaily basis over 7 years.
On the Life Assured surviving the end of thepolicy term of the contract, an amount equal to the Policyholder’s Fund Value based on highest Net Asset Value (NAV) recorded over the first 7 years of the policy, or the NAV as applicableon the end of the policyterm, whichever is higher is payable.
Allocation Charges (1st Year)
7.50% of the Basic Premium 12% of the Basic Premium
Allocation Charges (2nd Year)
6.50% of the Basic Premium
2.5% of the Basic Premium
Allocation Charges (3rd Year and onwards)
5.00% of the Basic Premium
2.5% of the Basic Premium
Allocation Charges (onany top up premium)
2% is levied on any top-up premium when paid
NA
Fund Management Charges
1.5% p.a. for Platinum Advantage Fund of which 0.30% is to provide for the investment guarantee
1% p.a for Wealth plus fund & 0.35% of the fundvalue will be levied forcost of investment guarantee
Policy Admin Charges
First 5 years: Rs 20 permonth*
Rs. 60/- per month during the first policy year
Sixth year: Rs 25 per month*
Rs 25/- per month duringthe second year
7th Year onwards: and thereafter, from
97
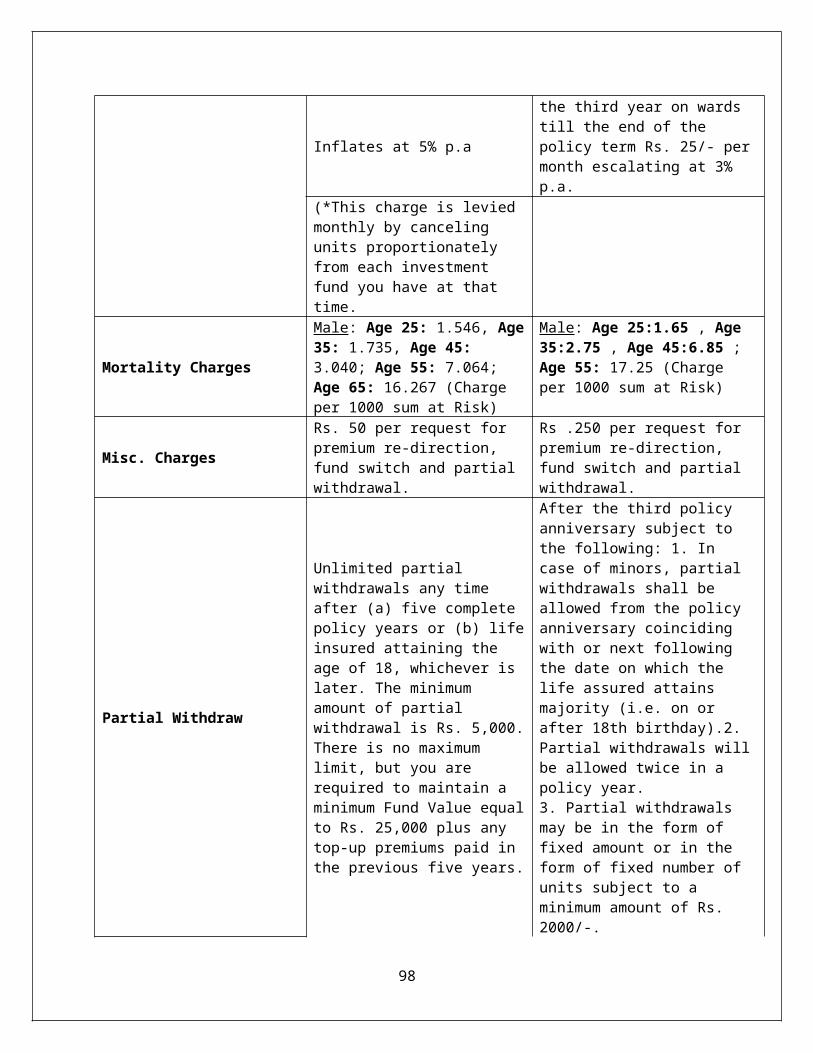
Inflates at 5% p.a
the third year on wards till the end of the policy term Rs. 25/- permonth escalating at 3% p.a.
(*This charge is levied monthly by canceling units proportionately from each investment fund you have at that time.
Mortality Charges
Male: Age 25: 1.546, Age35: 1.735, Age 45: 3.040; Age 55: 7.064; Age 65: 16.267 (Charge per 1000 sum at Risk)
Male: Age 25:1.65 , Age 35:2.75 , Age 45:6.85 ; Age 55: 17.25 (Charge per 1000 sum at Risk)
Misc. Charges
Rs. 50 per request for premium re-direction, fund switch and partial withdrawal.
Rs .250 per request for premium re-direction, fund switch and partial withdrawal.
Partial Withdraw
Unlimited partial withdrawals any time after (a) five complete policy years or (b) lifeinsured attaining the age of 18, whichever is later. The minimum amount of partial withdrawal is Rs. 5,000.There is no maximum limit, but you are required to maintain a minimum Fund Value equalto Rs. 25,000 plus any top-up premiums paid in the previous five years.
After the third policy anniversary subject to the following: 1. In case of minors, partial withdrawals shall be allowed from the policy anniversary coinciding with or next following the date on which the life assured attains majority (i.e. on or after 18th birthday).2. Partial withdrawals willbe allowed twice in a policy year. 3. Partial withdrawals may be in the form of fixed amount or in the form of fixed number of units subject to a minimum amount of Rs. 2000/-.
98
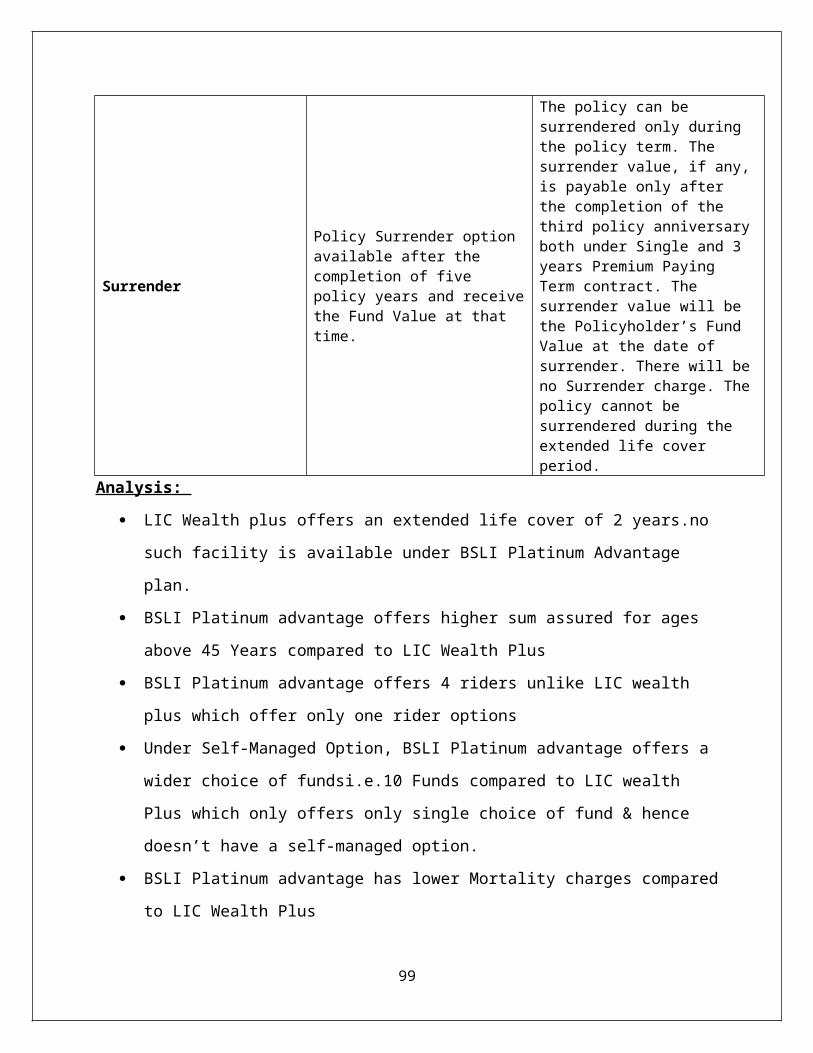
Surrender
Policy Surrender option available after the completion of five policy years and receivethe Fund Value at that time.
The policy can be surrendered only during the policy term. The surrender value, if any,is payable only after the completion of the third policy anniversaryboth under Single and 3 years Premium Paying Term contract. The surrender value will be the Policyholder’s Fund Value at the date of surrender. There will beno Surrender charge. Thepolicy cannot be surrendered during the extended life cover period.
Analysis:
LIC Wealth plus offers an extended life cover of 2 years.no
such facility is available under BSLI Platinum Advantage
plan.
BSLI Platinum advantage offers higher sum assured for ages
above 45 Years compared to LIC Wealth Plus
BSLI Platinum advantage offers 4 riders unlike LIC wealth
plus which offer only one rider options
Under Self-Managed Option, BSLI Platinum advantage offers a
wider choice of fundsi.e.10 Funds compared to LIC wealth
Plus which only offers only single choice of fund & hence
doesn’t have a self-managed option.
BSLI Platinum advantage has lower Mortality charges compared
to LIC Wealth Plus
99
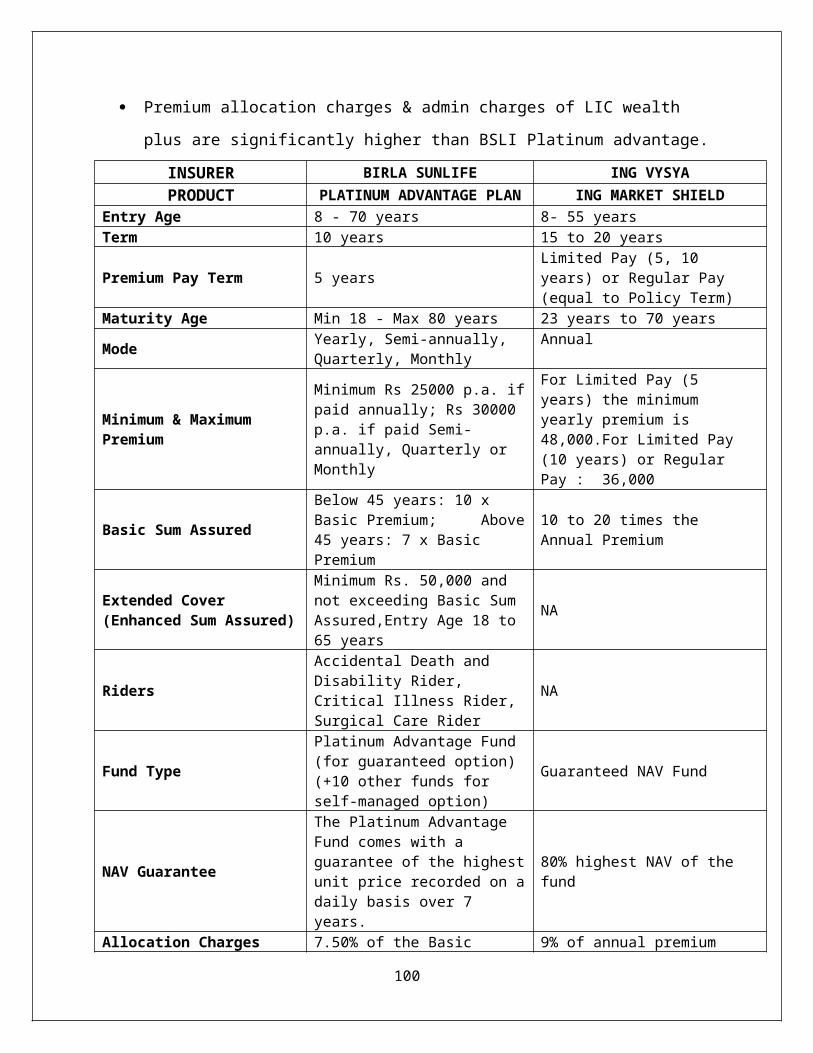
Premium allocation charges & admin charges of LIC wealth
plus are significantly higher than BSLI Platinum advantage.
INSURER BIRLA SUNLIFE ING VYSYAPRODUCT PLATINUM ADVANTAGE PLAN ING MARKET SHIELD
Entry Age 8 - 70 years 8- 55 yearsTerm 10 years 15 to 20 years
Premium Pay Term 5 yearsLimited Pay (5, 10 years) or Regular Pay (equal to Policy Term)
Maturity Age Min 18 - Max 80 years 23 years to 70 years
Mode Yearly, Semi-annually, Quarterly, Monthly
Annual
Minimum & Maximum Premium
Minimum Rs 25000 p.a. ifpaid annually; Rs 30000 p.a. if paid Semi-annually, Quarterly or Monthly
For Limited Pay (5 years) the minimum yearly premium is 48,000.For Limited Pay (10 years) or Regular Pay : 36,000
Basic Sum Assured
Below 45 years: 10 x Basic Premium; Above45 years: 7 x Basic Premium
10 to 20 times the Annual Premium
Extended Cover (Enhanced Sum Assured)
Minimum Rs. 50,000 and not exceeding Basic Sum Assured,Entry Age 18 to 65 years
NA
Riders
Accidental Death and Disability Rider, Critical Illness Rider, Surgical Care Rider
NA
Fund Type
Platinum Advantage Fund (for guaranteed option) (+10 other funds for self-managed option)
Guaranteed NAV Fund
NAV Guarantee
The Platinum Advantage Fund comes with a guarantee of the highestunit price recorded on adaily basis over 7 years.
80% highest NAV of the fund
Allocation Charges 7.50% of the Basic 9% of annual premium
100
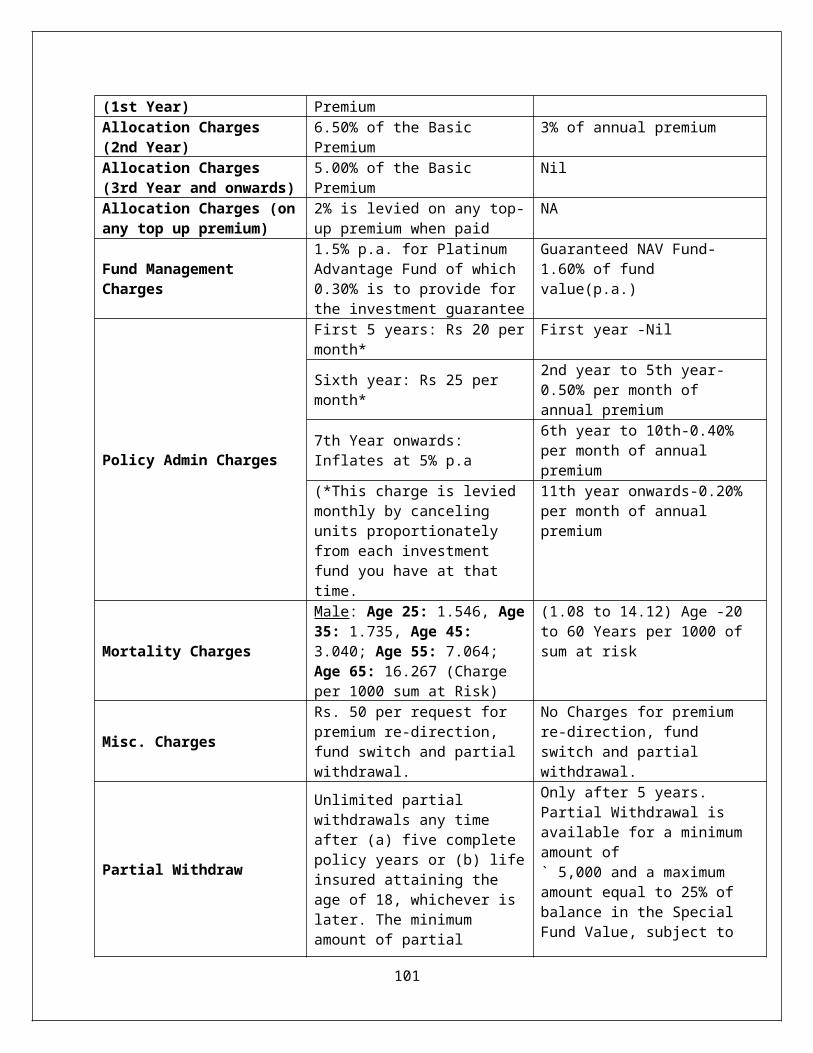
(1st Year) PremiumAllocation Charges (2nd Year)
6.50% of the Basic Premium
3% of annual premium
Allocation Charges (3rd Year and onwards)
5.00% of the Basic Premium
Nil
Allocation Charges (onany top up premium)
2% is levied on any top-up premium when paid
NA
Fund Management Charges
1.5% p.a. for Platinum Advantage Fund of which 0.30% is to provide for the investment guarantee
Guaranteed NAV Fund- 1.60% of fund value(p.a.)
Policy Admin Charges
First 5 years: Rs 20 permonth*
First year -Nil
Sixth year: Rs 25 per month*
2nd year to 5th year-0.50% per month of annual premium
7th Year onwards: Inflates at 5% p.a
6th year to 10th-0.40% per month of annual premium
(*This charge is levied monthly by canceling units proportionately from each investment fund you have at that time.
11th year onwards-0.20% per month of annual premium
Mortality Charges
Male: Age 25: 1.546, Age35: 1.735, Age 45: 3.040; Age 55: 7.064; Age 65: 16.267 (Charge per 1000 sum at Risk)
(1.08 to 14.12) Age -20 to 60 Years per 1000 of sum at risk
Misc. Charges
Rs. 50 per request for premium re-direction, fund switch and partial withdrawal.
No Charges for premium re-direction, fund switch and partial withdrawal.
Partial Withdraw
Unlimited partial withdrawals any time after (a) five complete policy years or (b) lifeinsured attaining the age of 18, whichever is later. The minimum amount of partial
Only after 5 years. Partial Withdrawal is available for a minimum amount of` 5,000 and a maximum amount equal to 25% of balance in the Special Fund Value, subject to
101
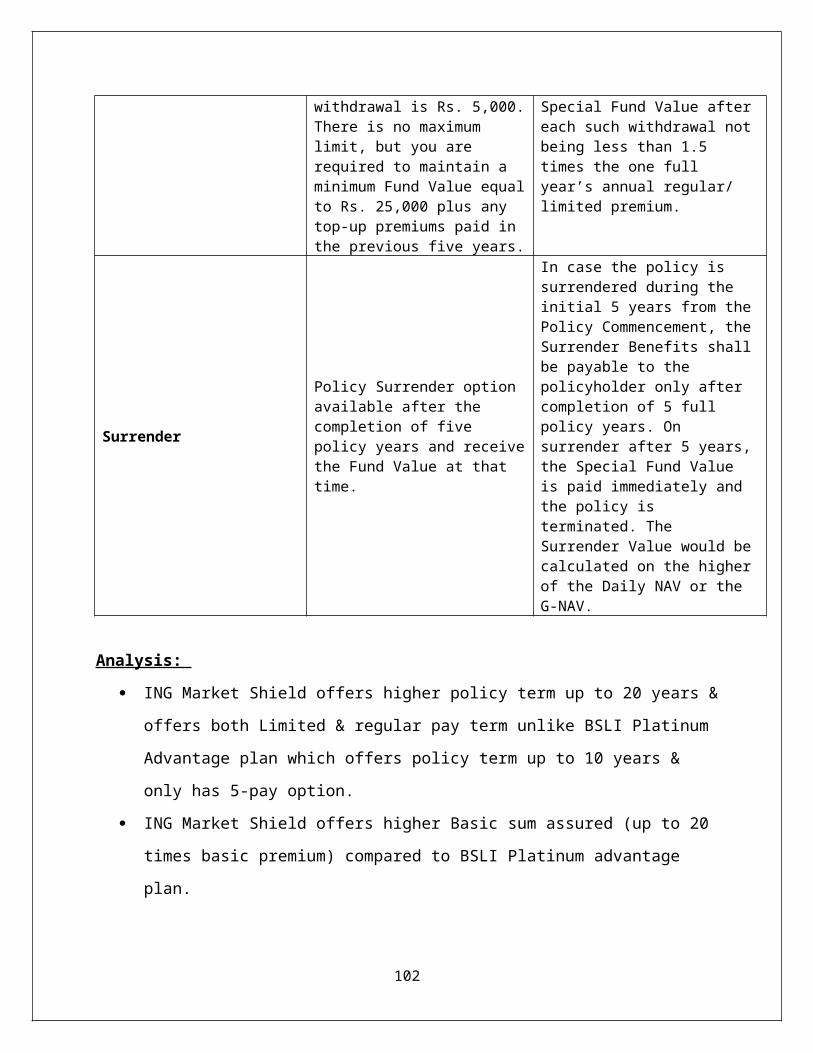
withdrawal is Rs. 5,000.There is no maximum limit, but you are required to maintain a minimum Fund Value equalto Rs. 25,000 plus any top-up premiums paid in the previous five years.
Special Fund Value aftereach such withdrawal notbeing less than 1.5 times the one full year’s annual regular/ limited premium.
Surrender
Policy Surrender option available after the completion of five policy years and receivethe Fund Value at that time.
In case the policy is surrendered during the initial 5 years from thePolicy Commencement, theSurrender Benefits shallbe payable to the policyholder only after completion of 5 full policy years. On surrender after 5 years,the Special Fund Value is paid immediately and the policy is terminated. The Surrender Value would becalculated on the higherof the Daily NAV or the G-NAV.
Analysis:
ING Market Shield offers higher policy term up to 20 years &
offers both Limited & regular pay term unlike BSLI Platinum
Advantage plan which offers policy term up to 10 years &
only has 5-pay option.
ING Market Shield offers higher Basic sum assured (up to 20
times basic premium) compared to BSLI Platinum advantage
plan.
102
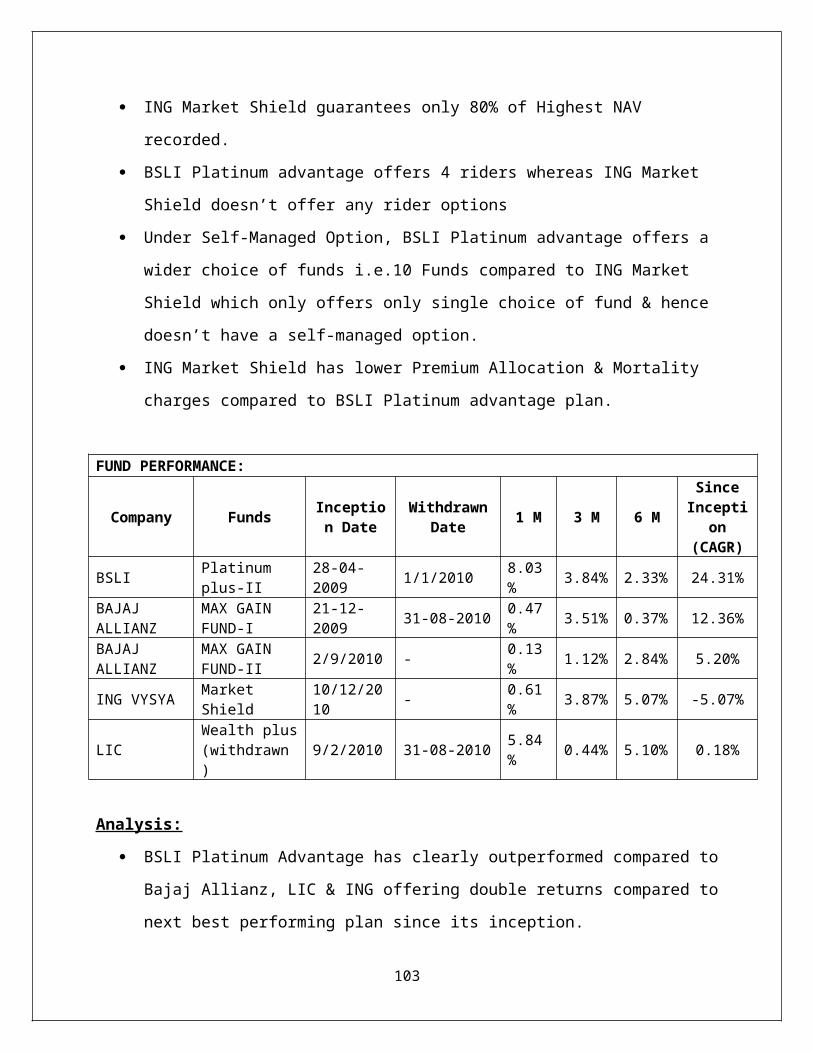
ING Market Shield guarantees only 80% of Highest NAV
recorded.
BSLI Platinum advantage offers 4 riders whereas ING Market
Shield doesn’t offer any rider options
Under Self-Managed Option, BSLI Platinum advantage offers a
wider choice of funds i.e.10 Funds compared to ING Market
Shield which only offers only single choice of fund & hence
doesn’t have a self-managed option.
ING Market Shield has lower Premium Allocation & Mortality
charges compared to BSLI Platinum advantage plan.
FUND PERFORMANCE:
Company Funds Inception Date
WithdrawnDate 1 M 3 M 6 M
SinceIncepti
on(CAGR)
BSLI Platinum plus-II
28-04-2009 1/1/2010 8.03
% 3.84% 2.33% 24.31%
BAJAJ ALLIANZ
MAX GAIN FUND-I
21-12-2009 31-08-2010 0.47
% 3.51% 0.37% 12.36%
BAJAJ ALLIANZ
MAX GAIN FUND-II 2/9/2010 - 0.13
% 1.12% 2.84% 5.20%
ING VYSYA Market Shield
10/12/2010 - 0.61
% 3.87% 5.07% -5.07%
LICWealth plus(withdrawn )
9/2/2010 31-08-2010 5.84% 0.44% 5.10% 0.18%
Analysis:
BSLI Platinum Advantage has clearly outperformed compared to
Bajaj Allianz, LIC & ING offering double returns compared to
next best performing plan since its inception.
103
Many of the plans analyzed have withdrawn themselves from
the market due to underperformance & indicating lack of
interest in such product offering by the customers.
8 ULIPs Vs MUTUAL FUNDS
Unit Linked Insurance Policies (ULIPs) as an investment avenue
are closest to mutual funds in terms of their structure and
functioning. As is the cases with mutual funds, investors in
ULIPs are allotted units by the insurance company and a net
asset value (NAV) is declared for the same on a daily basis.
Similarly ULIP investors have the option of investing across
various schemes similar to the ones found in the mutual funds
domain, i.e. diversified equity funds, balanced funds and debt
funds to name a few. Generally speaking, ULIPs can be termed
as mutual fund schemes with an insurance component.
104
However it should not be construed that barring the insurance
element there is nothing differentiating mutual funds from
ULIPs.
ULIPs have traditionally are being considered costly offerings
compared to Mutual funds & Media experts advise people to keep
their investments & insurance separate. But over the years,
the ULIPs have transformed & are giving intense competition to
mutual funds.
The objective of this study was to analyze the returns over a
5 year period of SIP of Rs.1, 00,000 p.a. into a well
performing Mutual Fund & into BSLI latest Unique offering of
BSLI Foresight plan.
8.1 INTRODUCTION TO BSLI FORESIGHT PLAN
One always wants an investment avenue that gives the advantage
of entering capital markets when they are low and locking in
gains when they are high, irrespective of when one decides to
invest. The BSLI Foresight Plan, which through its new
generation Foresight fund helps to do just that by optimizing
the investment in capital markets when they are low and
locking in gains when they are high.
105
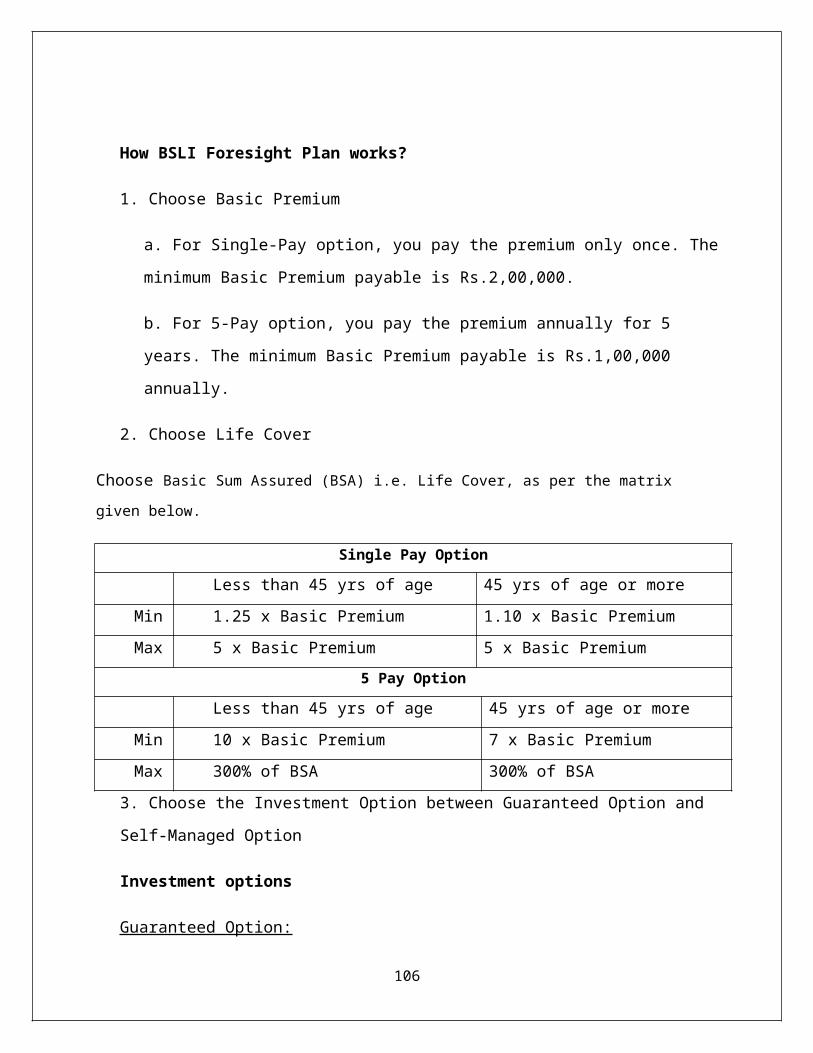
How BSLI Foresight Plan works?
1. Choose Basic Premium
a. For Single-Pay option, you pay the premium only once. The
minimum Basic Premium payable is Rs.2,00,000.
b. For 5-Pay option, you pay the premium annually for 5
years. The minimum Basic Premium payable is Rs.1,00,000
annually.
2. Choose Life Cover
Choose Basic Sum Assured (BSA) i.e. Life Cover, as per the matrix given below.
Single Pay Option
Less than 45 yrs of age 45 yrs of age or moreMin 1.25 x Basic Premium 1.10 x Basic PremiumMax 5 x Basic Premium 5 x Basic Premium
5 Pay Option
Less than 45 yrs of age 45 yrs of age or moreMin 10 x Basic Premium 7 x Basic PremiumMax 300% of BSA 300% of BSA
3. Choose the Investment Option between Guaranteed Option and
Self-Managed Option
Investment options
Guaranteed Option:
106
In this option your money is invested in the new generation
Foresight Fund. You receive a Guaranteed Minimum Maturity
Benefit by optimizing both your entry and gains from the
capital markets.
Self-Managed Option gives you complete access to our range of
investment funds with the freedom to switch between them. In
this investment option, you decide how to invest your
premiums. We offer 10 investment funds ranging from 100% debt
to 100% equity to suit your particular needs and risk appetite
- Income Advantage, Assure, Protector, Builder, Enhancer,
Creator, Magnifier, Maximiser, Multiplier and Super 20.
How does the Guaranteed Option work?
To understand how the Guaranteed Option works, it is important
to understand a few key terms:
Net Invested Premium (NIP):
Net Invested Premium is the money that is invested in the
investment option chosen.
From the premium paid, the following is deducted:
• Premium allocation charge; and
• Mortality charge for the BSA chosen by you
The residual amount is the NIP.
NIP Value:
107
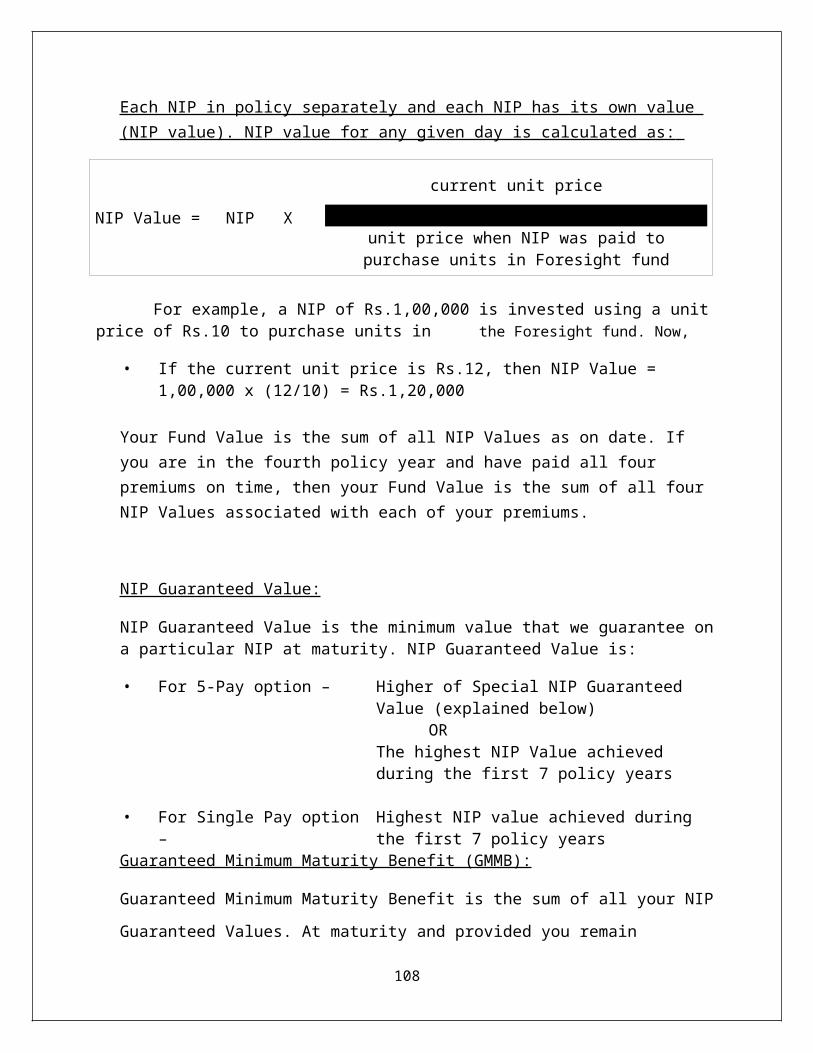
Each NIP in policy separately and each NIP has its own value (NIP value). NIP value for any given day is calculated as:
NIP Value = NIP X
current unit price
unit price when NIP was paid topurchase units in Foresight fund
For example, a NIP of Rs.1,00,000 is invested using a unit price of Rs.10 to purchase units in the Foresight fund. Now,
• If the current unit price is Rs.12, then NIP Value = 1,00,000 x (12/10) = Rs.1,20,000
Your Fund Value is the sum of all NIP Values as on date. If you are in the fourth policy year and have paid all four premiums on time, then your Fund Value is the sum of all four NIP Values associated with each of your premiums.
NIP Guaranteed Value:
NIP Guaranteed Value is the minimum value that we guarantee ona particular NIP at maturity. NIP Guaranteed Value is:
• For 5-Pay option – Higher of Special NIP Guaranteed Value (explained below)
OR The highest NIP Value achieved
during the first 7 policy years • For Single Pay option
–Highest NIP value achieved during the first 7 policy years
Guaranteed Minimum Maturity Benefit (GMMB):
Guaranteed Minimum Maturity Benefit is the sum of all your NIP
Guaranteed Values. At maturity and provided you remain
108
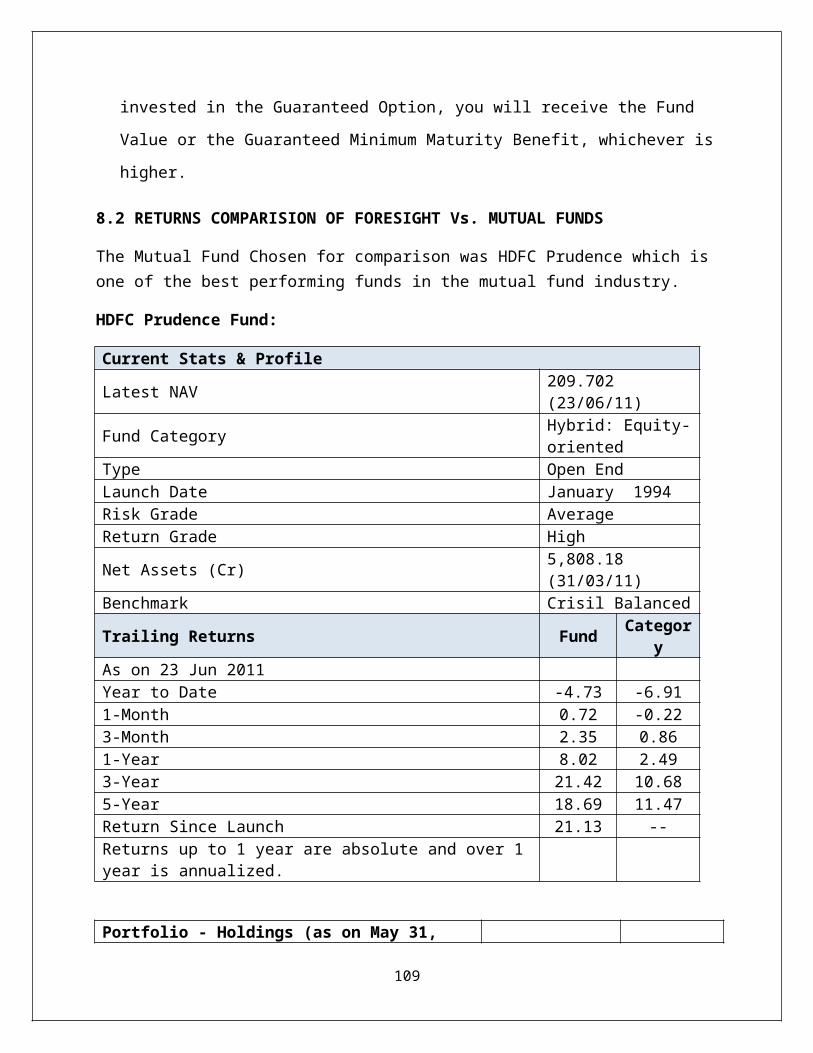
invested in the Guaranteed Option, you will receive the Fund
Value or the Guaranteed Minimum Maturity Benefit, whichever is
higher.
8.2 RETURNS COMPARISION OF FORESIGHT Vs. MUTUAL FUNDS
The Mutual Fund Chosen for comparison was HDFC Prudence which is one of the best performing funds in the mutual fund industry.
HDFC Prudence Fund:
Current Stats & Profile
Latest NAV 209.702 (23/06/11)
Fund Category Hybrid: Equity-oriented
Type Open EndLaunch Date January 1994Risk Grade AverageReturn Grade High
Net Assets (Cr) 5,808.18 (31/03/11)
Benchmark Crisil Balanced
Trailing Returns Fund Category
As on 23 Jun 2011Year to Date -4.73 -6.911-Month 0.72 -0.223-Month 2.35 0.861-Year 8.02 2.493-Year 21.42 10.685-Year 18.69 11.47Return Since Launch 21.13 --Returns up to 1 year are absolute and over 1year is annualized.
Portfolio - Holdings (as on May 31,
109
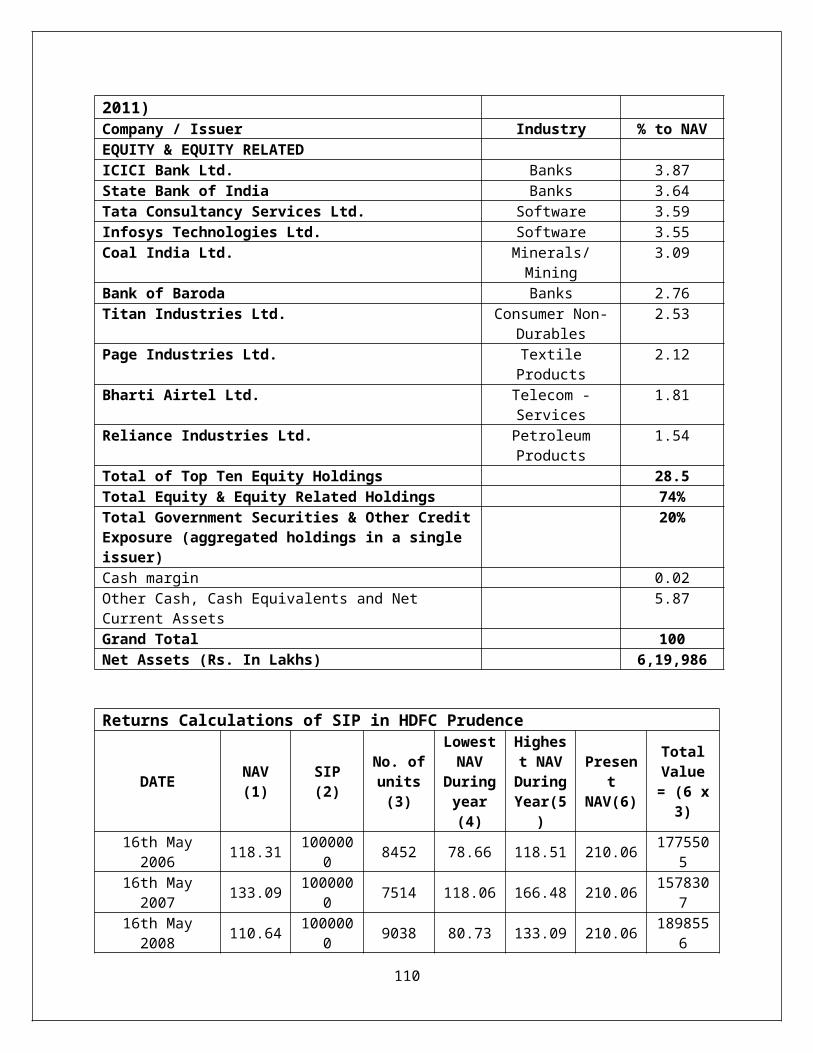
2011)Company / Issuer Industry % to NAVEQUITY & EQUITY RELATED ICICI Bank Ltd. Banks 3.87State Bank of India Banks 3.64Tata Consultancy Services Ltd. Software 3.59Infosys Technologies Ltd. Software 3.55Coal India Ltd. Minerals/
Mining3.09
Bank of Baroda Banks 2.76Titan Industries Ltd. Consumer Non-
Durables2.53
Page Industries Ltd. TextileProducts
2.12
Bharti Airtel Ltd. Telecom -Services
1.81
Reliance Industries Ltd. PetroleumProducts
1.54
Total of Top Ten Equity Holdings 28.5Total Equity & Equity Related Holdings 74%Total Government Securities & Other CreditExposure (aggregated holdings in a single issuer)
20%
Cash margin 0.02Other Cash, Cash Equivalents and Net Current Assets
5.87
Grand Total 100Net Assets (Rs. In Lakhs) 6,19,986
Returns Calculations of SIP in HDFC Prudence
DATE NAV(1)
SIP(2)
No. ofunits(3)
LowestNAV
Duringyear(4)
Highest NAVDuringYear(5
)
Present
NAV(6)
TotalValue= (6 x
3)
16th May2006 118.31 100000
0 8452 78.66 118.51 210.06 1775505
16th May2007 133.09 100000
0 7514 118.06 166.48 210.06 1578307
16th May2008 110.64 100000
0 9038 80.73 133.09 210.06 1898556
110
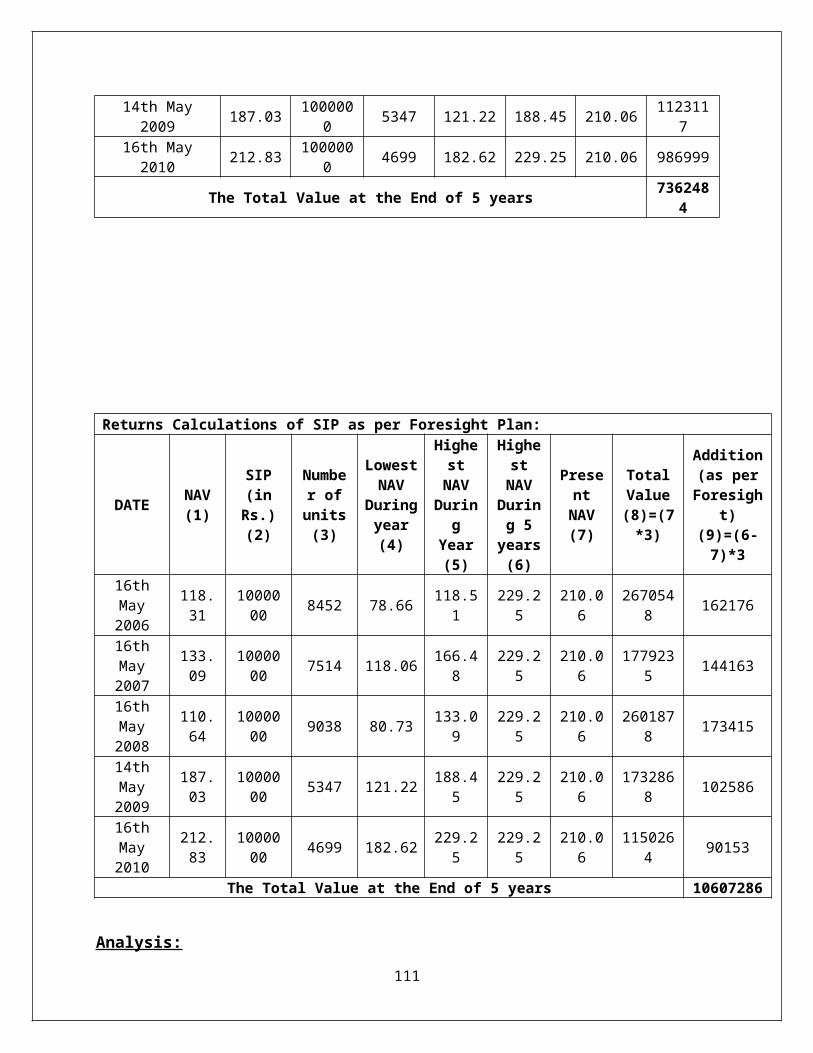
14th May2009 187.03 100000
0 5347 121.22 188.45 210.06 1123117
16th May2010 212.83 100000
0 4699 182.62 229.25 210.06 986999
The Total Value at the End of 5 years 7362484
Returns Calculations of SIP as per Foresight Plan:
DATE NAV(1)
SIP(inRs.)(2)
Number ofunits(3)
LowestNAV
Duringyear(4)
HighestNAV
During
Year(5)
HighestNAV
During 5
years(6)
PresentNAV(7)
TotalValue(8)=(7*3)
Addition(as perForesigh
t)(9)=(6-7)*3
16thMay2006
118.31
1000000 8452 78.66 118.5
1229.2
5210.0
6267054
8 162176
16thMay2007
133.09
1000000 7514 118.06 166.4
8229.2
5210.0
6177923
5 144163
16thMay2008
110.64
1000000 9038 80.73 133.0
9229.2
5210.0
6260187
8 173415
14thMay2009
187.03
1000000 5347 121.22 188.4
5229.2
5210.0
6173286
8 102586
16thMay2010
212.83
1000000 4699 182.62 229.2
5229.2
5210.0
6115026
4 90153
The Total Value at the End of 5 years 10607286
Analysis:
111
The comparison of the SIP of Rs.10,00,000 invested in HDFC
Prudence Fund & BSLI Foresight plan shows that the investment
would have generated higher returns in the foresight plan than a
mutual fund at the end of five years under consideration.
9.SUMMARY & CONCLUSION
The entire project findings can be summarized as follows:
Capital goods sector & banking sector was hit very badly
during recession. Capital goods Sector stock price decreased
by 40% to 50% & Banking sector decreased by 30 to 40%.
112

All the banking stocks touched their all-time high during
the period of November 2010
The balance sheet analysis of the L&T stock shows that
though the stock underperformed during recession,
fundamentally the stock has the capability to survive &
rebound strongly after recession
The balance sheet analysis of Axis Bank shows that it is one
of the best performing private sector banks in the last five
years. Though the stock price was badly hit during recession
due to global meltdown, the performance of the bank was very
commendable. The stock is a good potential investment from a
long term perspective due to its focus on emerging sectors
in India.
Only 20% of the stocks of the portfolio of Bajaj Allianz
Pure Stock was hit during recession whereas BSLI maxi miser
had 52% stock impacted during recession
Pure stock is the best performing fund in the fast track
fund category
Classic life Plan of BSLI is the best product in the market
for whole life ULIP plans. No other competitors are offering
such products. Most of these kind of product was withdrawn
in 2nd half of 2010
Fund Management charges of LIC are very less due to the huge
premium collections with the company.
Mortality charge for higher age individuals is less in BSLI
as compared to its competitors.
113
In the highest NAV product category BSLI’s platinum
advantage is the best product in market both in terms of
highest NAV & Fund performance.
The concept Foresight is the best investment option
available for the investors as compared to other insurance
plans & mutual funds considering risk-return trade off.
Foresight awards the investor with investment at best
possible time & returns with highest NAV.
10. RECOMMENDATIONS
BSLI has ten funds in their portfolio for classic life but
none of the portfolio was able to sustain the recession
during recession. In order to safeguard the investor’s money
they should construct a portfolio which is not hit during
recession. This portfolio should have major investment in
Pharma sector & FMCG sector due to defensive nature of the
industry which can provide much needed stability to the
portfolio during the recession times.
BSLI should balance its portfolio with combination of growth
stocks like Thermax & Yes Bank & balance the portfolio with
investments in defensive stocks like HUL, ITC, CIPLA, BASF
etc. which are less likely to be affected by the recession.
BSLI should make a portfolio which has limited exposure in
banking & Capital goods sector due to highly volatile nature
of the sector especially during recession.
114
Many insurance companies have not picked Bajaj Auto in their
portfolio while the past performance of this stock is
unmatchable.
The future of automobile is not showing great signs with
uncertainty in the fuel prices still Bajaj Auto posted a 22%
increase in latest quarter.
Telecom sector has underperformed in the past 3 years due to
the 2G scam & furious competition in this sector, but with
all the problems sorted out Bharti Airtel & Idea look as a
descent bet in the long run.
Sun Pharma has been a performing well from past 3 years & it
will continue to grow due to the strong demand for
healthcare all over the globe.
In the capital goods sector Crompton Greaves look a descent
beat in the long run due to the key merger it has done in
the last one year.
IRR of BSLI is least in the whole life product categories.
The IRR can be increased by increasing the guaranteed
additions from the tenth year at a higher percentage of the
fund value. This guaranteed addition is already a USP of
BSLI.
Innovative Products like foresight should be marketed
appropriately & more awareness should be created of the
potential of the product to provide high risk-adjusted
returns to the investors.
115
11. REFERENCES & BIBILOGRAPHY
www.birlasunlife.comwww.irdaindia.org
www.moneycontrol.com
www.policybazaar.com
www.inditrade.com
www.valueresearchonline.com
www.indiainfoline.com
www.hdfcmf.com
116