854 Birla Corporation Ltd - Axis Direct
12
Initiating Coverage 30 th June, 2020 Buy Target Price 854 Birla Corporation Ltd Cement 1 Capacity expansion, Focus on blended and premium segment to drive revenue growth We are initiating coverage on Birla Corporation Limited (BCL) with a BUY recommendation and a Target Price of Rs 854, which implies 50% upside from the current levels. BCL is a dominant player in the cement industry in its key market of central India and has a sizeable presence in northern and eastern markets. While FY21 will be impacted adversely due to COVID-19 related lockdown as most of its plants were shut and resumed operations only by end of April, but now the plants are gradually ramping up the operations and normalcy will be restored in Q2FY21. We expect the company to register Revenue/Ebitda/APAT CAGR of 8%/14%/17% from FY20-FY23E driven by volume CAGR of 5.8% and consistent realisation improvement of 3% CAGR over FY20-23E. We value BCL at 6x FY22E EV/EBITDA to arrive at TP of Rs.854 as we see solid re-rating potential on the back of strong growth. Our key reasons are as follows: Capacity expansion to drive higher sector revenue growth BCL is expanding its cement production capacity from the current 15.38 mtpa to 19.68 mtpa .Company is expanding its capacity by setting up green field facility of 3.9 mtpa in Mukutban, Maharashtra and expanding it existing facility capacity by 0.4 mtpa at Chanderia, Rajasthan. Expansions and new capacities will get operational by Q1FY22 which will drive the volume and revenue growth for the company. With the expansion of capacity the company will also conoslidate its position in western India and will gain significant market share. We expect Volume CAGR of 5.8% over FY20-23E which is significantly higher than the industry growth of 4% CAGR over the same period. Focus on sale of blended and premium cement The sale of blended cement forms 90% of company sale and focus on increasing sale of premium cement (40% of sale in trade segment) will drive margin growth. To consolidate its position in selling premium segment category, the company has introduced several brands in its markets. We expect premium cement to contribute 45% of the company sales in trade segment by FY23E which will help in realization improvement. Aided by growth in premium cement and consistent price hikes, we expect realizations to improve by 3% CAGR over FY20-23 compared to 2% CAGR over the last 10 years. Integrated operations with high capacity utilization and cost optimization BCL’s integrated operations and higher utilization of existing capacity will help the company to consolidate and capture further opportunities in its key market (Central, North, East). Further cost optimization excercise initiated at varoius operating facilities of the company will add to margin improvement going forward. We expect EBIDTA margins to improve from 19.3%% in FY20 to 22.1% by FY23E, notwithstainding the significant capacity addition of 28% over the next two years. Consequently, EBIDTA/tonne improves by 7% over the period FY20-23E to Rs.1215/tonne. Robust growth outlook – Initiate with BUY Current valuations are attractive at 5x FY22E EV/EBITDA (sector average 9X EV/EBIDTA) and US$54/tonne of capacity (significant discount to replacement cost of US$80/tonne). Initiate coverage with BUY and target price of Rs. 854/share, valuing the company at 6x of its FY22E EV/Ebida. Key Financials (Consolidated) (Rs. Cr) FY20A FY21E FY22E FY23E Net Sales 6915 6490 8132 8829 EBITDA 1339 1303 1672 1954 Net Profit 505 442 624 813 EPS (Rs.) 66 57 81 106 PER (x) 6.32 17 8 7 EV/EBITDA (x) 5.72 6.17 4.73 4.05 P/BV (x) 0.66 0.92 0.83 0.71 ROE (%) 11% 9% 11% 12% Source: Company, Axis Research CMP as of June 29, 2020) CMP (Rs) 569 Upside /Downside (%) 50% High/Low (Rs) 807/372 Market cap (Cr) 4400 Avg. daily vol. (6m) Shrs. 315629 No. of shares (Cr) 7.70 Shareholding (%) Mar-18 Mar-19 Mar-20 Promoter 62.9 62.9 62.9 FIIs 2.62 2.09 4.17 MFs / UTI 10.02 12.01 11.52 Banks / FIs 3.9 3.98 3.8 Others 20.56 19.02 17.61 Financial & Valuations Y/E Mar (Rs. Cr) FY21E FY22E FY23E Net Sales 6490 8132 8829 EBITDA 1303 1672 1954 Net Profit 442 624 813 EPS (Rs.) 57 81 106 PER (x) 17 8 7 EV/EBITDA (x) 6.17 4.73 4.05 P/BV (x) 0.92 0.83 0.71 ROE (%) 9% 11% 12% Key Drivers (%) (Growth in %) Y/E Dec FY21E FY22E FY23E Net Sales -6 25 9 EBITDA -2 28 17 Net Profit -12 41 30 Axis vs Consensus EPS Estimates 2021E 2022E Axis 57 81 Consensus 38 55 Mean Consensus TP (12M) 654 Relative performance Source: Capitaline, Axis Securities 0 40 80 120 160 200 Apr-19 Sep-19 Jan-20 Jun-20 Birla Corporation Ltd BSE Sensex Uttam Kumar Srimal Research Analyst Email: [email protected] Ph: +91 70001 30614
-
Upload
khangminh22 -
Category
Documents
-
view
1 -
download
0
Transcript of 854 Birla Corporation Ltd - Axis Direct

Initiating Coverage
30th June, 2020
Buy
Target Price
854
Birla Corporation Ltd Cement
1
Capacity expansion, Focus on blended and premium segment to drive revenue growth
We are initiating coverage on Birla Corporation Limited (BCL) with a BUY recommendation and a Target Price of Rs 854, which implies 50% upside from the current levels. BCL is a dominant player in the cement industry in its key market of central India and has a sizeable presence in northern and eastern markets. While FY21 will be impacted adversely due to COVID-19 related lockdown as most of its plants were shut and resumed operations only by end of April, but now the plants are gradually ramping up the operations and normalcy will be restored in Q2FY21. We expect the company to register Revenue/Ebitda/APAT CAGR of 8%/14%/17% from FY20-FY23E driven by volume CAGR of 5.8% and consistent realisation improvement of 3% CAGR over FY20-23E. We value BCL at 6x FY22E EV/EBITDA to arrive at TP of Rs.854 as we see solid re-rating potential on the back of strong growth. Our key reasons are as follows:
Capacity expansion to drive higher sector revenue growth
BCL is expanding its cement production capacity from the current 15.38 mtpa to 19.68 mtpa .Company is expanding its capacity by setting up green field facility of 3.9 mtpa in Mukutban, Maharashtra and expanding it existing facility capacity by 0.4 mtpa at Chanderia, Rajasthan. Expansions and new capacities will get operational by Q1FY22 which will drive the volume and revenue growth for the company. With the expansion of capacity the company will also conoslidate its position in western India and will gain significant market share. We expect Volume CAGR of 5.8% over FY20-23E which is significantly higher than the industry growth of 4% CAGR over the same period.
Focus on sale of blended and premium cement
The sale of blended cement forms 90% of company sale and focus on increasing sale of premium cement (40% of sale in trade segment) will drive margin growth. To consolidate its position in selling premium segment category, the company has introduced several brands in its markets. We expect premium cement to contribute 45% of the company sales in trade segment by FY23E which will help in realization improvement. Aided by growth in premium cement and consistent price hikes, we expect realizations to improve by 3% CAGR over FY20-23 compared to 2% CAGR over the last 10 years.
Integrated operations with high capacity utilization and cost optimization
BCL’s integrated operations and higher utilization of existing capacity will help the company to consolidate and capture further opportunities in its key market (Central, North, East). Further cost optimization excercise initiated at varoius operating facilities of the company will add to margin improvement going forward. We expect EBIDTA margins to improve from 19.3%% in FY20 to 22.1% by FY23E, notwithstainding the significant capacity addition of 28% over the next two years. Consequently, EBIDTA/tonne improves by 7% over the period FY20-23E to Rs.1215/tonne.
Robust growth outlook – Initiate with BUY
Current valuations are attractive at 5x FY22E EV/EBITDA (sector average 9X EV/EBIDTA) and US$54/tonne of capacity (significant discount to replacement cost of US$80/tonne). Initiate coverage with BUY and target price of Rs. 854/share, valuing the company at 6x of its FY22E EV/Ebida.
Key Financials (Consolidated)
(Rs. Cr) FY20A FY21E FY22E FY23E
Net Sales 6915 6490 8132 8829
EBITDA 1339 1303 1672 1954
Net Profit 505 442 624 813
EPS (Rs.) 66 57 81 106
PER (x) 6.32 17 8 7
EV/EBITDA (x) 5.72 6.17 4.73 4.05
P/BV (x) 0.66 0.92 0.83 0.71
ROE (%) 11% 9% 11% 12%
Source: Company, Axis Research
CMP as of June 29, 2020)
CMP (Rs) 569
Upside /Downside (%) 50%
High/Low (Rs) 807/372
Market cap (Cr) 4400
Avg. daily vol. (6m) Shrs. 315629
No. of shares (Cr) 7.70
Shareholding (%)
Mar-18 Mar-19 Mar-20
Promoter 62.9 62.9 62.9
FIIs 2.62 2.09 4.17
MFs / UTI 10.02 12.01 11.52
Banks / FIs 3.9 3.98 3.8
Others 20.56 19.02 17.61
Financial & Valuations
Y/E Mar (Rs. Cr) FY21E FY22E FY23E
Net Sales 6490 8132 8829
EBITDA 1303 1672 1954
Net Profit 442 624 813
EPS (Rs.) 57 81 106
PER (x) 17 8 7
EV/EBITDA (x) 6.17 4.73 4.05
P/BV (x) 0.92 0.83 0.71
ROE (%) 9% 11% 12%
Key Drivers (%) (Growth in %)
Y/E Dec FY21E FY22E FY23E
Net Sales -6 25 9
EBITDA -2 28 17
Net Profit -12 41 30
Axis vs Consensus
EPS Estimates
2021E 2022E
Axis
57 81
Consensus
38 55
Mean Consensus TP (12M) 654
Relative performance
Source: Capitaline, Axis Securities
0
40
80
120
160
200
Apr-19 Sep-19 Jan-20 Jun-20
Birla Corporation Ltd BSE Sensex
Uttam Kumar Srimal Research Analyst
Email: [email protected] Ph: +91 70001 30614

2
Story in Charts
Exhibit 1: Revenue and Volume Trend Exhibit 2: Capacity expansion and Utilization trend
Source: Company, Axis Securities,
Exhibit 3: Ebitda /Tonne to increase Exhibit 4: EBITDA & EBITDA margin to increase (Rs. In crores)
Source: Company, Axis Securities,
Exhibit 5: Realization tonne / Growth trend Exhibit 6: Trend in cost/ Tonne
Source: Company, Axis Securities,
12.413.6 13.6
12.4
15.216.1
0
20000
40000
60000
80000
100000
0
2
4
6
8
10
12
14
16
18
FY18 FY19 FY20 FY21E FY22E FY23E
Revenue Volume (mtpa)
15.38 15.38 15.3815.38
19.68 19.68
81% 88% 88% 81% 77% 82%
0
5
10
15
20
25
2018 2019 2020 2021E 2022E 2023E
Capacity
651698
9841051
1099
1215
0
200
400
600
800
1000
1200
1400
2018 2019 2020 2021E 2022E 2023E
8066 9486 13359 13032 16721 195430.0%
5.0%
10.0%
15.0%
20.0%
25.0%
0
5000
10000
15000
20000
25000
2018 2019 2020 2021E 2022E 2023E
43704571
4847 4993 5142 5297
-4%
-2%
0%
2%
4%
6%
8%
0
800
1600
2400
3200
4000
4800
5600
2018 2019 2020 2021E 2022E 2023E
Realization/tonne Growth
39364132 4109 4183 4245 4275
1000
2000
3000
4000
5000
2018 2019 2020 2021E 2022E 2023E
Cost/tonne
3
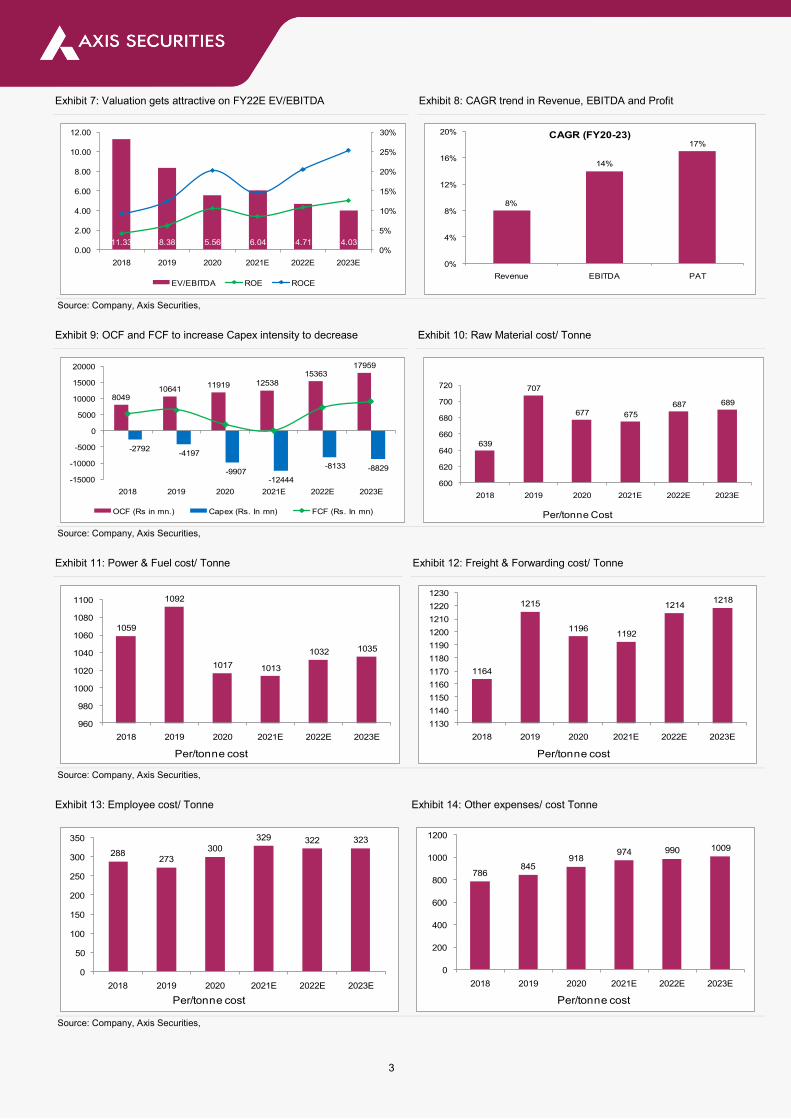
Exhibit 7: Valuation gets attractive on FY22E EV/EBITDA Exhibit 8: CAGR trend in Revenue, EBITDA and Profit
Source: Company, Axis Securities,
Exhibit 9: OCF and FCF to increase Capex intensity to decrease Exhibit 10: Raw Material cost/ Tonne
Source: Company, Axis Securities,
Exhibit 11: Power & Fuel cost/ Tonne Exhibit 12: Freight & Forwarding cost/ Tonne
Source: Company, Axis Securities,
Exhibit 13: Employee cost/ Tonne Exhibit 14: Other expenses/ cost Tonne
Source: Company, Axis Securities,
11.33 8.38 5.56 6.04 4.71 4.030%
5%
10%
15%
20%
25%
30%
0.00
2.00
4.00
6.00
8.00
10.00
12.00
2018 2019 2020 2021E 2022E 2023E
EV/EBITDA ROE ROCE
8%
14%
17%
0%
4%
8%
12%
16%
20%
Revenue EBITDA PAT
CAGR (FY20-23)
804910641
11919 1253815363
17959
-2792-4197
-9907-12444
-8133 -8829
-15000
-10000
-5000
0
5000
10000
15000
20000
2018 2019 2020 2021E 2022E 2023E
OCF (Rs in mn.) Capex (Rs. In mn) FCF (Rs. In mn)
639
707
677 675
687 689
600
620
640
660
680
700
720
2018 2019 2020 2021E 2022E 2023E
Per/tonne Cost
1059
1092
1017 1013
1032 1035
960
980
1000
1020
1040
1060
1080
1100
2018 2019 2020 2021E 2022E 2023E
Per/tonne cost
1164
1215
11961192
12141218
1130
1140
1150
1160
1170
1180
1190
1200
1210
1220
1230
2018 2019 2020 2021E 2022E 2023E
Per/tonne cost
288273
300
329 322 323
0
50
100
150
200
250
300
350
2018 2019 2020 2021E 2022E 2023E
Per/tonne cost
786845
918974 990 1009
0
200
400
600
800
1000
1200
2018 2019 2020 2021E 2022E 2023E
Per/tonne cost

4
Capacity expansion to augment revenue growth
The company is expanding its cement capacity by setting up a new green field facility of 3.9 mtpa at project cost of Rs. 2450 crores at Mukutban
in Maharashtra and expansion of existing facility at its plant in Chanderia, Rajasthan by 0.4 mtpa. The capacity will get operational by Q1FY21-
22. The total cement capacity will increase to 19.68 mtpa after the proposed expansion The increased capacity will drive revenue growth in
FY21-22 and beyond that. The proposed green field facility is integrated one, it will result in various cost savings to the company and also
strengthen its position in western market.
Exhibit 15: Cement plants (3.9 mn tone capacity)
Source: Company, Axis Securities
Focus on sale of blended and premium cement
Company has been consistently increasing the share of blended cement with higher absorption of fly ash and blast furnace slag to augment
production of environment friendly products. The sale of blended cement forms 90% of the company sales. The Company’s strategy of
increasing volumes in the high contribution core markets and moving up the value chain by increasing the proportion of cement sales in trade
segment, premium grade cement and blended cement have contributed to the growth in profitability and helped mitigate the cost pressures. To
enhance the sale of premium segment company has introduced several brands under this category in its respective market . The various
premium brand launched by the company are MP Birla cement Unique, Ultimate ultra and Samrat Advanced.

5
Integrated nature of operation with high capacity utilization and cost optimization
Currently BCL has a consolidated cement capacity of 15.38 mtpa of which BCL has 9.80 mtpa and RCCPL (Reliance cement company pvt
limited, previously named) has 5.58 mtpa. The vertical integration of operations with the availability of captive coal, lime stone mines and captive
power plant (CPPs, Solar and WHRS) is supported by clinkerisation facility of 10 mtpa for its various plants located in central, northern and
eastern India its principal market. The company is further strengthening its captive power capacity with the set up of new facility at Maihar and
Satna plant. These backward integration measures are likely to continue to accrue benefits to BCL strengthening its financial profile. The
capacity utilization in FY19-20 stood at 90% and it is is one of the best in the industry. The cost optimization exercise planned at various plants
related to setting up of captive power plants (Solar, WHRS), coal extraction will add to margins of the company going forward. Further, the
company has also engaged a global consultancy firm to optimize inbound and outbound logistics by strengthening system and processes.
Exhibit 16: Company plants and Offices
Source: Company, Axis Securities
State Town Units Capacity (Million Tonnes)
Acquired RCCPL plants
Madhya Pradesh Satna Satna Cement Works 2.2
Rajasthan Chanderia Birla Cement Work/Chanderia Cement Work 4.0
West bengal Durgapur Durgapur Cement Work/ Durga Hitech Cement 2.3
Uttar Pradesh Raibareli Raebareli Cement Works/ Raebareli Hitech Cement Work 1.3
Acquired RCCPL plants
Madhya Pradesh Maihar Maihar plant 3.0
Uttar Pradesh Kundanganj Kundangunj Plant 2.0
Maharashtra Butibori Butibori Plant 0.58
Source: Company
Experienced management
The company is managed by experienced management having long track record of operation in cement industry across various cycles. Since cement business is highly cyclical, relying on the economic growth of the country, presence of capable and experienced management offers operational comfort.

6
Company Overview
Birla Corporation Limited is the flagship Company of the M.P. Birla Group. Incorporated as Birla Jute Manufacturing Company Limited in 1919, it
was Late Mr. Madhav Prasad Birla who gave shape to it. As Chairman of the Company, he transformed it from a manufacturer of jute goods to a
leading multi-product corporation with widespread activities. The Company is primarily engaged in the manufacturing of cement as its core
business activity. It has significant presence in the jute goods industry as well. The Company has acquired 100% shares of Reliance Cement
Company Private Limited (Reliance Cement), a subsidiary of Reliance Infrastructure Limited (RIL). After this acquisition, Reliance Cement has
become a wholly-owned material subsidiary of Birla Corporation Limited. The entire cement business of RIL has been acquired for an Enterprise
Value of Rs. 4,800 crores. This acquisition provides Birla Corporation Limited with the ownership of high-quality assets, taking its total capacity
from 9.8 MTPA to 15.38 MTPA. .
The Cement Division of Birla Corporation Limited has 10 plants at seven locations, Satna & Maihar (Madhya Pradesh), Raebareli & Kundanganj
(Uttar Pradesh), Chanderia (Rajasthan), Butibori (Maharashtra) and Durgapur (West Bengal).
The company manufacture varieties of cement like Ordinary Portland Cement (OPC), Portland Pozzolana Cement (PPC), fly ash-based PPC,
Low Alkali Portland Cement, Portland Slag Cement (PSC), Low Heat Cement and Sulphate Resistant Cement. The company has 2 integrated
cements units, 3 grinding units, 1 blending unit, 1 Jute mill, 1 steel foundry unit
BCL sells cement under various well established brands, prominent being MP Birla Perfect Plus, MP Birla Unique, MP Birla Samrat, MP Birla
Ultimate, MP Birla Ultimate Ultra, MP Birla Chetak, MP Birla Concrecem, MP Birla Multicem, MP Birla PSC with its key markets being Uttar
Pradesh, Madhya Pradesh, Rajasthan,Haryana, Bihar, Bengal, Delhi, Gujarat and Maharashtra. BCL is currently under the control of Shri H. V.
Lodha.
Exhibit 17: Revenue by segment
Source: Company, Axis Securities
92.48%
7.49% 0.03%
Cement Jute Others0%
20%
40%
60%
80%
100%

7
Valuations and Outlook
We initiate coverage on Birla Corporation Limited with BUY and Target Price of Rs. 854/share implies upside of 50% as we value the stock at 6x
FY22E EV/Ebitda. The stock has corrected sharply from its high of Rs 800 in January 2020 to low of Rs. 372 in March 2020 due to muted
economic growth outlook and lockdown . Since then stock has recovered 53% from its low based on impressive Q4FY20 result. While FY21 will
be impacted due to COVID-19 and related lockdown as most of its plants were shut and operation resumed from April end 2020 and now plants
are gradually ramping up the operation and normalcy will be restored in Q2FY21. The outlook for the company in FY22/FY23 is robust as
upcoming capacities will drive volume and sales growth for the company. We expect the company to register Revenue/Ebitda/APAT CAGR of
8%/14%/17% from FY20-FY23E driven by volume CAGR of 5.8% and consistent realisation improvement of 3% CAGR over FY20-23E.
Valuation is attractive at 5x FY22E EV/EBITDA and USD54/t of capacity (significant discount to replacement cost) We value BCL at 6x FY22E
EV/EBITDA to arrive at TP of Rs.854 as we see solid re-rating potential on the back of strong growth.
Exhibit 18: FWD PE BAND (x) Exhibit 19: FWD EV/EBITDA BAND (x)
Source: Company, Axis Securities
Key Risk
Execution risk associated with expanded capacity
RCCPL is expanding its capacity by setting up a green field integrated cement plant at Mukutban, in Maharashtra, having a capacity of 3.9 mtpa
at a budgeted cost of around Rs. 2,450 crores. The project will be funded through mix of debt and equity. Since capacity expansion is sizeable
and debt-funded capex exposes the company to execution risks. However, the experience of the management in operating an integrated
cement plant provides some comfort.
Cyclicality of the cement industry
Cement industry is highly cyclical in nature and depends largely on the economic growth of the country. There is a high degree of correlation
between the GDP growth and the growth in cement consumption. The contraction in economic growth also hampers cement industry. Since
company enjoys strong presence in its key market of central, northern and eastern India with strong brand recall, the company is expected to
restrict the slowdown.
Fluctuation in input prices
Fluctuation in prices of input such as coal, pet coke, limestone, fly ash and slags , power and fuel affects cost structure of cement company.
BCL is also exposed to such fluctuation in input prices and any large variation may impact the profitability of the company.
0
10
20
30
40
50
60
70
80
90
100
Se
p-1
5
De
c-1
5
Mar-
16
Ju
n-1
6
Se
p-1
6
De
c-1
6
Mar-
17
Ju
n-1
7
Se
p-1
7
De
c-1
7
Mar-
18
Ju
n-1
8
Se
p-1
8
De
c-1
8
Mar-
19
Ju
n-1
9
Se
p-1
9
De
c-1
9
Mar-
20
Ju
n-2
0
P/E (Daily Time Series Ratio) Mean Mean+1stdev Mean-1stdev
0
10
20
30
40
50
60
70
80
90
Se
p-1
5
De
c-1
5
Mar-
16
Ju
n-1
6
Se
p-1
6
De
c-1
6
Mar-
17
Ju
n-1
7
Se
p-1
7
De
c-1
7
Mar-
18
Ju
n-1
8
Se
p-1
8
De
c-1
8
Mar-
19
Ju
n-1
9
Se
p-1
9
De
c-1
9
Mar-
20
Ju
n-2
0
Forward P/E (Daily Time Series Ratio) Mean Mean+1stdev Mean-1stdev

8
Industry Overview
After China, India is the world’s second largest cement producer and accounts for over 8% of the global installed capacity. The cement industry
is one of the key drivers of the Indian economy and provides employment to over one million people. The housing or real estate sector accounts
for almost 66 per cent of cement consumption in India, while the rest is split between public infrastructure (22 per cent) and industrial
development (12 per cent). The outlook for the cement industry continues to remain favorable with expected demand from the housing sector,
primarily rural and affordable housing and improved Government focus on infrastructure segments, mainly roads, railway and irrigation projects.
In addition, the Central India region has witnessed consolidation over the past couple of years, which is likely to bring price stability in the region,
thus supporting cement players based out of Central India, including BCL. The current capacity of cement industry is 520 mtpa and average
capacity utilization remains between 70-75%.
The cement industry is highly cyclical in nature and its growth prospect is well tied up with the economic growth of the country. Important
aspects to look into cement industry are a) Operating region demand supply dynamics b) Sources of raw material c) Power & Fuel d) Branding
e) Capacity expansion f) Locational economics g) Product mix (OPC, PPC & PSC) h) Management quality.
Challenges faced by cement industry in India are a) Excess capacity b) Availabilty of sands c) High logistic cost d) Availabilty of rake from
railway e) Input Prices f) GST @28%.
Exhibit 20: Cement Production (MTPA)
Source: Company, Axis Securities
Exhibit 21: Cement capacity region wise Exhibit 22: Capacity Utilisation region wise
Source: CMAI Source: Axis Securities
174.187
206.216 230
248255
270. 283279
297
337
0
50
100
150
200
250
300
350
400
2008 2009 2010 2011 2012 2013 2014 2015 2016 2017 2018 2019
Production in (mtpa)
71%
76%
74%
78%
56%
Eastern Region West Region North Region Central Region South Region
18%
14%
20%13%
35%
Eastern Region West Region North Region Central Region South Region

9
Financials (consolidated)
Profit & Loss (Rs Cr)
Y/E March FY20A FY21E FY22E FY23E
Net sales 6915 6490 8132 8829
Other operating income 0 0 0 0
Total income 6915 6490 8132 8829
Raw Material 919 836 1045 1108
Power & Fuel 1380 1256 1570 1665
Freight & Forwarding 1624 1478 1848 1959
Employee benefit expenses 407 407 489 518
Other Expenses 1246 1207 1506 1623
EBITDA 1336 1303 1672 1956
Other income 85 94 131 154
PBIDT 1421 1062 1608 2110
Depreciation 351 377 488 524
Interest & Fin Chg. 387 429 482 500
E/o income / (Expense) 0 0 0
Pre-tax profit 683 590 832 1086
Tax provision 176 147 208 271
(-) Minority Interests 0 0 0 0
Associates 0 0 0 0
Profit after Tax 507 442 624 815
Other Comprehensive Income 0 0 0 0
PAT after Comprehensive Income 507 442 624 815
Source: Company, Axis Securities
Balance Sheet (Rs Cr)
Y/E March FY20A FY21E FY22E FY23E
Total assets 12175 13282 14286 15083
Net Block 7324 7595 9870 10229
CWIP 1604 2200 250 250
Investments 836 1046 1546 2006
Wkg. cap. (excl cash) 515 511 570 612
Cash / Bank balance 259 104 102 162
Misc. Assets 1637 1826 1948 1824
Capital employed 12175 13282 14286 15083
Equity capital 77 77 77 77
Reserves 8346 8769 9449 10232
Minority Interests 0 0 0 0
Borrowings 3752 4436 4760 4774
Def tax Liabilities 0 0 0 0
Source: Company, Axis Securities

10
Cash Flow (Rs Cr)
Y/E March FY20A FY21E FY22E FY23E
Sources 1058 1510 1371 1284
Cash profit 864 820 1113 1338
(-) Dividends 58 46 62 62
Retained earnings 806 774 1052 1276
Issue of equity 0 0 0 0
Change in Oth. Reserves 0 0 0 0
Borrowings 663 694 320 8
Others -411 42 0 0
Applications 1058 1510 1371 1284
Capital expenditure 991 1244 813 883
Investments 267 210 500 300
Net current assets -6 -4 60 42
Change in cash -193 60 -2 60
Closing cash 44 104 102 162
Source: Company, Axis Securities
Ratio Analysis (%)
Y/E March FY20A FY21E FY22E FY23E
Sales growth 6 -6 25 9
OPM 19.3 20.1 20.6 22.1
Op. profit growth 41 -27 56 17
COGS / Net sales 57 55 55 54
Overheads/Net sales 24 25 24.5 24
Depreciation / G. block 4 4 4 4
Effective interest rate (%) 10.5 10.5 10.5 10.5
Net wkg.cap / Net sales 8 12 16 19
Net sales / Gr block (x) 79 69 67 67
RoCE 11% 10% 11% 13%
Debt / equity (x) 0.76 0.84 0.81 0.70
Effective tax rate 25.9 25 25 25
RoE 11% 9% 11% 12%
Payout ratio (Div/NP) 11 10 10 8
EPS (Rs.) 66 57 81 106
EPS Growth 98 -12 41 30
CEPS (Rs.) 111 107 145 174
DPS (Rs.) 8 6 8 8
Source: Company, Axis Securities

11
About the analyst
Uttam Srimal
Research Analyst
Call: +91 70001 30614
Disclosures:
The following Disclosures are being made in compliance with the SEBI Research Analyst Regulations 2014 (herein after referred to as the Regulations).
1. Axis Securities Ltd. (ASL) is a SEBI Registered Research Analyst having registration no. INH000000297. ASL, the Research Entity (RE) as defined in the
Regulations, is engaged in the business of providing Stock broking services, Depository participant services & distribution of various financial products. ASL is a
subsidiary company of Axis Bank Ltd. Axis Bank Ltd. is a listed public company and one of India’s largest private sector bank and has its various subsidiaries
engaged in businesses of Asset management, NBFC, Merchant Banking, Trusteeship, Venture Capital, Stock Broking, the details in respect of which are
available on www.axisbank.com.
2. ASL is registered with the Securities & Exchange Board of India (SEBI) for its stock broking & Depository participant business activities and with the Association
of Mutual Funds of India (AMFI) for distribution of financial products and also registered with IRDA as a corporate agent for insurance business activity.
3. ASL has no material adverse disciplinary history as on the date of publication of this report.
4. I/We, Uttam Srimal, MBA-Finance, author/s and the name/s subscribed to this report, hereby certify that all of the views expressed in this research report
accurately reflect my/our views about the subject issuer(s) or securities. I/We (Research Analyst) also certify that no part of my/our compensation was, is, or will
be directly or indirectly related to the specific recommendation(s) or view(s) in this report. I/we or my/our relative or ASL does not have any financial interest in
the subject company. Also I/we or my/our relative or ASL or its Associates may have beneficial ownership of 1% or more in the subject company at the end of
the month immediately preceding the date of publication of the Research Report. Since associates of ASL are engaged in various financial service businesses,
they might have financial interests or beneficial ownership in various companies including the subject company/companies mentioned in this report. I/we or
my/our relative or ASL or its associate does not have any material conflict of interest. I/we have not served as director / officer, etc. in the subject company in the
last 12-month period. Any holding in stock – No
5. 5. ASL has not received any compensation from the subject company in the past twelve months. ASL has not been engaged in market making activity for the
subject company.
6. In the last 12-month period ending on the last day of the month immediately preceding the date of publication of this research report, ASL or any of its
associates may have:
Received compensation for investment banking, merchant banking or stock broking services or for any other services from the subject company of this research report
and / or;
Managed or co-managed public offering of the securities from the subject company of this research report and / or;
Received compensation for products or services other than investment banking, merchant banking or stock broking services from the subject company of this
research report;
ASL or any of its associates have not received compensation or other benefits from the subject company of this research report or any other third-party in connection
with this report.
Term& Conditions:
This report has been prepared by ASL and is meant for sole use by the recipient and not for circulation. The report and information contained herein is strictly
confidential and may not be altered in any way, transmitted to, copied or distributed, in part or in whole, to any other person or to the media or reproduced in any form,
without prior written consent of ASL. The report is based on the facts, figures and information that are considered true, correct, reliable and accurate. The intent of this
report is not recommendatory in nature. The information is obtained from publicly available media or other sources believed to be reliable. Such information has not
been independently verified and no guaranty, representation of warranty, express or implied, is made as to its accuracy, completeness or correctness. All such
information and opinions are subject to change without notice. The report is prepared solely for informational purpose and does not constitute an offer document or
solicitation of offer to buy or sell or subscribe for securities or other financial instruments for the clients. Though disseminated to all the customers simultaneously, not
all customers may receive this report at the same time. ASL will not treat recipients as customers by virtue of their receiving this report.

12
Disclaimer:
Nothing in this report constitutes investment, legal, accounting and tax advice or a representation that any investment or strategy is suitable or appropriate to the
recipient’s specific circumstances. The securities and strategies discussed and opinions expressed, if any, in this report may not be suitable for all investors, who
must make their own investment decisions, based on their own investment objectives, financial positions and needs of specific recipient.
This report may not be taken in substitution for the exercise of independent judgment by any recipient. Each recipient of this report should make such investigations
as it deems necessary to arrive at an independent evaluation of an investment in the securities of companies referred to in this report (including the merits and risks
involved), and should consult its own advisors to determine the merits and risks of such an investment. Certain transactions, including those involving futures,
options and other derivatives as well as non-investment grade securities involve substantial risk and are not suitable for all investors. ASL, its directors, analysts or
employees do not take any responsibility, financial or otherwise, of the losses or the damages sustained due to the investments made or any action taken on basis of
this report, including but not restricted to, fluctuation in the prices of shares and bonds, changes in the currency rates, diminution in the NAVs, reduction in the
dividend or income, etc. Past performance is not necessarily a guide to future performance. Investors are advice necessarily a guide to future performance. Investors
are advised to see Risk Disclosure Document to understand the risks associated before investing in the securities markets. Actual results may differ materially from
those set forth in projections. Forward-looking statements are not predictions and may be subject to change without notice.
ASL and its affiliated companies, their directors and employees may; (a) from time to time, have long or short position(s) in, and buy or sell the securities of the
company(ies) mentioned herein or (b) be engaged in any other transaction involving such securities or earn brokerage or other compensation or act as a market
maker in the financial instruments of the company(ies) discussed herein or act as an advisor or investment banker, lender/borrower to such company(ies) or may
have any other potential conflict of interests with respect to any recommendation and other related information and opinions. Each of these entities functions as a
separate, distinct and independent of each other. The recipient should take this into account before interpreting this document.
ASL and / or its affiliates do and seek to do business including investment banking with companies covered in its research reports. As a result, the recipients of this
report should be aware that ASL may have a potential conflict of interest that may affect the objectivity of this report. Compensation of Research Analysts is not
based on any specific merchant banking, investment banking or brokerage service transactions. ASL may have issued other reports that are inconsistent with and
reach different conclusion from the information presented in this report. The Research reports are also available & published on AxisDirect website.
Neither this report nor any copy of it may be taken or transmitted into the United State (to U.S. Persons), Canada, or Japan or distributed, directly or indirectly, in the
United States or Canada or distributed or redistributed in Japan or to any resident thereof. If this report is inadvertently sent or has reached any individual in such
country, especially, USA, the same may be ignored and brought to the attention of the sender. This report is not directed or intended for distribution to, or use by, any
person or entity who is a citizen or resident of or located in any locality, state, country or other jurisdiction, where such distribution, publication, availability or use
would be contrary to law, regulation or which would subject ASL to any registration or licensing requirement within such jurisdiction. The securities described herein
may or may not be eligible for sale in all jurisdictions or to certain category of investors.
The Disclosures of Interest Statement incorporated in this document is provided solely to enhance the transparency and should not be treated as endorsement of the
views expressed in the report. The Company reserves the right to make modifications and alternations to this document as may be required from time to time without
any prior notice. The views expressed are those of the analyst(s) and the Company may or may not subscribe to all the views expressed therein.
Copyright in this document vests with Axis Securities Limited.
Axis Securities Limited, Corporate office: Unit No. 2, Phoenix Market City, 15, LBS Road, Near Kamani Junction, Kurla (west), Mumbai-400070, Tel No. – 022-
40508080/ 022-61480808, Regd. off.- Axis House, 8th Floor, Wadia International Centre, PandurangBudhkar Marg, Worli, Mumbai – 400 025. Compliance Officer:
AnandShaha, Email: [email protected], Tel No: 022-42671582.SEBI-Portfolio Manager Reg. No. INP000000654
DEFINITION OF RATINGS
Ratings Expected absolute returns over 12-18 months
BUY More than 10%
HOLD Between 10% and -10%
SELL Less than -10%
NOT RATED We have forward looking estimates for the stock but we refrain from assigning valuation and recommendation
UNDER REVIEW We will revisit our recommendation, valuation and estimates on the stock following recent events
NO STANCE We do not have any forward looking estimates, valuation or recommendation for the stock