market study about indian sea logistics and analysis of sea ...
145
MARKET STUDY ABOUT INDIAN SEA LOGISTICS AND ANALYSIS OF SEA SOLUTIONS BETWEEN THE COUNTRIES OF INDIA AND PORTUGAL KALYANASUNDARAM IYYAPPAN Outubro de 2017
-
Upload
khangminh22 -
Category
Documents
-
view
0 -
download
0
Transcript of market study about indian sea logistics and analysis of sea ...

MARKET STUDY ABOUT INDIAN SEALOGISTICS AND ANALYSIS OF SEASOLUTIONS BETWEEN THE COUNTRIES OFINDIA AND PORTUGAL
KALYANASUNDARAM IYYAPPANOutubro de 2017M
ARK
ET S
TUD
Y A
BOU
T IN
DIA
N S
EA L
OG
ISTI
CS A
ND
AN
ALY
SIS
OF
SEA
SOLU
TIO
NS
BETW
EEN
TH
E CO
UN
TRIE
S O
F IN
DIA
AN
D P
ORT
UG
AL
KALY
AN
ASU
ND
ARA
M IY
YAPP
AN
Out
ubro
de
2017

MARKET STUDY ABOUT INDIAN SEA LOGISTICS AND
ANALYSIS OF SEA SOLUTIONS BETWEEN THE COUNTRIES
OF INDIA AND PORTUGAL
Kalyanasundaram Iyyappan
2017
ISEP – School of Engineering
Masters in Mechanical engineering

MARKET STUDY ABOUT INDIAN SEA LOGISTICS AND
ANALYSIS OF SEA SOLUTIONS BETWEEN THE COUNTRIES
OF INDIA AND PORTUGAL
Kalyanasundaram Iyyappan
1150227
Dissertation presented to ISEP – School of Engineering to fulfill the requirements
necessary to obtain a Master's degree in Mechanical Engineering, carried out under the
guidance of Maria Teresa Ribeiro Pereira
2017
ISEP – School of Engineering
Masters in Mechanical Engineering

Market study of Indian sea logistics and analysis of sea solutions between India and Portugal Kalyanasundaram Iyyappan
JURY
President
Francisco José Gomes da Silva, Professor Adjunto, Departamento de Engenharia
Mecânica, Instituto Superior Engenharia do Porto
Supervisor
Maria Teresa Ribeiro Pereira, Professor Adjunto, Departamento de Engenharia
Mecânica, Instituto Superior de Engenharia do Porto.
Second supervisor
Isabel Azeredo, General Manager, "K" Line (Portugal) S.A.
Examiner
Delfina Gabriela Garrido Ramos, Professor Adjunto, Escola Superior de Tecnologia do
Instituto Politécnico do Cavado e do Ave


Market study of Indian sea logistics and analysis of sea solutions between India and Portugal Kalyanasundaram Iyyappan
ACKNOWLEDGEMENTS
I would first like to thank my thesis advisor Maria Teresa Ribeiro Pereira at Instituto
Superior de Engenharia do Porto. The door to her office was always open whenever I
ran into a trouble spot or had a question about my research or writing. She consistently
allowed this paper to be my own work, but steered me in the right direction whenever
she thought I needed it.
I would also like to thank Isabel Azeredo, the General Manager at K Line Portugal for her
constant support, suggestions and engagement through the learning process and
formation of this dissertation.
I would like to acknowledge Mr. Franciso J.G. Silva the Co Ordinator of Mechanical
Engineering at Isep for his ideas and guidance in allowing me to choose this title for my
master dissertation.
Finally, I must express my very profound gratitude to my parents for providing me with
unfailing support and continuous encouragement throughout my years of study and
through the process of researching and writing this thesis. This accomplishment would
not have been possible without them. Thank you.

Market study of Indian sea logistics and analysis of sea solutions between India and Portugal Kalyanasundaram Iyyappan

RESUMO IX
Market study of Indian sea logistics and analysis of sea solutions between India and Portugal Kalyanasundaram Iyyappan
KEYWORDS
Shipping, transportation, import, export, port, container, sea routes
ABSTRACT
This dissertation highlights the market research and internatonal trade of goods of India.
It highlights the major import export goods traded by this country. India is an emerging
country in this field and the statistics prove that international trade is flourishing and is
expected to reach the peak in the coming years. Many Indian major ports are upgrading
to handle this cargo traffic and deal with the trade relations. This dissertation mainly
covers the import – export data relations of India with Portugal. The major goods
exchanged between both the countries is explained. This also covers India’s major
shipping companies which cover parts of Europe. Different sea routes between India
and Portugal are analyzed and an effective sea solution is provided. Different sources
have been used for the formation of this dissertation such as statistical data from
sources such as Government, research papers and K Line company’s information. Data
in international trade for the previous years is available and a collective information is
presented in the form of graphs. As the trade in India is increasing, it becomes a good
opportunity for K Line to operate a dedicated line between India and Portugal by
following a transhipment route. Although Kline performed already an Asian-Europe line,
with the following current transhipment ports of Rotterdam, London gateway,
Singapore and Colombo. Regarding the market study of Indian sea logistics, trade
between India and almost major European countries is increasing and the forecasts
predicts that it will reach the maximum in the following years. Considering the possibility
of K-line decided to operate between both countries, few suggestions in perspective of
this view is proposed.

RESUMO X
Market study of Indian sea logistics and analysis of sea solutions between India and Portugal Kalyanasundaram Iyyappan
PALAVRAS CHAVE
Transporte marítmo, importar, exportar, contentores, rotas marítimas
RESUMO
Nesta dissertação destaca-se a pesquisa de mercado e o comércio internacional de bens
da Índia. Destaca-se os principais bens de exportação de importação negociados por
este país. A Índia é um país emergente neste campo e as estatísticas demonstram que o
comércio internacional está a crescer e espera atingir o pico nos próximos anos. Muitos
dos portos principais estão a atualizar-se para lidar com o tráfego de carga e lidar com
as relações comerciais da Índia. Esta dissertação abrange principalmente as relações de
dados de importação e exportação da Índia com Portugal. São explicados os principais
bens trocados entre os dois países. Isso também cobre as principais companhias de
navegação da Índia que cobrem partes da Europa. Diferentes rotas marítimas entre a
Índia e Portugal são analisadas e uma solução eficaz do mar é fornecida. Foram utilizadas
diferentes fontes para a realização desta dissertação, tais como dados estatísticos de
fontes governamentais, documentos de pesquisa, e dados da empresa K Line. Os dados
disponíveis de comércio internacional para os últimos anos foram tratados e
apresentados, sendo a informação conjunta apresentada sob a forma de gráficos. A
Índia apresenta crescimento nas trocas comerciais com a europa, face ao volume
expectável, há uma boa oportunidade para a K Line operar uma linha da India para a
Europe e proporcionar servico frequente entre estes países. Em relação ao estudo de
Mercado da logística do mar indiano, o comércio entre a India e os princiapis paises
importadores e exportadores apresenta um aumento continuado e as previsões
prevéem que alcance o máximo para a capacidade instalada nos anos seguintes. A K-line
tem uma linha que opera a Àsia. Os atuais portos de transporte transbordo de Kline
incluem Roterdam, London gateway, Cingapura e Colombo para esta rota. Em relação
ao estudo de mercado da logística do mar indiano, o comércio entre a Índia e quase
todos os principais países europeus parceiros está aumentando e as previsões prevêem
que ele alcance o máximo nos anos seguintes, dai o potencial da criação de uma linha
Portugal e a India, e algumas sugestões em perspectiva dessa visão são propostas.

RESUMO XI
Market study of Indian sea logistics and analysis of sea solutions between India and Portugal Kalyanasundaram Iyyappan


LIST OF SYMBOLS AND ABBREVIATIONS XIII
Market study of Indian sea logistics and analysis of sea solutions between India and Portugal Kalyanasundaram Iyyappan
LIST OF SYMBOLS AND ABBREVIATIONS
List of abbreviations
Term Designation
AI All Inclusive
BAF Bunker adjust factor applied by shipping lines to reflect fluctuations
CAF Currency Adjustment Factor
CR Container Rate
TEU Twenty Foot Equivalent unit of measurement equivalent to one 20
foot shipping container
GT Gross Tonnage
FEU Forty Foot Equivalent
NT Net Tonnage
PC Per Container
THC
Terminal Handling Charge also known as container yard charge
which is payable to a shipping line either for receiving a full container
loads at the container terminal, and delivering it to the ship at the
load port
Transit Time Time for goods to be carried from one place to another
POL Petroleum, Oil & Lubricants
FY Fiscal Year
FDI Foreign Direct Investment
List of units
Term Designation
KT Kilo Ton or Metric Ton = 1000 Kilograms or 2204.6 pounds


GLOSSARY OF TERMS XV
Market study of Indian sea logistics and analysis of sea solutions between India and Portugal Kalyanasundaram Iyyappan


FIGURES INDEX XVII
Market study of Indian sea logistics and analysis of sea solutions between India and Portugal Kalyanasundaram Iyyappan
FIGURES INDEX
FIGURE 1 – MARKET FUNDAMENTALS FOR CONTAINER SHIPPING ........................................................... 27
FIGURE 2 - INDIA'S ECONOMIC GROWTH FORECAST ................................................................................. 28
FIGURE 3 - OPERATING REVENUES OF K LINE ............................................................................................ 30
FIGURE 4 - TYPES OF DATA ......................................................................................................................... 38
FIGURE 5 - STEPS INVOLVED IN MARKET RESEARCH .................................................................................. 39
FIGURE 6 - TRANSPORT OF BULK AND GENERAL CARGO ........................................................................... 47
FIGURE 7 -INTERNATIONAL MARITIME PASSAGES ..................................................................................... 47
FIGURE 8 - PROCESS FOR SELECTION OF MONITORING DEVICES .............................................................. 51
FIGURE 9 - MAJOR PORTS OF INDIA ........................................................................................................... 55
FIGURE 10 - TONNAGE AT MAJOR INDIAN PORTS ..................................................................................... 56
FIGURE 11 - TEU VOLUMES AT LARGEST INDIAN PORTS ............................................................................ 56
FIGURE 12 - CARGO TRAFFIC AT MAJOR PORTS ......................................................................................... 57
FIGURE 13 - CARGO TRAFFIC HANDLED AT MAJOR PORTS ........................................................................ 58
FIGURE 14 - CARGO TRAFFIC AT NON-MAJOR PORTS ................................................................................ 59
FIGURE 15 - CARGO TRAFFIC HANDLED BY MAJOR AND NON MAJOR PORTS OF INDIA ........................... 61
FIGURE 16 - PERCENTAGE SHARE OF PORTS .............................................................................................. 62
FIGURE 17 - TRAFFIC HANDLED AT MAJOR PORTS ..................................................................................... 62
FIGURE 18 - EU-INDIA TRADE IN GOODS .................................................................................................... 70
FIGURE 19 - EU-INDIA TRADE IN SERVICES ................................................................................................. 71
FIGURE 20 - EU-INDIA FOREIGN DIRECT INVESTMENT ............................................................................... 71
FIGURE 21 - EUROPEAN TRADE FLOWS AND BALANCES ............................................................................ 72
FIGURE 22 - INDIA EXPORT AND IMPORT WITH PORTUGAL ...................................................................... 75
FIGURE 23 - INDIA'S EXPORTS TO PORTUGAL ............................................................................................ 76
FIGURE 24 - INDIA IMPORTS FROM PORTUGAL ......................................................................................... 77
FIGURE 25 - K LINE ROUTE FROM LISBON TO CHENNAI ............................................................................. 84


TABLES INDEX XIX
Market study of Indian sea logistics and analysis of sea solutions between India and Portugal Kalyanasundaram Iyyappan
TABLES INDEX
TABLE 1 - CARGO TRAFFIC HANDLED BY MAJOR AND NON MAJOR PORTS OF INDIA (2001-2002 TO 2016-
2017 UPTO SEPTEMBER 2016) .......................................................................................................... 60
TABLE 2 - INDIA SERVICE TRADE DATA ....................................................................................................... 67
TABLE 3 - TRADE EXCHANGE BETWEEN INDIA AND PORTUGAL ................................................................ 74
TABLE 4 - INDIAN EXPORT AND IMPORTS WITH PORTUGAL ...................................................................... 75
TABLE 5 - SWOT ANALYSIS OF INDIA'S TRADE ............................................................................................ 78
TABLE 6 - CHIEF SHIPPING ROUTES OF THE WORLD .................................................................................. 82

INDEX XXI
Market study of Indian sea logistics and analysis of sea solutions between India and Portugal Kalyanasundaram Iyyappan
INDEX
1 INTRODUCTION 27
1.1 Scope .......................................................................................................................................... 27
1.2 Objectives ................................................................................................................................... 27
1.3 Methodology .............................................................................................................................. 28
1.4 Company History synthesis ......................................................................................................... 29
1.5 Dissertation Organisation ........................................................................................................... 30
2 BIBLIOGRAPHIC WORK 35
2.1 Market Research Definitions ...................................................................................................... 35
2.2 Qualitative and Quantitative market research ............................................................................ 35
2.2.1 Qualitative research 35
2.2.2 Quantitative Research 36
2.2.3 Market Research Methods 36
2.2.4 Why do we do Market Research 36
2.2.5 Successful Market Research 37
2.2.6 The Importance of Market Research 38
2.2.7 Market Research Challenges 38
2.2.8 Steps for market research 39
2.3 Port Regulation ........................................................................................................................... 40
2.3.1 Port Regulation in Europe 41
2.3.2 Port Regulations in India 43
2.4 The importance of shipping ........................................................................................................ 44
2.4.1 Freight market 45
2.4.2 Concept of Parcel Size Distribution 46
2.4.3 International Maritime Passages 47
2.5 Containers in shipping industry .................................................................................................. 50
3 INDIAN SHIPPING INDUSTRY AND MAJOR PORTS 54
3.1 Major Shipping Industries ........................................................................................................... 54
3.2 Indian Ports ................................................................................................................................ 55

INDEX XXII
Market study of Indian sea logistics and analysis of sea solutions between India and Portugal Kalyanasundaram Iyyappan
3.3 Port Traffic .................................................................................................................................. 62
3.4 Road Ahead for Indian Ports ....................................................................................................... 63
3.5 Market study Of Indian Sea Logistics .......................................................................................... 64
3.5.1 Indian Exports 65
3.5.2 Indian Imports 65
3.5.3 India’s top 10 International Trade Data 67
3.6 India’s Trade Relation with Europe ............................................................................................. 69
3.7 Portugal trade with India ............................................................................................................ 73
3.7.1 India Exports to Portugal 76
3.7.2 India’s Import From Portugal 76
3.8 SWOT Analysis Of Indian Import Export ...................................................................................... 78
3.8.1 Strengths 78
3.8.2 Weakness 79
3.8.3 Opportunities 79
3.8.4 Threats 80
3.9 Sea Routes Between India and Portugal ..................................................................................... 81
3.9.1 Direct Vs Transhipment Services 81
3.9.2 Sea Routes between Portugal to India 82
3.9.3 Advantages and disadvantages of Direct & Trans-shipment 84
3.10 Highlights of K Line concerning Portugal and India trade ............................................................ 85
4 CONCLUSIONS AND PROPOSALS OF FUTURE WORKS 89
4.1 CONCLUSIONS ............................................................................................................................ 89
4.1.1 Market study of India 89
4.1.2 Effective sea route between Portugal and India 89
4.2 Proposals of Future Works .......................................................................................................... 90
5 REFERENCES AND OTHER SOURCES OF INFORMATION 95
5.1 Websites ..................................................................................................................................... 95
5.2 Research papers ......................................................................................................................... 95
6 ANNEXES 103
6.1 Cargo traffic handled by major and non-major ports of India ................................................... 103

INDEX XXIII
Market study of Indian sea logistics and analysis of sea solutions between India and Portugal Kalyanasundaram Iyyappan
6.2 Cargo handled at major ports ................................................................................................... 105
6.3 Exports & Imports Trade data ................................................................................................... 111
6.4 India’s top 10 imports for 2016-2017 ........................................................................................ 112
6.5 India’s top 10 exports for 2016-2017 ........................................................................................ 113
6.6 India’s trade with major countries ............................................................................................ 114
6.7 Top 10 major export companies of India................................................................................... 115
6.8 Key Figure’s of India’s trade relation with Europe .................................................................... 116
6.9 Total goods: EU trade flows and balance .................................................................................. 117
6.10 Goods exported from India to Portugal .................................................................................... 118
6.11 Goods Imported to India from Portugal .................................................................................... 124
6.12 Sea Route from Leixoes to Indian Ports .................................................................................... 134
6.13 Sea Routes from Lisbon to Indian Ports .................................................................................... 138
6.14 Sea Routes from Sines to Indian Ports ...................................................................................... 141

25
INTRODUCTION
1.1 Scope
1.2 Objectives
1.3 Methodology
1.4 Company History synthesis
1.5 Dissertation Organisation


INTRODUCTION 27
Market study of Indian sea logistics and analysis of sea solutions between India and Portugal Kalyanasundaram Iyyappan
1 INTRODUCTION
1.1 Scope The shipping industry is one of the oldest industries and in today’s present day plays a
major role in the modern society. Today, over 55000 cargo ships (International Chamber
of Shipping, 2017) are active in the international trade. The shipping industry is the
foundation for global commerce, transporting about 60 percent (World Shipping
Council) of world trade in a cost effective and reliable manner. Often international
exports are most transported by sea. The necessity for shipping bigger volumes of cargo
with less time is of major demand and most attracted in the globalised economy, which
has led to the construction of mega vessels which can carry huge amounts of goods at
once.
It can be observed from the above graph that, the demand for container shipping grew
by around 2.7% in 2016 from a negative value of -10% during the period of 2009 and the
peak of around 13% in 2010. The supply for containers however did not attain a negative
value as there is constant trade of goods. The highest supply was during the period of
2006 with a value of 17% but it was only 2% during 2016. With the rising demand for
global trade in these days, service providers should make use of this opportunity and
increase their revenues.
1.2 Objectives
The main aim of this thesis is to understand the market of India consisting of Import and
Export of goods to the global market. India is a country of increasing international trade
and trade relations with different countries is strengthening. This paper describes the
list of goods traded by different countries and trade relation with Portugal is given a
Figure 1 – Market fundamentals for container shipping
Source: Bimco, Clarksons- Container shipping report
2017
INTRODUCTION 28
Market study of Indian sea logistics and analysis of sea solutions between India and Portugal Kalyanasundaram Iyyappan
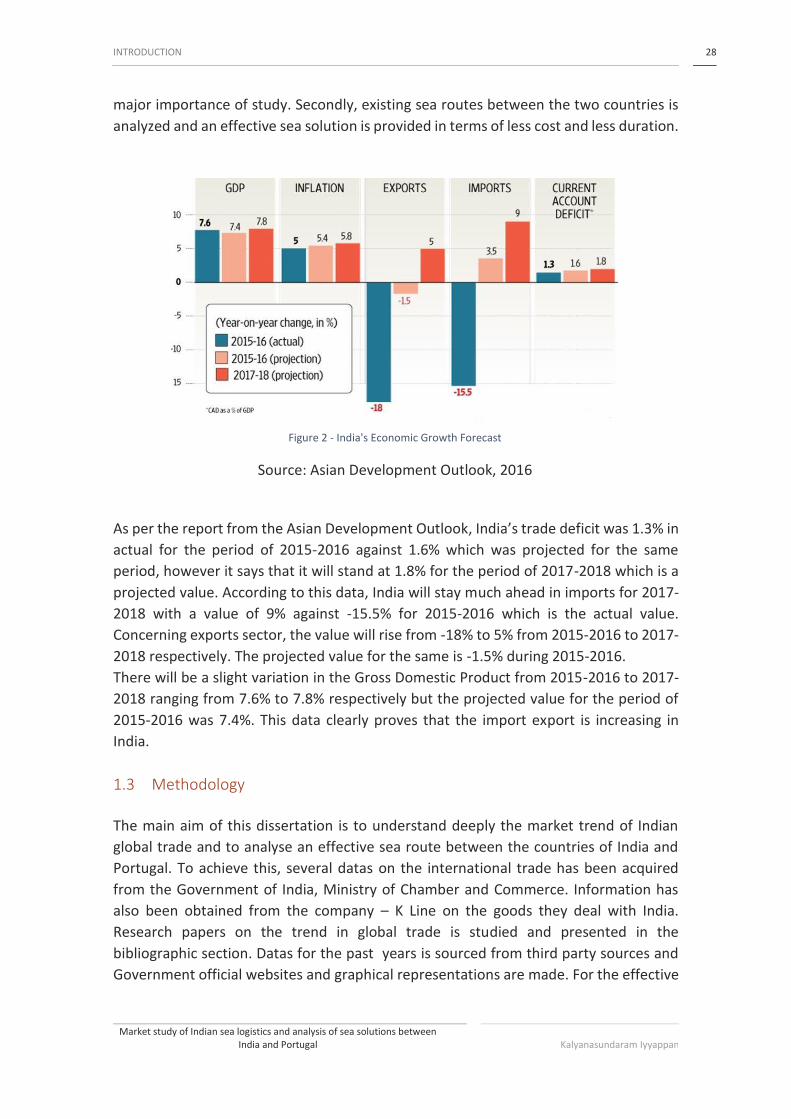
major importance of study. Secondly, existing sea routes between the two countries is
analyzed and an effective sea solution is provided in terms of less cost and less duration.
As per the report from the Asian Development Outlook, India’s trade deficit was 1.3% in
actual for the period of 2015-2016 against 1.6% which was projected for the same
period, however it says that it will stand at 1.8% for the period of 2017-2018 which is a
projected value. According to this data, India will stay much ahead in imports for 2017-
2018 with a value of 9% against -15.5% for 2015-2016 which is the actual value.
Concerning exports sector, the value will rise from -18% to 5% from 2015-2016 to 2017-
2018 respectively. The projected value for the same is -1.5% during 2015-2016.
There will be a slight variation in the Gross Domestic Product from 2015-2016 to 2017-
2018 ranging from 7.6% to 7.8% respectively but the projected value for the period of
2015-2016 was 7.4%. This data clearly proves that the import export is increasing in
India.
1.3 Methodology
The main aim of this dissertation is to understand deeply the market trend of Indian
global trade and to analyse an effective sea route between the countries of India and
Portugal. To achieve this, several datas on the international trade has been acquired
from the Government of India, Ministry of Chamber and Commerce. Information has
also been obtained from the company – K Line on the goods they deal with India.
Research papers on the trend in global trade is studied and presented in the
bibliographic section. Datas for the past years is sourced from third party sources and
Government official websites and graphical representations are made. For the effective
Figure 2 - India's Economic Growth Forecast
Source: Asian Development Outlook, 2016

INTRODUCTION 29
Market study of Indian sea logistics and analysis of sea solutions between India and Portugal Kalyanasundaram Iyyappan
routings, datas are taken from the company’s offical website and the pricing for the
same is obtained through mail from the respective departments of the service provider.
1.4 Company History synthesis
Kawasaki Kisen Kaisha, Ltd. Also referred to as “K” Line, is one of the largest Japanese
transportation companies which owns and controls large cargo ships, including dry cargo
ships (bulk carriers), container ships, container terminals, liquefied natural gas carriers,
ro-ro ships and tankers.
It is the sixteenth largest container transportation and shipping company in the world.
“K” Line (Europe) Ltd is the European subsidiary of global Japanese Shipping and logistics
company, Kawasaki Kishen Kaisha, Ltd, known as “K” Line. Headquartered in London,
UK, “K” Line (Europe) Ltd is responsible for all business activities in Europe, the
Mediterranean and North Africa.
With a network of owned offices and well established agents across the region, “K” Line
(Europe) Ltd is committed to providing safe, cost effective and environmentallu friendly
shipping services for all types of cargo.
As an integrated logistics company grown from shipping business, the “K” Line Group
contributes to society so that people live well and prosperously. The aim includes
becoming an important infrastructure for global society, and to be the best partner with
customers by providing the high-quality logistics services based on customer first policy.
The company recognizes the following to respond to business environmental change.
• Maximize strengths to ensure competitiveness
• Transform business portfolio to reduce influence from market volatility
• Achieve growth by technological and business model innovation
The company’s operating revenues consolidated during the Fiscal year 2016, was
¥1030.2 billion and the company suffered a loss of ¥52.4 billion due to historical fall in
the containership and dry bulk carriers as well as in the difficult conditions of the car
carrier market. In the containership segment, the market conditions reached the lowest
point at the beginning of 2016 which caused the earnings to deteriorate by ¥38 millions.
The total number of vessels in operation (consolidated) was 575 during the same year
& the number of employees working was 8097 people. The “K” Line group promotes
proactive initiatives as a group of companies to contribute to the realization of a better
society by working to resolve issues in each of the areas that it has identified as a
material such as building a management structure that emphasizes social responsibility
which include methods and steps that improve corporate value by consistently
implementing initiatives for the realization of its corporate principles and vision. It
manages the impact of business activities in a way such that it promotes business.

INTRODUCTION 30
Market study of Indian sea logistics and analysis of sea solutions between India and Portugal Kalyanasundaram Iyyappan
1.5 Dissertation Organisation
Regarding the presentation of this dissertation, it is been divided into six parts namely:
Chapter 1 presents the Introduction, scope of this thesis, the different methedologies
used in the formation of the practical work such as data acquisition from the company,
Government sources and other research papers which enables to compare the results
and use it for comparison between different countries and the total trade done between
them. This section also includes the company history synthesis, their formation and
nature of business which is currently operated.
Chapter 2 involves the bibliographic work in which history of the international trade is
discussed, formation of ports and the regulations imposed on it by respective
Government. This section also discusses the history of sea route between India and
Portugal. Supply chain management for containers is presented and a technology which
enables it to monitoring is also presented.
Chapter 3 is the major framework on the practical section which explains the shipping
companies of India which ship to Europe, major Indian ports and the cargo traffic and
port traffic handled by them and a summary in the form of Porters Five force Analysis is
presented. In the next section, a market study of Indian sea logistics which is the major
topic of this dissertation is presented. Import Export data is summarised and major trade
between India and Portugal is given a major importance. India’s major trade relations
such as top 10 international trade data, top 10 imports and exports for the period of
2016-2017 and India’s major export companies is discussed. A SWOT analysis for the
Indian Export Import is summarised. In the last section of this chapter, sea routes
between India and Portugal is presented and comparison between direct and trans-
shipment is given.
Chapter 4 gives the conclusions of the market study of India and an effective sea route
between Portugal and India is discussed. Market study of India is deeply discussed
1331 1244.3
838985.1 972.3
1134.8 1224.1 1352.4 1243.91030.2
0
500
1000
1500
2007 2008 2009 2010 2011 2012 2013 2014 2015 2016
Operating Revenues, Ordinary Income in billions of Yen
Operating Revenues, Ordinary Income in billions of Yen
Figure 3 - Operating Revenues Of K Line

INTRODUCTION 31
Market study of Indian sea logistics and analysis of sea solutions between India and Portugal Kalyanasundaram Iyyappan
between India and Portugal and a conclusion for the future is summarised and for the
analysis of sea route an effective sea solution is provided. Also, suggestions for future
work is presented.
Chapter 5 presents the references from which information and datas for the
bibliographic work and practical work is taken. Different sources include research
papers, websites and third party sources from which information is sourced.
Chapter 6 is the annexure part which summarises the data for the practical section of
chapter 3, and a detailed review of the data is presented in this section.


33
<TÍTULO DA TESE> <NOME DO AUTOR>
BIBLIOGRAPHIC WORK
2.1 Market Research Definitions
2.2 Qualitative and Quantitative market research
2.2.1 Qualitative research
2.2.2 Quantitative Research
2.2.3 Market Research Methods
2.2.4 Why do we do Market Research
2.2.5 Successful Market Research
2.2.6 The Importance of Market Research
2.2.7 Market Research Challenges
2.2.8 Steps for market research
2.3 Port Regulation
2.3.1 Port Regulation in Europe
2.3.2 Port Regulations in India
2.4 The importance of shipping
2.4.1 Freight market
2.4.2 Concept of Parcel Size Distribution
2.4.3 International Maritime Passages
2.5 Containers in shipping industry


BIBLIOGRAPHIC WORK 35
Market study of Indian sea logistics and analysis of sea solutions between India and Portugal Kalyanasundaram Iyyappan
2 BIBLIOGRAPHIC WORK
2.1 Market Research Definitions
Market research can be defined as the process of gathering, analyzing and interpreting
information about a market, about a product or service to be offered, needs of
business’s target market, and the particular competitors in competition. (Gupta &
Benedett, 2007). This research provides data which will help in solving market
challenges that business will likely face and this is considered as an integral part of the
business planning process. Strategies such as market segmentation which includes
identification of specific groups within a market and product differentiation such as
creation of identity for a product or service that seperates it from the competitors
cannot be developed without market research (Nevo, 2001). The process of assessing
the feasibility of a new product or service includes techniques such as surveys, product
testing and focus groups.
The area of market research allows a company or organization to discover the target
market and competitors and the requirements and thoughts of consumers about the
particular product and service before it becomes available to the public (Van Den &
Joshi, 2007). This may be conducted either by the company or by a third-party company
or organisation that specialises in market research. The market of market research is to
acquire and the process of primary and secondary data information about customers
attitude and behavior and the product demand (McDonald, 2002). The purpose of
market research proposed by Van & Fok,(2009) is as follows: understanding of markets,
identify changes in the market, improve market awareness, understand customer
needs, reduce the risk and uncertainity, anticipate and forecast market trends and
provide a strong basis for marketing decisions.
2.2 Qualitative and Quantitative market research
The difference between the primary and secondary research is the different sources of
available market information which include the qualitative or quantitative methods.
2.2.1 Qualitative research
This research means ‘quality’ and does not include ‘quality.’ Qualitative research
methods includes talking to a relatively few people in the target audience of interest.
The purpose of qualitative research is to understand the depths and range of buying
attitudes, project or forecast quantity. (Barabba & Zaltman, 1991). Popular qualitative
market research includes focus group studies, interviews and observational techniques
such as ethnography and popular in marketing research, photo-ethnography (Creswell,
2003). This refers to “market survey” method because it offers a way to measure the

BIBLIOGRAPHIC WORK 36
Market study of Indian sea logistics and analysis of sea solutions between India and Portugal Kalyanasundaram Iyyappan
market in terms of depth and range of buying perceptions and needs rather than
quantity. The quality and validity of market surveys is judged by the design, interviewing
surveys of the moderator or principal interviewer, and the interpretation of results by
the market research consultant or analyst.
The Qualitative research is based on opinions, attitudes, beliefs, and intentions. This
type of research deals with questions such as “Why”? “Would?”, or “How?”. Qualitative
research aims to understand why customers approach in a certain way or how they
respond to a new product or service. Given that these opinions are often obtained from
small numbers of people or groups, the findings are not necessarily statistically valid.
However, these data can highlight potential issues which can be explored in quantitative
research. The common methods in this research include focus groups and interviews to
collect the data. The data obtained may prove revealing and useful, but can prove costly
and time- consuming to collect, particularly for a start-up or small business (Creswell,
2003).
2.2.2 Quantitative Research
This research method aims to gauge quantity. With the use of sampling strategies,
quantitative market research methods seek to project results of a quantitative market
survey to the marketplace. Popular quantitative market survey methods include online
surveys, personal quantitative interviews, mail surveys, and telephonic surveys.
“Hybrid” research refers to the combination of marketing research survey
tools.(Bush.et.al, 2006). Normally, this is research based on larger samples for more
statistically valid methods. Quantitative research is related with data and questions such
as “how many?”, “how often”, “who?”, “when”? and “where?”.
2.2.3 Market Research Methods
There are two types of collecting data, primary data and secondary data. Secondary data
are those which were previously collected for some other research purposes. This type
of data is easily accessible, inexpensive, quickly obtainable and is used for the collection
of primary data, for example, a population census. Hence, the examination of secondary
data is a pre-requisite to the collection of primary data. However, due to the fact that
secondary data was collected for some other purpose, their usefulness to the problem
at hand may be limited. Primary data may be qualitative or quantitative in nature
(Jarowski.et.al, 2000).
2.2.4 Why do we do Market Research
Market Research is important for every business, and cannot be a one-off activity.
Successful businesses conduct research on a continual basis to keep pace with the
market trends and to maintain a competitive edge. Regardless of whether starting or

BIBLIOGRAPHIC WORK 37
Market study of Indian sea logistics and analysis of sea solutions between India and Portugal Kalyanasundaram Iyyappan
expanding the business, market research is important in understanding the target
market and increasing sales (Blind.et.al, 2009). Several issues need to highlight before a
market research to be implemented. The issues are as follows:
• Identify potential customers
This is the stage to identify who is going to use the product/service? How old are
they? Are they male or female? Are they married, single or divorced? Do they
have children? Where do they live? What is their level of education? (Barabba &
Zaltman, 1991)
• Understanding the existing customers
Why do customers choose this product or service over competitors? What do
they value? Is it service, product quality or the prestige associated with
consumption of the product/service? Who influences the buying decision? What
sources do they refer?
• Set Realistic targets
From information collected, realistic targets can be set for areas such as growth,
sales and the introduction of new products or services.
• Identify Business opportunities
The research data can identify new business opportunities and can open area in
the un-serviced or under-serviced market. This can help to identify changing
market trends in areas such as population shifts, increasing levels of education
or leisure time which can help to bring new opportunities(Barabba & Gerald,
1991).
2.2.5 Successful Market Research
The market research helps to understand the market, customers, competitors and
industry trends. High quality research reveals details such as current customers and will
help target new customers (Balmer, 2001). For example, to operate organic produce
market, it is important to find out if there is a demand for food grown without pesticides
and whether customers can afford or willing to pay more. Market research involves two
types of data which are shown in the figure below:

BIBLIOGRAPHIC WORK 38
Market study of Indian sea logistics and analysis of sea solutions between India and Portugal Kalyanasundaram Iyyappan
Source : Balmer, 2001
2.2.6 The Importance of Market Research
Market Research focuses your marketing strategy on potential customers that want
your product or service. Small and local businesses may find researching their market
easier than large, nationwide businesses because the customer base is smaller. Timely
information reduces business risks and helps sales and operation opportunities. An
important phase is present where it is important to identify current challenges and
potential problems in the current market, and a proper plan and strategy needs to be
developed. This phase will help to understand the market, customers, competitors, and
industry trends. The High-quality research will reveal details about the present
customers and this will help the new operator to target the new customers.
2.2.7 Market Research Challenges
There are several challenges in conducting market research which is sourced from
Dekeba & Alemayehu in 2003 which involves the following:
• Objectives unclear, leading to conflicting or unrealistic expectations. This often
is due to imprecise or many goals.
• Consumer cannot easily express how they feel
• Sometimes data providers are not strategic advisors.
• Sample has quality issues are participants are not sufficiently qualified or
authenticated or does not pay adequate attention or required sample size is not
fulfilled.
Figure 4 - Types of Data

BIBLIOGRAPHIC WORK 39
Market study of Indian sea logistics and analysis of sea solutions between India and Portugal Kalyanasundaram Iyyappan
• Instrument is poorly designed. Long, complicated questionnaire design confuses
participants with awkward question sequences and poor answer options.
• Data analysis is conducted with more attention to techniques than results and
either of the choices of analytics is poor or is misaligned with client needs.
• Poor matching of methodology and customer needs with the incorrect usage of
qualitative or quantitative methods.
• Schedules slip significantly and the research is completed too late to support the
intended decisions.
• Internal clients are unable to apply the research as originally intended; “action-
ability” of research.
• Programming for online or telephone data collection is done hastily and
questionnaire logic is not enforced or not approved by the client. The entire
question is missing or answers are not properly presented.
• Research reports may contain shocking errors.
• Client-agency relationship is unproductive or strained which causes
miscommunication and conflicts.
2.2.8 Steps for market research
The below diagram describes the appropriate steps for market research based on
Creswell & John (2003).
• Define the objective & Problem
This is the most important step in the market research process which defines the
goals of the project. The core of this step is to understand the root question that
needs to be informed by market research. There is typically a key business
problem or an opportunity that needs to be acted upon and there is a lack of
information to make the decision comfortable and the job of a market researcher
is to inform that decision with solid data. (Bakery & Thamer, 2006).
• Determine Research Design
The second step is the objective of research and this involves type of research
and duration to collect primary data. Proper research design need to be plan and
this invloves survey, focus groups and other variables.
Figure 5 - Steps involved in market research

BIBLIOGRAPHIC WORK 40
Market study of Indian sea logistics and analysis of sea solutions between India and Portugal Kalyanasundaram Iyyappan
• Design & Prepare Research Instrument
This step of market research process involves the use of appropriate research
tool.
• Data Collection
This is the important dimension step that wil invlove administering the research
questions, and observations through the data collection and by recording
questionnaires.
• Analyze Data
The step that comes after the data has been collected is to analyze and this
process may invlove the statistical tools cush as SPSS, SEM or Rasch technique.
• Visualize Data and Communicate Results
The result of the finding will help an individual or industry to identify the possible
solution to overcome any shortcoming before the product or service is
introduced.
2.3 Port Regulation
The importance of logistics and trade infrastructure cannot be underestimated in the
perspective of structural changes. Countries with reformed port management and with
heavy investment in trade infrastrucutre, opened the logistics market to foreign
investors to help gain a profitable global trade. China is a great example in which
manufacturing growth and foreign direct investments went in par with large scale
transport infrastructure investments, followed by Singapore, Korea, Japan and Taiwan.
Upgrading of the logistics perfomance of a country cannot be reduced just to investment
in physical infratsructure and the application of Information and communication
technologies but also to regulatory and procedural issues regarding to to the areas in
global shipping and international trade and the management of ports and related
infrastructure. According to World Bank(2010), those countries with the logistics
perfomance in a best manner experience 1 per cent growth in GDP and 2 per cent in
trade as a result. Low income countries are exepmted due to the lack of financial
methods to invest in infrastructure and regulatory procedures, but policies such as
liberalized logistics services and port/terminal management and improved customs
procedures can help in the difference. The factor which plays a major role is the
commodities shipped. Large bulk volumes such as ore or crude oil which are being
shipped on a point-to-point basis are much more dependent on global shifts in demand
and price fluctuations, but containers specialised in merchandise (e.g. electronics
components) is far more sensitive to reliability in delivery. However in some cases,
maintanence of relatively high inventory costs to incur costs of rapid and reliable
transportation is more economic.
BIBLIOGRAPHIC WORK 41
Market study of Indian sea logistics and analysis of sea solutions between India and Portugal Kalyanasundaram Iyyappan
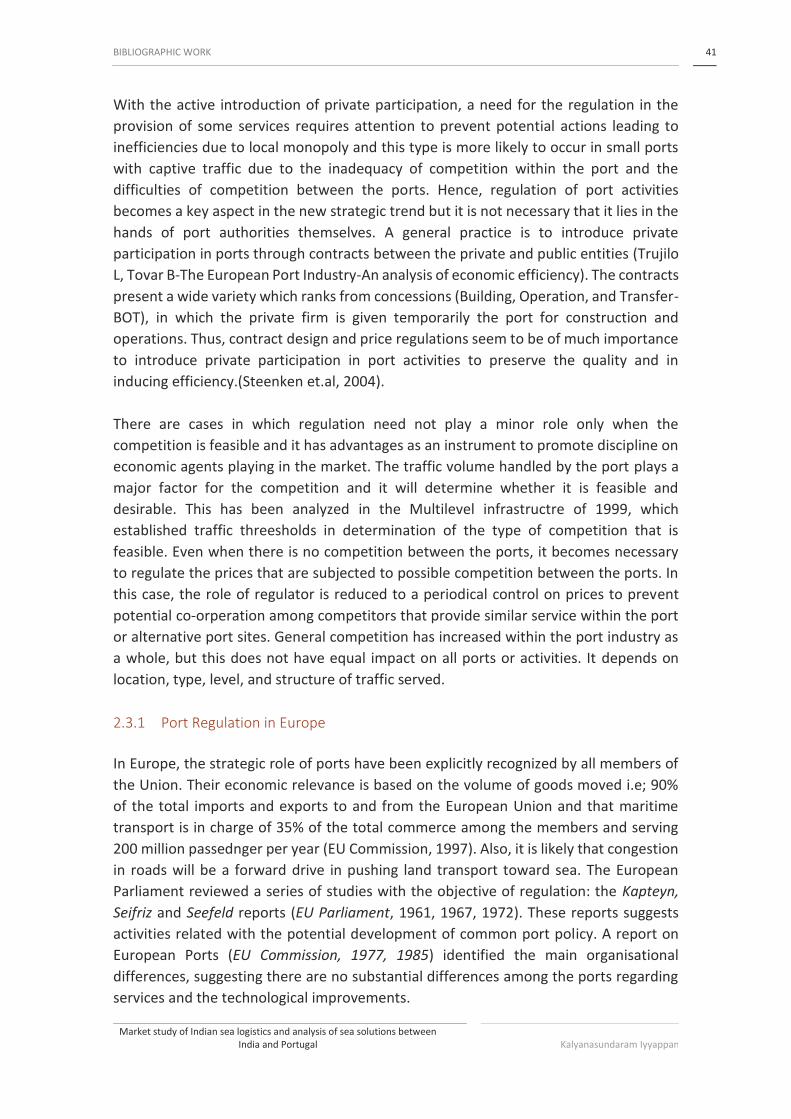
With the active introduction of private participation, a need for the regulation in the
provision of some services requires attention to prevent potential actions leading to
inefficiencies due to local monopoly and this type is more likely to occur in small ports
with captive traffic due to the inadequacy of competition within the port and the
difficulties of competition between the ports. Hence, regulation of port activities
becomes a key aspect in the new strategic trend but it is not necessary that it lies in the
hands of port authorities themselves. A general practice is to introduce private
participation in ports through contracts between the private and public entities (Trujilo
L, Tovar B-The European Port Industry-An analysis of economic efficiency). The contracts
present a wide variety which ranks from concessions (Building, Operation, and Transfer-
BOT), in which the private firm is given temporarily the port for construction and
operations. Thus, contract design and price regulations seem to be of much importance
to introduce private participation in port activities to preserve the quality and in
inducing efficiency.(Steenken et.al, 2004).
There are cases in which regulation need not play a minor role only when the
competition is feasible and it has advantages as an instrument to promote discipline on
economic agents playing in the market. The traffic volume handled by the port plays a
major factor for the competition and it will determine whether it is feasible and
desirable. This has been analyzed in the Multilevel infrastructre of 1999, which
established traffic threesholds in determination of the type of competition that is
feasible. Even when there is no competition between the ports, it becomes necessary
to regulate the prices that are subjected to possible competition between the ports. In
this case, the role of regulator is reduced to a periodical control on prices to prevent
potential co-orperation among competitors that provide similar service within the port
or alternative port sites. General competition has increased within the port industry as
a whole, but this does not have equal impact on all ports or activities. It depends on
location, type, level, and structure of traffic served.
2.3.1 Port Regulation in Europe
In Europe, the strategic role of ports have been explicitly recognized by all members of
the Union. Their economic relevance is based on the volume of goods moved i.e; 90%
of the total imports and exports to and from the European Union and that maritime
transport is in charge of 35% of the total commerce among the members and serving
200 million passednger per year (EU Commission, 1997). Also, it is likely that congestion
in roads will be a forward drive in pushing land transport toward sea. The European
Parliament reviewed a series of studies with the objective of regulation: the Kapteyn,
Seifriz and Seefeld reports (EU Parliament, 1961, 1967, 1972). These reports suggests
activities related with the potential development of common port policy. A report on
European Ports (EU Commission, 1977, 1985) identified the main organisational
differences, suggesting there are no substantial differences among the ports regarding
services and the technological improvements.
BIBLIOGRAPHIC WORK 42
Market study of Indian sea logistics and analysis of sea solutions between India and Portugal Kalyanasundaram Iyyappan
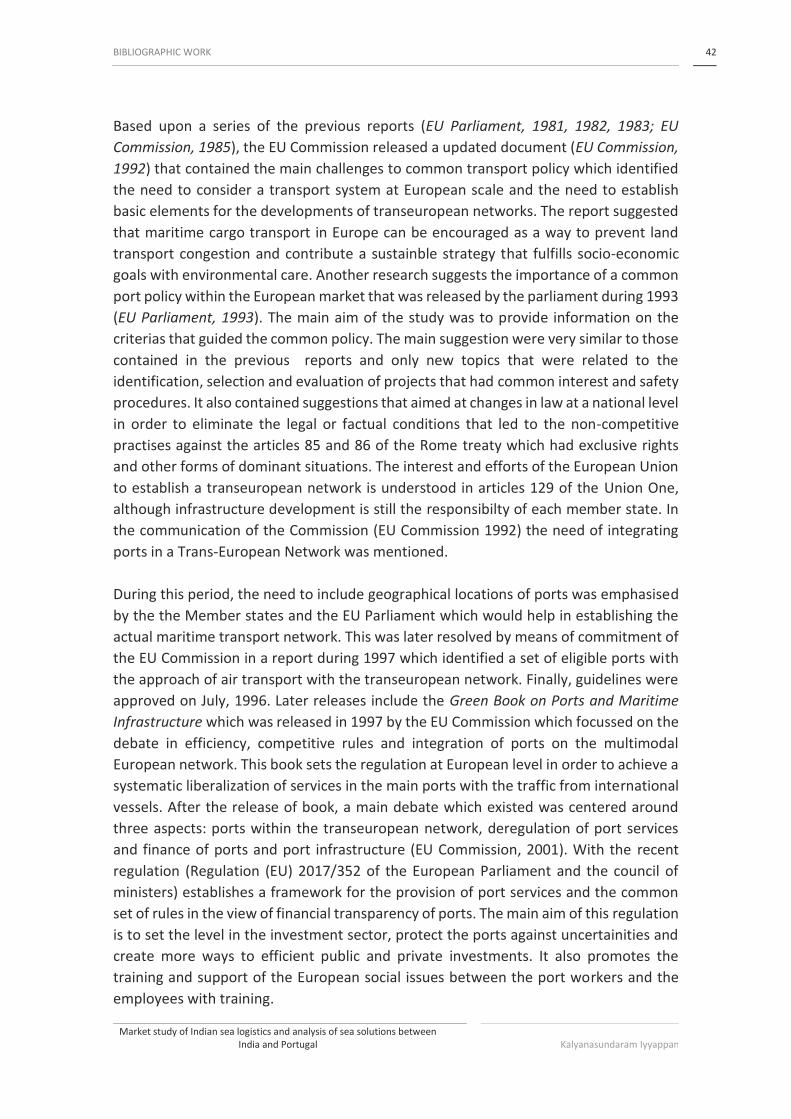
Based upon a series of the previous reports (EU Parliament, 1981, 1982, 1983; EU
Commission, 1985), the EU Commission released a updated document (EU Commission,
1992) that contained the main challenges to common transport policy which identified
the need to consider a transport system at European scale and the need to establish
basic elements for the developments of transeuropean networks. The report suggested
that maritime cargo transport in Europe can be encouraged as a way to prevent land
transport congestion and contribute a sustainble strategy that fulfills socio-economic
goals with environmental care. Another research suggests the importance of a common
port policy within the European market that was released by the parliament during 1993
(EU Parliament, 1993). The main aim of the study was to provide information on the
criterias that guided the common policy. The main suggestion were very similar to those
contained in the previous reports and only new topics that were related to the
identification, selection and evaluation of projects that had common interest and safety
procedures. It also contained suggestions that aimed at changes in law at a national level
in order to eliminate the legal or factual conditions that led to the non-competitive
practises against the articles 85 and 86 of the Rome treaty which had exclusive rights
and other forms of dominant situations. The interest and efforts of the European Union
to establish a transeuropean network is understood in articles 129 of the Union One,
although infrastructure development is still the responsibilty of each member state. In
the communication of the Commission (EU Commission 1992) the need of integrating
ports in a Trans-European Network was mentioned.
During this period, the need to include geographical locations of ports was emphasised
by the the Member states and the EU Parliament which would help in establishing the
actual maritime transport network. This was later resolved by means of commitment of
the EU Commission in a report during 1997 which identified a set of eligible ports with
the approach of air transport with the transeuropean network. Finally, guidelines were
approved on July, 1996. Later releases include the Green Book on Ports and Maritime
Infrastructure which was released in 1997 by the EU Commission which focussed on the
debate in efficiency, competitive rules and integration of ports on the multimodal
European network. This book sets the regulation at European level in order to achieve a
systematic liberalization of services in the main ports with the traffic from international
vessels. After the release of book, a main debate which existed was centered around
three aspects: ports within the transeuropean network, deregulation of port services
and finance of ports and port infrastructure (EU Commission, 2001). With the recent
regulation (Regulation (EU) 2017/352 of the European Parliament and the council of
ministers) establishes a framework for the provision of port services and the common
set of rules in the view of financial transparency of ports. The main aim of this regulation
is to set the level in the investment sector, protect the ports against uncertainities and
create more ways to efficient public and private investments. It also promotes the
training and support of the European social issues between the port workers and the
employees with training.
BIBLIOGRAPHIC WORK 43
Market study of Indian sea logistics and analysis of sea solutions between India and Portugal Kalyanasundaram Iyyappan
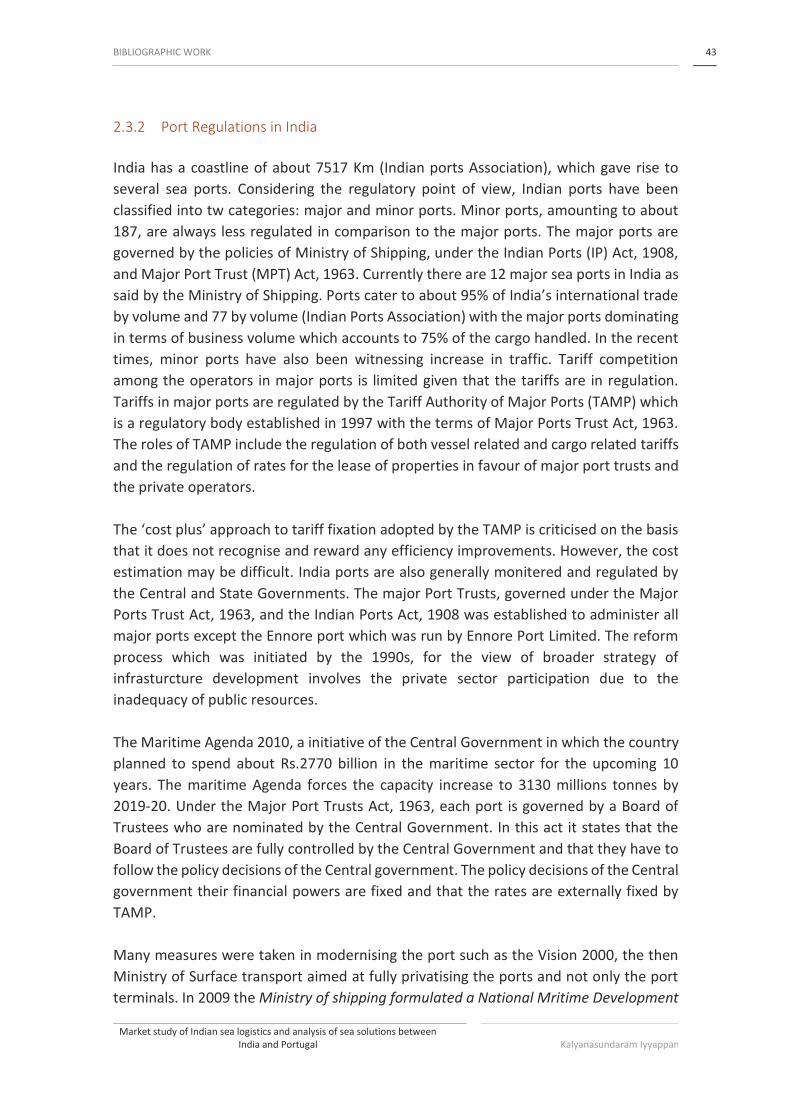
2.3.2 Port Regulations in India
India has a coastline of about 7517 Km (Indian ports Association), which gave rise to
several sea ports. Considering the regulatory point of view, Indian ports have been
classified into tw categories: major and minor ports. Minor ports, amounting to about
187, are always less regulated in comparison to the major ports. The major ports are
governed by the policies of Ministry of Shipping, under the Indian Ports (IP) Act, 1908,
and Major Port Trust (MPT) Act, 1963. Currently there are 12 major sea ports in India as
said by the Ministry of Shipping. Ports cater to about 95% of India’s international trade
by volume and 77 by volume (Indian Ports Association) with the major ports dominating
in terms of business volume which accounts to 75% of the cargo handled. In the recent
times, minor ports have also been witnessing increase in traffic. Tariff competition
among the operators in major ports is limited given that the tariffs are in regulation.
Tariffs in major ports are regulated by the Tariff Authority of Major Ports (TAMP) which
is a regulatory body established in 1997 with the terms of Major Ports Trust Act, 1963.
The roles of TAMP include the regulation of both vessel related and cargo related tariffs
and the regulation of rates for the lease of properties in favour of major port trusts and
the private operators.
The ‘cost plus’ approach to tariff fixation adopted by the TAMP is criticised on the basis
that it does not recognise and reward any efficiency improvements. However, the cost
estimation may be difficult. India ports are also generally monitered and regulated by
the Central and State Governments. The major Port Trusts, governed under the Major
Ports Trust Act, 1963, and the Indian Ports Act, 1908 was established to administer all
major ports except the Ennore port which was run by Ennore Port Limited. The reform
process which was initiated by the 1990s, for the view of broader strategy of
infrasturcture development involves the private sector participation due to the
inadequacy of public resources.
The Maritime Agenda 2010, a initiative of the Central Government in which the country
planned to spend about Rs.2770 billion in the maritime sector for the upcoming 10
years. The maritime Agenda forces the capacity increase to 3130 millions tonnes by
2019-20. Under the Major Port Trusts Act, 1963, each port is governed by a Board of
Trustees who are nominated by the Central Government. In this act it states that the
Board of Trustees are fully controlled by the Central Government and that they have to
follow the policy decisions of the Central government. The policy decisions of the Central
government their financial powers are fixed and that the rates are externally fixed by
TAMP.
Many measures were taken in modernising the port such as the Vision 2000, the then
Ministry of Surface transport aimed at fully privatising the ports and not only the port
terminals. In 2009 the Ministry of shipping formulated a National Mritime Development

BIBLIOGRAPHIC WORK 44
Market study of Indian sea logistics and analysis of sea solutions between India and Portugal Kalyanasundaram Iyyappan
Programme (NMDP) which aims at various port capacities and the hinterland
connectivity projects across the Major ports with estimated investments of about
58,000 crores (US$ 14.2 billion) (Indian ports Asscosiation-Regulation acts-Vision 2000)
over the next decade. Another new model under the Model Concession Agreement
(MCA) which was approved by the Union Government in January 2008. Under this
regime, a port trust could directly approach the inter ministerial Public Private
Partnership Appraisal Committee (PPP-AC) for the final project approval without having
to acquire in the principle approval. By enabling this, the process would spped up by
inviting bids for new projects. In success of TAMP, another proposal was formulated
which was circulated within the ports community called the draft Major Ports
Regulatory Authority Act, 2008 which had the major functions such as fixing the rates of
port and terminal services that are provided by the port authorities and the private
operators in the major ports. Recently the Major Ports Authority Bill of 2016 includes a
provision to de regulate the pricings at major ports by chopping away the Tariff
Authority for major ports, or TAMP which set prices at public Indian ports. This change
would allow major ports to compete with the minor rivals, or private ports, which can
adjust the prices demanding on demand.
2.4 The importance of shipping
Shipping is concerned with the transport of cargo between seaports by ships. For some,
“shipping” means ships and seaborne businesses. For others it refers to any mode of
transport that moves goods between two geographical points. Trends in the shipping
business are moving towards the concept of economies of scale in operations, the
development of network based management, and the adoption of technology to
improve efficiency and effectiveness. The varied interpretations of shipping imply that
the shipping business has become increasingly dynamic and complex. Shipping is one of
the world’s most internationalized industries. It should not be viewed only from a
narrow national perspective. Rather, it should be looked at from a broader view of world
development, particularly in the international trade sector. This is fundamental to
international trade as it provides a cost-effective means to transport large volumes of
cargo around the world.
Shipping as a core element of economic development has a long history. Adam Smith,
the father of economics, considered shipping as a source of low cost transport that could
open up markets. Adam Smith (1986) mentioned that “as by means of water carriage a
more extensive market is opened to every sort of industry... it is upon the sea-coast that
industry of every kind naturally begins to subdivide and improve itself”. Water carriage
facilitates specialization that enables products to be sold at low prices. The shipping
business has been essential to the development of economic activities as business
transactions and trade need ships to transport cargoes from the place of production to
the place of consumption. The shipping business involves the physical transport of
cargoes from an area of supply to an area of demand, together with the activities

BIBLIOGRAPHIC WORK 45
Market study of Indian sea logistics and analysis of sea solutions between India and Portugal Kalyanasundaram Iyyappan
required to support and facilitate the transport. A transport system involves three key
components that are used for the movement of goods, with nodes linking them together
(Steenbrick 1974):
1. Fixed infrastructure such as ports or terminals
2. Vehicles such as ships or barges using the fixed infrastructure to move cargoes
3. Organisational systems necessary to ensure that the vehicled and the fixed
infrastructure are used effectively and efficiently.
2.4.1 Freight market
Although the shipping business is an economic sector, there are important subdivisions
in the sea freight market. The sea freight market is linked with ships that can carry
different types of cargoes. Generally, the freight market can be divided into the tramp
market and the linear market.
➢ Tramp Market
The purpose of tramp ships is to provide a convenient and economical means to
transport goods that require cross ocean movement. One of the key
characteristics of tramp shipping is to seek cargoes all over the world and provide
flexibility in sea transport to satisfy the needs of world trade (Kendall and Buckley
2001). The tramp ship can be any vessel that does not have a fixed itinerary and
mainly carries dry cargoes in bulk from one or more ports to one or more
different ports. This mainly carries only one commodity at a time and usually
carries cargoes from one shipper. In this market, cargoes are carried at freight
rates, whereby the terms and conditions are negotiated usually on a case-by-
case basis. They carry dry bulk cargoes that are used by many industries.
Bulk cargoes can be classified into dry bulk and liquid bulk. Demand for the
transport of liquid bulk by sea is served mainly by the sector of tanker shipping.
Ships designed for the transport of liquid in bulk are called tankers. The main
cargoes carried in tankers are liquid and gas. Ships designed to carry liquefied
petroleum gas (LPG)/liquefied natural gas (LNG) are referred to as LPG carriers
or LNG carriers. Tanker shipping was one of the forst types of shipping to make
use of the concept to improve operations efficiency (Metaxas 1971). An example
is the deployment of ultralarge crude carriers with a carrying capaity of over
300,000 deadweight tons.
➢ Liner market
A main function of liner shipping is to satisfy the demand for regular transport
under which cargoes are transported through regular routes and with regular

BIBLIOGRAPHIC WORK 46
Market study of Indian sea logistics and analysis of sea solutions between India and Portugal Kalyanasundaram Iyyappan
schedules. Liners operate according to a schedule of ports of loading and
discharge, usually adhering to a published timetable with set conditions of
carriage. They operate like trains of international seaborne trade, with cargoes
made up of a large number of different consignments from different shippers.
Liner cargo is mainly made up of manufactured or partly manufactured goods.
The majority of liner cargo is carried in containers. Containerization seems to
have become a must for ports, as the provision of container facilities is
considered to be one of the pre requisited for success in the new shipping
business environment (Notteboom, 2002).
Cargo liners are more expensive vessels than tramp ships because their building
and operating costs are usually higher. For example, cargo liners usually deploy
ships of speed higher than that of tramp ships. The full cellular container ships
are seperated into compartments, which enable containers to be dropped in
vertically between systems of container guides and to be stacked in holds.
Furthermore, several tiers of containers can be carried on top of the hatch cover.
Their accomodation is larger, with more facilities and comfort than tramp ships.
As the cargoes transported by liners belong to many shippers, the administrative
processes of cargo liners are far more complex. As a result, both the construction
and the operational costs of liners are higher.
2.4.2 Concept of Parcel Size Distribution
To explain how the shipping business approaches the task of transporting cargoes, the
concept of Parcel Size Distribution (PSD) is useful. A “parcel” is an individual
consignment of cargo for shipment. For a particular commodity trade, PSD describes the
range of parcel sizes in which cargo is transported (Stopford 2004). PSD answers the
question “which cargoes go in which ships?” Cargoes of similar sizes tend to use the
same type of shipping service. For example, movement of bulk commodities such as iron
ore and coal requires the use of bulk carriers since the cargo parcels are big enough to
fill an entire ship. On the other hand, for movement of general cargoes such as radios
and watches container liner shipping services are preferred since these cargoes are
mainly small consigments, which are too small to fill a whole ship, and it is better to load
them with other consigments on a ship for transport to fully utilize the shipping space
and spread out the shipping cost. Hence, the PSD concept is useful for classifying cargoes
into “bulk cargo” and “general cargo” to determine how cargoes are to be shipped.

BIBLIOGRAPHIC WORK 47
Market study of Indian sea logistics and analysis of sea solutions between India and Portugal Kalyanasundaram Iyyappan
2.4.3 International Maritime Passages
With the discussion of international trade, it is essential to consider the world
geographical pattern. The basic features of deat transport are constrained by the
world’s geography. International maritime routes are forced to pass through specific
locations corresponding to passages, capes and straits. These routs are generally
located between major economic zones, such as western Europe, North America, and
East Asia.
Figure 6 - Transport of bulk and general cargo
Figure 7 -International maritime passages

BIBLIOGRAPHIC WORK 48
Market study of Indian sea logistics and analysis of sea solutions between India and Portugal Kalyanasundaram Iyyappan
➢ The Panama Canal
The Panama Canal is approximately 80km long between the Atlantic Ocean and
the Pacific Ocean (Panama Canal Authority 2016). This waterway cuts through
one of the narrowest saddles of the isthmus that joins North America and South
America. The Panama Canal follows a system of locks-compartments with
entrance and exit gates. The locks function as water lifts: they raise ships from
the sea level (the Pacific or the Atlantic) to the level of Lake Gatun (26 m above
sea level); ships then sail the channel through the Continental Divide. The
Panama Canal handles about 12% of the Amercian International seaborne trade.
In December 1999, the Panama Canal Authority. The same year, Hong Kong port
operator Hutchison-Whampoa took operational control of the ports at both the
Atlantic (Port of Colon) and the Pacific (Port of Panama City) sides of the Panama
Canal with a 25-year lease. The company also became involved in the
improvement of the rail line between the two ports to handle the growing
amount of containerized traffic. This rail line is important as it offers an
alternative the size limitations of the Panama Canal, which prevents large post
Panamax container ships from going through.
➢ The Suez Canal
The Suez Canal is an artificial waterway in Egypt, connecting the Mediterranean
Sea to the Gulf of Suez, and then to the Red Sea. The Suez Canal is 163 Km long,
with a canal width of a minimum of 60 m (Suez Canal Authority 2008). The Suez
Canal is extensively used by modern ships, as it the fastest crossing from the
Atlantic Ocean to the Indian Ocean. Taxes paid by the vessels represent an
important source of income to the Egyptian Government. The Suez Canal has no
locks because the Mediterranean Sea and the Gulf of Suez have roughly the same
water level. It acts as a shortcut for ships between both European and Amercian
ports and ports located in southern Asia, eastern Africa, and Oceania.
➢ The Strait of Malacca
The Strait of Malacca is one of the most important strategic passages of the
world because it supports the bulk of the maritime trade between Europe and
Asia, which accounts for 50,000 ships per year (600 ships per day) (World
Shipping Council, 2016). The Strait os Malacca forms the main ship passageway
between the Indian Ocean and the Pacific ocean. It is about 800km in length, has
an average width between 50 and 320km (2.5 km at it narrowest point), and a
minimum channel depth of 23m. It represents the longest strait in the world used
for international navigation.

BIBLIOGRAPHIC WORK 49
Market study of Indian sea logistics and analysis of sea solutions between India and Portugal Kalyanasundaram Iyyappan
➢ The Starit of Hormuz
The Strait of Hormuz is a strategic link between the oil fields of the Persian Gulf
and the Indian Ocean. It has a width of between 48 and 80m, but only 6km wide
navigation channel (with two, 3-km wide channels, each exclusively used for
inbound or outbound traffic respectively). It represents the most important
strategic passage in the world for oil transport.
➢ The Strait of Magellan
The Strait of Magellan is 530 km ling and 4-24 km wide. It is a navgable route
immediately south of mainland South America. The strait is arguably the most
important natural passage between the Pacific ocean and the Atlantic Ocean, but
it is considered a difficult route to navigate because of the inhospitable climate
and its narrow passage. This passage is a relatively narrow stretch of ocean
seperating Cape Horn (the southern tip of South America) from Antartica, the
waters of which are notoriously turbulent, unpredictable, and impede by
icebergs and sea ice. With the construction of the Panama Canal in 1916, this
passage lost its strategic importance.
➢ The Cape of Good Hope
The Cape of Good Hope is located at the extreme southern tip of the African
continent that seperates the Atlantic Ocean and the Indian Ocean. It got its name
because it offers a maritime passage towards India and Asia, and is regarde as
the hope of a fortune for those who pass it. Since the widening of the Suez Canal
in the 1970s, the Cape of Good Hope has lost some if its strategic importance.
Improvements in international shipping by developing trade routes are one of the main
features of globalization. Together with progress in trade liberalization in many
countries, sea transport has become faster, more reliable, and cheaper. Lower transport
costs lead to higher levels of foreign investment, a higher savings ratio, an increased
volume of export, easier access to technology and knowledge, and a decline in
unemployment. Analysing the components of transport costs is a complex issue.
Demand for transport service is derived from trade, which is influenced by a number of
factors that have an impact on the costs of transport. Generally, the cost of transport is
essentially the price of a transport service and is determined by the supply and demand
of that service. Lower transport costs would reduce the final product price and lead to
an increase in trade volume. Furthermore, expanding trade volumes, in the long run,
would reduce the unit cost of transport by allowing economies of scale and greater
specialization in terms of efficiency, frequency, and reliability in shipping operations.
BIBLIOGRAPHIC WORK 50
Market study of Indian sea logistics and analysis of sea solutions between India and Portugal Kalyanasundaram Iyyappan
2.5 Containers in shipping industry
Container shipping is a shipping method that uses large intermodal containers that can
be transferred between rail or truck and ship and never opened while in transit between
ship and consignee (Levinson 2006). Malcolm McLean, a leader in the American trucking
industry, designed the first standardized container and created Se-Land shipping in 1956
(ISBU 2010). Initial designs called for entire truck trailers to be loaded into ships. To save
space and weight, the industry standard quickly evolved to load only the containers
themselves, rather than containers attached to chassis (Levinson 2006). The U.S.
container shipping industry began in 1956 when 58 containers were sailed from Newark
to Houston aboard retrofitted tanker ship (Cudahy & Brian, 2007).
Shipping cargo in containers offers several key advantages to the industry. Studies have
shown that at U.S. ports, container cargo can be moved nearly twenty times faster than
break bulk cargo (goods that must be loaded individually; Herod 1998). Gains in
efficiency have greatly reduced costs: loading oose cargo cost $5.85 per ton to load in
1956; when that same cargo was containerized, it cost $0.16 per ton (ISBU 2010).
Containers that remain locked also create improved cargo security and reduce cargo
breakage and contamination risks. Because of these increases in efficiency, the industry
has experienced tremendous growth in recent decades.
Container capacity is often expressed in units of twenty-foot equivalent units (TEU). One
TEU of containerised cargo capacity is equal to one standard 20ft* 8ft container (World
Bank 2009). Container trans shipment traffic figures are generally a measure of
container traffic moving from land to sea transport modes, and include both
international and coastal journeys. A estimate states that there are approximately 100
million containers shipped each year (WSC 2016). Currently, one of the main size
constraints facing container ships is the size of the locks in the Panama canal. Ships that
are “Panamax” in size fit within the dimensions of the locks and have a capacity up to
roughly 5,000 TEU. After the expansion of the Panama canal, it will be able to handle
“Post-Panamax” container vessels up to capacities of 12,000 TEU (Payer 1999). Ships
with capacity greater than 10,000 TEU are known as Ultra Large Container ships (ULC).
The next size limitation that will emerge is tied to the depth of the Straits of Malacca,
which link the Indian and Pacific oceans and are one of the busiest shipping lanes in the
world. “Malaccamax” ship dimensions will be 470 m * 60m (Levinson 2006). As each
generation of ship becomes larger, the taller the stacks of containers become. The
physics of taller stacks require new innovations to adequately secure them.
With the increase in global trade, there becomes a major demand of containers to
transport the goods in it. However, there is a concern that shipping containers may be
used by terrorists as the delivery component for chemical, biological, radiological or
nuclear weapon (ECMT, 2005). A disruption of operations in ports can become very
expensive as the port security remains the primary importance for Europe both due to

BIBLIOGRAPHIC WORK 51
Market study of Indian sea logistics and analysis of sea solutions between India and Portugal Kalyanasundaram Iyyappan
the direct threats of life and property which can become the major economic damage
which arises from the effects on the supply chains. Traceability and monitoring of cargo
becomes the key elements for smarter logistics to support safe and secure freight
transports (Rantasila et al., 2012). The process of providing real time information on the
supply chain security incidents and decisions become the support tools for early
detection and shorten the response times. (Gould et al., 2011). Two EU sponsored
projects have already addressed the security of container transport: the SUPPORT
project which addressed the security of ports, the CONTAIN project which aimed at the
security of container supply chain.
Monitoring of the integrity and status of the containers can be performed by using
different methods depending on the needs and interests of the stakeholders in the port
and supply chain: the primary method is through non intrusive identification and
detection technologies which includes the identification of driver, vehicle, container
during the different processes in the port and also inspect the damage for the containers
by the use of non-intrusive sensors. The use of identification technologies requires
colloboration with other stakeholders, both for access to databases and the
management of tags. Non intrusive detection technology come mainly under the
responsibilty of Customs.
Figure 8 - Process for Selection of Monitoring devices

BIBLIOGRAPHIC WORK 52
Market study of Indian sea logistics and analysis of sea solutions between India and Portugal Kalyanasundaram Iyyappan
53
Market study of Indian sea logistics and analysis of sea solutions between India and Portugal Kalyanasundaram Iyyappan
THESIS DEVELOPMENT
3.1 Major Shipping Industries
3.2 Indian Ports
3.3 Port Traffic
3.4 Road Ahead for Indian Ports
3.5 Market study Of Indian Sea Logistics
3.5.1 Indian Exports
3.5.2 Indian Imports
3.5.3 India’s top 10 International Trade Data
3.6 India’s Trade Relation with Europe
3.7 Portugal trade with India
3.7.1 India Exports to Portugal
3.7.2 India’s Import From Portugal
3.8 SWOT Analysis Of Indian Import Export
3.8.1 Strengths
3.8.2 Weakness
3.8.3 Opportunities
3.8.4 Threats
3.9 Sea Routes Between India and Portugal
3.9.1 Direct Vs Transhipment Services
3.9.2 Sea Routes between Portugal to India
3.9.3 Advantages and disadvantages of Direct & Trans-shipment
3.10 Highlights of K Line concerning Portugal and India trade

THESIS DEVELOPMENT 54
Market study of Indian sea logistics and analysis of sea solutions between India and Portugal Kalyanasundaram Iyyappan
3 Indian Shipping Industry and Major Ports
3.1 Major Shipping Industries
The Indian shipping Industry plays a crucial role in Indian economy. Major share of
around 90% of the Nation’s trade by volume is done by sea (Ministry of Shipping, India).
India has been the largest merchant shipping fleet among the developing nations. The
Indian Shipping Industry not only includes transportation of both national and
international cargoes but also provides various other facilities such as ship building, ship
repairing, lighthouse facilities, freight forwarding. There are as many as 50 shipping
companies in the Indian industry, out of which 19 deal with coastal trade and 29 are
engaged in overseas trade. The shipping industry governed by 3 seperate Acts such as
The Merchant Shipping Act in 1958, The Inland Vessels Act in 1917 and The Coasting
Vessels Act in 1838 has most of the vessesls registered under Merchant Shipping Act.
Smaller barges and coastal vessels are governed by the other two acts. The total size of
the industry is 515 vessels with a gross register tonnage of 7.06 million. The major ports
are located at Calcutta/Haldia, Chennai, Cochin, Ennore, Jawaharlal Nehru Port at Nhava
Sheva, Kandla, Mormugao, Mumbai, New Mangalore, Paradip, Tuticorn and
Vishakhapatnam. The major routes are concerned with China and Singapore as the
demand from them is very huge. Out of the 29 ship industries, 3 operate their lines to
Europe which are as follows:
1. Zim World Freight Private Limited
This company operates several vessel operators from Indian ports to
Gulf, Europe, Far East, China and Indian Sub Continent. It is mainly
concentrated on ocean freight forwarding. Zim operates a fleet of 80
vessels of which 2 travel to Rotterdam and one to Spain.(data obtained
from website www.Zline.in)
2. Mercator Limited
This is a Mumbai based International Organisation. This group diversifies
business intrests in Coal, Container shipment, Oil & Gas. It operates only
a single vessel to Rotterdam called Panamax which has a capacity of
69286 TEUs. (Data obtained from website www.mercator.in)
3. Great Eastern Shipping Company Limited
This is India’s Largest private sector Shipping Company which has
experience and expertise for over 6 decades. The company has two main
business: shipping and offshore. The shipping business is involved in
transportation of cruse oil, petroleum products, gas and dry bulk
commodities. This company operates 6 vessels to the Port of Spain,
Germany.(data sourced from website www.greatship.com)

THESIS DEVELOPMENT 55
Market study of Indian sea logistics and analysis of sea solutions between India and Portugal Kalyanasundaram Iyyappan
3.2 Indian Ports
Seaports in India are responsible for their varied range of economic activity and they
account for 95% by volume and 70% by value of the country’s international trade. the
ports play a major role in the overall economic development of the country. India has a
coastline spreading to 7516.6 Kilometres.(Indian Ports Association). India has 12 major
ports which handle about 58% of seaborne traffic, which includes Kolkata,
Visakhapatnam, Chennai, V.O.Chidambaranar (Tuticorin), Cochin, New Mangalore,
Mormugao, Jawaharlal Nehru Port Trust (JNPT), Mumbai, Kandla, and Ennore. Of these,
Ennore Port Limited is a company and the remaining 11 are port trusts, governed by the
Major Port Trusts Act, 1963.
Under the Indian Ports Act, 1908, the Government has declared the Port Blair Port with
its territorial jurisdiction over all ports of Andaman & Nicobar Islands as a major port
with effective from 1 June 2010. All major provisions of the Major Port Trusts Act, 1963
has become applicable to the major port of Port Blair from 1 June 2010. India has around
200 Non Major ports, which handle about 42% of seaborne traffic.(Ministry of Shipping,
India).
Figure 9 - Major Ports of India

THESIS DEVELOPMENT 56
Market study of Indian sea logistics and analysis of sea solutions between India and Portugal Kalyanasundaram Iyyappan
From the above graph, it can be observed that the total throughput of the cargo tonnage
at major ports in the first fiscal month was up by nearly 10% year-over-year to 52.4
million tonnes from about 48 million tonnes in April 2015. From the list of ports stated
above, Mormugao reported the highest gain in lifting volume, with a 153% year-over-
year jump, to 3.3 million tonnes. Paradip experienced the second largest increase in
traffic growth, with a 19% rise to 7.2 million tonnes, followed by Visakhapatnam which
had 18.11% to 4.7 million tonnes, Kandla up by 17.2% to 8 million tonnes and Cochin up
by 10.14% to 2 million tonnes.
The above graph explains the TEU volumes at major Indian ports for the period of April-
June 2016 & 2017. It can be said that Kolkata handled 188.000 TEU’s, Tuticorn at 166,000
Figure 10 - Tonnage at major Indian Ports
Source: India Major Port Authorities, 2016
Figure 11 - TEU Volumes at largest Indian Ports
Source: Indian Ports Association, Monthly capacity at Major Ports

THESIS DEVELOPMENT 57
Market study of Indian sea logistics and analysis of sea solutions between India and Portugal Kalyanasundaram Iyyappan
TEU’s from 162,000 TEU’s which gained a 2.5% increase from the previous year followed
by Cochin which handled 136,000 TEU’s and gained 13% increase from the previous year
and Visakhapatnam was up by 3.4% and handled 90,000 TEU’s.(datas sourced from
Indian Ports Association).
Figure 12 - Cargo traffic at major ports
Source: Deloitte, BMI, Financial Express
The above graph implies that cargo traffic stands at 647.43 MMT (Million Metric Tonnes)
in Fiscal year 2017 and it has been growing at an Compund Annual Growth Rate of 4.02
per cent from the fiscal year 2007. Increasing trade is translating into higher demand for
containerisation due to ther efficiency. During the year of 2016-2017, 12 major ports in
India handled 647.43 million tonnes of cargo, which shows a growth of 6.79 per cent in
comparison to the previous year.
436.6
519.2 530.4561 569.8 560.1 546.6 555.3
581.3606.4
647.4
0
100
200
300
400
500
600
700
FY 07 FY 08 FY 09 FY 10 FY 11 FY 12 FY 13 FY 14 FY 15 FY 16 FY 17
Cargo Traffic at major Ports (MMT)
FY 07 FY 08 FY 09 FY 10 FY 11 FY 12 FY 13 FY 14 FY 15 FY 16 FY 17

THESIS DEVELOPMENT 58
Market study of Indian sea logistics and analysis of sea solutions between India and Portugal Kalyanasundaram Iyyappan
Source: Indian Port Association; Tech Sci Research
In the above graph the details are as follows:
• Between Fiscal year 2007-2017, cargo traffic grew at Compund Annual growth
rate of 0.38 per cent.
• Over Fiscal year 2007-2016, CAGR in the volume of different segments was as
follows:
I. Solid cargo was 2 percent
II. Liquid cargo was 3.1 percent
III. Container cargo stood at 6 per cent
• Cargo traffic for Fiscal year 2017 (till december 2016) for solid, liquid and
container cargo was 230.8, 158.2 & 92.13 Million Metric Tonnes respectively.
• During April-October 2016, cargo traffic at 12 major ports in the country was
reported at 370.04 Million Tonnes, showin a growth of 6.27 per cent over the
same period suring the previous year.
Cargo traffic handled by India’s major ports increased 5.56 per cent year on year to
113.63 million tonnes (MT) during April-May 2017. In terms of composition of cargo
traffic, iron ore traffic volume rose 33.28 per cent to 9.96 MT, cooking coal grew 12.67
per cent to 9.30 MT, and fertiliser traffic went up 20.09 per cent to 1 MT during the
period. The country’s major ports handled a combined traffic volume of 647.43 million
tonnes during April 2016-February 2017,registering an annual growth rate of 6.79 per
cent, as againt a growth of 4.32 per cent in Fiscal Year 2015-2016. The major ports
recorded in the highest ever capacity addition of 100.37 MT in 2016-17, thereby raising
the total capacity to 1065 MT per annum, as against a capacity of 965.36 MT per annum
in 2015-16.
23
5.9
25
8.2
26
1.2
28
4.7
27
6.6
26
0.9
23
9.9
25
3.5
27
3 28
7.4
23
0.8
54
.3
16
8.7
17
6.1
17
5.1
17
9.1
17
9.1
18
5.9
18
7.2
18
8.9
19
5.9
15
8.2
73
.2 92
.3
93
.1
10
1.2
11
4.1
12
0.1
11
9.8
11
4.4
11
9.4
12
3.2
92
.1
F Y 0 7 F Y 0 8 F Y 0 9 F Y 1 0 F Y 1 1 F Y 1 2 F Y 1 3 F Y 1 4 F Y 1 5 F Y 1 6 F Y 1 7
CARGO TRAFFIC AT MAJOR PORTS (MMT)
Solid Liquid Container
Figure 13 - Cargo Traffic Handled at major ports

THESIS DEVELOPMENT 59
Market study of Indian sea logistics and analysis of sea solutions between India and Portugal Kalyanasundaram Iyyappan
Figure 14 - Cargo Traffic at non-major ports
Source: Ministry of shipping, Tech Sci Research
E: Estimate
Unit: Metric Million Tonnes
From the above graph it is understood that cargo traffic stood at 466.1 MMT in Fiscal
year 2016. Cargo traffic has expanded at a Compound Annual Growth Rate of 10.7 per
cent during Fiscal Year 2007-2016 and is expected to grow annually at 15.9 per cent
during Fiscal year 2007-2017 and it is expected to reach 815.2 MMT.
On comparing both the major and non major ports, the major ports have outperformed
private ports by acheiving a growth 6.79 per cent in 2016-17, whereas the private ports
recorded a traffic growth rate of only 4 per cent. The Department of Industrial Policy
and Promotion (DIPP), Ministry of Commerce and Industry, reported that the Indian
ports sector received FDI (Foreign Direct Investment) worth US$ 1.64 billion between
April 2000 and March 2017. The country’s 12 major ports saw the cargo traffic go up
4.13% to 221.95 million tonnes (MT) in April-July period of the ongoing fiscal, riding on
the back of surge in demand, according to data from Indian Ports Association (IPA).
These top ports, had handled 213.15 MT cargo in the period of the last fiscal. Increased
demand from sectors like iron ore, pertoleum oil and lubricants (POL) and containers led
to higher movement of cargo. Iron ore traffic volumes moved up 32.28% to 15.61 MT
during April-July as against 11.80 MT in the same period during 2016, while those of POL
rose 10.40% to 75.18 MT. Container traffic rose from 6.16% to 44.06 MT.
186.1 203.6 213.2288.9 314.9 353 387.9 417.1
471.2 466.1
815.2
FY 07 FY 08 FY 09 FY 10 FY 11 FY 12 FY 13 FY 14 FY 15 FY 16 FY 17E
Cargo traffic at non-major ports
Cargo traffic in MMT

THESIS DEVELOPMENT 60
Market study of Indian sea logistics and analysis of sea solutions between India and Portugal Kalyanasundaram Iyyappan
Cargo traffic Handled By Major and Non-Major Ports Of India
(In Million Tonnes)
Period Major Ports Non Major Ports
2001-2002 287.58 95.52
2002-2003 313.55 108.3
2003-2004 344.8 118.86
2004-2005 383.75 138.20
2005-2006 423.56 155.42
2006-2007 463.83 181.11
2007-2008 519.31 206.37
2008-2009 530.53 213.22
2009-2010 561.09 289.32
2010-2011 569.91 314.64
2011-2012 560.19 353.74
2012-2013 545.83 387.92
2013-2014 555.49 (1.8) 416.96 (7.5)
2014-2015 581.34 (4.7) 470.89 (12.9)
2015-2016 (P) 606.37 (4.3) 466.1 (1.0)
2016-2017 # 315.42 (5.2) 234.32 (4.9)
Table 1 - Cargo Traffic Handled by Major and Non Major Ports of India (2001-2002 to 2016-2017 upto September 2016)
Source: Ministry of Finance, Government of India (16944) & Ministry of Shipping,
Government of India (ON283) & (ON1289)
Abbreviations: P-Provisional
Note: # -Upto September 2016
Figures in brackets indicate growth over previous year

THESIS DEVELOPMENT 61
Market study of Indian sea logistics and analysis of sea solutions between India and Portugal Kalyanasundaram Iyyappan
Table 1 compares the cargo traffic handled between major and non major ports of India.
The container traffic was at 287.88 and 95.52 million tonnes during the period of 2001-
2002 for major and non major ports respectively. It steadily increased during the future
years and the maximum was achieved during the period of 2015 -2016 for major ports
for the container traffic of 606.37 million tonnes. For the non major ports the maximum
container traffic was during the period of 2014-2015 which handled 470.89 million
tonnes of cargo.
From Figure 16, it is understood that non major ports are evolving faster than major
ports. It is clearly observed that non major ports are gaining high shares and major traffic
has shifted from major ports to non-major ports. The contribution of non-major port’s
traffic rose to 43.5 per cent in FY16 from 28.6 per cent in FY07.
0100200300400500600700
Cargo Traffic Handled by major and non major ports of India
Major Ports(in Million Tonnes) Non Major Ports(in Million Tonnes)
Figure 15 - Cargo traffic Handled by Major and Non major ports of India

THESIS DEVELOPMENT 62
Market study of Indian sea logistics and analysis of sea solutions between India and Portugal Kalyanasundaram Iyyappan
Source: Indian Ministry of Shipping, 2017
FY – Fiscal Year April – March
E – Estimate
3.3 Port Traffic
This section gives details and informations to the traffic held at the main ports of India.
Detailed information on the type of cargo traffic it handles is explained. Also analysis is
done in the form of Porters Five Force Analysis.
Annexure 6.1 describes traffic Handled at Major ports during April to August, 2017* vis-
a-vis April to August,2016.
71
.40
%
71
.80
%
71
.30
%
66
.00
%
64
.40
%
61
.30
%
58
.40
%
57
.10
%
55
.20
%
56
.50
%
53
.60
%
28
.60
%
28
.20
%
28
.70
%
34
.00
%
35
.60
%
38
.70
%
41
.60
%
42
.90
%
44
.80
%
43
.50
%
46
.40
%
F Y 0 7 F Y 0 8 F Y 0 9 F Y 1 0 F Y 1 1 F Y 1 2 F Y 1 3 F Y 1 4 F Y 1 5 F Y 1 6 F Y 1 7 E
% SHARE OF PORTS
Major Ports Non-major Ports
Figure 16 - Percentage share of ports
05000
100001500020000250003000035000400004500050000
Traffic Handled at Major Ports
Cargo traffic in 2017 Cargo traffic in 2016
Figure 17 - Traffic Handled at major ports

THESIS DEVELOPMENT 63
Market study of Indian sea logistics and analysis of sea solutions between India and Portugal Kalyanasundaram Iyyappan
From this annexure, it is evident that the cargo traffic is increasing for almost all the
ports of India however, there are a few exceptions. Considering Visakhapatnam port the
traffic fell by 327,000 Tonnes. In the case of V.O. Chidambaranar port, Cochin, New
Mangalore, Jnpt & Kandla the traffic difference was about 1500,000 Tonnes. However,
in comparison with the total traffic for the previous year it increased to 8653,000 tonnes
which clearly shows cargo traffic is steadily increasing in almost all the major ports of
India. A 3.26 percentage variation was observed against the previous year traffic.
The highest cargo traffic was handled by Kandla port during both the years i.e., April to
August 2017 and April to August 2016 and handled 43986,000 & 45193,000 tonnes
respectively. It continues to retain its No.1 Position amongst Indian Major ports for the
past nine years. To conclude for the least traffic handled, Kolkata handled only 6875,000
tonnes for April to August 2017 and 7094,000 tonnes during April to August 2016.
Annexure 6.2 describes the traffic held at major ports which shows a comparison for the
period of April to August 2017 with April to August 2016. The main commodities along
with the data which are transported are explained. On further observations, it can be
understood that Kandla port handles major cargo traffic in its port. Even tough, it has
reduced to about 120,000 Tonnes against the previous year it still manages to retain the
position of the top port of India to handle cargo traffic. This port handles almost all the
commodities in a greater quantity than other ports. Data from the above table reveals
that Indian ports handled a major capacity of P.O.L (Crude products, LPG/LNG) which
constitutes a major share for the ports during the period of April to August 2017. The
least quantity goes to fertilizers during the period of April to August 2016 which handles
a total of 2943,000 Tonnes. However, in close examination, container cargo traffic is
steadily increasing and it is the second most traffic handled quantity which shows more
containers are welcomed into the ports of India due to high demand of goods.
3.4 Road Ahead for Indian Ports
• Competitive Rivalry
Increasing trade activities brought by rising imports of commodities like coal and
crude (from Annexure 6.3) to generate high business and limit overall
competition as most ports operate in specific geographies. In recent days private
managed ports attracts the share of other ports which include ports like JNPT
and Mumbai Port Trust which are usually handled by government agencies.
However, the demand expected to be strong.(Indian Ports Association
www.ipa.nic.in)
• Threat of New Entrants
100 per cent FDI under automatic route and income tax exemption for a period
of 10 years is attracting foreign investors but higher capital expenditure acts as
a barrier. This is evident from the fact from the data observed from Indian Ports

THESIS DEVELOPMENT 64
Market study of Indian sea logistics and analysis of sea solutions between India and Portugal Kalyanasundaram Iyyappan
Association that the Indian Minister for shipping, Road Transport and Highways,
Mr Nitin Gadkari announced a massive investment in India’s Ports as the
Government is about to develop 10 coastal economic regions as part of the
country’s Sagarmala (string of ports) project. Adding this, it is also stated that
around USD 18.6 billion investment is to allocated for the same.(Ministry of
Shipping, TechSci Research)
• Substitute Products
With the rising demand for port infrastructure due to the growing demands like
crude, coal and containerisation, other products may suffer as the demand
become less.
• Bargaining Power of Suppliers
Due to the increase in demand of supply and considering capacities which are
being added forward, it becomes the best time for several suppliers to quote
their required cost and specified time.
• Bargaining power of customers
As imports continue to remain strong which is lead by strong demand, the
demanding power of customers also becomes high(refer data from annexure
6.2). Customers may bargain in terms of cost as there is abundance reserve of a
particular stock due to frequent shipping.
As observed from the above data and information, it becomes wise to say that increasing
investments and cargo traffic leads towards a healthy prospective for the Indian Ports
Sector. Providers of services such as operation & maintenance (O&M), pilotage and
harbouring will benefit from these investments. The capacity addition at ports is
expected to grow at a CAGR of 5-6 percent till 2022, thereby additon of 275-325 MT of
capacity. The Ministry of Shipping has set a target capacity of over 3,130 MMT by 2020,
which will be driven mostly by the private sector while the non major ports are expected
to generate over 50% of this capacity.
3.5 Market study Of Indian Sea Logistics
The lifeblood of a global market is trade. Imports and Exports play a major role as it helps
grow national economies and expands the global market. Every country is blessed with
certain advantages in resource and skills. For example, in the case of India it is rich in
resource such as spices, fertile soil while other countries have shortages of these
resources. Additionally, some countries have highly developed infrastructures,
educational systems and capital markets that permit them to involve in complex
manufacturing and technological innovations, while many countries do not.
Imports are important for businesses and individual consumers. The consumers benefit
from the locally produced products with imported components along with products that

THESIS DEVELOPMENT 65
Market study of Indian sea logistics and analysis of sea solutions between India and Portugal Kalyanasundaram Iyyappan
are imported into the country. Many times, imported products provide a better price
and more choice to consumers, which help their standard of living. Countries prefer to
be net exporters rather than net importers, even though importing is not a bad thing as
it gives access to important resources and products. The more a country exports, the
more domestic economic activity is increasing. More exports means more production,
jobs and revenue. If a country becomes a net exporter, its gross domestic product
increases, which is the total value of finished goods and services it produces in a given
period of time.
3.5.1 Indian Exports
I. Merchandise trade
The positive growth achieved by exports for the previous year, exports during
the month of July 2017 shows growth of 3.94 per cent in dollar terms valued at
US$ 22543.80 million as compared to US$ 21689.57 million during July 2016. In
the case of Rupee terms, India suffered a negative growth of 0.32 per cent as
during July 2017, exports were valued at Rs.145308.10 crore on comparing with
Rs.145770.39 crore during July 2016. During the period of July 2017, major
commodity groups of export showing positive growth over the month of last year
include Engineering goods (15.16%), Petroleum Products (20.27%), Organic &
Inorganic Chemicals (20.67%), Cotton Yarn fabrics including handloom products
(5.39%) and Marine products (30.53%). (data as per RBI’s press release dated
14th August 2017)
The cumulative value of exports for the period of April-July 2017-18 was US$
94756.13 million (Rs.610780.14 crore) as against US$ 87001.34 million
(Rs.582731.37 crore) which implies registering a positive growth of 8.91 per cent
in dollar terms and 4.81% in Rupee terms over the same period last year. Non-
petroleum and Non Gems & Jewellery exports in July 2017 were valued at US$
22543.80 million against US$ 21689.57 million in July 2016 corresponding to an
increase of 6.93%. These goods are valued at US$ 94756.13 million for the period
of April-July 2017-2018 as compared to US$ 87001.34 million for the
corresponding period in 2016-17 with an increase of 9.05%.(data as per RBI’s
press release dated 14th August 2017).
3.5.2 Indian Imports
The country’s imports during July 2017 were valued at US$ 33993.61 million (Rs
219108.89 crore) which is 15.42% higher in Dollar terms and 10.70% higher in Rupee
terms over the import levels which is at US$ 29450.97 million (Rs. 197932.93 crore) in
July 2016. The cumulative value of imports for the period of April-July 2017-18 is US$
146256.71 million (Rs. 942740.00 crore) as against US$ 113996.75 million (Rs.763687.22

THESIS DEVELOPMENT 66
Market study of Indian sea logistics and analysis of sea solutions between India and Portugal Kalyanasundaram Iyyappan
crore) achieveing a positive growth of 28.30% in Dollar terms and 23.45% in Rupee terms
over the same period last year.
Major commodity list of imports which showed high growth in July 2017 in comparison
to previous year of July 2016 were Petroleum, Crude & products (15.02%), Electronic
goods (22.5%), Machinery, electrical & non-electrical appliances (7.34%), Perals,
precious & semi precious stones (6.86%) and Gold (95.05%).
• Crude oil and Non-oil Imports
Oil imports during the period of July 2017, were valued at US$ 7844.94 million
achieving 15.02% higher than oil imports which were valued at US$ 6820.34
million in July 2016. Oil imports during April-July, 2017-2018 were valued at US$
31022.43 million which was 20.87% higher than the oil imports of US$ 25666.96
million in the previous year.
Non oil imports during July 2017 were estimated at US$ 26148.7 million which is
15.55% higher than non oil imports of US$ 22630.63 million in July 2016. Non-oil
imports during April-July 2017-2018 were valued at US$ 115234.28 million which
was 30.46% higher than the level of such imports which was valued at US$
88329.79 million in April-July 2016-2017.
II. Trade in Services (June 2017, RBI press Release dated 14th August, 2017)
Exports (Receipts)
Exports during June 2017 were valued at US$ 13388 Million (Rs. 86276.29 Crore)
registering a negative growth of 0.31% in dollar terms in comparion to positive
growth of 4.08 % during May 2017.
Imports (Payments)
Imports during June 2017 were valued at US$ 7457 Million (Rs. 48055.15 Crore)
registering a negative growth of 2.07 per cent in dollar terms as compared to
positive growth of 5.44% during May 2017.
III. Trade Balance
Merchandise: The trade deficit for July 2017 was estimated at US$ 11449.81
million against the deficit of US$ 7761.40 million during July 2016.
Services: Trade Balances in services (i.e. net export of services) for June 2017 was
estimated at US$ 5931 million.
Overall Trade Balance: Taking merchandise and services together, overall trade
deficit for April-July 2017-2018 is estimated at US$ 34072.58 million as compared
to US$ 10799.41 million during April-July 2016-2017. (service data refers to April-

THESIS DEVELOPMENT 67
Market study of Indian sea logistics and analysis of sea solutions between India and Portugal Kalyanasundaram Iyyappan
June 2017-2018 as June 2017 is the latest data available as per RBI’s press release
dated 14th August 2017).
Annexure 6.3 explains the exports and imports of India for the period of 2016-2017. On
close observation it is found that for Merchandise trade, the value of exports is steadily
increasing and stands at 94756.13 US$ Millions for the period of April-July 2017-2018 as
compared to 87001.34 US$ Millions during the same period last year. This is evident to
show that the value of exports is increasing and will provide better trade opportunities
between the two countries. The percentage of growth is almost double for the period
of 2016-2017 and 2017-2018. On comparing the imports sector, it is found that for the
period of July 2016-2017 and April-July 2017-2018, the value is increasing at a slow pace
and the percentage of growth is also double as compared to exports. The table clearly
denotes that both imports and exports is increasing and India will prove a healthy
relationship between its trading countries.
Exports & Imports (Services) (June
2017) (Provisional)
US$ Million Rs.Crore
Exports (Receipts)
13388 86276.29
Imports (Payments)
7457 48055.15
Trade Balance 5931 38221.14
Table 2 - India Service trade data
Source: Reserve Bank of India dated 14 August 2017
Service trade data for the month of June 2017 is explained in the above table. Exports
play a major role as compared to imports in this month and it is to be noted that value
of exports is nearly double compared to imports.
3.5.3 India’s top 10 International Trade Data
➢ Imports
India imported goods accounting to US$ 356.7 billion from around the globe in 2016,
which is 33.9% higher on comparing with 2009 but down by -8.7% from 2015-2016.
India’s top 10 imports accounted for 74.3% of the overall value of its products purchases
from other countries and is explained in Annexure 6.4. The country’s import represent
2.2% of total global imports which totaled $16.473 trillion one year earlier in 2015.
Around 58.2% of India’s total imports by value in 2016 was purchased from Asian
countries. Trade with Europe supplied to 17.5% while North America and Africa
constituted 7.3% individually. On referring India’s population of 1.267 billion people, its
total value of imports of $356.7 billion in 2016 compares to roughly $280 in yearly

THESIS DEVELOPMENT 68
Market study of Indian sea logistics and analysis of sea solutions between India and Portugal Kalyanasundaram Iyyappan
product demand from every person in the country. Close observations from the table
suggest that Imported plastics and plastic articles had the fastest growing increase in
value among the top 10 import categories up by 121.9% for the 7 year period starting
from 2009. Vegetable or animal fats, oils and waxes comes in the second place to
112.3%. Iron or steel was the laggard among the import list holding a 2.9% modest
uptick.
Research Sources:
The World Factbook, Country profiles, Central Intelligence Agency. Accessed on June 9,
2017
Trade Map, International Trade Centre. Accessed on June 9, 2017
Source: World Economic Outlook Database, 2016
➢ Exports
India exported US$ 261 billion worth goods around the globe in 2016 which is 47.7%
higher than 2009 which was the period of Great recession. However it went down by
1.3% during the period of 2015-2016 and is explained in Annexure 6.5. The total value
of the 10 exports accounted for 59.4% of the overall value of its total shipments. India’s
total Gross Domestic Product valued to $8.721 trillion as of October 2016. Hence,
exports accounted for about 3% of total Indian Economy output. 49.1% of India’s exports
are shipped to Asian countries while 19.5% are sailed to European importers. India
delivers 18.1% to North America with 8.7% worth shipped to Africa. India’s population
of 1.267 billion people, the total of $261 billion in 2016 exports accoints to average of
$200 for every resident of the country. On close examination from the above table, it is
observed that Vehicles were of greater demand among the top 10 exports valuing for
162.2% for the 7 year period starting from 2009, followed by Pharmaceuticals which
benefitted 160.3%. Electronics fell by 14.6% which is the only declining category.
Research Sources:
International Monetary Fund, World Eonomic Outlook Database. Accessed on June 9,
2017
The World Factbook, Country Profiles, Central Intelligence Agency
Trade Map, International Trade Centre. Accessed on June 11, 2017
Investopedia, Net Exports Definition. Accessed on June 11, 2017
Forbes 2015 Global 2000 Rankings, The World’s Biggest Public companies. Accessed on
June 11, 2017.
➢ India’s total trade with Major countries
The Annexure 6.6 gives the trade information of India with the top countries it deals
with. The period of data is for 2016-2017(July) and the values are in US$ Million.
Source: Government Of India, Ministry of Commerce and Industry – export import data
bank. Version 7.1 Tradestat

THESIS DEVELOPMENT 69
Market study of Indian sea logistics and analysis of sea solutions between India and Portugal Kalyanasundaram Iyyappan
It is to be noted that Portugal does not stand in the list of top 24 countries that India
trades with. However, there are 4 European countries in this list which include Germany,
Switzerland, France & Italy. K Line operates regular routes from these ports to India.
The total share for top countries for export and import is at 186,934.75 and 304,364.65
respectively. The total trade stood at 491,299.40 and the trade balance is -117,429.90.
India’s total in export is 276,280.28 and the import is 384,318.66 and the total trade is
659,218.76. Trade balance in India’s total stands at -108,038.38.
The percentage share of the above mentioned countries for export, import, total trade
and trade balance are at 67.66, 79.20, 74.53, 108.69 respectively.
➢ India’s Top 10 Major Export Companies
Source: Forbes 2016 Global 2000 individual company profiles, Example of top Indian
company compiled here is Reliance Industries. Accessed on June 20, 2017.
Trade Map, International Trade Centre. Accessed on June 20, 2017.
On observing Annexure 6.7, one can understand that four of India’s largest export
companies specialize in the petroleum industry. Also two major automotive industry
rank among the list. The overall value of Indian exports fell by -12.3% in comparison with
2011 was US$ 301.5 billion against US$ 264.4 billion during 2015. Tata motors recorded
17.4% increase in sales slighty greater than Hindalco Industries which experienced sales
of 16%. However, sales declined for Bharat Petroleum to -4.8% and -42% for Reliance
Industries.
3.6 India’s Trade Relation with Europe
India-EU relations have developed substantially since the adoption of the 1993
declaration. An extensive bilateral political involvement is involved, which includes
regular annual summits, Troika Ministerial and senior Official level meetings to cover a
wide range of issues. As both these countries are largest democracies in the world, they
share common values and beliefs that helps the relationship between the two. They
contribute towards preserving a rule based international order such as the United
Nations (UN) or the World Trade Organisation (WTO). As European Union is evolving and
enlarging, it faces diverse and complex global challenges and it is critically important to
expand the multifaceted relationship to build the foundations. With the help of this
policy, it fosters to
o Strength dialogue and consultation mechanisms
o Deepen the political dialogue and cooperation
o Bring together people and cultures
o Enhance Economic policy cooperation
o Develop trade and investment

THESIS DEVELOPMENT 70
Market study of Indian sea logistics and analysis of sea solutions between India and Portugal Kalyanasundaram Iyyappan
The trade relations between the two countries dates back to the early 1962 (Eurostat
1988) when European Commission was only a group of six countries and it was at the
initial stage of economic development. The 1994 cooperation agreement signed
between both Europe and India took relations beyond just trade and economic
cooperation. The first India-European Union Summit was held in Lisbon in June
2000.(European Commission Trade Policy) The relation between these countries has
grown exponentially from what generally is purely trade and economic driven
relationship to cover all areas of interaction.
India is presently the fastest growing economy in the world and is a important partner
for the European Union which represents sizable and dynamic market. For this reason,
the EU and India are committed to further increase the bilateral trade and investment
through the Free Trade Agreement negotiations that was launched in 2007. The
European Union is India’s major partner with 13.5% of India’s overall trade with the
world (Ministry of Chamber and Commerce, India). India is EU’s 9th trading partner in
2016 with 2.2% of EU’s overall trade with the world after South Korea with 2.5% and
ahead of China of 1.9%.(European Commission Trade and Policy data). The value of EU
exports to India grew from €24.2 billion in 2006 to €37.8 billion in 2016 with major goods
such as engineering goods, gems and jewellery, other manufactured goods and
chemicals which tops the list.
The value of EU imports from India also increased from €22.6 billion in 2006 to €39.3
billion in 2016, with textiles and clothing, chemicals and engineering goods which tops
the list. Trade in services almost tripled in the past decade, increasing from €10.5 billion
in 2005 to €28.1 billion in 2015. The EU investment stocks in India amounted to €51.2
billion in 2016, increasing from €44.2 billion in the previous year.(Eurostat Comext –
Statistical regime 4).
Source: Government Of India, Ministry of Commerce & Industry, 2017
37.139.5 39.3
35.638.1 37.8
-1.5 -1.3 -1.5-10
0
10
20
30
40
50
2014 2015 2016
EU-India Trade in goods
EU imports (€ billion) EU exports (€ billion) Balance (€ billion)
Figure 18 - EU-India Trade in Goods

THESIS DEVELOPMENT 71
Market study of Indian sea logistics and analysis of sea solutions between India and Portugal Kalyanasundaram Iyyappan
Source: Government Of India, Ministry Of Commerce and Industry, 2017
From the above graph, it can be understood that the total trade in services is at 13.7€
billion and 14.4€ billion for the period of 2016 and the balance stood at 0.8€ billion. It
witnessed a growth against 11.7€ billion for exports, 12.5€ billion for imports for the
period of 2015, however the balance was at 0.7€ billion. For the period of 2014, it was
12.6€ billion and 11.7€ billion for imports and exports respectively. However, the
balance in trade remained at a negative of 0.9€ billion. Hence, in comparison we can
conclude that the balance in trade is increasing between European Union and India.
12.611.7
13.7
11.712.5
14.4
-0.9
0.7 0.8
-2
0
2
4
6
8
10
12
14
16
2014 2015 2016
EU-India: Trade in Services
EU imports(€ billion) EU exports(€ billion) Balance(€ billion)
Figure 19 - EU-India Trade In Services
15.9
51.2
35.3
0
10
20
30
40
50
60
2016
EU-India: Foreign direct Investment
Inward Stocks(€ billion) Outward Stocks(€ billion) Balance(€ billion)
Figure 20 - EU-India Foreign direct Investment

THESIS DEVELOPMENT 72
Market study of Indian sea logistics and analysis of sea solutions between India and Portugal Kalyanasundaram Iyyappan
Source: Government Of India, Ministry Of Commerce and Industry, 2017
The above graph is a description of the Foreign direct Investment on the two countries.
For the inward stocks and the outward stocks it was 15.9€ billion and 51.2€ billion
respectively for the period of 2016. The balance stood at 35.3€ billion.
The Annexure 6.8 represents the key figures for India’s trade relation with Europe. The
total trade between the two countries was 77,021 Mio Euros and a negative balance of
-1,530 Mio Euros occured between them. Europe stood in the 9th rank with imports in
India’s list and 10th in the exports list. The annual average growth rate was 1.1 Mio
Euros for imports and a negative value of 0.6 Mio Euros for exports. Data sourced from
European Commission, Directorate-General for trade.
Source: Eurostat Comext- Statistical Regime 4
The above graph and Annexure 6.9 denotes the total goods for European Union and
their trade flow and balances are depicted below. The highest Import value was
obtained during the period of 2011 accounting to 39,927 as compared to the lowest
2006 which was 22637. With the Exports section the highest also was obtained during
the same year of 2011 with 40648 and the lowest was 2006 amounting to 24241. The
highest balance was during the period of 2007 totalling to 2515. All the values are
denoted in Mio€. Hence it becomes easy to say that the period of 2011 was a flourishing
period for the European Union in international trade, also the trade relations is occuring
at a constant rate and the trade relations between the two countries is stable.
-10000
0
10000
20000
30000
40000
50000
2006 2007 2008 2009 2010 2011 2012 2013 2014 2015 2016
EU Trade flows and balance, annual data 2006-2016
Imports Exports Balance
Figure 21 - European Trade Flows and Balances

THESIS DEVELOPMENT 73
Market study of Indian sea logistics and analysis of sea solutions between India and Portugal Kalyanasundaram Iyyappan
3.7 Portugal trade with India
On May 20, 1498, Portuguese explorer Vasco da Gama landed in what is now Kozhikode,
India. Da Gama was the first European to reach the lucative trade centers of India by
sea. Portugal and other European empires had been trading with communities in India
and throughout Southeast Asia for centuries. The legendary Silk Road was an overland
trade route that linked the spice markets of the east with the bustling commerce of the
west. Travelling in the territories of the Mediterranean Sea and Arabian Peninsula was
dangerous and time consuming.(Oliver J. Thatcher, ed., The Library of original sources-
Milwaukee: University Research Extension Co., 1907, Vol V: 9th to 16th centuries, pp.26-
40).
Da Gama and his fleet used well travelled routes to navigate down the western coast of
Africa. After re supplying in the Canary islands, da Gama took a chance and sailed west
into the Atlantic ocean, taking advantage of the strong, reliable winds called Westerlies
to quickly steer him to the southern coast of Africa. Da Gama and his fleet rounded the
Cape of Good Hope in December 1497, and named the nearby coast Natal. He
established poor relations with leaders in what are now the coasts of Mozambique and
southern Kenya- the Europeans became pirates of Arab trading shios in this region.(The
First Voyage of Vasco Da Gama, E-G. Ravenstein).
In what is now the port of Malindi, Kenya, da Gama met and interacted with Indian
merchants and sailors. They advised him on favourable monsoon winds of the western
Indian Ocean, and da Gama hired an experienced Indian Navigator to guide his fleet to
the trade center of Calicut (now known as Kozhikode). Da Gama’s sea route to India
allowed Portugal to establish a rich trade with India and southeast Asia. Portugal was
also able to expand its empire to include provinces from India (centered around the
state of Goa, whose largest city is Vasco da Gama) to China (the island of Macau).
(Howard la Fay, National Geographic, November 1992).
“ While Portugal’s annual exports to India are worth €1200 million, India’s exports to
Portugal are only worth €500 million, so it is the right time to boost trade and investment
between the two nations”, said Portugal Prime Minister Antonio Costa – (The Hindu
Business Line dated January 9, 2017).
India’s relations with Portugal remain close and friendly. Relations between India and
Portugal began in 1947 after India’s independence and diplomatic relations were
established in 1949. The Bilateral relations went to decline after 1950 over Portugal’s
refusal to surrender its enclaves of Goa, Daman Diu and Nagar Haveli on India’s west
coast. The diplomatic relations were cut off between the two nations in 1995 due to a
crisis which started the liberation of Goa by Indian military forces, ending the Portugal
rule over India in 1961, bringing 451 years of Portuguese overseas provincial governance
in Goa. A treaty of bilateral trade relation was signed again in New Delhi on December
31, 1974, and the countries shared their amicable trade relations.

THESIS DEVELOPMENT 74
Market study of Indian sea logistics and analysis of sea solutions between India and Portugal Kalyanasundaram Iyyappan
Values in US$ Million
2012-2013 2013-2014 2014-2015 2015-2016 2016-
2017(July)
EXPORTS 528.46 627.00 636.43 589.64 671.17
%
Growth
18.65 1.50 -7.35 13.83
India’s
Total
Export
300,400.58 314,405.30 310,338.48 262,290.13 276,280.29
%Growth 4.66 -1.29 -15.48 5.33
%Share 0.18 0.20 0.21 0.22 0.24
IMPORTS 378.21 339.98 145.05 102.54 141.16
%
Growth
-10.11 -57.34 -29.30 37.66
India’s
Total
Import
490,736.65 450,199.79 448,033.41 381,006.63 384,319.29
%Growth -8.26 -0.48 -14.96 0.87
%Share 0.08 0.08 0.03 0.03 0.04
TOTAL
TRADE
906.67 966.98 781.48 692.19 812.34
%
Growth
6.65 -19.18 -11.43 17.36
India’s
Total
Trade
791,137.23 764,605.09 758,371.89 643,296.75 660,599.58
%Growth -3.35 -0.82 -15.17 2.69
%Share 0.11 0.13 0.10 0.11 0.12
TRADE
BALANCE
c 287.02 491.38 487.10 530.01
India’s
Trade
Balance
-
190,336.07
-
135,794.49
-
137,694.93
-
118,716.50
-
108,039.01
Table 3 - Trade Exchange between India and Portugal
Datas sourced from Government of India, Ministry of Commerce & Industry-Export
Import Data bank-Version 7.1-Tradestat accessed on July 15, 2017.
Bilateral trade has been growing steadily during the past few years. Major articles of
export from India include : Cotton, Fish & Crustaceans, Iron and Steel, Machinery and
Mechanical Appliances, Footwear, Plastics and articles, Man made fibres, Chemicals.
Major articles of import from Portugal are Machinery and Mechanical Appliances,

THESIS DEVELOPMENT 75
Market study of Indian sea logistics and analysis of sea solutions between India and Portugal Kalyanasundaram Iyyappan
Electrical machinery and equipments, plastics, organic chemicals, copper and articles,
paper, raw hides and skins. (Embassy of India www.eolisbon.in India-Portugal Relations)
For the period of 2016-2017, bilateral trade was US$ 812.34 million. Portugal ranks 56th
in Foreign Direct Investment to India, with total FDI inflows accounting to 36.49 million
(Diplomatic trade relations country wise. Accessed on July 3 2017).Indian exports stood
at USD 671.17 million and Portuguese exports at US$ 141.16 million. Trade balance
favoured India. The trade between these countries increase by 120 Mn over the previous
year share of 692.19 Million, which accounts for increase in 17.3%. It can be said that
trade between these countries in increasing and resulted in a positive growth
percentage for the current year. The below table shows the trade relationship from
2012-2013 to 2016-2017.
Year (April-
March)
2012-2013 2013-2014 2014-2015 2015-2016 2016-2017
Exports 528.46 647.00 636.43 589.64 671.17
Imports 378.21 349.98 145.05 102.55 141.16
Total Trade 906.67 996.98 781.48 692.19 812.34
Percentage
Growth
9.38 6.65 -19.18 -11.43 17.36
Table 4 - Indian Export and Imports with Portugal
Source: Indian Directorate General of Foreign Trade Accessed on 3 July 2017.
0
100
200
300
400
500
600
700
2012-2013 2013-2014 2014-2015 2015-2016 2016-2017
India Export and Import with PortugalValues in US$ Million
Exports Imports
Figure 22 - India Export and Import with Portugal

THESIS DEVELOPMENT 76
Market study of Indian sea logistics and analysis of sea solutions between India and Portugal Kalyanasundaram Iyyappan
3.7.1 India Exports to Portugal
Exports to Portugal in India decreased to 3.89 INR Billion in January 2017 from 4.10 INR
Billion in December of 2016. The exports to Portugal averaged 1.21 INR Billion from 1991
until 2017, and it reached an all time high of 5.4INR Billion in December 2015 but
recorded low of 0.05 INR Billion in October 1991. (Reserve Bank Of India).
The Annexure 6.10 gives the data on the goods that are exported from India to Portugal.
All the values are in US$ Million.
Datas sourced from Government Of India, Ministry of Commerce & Industry Export data
Bank – Version 7.1 Tradestat Accessed on 15 July 2017.
From the annexure it is understood that India’s total for the export of good in 2015-2016
stood at US$262,290.13. The value rose to US$275,280.29 during 2016-2017 accounting
for a 1.8% increase in the current year. Total trade balance between the two countries
increased from US$ 589.64 Millions to US$ 669.66 Millions amounting to US$ 80.02
million increase in the current year.
3.7.2 India’s Import From Portugal
India’s import of goods from Portugal increased to 0.93 INR Billion in January 2017 from
0.74 Billion in December 2016. Imports form Portugal averaged an amount of 0.32 INR
Billion from 1991 till 2017, reaching all time high of 3.25 INR Billion in March 2013 and
recorded low of 0 INR Billion in April 1991.
3.9
3.4
32.9
2.7
3.5
2.83
.1
2.7 3
.1
3.8
2.93.1
2.6
4
3.13
.5
2.9
3.7
3.2
3.1
3
4.1
5.4
2 0 1 7 2 0 1 6 2 0 1 5
INDIA EXPORTS TO PORTUGAL(VALUES IN INR BILLION)
January February March April May June
July August September October November December
Figure 23 - India's Exports to Portugal

THESIS DEVELOPMENT 77
Market study of Indian sea logistics and analysis of sea solutions between India and Portugal Kalyanasundaram Iyyappan
Datas sourced from Government Of India, Ministry of Commerce & Industry Import data
Bank – Version 7.1 Tradestat Accessed on 15 July 2017.
The Annexure 6.11 gives information on some of the goods that are imported to India
from Portugal. All the values are in US$ Million.
Datas sourced from Government Of India, Ministry of Commerce & Industry Import
data Bank – Version 7.1 Tradestat Accessed on 15 July 2017
From the annexure it is observed that India’s total share in imports for 2015-2016 stood
at US$ 381,006.60 and is at US$ 384,355.55 for the period of 2061-2017 while the
percentage of share went up by 23% for the current year with trade share amounting to
0.269 and 0.0367 for 2015-2016 & 2016-2017 respectively.
0.5
99
6
0.4
37
7
0.5
66
5
0.4
96
1
0.4
21
1
0.6
65
3
0.5
70
6
0.5
99
6
1.8
28
1
0.6
78
9
0.1
71
3
0.7
37
5
0.9
3
INDIA IMPORTS FROM PORTUGAL (VALUES IN INR BILLION)
2016 2017
Figure 24 - India Imports from Portugal
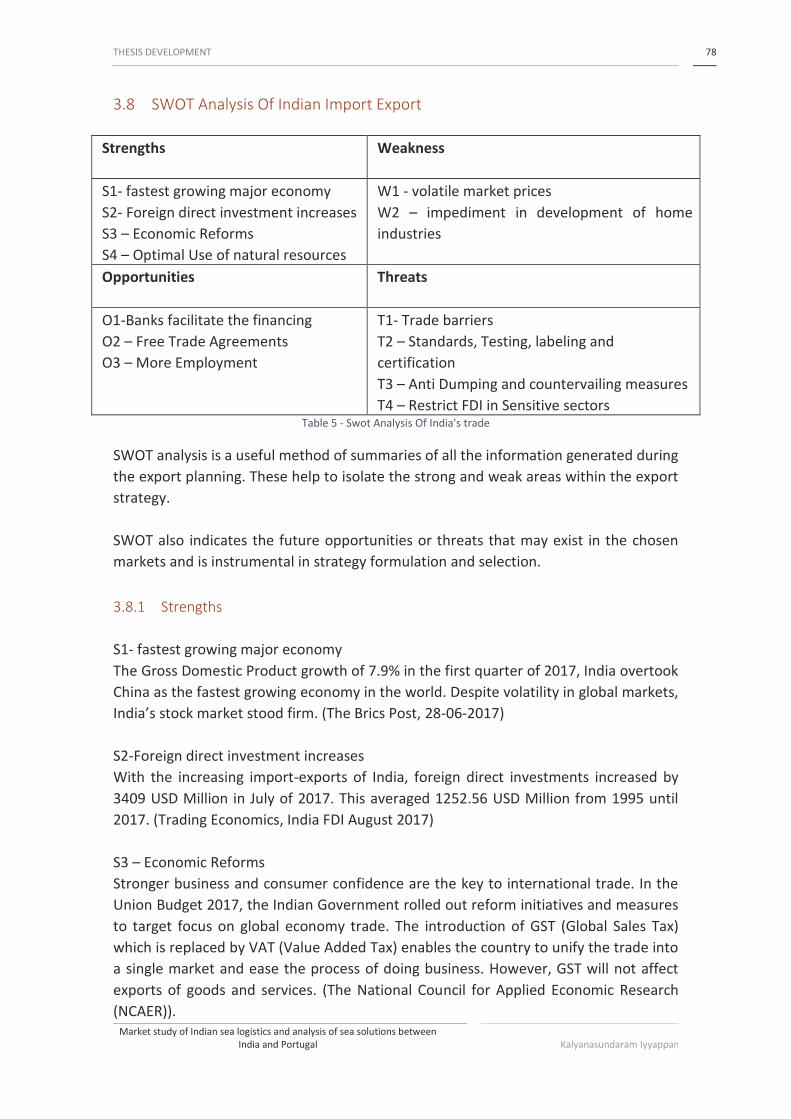
THESIS DEVELOPMENT 78
Market study of Indian sea logistics and analysis of sea solutions between India and Portugal Kalyanasundaram Iyyappan
3.8 SWOT Analysis Of Indian Import Export
Strengths
Weakness
S1- fastest growing major economy
S2- Foreign direct investment increases
S3 – Economic Reforms
S4 – Optimal Use of natural resources
W1 - volatile market prices
W2 – impediment in development of home
industries
Opportunities
Threats
O1-Banks facilitate the financing
O2 – Free Trade Agreements
O3 – More Employment
T1- Trade barriers
T2 – Standards, Testing, labeling and
certification
T3 – Anti Dumping and countervailing measures
T4 – Restrict FDI in Sensitive sectors Table 5 - Swot Analysis Of India's trade
SWOT analysis is a useful method of summaries of all the information generated during
the export planning. These help to isolate the strong and weak areas within the export
strategy.
SWOT also indicates the future opportunities or threats that may exist in the chosen
markets and is instrumental in strategy formulation and selection.
3.8.1 Strengths
S1- fastest growing major economy
The Gross Domestic Product growth of 7.9% in the first quarter of 2017, India overtook
China as the fastest growing economy in the world. Despite volatility in global markets,
India’s stock market stood firm. (The Brics Post, 28-06-2017)
S2-Foreign direct investment increases
With the increasing import-exports of India, foreign direct investments increased by
3409 USD Million in July of 2017. This averaged 1252.56 USD Million from 1995 until
2017. (Trading Economics, India FDI August 2017)
S3 – Economic Reforms
Stronger business and consumer confidence are the key to international trade. In the
Union Budget 2017, the Indian Government rolled out reform initiatives and measures
to target focus on global economy trade. The introduction of GST (Global Sales Tax)
which is replaced by VAT (Value Added Tax) enables the country to unify the trade into
a single market and ease the process of doing business. However, GST will not affect
exports of goods and services. (The National Council for Applied Economic Research
(NCAER)).

THESIS DEVELOPMENT 79
Market study of Indian sea logistics and analysis of sea solutions between India and Portugal Kalyanasundaram Iyyappan
S4 – Optimal use of natural resources
International trade helps each country to make optimum use of its natural resources.
Each country can major on goods which its resources are best suited, hence wastage of
resources is avoided. Example: India is best in handicrafts and cottage industries and is
a major component in export to other countries. The total value of exports for this sector
stood at 24392.39 INR crores for the period of June 2016-June 2017.(Indian Export
promotion council for handicrafts annual report).
3.8.2 Weakness
The weakness are classified as follows
W1- Volatile market prices
India’s exports have been falling for 17 months in a row, and dropped by 6.7% compared
to the same time last year. 2015-2016,was the first time in six years that India’s volume
of exports decreased. This happens as considerable amount of India’s total exports
comprises either raw materials such as precious metals (12%) and natiral resource based
products like refined oil (32%); both of which are highly exposed to volatile market
prices. (The Brics Post, 28-06-2017)
W2 - Impediment in development of home industries
The international trade has an adverse effect on the development of home industries,
also it plays a threat to the survival of emerging industries at home country. Due to
foreign competiton and unrestricted imports, the emerging industries may collapse. To
condiser this, coffee and tea is a well established sector in India and due to the rising
imports of the same , home industries which process coffee and tea suffer a risk. Coffee
and tea imports to India stood at US$ 771.29 million for the period of 2016-2017 (April-
August) as against US$ 299.25 million for the same period of 2015-2016. (Government
of India, Minstry of Commerce and Industry, Department of Commerce, Press Release
dated 31 August 2017).
3.8.3 Opportunities
The external environmental analysis may reveal certain new opportunities for profit and
growth. Such factors of opportunities include:
O1- Banks facilitate the financing
With the increase in imports and exports, it becomes an opportunity for many bankers
to finance the trade which can actively attract many companies bank with them, thus
increasing their share. International banks have the essential access to the cross border
banking connections that Indian exporters need. This helps India’s foreign trading
partners travel new and unfamiliar territories by absorbing the risks for foreign counter
parties.(The Brics Post, 28-06-2017).

THESIS DEVELOPMENT 80
Market study of Indian sea logistics and analysis of sea solutions between India and Portugal Kalyanasundaram Iyyappan
O2 – Free Trade Agreements
With the rising import export and strong trade relations between the two countries, free
trade policy occurs,by which the government does not restrict imports from, or exports
to the respective country. One example of free trade is the trade agreement between
the United states, Mexico and Canada known as the North American FreeTrade
Agreement (NAFTA) which was established on January 1, 1994.(United States Economy,
Definition, Types and examples).
O3 – More Employment
International trade brings in lot of employment opportunities as more number of people
are required to support this sector. India depends heavily on its service industries for
economic expansion as it holds a dominant share of the global trade and requires
support from information technology (IT) and business process management (BPM).
Export information from IT-BPM services are mainly to the developed countries, in
particular to the US and Europe. The economy of this sector reached US$154 billion in
the fiscal year 2017.(India Market Profile-HKTDC Research).
3.8.4 Threats
Changes in the external environmental may also contribute to the this factor. Other
examples of such threats include:
T1 – Trade barriers
Any restriction imposed on the free flow of trade is a trade barrier. One of the most
common non tariff barriers is the prohibition or restrictions on imports maintained
through import licensing requirements. Although India has eliminated its import
licensing related trade barriers, certain products still face the same. For example, Indian
government requires a special import license for motorcycles and vehicles that is very
restrictive. (Ministry of Chamber and commerce, Indian Government Accessed 19-06-
2017).
T2- Standards, testing, labeling & Certification
The Indian Government has identified 109 commodities that must be certified by its
National standards body, the Bureau of Indian Standards (BIS). Food related
certifications go under the Food Safety and Standards Authority of India which is
established under the Food Safety and Standards Act,2006 as a statutory body for
standards for articles of food and regulating manufacturing, processing, distribution and
sale and import of food.(Food safety and standards authority of India, circular dated 02-
11-2016)
T3 – Anti Dumping and countervailing measures
These measures are permitted by the World Trade Organisations in specified situations
to protect the domestic industry from serious injury arising from dumped or subsidized

THESIS DEVELOPMENT 81
Market study of Indian sea logistics and analysis of sea solutions between India and Portugal Kalyanasundaram Iyyappan
imports. This policy has been followed by India from time-to-time to protect any such
accidents. In recent years, India seems to have aggressively increased its application of
the anti dumping law.(Export and International Trade Administration, India country
commercial guide, 8-1-2017).
T4 – Restrict FDI in sensitive sectors
Equity restrictions and other trade related investment measures are currently in place
which give an unfair advantage to domestic companies. The Government of India
continues to restrict or prohibit FDI in sensitive sectors such as retail trade and
agriculture. Additionally there is an unpublished policy that favors counter trade.
Example include the Jawaharlal Nehru National solar mission (JNNSM). (Make in India
Policies, Restrictions in foreign direct trade).
3.9 Sea Routes Between India and Portugal
3.9.1 Direct Vs Transhipment Services
Ships that are required to carry cargo must fill their capacity to the maximum to benefit
profit and economize the cost. It also helps in continuous serivce between the two
countries. Before deciding the operations cost, calculation of the market requirement
and the demand of the cargo must be given prime importance. Based on the number of
services offered in between the ports, port stay time, voyage time and other related
factors related complete one voyage from the port of starting and reaching back the
same port, the amount of vessel is decided. The international trade between countries
is exchanged through bankers on faith and a letter of credit or other agreements based
on the relationship of parties.
• Direct service
It can be coined as an independent or alliance shipping line, operating services from one
port to another port or group of ports, without transshipping. Direct service means a
service under which a vessel operator carries the container / cargo from the point of
loading to the port of destination without off loading the container in any trans
shipment ports enroute. For example, K Line operates a direct service route from Leixoes
to Rotterdam. In this route, the ship is loaded at the port of loading and directly shipped
to port of discharge.( information from website www.grip.kline.co.jp )
• Trans Shipment service
It may be termed as an independent or alliance shipping line operating services
operating services connecting only hub ports from the port of loading and trans shipping
the containers to smaller ports through feeder vessels. It may also be stated that trans
shipment service through which the container / cargo is carried by a feeder vessel from
the Gateway port and delivered to the final port of destination undergoing trans
shipment in different hub/hub ports. During this voyage, in the first leg, the container

THESIS DEVELOPMENT 82
Market study of Indian sea logistics and analysis of sea solutions between India and Portugal Kalyanasundaram Iyyappan
will be carried from the port of loading to the trans shipment hub. From this point, it will
be offloaded from the vessel and will be loaded in the next vessel which will transport it
to the desired port. For example, shipment from Leixoes to Chennai port takes trans
shipment in which in the first phase of its journey, ship travels from Leixoes to
Rotterdam, further continued till Colombo and from there it reaches its destination port-
Chennai. ( information from website www.grip.kline.co.jp ).
Presented below is the chief shipping lines operating in the world at present.
Chief Shipping Lines in the world
Shipping Routes Regions Connected
The North Atlantic Route W.Europe, E.Canada and USA
The Mediterranean-Red Sea-Indian Ocean
Route
N.W.Europe, Mediterranean, E.Europe, S.Asia
and E.Asia
The Cape Route W.Europe, Africa, Australia via Cape of Good
Hope
The South Atlantic Route S.E.South America, N.W. Europe,
Mediterranean
The Panama Route E.N.America, W.United States, W.Canada, Chile
The North Pacific Route W.N.America, E.Asia, N.America, Australia
Note: N-North, W-West, S-South, E-East
Table 6 - Chief shipping routes of the world
Information sourced from World Shipping council, Linear market shares BRS report for
routes, January 2015.
3.9.2 Sea Routes between Portugal to India
Different companies follow different routes for their voyage. Presented below is the
detailed description of K Line for their journey from Portugal to India. It can be observed
from their route schedule that they trans-ship their shipment for Portugal to India route.
Other than K Line companies which offer shipment from Portugal to India are mSC, CMA-
CGM & MOL. For comparison purposes, mSC & CMA-CGM are compared for routings
and costs.
The major sea ports in Portugal in which K Line operates are
• Leixoes
• Lisboa

THESIS DEVELOPMENT 83
Market study of Indian sea logistics and analysis of sea solutions between India and Portugal Kalyanasundaram Iyyappan
It operates to Indian ports which are as follows
• Kolkata
• Cochin
• Chennai
• Tuticorn
• Haldia
• Vizag
• Nhava Sheva
From here, other ports of India are covered either by road or railway network.
Below is the detailed explanation of routes of K Line along with its competitors.
➢ Leixoes – Indian Ports
The Annexure 6.12 describes the route information from Leixoes to different ports of
India. Although majority of carriers operate between this route, K Line, mSC, MOL &
CMA CGM are choosen as they are the main carriers who operate between these routes.
The above information is dated for 16 September 2017 and is sorted by the earliest
departure schedule. The price information have been sourced from the respective
company sources and is effective till 30 September 2017. There are different schedules
operated by them, but explained here is the shortest time (Earliest Departure, Earlier
Arrival) taken by them to reach the port of destination.
➢ Lisboa to Indian ports
The Annexure 6.13 explains the different routes provided by the major carriers which
ship from Portugal to Europe. Currently It can be clearly understood that it follows a
trans-shipment between the two countries. The above information is sourced from their
respective company website. It is effective till 30 September 2017. There may be
different routes and time schedules provided by the operators but explained here is the
shortest time (Earliest departure, Earliest Arrival) taken by them to reach the port of
destination.
➢ Sines to Indian Ports
The Annexure 6.14 describes the routes along with the cost of operating from Sines to
major Indian ports. It is to be noted that K Line does not operate from Sines and only
the other two major carriers mSC and CMA-CGM operates between them. However in
close comparison with the other two major ports of Portugal, Sines takes a longer
duration in average to reach the port of destination even though the cost of operation
is nearly the same. Respective information is sourced from the company website and
routings and cost are effective till 30 September 2017.

THESIS DEVELOPMENT 84
Market study of Indian sea logistics and analysis of sea solutions between India and Portugal Kalyanasundaram Iyyappan
3.9.3 Advantages and disadvantages of Direct & Trans-shipment
As explained in the previous section the explanation of direct and trans shipment
services, it is now beneficial to understand the advantages and disadvantages of both.
As seen above, the different routes between India and Portugal, the advantages &
disadvantages may be concluded as:
• Containers take a longer time to reach
As seen from the tables above, it is understood that majority of routes follow a
trans shipment route and only one route is offered as a direct service. In trans
shipment service, it can be understood that containers take a longer duration to
reach the port of destination.
Containers take a longer duration to reach the final destination as many days are wasted
in the trans shipment ports. From the above figure it is clear that the containers remain
idle for a period of 9 days, hence reaching the port of destination 9 days later which can
prove unsatisfactory to the customers. Example sourced from www.grip.kline.co.jp
• Inventory Costs
The major problem of trans-shipment also charges the container for inventory
costs. The more number of days the container stays at the port, it incurs
additional cost which are to be borne by the carriers. Hence if an option of direct
service is followed, additional costs such as inventory, handling costs can be
reduced. (Shipping Economics, Ross Robinson, pg 267-231)
• More number of human labour
For a trans-shipment route, additional human labour is required to operate the
containers. This can be either in the form of loading or off loading the containers
from the vessels. In general, labour requires money to do operations and hence
transhipment can charge for labour.(Franceso M Di, Fancello G et al (2015),
Optimal management of human resources in transhipment container ports).
• Additional Revenue to the carriers
Trans-shipment benefits the carriers. In broad terms, it can be said that in trans-
shipment locations, additional shipments can be loaded in the vessels, hence
offering revenue to the carriers. This can be one of the major reasons why
carriers often follow a trans-shipment route even though the time consumed is
Figure 25 - K Line route from Lisbon to Chennai

THESIS DEVELOPMENT 85
Market study of Indian sea logistics and analysis of sea solutions between India and Portugal Kalyanasundaram Iyyappan
high.(A survey of trans shipment in Pacific Island and countries-Opportunities for
increasing benefits and improving monitoring:1-70).
3.10 Highlights of K Line concerning Portugal and India trade
With the market research and increasing trade relations between the two countries,
forecast predicts that international trade between these countries will grow in the
coming years. Both these countries depend on each other for the goods and bilateral
trade is made possible with the help of several carriers travelling in this route. With the
ever growing trade, several competitors help by offering cut throat competition with
low cost and less time for the delivery. K Line also plays a major role in this sector by
offering frequent vessels for their operation between these routes and in close
comparison with their competitors, they offer less cost by delivering in the port of
destination. K Line can reduce their period of wait in the trans shipment port so that the
vessels reach the destination even more faster. In relation with the title of this
dissertation, market study of India proves a increasing trend for future years and K Line
can increase their profit for this route by operating more number of vessels between
these countries.

THESIS DEVELOPMENT 86
Market study of Indian sea logistics and analysis of sea solutions between India and Portugal Kalyanasundaram Iyyappan

87
<TÍTULO DA TESE> <NOME DO AUTOR>
CONCLUSIONS
4.1 CONCLUSIONS
4.1.1 Market study of India
4.1.2 Effective sea route between Portugal and India
4.2 Proposals of Future Works


CONCLUSIONS 89
Market study of Indian sea logistics and analysis of sea solutions between India and Portugal Kalyanasundaram Iyyappan
4 CONCLUSIONS AND PROPOSALS OF FUTURE WORKS
4.1 CONCLUSIONS
4.1.1 Market study of India
Regarding the Indian international trade, the exports are expected to reach $750 billion
by 2018-19 with improvement in the global trade scenario.(The Economic Times 17
September 2017). Despite the current uncertainities on global growth, The World Trade
Organisation (WTO) forecasted the growth in volume of global trade from 1.3% in 2016
to 2.4% in 2017. The global trade has surpassed this forecast and is growing in the range
from 1.8% to 3.6%. This can further continue ranging between 2.1% to 4% in 2018. The
2.4% growth in global trade volume in 2017 is because of stagnating imports to
developed countries which touched 2%. The demand for imports rose mainly from Asian
and European countries.
A complete analysis was done on the import export list of goods between Europe and
India. This was made possible because of the easily available data from the respective
Government sources and a comparison was done for the past 5 years. More focus was
given on the trade between India and Portugal and the importance of this trade is
studied thus achieving a complete justice to the market study section of this
dissertation.
4.1.2 Effective sea route between Portugal and India
To find the effective sea route between countries of Portugal and India, from annexure
12, 13 & 14 it can be understood that majority of the carriers follows a trans-shipment
route and only one direct route is available but with a high cost of operation. In my point
of view, routes operating from Lisbon & Leixoes to Indian ports can be considered as
effective routings as demand from these two ports is high in regard to the number of
services offered by different carriers. In order to estimate the perfect route from
Portugal to India, it becomes difficult as the trend in demand from these areas have to
be studied, the selection of Trans-shipment port in view of distance, waiting time, cost
should be considered which could not be done in a period of 6 months due to high data
in demand, many number of ports for loading, unloading and transhipment. Given a
database with the above mentioned difficulties, it might become a easy solution to
provide a perfect route in terms of less cost less time between the two countries.

CONCLUSIONS 90
Market study of Indian sea logistics and analysis of sea solutions between India and Portugal Kalyanasundaram Iyyappan
4.2 Proposals of Future Works
The growth in shipping container demand will increase the container volume in the
upcoming years, leading the over capacity in shipping industry to significantly worsen
and also double by the end of 2020.(Boston consulting Group-15 August 2017). This
consultant predicts growth between 2 and 3.3 million TEUs by the end of 2020. Industry
capacity also will grow in the range of 8.2% and 13.8% by the end of 2020, which is 7%
in demand in the current year. Global container traffic will grow between 2.2% and 3.8%
in the following years and with the increasing demand for international trade in India, K
Line should consider increasing their vessels to offer more services. Also in comparison
with the cost and duration offered by its competitor, K Line can revise their cost policy
and also reduce the number of days in the trans-shipment port by organising a faster
service vessel from that port. Hence if cost and the waiting period is reduced, it can
attract more customers.
In an article in ‘The Economic Times’ dated 18 September 2017, states that Maersk Line
is expanding its cargo-shipping role in India to establish as a provider of end-to-end
supply chain solutions that would include doorstep delivery. This would include the
company’s involvement in the road and railway legs of shipments for importers and
delivering consigments at factories or warehouses. Hence, K Line could look upon it and
instead of just doing a port to port business, it can go the extra mile in delivering inland
container depots to the costumer’s premises which can help increase revenue and
create more value proposition for customers.

CONCLUSIONS 91
Market study of Indian sea logistics and analysis of sea solutions between India and Portugal Kalyanasundaram Iyyappan


93
<TÍTULO DA TESE> <NOME DO AUTOR>
REFERENCES AND OTHER
SOURCES OF INFORMATION
5.1 Websites
5.2 Research papers


REFERENCES AND OTHER SOURCES OF INFORMATION 95
Market study of Indian sea logistics and analysis of sea solutions between India and Portugal Kalyanasundaram Iyyappan
5 REFERENCES AND OTHER SOURCES OF INFORMATION
5.1 Websites
1. K Line intranet: www.grip.kline.co.jp Accessed on 14 September 2017
2. K Line website: www.klineurope.com Accessed on 06 June 2017
3. Msc website: www.msc.com Accessed on 14 September 2017
4. CMA-CGM website : www.cma-cgm.com Accessed on 14 September 2017
5. www.eoilisbon.in Accessed on 15 July 2017
6. www.fd.ulisboa.pt Accessed on 16 July 2017
7. www.ec.europa.eu Accessed on 16 July 2017
8. www.commerce.gov.in Accessed on 15 July 2017
5.2 Research papers
Adam Smith.(1986), The Wealth of Nations, ISBN 13:9780140400120
Al-Bakery, Thamer, (2006). Marketing Communications and Promotion, The first edition,
Dar AlHamed for publishing and Distribution, Amman, Jordan
Balmer, John M. T. (2001). Corporate Identity, Corporate Branding and Corporate
Marketing – Seeing Through the Fog. European Journal of Marketing, Vol. 35, No. 3/4,
pp. 348‐291
Barabba, V. P., & Zaltman, G. (1991). Hearing the Voice of the Market: Competitive
Advantage through Creative Use of Market Information. Dar Al-Hamed for Publishing
and Distribution, Amman, Jordan
Blind, K. & Gauch, S. J Technol Transf (2009) 34: 320.
https://doi.org/10.1007/s10961-008-9089-8Creswell, John W. (2003). Research
Design – Qualitative, Quantitative, and Mixed Methods Approaches. 2nd Edition.
California: Sage publication Ltd.
Bush, S., Connell, M., & Denney, R. (2006). Ethical practice in forensic psychology.
Washington, DC: American Psychological Association
Creswell, John W. (2003). Research Design – Qualitative, Quantitative, and Mixed
Methods Approaches. 2nd Edition. California: Sage publication Ltd.
Cudahy, Brian J., "Box Boats: How Container Ships Changed the World" (2007).

REFERENCES AND OTHER SOURCES OF INFORMATION 96
Market study of Indian sea logistics and analysis of sea solutions between India and Portugal Kalyanasundaram Iyyappan
Dekeba, Alemayehu. 2003. ―Basic of Marketing Research Methods‖ URL:
http://www.globusz.com/ebooks/MarketingResearch/index.htm Econometrica 76 (5),
1017– 1074.
Gould, M.D., Porter, M.A., Williams, S., McDonald, M., Fenn, D.J. and Howison, S.D.,
Statistical properties of foreign exchange limit order books, 2011
Gupta, M. C., & Di Benedett, C. A., (2007). Optimal pricing and advertising strategy for
introducing a new business product with threat of competitive entry. Industrial
Marketing Management. Vol. 36 (4), 540–548.
Helpman, Elhanan, (1981), International trade in the presence of product
differentiation, economies of scale and monopolistic competition: A Chamberlin-
Heckscher-Ohlin approach, Journal of International Economics, 11, issue 3, p. 305-340
Jaworski, B. J. and A. K. Kohli (2000), “Market Orientation: Antecedents and
Consequences,” in Journal of Marketing, 57 (3), 53-70
Levinson, M. 2006. The Box: How the Shipping Container Made the World Smaller and
the World Economy Bigger. Princeton University Press. p. 1
McDonald, M. (2002). How come your marketing plans aren’t working?: The essential
guide to marketing planning. London: Kogan Page Limited
Metaxas BN (1971) The economics of tramp shipping. The Athlone Press of the
University of London, London
Notteboom T (2002) Current issues in port logistics and intermodality. Institute of
Transport and Maritime Management Antwerp and Institute of Maritime Transport and
Seaborne Trade, Antwerp
Nevo, A., (2001). Measuring market power in the ready-to-eat cereal industry.
Econometrica 69 (2), 307–342
Payer, H.G., (1999) “Feasibility and practical implications of container ships of 8000,
10,000 or even 15,000 Exhibition
Rantasila, K., Pilli-Sihvola, E., Permala, A., 2012 Technologies enabling efficient transport
monitoring, 5th European Conference on ICT for Transport Logistics, November 2012,
Gothenburg, Sweden
Steenken, D., Voss, S. and Stahlbock, R. (2004) Container terminal operation and
operations research: a classification and literature review, OR Spectrum, 26(1), pp. 3–49

REFERENCES AND OTHER SOURCES OF INFORMATION 97
Market study of Indian sea logistics and analysis of sea solutions between India and Portugal Kalyanasundaram Iyyappan
Stopford (2004), World Shipbuilding 2004, Advance Press Conference SMM 2004
Suez Canal Authority (2008) About Suez Canal.
http://www.suezcanal.gov.eg/sc.aspx?show=17
Van den Bulte Christophe, Yogeh V. Joshi (2007), "New Product Diffusion with
Influentials and Imitators", Marketing Science, 26 (3), 400-21
Van Everdingen, Y., & Fok, D. S. S., (2009). Modeling global spillover of new product
takeoff. Journal of Marketing Research, Vol. 46 (5), 637–652


REFERENCES AND OTHER SOURCES OF INFORMATION 99
Market study of Indian sea logistics and analysis of sea solutions between India and Portugal Kalyanasundaram Iyyappan


101
<TÍTULO DA TESE> <NOME DO AUTOR>
ANNEXES
6.1 Cargo traffic handled by major and non-major ports of India
6.2 Cargo handled at major ports
6.3 Exports & Imports Trade data
6.4 India’s top 10 imports for 2016-2017
6.5 India’s top 10 exports for 2016-2017
6.6 India’s trade with major countries
6.7 Top 10 major export companies of India
6.8 Key Figure’s of India’s trade relation with Europe
6.9 Total goods: EU trade flows and balance
6.10 Goods exported from India to Portugal
6.11 Goods Imported to India from Portugal
6.12 Sea Route from Leixoes to Indian Ports
6.13 Sea Routes from Lisbon to Indian Ports
6.14 Sea Routes from Sines to Indian Ports

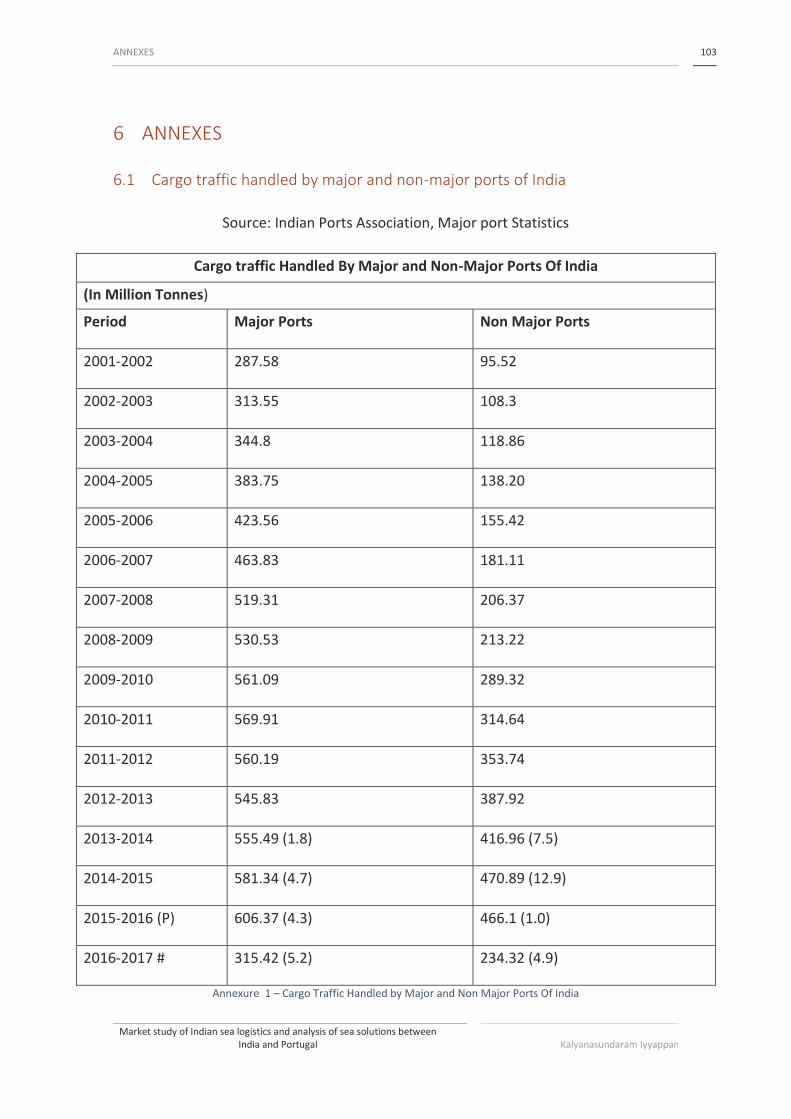
ANNEXES 103
Market study of Indian sea logistics and analysis of sea solutions between India and Portugal Kalyanasundaram Iyyappan
6 ANNEXES
6.1 Cargo traffic handled by major and non-major ports of India
Source: Indian Ports Association, Major port Statistics
Cargo traffic Handled By Major and Non-Major Ports Of India
(In Million Tonnes)
Period Major Ports Non Major Ports
2001-2002 287.58 95.52
2002-2003 313.55 108.3
2003-2004 344.8 118.86
2004-2005 383.75 138.20
2005-2006 423.56 155.42
2006-2007 463.83 181.11
2007-2008 519.31 206.37
2008-2009 530.53 213.22
2009-2010 561.09 289.32
2010-2011 569.91 314.64
2011-2012 560.19 353.74
2012-2013 545.83 387.92
2013-2014 555.49 (1.8) 416.96 (7.5)
2014-2015 581.34 (4.7) 470.89 (12.9)
2015-2016 (P) 606.37 (4.3) 466.1 (1.0)
2016-2017 # 315.42 (5.2) 234.32 (4.9)
Annexure 1 – Cargo Traffic Handled by Major and Non Major Ports Of India


ANNEXES 105
Market study of Indian sea logistics and analysis of sea solutions between India and Portugal Kalyanasundaram Iyyappan
6.2 Cargo handled at major ports
Port Traffic
Period
P.O.L(Crude,
LPG/LNG)
Other
liquids
Iron Ore
Including
Pellets
Fertilizers Coal containers Other
Misc.
cargo
Total % Var
against
2016-
2017
Fine Raw Thermal,
Steam
Cooking,
others
Tonnage TEUs
Kolkalta
Kolkata Dock
System
April-
Aug
2017
April-
Aug
2016
.
278
318
350
294
-
-
59
38
9
-
7
-
147
517
4089
4299
266
279
1936
1628
6875
7094
-3.09
Kolkata
Haldia Dock
System
April-
Aug
2017
April-
Aug
2016
3452
2632
2066
1848
640
68
209
48
118
90
799
599
4640
5103
1044
590
57
40
3129
2540
16097
13518
19.08

ANNEXES 106
Market study of Indian sea logistics and analysis of sea solutions between India and Portugal Kalyanasundaram Iyyappan
Total Kolkata April-
Aug
2017
April-
Aug
2016
3730
2950
2416
2142
640
68
268
86
127
90
806
599
4787
5620
5133
4889
323
319
5065
4168
22972
20612
11.45
Paradip April-
Aug
2017
April-
Aug
2016
14418
10715
648
870
4419
2857
4
20
1806
1614
10438
12147
5009
4212
25
28
2
1
3607
3403
40374
35866
12.57
Visakhapatnam April-
Aug
2017
April-
Aug
2016
6948
6655
856
756
4581
4262
860
938
411
379
2983
4137
2338
1983
2662
2687
154
156
3806
3975
25445
25772
-1.27

ANNEXES 107
Market study of Indian sea logistics and analysis of sea solutions between India and Portugal Kalyanasundaram Iyyappan
Kamaraj
(Ennore)
April-
Aug
2017
April-
Aug
2016
1751
1686
44
46
-
-
-
-
-
-
9279
9716
-
79
-
1
-
-
1005
1012
12079
12540
-3.68
Chennai April-
Aug
2017
April-
Aug
2016
5747
5494
703
518
-
-
-
12
52
87
-
-
-
-
12751
12195
661
632
2711
3640
21964
21946
0.08
V.O
Chidambaranar
April-
Aug
2017
April-
Aug
2016
294
289
338
391
-
-
60
207
381
375
3502
4845
1337
1704
5644
5468
281
272
2923
2946
14479
16225
-10.76

ANNEXES 108
Market study of Indian sea logistics and analysis of sea solutions between India and Portugal Kalyanasundaram Iyyappan
Cochin April-
Aug
2017
April-
Aug
2016
8071
6306
146
222
-
-
15
-
98
117
-
44
-
-
3166
2807
228
202
435
447
11931
9943
19.99
New
Mangalore
April-
Aug
2017
April-
Aug
2016
9587
9417
790
686
1817
124
211
167
51
26
1496
1389
1042
1553
631
538
40
36
496
333
16121
14233
13.26
Mormugao April-
Aug
2017
April-
Aug
2016
257
239
246
150
3960
4065
82
68
-
-
873
1504
4084
3372
161
158
11
11
1575
1937
11238
11493
-2.22

ANNEXES 109
Market study of Indian sea logistics and analysis of sea solutions between India and Portugal Kalyanasundaram Iyyappan
Mumbai April-
Aug
2017
April-
Aug
2016
15440
15383
803
893
2865
2910
88
115
30
-
1095
1191
1797
1712
262
245
20
19
3456
3103
25836
25552
1.11
J.N.P.T April-
Aug
2017
April-
Aug
2016
1936
1719
1102
947
-
-
-
-
-
-
-
-
-
-
24170
22949
2020
1903
327
317
27535
25932
6.18
Kandla April-
Aug
2017
April-
Aug
2016
24966
25108
3652
3310
450
199
1629
1957
45
165
4656
7604
116
170
659
76
44
4
7813
6604
43986
45193
-2.67

ANNEXES 110
Market study of Indian sea logistics and analysis of sea solutions between India and Portugal Kalyanasundaram Iyyappan
All Ports April-
Aug
2017
April-
Aug
2016
93145
85961
11744
10931
18732
14485
3217
3570
3001
2853
35128
43176
20510
20405
55264
52041
3784
3555
33219
31885
273960
265307
3.26
% variation from
previous year
8.36 7.44 29.32 -
9.89
5.19 -18.64 0.51 6.19 6.44 4.18 3.26
Annexure 2 - Traffic Handled at major ports

ANNEXES 111
Market study of Indian sea logistics and analysis of sea solutions between India and Portugal Kalyanasundaram Iyyappan
6.3 Exports & Imports Trade data
Source: Reserve Bank Of India dated 14 August 2017
Exports & Imports (US$ Million)
(Provisional)
July April-July
Exports
2016-2017 21689.57 87001.34
2017-2018 22543.80 94756.13
% Growth 2017-18/ 2016-17 3.94 8.91
Imports
2016-2017
29450.97 113996.75
2017-2018
33993.61 146256.71
% Growth 2017-18/ 2016-17 15.42 28.30
Trade Balance
2016-2017
-7761.40 -26995.41
2017-2018 -11449.81 -51500.58
Annexure 3 - Exports & Imports Trade data

ANNEXES 112
Market study of Indian sea logistics and analysis of sea solutions between India and Portugal Kalyanasundaram Iyyappan
6.4 India’s top 10 imports for 2016-2017
Source : International Trade Database- India, 2017
S.No Type Of Goods Value (US$ Billion) % Share (%) of total
Imports
1. Mineral fuels
including oil
89.3 25
2. Gems, precious
metals
48.1 13.5
3. Electrical
machinery,
equipment
37 10.4
4. Machinery
including
computers
32.5 9.1
5. Organic chemicals 14.8 4.1
6. Plastics, Plastic
articles
11.4 3.2
7. Animal/Vegetable
fats, oils, waxes
10.5 2.9
8. Iron, Steel 8.7 2.4
9. Optical, technical,
medical apparatus
7.2 2
10. Ships, boats 5.5 1.5 Annexure 4 - India's top 10 imports for 2016-2017
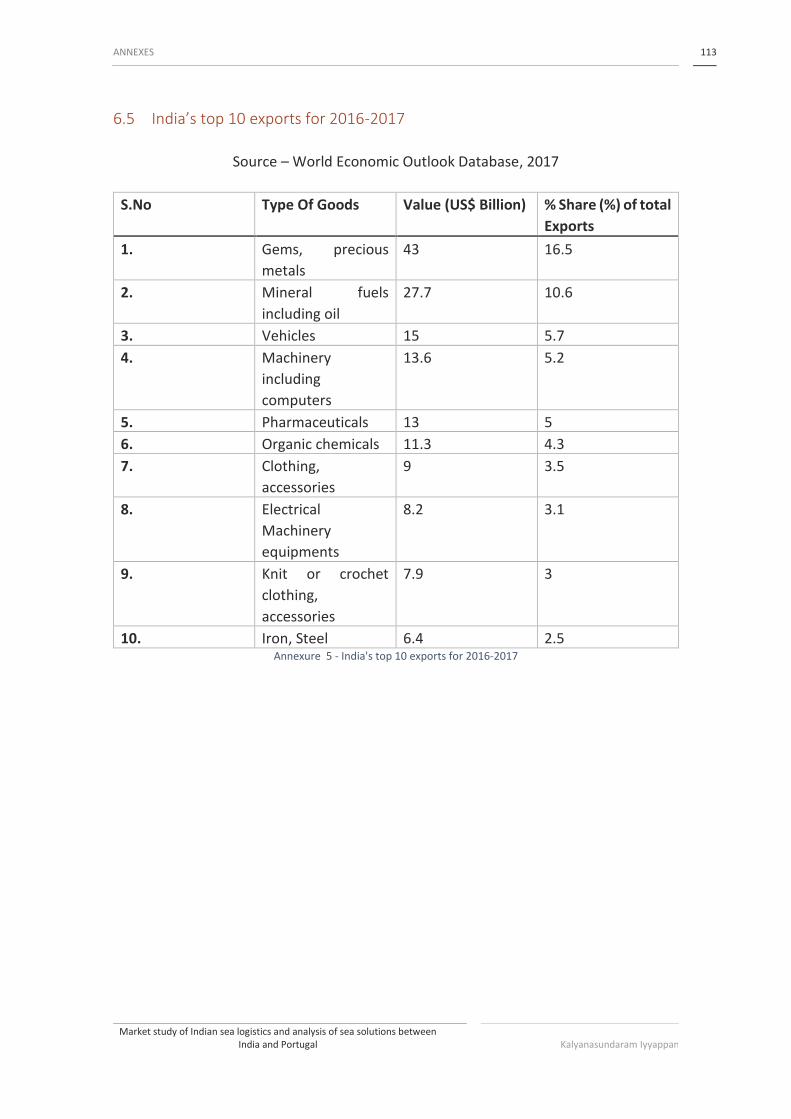
ANNEXES 113
Market study of Indian sea logistics and analysis of sea solutions between India and Portugal Kalyanasundaram Iyyappan
6.5 India’s top 10 exports for 2016-2017
Source – World Economic Outlook Database, 2017
S.No Type Of Goods Value (US$ Billion) % Share (%) of total
Exports
1. Gems, precious
metals
43 16.5
2. Mineral fuels
including oil
27.7 10.6
3. Vehicles 15 5.7
4. Machinery
including
computers
13.6 5.2
5. Pharmaceuticals 13 5
6. Organic chemicals 11.3 4.3
7. Clothing,
accessories
9 3.5
8. Electrical
Machinery
equipments
8.2 3.1
9. Knit or crochet
clothing,
accessories
7.9 3
10. Iron, Steel 6.4 2.5 Annexure 5 - India's top 10 exports for 2016-2017
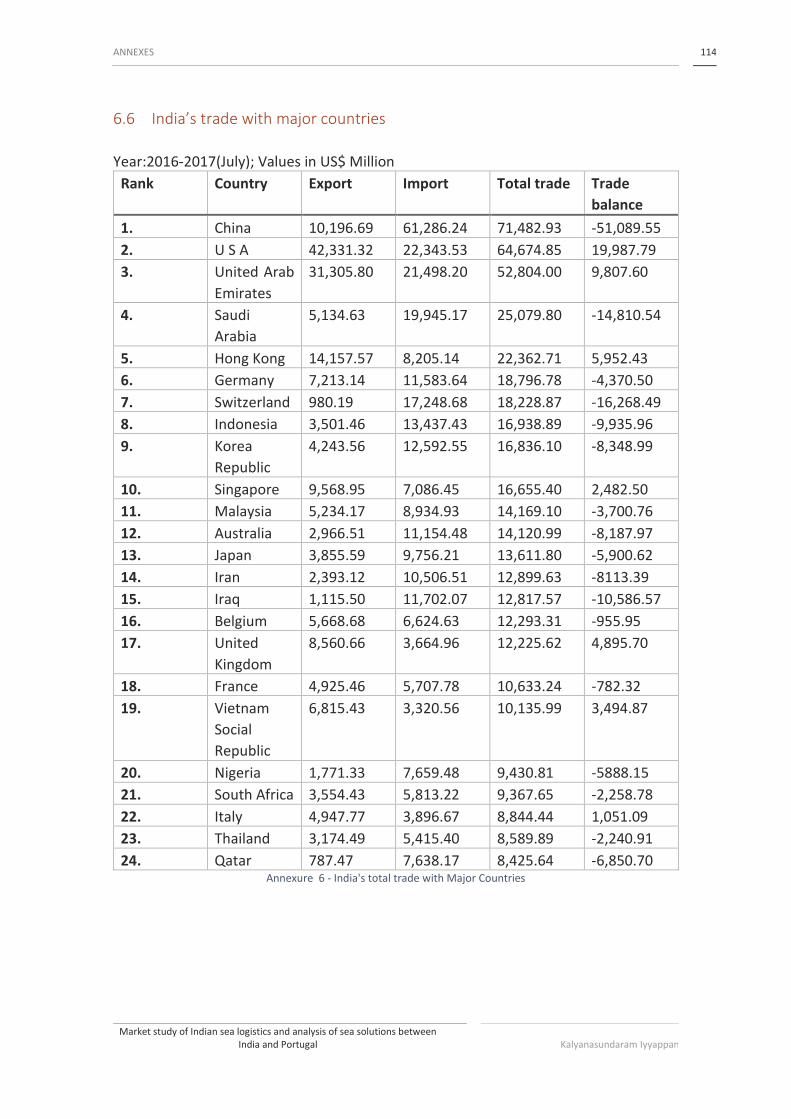
ANNEXES 114
Market study of Indian sea logistics and analysis of sea solutions between India and Portugal Kalyanasundaram Iyyappan
6.6 India’s trade with major countries
Year:2016-2017(July); Values in US$ Million
Rank Country Export Import Total trade Trade
balance
1. China 10,196.69 61,286.24 71,482.93 -51,089.55
2. U S A 42,331.32 22,343.53 64,674.85 19,987.79
3. United Arab
Emirates
31,305.80 21,498.20 52,804.00 9,807.60
4. Saudi
Arabia
5,134.63 19,945.17 25,079.80 -14,810.54
5. Hong Kong 14,157.57 8,205.14 22,362.71 5,952.43
6. Germany 7,213.14 11,583.64 18,796.78 -4,370.50
7. Switzerland 980.19 17,248.68 18,228.87 -16,268.49
8. Indonesia 3,501.46 13,437.43 16,938.89 -9,935.96
9. Korea
Republic
4,243.56 12,592.55 16,836.10 -8,348.99
10. Singapore 9,568.95 7,086.45 16,655.40 2,482.50
11. Malaysia 5,234.17 8,934.93 14,169.10 -3,700.76
12. Australia 2,966.51 11,154.48 14,120.99 -8,187.97
13. Japan 3,855.59 9,756.21 13,611.80 -5,900.62
14. Iran 2,393.12 10,506.51 12,899.63 -8113.39
15. Iraq 1,115.50 11,702.07 12,817.57 -10,586.57
16. Belgium 5,668.68 6,624.63 12,293.31 -955.95
17. United
Kingdom
8,560.66 3,664.96 12,225.62 4,895.70
18. France 4,925.46 5,707.78 10,633.24 -782.32
19. Vietnam
Social
Republic
6,815.43 3,320.56 10,135.99 3,494.87
20. Nigeria 1,771.33 7,659.48 9,430.81 -5888.15
21. South Africa 3,554.43 5,813.22 9,367.65 -2,258.78
22. Italy 4,947.77 3,896.67 8,844.44 1,051.09
23. Thailand 3,174.49 5,415.40 8,589.89 -2,240.91
24. Qatar 787.47 7,638.17 8,425.64 -6,850.70 Annexure 6 - India's total trade with Major Countries

ANNEXES 115
Market study of Indian sea logistics and analysis of sea solutions between India and Portugal Kalyanasundaram Iyyappan
6.7 Top 10 major export companies of India
Source: Forbes 2016 Global 2000 individual company profiles, Example of top Indian
company compiled here is Reliance Industries. Accessed on June 20, 2017
Trade Map, International Trade Centre. Accessed on June 20, 2017
S.No Company Value for
Period- (2016-
2017) US$
Billions
% Share (%)
From 2015
1. Indian Oil
Corporation
70.6 Down -5.3%
2. Reliance Industries 42.2 Down -42%
3. Tata Motors 40.5 Up 17.4%
4. Bharat Petroleum 38.4 Down -4.8%
5. Oil & Natural Gas
Corporation of
India
26.1 Down -11.9%
6. Tata Steel 18.7 Down -21.3%
7. Hindalco Industries 16.9 Up 16%
8. Coal India 11.8 Down -6.4%
9. Mahindra &
Mahindra
10.5 Down -15.7%
10. Steel Authority of
India
7.4 Down -9.5%
Annexure 7 - Top 10 Major Export Companies of India

ANNEXES 116
Market study of Indian sea logistics and analysis of sea solutions between India and Portugal Kalyanasundaram Iyyappan
6.8 Key Figure’s of India’s trade relation with Europe
Indicator Unit Period Imports Exports Total
Trade
Balance
Last Year Mio Euros 2016 39,626 37,745 77,021 -1,530
Rank as EU
partner
2016 9 10 9
Share in
EU trade
% 2016 2.3 2.2 2.2
Annual
growth
rate
% 2015-
2016
-0.5 -1.0
Annual
average
growth
rate
% 2012-
2016
1.1 -0.6
Annexure 8 – Key Figures of India’s trade relation with Europe
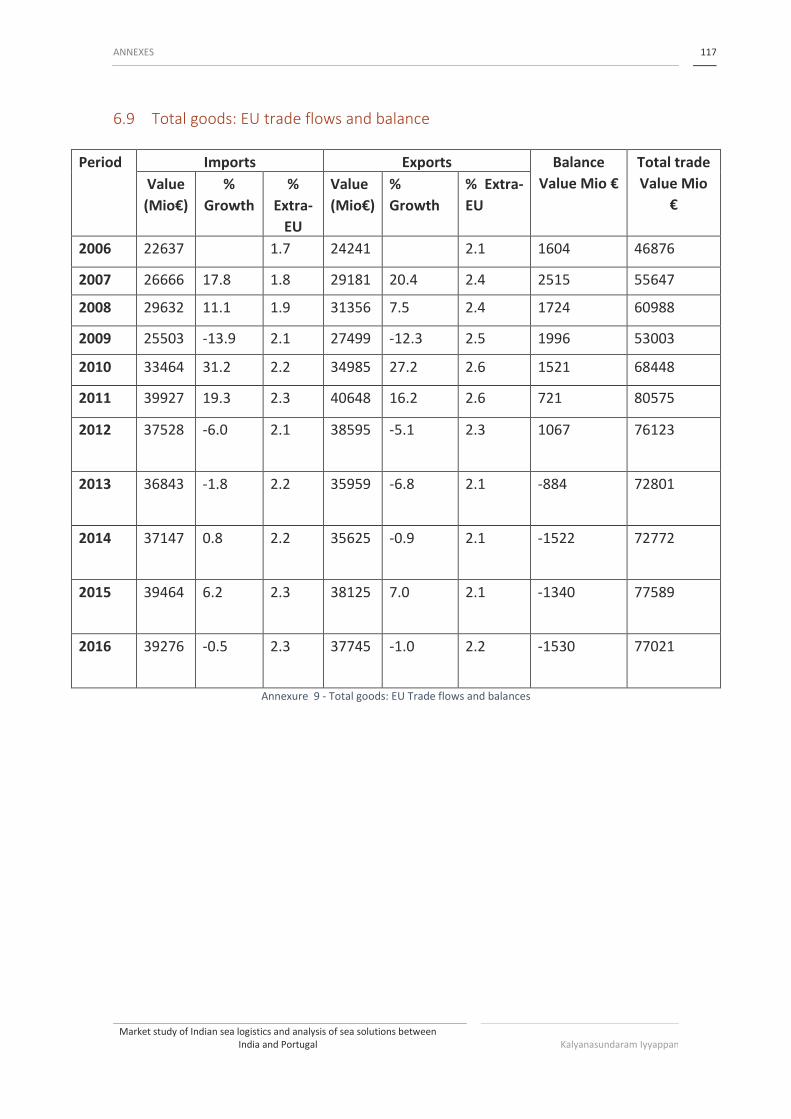
ANNEXES 117
Market study of Indian sea logistics and analysis of sea solutions between India and Portugal Kalyanasundaram Iyyappan
6.9 Total goods: EU trade flows and balance
Period Imports Exports Balance
Value Mio €
Total trade
Value Mio
€
Value
(Mio€)
%
Growth
%
Extra-
EU
Value
(Mio€)
%
Growth
% Extra-
EU
2006 22637 1.7 24241 2.1 1604 46876
2007 26666 17.8 1.8 29181 20.4 2.4 2515 55647
2008 29632 11.1 1.9 31356 7.5 2.4 1724 60988
2009 25503 -13.9 2.1 27499 -12.3 2.5 1996 53003
2010 33464 31.2 2.2 34985 27.2 2.6 1521 68448
2011 39927 19.3 2.3 40648 16.2 2.6 721 80575
2012 37528 -6.0 2.1 38595 -5.1 2.3 1067 76123
2013 36843 -1.8 2.2 35959 -6.8 2.1 -884 72801
2014 37147 0.8 2.2 35625 -0.9 2.1 -1522 72772
2015 39464 6.2 2.3 38125 7.0 2.1 -1340 77589
2016 39276 -0.5 2.3 37745 -1.0 2.2 -1530 77021
Annexure 9 - Total goods: EU Trade flows and balances

ANNEXES 118
Market study of Indian sea logistics and analysis of sea solutions between India and Portugal Kalyanasundaram Iyyappan
6.10 Goods exported from India to Portugal
The below annexure gives information on the goods that are exported from India to
Portugal. All the values are in US$ Million.
S.No HS
Code
Commodity 2015-
2016
2016-
2017
%
Growth
1 03 Fish and Crustaceans,
Molluscs and other Aquatic
Invertabrates
44.34 58.87 32.52
2 05 Products of animal origin, not
elsewhere specified or
included
0.27 0.17 -35.87
3 06 Live trees and other plants;
bulbs; roots and the like; cut
flowers and ornamental
foliage
0.16 0.11 -29.98
4 07 Edible vegetables and certain
roots and tubers
1.94 1.69 -12.92
5 08 Edible fruit and nuts; Peel or
Citrus Fruit or Melons
1.38 1.13 -17.66
6 09 Coffee, Tea, Mate and Spices 7.10 7.88 10.95
7 10 Cereals 4.35 5.79 33.19
8 11 Products of the Milling
industry; Malt; Starches;
Inulin; wheat Gluten
0.00
9 12 Oil seeds and Olea Fruits;
Misc Grains seeds and Fruit;
Industrial or Medicinal Plants;
straw and fodder
0.34 0.34 0.80
10 13 Lac; Gums, resins and Other
Vegetable Saps and Extracts
0.09 0.34 263.33
11 14 Vegetable Plaiting Materials;
Vegetable Products not
elsewhere specified or
included
0.01 0.02 19.05
12 15 Animal or Vegetable Fats and
Oils and their Cleavage
Products; Pre edible fats;
Animal or vegetable waxex
0.01 0.01 41.67

ANNEXES 119
Market study of Indian sea logistics and analysis of sea solutions between India and Portugal Kalyanasundaram Iyyappan
13 16 Preparations of Meat of fish
or of crustaceans, molluscs or
other aquatic invertebrates
0.07
14 17 Sugars and sugar
confectionary
0.07 0.00 -92.68
15 18 Cocoa and cocoa
preparations
0.00
16 19 Preparations of cereals, flour,
starch or milk; pastry cooks
products
0.31 0.13 -59.09
17 20 Preparations of vegetables,
fruit, nuts or other parts of
plants
0.11 0.17 59.23
18 21 Miscellaneous edible
preparations
0.04 0.03 -43.60
19 22 Beverages, spirits and vinegar 0.01
20 23 Residues and waste from the
food industries; prepared
animal foder
0.01 0.00 -50.00
21 24 Tobacco and manufactured
tobacco substitutes
2.07 0.36 -82.66
22 25 Salt,sulphur; earths and
stone; plastering materials,
lime and cement
0.68 0.28 -58.35
23 27 Mineral fuels, mineral oils
and products of their
distillation; bituminous
substances; mineral waxes
0.04 0.02 -59.28
24 28 Inorganic chemicals; organic
or inorganic compounds of
precious metals of rare-earth
metals, or radi.elem or of
isotopes
2.90 3.72 28.19
25 29 Organic chemicals 25.17 23.07 -8.35
26 30 Pharmaceutical products 5.44 4.04 -25.74
27 32 Tanning or dyeing extracts;
tannins and their derivatives
dyes, pigments and other
colouring matter; paints and
ver; putty and other mastics;
inks
12.89 10.69 -17.08

ANNEXES 120
Market study of Indian sea logistics and analysis of sea solutions between India and Portugal Kalyanasundaram Iyyappan
28 33 Essential oils and resinoids;
perfumery, cosmetic or toilet
preparations
0.65 0.66 0.87
29 34 Soap, organic surface-active
agents, washing
preparations, lubricating
preparations, artificial waxes,
prepared waxes, polishing or
scouring preparations
0.01 0.02 232.86
30 35 Albuminoidal substances;
modified starches; glues;
enzymes
0.24 0.13 -45.62
31 36 Explosives; pyrotechnic
products;matches;Pyrophoric
alloys; certain combustible
preparations
0.32 0.19 -40.86
32 38 Miscellaneous chemical
products
4.68 6.71 43.33
33 39 Plastic and articles thereof 35.19 30.11 -14.43
34 40 Rubber and articles thereof 19.32 19.37 0.24
35 41 Raw hides and skins (other
than furskis) and leather
17.28 15.36 -11.12
36 42 Articles of leather, saddlery
and harness; travel goods,
handbags and similar articles
of animal gut (other than Silk
worm) Gut.
7.42 8.54 15.14
37 43 Furskins and artificial fur,
manufactures therof
0.01 0.03 131.36
38 44 Wood and articles of wood;
wood charcoal
0.40 0.31 -23.78
39 45 Cork and articles of cork 0.00
40 46 Manufactures of straw of
Esparto or of other plaiting
materials; basketware and
wickerwork
41 48 Paper and paperboard;
articles of paper pulp of paper
or of paperboard
1.23 2.05 66.56
42 49 Printed books, newspapers,
pictures and other products
of the printing industry,
0.50 0.28 -45.32

ANNEXES 121
Market study of Indian sea logistics and analysis of sea solutions between India and Portugal Kalyanasundaram Iyyappan
manuscripts, typescripts and
plans
43 50 Silk 0.13 0.03 -77.21
44 51 Wool, Fine or Coarse animal
hair, horsehair yarn and
woven fabric
2.92 0.28 -90.32
45 52 Cotton 124.20 140.84 13.40
46 53 Other vegetable textile fibres;
paper yarn and woven fabrics
of paper yarn
0.60 0.68 12.64
47 54 Man-made filaments 12.15 14.16 16.34
48 55 Man-made Staple fibres 26.13 25.20 -3.59
49 56 Wadding, felt and
nonwovens; spacial yarns;
Twine, Cordage, ropes and
cables and articles thereof
0.50 0.48 -3.92
50 57 Carpets and other textile
floor coverings
10.48 9.76 -6.82
51 58 Special woven fabrics; tufted
textile fabrics;lace;
tapesteries; trimmings;
embroidery
0.86 0.69 -19.57
52 59 Impregnated, coated,
covered, or laminated textile
fabrics; textile articles of a
kind suitable for industrial
use
0.14 0.03 -76.42
53 60 Knitted or crocheted fabrics 0.01 0.17 2112.66
54 61 Articles of apparel and
clothing accessories, knitted
or crocheted
10.20 10.54 3.27
55 62 Articles of apparel and
clothing accessories, not
knitted or corcheted
23.
79
29.92 25.77
56 63 Other made up textiles
articles; sets; worn clothing
and worn textile articles; rags
7.12 8.07 13.28
57 64 Footwear, gaiters and the
like; parts of such articles
38.52 45.36 17.76
58 65 Headgear and parts thereof 0.05 0.10 89.60
59 66 Umbrellas, sun
umbrellas,walking-sticks,
0.00

ANNEXES 122
Market study of Indian sea logistics and analysis of sea solutions between India and Portugal Kalyanasundaram Iyyappan
seat-sticks, whips, riding-
crops and parts thereof
60 67 Prepared feathers and down
and articles made of feathers
or of down; artificial flowers;
articles of human hair
0.77 0.49 -35.95
61 68 Articles of stone, plaster,
cement, asbestos, mica or
similar materials
0.99 1.28 29.36
62 69 Ceramic products 0.05 0.04 -32.52
63 70 Glass and Glassware 1.48 1.59 7.79
64 71 Natural or cultured pearls,
precious or semiprecious
stones, pre metals, clad with
pre metal and articles thereof
imitation jewellery; coins
1.43 0.94 -34.12
65 72 Iron and steel 41.34 84.43 103.73
66 73 Articles of iron and steel 7.56 7.18 -4.94
67 74 Copper and articles thereof 1.13 1.17 4.02
68 76 Aluminium and articles
thereof
1.75 2.25 28.19
69 79 Zinc and articles thereof 0.06 0.14 137.76
70 82 Tools implements, cutlery,
spoons and forks, of base
metal; parts thereof base
metal
0.81 0.64 -20.64
71 83 Miscellaneous articles of base
metal
0.87 0.99 14.00
72 84 Nuclear reactors, boilers,
machinery and mechanical
appliances; parts thereof
40.15 25.44 -36.64
73 85 Electrical machinery and
equipment and parts thereof;
sound recorders and
reproducers, television image
and sound recorders and
reproducers and parts
15.75 21.29 35.15
74 86 Railway or tramway
locomotives, rolling stock and
parts thereof; railways or
tramways track fixtures and
0.00
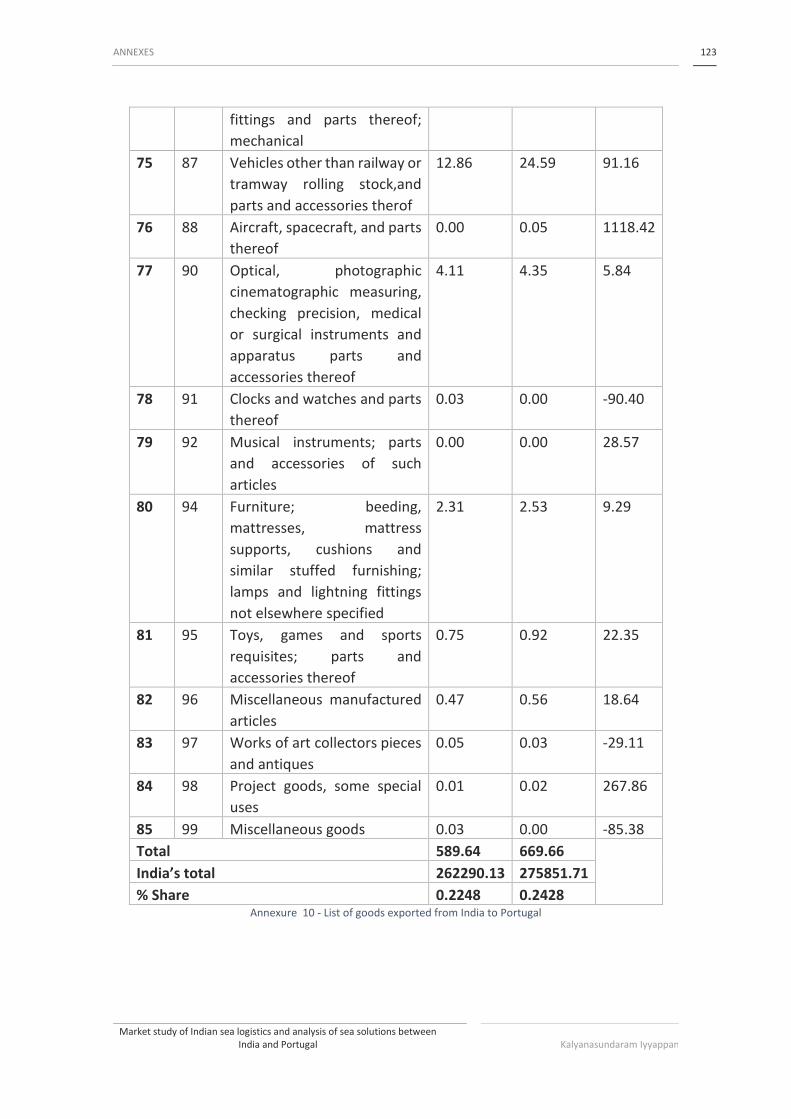
ANNEXES 123
Market study of Indian sea logistics and analysis of sea solutions between India and Portugal Kalyanasundaram Iyyappan
fittings and parts thereof;
mechanical
75 87 Vehicles other than railway or
tramway rolling stock,and
parts and accessories therof
12.86 24.59 91.16
76 88 Aircraft, spacecraft, and parts
thereof
0.00 0.05 1118.42
77 90 Optical, photographic
cinematographic measuring,
checking precision, medical
or surgical instruments and
apparatus parts and
accessories thereof
4.11 4.35 5.84
78 91 Clocks and watches and parts
thereof
0.03 0.00 -90.40
79 92 Musical instruments; parts
and accessories of such
articles
0.00 0.00 28.57
80 94 Furniture; beeding,
mattresses, mattress
supports, cushions and
similar stuffed furnishing;
lamps and lightning fittings
not elsewhere specified
2.31 2.53 9.29
81 95 Toys, games and sports
requisites; parts and
accessories thereof
0.75 0.92 22.35
82 96 Miscellaneous manufactured
articles
0.47 0.56 18.64
83 97 Works of art collectors pieces
and antiques
0.05 0.03 -29.11
84 98 Project goods, some special
uses
0.01 0.02 267.86
85 99 Miscellaneous goods 0.03 0.00 -85.38
Total 589.64 669.66
India’s total 262290.13 275851.71
% Share 0.2248 0.2428 Annexure 10 - List of goods exported from India to Portugal

ANNEXES 124
Market study of Indian sea logistics and analysis of sea solutions between India and Portugal Kalyanasundaram Iyyappan
6.11 Goods Imported to India from Portugal
The below annexure gives information on the list of goods that are imported to India
from Portugal. All the values are in US$ Million.
S.No. HS Code Commodity 2015-2016 2016-2017 %
Growth
1 06 Live trees and
other plants;
bulbs; roots and
the like; cut
flowers and
ornamental
foliage
0.64
2 07 Edible Vegetables
and certain roots
and tubers
0.01
3 08 Edible Fruit and
Nuts; Peel or
Citrus Fruit or
Melons
0.00 0.00 625.00
4 14 Vegetable Plaiting
Materials;
Vegetable
Products not
elsewhere
Specified or
Included
5 15 Animal or
Vegetable Fats
and oils and their
cleavage
products; pre
edible fats; animal
or vegetable
waxex
0.85 0.80 -5.47
6 18 Cocoa and cocoa
preparations
0.06 0.01 -83.48

ANNEXES 125
Market study of Indian sea logistics and analysis of sea solutions between India and Portugal Kalyanasundaram Iyyappan
7 19 Preparations of
cereals, Flour,
Starch or Milk;
Pastry cooks
products
0.00
8 20 Preparations of
Vegetables, fruits,
nuts or other
parts of plants
0.03 0.19 561.38
9 21 Miscellaneous
Edible
preparations
0.21 0.12 -43.16
10 22 Beverages, spirits
and Vinegar
0.09 0.10 6.26
11 24 Tobacco and
Manufactured
Tobacco
Substitutes
0.00
12 25 Salt; Sulphur;
Earths and Stone;
Plastering
Materials, Lime
and Cement
3.66 4.19 14.36
13 26 Ores, Slag and Ash 0.95 1.60 68.78
14 27 Mineral Fuels,
Mineral Oil and
Products of Their
Distillation;
Bituminous
Substances;
Mineral waxes
0.03 27.76 81,559.71
15 28 Inorganic
chemicals;
organic or
inorganic
compounds of
precious metals of
rare earth metals
0.04 0.01 -74.59

ANNEXES 126
Market study of Indian sea logistics and analysis of sea solutions between India and Portugal Kalyanasundaram Iyyappan
or radi.elem or of
isotopes
16 29 Organic
Chemicals
5.86 19.29 228.95
17 30 Pharmaceutical
products
0.15 0.82 461.92
18 32 Tanning or Dyeing
Extracts; Tannins
and their Deri.
Dyes, Pigments
and other
colouring matter;
paints and Ver;
Putty and Other
Mastics; Inks
0.61 0.37 -39.08
19 33 Essential oils and
Resinoids;
Perfumery,
cosmetic or toilet
preparations
0.02 0.14 660.89
20 34 Soap, Organic
surface-Active
agents, washing
preparations,
lubricating
preparations,
artificial waxes,
prepared waxes,
polishing or
scouring
preparations
0.12 0.12 -0.56
21 35 Albuminoidal
Substances,
Modified
Starches; Glues;
Enzymes
0.04 0.15 273.11
22 38 Miscellaneous
Chemical
Products
0.96 2.63 172.64

ANNEXES 127
Market study of Indian sea logistics and analysis of sea solutions between India and Portugal Kalyanasundaram Iyyappan
23 39 Plastic and
articles therof
9.33 10.25 9.87
24 40 Rubber and
Articles therof
0.89 0.78 -12.64
25 41 Raw hides and
skins (other than
furskins) and
leather
5.10 5.51 8.13
26 42 Articles of Leather
Saddlery and
Harness; Travel
goods; Handbags
and similar
containing articles
of animal Gut
(other than Silk
worm) Gut.
0.61 0.39 -35.45
27 43 Furskins and
Artificial Fur,
Manufactures
Therof
0.01 0.01 73.97
28 44 Wood and Articles
of Wood; Wood
Charcoal
0.94 0.92 -2.16
29 45 Cork and articles
of Cork
2.54 2.43 -4.07
30 47 Pulp of wood or of
other fibrous
cellulosic
material; waste
and scrap of
paper or
paperboard
0.45 0.42 -6.34
31 48
Paper and
paperboard;
articles of paper
pulp, of paper or
paperboard
5.10 5.16 1.09
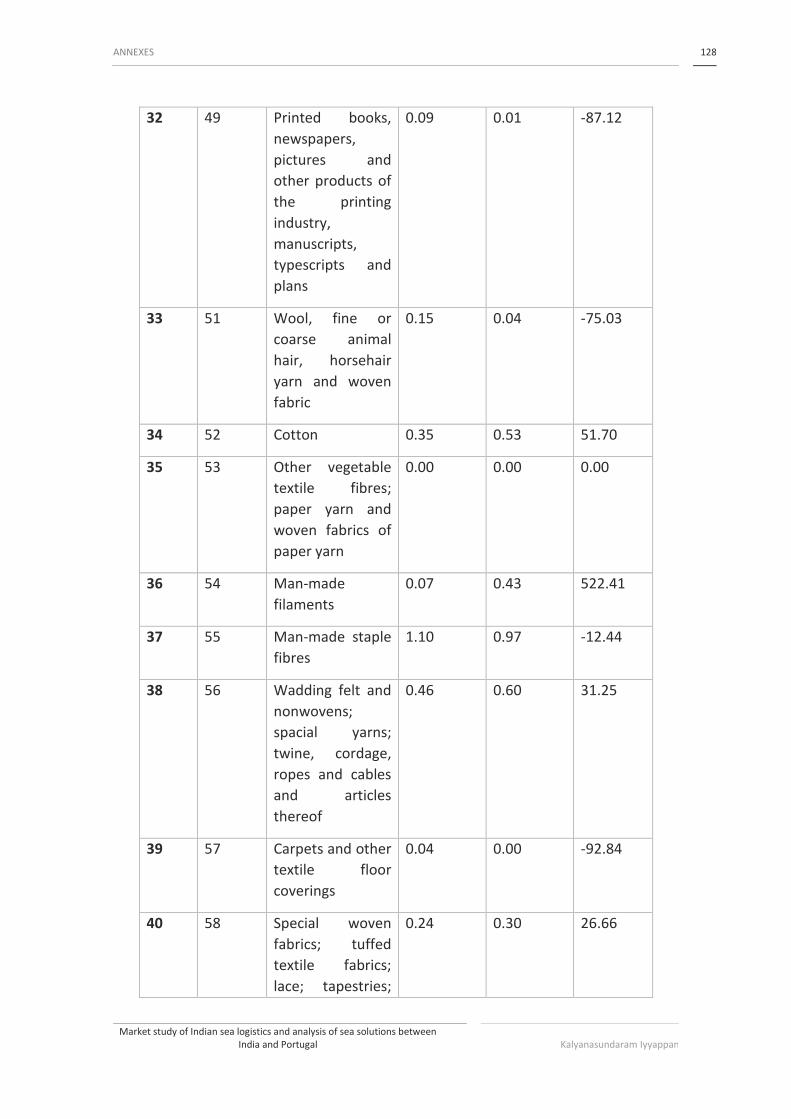
ANNEXES 128
Market study of Indian sea logistics and analysis of sea solutions between India and Portugal Kalyanasundaram Iyyappan
32 49 Printed books,
newspapers,
pictures and
other products of
the printing
industry,
manuscripts,
typescripts and
plans
0.09 0.01 -87.12
33 51 Wool, fine or
coarse animal
hair, horsehair
yarn and woven
fabric
0.15 0.04 -75.03
34 52 Cotton 0.35 0.53 51.70
35 53 Other vegetable
textile fibres;
paper yarn and
woven fabrics of
paper yarn
0.00 0.00 0.00
36 54 Man-made
filaments
0.07 0.43 522.41
37 55 Man-made staple
fibres
1.10 0.97 -12.44
38 56 Wadding felt and
nonwovens;
spacial yarns;
twine, cordage,
ropes and cables
and articles
thereof
0.46 0.60 31.25
39 57 Carpets and other
textile floor
coverings
0.04 0.00 -92.84
40 58 Special woven
fabrics; tuffed
textile fabrics;
lace; tapestries;
0.24 0.30 26.66

ANNEXES 129
Market study of Indian sea logistics and analysis of sea solutions between India and Portugal Kalyanasundaram Iyyappan
trimmings;
embroidery
41 59 Impregnated,
coated, coivered
or laminated
textile fabrics,
textile articles of a
kind suitable for
industrial use
1.63 1.70 4.17
42 60 Knitted or
crocheted fabrics
0.01 0.02 200.00
43 61 Articles of apparel
and clothing
accessories,
knitted or
corcheted
0.47 0.48 3.14
44 62 Articles of apparel
and clothing
accessories, not
knitted or
crocheted
0.70 0.54 -22.00
45 63 Other made up
textile articles;
sets; worn
clothing and worn
textile articles;
rags
0.57 0.35 -37.96
46 64 Footwear, gaiters
and the like; parts
of such articles
1.25 1.44 15.05
47 65 Headgear and
parts thereof
0.05 0.08 68.96
48 66 Umbrellas, sun
umbrellas,
walking-sticks,
seat-sticks, whips,
riding-crops and
parts thereof
0.00

ANNEXES 130
Market study of Indian sea logistics and analysis of sea solutions between India and Portugal Kalyanasundaram Iyyappan
49 67 Prepared feathers
and down and
articles made of
feathers or of
down; artificial
flowers; articles
of human hair
0.00 0.00 900.00
50 68 Articles of stone,
plaster, cement,
asbestos, mica or
similar products
4.50 3.67 -18.39
51 69 Ceramic products 1.05 0.78 -25.72
52 70 Glass and
glassware
0.43 0.32 -24.02
53 71 Natural or
cultures pearls,
precious or
semiprecious
stines, pre metals,
clad with
pre.metal and
articles thereof
imitation
jewellery; coin
0.04 0.01 -69.06
54 72 Iron and steel 2.44 3.82 56.88
55 73 Articles of iron
and steel
0.76 0.64 -16.55
56 74 Copper and
articles thereof
5.50 2.09 -62.11
57 75 Nickel and articles
thereof
0.18 0.00 -99.62
58 76 Aluminium and
articles thereof
2.40 1.02 -57.41
59 78 Lead and articles
thereof
0.23
60 79 Zinc and articles
thereof
0.68 1.54 125.50

ANNEXES 131
Market study of Indian sea logistics and analysis of sea solutions between India and Portugal Kalyanasundaram Iyyappan
61 80 Tin and articles
thereof
0.01
62 82 Tools
implements,
cutlery, spoons
and forks of base
metal, parts
thereof of base
metal
0.28 0.60 115.39
63 83 Miscellaneous
articles of base
metal
0.76 0.75 -0.89
64 84 Nuclear reactors,
boilers,
machinery and
mechanical
appliances; parts
thereof
19.64 15.02 -23.52
65 85 Electrical
machinery and
equipment and
parts therof;
sound recorders
and reproducers;
television image
and sound
recorders and
reproducers and
parts
10.82 13.31 23.10
66 86 Railway or
tramway
Locomotives,
rolling-Stock and
parts thereof;
railway or
tramway track
fictures and
fittings and parts
thereof;
Mechanical
0.01

ANNEXES 132
Market study of Indian sea logistics and analysis of sea solutions between India and Portugal Kalyanasundaram Iyyappan
67 87 Vehicles other
than railway or
tramway rolling
stock and parts
and accessories
thereof
0.14 0.56 310.35
68 88 Aircraft,
Spacecraft and
parts therof
0.00 0.00 -77.42
69 89 Ships, Boats and
floating
structures
0.01 0.14 993.70
70 90 Optical,
photographic
cinematographic
measuring,
checking
precision, medical
or surgical
instruments and
apparatus parts
and accessories
thereof
1.19 0.91 -23.18
71 91 Clocks and
watches and parts
thereof
0.03 0.00 -92.21
72 93 Arms and
ammunition;
parts and
accessories
thereof
0.01 0.01 3.39
73 94 Furniture;
bedding,
mattresses,
mattress
supports,
cushions and
similar stuffed
furnishing, lamps
and lightning
0.37 1.33 260.67
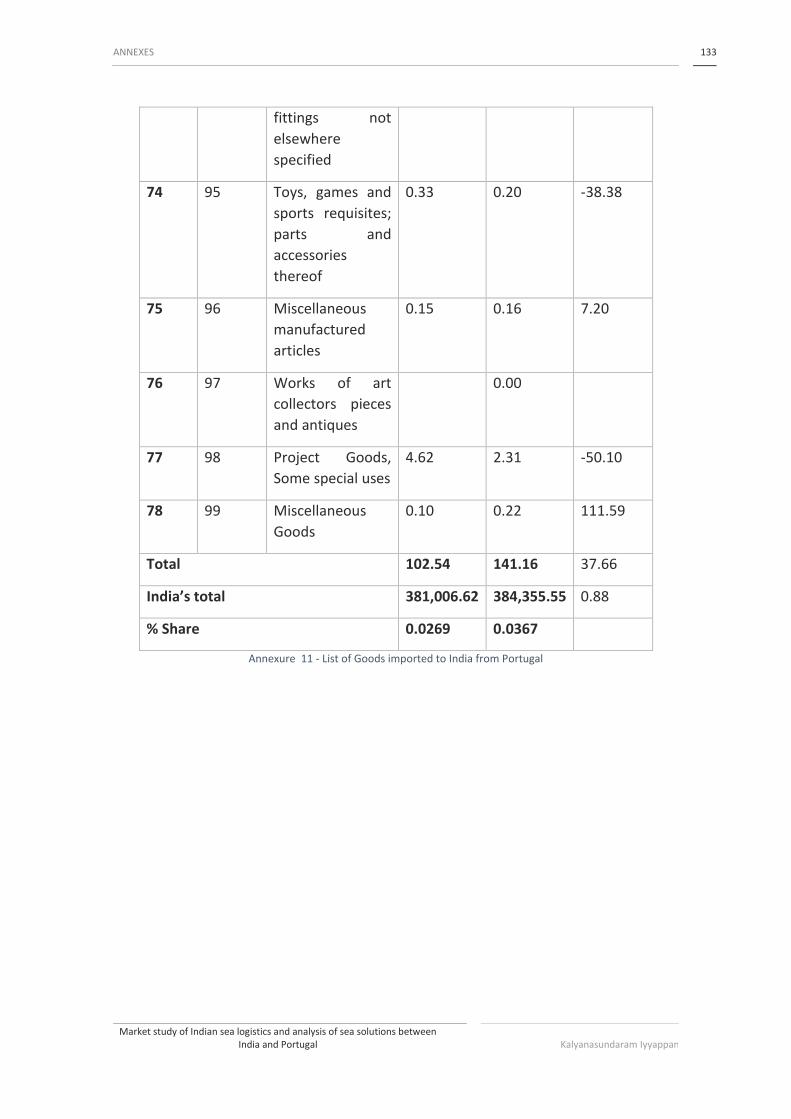
ANNEXES 133
Market study of Indian sea logistics and analysis of sea solutions between India and Portugal Kalyanasundaram Iyyappan
fittings not
elsewhere
specified
74 95 Toys, games and
sports requisites;
parts and
accessories
thereof
0.33 0.20 -38.38
75 96 Miscellaneous
manufactured
articles
0.15 0.16 7.20
76 97 Works of art
collectors pieces
and antiques
0.00
77 98 Project Goods,
Some special uses
4.62 2.31 -50.10
78 99 Miscellaneous
Goods
0.10 0.22 111.59
Total 102.54 141.16 37.66
India’s total 381,006.62 384,355.55 0.88
% Share 0.0269 0.0367
Annexure 11 - List of Goods imported to India from Portugal

ANNEXES 134
Market study of Indian sea logistics and analysis of sea solutions between India and Portugal Kalyanasundaram Iyyappan
6.12 Sea Route from Leixoes to Indian Ports
S.No
Journey
Details
Shipping
Company
Route Total
Duration
Cost (US$)
20
DV
40
DV
40 HC
1.
Leixoes-
Kolkata
K Line
Leixoes to
Rotterdam
Rotterdam to
Singapore
Singapore to
Kolkata
40 days 1150 1500 1500
mSC Leixoes to
Sines
Sines to
Colombo
Colombo to
Kolkata
54 days 1200 1900 1900
CMA
CGM
Leixoes to
Rotterdam
Rotterdam to
Colombo
Colombo to
Kolkata
34 days 950 1750 1750
2. Leixoes-
Cochin
K Line Leixoes to
Rotterdam
Rotterdam to
Colombo
Colombo to
Cochin
35 days 1150 1500 1500
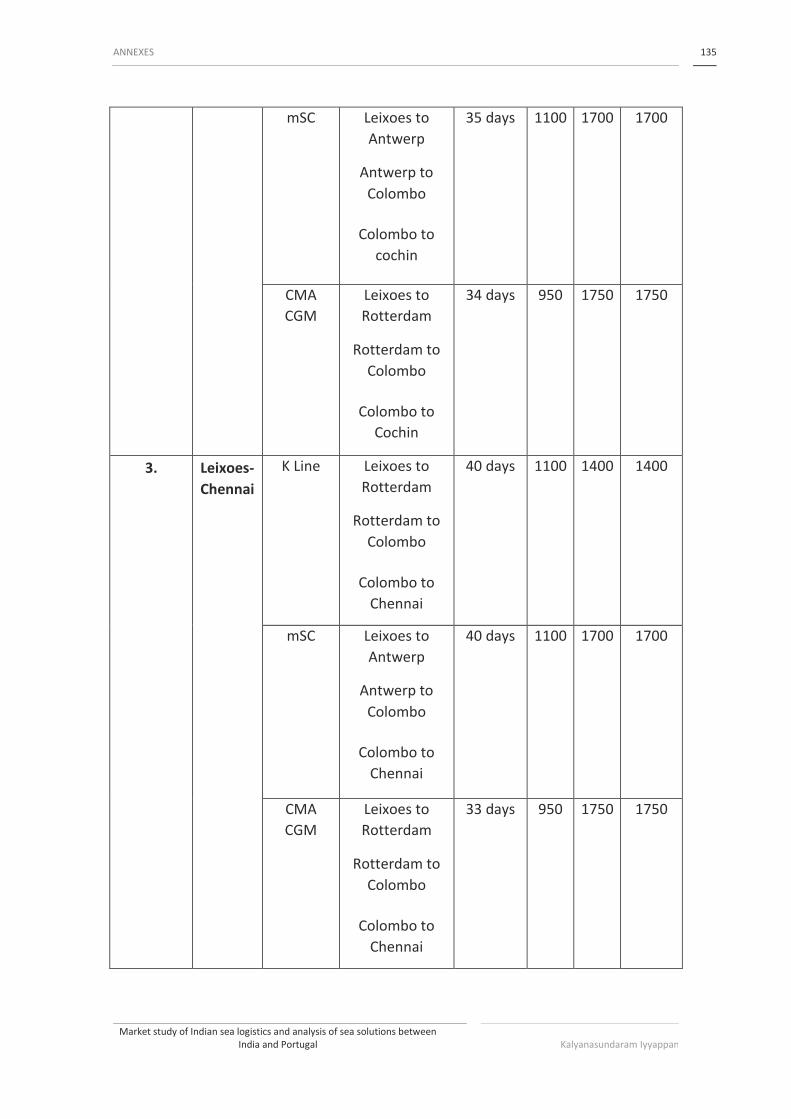
ANNEXES 135
Market study of Indian sea logistics and analysis of sea solutions between India and Portugal Kalyanasundaram Iyyappan
mSC Leixoes to
Antwerp
Antwerp to
Colombo
Colombo to
cochin
35 days 1100 1700 1700
CMA
CGM
Leixoes to
Rotterdam
Rotterdam to
Colombo
Colombo to
Cochin
34 days 950 1750 1750
3. Leixoes-
Chennai
K Line Leixoes to
Rotterdam
Rotterdam to
Colombo
Colombo to
Chennai
40 days 1100 1400 1400
mSC Leixoes to
Antwerp
Antwerp to
Colombo
Colombo to
Chennai
40 days 1100 1700 1700
CMA
CGM
Leixoes to
Rotterdam
Rotterdam to
Colombo
Colombo to
Chennai
33 days 950 1750 1750

ANNEXES 136
Market study of Indian sea logistics and analysis of sea solutions between India and Portugal Kalyanasundaram Iyyappan
4. Leixoes-
Tuticorn
K Line Leixoes to
Rotterdam
Rotterdam to
Colombo
Colombo to
Tuticorn
35 days 1150 1500 1500
mSC Leixoes to
Antwerp
Antwerp to
Colombo
Colombo to
Tuticorn
35 days 1100 1700 1700
CMA-
CGM
Leixoes to
Rotterdam
Rotterdam to
Colombo
Colombo to
Tuticorn
33 days 1250 1900 1900
5. Leixoes-
Vizag
K Line Leixoes to
Rotterdam
Rotterdam to
Colombo
Colombo to
Visakhapatnam
37 days 1250 1600 1600
mSC Leixoes to
Rotterdam
Rotterdam to
Colombo
Colombo to
Visakhapatnam
36 days 1200 1900 1900

ANNEXES 137
Market study of Indian sea logistics and analysis of sea solutions between India and Portugal Kalyanasundaram Iyyappan
CMA-
CGM
Leixoes to
Rotterdam
Rotterdam to
Colombo
Colombo to
Visakhapatnam
34 days 950 1750 1750
6. Leixoes-
Haldia
K Line Leixoes to
Rotterdam
Rotterdam to
Colombo
Colombo to
Haldia
40 days 1025 1500 1500
mSC Leixoes to
Antwerp
Antwerp to
Colombo
Colombo to
Haldia
35 days 1100 1700 1700
CMA-
CGM
Leixoes to
Rotterdam
Rotterdam to
Colombo
Colombo to
Haldia
35 days 950 1750 1750
7. Leixoes-
Nhava
Sheva
Kline Leixoes to
Rotterdam
Rotterdam to
Singapore
Singapore to
Nhava Sheva
41 days 950 1200 1200
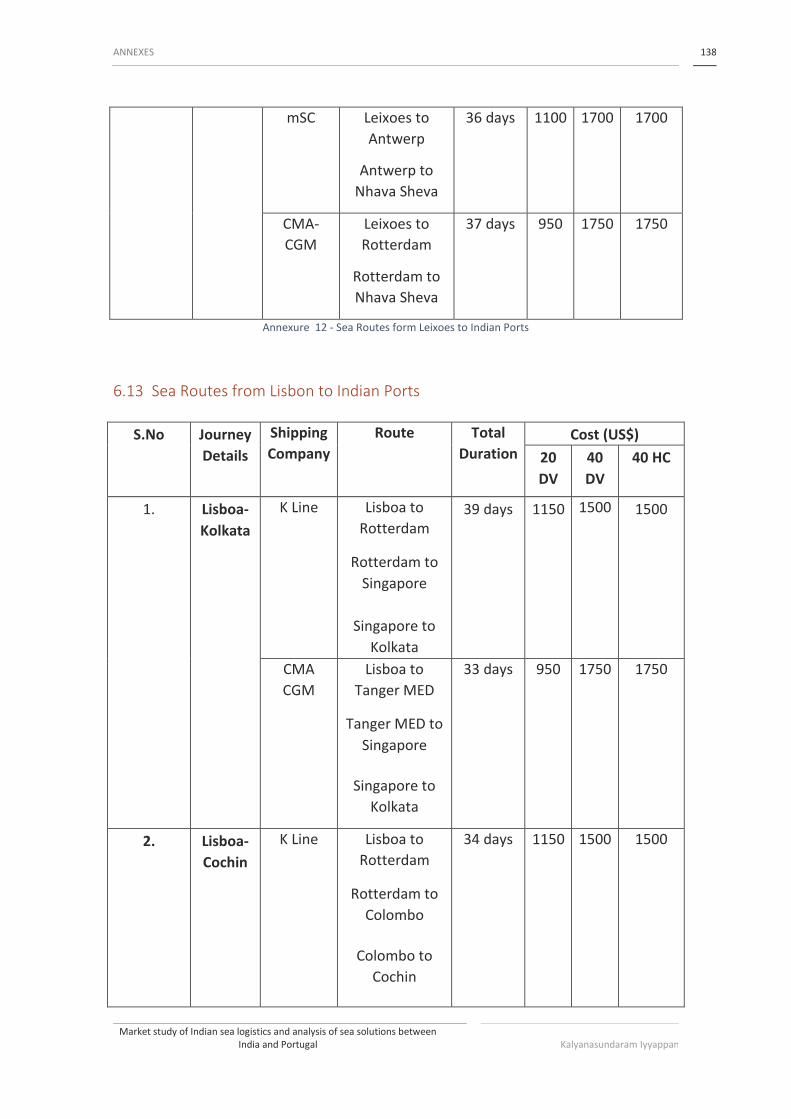
ANNEXES 138
Market study of Indian sea logistics and analysis of sea solutions between India and Portugal Kalyanasundaram Iyyappan
mSC Leixoes to
Antwerp
Antwerp to
Nhava Sheva
36 days 1100 1700 1700
CMA-
CGM
Leixoes to
Rotterdam
Rotterdam to
Nhava Sheva
37 days 950 1750 1750
Annexure 12 - Sea Routes form Leixoes to Indian Ports
6.13 Sea Routes from Lisbon to Indian Ports
S.No
Journey
Details
Shipping
Company
Route Total
Duration
Cost (US$)
20
DV
40
DV
40 HC
1.
Lisboa-
Kolkata
K Line
Lisboa to
Rotterdam
Rotterdam to
Singapore
Singapore to
Kolkata
39 days 1150 1500 1500
CMA
CGM
Lisboa to
Tanger MED
Tanger MED to
Singapore
Singapore to
Kolkata
33 days 950 1750 1750
2. Lisboa-
Cochin
K Line Lisboa to
Rotterdam
Rotterdam to
Colombo
Colombo to
Cochin
34 days 1150 1500 1500
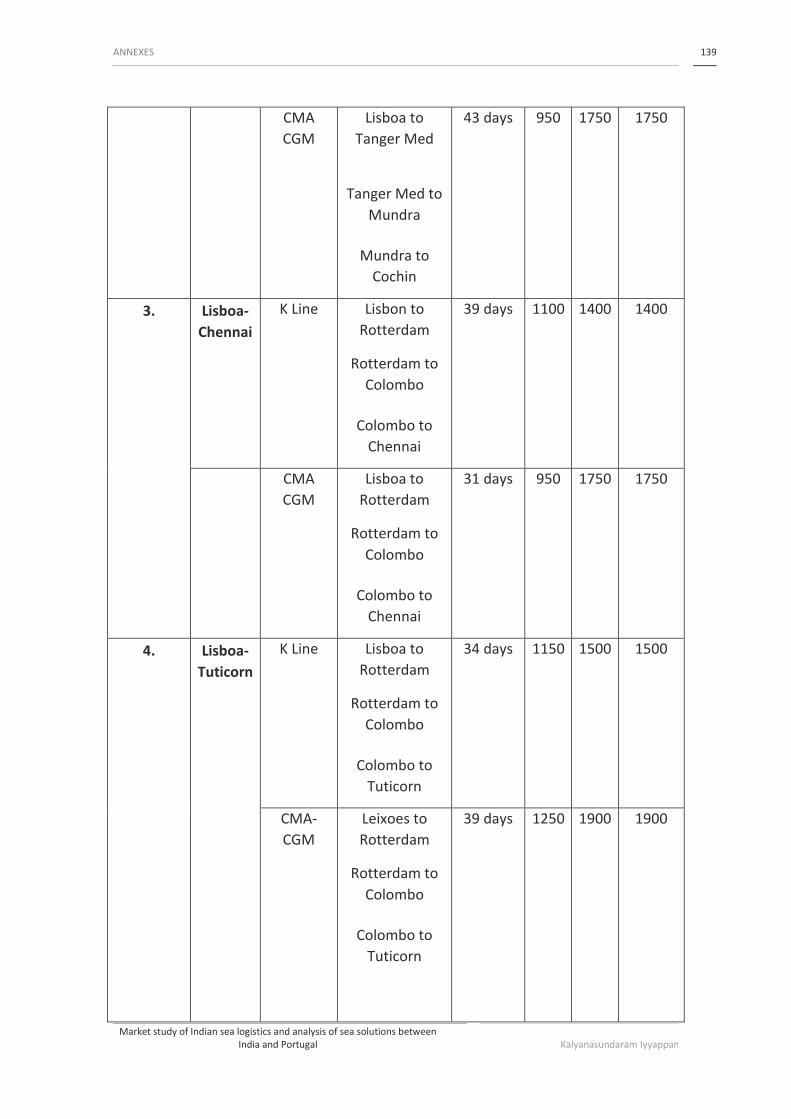
ANNEXES 139
Market study of Indian sea logistics and analysis of sea solutions between India and Portugal Kalyanasundaram Iyyappan
CMA
CGM
Lisboa to
Tanger Med
Tanger Med to
Mundra
Mundra to
Cochin
43 days 950 1750 1750
3. Lisboa-
Chennai
K Line Lisbon to
Rotterdam
Rotterdam to
Colombo
Colombo to
Chennai
39 days 1100 1400 1400
CMA
CGM
Lisboa to
Rotterdam
Rotterdam to
Colombo
Colombo to
Chennai
31 days 950 1750 1750
4.
Lisboa-
Tuticorn
K Line Lisboa to
Rotterdam
Rotterdam to
Colombo
Colombo to
Tuticorn
34 days 1150 1500 1500
CMA-
CGM
Leixoes to
Rotterdam
Rotterdam to
Colombo
Colombo to
Tuticorn
39 days 1250 1900 1900

ANNEXES 140
Market study of Indian sea logistics and analysis of sea solutions between India and Portugal Kalyanasundaram Iyyappan
5. Lisboa-
Vizag
K Line Lisboa to
Rotterdam
Rotterdam to
Colombo
Colombo to
Visakhapatnam
36 days 1250 1600 1600
CMA-
CGM
Lisboa to
Rotterdam
Rotterdam to
Colombo
Colombo to
Visakhapatnam
34 days 950 1750 1750
6. Lisboa-
Haldia
K Line Lisboa to
Rotterdam
Rotterdam to
Colombo
Colombo to
Haldia
39 days 1025 1500 1500
CMA-
CGM
Lisboa to
Tanger MED
Tanger MED to
Singapore
Singapore to
Haldia
33 days 950 1750 1750
7. Lisboa-
Nhava
Sheva
K Line Lisbon to
Rotterdam
Rotterdam to
Singapore
Singapore to
Nhava Sheva
41 days 950 1200 1200

ANNEXES 141
Market study of Indian sea logistics and analysis of sea solutions between India and Portugal Kalyanasundaram Iyyappan
CMA-
CGM
Lisboa to
Tanger Med
Tanger Med to
Nhava Sheva
36 days 950 1750 1750
Annexure 13 - Sea Routes from Lisbon to Indian Ports
6.14 Sea Routes from Sines to Indian Ports
S.No
Journey
Details
Shipping
Company
Route Total
Duration
Cost (US$)
20
DV
40
DV
40
HC
1.
Sines-
Kolkata
mSC
Sines to
Colombo
Colombo to
Kolkata
32 1200 1900 1900
CMA-
CGM
Sines to
Antwerp
Antwerp to Le
Havre, France
Le Havre,
France to Port
Kelang
Port Kelang to
Kolkata
46 950 1750 1750
2. Sines-
Cochin
mSC Sines to
Colombo
Colombo to
Cochin
21 1200 1900 1900

ANNEXES 142
Market study of Indian sea logistics and analysis of sea solutions between India and Portugal Kalyanasundaram Iyyappan
CMA-
CGM
Sines to Lisboa
Lisboa to
Tanger Med
Tanger Med to
Jebel Ali
Jebel Ali to
Cochin
35 1100 1750 1750
3. Sines-
Chennai
mSC Sines To
Colombo
Colombo to
Chennai
24 1200 1900 1900
CMA-
CGM
Sines to Lisboa
Lisboa to
Tanger Med
Tanger Med to
Damietta
Damietta to
Chennai
68 950 1750 1750
4. Sines to
Tuticorn
mSC Sines to
Colombo
Colombo to
Tuticorn
36 1200 1900 1900
CMA-
CGM
Sines to Lisboa
Lisboa to
Tanger Med
Tanger Med to
Mundra
Mundra to
Tuticorn
36 950 1750 1750

ANNEXES 143
Market study of Indian sea logistics and analysis of sea solutions between India and Portugal Kalyanasundaram Iyyappan
5. Sines to
Vizag
mSC Sines to
Colombo
Colombo to
Visakhapatnam
39 1200 1900 1900
CMA-
CGM
Sines to
Antwerp
Antwerp to Le
Havre
Le Havre to
Port Kelang
Port Kelang to
Visakhapatnam
47 950 1750 1750
6. Sines to
Haldia
mSc Sines to
Colombo
Colombo to
Haldia
35 1200 1900 1900
CMA-
CGM
Sines to
Antwerp
Antwerp to Le
Havre, France
Le Havre,
France to Port
Kelang
Port Kelang to
Haldia
48 950 1750 1750
7. Sines to
Nhava
Sheva
mSC Sines to Nhava
Sheva 20 days 1100 1700 1700
CMA
CGM
Sines to Lisboa
Lisboa to
Tanger Med
Tanger Med to
Nhava Sheva
29 days 950 1750 1750
Annexure 14 - Sea Routes from Sines to Indian Ports

ANNEXES 144
Market study of Indian sea logistics and analysis of sea solutions between India and Portugal Kalyanasundaram Iyyappan