NORTHERN POWER DISTRIBUTION COMPANY OF ... - TSERC
210
NORTHERN POWER DISTRIBUTION COMPANY OF TELANGANA LIMITED (Distribution & Retail Supply Licensee) Filing of Aggregate Revenue Requirement (ARR) for Retails Supply Business for the FY 2017-18 November 2016
-
Upload
khangminh22 -
Category
Documents
-
view
1 -
download
0
Transcript of NORTHERN POWER DISTRIBUTION COMPANY OF ... - TSERC

NORTHERN POWER DISTRIBUTION COMPANY
OF TELANGANA LIMITED
(Distribution & Retail Supply Licensee)
Filing of Aggregate Revenue Requirement (ARR) for
Retails Supply Business for the FY 2017-18
November 2016

BEFORE THE HONOURABLE TELANGANA STATE ELECTRICITY REGULATORY COMMISSION
AT ITS OFFICE AT 5th Floor, SingareniBhavan, Red Hills, Hyderabad - 500 004
FILING NO.________/2016
CASE NO. ________/2016 In the matter of:
Filing of the ARR & Tariff applications for the Retail Supply Business for the year FY 2017-
18under Multi-Year Tariff principles in accordance with the erstwhile “Telangana State
Electricity Regulatory Commission (Terms And Conditions For Determination Of Tariff For
Wheeling And Retail Sale Of Electricity) Regulation, 2005” by the Northern Power
Distribution Company of Telangana Limited (‘TSNPDCL’ or ‘the Company’ or ‘the Licensee’)
as the Distribution and Retail Supply Licensee.
In the matter of:
NORTHERN POWER DISTRIBUTION COMPANY OF TELANGANA LIMITED
… Applicant
The Applicant respectfully submits as under: -
1. Consequent to the formation of Telangana State on 02-06-2014 as per the Andhra Pradesh
Reorganisation Act,2014, a separate Telangana Electricity Regulation Commission
constituted on 03-11-2014. TSERC vide Telangana Official Gazzette has issued its first
regulation, Regulation No. 1 of 2014 on 10.12.2014 (Adoption of Previously Subsisting
Regulations, Decisions, Directions or Orders, Licenses and Practice of Directions) wherein
clause 2 states that:
2. “All regulations, decisions, directions or orders, all the licences and practice directions
issued by the erstwhile Andhra Pradesh Electricity Regulatory Commission (Regulatory
Commission for States of Andhra Pradesh and Telangana) as in existence as on the date of
the constitution of the Telangana State Electricity Regulatory Commission and in force, shall

ii
mutatis-mutandis apply in relation to the stakeholders in electricity in the State of
Telangana including the Commission and shall continue to have effect until duly altered,
repealed or amended, any of Regulation by the Commission with effect from the date of
notification as per Notification issued by the Government of Telangana in G.O.Ms.No.3
Energy( Budget) Department, dt.26-07-2014 constituting the Commission.”
3. This filing is made by the NORTHERN POWER DISTRIBUTION COMPANY OF TELANGANA
LIMITED (TSNPDCL) under Section 61 of the Electricity Act 2003 for determination of the
Aggregate Revenue Requirement (ARR) and Tariff for the Retail Supply Business for the year
FY 2017-18.
4. The licensee has adopted the following methodology to arrive at the ARR for retail supply
business.
Distribution Cost:The licensee has considered the figures as per the Distribution Tariff
Order dated 27th March, 2015 issued by TSERC for the period from FY 2014-15 to FY
2018-19.
Transmission Cost: The licensee has considered the approved transmission cost as per
the Transmission Tariff Order dated 9th May 2014.
SLDC Cost: The licensee has considered the approved figures as per the SLDC Annual Fee
and Operating Charges order dated 9th May 2014.
PGCIL and ULDC Costs: PGCIL and ULDC costs have been projected for FY 2016-17 H2
and FY 2017-18 based on the H1 actuals of FY 2016-17.
Distribution losses:The Licensee has considered the Distribution Losses as approved by
by TSERC for the period from FY 2014-15 to FY 2018-19 in its tariff Order dated 27th
Mar, 2015.
Transmission losses: The licensee has considered theactual cumulative transmission loss
of TS Transco incurred till the month of October 16 ie 3.38%.
PGCIL Losses:The external losses (PGCIL) are estimated to be at 3.44%.
5. As per the Government of Telangana vide G.O Ms. No, dt: 11.10.2016 and G.O Ms No.234
dt: 11.10.2016 has given final notification for formation/ reorganization of new districts,
revenue divisions and mandals in Siddipet and Jangaon Districts respectively. In the said

iii
GOs, 7 revenue Mandals from the jurisdiction of Karimnagar and Warangal were now re-
organized to Siddipet District and one Mandal, Gundala of Nalgonda District were re-
organized to Jangaon District. However the impact of sales re-allocation between the two
licensees, - Northern Power Distribution Company of Telangana Limited (TSNPDCL) and
Southern Power Distribution Company of Telangana Limited is expected to be minimal. Any
inter-discom adjustment in sales if any would be done at the end of the financial year if
required.
6. As per Regulation No. 4 of 2005, the licensee is required to file the Aggregate Revenue
Requirement (ARR) for Retail Supply Business and Tariff proposal for the entire control
period i.e., for the period FY 2014-15 to FY 2018-19. However, the licensee had requested
the Hon’ble Commission to allow it to submit the ARR for Retail Supply Business for the FY
2017-18 on yearly basis, instead for the entire control period due to the reasons as
mentioned below:
a. Significant uncertainty involved in projection of quantum of power to be purchased
from various sources as well as in costs -
Projections of Generation Availability
Projection of power to be purchased from TS Genco stations, CGS Stations & other
stations would be difficult beyond one or two years. As seen in the past there have
been deviations from the scheduled commissioning for both thermal and Hydro
plants. Given the high quantum of power likely to be purchased from the plants
likely to be commissioned till FY 2018-19, any deviations in the power procurement
schedule from these plants will have a material impact on the power purchase costs
if projections are to be done for the entire 3rdcontrol period.
Projections of Power Purchase Costs
The licensee would like to submit that it is facing challenges in projecting the power
procurement cost for the entire 3rd control period as there has been a sharp increase
in the Power procurement cost in the recent past due to the following reasons:
Sharp fall observed in Energy dispatched from cheaper Hydel sources over the
years. The hydro energy availability for FY 2016-17 is expected to be 1021 MU as

iv
compared to the Tariff Order approved quantity of 3841 MU. It has been
observed over the past few years that the actual availability from Hydel stations
has been consistently lower than the value approved in the Tariff Orders issued
by TSERC. This can be attributed to the multipurpose usage of Hydro projects
where in Irrigation takes preference over power generation.
The shortfall in energy from Hydel sources FY 2016-17 was met from relatively
expensive sources like Bilateral purchases.
As can be seen from the points mentioned above, there is a scope of significant
variation in the power purchase costs of the licensee, if the projections of power
procurement are done for the entire control period.
b. Regulatory objectives of a Multi-year tariff regime not met
Mechanism of Incentivization
One of the objectives of the multi-year tariff regime is to incentivize the
performance of the licensee based on its achievement vis-à-vis the targets fixed by
the regulator. In the current scenario, this concept is more relevant in distribution
business as many of the ARR items in distribution business are deemed to be
controllable and the licensee can take steps to achieve the targets fixed by the
regulator thereby improving its operational performance. However in the retail
supply business, the cost of power purchase is uncontrollable factor and hence not
amenable to fixation of targets. Hence the regulatory objective of improving the
performance of the licensee, intended to be achieved in a multi-year tariff regime is
not met in case of retail supply business
Tariff Certainty
The other key objective intended to be achieved through a multi-year tariff
framework is to reduce the regulatory uncertainty for consumers stemming from
methodology followed by the regulator in tariff setting. This objective is achieved in
the distribution business through the wheeling tariffs set for the MYT control period
which are based on the factors which are controllable by the licensee. However in

v
retail supply business, following are the key constraints in fixing a tariff for entire
control period:
As explained in point 1, there is high degree of uncertainty in power purchase
costs and it has a significant impact on the ‘Cost to serve’ which forms the basis
of fixation of retail tariffs.
In addition to ‘cost of service’, the retail tariffs also depend on the level of
subsidy support from Government of Telangana and cross subsidy levels across
consumer categories. These factors are beyond the control of the licensee.
Hence the objective of providing tariff certainty to consumers, which is well
established in distribution business in the form wheeling tariffs, is unlikely to be met
in retail supply business due to the uncontrollable factors mentioned above.
Demand Side uncertainties -
The licensee has made best efforts in estimating to a good degree of accuracy,
the quantum of load shedding done in the previous year for consumers category-
wise and factoring the impact of the same in coming up with projections for the
ensuing year. However any short-fall in the load relief estimates will have an
adverse impact on the licensee if sales projections are done for the entire 3rd
control period
The policy of the Government of Telangana towards the agricultural supply hours
and the likely date of commissioning of the Lift Irrigation Schemes (LI Schemes)
are other parameters which would significantly alter the demand projections for
the 3rd control period.
It is also very difficult to predict with accuracy the levels of demand that will be
there for power from different category of consumers especially Industrial and
Commercial consumers. These are dependent on macroeconomic situations and
are not easy to forecast over a 5 year period. Variations in this demand will alter
sales mix and therefore make ARR substantially inaccurate if done over 5year
period.

vi
The Hon’ble Commission has been kind enough in granting permission to submit the ARR in
respect of the Retail Supply Business for FY 2017-18 instead of total control period of FY
2014-15 to FY 2018-19 vide proceedings Lr. No.TSERC/Tariff/DD(T-Engg)/T-03/2015/D.No.
708/16 Dt. 19.11.2016.
7. The Petitioner (Distribution Licensee) submits that as per the APERC Regulation 1 of 2014,
TS DISCOMS have to file for provisional true-up for the FY 2016-17 and final true-up for the
FY 2015-16. However, the licensee would like to submit the following to the Hon’ble
Commission for consideration.
a. Joining the UDAY scheme is under consideration by Government of Telangana
(GoTS). The accumulated losses of the licensee as on 31st March 2015 is Rs 4,883crs.
The licensee has taken loans to fund cash losses, and since 75% of the loans
outstanding as on 30th September would be taken over GoTS, this would impact the
loss position of the licensee and hence the true-up requirements. Hence filing of
true-up subsequent to take-over of the debt of licensee would result in minimizing
the financial burden on the consumers in the state.
b. The licensee would like to file for true-up for the previous years based on the take-
over of debt by the since the actual loss position of the discom would be known
based on the take over of discom debt. Hence the licensee prays that the Hon’ble
Commission may allow the licensee to file the true-up for previous years separately.
c. In order to simplify the tariff structure/ reduce tariff categories of consumers,
Government of India constituted a committee with Joint Secretary (Ministry of
Power) as the Chairperson vide 23/32/2016- R & R dated 24/ 08/2016. The licensee
is currently evaluating the options for rationalizing tariff and categories. As a careful
study needs to be made to assess the impact of such an exercise on different
consumer categories in the state of Telangana, the licensee prays that the Hon’ble
Commission may allow the licensee to file for tariff proposals, cross subsidy
surcharge and additional surcharge proposals separately.
d. In view of the above, the licensee prays that the Hon’ble Commission may allow the
licensee to file for True-ups for previous years and tariff proposals separately. This
will enable the licensee in minimizing the financial impact on the consumers and
also would enable the licensees in proposing a rationalized tariff structure after due
examination which reduces any un-due financial burden on any category of
consumers.

vii
8. Other Key Measures: Telangana Power Generation Corporation has initiated
measures for reducing the cost of power generation. Some of the measures adopted
are – re-negotiation of interest rate on loans for newly commissioned generating
stations, minimizing grade slippage of coal which reduces the variable cost of
generation.
9. In the following paragraphs, the licensee has provided a brief summary of its
performance during FY 2015-16 as well as the expected performance for the current
year i.e. FY 2016-17 against the tariff order and projections for FY 2017-18.
Summary of the Filing
Performance Analysis of the Licenseefor the Previous Year FY 2015-16 and Current Year FY
2016-17
Performance Analysis: A brief analysis of the key elements of licensee’s business is as follows:
Sale of Energy andloss reduction:
Particulars
2015-16 (Actuals)
2016-17 (Revised Estimate)
MU % MU %
Metered Sales 6,893.73 51.95% 7,432.7 53.5%
LT Agricultural Sales 4,671.95 35.21% 4,942.4 35.6%
Total Sales 11,565.68 87.16% 12,375.1 89.1%
ADD:Distribution Losses (incl. EHT sales)
1,704.27 12.84% 1,518.0 10.9%
Energy required at Discom level
13,269.95 100.00% 13,893.1 100.0%
Distribution Losses (excl. EHT sales)
1,704.27 14.35% 1,518.0 12.30%
As can be seen from the table above, in 2015-16, the percentage of metered sales is 51.95 % as
against 49.73% during 2014-15. The increase is mainly due to increase in domestic category
sales by 372 MU which is 3.4% higher than the 2014-15 metered sales.
Licensee has fixed 3,168 meters for LV side of the Agricultural DTRs as per the ISI methodology
approved by the Hon’ble Electricity Regulatory Commission. The Agricultural consumption is

viii
being estimated as per ISI methodology from October 2013 onwards and same is being
furnished to the Hon’ble Commission.
Further, the licensee is in the process of releasing around 42635 new agricultural connections
during FY 2016-17. In view of this, the licensee requests the Hon’ble Commission to revisit the
level of agricultural sales.
Revenue and net gap
As mentioned in the earlier sections, the licensee prays that the Hon’ble Commission may
give an opportunity to file the tariff proposals and true-ups separately. The net gap would
also be stated during the aforesaid filing.
Estimates for the Ensuing Year (FY 2017-18)
The licensee has adopted a modified trend approach for projecting the category-wise sales for
the ensuing year. As the name suggests, the licensee has considered the historical growth trend
observed in the sales of categories and the same has been moderated based on the other
relevant inputs such as underlying economic growth drivers, number of pending applications
etc. The total sales forecast is as follows:
Sales/Forecast Sales (MU) 2016-17 2017-18
LT Category 9,207.57 9,869.65
LT-I(A&B): Domestic 3,070.00 3,343.33
LT-II(A,B&C): Non-domestic/Commercial 617.92 667.03
LT-III: Industry 245.62 248.08
LT-IV(A&B): Cottage Industries 6.48 6.65
LT-V(A,B&C): Agricultural 4,942.39 5,263.65
LT-VI(A&B): Street Lighting & PWS Schemes 281.44 292.03
LT-VII(A&B): General Purpose 43.72 48.89
LT-VIII: Temporary Supply 0.00 0.00
HT Category 3,167.51 3,996.01
HT Category at 11 kV 1,317.04 1,494.85
HT-I(A): Industry (General) 498.33 557.59
HT-I(B): Ferro Alloy Units 0.00 0.00
HT-II: Others 107.55 119.82
HT-III: Airports, Bus Stations and Railway Stations 8.02 8.60
HT-IV(A): Lift Irrigation & Agriculture 14.78 14.78
HT-IV(B): CPWS 22.75 81.26
HT-VI: Townships & Residential Colonies 12.80 13.06

ix
Sales/Forecast Sales (MU) 2016-17 2017-18
HT Temporary Supply 0.00 0.00
Category RESCOs 652.80 699.74
HT Category at 33 kV 297.92 508.32
HT-I(A): Industry (General) 180.48 184.21
HT-I(B): Ferro Alloy Units 0.02 0.00
HT-II: Others 13.13 13.39
HT-III: Airports, Bus Stations and Railway Stations 0.00 0.00
HT-IV(A): Lift Irrigation & Agriculture 27.80 27.80
HT-IV(B): CPWS 31.23 236.12
HT-VI: Townships & Residential Colonies 45.26 46.79
HT Temporary Supply 0.00 0.00
HT Category at 132 kV 1,552.55 1,992.84
HT-I(A): Industry (General) 684.89 694.65
HT-I(B): Ferro Alloy Units 0.00 0.00
HT-II: Others 6.12 3.38
HT-III: Airports, Bus Stations and Railway Stations 0.00 0.00
HT-IV(A): Lift Irrigation & Agriculture 339.94 767.71
HT-IV(B): CPWS 0.00 0.00
HT-V: Railway Traction 421.74 422.91
HT-VI: Townships & Residential Colonies 99.86 104.19
HT Temporary Supply 0.00 0.00
Total 12,375.08 13,865.66
Key Demand Drivers for FY 2017-18: Some of the key drivers for the increase in the demand of
the licensee has been highlighted below:
Water Grid: The licensee expects a load of 85.37 MW in its area.
The licensee has started supply of 9 hours of supply to agricultural consumers from April
this year. The licensee intends to continue with supply of 9 hours supply to agricultural
consumers in the ensuing year as well.
Lift Irrigation (LI) Schemes: Based on the data provided by Irrigation Department, the
licensee expects the following LI schemes in its area in FY 2017-18. A total of 427.77 MU
has been considered for FY 2017-18.
LIS addition in NPDCL (FY 2017-18 )
SN LI Schemes MVA MU CoD
1 SripadaSagar LIS 135 194 Jul-17
2 Bhakta Ramadasu LIS 22 32 Jul-17

x
LIS addition in NPDCL (FY 2017-18 )
SN LI Schemes MVA MU CoD
3 Devadula LIS 66 96 Jul-17
4 Thotapally reservoir to Gouravelly reservoir
45 65 Jul-17
5 LI Scheme at Jogapur 14 21 Jul-17
6 LI Scheme at Chanaka Koratala 14 21 Jul-17
Total 297.1 427.8
Power Purchase Requirement for FY 2017-18:
The following are the key points considered by the licensee with regard to power purchase
requirement by the licensee –
Average PLF of 80% from TSGENCO & APGENCO (thermal) considered
New sources of energy considered
o Kudigi- Unit 2 - 75Aug 2017, Unit 3 –84 MW from Jan 2018
o The licensee has entered PPA with Chattisgarh State Power Distribution
Company Limited (CSPDCL) for purchase of power on long-term basis for a
period of 12 years. The licensee has submitted the PPA to the Hon’ble
Commission for approval. The licensee has considered an availability of 6,482
MU.
Allocation Principles
o NCE – As per Geographical location
o All other sources – 53.89% as per GO Ms. No. 20 of 2014
The licensee has not projected any availability from new gas based IPPs in the
absence of any proposal of supply of power to stranded gas based plants.
The overall energy scenario at the State level in FY 2017-18 is given below
Particulars FY 2017-18
Energy Requirement (MU) 54,756 Energy Availability from Long term & Medium Term sources (MU)
66,076
Surplus 11,320 Power Purchase Cost Estimate for the state of Telangana for FY 2017-18

xi
Variable costs for TSGENCO & APGENCO – Thermal and CGS – These costs are
considered as given by the generator or capped at 2 % escalation on H1 actuals in 2016-
17.
Fixed costs for existing stations have been considered as projected for the respective
generating station
As per the tariff order of HonbleChattisgarh State Electricity Regulatory Commission, a
provisional tariff of Rs 3.90/kWh was permitted. The licensee has considered the same
for projecting the cost of power from Chhattisgarh subject to the approval from Hon’ble
TSERC.
The average PP cost at state level is projected to be at Rs. 4.46/unit for FY 2017-18
Aggregate Revenue Requirement (ARR)
The estimated Aggregate Revenue Requirement (ARR) for the licensee for the current year and
ensuing year is shown in the table below: In Rs. Crores
2016-17 Revised
Estimates 2017-18 Projected
Power Purchase Cost 6,601.55 7,326.43
Distribution Cost 1,390.17 1,632.93
Transmission Cost 432.89 472.27
SLDC Cost 12.05 13.04
PGCIL Cost 246.18 372.48
ULDC Cost 2.69 3.32
Network Cost 2,083.98 2,494.04
Interest on Consumer Security Deposits
41.91 46.52
Supply Margin 10.71 13.14
Other Expenses 5.75 5.75
CSD & Other Costs 58.37 65.41
Aggregate Revenue Requirement (ARR)
8,743.90 9,885.89
Based on the information available, the Applicant has made sincere efforts to comply with
the Regulation of the Hon’ble Commission and discharge its obligations to the best of its
abilities. However, should any further material information become available in the near


xiii
BEFORE THE HONOURABLE TELANGANA ELECTRICITY REGULATORY COMMISSION
AT ITS OFFICE AT 5th FLOOR, SINGARENI BHAVAN, RED HILLS, HYDERABAD 500 004
FILING NO.______/2016
CASE NO._______/2016
In the matter of:
Filing of the ARR & Tariff applications for the year 2017-18 in accordance with the “Telangana
Electricity Regulatory Commission (Terms And Conditions For Determination Of Tariff For
Wheeling And Retail Sale Of Electricity) Regulation, 2005” by the NORTHERN POWER
DISTRIBUTION COMPANY OF TELANGANA LIMITED (‘TSNPDCL’ or ‘the Company’ or ‘the
Licensee’) as the Distribution and Retail Supply Licensee.
In the matter of:
NORTHERN POWER DISTRIBUTION COMPANY OF TELANGANA LIMITED
… Applicant
AFFIDAVIT OF APPLICANT VERIFYING THE APPLICATION ACCOMPANYING FILING AS PER TERMS AND CONDITIONS OF TARIFF FOR WHEELING AND RETAIL SALE OF ELECTRICITY
I, Sri A Gopal Rao, son of Sri A. Chalapathi Rao, working for gain at the Northern Power
Distribution Company of Telangana Limited do solemnly affirm and say as follows:
1 I am the Chairman and Managing Director of TSNPDCL, the Licensee that has, vide the
Hon’ble Commission’s approval in proceedings No. APERC/Secy/Engg/No.6 dt.31.3.2000,
been granted the distribution and retail supply functions that Transco was authorised to
conduct or carry out under the Act and the license, with respect to the business of
distribution and retail supply of electricity in the Northern distribution zone in Telangana.
On December 27, 2000, the Hon'ble Commission has awarded a Distribution and Retail
Supply License to NPDCL effected from April 1, 2001. I am competent and duly authorised
by TSNPDCL to affirm, swear, execute and file this affidavit in the present proceedings.


1 Introduction Filings based on Multi-Year Tariff (MYT) Principles Consequent to the formation of Telangana State on 02-06-2014 as per the Andhra Pradesh
Reorganisation Act,2014, a separate Telangana Electricity Regulation Commission
constituted on 03-11-2014. TSERC vide Telangana Official Gazzette has issued its first
regulation, Regulation No. 1 of 2014 on 10.12.2014 (Adoption of Previously Subsisting
Regulations, Decisions, Directions or Orders, Licenses and Practice of Directions) wherein
clause 2 states that:
“All regulations, decisions, directions or orders, all the licences and practice directions
issued by the erstwhile Andhra Pradesh Electricity Regulatory Commission (Regulatory
Commission for States of Andhra Pradesh and Telangana) as in existence as on the date of
the constitution of the Telangana State Electricity Regulatory Commission and in force,
shall mutatis-mutandis apply in relation to the stakeholders in electricity in the State of
Telangana including the Commission and shall continue to have effect until duly altered,
repealed or amended, any of Regulation by the Commission with effect from the date of
notification as per Notification issued by the Government of Telangana in G.O.Ms.No.3
Energy (Budget) Department, dt.26-07-2014 constituting the Commission.”
Hence, the TSNPDCL has made these filings in accordance with the Principle Regulation
namely “Terms and Conditions for determination of Tariff for Wheeling and retail supply
of electricity” - Regulation 4 of 2005 (“Regulation”) and its subsequent amendment
regulation 1 of 2014, which lays the principles for determination of Aggregate Revenue
Requirement (ARR) for a) Distribution Business and b) Retail Supply Business of the
licensees. The ARR so determined for each of the businesses will form the basis for
fixation of wheeling tariff / charges and charges for retail sale of electricity.
In the Regulation, the Commission has also laid down the procedures for filing under
multi-year tariff principles. The current filing pertains to the Third Control Period. The
Commission has specified the following procedure in Para 6.2 of the Regulation 4 of 2005
for ARR filing for the distribution and retail supply business:
“The ARR filing for the Distribution business shall be for the entire Control Period. For the
Retail Supply business the ARR filing will be on annual basis for the first Control Period and
the entire Control Period for the subsequent Control Periods”.
Page 1 of 195

The TSDISCOMS have sought permission from Hon’ble TSERC to file ARR for Retail Supply
Business for FY 2017-18 on annual basis in view of the difficulties in projection of power
purchase cost estimation for the entire control period and Tariff uncertainty and the
Hon’ble Commission was kind enough to grant permission for filing Retail Supply Business
(RSB) only for FY 2017-18 only vide its Lr. No.TSERC/Tariff/DD(T-Engg)/T-03/2015/D.No.
708/16 Dt. 19.11.2016.
In order to simplify the tariff structure/ reduce tariff categories of consumers,
Government of India constituted a committee with Joint Secretary (Ministry of Power) as
the Chairperson vide 23/32/2016- R & R dated 24/ 08/2016. The licensee is currently
evaluating the options for rationalizing tariff and categories and would require additional
time for performing a holistic assessment to meet the above mandate. Hence the licensee
requested the Honble Commission to permit to file to the extent of ARR only for FY 2017-
18 by 30th Nov 16 and allow filing Tariff Proposals by 31st December 2016. Proposal of
Cross Subsidy Surcharge and computation of Additional Surcharge will be filed with tariff
proposal in due course of time.
Further, as per the Directive No.10 issued by the Hon’ble Commission in Tariff Order dated
23.06.2016 for Retail Supply Tariffs for FY2016-17, the Discoms have to file True-up
proposals of Distribution Business for both 1st and 2nd control periods and true-up of
Retail Supply Business under Regulation 1 of 2014 for FY 2014-15 and FY 2015-16. In this
regard it is to submit that Government of Telangana (GoTS) is considering signing UDAY
scheme this year. Licensee will file true-up for FY15-16 and FY16-17 along with tariff
proposal after considering final MoU signed by GoTS and GoI.
Filing Contents The filing is structured in the following way: Section 2 provides analysis of performance for year 2015-16 and year 2016-17 for Retail
supply Business comprising
- Operating Performance
- Financial Performance
Section 3: Sales Forecast & Energy Requirement
Page 2 of 195

Section 4: Deals with Power procurement plan for FY 2016-17 and for FY 2017-18 Section 5: Charts out expenditure projections comprising of - Power Purchase Cost
- Transmission and PGCIL Charges
- SLDC Charges
- Distribution Cost
- Interest on Consumer Security Deposits
- Supply Margin
- Other Costs
- Finally amounting to Aggregate Revenue Requirement for Retail Supply Business
Section 6 : Deals with Cost of Service Appendix –A – Resource Plan till 2018-19 Appendix –B – Status of Implementation of Directives Appendix –C – Performance parameters Appendix –D – Court Cases Appendix –E – RSF filing formats Appendix –F – CoS filing formats
2.1 Introduction This chapter presents the analysis of licensee’s performance during the Current Year as
compared to the previous year. Key operating and financial parameters have been
considered for this analysis.
2.2 Operating Performance
Energy Balance:
Particulars
2015-16 2016-17
TSERC Actuals TSERC Estimates
MU % MU % MU % MU %
Metered Sales 7,242.60 55.57% 6,893.73 51.95% 7,769.25 56.10% 7,432.69 53.50% LT Agricultural Sales 4,340.01 33.30% 4,671.95 35.21% 4,589.01 33.14% 4,942.39 35.57%
Total Sales 11,582.61 88.87% 11,565.68 87.16% 12,358.26 89.23% 12,375.08 89.07% Dist. Losses (Excl: EHT
Sales) 1,450.78 12.58% 1,704.27 14.35% 1,490.91 12.14% 1,518.04 12.30%
EHT Sales 1,504.04 11.54% 1,397.17 10.53% 1,571.65 11.35% 1,552.55 11.17% Dist. Losses (Incl: EHT
Sales) 1,450.78 11.13% 1,704.27 12.84% 1,490.91 10.77% 1,518.04 10.93%
Discom Input (MU) 13,033.39 100.00% 13,269.95 100.00% 13,849.17 100.00% 13,893.12 100.00%
Distribution Loss Reduction –
Page 3 of 195

Year
Loss Target as per ERC
Actual No. of 11 KV
T&MHQ feeders for
which energy audit done
Additional 33/11 KV sub-
stations charged Excl. EHT Incl. EHT Excl. EHT Incl. EHT
2010-11 16.92% 14.47% 15.95% 14.21% 445 65
2011-12 15.38% 13.33% 15.63% 14.02% 464 27
2012-13 13.99% 12.36% 15.06% 13.37% 505 70
2013-14 13.45% 11.88% 14.89% 13.32% 529 18
2014-15 Tariff Order not issued 14.69% 13.25% 565 28
2015-16 12.58% 11.13% 14.35% 12.84% 570 64
2016-17 12.14% 10.77% 12.30% 10.93% 573 174* *Proposed
As seen from the above table, the actual distribution losses for the FY 2015-16 are 14.35%
and reduced compared to previous year loss of 14.69%. However it is expected that the
losses will reduce further with the implementation of the following measures.
i) Strict implementation of Restriction and Control measures to ensure the assured
number of hours of supply to agricultural sector. ii) Reduction of both technical and commercial losses by actively conducting 11KV
feeder wise energy audit of around 573 feeders in the company. iii) During the year 2014-15, only 565 11 KV Town & MHQ feeders were considered for
energy audit where as during the year 2015-16, 570 feeders energy audit is being
done on regular basis at corporate office level.
For the year 2015-16, 64 additional 33/11 KV sub-stations were charged and for the year
2016-17, 174 additional 33/11 KV sub-stations are proposed to reduce the load on over
loaded 33 KV & 11 KV lines and to maintain good voltage profiles up to the consumers end
and so far 58 no 33/11 KV sub-stations are commissioned.
Metered Sales:- In 2016-17, the metered sales are expected to increase by 539 MU over 2015-16 levels,
which is 7.82% increase.
Agriculture Sales:
Page 4 of 195

In the year 2015-16 the actual Agriculture Consumption is 4,672 MU as against the 2014-
15 actuals of 4,738 MU, which is 66MU less than the 2014-15 sales. During the first half of
the current year the agriculture consumption decreased at 1964 MU compared to the last
year 2015-16 first half at 1988 MU due to dwindled water table in NPDCL jurisdiction due
to acute short fall in rain fall since last two years and this year sufficient rainfall in the
month of Sep/2016 and ground water is increased. In the current year the rain fall is heavy
and all tanks are filled and ground water is raised and also the cultivation land is also
expected to increase. Thus sharp rise of agriculture consumption is expected. A growth
rate of 11 % is considered on 2nd half of the FY2015-16 for projection of H2 of 2016-17 on
account of new services and sufficient rain fall. Thus expected agricultural consumption
for FY 2016-17 is 4,942 MU.
2.3 Financial Performance The following table provides an overview of TSNPDCL’s financial performance for the FY
2015-16 and compares it with the TSERC orders.
Particulars
2015-16
TSERC Actuals Variations
(+/-)
Revenue from Tariff 3,608.35 3,608.22 (0.13)
Non-Tariff Income 28.68 100.68 72.00
GOAP Subsidy 3,533.44 3,533.44 (0.00)
Total Revenue 7,170.47 7,242.34 71.87
Distribution Cost 1,203.15 1,143.97 (59.18)
Power purchase 5,308.96 6,507.66 1,198.70
Transmission & SLDC Charges 352.24 353.51 1.27
PGCIL & ULDC charges 111.53 138.47 26.94
Interest on Consumer SD 51.88 41.60 (10.28)
Supply margin in RSB 8.14 8.99 0.85
Other Costs if any 134.56 5.75 (128.81)
Total Expenditure 7,170.47 8,199.94 1,029.48
Revenue (Deficit)/Surplus 0.00 (957.60) (957.61)
Page 5 of 195

2.3.1 Revenue from sale of Power:- The net revenue (excl. NTI) for FY 2015-16 actuals Rs 3608.22 Crores.
For the key categories, the licensee has estimated the revenue as below:
Particulars
2015-16
TSERC Actuals Variations
(+/-) LT
LT-I Domestic 821.41 877.46 56.05
LT-I Non - Domestic 529.31 540.17 10.87
LT-III Industry 215.54 210.09 (5.45)
LT-IV Cottage and Dobighats 2.81 2.84 0.04
LT-V Agriculture 39.08 32.46 (6.62)
LT-VI Street light and PWS 172.12 155.91 (16.21)
LT-VII General 26.70 27.74 1.04
LT-VIII Temporary - 1.99 1.99
Total LT 1,806.97 1,848.67 41.71
HT
HT-I Industrial (Seg.) 965.06 936.65 (28.41)
HT-II Industrial (Non-seg) 111.04 140.28 29.24
HT-III Airports,Bus&Railway Stations 7.44 6.87 (0.57)
HT-IV Agriculture and Irrigation 241.21 220.24 (20.97)
HT-V Railway Traction 320.19 295.74 (24.45)
HT-VI Townships 91.53 97.07 5.54
Resco 64.92 60.26 (4.66)
Temporary - 2.44 2.44
Total HT 1,801.39 1,759.55 (41.84)
Grand Total 3,608.35 3,608.22 (0.13)
3 Sales Forecast & Energy Requirement:
3.1 Sales Forecast: The licensee has adopted two different methodologies namely, trend method and end-
user method for forecasting the sales in various categories. The trend method has been
used predominantly except in the case of HT - I and HT-IV category services, for which the
end-user method has been adopted. The sales projections for the current and ensuing
years, the licensee has shown below actual sales of TSNPDCL for the FY 2015-16.
Page 6 of 195

Trend Method This method is a non-causal model of demand forecasting that assumes that the demand
would follow the same trend as in the past. In this trend method, there is flexibility to
incorporate recent and future changes by adjusting the growth rates to project short
term sales forecasting of current and ensuing years. The licensee has projected the
category wise sales duly considering the recent changes and historical sales from FY 2010-
11 to H1 of FY 2016-17 and its compound annual growth rates. The following inputs have
been taken to arrive at sales consumption for H2 of FY 16-17 and FY 2017-18.
Compounded annual growth rate computed for historical sales from FY 2010-11 to
FY 2015-16.
Sales projected for H2 of FY 2016-17 using expected growth rates over actual sales of H2 of FY 2015-16.
Sales projected for FY 2017-18 using expected growth rates over projected sales of FY 2016-17
In the FY 2015-16 and H1 of FY 2016-17, the licensee has not imposed any load restriction to any class of consumers.
End-User Method The licensee has adopted this methodology primarily for HT – 1 (Industrial) and HT – IV
(Irrigation and Agriculture) categories. For HT – I category, the licensee believes that the
projection of consumption based on historical growth-rate is not correct because of the
nature of the industries in its area. For HT – IV, the sales are scheme dependent and
hence, for forecasting the sales of this category, the licensee has considered the inputs as
given by the Irrigation Department.
Category-wise Load Forecast HT-I Industrial: This category is predominantly driven by Singareni Collieries, Cement Industry, HMWSSB
(Hyderabad Metropolitan Water Supply Sewerage Board), and Paper Industry. These
industries contribute about 43%, 3%, 3% and 1% of the HT - I sales respectively.
Page 7 of 195

Singareni Collieries: - In the recent past, they have closed down some of their
underground mines and the new operational mines have been based on Open Cast. As per
the historical data, there has been a downward trend in consumption due to low load
requirement for opencast mining. In addition to the above, they have adopted energy
conservation measures, which have resulted in reduction in energy consumption. The
Compound Annual Growth Rate (CAGR) of sales for the last 14 years of this industry is
negative growth rate of 0.48%. In the 1st half of the current year 2016-17, the
consumption increased by 2.39% with respect to the 1st half of the previous year 2015-16.
In view of this, the licensee has considered the above 1st half growth rate on H2 of 2015-
16 to arrive H2 sales of FY 2016-17 and same growth rate is considered for FY 2017-18 and
the sales for FY 2017-18 expected to be 573.33 MU.
Cement industry:- In FY 2010-11, the sales of this industry has recorded negative growth
rate i.e., (-) 63% due to captive generation. In this segment, about 80% of sales
contribution used to be by Orient Cement Industry service only, but in FY 2010-11, this
consumer switched over to captive generation by installing 2X25MW generators. Due to
this, the power consumption by the consumer has decreased by 70%, 36% and 60% in FY
2010-11, FY 2011-12 and FY 2012-13 respectively. The consumption of cement industry for
the 1st half of FY 2015-16 has decreased by -28%. Considering the above factors the
licensee has considered the same quantum of sales recorded in H2 of FY 2015-16 as
estimated sales for H2 of FY 2016-17 also. The licensee has considered 1% nominal growth
rate on sales of FY 2016-17 to arrive sales of FY2017-18 and the sales for FY 2017-18
expected to be 31.62 MU.
Paper Industry:- In FY 2015-16, this industry has recorded negative growth rate i.e., (-)
57% due to closer of Sirpur Kagaznagar Paper Mill. In this segment, about 90% of sales
contribution used to be by Sirpur Kagaznagar Paper Mill service only. In view of this, the
licensee has considered the same quantum of sales recorded in H2 of FY 2015-16 as
estimated sales for H2 of FY 2016-17 also. The licensee has considered 1% nominal growth
rate on sales of FY 2016-17 to arrive sales of FY 2017-18 and the sales for FY 2017-18
expected to be 25.69 MU.
Ferro Alloy Units:- In licensee’s area, there is only one Ferro Alloy unit at 33 kV voltage
Page 8 of 195

level. This service load was de-rated from 6,300 KVA to 70 KVA in the month of Nov/2015.
Hence, the licensee has considered the same quantum of sales recorded in H1 of FY 2016-
17 as estimated sales for H2 of FY 2016-17 and the same quantum of sales projected FY
2016-17 are estimated FY 2017-18 also.
Hyderabad Metropolitan Water Supply Sewerage Board :- In licensee’s area, there are
two services which are released in the month of Oct-2015 with contracted load of 12 MW
each at 220 Kv voltage level for supply of drinking water from Yellampally Project in Dist:
Peddapally to Hyderabad city. The licensee has considered the same quantum of sales
recorded in H1 of FY 2016-17 as estimated sales for H2 of FY 2016-17 and the same
quantum of sales projected for FY 2016-17 and estimated for FY 2017-18 also and the
estimated sales for FY 2017-18 are to be 144.23 MU.
Other Industries: In HT-I-Industrial Category, apart from Singareni, Cement, Paper, Ferro
Alloy units, other industries contribute about 50% of the sales. In this segment, majority of
the consumers avail supply at 11 KV and the growth in sales is due to increase in specific
consumption of existing consumers in addition to release of new services. In the 1st half of
the current year, the sales of this category has recorded growth rate of 8% over H1 of FY
2015-16. However, the licensee expects the nominal growth rate of 6% to arrive sales
projection for H2 of FY 2016-17 over the H2 of FY 2015-16. The licensee has considered 5%
optimistic growth rate on sales of FY 2016-17 to arrive sales of FY 2017-18.
HT-IA Poultry Farms: As per the Tariff Order for the FY 2015-16, Poultry Farms are categorized under HT-IA by
the Hon’ble commission with effect from 01.04.2015. Hence, sales in this category are
expected as 7.59 MU and 7.74 MU for the FY 2016-17 and FY 2017-18 respectively.
(In MU)
HT-I 2015-16 2016-17H1 2016-17H2 2016-17 2017-18
Voltage Actuals Actuals Projections Projections Projections
132kV 570.94 337.41 347.48 684.89 694.65
33kV 207.45 86.75 93.75 180.50 184.21
11kV 488.62 212.42 285.91 498.33 557.59
Total 1,267.01 636.58 727.15 1,363.73 1,436.45
HT-II Non-Industrial:
Page 9 of 195

In this category, there are two consumers at 220 KV level, out of which one consumer
avails power from captive sources and another service was released in the end of the FY
2012-13 which was taken for construction of power plant and subsequently this service is
being used for standby supply. In the month of August 2015, the consumption of this
category at 220 KV level is expected to be 1.21 MU for H2 of FY 2016-17 and 3.38 MU for
FY 2017-18. The consumption of HT-II at 33 KV level is expected to be 13.13 MU and 13.39
MU for current and ensuing years respectively. The consumption of this category is mainly
contributed by 11 KV consumers. At 11KV level sales growth rate of 8% recorded for H1 of
FY 2016-17 over H1 of FY 2015-16, the same growth rate over sales of H2 of FY 2015-16 is
considered to arrive the sales of H2 of FY 2016-17 and also same growth rate over sales of
FY 2016-17 is taken to arrive estimated sales of FY 2017-18. The sales in this category are
expected as 126.79 MU and 136.59 MU for the FY 2016-17 and FY 2017-18 respectively.
(In MU) HT-II 2015-16 2016-17H1 2016-17H2 2016-17 2017-18
Voltage Actuals Actuals Projections Projections Projections
132kV 12.39 4.91 1.21 6.12 3.38
33kV 13.48 6.30 6.83 13.13 13.39
11kV 99.38 56.40 51.15 107.55 119.82 Total 125.24 67.60 59.19 126.79 136.59
HT-III Airport, Bus Stations and Railway Stations: As per the Tariff Order for the FY 2013-14, Airports, Bus Stations and Railway Stations are
categorized under HT-III by the Hon’ble commission with effect from 01.04.2013. Hence,
sales in this category are expected as 8.02 MU and 8.60 MU for the FY 2016-17 and FY
2017-18 respectively.
In MU
HT-III 2015-16 2016-17H1 2016-17H2 2016-17 2017-18
Voltage Actuals Actuals Projections Projections Projections
132kV
33kV
11kV 7.97 4.36 3.66 8.02 8.60 Total 7.97 4.36 3.66 8.02 8.60
HT-IV Irrigation & Agriculture: In TSNPDCL, the following are major State Government Lift Irrigation Schemes including
new upcoming schemes.
Page 10 of 195

Existing LIS schemes
Devadula Phase-I
Darma Sagar JCR-DLIS-Phase-I WGL192 Released 120.00 16.00 132.00 6.00 37.75
Atmakur (Punkurthi) JCR-DLIS-Phase-I WGL198 Released 120.00 16.00 220.00 13.00 30.04
Bheemghanpur JCR-DLIS-Phase-I WGL200 Released 120.00 16.00 132.00 46.67 91.21
Gangaram JCR-DLIS-Phase-I WGL201 Released 120.00 16.00 132.00 148.89 106.54
Devadula Phase-I (Total) 214.56 265.55
Devadula Phase-II
Chalivagu JCR-DLIS-Phase-II WGL288 Released 120.00 16.00 220.00 29.00 46.49
Chaghal JCR-DLIS-Phase-II WGL260 Released 120.00 16.00 33.00 7.00 7.36
Bhommakur JCR-DLIS-Phase-II WGL289 Released 120.00 16.00 33.00 7.50 4.54
Gandiramaram JCR-DLIS-Phase-II WGL344 Released 120.00 16.00 33.00 9.00 9.39
Devadula Phase-II (Total) 52.50 67.78
Arugula Rajaram Guthpa
Nandipet - A R Guthpa - Ummeda - 120 NZB222 Released 120.00 16.00 132.00 11.34 6.02 Nandipet - A R Guthpa - Lakmapur - 120 NZB223 Released 120.00 16.00 132.00 7.56 3.62
Arugula Rajaram Guthpa(Total) 18.90 9.64
Alisagar
Bodhan Alisagar-Kosli -120 Days NZB212 Released 120.00 16.00 132.00 8.07 3.51 Bodhan Alisagar-Bhagepally 120 Days NZB213 Released 120.00 16.00 132.00 10.88 4.98
Bodhan Alisagar-Jankam Pet -120 Days NZB214 Released 120.00 16.00 132.00 4.69 2.56 Alisagar (Total) 23.64 11.05
KADDAM ADB438 Released in Nov/2014 120.00 16.00 132.00 11.25 7.22
KADDEM (Total) 11.25 7.22
Other 33kv Services
Kotha Pally SRSP NZB159 Released 120.00 16.00 33.00 4.50 0.83
Navap tank SRSP NZB193 Released 120.00 16.00 33.00 2.00 0.07
Armoor - CH Hanumantha Reddy - Setpally NZB238 Released 120.00 16.00 33.00 5.68 0.56
Armoor - CH Hanumantha Reddy - Setpally NZB268 Released 120.00 16.00 33.00 1.82 0.52
Armoor - CH Hanumantha Reddy - Setpally NZB271 Released 120.00 16.00 33.00 1.50 0.07
CH Hanumantha Phase-II NZB294 Released 120.00 16.00 33.00 0.46 0.00
CH Hanumantha Phase-III NZB295 Released 120.00 16.00 33.00 0.37 0.00
M/S LIFT IRRIGATION SCHEME ADB349 Released 120.00 16.00 33.00 1.60 0.96
THE PRESIDENT, MALLIKARJUN LIS ADB437 Released 120.00 16.00 33.00 1.58 -
THE EXECUTIVE ENGINEER, KRN431 Released 120.00 16.00 33.00 3.15 2.76
THE EXECUTIVE ENGINEER, DIVN,1 KRN542 Released 120.00 16.00 33.00 3.48 0.74
Other 33kv Services Total 26.13 6.50
Existing Major LIS Total 346.98 367.74
Up coming LIS in 2017-18
Sri Pada Sagar
Vemunuru Village (Ramagundam) KRN610 KRN610 90.00 16.00 220 42.80 61.63
Islampur Village (Gangadhara) KRN611 KRN611 90.00 16.00 132 28.32 40.78
Nandi Medarm Village (Dharmaram) KRN623 KRN623 90.00 16.00 220 63.96 92.10
Sri Pada Sagar (Total) 135.08 194.52
Bhakta Ramadasu LIS
Bhakta Ramadasu LIS To be Released 2017-18 90.00 16.00 132.00 22.00 31.68
Bhakta Ramadasu LIS Total 22.00 31.68
Devadula III rd Phase(Addl Load)
J.Chokkarao Godavari LI Scheme Phase-
III(Gandiramara,Rangarao palli,BommakurEXT
To be Released 2017-18 90.00 16.00 220.00 66.50 95.76
Devadula III rd Phase(Addl Load) Total 66.50 95.76
Thotapally Reservoir to Gouravelly Reservior
Thotapally Reservoir to Gouravelly Reservior To be Released 2017-18 90.00 16.00 132.00 45.00 64.80
Thotapally Reservoir to Gouravelly Reservior
Total 45.00 64.80
LI Scheme at Jogapur
LI Scheme at Jogapur To be Released 2017-18 90.00 16.00 132.00 14.24 20.51
LI Scheme at Jogapur Total 14.24 20.51
LI Scheme at Chanaka Koratala
LI Scheme at Chanaka Koratala To be Released 2017-18 90.00 16.00 132.00 14.24 20.51
LI Scheme at Chanaka Koratala Total 14.24 20.51
Up coming LIS in 2017-18 Total 297.06 427.77
MAJOR LIS GRAND TOTAL 644.04 795.50
PROJECTED SALES UNDER MAJOR LIFT IRRIGATION SCHEMES FY 2017-18
N A M E OF T H E M A JOR LIS SC .N O. ST A T US N O OF
D A YS
N O OF
H OUR S T O
B E
OP ER A T E
D IN A
D A Y
VOLT A G
E
C M D
(M VA )
Released end of the
month of Sep-2016
P R OJEC T
ED SA LES
F Y 2017-18
IN (M U)
Page 11 of 195

The above major lift irrigation schemes, with a contracted load of 347 MVA, consumed
309 MU in the year 2015-16 and 232 MU in H1 of the FY 2016-17. In the year 2015-16, the
consumption of this category is increased by 72 MU over FY 2014-15 sales. However, it is
expected that the above services will run full-fledged in the FY 2017-18. In addition to the
above, new LIS services with connected load of 297 MVA are expected to be released and
operated in the FY 2017-18. The Government of Telangana has taken up new drinking
water scheme i.e., water grid scheme to provide drinking water to all households of
Telangana State. Under this scheme, the licensee expects the consumption of 300 MU for
the FY 2017-18. Accordingly, the sales projected for the above services for year 2017-18
are as follows.
(In MU) HT-IV 2015-16 2016-17H1 2016-17H2 2016-17 2017-18
Voltage Actuals Actuals Projections Projections Projections
132kV 287.74 216.02 123.92 339.94 767.71
33kV 21.68 15.84 43.19 59.03 263.92
11kV 31.36 14.03 23.50 37.53 96.04 Total 340.78 245.90 190.60 436.50 1,127.67
HT-V Traction: In the FY 2015-16, the consumption in this category almost same compared with the
preceding year 2014-15. In this category, the licensee has considered 5years CAGR of
1.75% over sales of FY 2015-16 to arrive H2 sales of FY 2016-17. The licensee has
considered 5years CAGR of 0.28% on sales of current year 2016-17 for projecting sales for
FY 2017-18. Accordingly, the sales for FY2017-18 are expected to be 422.91 MU.
(In MU)
HT-V 2015-16 2016-17H1 2016-17H2 2016-17 2017-18
Voltage Actuals Actuals Projections Projections Projections
132kV 430.40 208.17 213.58 421.74 422.91
33kV
11kV
Total 430.40 208.17 213.58 421.74 422.91
HT-VI Colony Lighting: In this category, townships of Singareni Collieries’ consumption contribute about 93% of
the total consumption. In the FY 2015-16, the consumption in this category same
compared with the preceding year 2014-15. The sales for HT-VI category have been
Page 12 of 195

projected using a normal growth as 157.92 MU and 164.04 MU for FY 2016-17 and FY
2017-18.
(In MU) HT-VI 2015-16 2016-17H1 2016-17H2 2016-17 2017-18
Voltage Actuals Actuals Projections Projections Projections
132kV 95.70 52.44 47.42 99.86 104.19
33kV 43.78 24.28 20.98 45.26 46.79
11kV 14.48 6.54 6.26 12.80 13.06 Total 153.96 83.26 74.66 157.92 164.04
HT- RESCO: In this category, there is only one bulk supply consumer i.e., Rural Electrical Supply Co-
Operative society, Sircilla and the consumption pattern of the RESCO is in line with
TSNPDCL’s consumption of all LT consumer categories. The RESCO consumption in the 1st
half of FY 2016-17 increased by 5.14% over the 1st half of FY 2015-16. The sales are
projected at growth rate of 9.69% for the H2 of FY 2016-17 over H2 of FY 2015-16. Hence,
sales are projected for FY 2017-18 by using TSNPDCL all LT categories aggregate growth
rate. The sales for the current year 2016-17 and ensuing year 2017-18 are projected to be
652.80 MU and 699.74 MU respectively.
(In MU) HT-Resco 2015-16 2016-17H1 2016-17H2 2016-17 2017-18
Voltage Actuals Actuals Projections Projections Projections
132kV
33kV
11kV 607.52 313.62 339.18 652.80 699.74 Total 607.52 313.62 339.18 652.80 699.74
LT-I Domestic: Two factors contribute to the Domestic category sales growth namely, releases of new
service connections and increase in specific consumption. In FY 2015-16, the sales in this
category recorded 15.42% growth over its previous year. Further in the 1st half of the
current year 2016-17, growth rate in sales of this category are recorded by 9% over the 1st
half of the FY 2015-16.The same 9% growth rate on sales of H2 of 2015-16 is considered
for the H2 of 2016-17. Hence, a sales growth of 9% over sales of FY 2016-17 is considered
for FY 2017-18. The sales for the current year 2016-17 and ensuing year 2017-18 are
projected to be 3070 MU and 3343.33 respectively.
Page 13 of 195

(In MU)
LT-I 2015-16 2016-17H1 2016-17H2 2016-17 2017-18
Actuals Actuals Projections Projections Projections
Sales 2,819.02 1,623.98 1,446.02 3,070.00 3,343.33
LT-II Non-Domestic /Commercial: In the year 2015-16, the consumption of this category is increased by 13.89 % over FY
2014-15 sales. Further in the 1st half of the current year 2016-17, growth rate in sales of
this category are recorded by 7.95% over the 1st half of the FY 2015-16. In this regard, the
licensee expects that the same growth recorded in the 1st half of the current year will be
continued for the 2nd half of the FY 2016-17 & FY 2017-18 also. Hence, sales in this
category are expected as 617.92 MU and 667.03 MU for the FY 2016-17 and FY 2017-18
respectively.
(In MU)
LT-II 2015-16 2016-17H1 2016-17H2 2016-17 2017-18
Actuals Actuals Projections Projections Projections
Sales 572.43 321.93 295.99 617.92 667.03
LT-III Industrial: In the year 2015-16, the consumption of this category recorded negative growth rate of
7.95% over FY 2014-15 sales. Further in the 1st half of the current year 2016-17, growth
rate in sales of this category are recorded by -3.31% over the 1st half of the FY 2015-16. In
this regard, the licensee expects an optimistic growth rate of 2% for the H2 of FY 2016-17
over H2 of FY 2015-16 and 1% growth rate is considered for FY 2017-18 over FY 2016-17.
The Actual sales from 2015-16 to H1 of 2016-17, projections of sales for H2 of 2016-17
and sales projection for 2017-18 are as shown below.
(In MU)
LT-III 2015-16 2016-17H1 2016-17H2 2016-17 2017-18
Actuals Actuals Projections Projections Projections
Sales 247.05 116.18 129.44 245.62 248.08
Page 14 of 195

LT-IV Cottage Industries: This category has very low sales per year around 6 MU. However, the licensee expects the
consumption of 6.65MU for the FY 2017-18.
(In MU)
LT-IV 2015-16 2016-17H1 2016-17H2 2016-17 2017-18
Actuals Actuals Projections Projections Projections
Sales 6.32 3.29 3.20 6.48 6.65
LT-V Agriculture:
The Licensed area of TSNPDCL covers seventeen rural predominant districts. Farmers in
these districts are largely dependent on pumping of ground water for their irrigation
needs. The demand has been growing consistently over the past years. Typically two crops
are grown in a year and in some areas a third crop is also grown.
In spite of our regular appeals every year to the farmers to go for ID crops and complete
by 15th April, farmers are not obliging and they are continuing to raise only paddy in
midsummer also. Paddy is the preferred crop in most of the areas resulting in high
demand for irrigation.
There are other practices which are contributed to increased drawl of energy. One of
them being the fact that almost all the farmers get their pump sets locally wound which
draw more energy. Also they tend to replace their old pump sets with higher capacity
pump sets, whenever water levels deplete.
Agriculture consumption estimation based on ISI methodology:- Licensee has fixed 3168 meters for LV side of the Agricultural DTRs as per the ISI
methodology approved by the Hon’ble Electricity Regulatory Commission. The Agricultural
consumption is being estimated as per ISI methodology from October 2013 onwards and
same is being furnished to the Hon’ble Commission.
Projection of Agriculture category consumption for H2 of FY 2016-17 and FY 2017-18:- In the FY 2015-16, due to insufficient rain fall the consumption of the agricultural category
consumers decreased from its previous year’s levels of 4738 MU to 4672 MU which is -
1.40% growth over the FY 2014-15 and the consumption of agriculture category in H1 of
Page 15 of 195

FY 2016-17 has also decreased by -1.24% over the H1 of FY 2015-16. In the current year
the rain fall is heavy and all tanks are filled and ground water is raised and also the
cultivation land is also expected to increase. Thus sharp rise of agriculture consumption is
expected and 42635 new agriculture connections are planned to release during FY 2016-
17 and already 17621 service connections are released up to the month of Sep/2016. In
view of the above, the licensee expects growth rate of 11% for the H2 of FY 2016-17 over
the H2 of FY 2015-16. The sales for the FY 2016-17 are expected to be 4942 MU. The
licensee has considered 6.50% growth over FY 2016-17 projected sales for estimating
consumption for FY 2017-18. Thus, the licensee has estimated agriculture consumption of
5,264 MU for the FY 2017-18.
(In MU)
LT-V 2015-16 2016-17H1 2016-17H2 2016-17 2017-18
Actuals Actuals Projections Projections Projections
Sales 4,671.95 1,963.69 2,978.70 4,942.39 5,263.65
LT-VI Public Lighting & PWS Schemes: In 1st half of the FY 2016-17, the consumption of this category has increased by 0.49% over
H1 of FY 2015-16. The licensee has considered 2years CAGR of 1.87% on sales of FY 2015-16 for
projecting sales for H2 of FY 2016-17 and 3years CAGR of 1.74% on sales of FY 2016-17 for
projecting sales for FY 2017-18. The licensee expects the additional consumption of 6.38 MU
in this category under water grid scheme of state Government for ensuing year 2017-18.
The Actual sales from FY 2015-16 to H1 of FY 2016-17, projections of sales for H2 of FY
2016-17 and FY 2017-18 are as shown below.
(In MU)
LT-VI 2015-16 2016-17H1 2016-17H2 2016-17 2017-18
Actuals Actuals Projections Projections Projections
Sales 277.34 137.20 144.24 281.44 292.03
LT-VII General Purpose: In the 1st half of the current year 2016-17, growth rate in sales of this category is 15.08%
over the 1st half of the FY 2015-16. The licensee has considered 2years CAGR of 11.09% on
sales of FY 2015-16 for projecting sales for H2 of FY 2016-17 and 4years CAGR of 11.83%
on sales of FY 2016-17 for projecting sales for FY 2017-18. The Actual sales from 2015-16
to H1 of FY 2016-17, projections of sales for H2 of FY 2016-17 and for FY 2017-18 are as
shown below.
Page 16 of 195

(In MU)
LT-VII 2015-16 2016-17H1 2016-17H2 2016-17 2017-18
Actuals Actuals Projections Projections Projections
Sales 38.69 21.32 22.40 43.72 48.89
Abstract of category wise sales 2015-16, 2016-17 and 2017-18 is given below:
(In MU)
3.2 Load Forecast 3.2.1 Discom Losses The Hon’ble Commission had approved a loss trajectory for the licensee as per the
Wheeling tariff order for the period FY2014-15 to FY2018-19 and the same has been
considered for projection of energy input for 2016-17 and 2017-18.
Losses FY16-17 FY17-18
LT Loss (%) 5.50% 5.25%
11 kV Loss (%) 4.23% 4.20%
33 kV Loss (%) 4.00% 4.00%
3.2.2 Transco Losses The Hon’ble Commission had approved a loss trajectory for the licensee as per the
Transmission tariff order for the period FY2014-15 to FY2018-19. As the actuals are lower
2015-16 2016-17H1 2016-17H2 2016-17 2017-18
Actuals Actuals Projections Projection Projection
LT
Domestic Supply : LT- I 2,819.02 1,623.98 1,446.02 3,070.00 3,343.33 8.90% 8.90%
Non-Domestic :-LT-II 572.43 321.93 295.99 617.92 667.03 7.95% 7.95%
Industrial Supply : Cat. III 247.05 116.18 129.44 245.62 248.08 -0.58% 1.00%
Cottage Industries : Cat. IV 6.32 3.29 3.2 6.48 6.65 2.59% 2.59%
Irrigation & Agriculture : Cat. V 4,671.95 1,963.69 2,978.70 4,942.39 5,263.65 5.79% 6.50%
Public Lighting : Cat. VI 277.34 137.2 144.24 281.44 292.03 1.48% 3.76%
General Purpose : Cat. VII 38.69 21.32 22.4 43.72 48.89 13.00% 11.83%
TOTAL 'LOW TENSION' 8,632.80 4,187.58 5,019.99 9,207.57 9,869.65 6.66% 7.19%
HT
Industrial Segregated : Cat. I 1,267.01 636.58 727.15 1,363.73 1,436.45 7.63% 5.33%
Others : Cat. II 125.24 67.6 59.19 126.79 136.59 1.24% 7.73%
Airport,Bus&Railway 7.97 4.36 3.66 8.02 8.6 0.66% 7.25%
Irrigation & Agriculture : Cat. IV 340.78 245.9 190.6 436.5 1,127.67 28.09% 158.34%
Railway Traction : Cat. V 430.4 208.17 213.58 421.74 422.91 -2.01% 0.28%
Colony Lighting Cat. VI 153.96 83.26 74.66 157.92 164.04 2.57% 3.88%
Electric Co-Op Societies 607.52 313.62 339.18 652.8 699.74 7.45% 7.19%
Temporary
TOTAL 'HIGH TENSION' 2,932.87 1,559.50 1,608.01 3,167.51 3,996.01 8.00% 26.16%
TOTAL (LT + HT) 11,565.68 5,747.08 6,628.00 12,375.08 13,865.66 7.00% 12.05%
Consumer category 2016-17 on
2015-16
2017-18 on
2016-17
Page 17 of 195

than the approved the same has been considered for projection of energy input for 2016-
17 and 2017-18.
Losses FY16-17 FY17-18
Transco Loss (%) 3.38% 3.38%
3.2.3 Losses external to Transco system The losses external to the TSTransco system are estimated to be 3.44 %. This is applicable
for procurement of power from Central Generating Stations and other medium and short
term purchases. However, external losses have not been considered for bilateral/inter-
state purchases due to considering average landed power purchase cost at TSTransco
periphery. Also no additional losses have been considered for the APTransco network.
3.3.4 Energy Requirement The energy requirement duly considering the approved losses and projected sales for
FY2016-17 andFY2017-18 is tabulated below:
Energy Requirement
Particulars FY16-17 FY17-18 LT Sales 9,208 9,870 Annual LT Loss % 5.50% 5.25% LT Loss (MU) 536 547 11 kV Sales (MU) 1,317 1,495 Energy Requirement at 11 kV level (MU) 11,061 11,911 Annual 11 kV Loss % 4.23% 4.20% 11 kV loss (MU) 489 522 33 kV Sales (MU) 298 508 Energy Requirement at 33 kV level (MU) 11,847 12,942 Annual 33 kV Loss % 4.00% 4.00% 33 kV losses (MU) 494 539 132 kV Sales (MU) 1,553 1,993 Energy Requirement at 132 kV level (MU) 13,893 15,474 Cumulative Distribution Losses (MU) 1,518 1,608 Cumulative Distribution Losses (%)(incl EHT sales) 10.93% 10.39% Cumulative Transmission loss (%) 3.38% 3.38% Cumulative Transmission Losses (MU) 486 541 Total Energy Requirement 14,379 16,015 Total T & D loss (MU) 2,004 2,150 T & D Loss % 13.94% 13.42% Total Sales 12,375 13,866 Total Energy Requirement* 14,379.13 16,015
* Excluding PGCIL Losses
Page 18 of 195

4. POWER PURCHASE COST FOR CURRENT YEAR (FY 2016-17) SECOND HALF AND ENSUING YEAR (FY 2017 - 18)
The licensee is submitting the power procurement plan which will take into
account all the available and possible generation sources and shall meet out the
additional power required to meet the future energy demand.
Basis of Estimation of Quantity and Cost
This section discusses the methodology and assumptions considered for estimating
the quantum and corresponding cost of power purchase of the Licensee for the
second half of the Financial Year ending 31stMarch, 2017 and for the Financial Year
ending 31st March, 2018.
With the implementation of Multi-Buyer Model (MBM) in the state from 9thJune,
2005, each DISCOM has been allocated a certain share of the generating stations
contracted by TS & APTRANSCO. After bifurcation of the state the share from the
generating stations to TSDISCOMs is allocated as per G.O.Ms.No.20,Dt:08.05.2014.
S. No. Name of the Distribution Company Allocation Percentage
1 TSSPDCL 38.02
2 TSNPDCL 15.87
3 APEPDCL 15.80
4 APSPDCL 30.31
Power Purchase allocation Non-conventional Energy sources have been allocated to the DISCOMs
based on their geographical presence/location.
The allocation percentages for different DISCOMs of TSGENCO& APGENCO
and all the other sources is being done as per the final transfer scheme are
as follows:
S. No. Name of the Distribution Company Allocation Percentage
1 TSSPDCL 70.55 %
2 TSNPDCL 29.45 %
In case of deficit of energy, the external purchases have also been allocated based
on the above allocation percentages.
In the following paragraphs, the capacities and availabilities of all the generating
sources have been described. The actual energy availability in MU for each
DISCOM has been projected based on the above allocation principles.
Page 19 of 195

Installed Capacity of Generating Stations
a) TSGenco&APGenco Stations: The table below shows the projected
capacities of the Thermal and Hydel generating stations of
TSGenco&APGenco including the share in the interstate projects. The
Discomspurchase the entire generation of TSGenco&APGenco under the
terms of the PPAs with the generator.
Source Project Installed Capacity (MW)
TS Share Capacity (MW)
Thermal
Kothagudem-(A,B,C) 720 388
Kothagudem-V 500 269
KTPS-VI 500 269
KTPP -I 500 269
KTPP -II 600 600
Ramagundam-B 62.5 34
Dr. NTTPS ( I, II, III) 1,260 679
Dr. NTTPS – IV 500 269
RTPP-I 420 226
RTPP-II 420 226
RTPP- III 210 113
TOTAL THERMAL 5692.5 3344
HYDEL
Interstate projects:
Machkund, Orissa (AP share 70%) 84 45
T.B. Station, Karnataka (AP share 80%) 57.6 31
State projects:
Srisailam left bank PH 900 900
Nagarjunsagar 815.6 815.6
Nagarjunsagar left canal PH 60 60
Nizam Sagar 10 10
Pochampadu 27 27
Pochampadu-Stage II 9 9
Mini hydro(palair + peddapalli) 11.16 11.16
Singur 15 15
Priyadarshini Jurala* 234 117
Lower Jurala 240 240
Pulichintala 120 120
TOTAL HYDEL 2583.36 2401
TOTAL TS & APGENCO 8275.86 5745
Page 20 of 195

*At present, in respect of Priyadarshini Jurala project MoU was entered
with Karnataka, the Energy sharing is in the ratio of 50:50 between TS &
Karnataka.
*COD of 1st Unit (30MW), in respect of Pulichintala Hydro Electric Project
was declared on 29.09.2016, and the COD of remaining 3 Units are yet to
be declared.
b) Central Generating Stations(CGS): The Licensee has Power Purchase
Agreements with Central Generating Stations to purchase power from
NTPC RSTPS I&II , NTPC RSTPS-III , NTPC -Talcher-II, NTPC Simhadri-I, Vallur
(JV) Power Project,Simhadri Stage-II, Neyveli Lignite Corporation Ltd
(“NLC”) NLC TPS-II Stage-I and Stage-II, NTPL NLC Tamilnadu power
limited(Tuticorn), Madras Atomic Power Station (“MAPS”) and Kaiga
Atomic Power Station (“KAPS”). The share of the DISCOMs in the total
capacity of the stations is provided below for FY 2017-18. The percentage
allocations are the tentative weighted average allocations as per SRPC
letter dt 14.09.2016.
Name of the Station Capacity TS Share
MW MW %
NTPC-(SR) Ramagundam I & II 2100 357.84 17.04
NTPC-(SR) STAGE – Ramagundam- III 500 89.70 17.94
NTPC-TALCHER-II 2000 226 11.3
NLC TS II STAGE-I 630 58.84 9.34
NLC TS II STAGE-II 840 105.67 12.58
MAPS 440 22.44 5.10
KAIGA 1 & 2 440 69.17 15.72
KAIGA 3 & 4 440 73.48 16.70
NTPC Simhadri Stage-II 1000 247.60 24.76
Vallur (JV) NTPC with TANGEDCO * 1500 108.60 7.24
NTPL (JV) NLC with TANGEDCO 1000 150.10 15.01
Bundled Power under JVNSM from NTPC
85 MW from CGS coal portion (NTPC)
45.81 53.89
TOTAL 10975 1555.25 14.17
NTPC- Simhadri stage-I 1000 538.9 53.89
GRAND-TOTAL (CGS) 11975 2094.15 17.49
Page 21 of 195

2400MW(3x800MW) Thermal Power Project is being setting up by M/s
NTPC Ltd at Kudigi, Karnataka. The then TSDISCOMs have signed a PPA with
NTPC on 23.09.2010.9.75% of power (234 MW) from the said Power Project
was allocated by MoP,GoI to TSDISCOMs. As informed by NTPC, the
scheduled COD of 1st unit(800MW) in Jan, 2017, scheduled COD of 2nd
unit(800MW) in Aug,2017 and the scheduled COD of 3rd unit(800MW) in
Jan,2018.
c) Independent Power Producers (IPPs):As per the GoI scheme for utilization
of stranded gas based power generation capacity, it was envisaged to
supply imported spot RLNG “e-bid RLNG” to the stranded gas based plants
receiving domestic gas upto target PLF of 30% selected through a reverse e-
bidding process. The Commission approved energy availability for FY 2016-
17 was 128 MU from old gas based IPPs – Spectrum and Reliance BSES and
1947 MU from new IPPs. However till date the gas based generation has
been minimal and TS Discoms have received 39 MU from GVK Extension in
H1 of 2016-17. As there is no proposal from GoI for extension of the above
scheme for FY 2017-18, the licensees have not considered any energy
availability from the new IPPs for the ensuing year. M/s. Reliance
Infrastructure Limited (BSES) PPA term will expire by 23.12.2017. The new
IPPs which have been commissioned in XIth Five Year Plan with installed
capacity along with TS share (53.89% of the total capacity as per
Go.Ms.No.20) are tabulated as below.
Project Name Capacity (MW) TS Share (MW)
GVK Extension 220.00 118.56
Vemagiri 370.00 199.39
Gautami 464.00 250.05
Konaseema 444.08 239.31
Total 1498.08 807.31
d) AP Gas Power Corporation Ltd (APGPCL): Joint Sector:APGPCL is a joint
sector gas-based power project. The allocation of power from this project is
in proportion to the equity share capital of participating industries. TS share
Page 22 of 195

is considered as 41.68% of the total capacity as per Go.Ms.No.26 .The total
installed capacity of the project along with the DISCOMs share is as given
below:
Sl.No Station InstalledCapacity TS Share
(MW) MW %
1. APGPCL Stage- I 100 6.6688 6.67
2. APGPCL Stage- II 172 17.8390 10.37
Total 272 24.5078 9.01
e) Non-ConventionalEnergy (NCE) Sources: The details of installed capacities
of NCE projects in the state projected for FY16-17 and FY17-18 are as
follows:
Type of Project FY16-17 (MW) FY17-18(MW)
Bio Mass Power Projects 51.00 51.00
Bagasse Cogeneration Projects. 73.80 73.80
Wind Power Projects 100.00 200.00
Mini Hydel Power Projects 7.55 7.55
Industrial Waste Based Power Projects 11.00 11.00
Municipal Waste Based Power Projects 18.60 31.2
Solar Power Projects 1138.75 2609.75
TOTAL 1400.7 2984.3
The actual energy generation from biomass projects in H1 of 2016-17 is 75
MU and is in line with the approved energy of 156 MU for the current year.
However the generation from Industrial waste and bagasse based projects
in H1 of 2016-17 is 2.5 MU and 0.6 MU as against the approved availability
of 55 MU and 128 MU.
In view of the above, the licensee has considered a minimal generation of
7.77 MU from bagasse and industrial waste projects. However as the
Hon’ble Commission has fixed the tariff for generation of power from MSW
and RDF projects, it expected that this will give impetus to waste to energy
generation. The licensee has projected an availability of 126 MU in the
ensuing year from MSW projects.
f) Singareni Thermal Power Project: During the united AP state regime the
then 4 APDISCOMs had entered into a PPA with M/s Singareni Colleries
Company Limited (SCCL) in respect of their 2x600MW Thermal Power
Page 23 of 195

Project-Stage-I at PagadapalliVillage,Jaipur Mandal, Adialabad Dist. on
29.09.2010. The aforesaid PPA was submitted to the then APERC for its
consent. The then APERC however, returned the said PPA without giving its
consent for the reason that the said PPA did not specify precisely the tariff
payable in terms of its Regulation No.1 of 2008 and directed that the
APDISCOMs &TSDISCOMs may file suitable petitions under section 86(1)(b)
of the Electricity Act 2003.
Consequent to the State bifurcation and formation of Telangana State, the
Govt.of Telangana sought to work out the revised PPA to be entered by the
2 DISCOMs of Telangana only.
Accordingly, TelanganaDISCOMs have signed fresh PPA with M/s. Singareni
Colleries Company Ltd on 18.01.2016 in respect of 2x600MW Thermal
Power Project, Stage-I after legal opinion was obtained from Ld. Advocate
General of Telangana State.
The COD of 1st unit(600MW) was declared on 25.09.2016. The licensee has
considered the COD of the 2nd unit (600 MW) in December 2016.
As per its filing of Capital Cost/Tariff of 1200 MW (2 X 600 MW) project,
SCCL has considered an IDC cost of Rs 407Crs which is substantial. It is the
submission of the licensee that the consumers in the state should not be
saddled with the IDC component which is due to the project execution
delays. Further there is scope of interest cost reduction through
negotiations with the funding agencies. Keeping this in view, the licensee
has considered a fixed cost per unit of Rs 2.15/KWh for FY 2017-18.
As SCCL is a pit head station, there is a good scope of decreasing the transit
losses in coal. The licensee has considered a variable cost per unit of
Rs.1.80/KWh for FY 2017-18.
g) Long Term Purchases: The licensees have signed a Power Purchase
Agreement with M/s. Thermal Power Tech Corporation India Limited
(TPCIL) for a contracted capacity of 500 MW under long term basis through
Case-I bidding route for a period of 25 years. Consequent to bifurcation of
Page 24 of 195

the state TSDISCOMs will have 53.89% of share i.e 269.45MW. TPCIL is
supplying the above power from 20.04.2015 and the energy availability
projected from this plant is 1000.41 MU for FY 2016-17 (H2 Projection) and
2006.32 MU for FY 2017-18. The licensee has considered a total cost per
unit of Rs 3.79/unit for power from TPCIL (Unit -1)
Also the licensees have followed the competitive bidding mechanism and
have signed a Power Purchase Agreement with M/s. Thermal Powertech
Corporation India Limited (TPCIL) for a contracted capacity of 570 MW
under long term DBFOO basis for a period of 8 years. TPCIL is supplying the
above power from 30.03.2016 and the energy availability from this plant is
projected at 3968 MU for FY 2017-18.
The licensees have considered the costs as per the prices quoted by the
bidders in the Long term bidding process.
h) Bilateral/Inter-State purchases: The licensee has not proposed any
additional purchase of power through bilateral/ inter-state purchases for
the FY 2017-18. However licensee may opt for procurement of power
during specific days/ month depending on demand to ensure the stability
of the grid and also to ensure uninterrupted power supply to all categories
of consumers in the State.
Energy Availability
a) TSGenco&APGenco– Thermal Energy: The Energy availability for H2 of
FY16 has been projected based on the actual performance of Plants up to
Sep 2016 and projected performance estimated by TS &APGENCO from
October 2016 to March 2017. For FY17, the energy availability has been
projected based on the projected performance estimated by TS &
APGENCO and maintenance schedules of the plants.
The average variable cost per unit for 1st half of FY 2016-17 is considered
for H2 of FY 2016-17. For FY 2017-18 the variable cost considered is lower
Page 25 of 195

of the cost provided by the generator or actual cost in H1 escalated by 2%,
which is lower.
TSGenco intends to initiate measures aimed at reducing the cost of
delivered power to discoms through measures such as joint sampling of
coal to avoid grade slippage etc. In view of this, the licensee has considered
a variable cost per unit of Rs 2.50/unit in FY 2017-18 for KTPS A, B and C.
TSGenco&APGenco Thermal (Energy Availability- MUs)
S. No. Station Name FY16 H2TS Share FY17 TS share
1 Dr NTTPS-I,II,III 2171.08 4342.16
2 Dr NTTPS-IV 873.34 1746.68
3 RTPP-I 721.71 1,443.42
4 RTPP-II 721.71 1,443.42
5 RTPP-III 360.86 721.71
6 KTPS-(A,B,C) 1131.70 2455.40
7 KTPS-D 859.18 1718.36
8 RTS-B 101.29 214.79
9 KTPP-I 873.34 1,746.68
10 KTPP-2 1944.72 3,889.44
11 KTPS-VI 873.34 1,746.68
Total 10632.27 21,468.74
b) TSGenco&APGenco – Hydel Energy: The licensee has projected the Hydel
availability considering 100% share of power from thehydel projects in the
state of Telangana. The licensee would like to submit that the major hydel
projects in the state of Telangana serve as multi-purpose projects. In such
projects, meeting the irrigation needs is of primary importance and
generation of power is subject to meeting the irrigation needs. This coupled
with bad monsoon has resulted in Hydel failure in the FY 2015-16 wherein
only a mere 367 MU was generated as against the commission approved
value of 4038 MU. In the current year, the actual hydel generation for 1st
half was 621 MU as against the approved availability of 3841 MU for the
year. In view of the above, the licensee has projected an availability of
1,400 MU for FY 2017-18.
In this regard, the projection for the ensuing year (FY 2017 - 18) has been
considered to be similar to the availability during the current year (FY 2016-
17).
Page 26 of 195

The following table shows the station-wise projected availability for FY
16H2 and FY 17:
TSGenco&APGencoHydel (Energy Availability-MUs)
Sl No. Station Name FY16 H2TS share
FY17 TS share
1 Machkund PH AP Share 23.94 60.33
2 Tungabhadra PH AP Share 4.74 26.74
3 USL 134.25 493.43
4 LSR 12.73 22.67
5 Donkarayi 17.80 24.84
6 SSLM (Right Bank) 5.62 8.59
7 NSRCPH 1.44 19.91
8 Mini hydel (Chettipeta) 4.25 8.87
9 PABM 11.90 64.18
10 Nagarjunasagar tail pond dam PH 120.67 472.40
11 NSPH 34.32 46.31
12 NSLCPH 28.32 151.73
Total 400 1400
*At present, in respect of Jurala project, MoU was entered with Karnataka,
the Energy sharing is in the ratio of 50:50 between TS & Karnataka.
**In the Tariff Order FY 2016-17,the Hon’ble Commission has considered
total generation of TSGENCO Hydel stations to the TSDISCOMS only. Based
on this the Energy Availability of TSGENCO Hydel stations are 100%
projected to TSDISCOMS only for FY 2017-18.
c) Central Generating Stations:The energy availability for H2 of FY16-17 has
been projected based on the actual performance up to September 2016
and projected performance estimated for H2 of FY 16-17. For FY 17-18, the
energy availability has been projected based on the projected performance
estimated by CGS and maintenance schedules of the plants.
The Kudigi Thermal Power Plant has total installed capacity of 2400MW.
9.75% Power i.e., 234 MW from the said Power Project was allocated by
MoP, GoI to TSDISCOMs. As informed by NTPC, the scheduled COD of 1st
unit (800MW) in Jan, 2017, scheduled COD of 2nd unit (800MW) in
Aug,2017 and the scheduled COD of 3rd unit (800MW) in Jan,2018.
The total power availability estimate from CGS for FY16- 17 H2 and FY 17-
18 is tabulated below:
Page 27 of 195

Central Generating Stations ( Energy Availability - MUs )
Sl. No. Station Name 2016-17 H2 2017-18
1 NTPC- RSTPS I & II 1339.34 2493.15
2 NTPC- RSTPS– III 286.22 629.50
3 NTPC –TALCHER-II 835.07 1586.03
4 NTPC- SIMHADRI Stage-I 1929.80 3801.99
5 NTPC- Simhadri Stage –II (Unit 3 &4)
824.51 1746.84
5 NLC TPS II STAGE- I 135.43 314.01
6 NLC TS II STAGE- II 314.25 579.94
7 NPC-MAPS 63.85 137.65
8 NPC-KAIGA 1 & 2 219.66 460.96
9 NPC- KAIGA 3 & 4 274.55 460.96
10 Vallur (JV) NTPC & TANGEDCO 379.73 754.54
11 NTPL (JV) NLC with TANGEDCO 525.20 1058.97
13 Kudigi 46.49 1026.52
TOTAL 7174.1 15051.1
d) APGPCL: The projections for APGPCL – I and APGPCL – II are as shown
below. The actuals till September, 2016 have been factored while
estimating energy availability for FY 16-17 H2 and FY 17-18.
APGPCL Allocated Capacity (Energy Availability- MUs )
S. No. Station Name FY16-17 H2 FY17-18
1 APGPCL I - Allocated capacity 9.09 19.99
2 APGPCL II - Allocated capacity 32.49 71.53
Total 41.58 91.52
e) IPPs (Existing):
(a) M/s.GVK Industries Limited PPA is expired on 19.06.2015. Hence, there
is no energy availability for the FY 2016-17 and FY 2017-18.
(b) The Power Purchase Agreement of M/s.Spectrum Power Generation
Ltd. is expired on 18.04.2016. Hence, there is no energy in FY 2016-
17and FY 2017-18.
(c) The Power Purchase Agreementof M/s.LANCOKondapalli Power Limited
is expired on 01.01.2016. Hence, in FY 2016-17 and FY 2017-18 there
will be no energy availability.
(d) M/s.Reliance Infrastructure Limited (BSES) PPA term will expire by
23.12.2017. However no energy is projected from this project for FY 16-
17 and FY 2017-18
Page 28 of 195

Old IPPs (Energy Availability-MU)
S. No. Station Name FY16-17 FY17-18
1 GVK 0 0
2 Spectrum 0 0
3 LancoKondapalli (Gas) 0 0
4 Reliance 0 0
Total 0 0
f) IPPs (New): The Natural gas supplies from RIL KG D-6 fields to the 4 Nos
new IPPs (GVK EXtn, GMR Vemagiri, Konaseema and LKPL) was zero from
01.03.2013 onwards hence there is no generation under Long Term PPA.
PPAs were not entered with the above new IPPs under scheme for
utilization of stranded gas based power generation capacity i.e under e-bid
RLNG Scheme (Phase-IV). Energy availability from the Merchant Power
Plant viz., M/s. Pioneer Gas Power Plant under e-bid RLNG Scheme (Phase-
IV) is as mentioned.
S.No Name of the Project FY 16 H2 (MU)
1 M/s. Pioneer Gas Power Plant 986.36
The generation from aforesaid project may vary, as M/s. Pioneer Gas Power
Limited (388MW) have agreed to supply the power to TSDISCOMs suitable
to the requirement of TSDISCOMs under rostering mechanism (which
includes supply of power on non-RTC basis).
g) Non-ConventionalEnergy (NCE) Sources:
i) Biomass, Bagasse & Industrial Waste: Actual H1 data of FY 2016-17
is considered for the projection of data for H2 of FY 2016-17 & FY
2017-18, FY 2018-19
ii) Municipal Solid Waste (MSW): The energy in M/s. Hema Sri & M/s.
Shalivahana are anticipated from April, 2017 onwards.
iii) Wind: Actual H1 data of FY 2016-17 is considered for the projection
of data for H2 of FY 2016-17. For FY 2017-18.
Page 29 of 195

iv) Solar:A CUF of 19% considered for calculation of Energy for H2 of FY
2016-17, FY 2017-18.
Solar Bid 2012, Open Offer & Solar bid 2014: All the projects
selected under Solar bid 2012 and Open Offer and not
synchronized to grid are expected to commissioned by
31.12.2016.
Bid 2015: Solar projects selected under solar bid 2015 are
expected to be commissioned within 12 months & 15 months
from the date of PPA whose evacuation voltage levels are at 33
KV & 132 KV respectively.
NTPC & NVVL Bundled Power: The actual energy was
considered for projection.
The Discom-wise energy availability projections for FY16-17 H2 from
various NCE sources is as summarized in the following table:
S. No. Station Name SPDCL (MU)
NPDCL (MU)
Total (MU) (Type-wise)
1 NCE - Bio-Mass 27.03 49.33 76.36
2 NCE – Bagasse 0.00 0.01 0.01
3 NCE - Municipal Waste to Energy
0.00 0.00 0.00
4 NCE - Industrial Waste based power project
3.68 0.00 3.68
5 NCE - Wind Power 118.65 0.00 118.65
6 NCE - Mini Hydel 0.00 0.00 0.00
7 NCE - NCL Energy Ltd 0.00 0.00 0.00
8 NCE – Solar Power 524.52 62.51 587.03
Total Availability (Discom-wise) 673.88 111.85 785.73
The Discom-wise energy availability projections for FY2017-18 from various
NCE sources is as mentioned below:
S. No. Station Name TSSPDCL TSNPDCL Total (Type-wise)
1 NCE - Bio-Mass 56.52 95.22 151.74
2 NCE – Bagasse 0.40 1.57 1.97
3 Municipal Waste Energy 64.57 61.50 126.07
4 NCE - Industrial Waste based power project
5.52 0.00 5.52
5 NCE - Wind Power 397.75 0.00 397.75
Page 30 of 195

S. No. Station Name TSSPDCL TSNPDCL Total (Type-wise)
6 NCE - Mini Hydel 0.00 0.00 0.00
7 NCE - NCL Energy Ltd 0.00 0.00 0.00
8 NCE – Solar Power 2745.87 1397.89 4143.76 Total Availability(Discom-wise) 3270.63 1556.18 4826.81
h) Long Term/Medium Term Purchases: The licensees have signed a Power
Purchase Agreement with M/s. Thermal Power Tech Corporation India
Limited (TPCIL) for a contracted capacity of 500 MW under long term basis
through Case-I bidding route for a period of 25 years. Consequent to
bifurcation of the state TSDISCOMs will have 53.89% of share i.e
269.45MW. TPCIL is supplying the above power from 20.04.2015 and the
energy availability projected from this plant is 1000.41 MU for FY 2016-17
(H2 Projection) and 1875.913 MU for FY 2017-18.
Also the licensees have signed a Power Purchase Agreement with
M/s. Thermal Powertech Corporation India Limited (TPCIL) for a contracted
capacity of 570 MW under long term DBFOO basis for a period of 8 years.
TPCIL is supplying the above power from 30.03.2016 and the energy
availability from this plant is 2240.78 MU for FY 2016-17 (H2 Projection)
and 3968.345 MU for FY 2017-18.
i) Singareni Thermal Power Project: Energy availability of 3179.68 MU and
7778.8MU has been considered from Singareni Thermal Power Plant for H2
of FY 2016-17 and FY 2017-18 respectively. The entire energy available
from Singareni Thermal Power Plant may be considered for TS DISCOMs
only
j) Summary: A summary of the source wise current estimate of dispatch for
FY2016-17 H2 and FY2017-18 is presented below
Generating Station Net Energy Availability (MU)
FY2016-17 H2 FY2017-18
TS & AP Genco - Thermal 10632.27 21468.8
TS & AP Genco - Hydel 400 1400
CGS 7174.21 15050
NCE 953.91 5163
IPPs 0 0
Page 31 of 195

Generating Station Net Energy Availability (MU)
FY2016-17 H2 FY2017-18
APGPCL 41.58 92
Singareni 3179.68 7778.9
Thermal Power Tech 2941.43 5844.3
CSPGCL 0 6482.4
Total 25323.08 63279
Power Purchase Quantum & Procurement Cost
TSGenco&APGenco
The annual fixed costs for all TS & AP GENCO stations for H2 of FY 16& FY 2017-18
have been considered provisionally as per the projections given by TSGENCO and
APGENCO. The total fixed costs for all the TS & AP GENCO Thermal and Hydel
stations including both existing and new stations is Rs. 2082.36 Crs for H2 of FY 16
and Rs. 4777.53 Crs for FY 17. The fixed costs for all TS & APGENCO Thermal and
Hydel stations have been tabulated below:
TSGenco&APGenco Fixed Costs for FY16H2 (Rs.Cr.)
Fixed Costs for FY17 (Rs.Cr.)
Dr NTTPS I 58.92 120.98
Dr NTTPS II 58.92 120.98
Dr NTTPS III 58.92 120.98
VTPS-IV 117.37 246.09
RTPP I 72.13 146.27
RTPP Stage-II 114.52 223.29
RTPP-III 76.76 149.23
KTPS A 47.39 100.813
KTPS B 47.39 100.813
KTPS C 47.39 100.813
KTPS V 71.80 168.13
KTPS-VI 152.39 304.214
RTS B 13.45 27.505
Kakatiya Thermal Power Plant Stage I 157.61 304.09
Kakatiya Thermal Power Plant Stage II 467.60 1058.95
TOTAL THERMAL 1557.18 3293.15
MACHKUND PH AP Share 7.96 16.53
TUNGBHADRA PH AP Share 5.43 238.70 93.97
11.33 481.37 241.93
SSLM LCPH
NSPH
NSLCPH 6.92 17.8
POCHAMPAD Stage II 3.50 8.82
Small Hydel 16.86 36.81
Page 32 of 195

TSGenco&APGenco Fixed Costs for FY16H2 (Rs.Cr.)
Fixed Costs for FY17 (Rs.Cr.)
(SINGUR+Nizamsagar+pochampad I)
MINI HYDRO&OTHERS (Palair+Peddapalli) 2.77 9.05
Priyadarshini Jurala Hydro Electric Project 30.93 63.96
Lower jurala HES 107.48 395.23
Pulichinthal 10.68 130.65
TOTAL HYDRO 525.18 1413.48
TOTAL TS & APGENCO 2082.36 4706.63
5.1.1.3 The average variable cost for H1 of 2016-17 is considered for H2 of 2016-17 or as
provided by the generators whichever is lower for TS GENCO Stations. For FY 2017-
18, an escalation of 2% over average variable cost of H1 or as provided by
generator whichever is lower is considered for TSGENCO Stations. Similarly for
APGENCO stations the per unit average variable cost for H1 of FY 2016-17 is
considered for H2 of 2016-17 or as provided by generators whichever is lower and
for FY 2017-18 an escalation of 2% over FY 16-17 H1 variable cost or as projected
by APGENCO whichever is lower. The station-wise variable rates that have been
adopted for TS & APGENCO Thermal plants for FY 16 H2 and for FY 17 are as
follows:
Station Variable rate (Rs./kWh)
FY16-17H2 FY17-18
VTPS (I, II, III) 3.20 3.26
VTPS-IV 3.02 2.99
RTPP-I 3.79 3.63
RTPP-II 3.14 3.20
RTPP-III 3.79 3.63
KTPS (A, B, C) 2.80 2.50
KTPS- V 2.13 2.17
KTPS-VI 2.83 2.50
RTS- B 3.32 3.39
KTPP-I 2.67 2.50
KTPP-II 2.65 2.50
5.1.1.4 The incentives for TS & AP GENCO thermal stations are calculated based on APERC
Regulation No 1 of 2008, at a flat rate of 25 paisa/kWh for ex-bus scheduled
energy corresponding to scheduled generation in excess of ex-bus energy
Page 33 of 195

corresponding to target Plant Load Factor. However for the purpose of projection,
the licensee has projected availability at normative PLF of 80%.
The licensee has considered a cost of Rs 332 crs in FY 2016-17 towards interest on
pension bonds. Additional Interest on pension bonds projected for FY 2017-18 as
per the claim made by TSGENCO and APGENCO is Rs 660 crs.
Central Generating Stations (CGS):
a) NTPC-Talcher-II (2000 MW): CERC had issued Tariff Regulation for F.Y
2014-19 i.e for 5years on 21.02.2014. CERC has not finalized the individual
Tariff orders of interstate generators for F.Y 2014-19. Due to non-
availability of CERC orders for F.Y 2014 -19, the annual fixed charges for
F.Y.2016 and 2017 were considered based on the approval of CERC orders
of FY 13-14. . As per the Central Electricity Regulatory Commission (Terms
and Conditions of Tariff) Regulations, 2014, Fixed charges and incentive are
separate which are to be computed in every month based on the formulae
provided in the Regulations. Based on the availability projections, the fixed
charges and payable incentives are mentioned in the ARR for FY 16 H2 and
FY 17 in case of Talcher-II. TS has a firm share from Talcher-II. The total
variable charges for each month of FY 16 H2 and FY 17 are projected based
on the variable charges per unit already paid during the monthly Energy Bill
of August’16.
b) NTPC (SR) RSTPS Stage–I&II (2100 MW): CERC had issued Tariff Regulation
for F.Y 2014-19 i.e. for 5years on 21.02.2014. CERC has not finalized the
individual Tariff orders of interstate generators for F.Y 2014-19. Due to
non-availability of CERC orders for F.Y 2014 -19, the annual fixed charges
for F.Y.2016 and 2017 were considered based on the approval of CERC
orders of FY 13-14. As per the Central Electricity Regulatory Commission
(Terms and Conditions of Tariff) Regulations, 2014, Fixed charges and
incentive are separate which are to be computed in every month based on
the formulae provided in the Regulations. Based on the availability
projections, the fixed charges and payable incentives are mentioned in the
Page 34 of 195

ARR for FY 16 H2 and FY 17 in case of RSTPS I&II. TS has a firm share from
RSTPS I&-II. The total variable charges for each month of FY 16 H2 and FY
17 are projected based on the variable charges per unit already paid during
the monthly Energy Bill of August’16.
c) NTPC (SR) RSTPS Stage-III (500 MW): CERC had issued Tariff Regulation for
F.Y 2014-19 i.e. for 5years on 21.02.2014. CERC has notfinalized the
individual Tariff orders of interstate generators for F.Y 2014-19. Due to
non-availability of CERC orders for F.Y 2014 -19, the annual fixed charges
for F.Y.2016 and 2017 were considered based on the approval of CERC
orders of FY 13-14. . As per the Central Electricity Regulatory Commission
(Terms and Conditions of Tariff) Regulations, 2014, Fixed charges and
incentive are separate which are to be computed in every month based on
the formulae provided in the Regulations. Based on the availability
projections, the fixed charges and payable incentives are mentioned in the
ARR for FY 16 H2 and FY 17 in case of RSTPS III. TS has a firm share from
RSTPS I-II. The total variable charges for each month of FY 15 H2 and FY 16
are projected based on the variable charges per unit already paid during
the monthly Energy Bill of August’16.
d) NTPC Simhadri Stage-I (1000 MW): As per the Central Electricity
Regulatory Commission (Terms and Conditions of Tariff) Regulations, 2014
and CERC orders fixed charges and incentive are separate which are to be
computed in every month based on the formulae provided in the
Regulations. Based on the availability projections, the fixed charges and
payable incentives are mentioned in the ARR for FY 16 H2 and FY 17 in case
of NTPC Simhadri-I. TS has a firm share from NTPC Simhadri-I. The total
variable charges for each month of FY 16 H2 and FY 17 are projected based
on the variable charges per unit already paid during the monthly Energy Bill
of August’16.
e) NLC TPS II (1470 MW): CERC had issued Tariff Regulation for F.Y 2014-19
i.e for 5years on 21.02.2014. CERC has not finalized the individual orders of
Page 35 of 195

inter state generators for F.Y 2014-19. Due to non-availability of CERC
orders for F.Y 2014 -19 , the annual fixed charges for F.Y.2016 and 2017
were considered based on the approval of CERC orders of FY 13-14. . As
per the Central Electricity Regulatory Commission (Terms and Conditions of
Tariff) Regulations, 2014, Fixed charges and incentive are separate which
are to be computed in every month based on the formulae provided in the
Regulations. Based on the availability projections, the fixed charges and
payable incentives are mentioned in the ARR for FY 16 H2 and FY 17 in case
of NLC TPS-II. TS has a firm share from NLC TPS-II. The total variable
charges for each month of FY 16 H2 and FY 17 are projected based on the
per unit cost projections given by Generator.
f) NLC Stage –I (630 MW): For the TS DISCOMs share of 9.340 % of 630 MW,
the payable fixed charges and also lignite cost for the Control Period 2009-
14 was determined by CERC in its final orders of NLC TPS-II. (Stage-I).
g) NLC Stage –II (840 MW): For the TS DISCOMs share of 12.58 % of 840 MW,
the payable fixed charges and also lignite cost for the Control Period 2009-
14 was determined by CERC in its final orders of NLC TPS-II. (Stage-II).
h) Madras Atomic Power Stations (MAPS) (440 MW): The Department of
Atomic Energy (Power Section) under the Government of India, notified the
tariff for supply of power from MAPS vide ‘Tariff Notification ‘dated
22.09.2006. The share of TS in MAPS is 5.10%. The payable chargers to
MAPS to the extent of TS allocation are computed based on the tariff
determination of Department of Atomic Energy Commission.
i) Kaiga Atomic Power Station 1&2 (440 MW) and 3&4 (440MW): The TS
share from Kaiga 1 & 2 is 15.72% and it is 16.70% in case of Kaiga 3 &4. The
payable charges to Kaiga 1&2 and Kaiga 3&4 were computed based on the
single part tariff which was approved by DAE.
j) NTPC-Simhadri II (1000 MW): As per the Central Electricity Regulatory
Commission (Terms and Conditions of Tariff) Regulations, 2014 and CERC
provisional orders Fixed charges and incentive are separate which are to be
Page 36 of 195

computed in every month based on the formulae provided in the
Regulations. Based on the availability projections, the fixed charges and
payable incentives are mentioned in the ARR for FY 16 H2 and FY 17 in case
of NTPC Simhadri-II. TS has a firm share from NTPC Simhadri-II. The total
variable charges for each month of FY 16 H2 and FY 17 are projected based
on the variable charges per unit already paid during the monthly Energy Bill
of Aug’16.
k) Vallur Thermal JV Power Project (NTPC & TANGEDCO): CERC had issued
Tariff Regulation for F.Y 2014-19 i.e for 5years on 21.02.2014. CERC is not
finalized the individual orders of inter state generators for F.Y 2014-19.
Due to non-availability of CERC orders for F.Y 2014 -19 , the annual fixed
charges for F.Y.2016 and 2017 were considered based on the approval of
CERC orders of FY 13-14. As per the Central Electricity Regulatory
Commission (Terms and Conditions of Tariff) Regulations, 2014, Fixed
charges and incentive are separate which are to be computed in every
month based on the formulae provided in the Regulations. Based on the
availability projections, the fixed charges and payable incentives are
mentioned in the ARR for FY 16 H2 and FY 17 in case of NTECL Valluru-II. TS
has a firm share from NTECL Valluru . The total variable charges for each
month of FY 16 H2 and FY 17 are projected based on the variable charges
per unit already paid during the monthly Energy Bill of August’16.
l) NTPL (Tuticorin) JV Power Project (NLC & TANGEDCO): As per the Central
Electricity Regulatory Commission (Terms and Conditions of Tariff)
Regulations, 2014 and CERC provisional orders Fixed charges and incentive
are separate which are to be computed in every month based on the
formulae provided in the Regulations. Based on the availability projections,
the fixed charges and payable incentives are mentioned in the ARR for FY
16 H2 and FY 17 in case of NTPL. TS has a firm share from NTPL. . The total
variable charges for each month of FY 16 H2 and FY 17 are projected based
on the per unit cost projections given by Generator.
Page 37 of 195

m) Bundled Power from NTPC(ER) Stations under JNNSM: Presently, NVVNL
has been issuing the availability declarations to TS DISCOMs from NTPC(SR)
stations to TS against commissioning of solar power in TS under JNNSM
Policy. The available energy was considered based on the solar power at an
availability of 20% PLF to the total installed capacity of 85 MWs and
85MWs for unallocated power from NVVNL at availability PLF of 85%.
n) Bundled Power from NTPC(ER) Stations under JNNSM: Presently, NVVNL
has been issuing the availability declarations to TS DISCOMs from NTPC(SR)
stations to TS against commissioning of solar power in TS under JNNSM
Policy. The available energy was considered based on the solar power at an
availability of 20% PLF to the total installed capacity of 85 MWs and
85MWs for unallocated power from NVVNL at availability PLF of 85%.
o) PGCIL/CTU Charges, POSOCO Charges & ULDC Charges: TSDISCOMs have
been making the payments in every month towards utilization of Inter-
State Transmission Charges based on the determination of POC rates
applicable to TS in every quarter. Further, POSOCO (SRLDC) charges as well
ULDC charges are separately being paid to SRLDC & PGCIL respectively
based on the fixed chargers determined by CERC for a period of 5 years. In
case of PGCIL, as per the regulations, PGCIL has been recovering the full
fixed charges through POC rates duly considering the orders of CERC and
also subject to reconcile the entire amounts on pro-rata basis of payments
in every quarter and if recovery of fixed charges are made lesser or higher
side by PGCIL in every month. Presently, the projection of fixed charges of
PGCIL, POSOCO & ULDC was projected for FY H2 16 and FY 17 based on the
Oct’16 monthly bill.
p) NTPC-Kudgi: As informed by NTPC, the estimated total cost per unit is Rs
4.20 (Fixed Cost of Rs 2.31 and Variable Cost of Rs is 1.89). A petition was
filed before Hon’ble CERC for determination of tariff based on the capital
cost. For the period between the achievements of COD and determination
Page 38 of 195

of tariff by CERC, the Company will raise bills based on the provisional tariff
and reconciliation will be done after finalization of tariff by CERC.
APGPCL
The power purchase cost incurred by TSDISCOMs for procurement from APGPCL
for FY 16-17(H2) and FY 17-18 is as per the projections given by APGPCL:
Cost components for FY16-17 H2 and FY17-18
Stage-I FY 16-17 H2 FY 17-18
Fixed cost (Rs.in crore) 1.21 0.75
Variable cost (Rs./kWh) 2.84 2.33
Stage –II FY 16-17 H2 FY 17-18
Fixed cost (Rs. in crore) 2.07 3.04
Variable cost (Rs./kWh) 2.33 2.08
The calculations were done on the basis of availability of 0.65 MSCMD of Natural
Gas with the usage of part load i.e., about 172 MW (out of 272 MW). Stage- I is
not operated due to shortage of Natural Gas.
During Financial Year 2015-2016, Natural Gas dollar rate had been increased from
US $ 62.00 to 67.00 and Fixed Cost also increased due to non supply of natural gas
due to gas pipe line blast at Nagaram Village, East Godavari Dist on 27.06.2014
APGPCL plants were totally closed for about four and half months and also due to
application of rostering system for supply of gas by GAIL i.e. (15 days gas supply to
APGPCL and 15 days to LANCO in a month).
The following table showing the reasons to increase/Decrease the Variable cost
and Fixed cost from October, 2016 to March, 2018.
Sl. No.
PARTICULARS 2016-2017
[from October,2016 to March, 2017]
During Financial Year
2017-2018
1 Gas Availability in SCMD 6,50,000 6,50,000
2 Gas Rate - per MMBTU $2.50 $2.50
3 Exchange Dollar Rate [$] 66.94 66.94
4 Variable Cost Unit Rate : Rs.
Stage-I (Average Yearly) 2.50 [2.37] 2.34
Stage-II (Average Yearly) 2.18 [2.09] 2.09
5 Fixed Cost Unit Rate Rs.
Page 39 of 195

As plants are running with part load, the gas consumption i.e SFC (Specific Fuel
Consumption) is also more which is contributing for increase in the variable cost
and fixed cost. In view of the above, The fixed cost increased during financial year
2016-2017 compared to financial year 2017-2018 due to overhauls will be taken
place during this financial year.
New IPPs
The Natural gas supplies from RIL KG D-6 fields to the new IPPs zero from
01.03.2013 onwards hence there is no generation under long term PPA. The PPAs
were not entered with the above new IPPs under scheme for utilization of
stranded gas based power generation capacity i.e under e-bid RLNG
Scheme(Phase-IV). The projected power purchase cost from M/s. Pioneer Gas
Power Plant is as mentioned below:
S.No Merchant Plant FY 16-17 H2
(Rs. in Crs)
1 M/s. Pioneer Gas Power Plant 463.59
For arriving the projected power purchase cost, unit rate of Rs.4.70/- is taken as
per the PPA is entered under phase – IV of the e-bid RLNG scheme for the period
from 01.10.2016 to 31.03.2017.
In regular long term PPA, the tariff is two part tariff i.e., Fixed and Variable cost.
Where in during the operation of e-bid RLNG scheme, the targeted tariff fixed for
TSDISCOMs by MoP is Rs. 4.70 per unit.
Non-ConventionalEnergy(NCE) Sources: TSERC has to determine tariff for M/s. ShalivahanaProjets a MSW based power
plant. TSERC yet to determine tariff for Wind projects after conclusion of Wind
Power Policy.
The total weighted average cost of each of the NCEs is shown in the table below:
Stage-I (Average Yearly) 1.15 [1.37] 0.38
Stage-II (Average Yearly) 0.55 [0.64] 0.43
Page 40 of 195

Project Type Weighted average Cost Considered for FY17-18 (Rs./ kWh)
NCE – Bio-mass 5.86
NCE – Bagasse 4.19
NCE – Municipal Waste to Energy 7.23
NCE – Industrial Waste based power project 6.01
NCE – Wind Power 4.70
NCE – Mini Hydel 0.00
NCE – NCL Energy Ltd. 0.00
NCE – Solar Power 5.84
BilateralPurchases Month-wise shortfall has been estimated based on the availability and
requirement. A part of this deficit would be met from external sources such as
power traders and power exchange. The estimated purchases from such external
sources are estimated to be 628 MU for FY 16-17 H2.
Long Term The licensees have considered the costs as per the prices quoted by the bidders in
the Long term bidding process
Singareni Thermal Power Project
As per its filing of Capital Cost/Tariff of 1200 MW (2 X 600 MW) project, SCCL has
considered an IDC cost of Rs 407Crs which is substantial. It is the submission of the
licensee that the consumers in the state should not be saddled with the IDC
component which is due to the project execution delays. Further there is scope of
interest cost reduction through negotiations with the funding agencies. Keeping
this in view, the licensee has considered a fixed cost per unit of Rs 2.15/KWh for FY
2017-18.
As SCCL is a pit head station, there is a good scope of decreasing the transit losses
in coal. The licensee has considered a variable cost per unit of Rs.1.80/KWh for FY
2017-18.
Summary of Energy Requirement Based on the availability shown above and the energy requirement from all the
DISCOMs, the actual energy to be purchased Discom-wise has been projected as
follows:
Page 41 of 195

TSDiscom FY16-17 H2 FY17-18
MU MU
TSSPDCL 17823.4 38,432.93
TSNPDCL 7802.07 16,323.11
Total 25,625.46 54,756.05
The above energy requirement of the licensees has been arrived at by grossing up
the sales of the licensee sales with appropriate transmission and distribution
losses. The external loss on the power purchased from CGS only has also been
factored in the above energy requirement.
Summary of power purchase for current year and ensuing year
Based on the availability, requirement and costs for each source, the summary of
revised power purchase cost for the State for FY 2016 – 17 is projected as follows:
Source FY2016-17 (H1 Actual & H2 Projected)
Power Purchase (MU)
Fixed Cost Rs.Crs.
Variable Cost Rs.Crs.
Other Cost RsCrs
Total Cost RsCrs
TS &APGenco – Thermal
19650 3114 5773 352 9240
TS & APGenco – Hydel
1021 1050 0.00 0.00 1050
CGS 13654 1223 3286 9.20 4518
NCE 1635 35 937 0.00 972
IPPs 39 0 18 88 106
APGPCL 68 5 16 0.00 21
Thermal Tech 5809 1307 1001 0.00 2308
Singareni 3606 765 778 52.92 1596
Market Purchase 4654 7 2758 0.00 2765
Total 50136 7506 14568 502 22577
Based on the availability, requirement and costs for each source, the summary of
power purchase cost for the State for FY 17 is projected as follows:
Source FY2017-18 (Projected)
Power Purchase
(MU)
Fixed Cost
Rs.Crs.
Variable Cost
Rs.Crs.
Other Cost RsCrs
Total Cost RsCrs
TS &APGenco - Thermal 14,410 3293 3741 356 7389
TS & APGenco - Hydel 1400 1413 0.00 0.00 1413
CGS 13586 1493 3153 0.18 4646
NCE 5163 68 2843 0.00 2911
IPPs 0.00 0.00 0.00 0.00 0.00
APGPCL 92 4 19.52 0.00 23.31
Page 42 of 195

Source FY2017-18 (Projected)
Power Purchase
(MU)
Fixed Cost
Rs.Crs.
Variable Cost
Rs.Crs.
Other Cost RsCrs
Total Cost RsCrs
Thermal Tech 5844 1361 1076.8 0.00 2437.9
Singareni 7779 1672 1400 0.00 3073
CSPGCL 6482 1750 778 0.00 2528
Total 54,756 11055 13010 356 24421
5. Expenditure Projections
5.1 Power Purchase and Procurement Cost As per the sales forecast and projected losses, TSNPDCL would require 14,700 MU for
2016-17 and 16,323 MU for 2017-18 for sale of power to various categories aggregated by
energy losses and the cost of this energy would be Rs.6,531 Cr. and Rs.7326.43 Cr.
respectively after considering net of Pool transactions.
Details 2016-17 2017-18
Power Purchase (MU)
14,700.20
16,323.11
Power Purchase / Procurement Cost (Rs. Cr.)
6,601.55
7,326.43
5.2 Transmission Cost
The licensee has adopted the Transmission capacity contracted and rate of Transmission
charges per MW per month as per the MYT Order issued by the Hon’ble Commission for
the 3rd control period. Accordingly, the Transmission charges are expected for 2016-17
and 2017-18 are Rs. 432.89 Cr. and Rs.472.27 Cr.
5.3 PGCIL & ULDC Charges Based on the H1 actuals of FY 2016-17, the PGCIL and ULDC costs has been estimated for
entire current year of FY 2016-17 and ensuing year FY 2017-18. The details of the PGCIL &
ULDC charges are as shown in the table below:
Details 2016-17 2017-18
PGCIL Charges 246.18 372.48
ULDC Charges 2.69 3.32
Page 43 of 195

Details 2016-17 2017-18
PGCIL & ULDC Charges 248.87 375.81
5.4 SLDC Charges SLDC charges are calculated for the years 2016-17 and 2017-18 at the rate and
Transmission capacity contracted, as given in the MYT Order issued by the Hon’ble
Commission for the 3rd control period. The charges are expected to be Rs.12.05 Cr. for
2016-17 and Rs.13.04 Cr for 2017-18.
Details 2016-17 2017-18
Capacity Contracted (MW) 3948.61 4126.68
Annual Fee Rs. / MW / Year 3533.18 3995.39
Operating Charges Rs. / MW / Month 2247.62 2300.31
SLDC Charges ( Rs. Cr.) 12.05 13.04
5.5 Distribution Cost The licensee has adopted the Distribution cost for FY 2016-17 and FY 2017-18 as approved
by the Hon TSERC in its tariff Order dated 27th Mar, 2015 for 3rd MYT control period (FY
2014-15 to 2018-19).
The distribution costs for 2016-17 and 2017-18 are Rs 1,390 Crores and Rs 1,633 Crores
respectively.
Details (Rs. In Crores) 2016-17 2017-18
Return on Capital Employed 267.65 328.59
O&M Expenses 955.05 1104.00
Depreciation 311.59 372.40
Taxes on Income 9.36 9.56
Special Appropriation for Safety measures 65.12 68.41
Other Expenditure 1.38 1.45
Gross ARR 1610.15 1884.41
Less: O&M Expenses Capitalized 72.41 77.72
Less: Non-Tariff Income 147.57 173.76
Net ARR of TSNPDCL 1390.17 1632.93
5.6 Interest on Consumer Security Deposits The licensee has adopted 6.75% p.a. as interest rate which is prevailing bank rate of RBI on
security deposit for FY 2016-17 and FY 2017-18 in these filings. The interest on consumer
Page 44 of 195

security deposit for 2016-17 is estimated at Rs.41.91 Cr. and Rs.46.52 Cr. for 2017-18.
Details (Rs. Cr.) 2016-17 2017-18
Opening Balance 587.64 654.19
Additions during the Year 66.55 69.87
Closing Balance 654.19 724.06
Average Balance 620.92 689.13
Interest @ % p.a. 6.75% 6.75%
Interest Cost 41.91 46.52
5.7 Supply Margin in Retail Supply Business The licensee has adopted 2% on equity portion of approved regulatory rate bass (RRB) in
MYT order for the third control period (FY 2014-15 to 2018-19) as Supply Margin in Retail
Supply Business for FY 2016-17 and FY 2017-18.
Details (Rs. Cr.) 2016-17 2017-18
Approved RRB by the Hon’ble Commission 2,141 2629
Equity portion ( 25% of RRB) 535 657
Supply Margin in Retail Supply Business 10.71 13.14
5.8 Other Cost The licensee has proposed reactive power charges payable to southern grid, wheeling
charges payable to other states and assets maintenance charges to SRPC under this head.
Details (Rs. Crores) 2015-16 2016-17 2017-18
Actuals Projection
Reactive charges 1.16 1.16 1.16
Assets Maintenance charges 0.08 0.08 0.08
Wheeling charges KPTCL 1.15 1.15 1.15
Others 3.30 3.30 3.30
Conjestion charges 0.06 0.06 0.06
Other Costs 5.75 5.75 5.75
5.9 Aggregate Revenue Requirement for Retail Supply Business The Aggregate Revenue Requirement for the Retail Supply Business is provided below for
years 2016-17 and 2017-18.
Page 45 of 195

Details (Rs. Cr.) 2016-17 2017-18
Transmission Cost 432.89 472.27
SLDC Cost 12.05 13.04
Distribution Cost 1,390.17 1,632.93
PGCIL & ULDC charges (Rs. Cr.) 248.87 375.81
Network and SLDC Cost 2,083.98 2,494.05
Power Purchase / Procurement Cost (Net) 6,601.55 7,326.43
Interest on Consumer Security Deposits 41.91 46.52
Supply Margin in Retail Supply Business 10.71 13.14
Other Costs, if any 5.75 5.75
Supply Related Cost 6,659.92 7,391.84
Aggregate Revenue Requirement 8,743.89 9,885.89
6. Cost of Service:
6.1 Introduction This report presents the estimated cost of service for various consumer categories of the
Northern Power Distribution Company of Telangana Limited (TSNPDCL), for the year
starting on April 1, 2017 and ending on March 31, 2018. The objective of this report is to
classify the costs into demand; energy and customer related components and then
apportion the same to various customer categories.
The steps involved in the analysis are:
Forecasting the energy and peak demand requirements for the power system in the
year under consideration;
Forecasting the energy and peak demand requirements at the transmission-
distribution interface in that year;
Estimating the energy and peak demand requirements for each customer category for
that year;
Estimating the costs of providing the energy and peak demand required for each
customer category; and
Classifying and allocating the above costs to various consumer categories of TSNPDCL
at the retail level.
(This space is intentionally left blank)
Page 46 of 195

6.2 COST OF SERVICE MODEL FOR TSNPDCL
The cost of service calculations are based on the cost of service model developed for TSNPDCL. The model, as currently used, calculates the cost of serving all customers categories of TSNPDCL.
All financial input into the model is as per the ARR for the year 2017-18, including
revenue, and expenditure data.
The following section gives a brief overview of the Cost of Service model developed for TSNPDCL
(This space is intentionally left blank)
Page 47 of 195

Financial Input
Cost Elements as per the
ARR
1. Power Purchase Cost
2.
Technical Input
Energy Sales ( MU)
Coincident Demand (MW)
Non- Coincident Demand
(MW)/ Contracted Demand
(MW)
Expenditure Classification
Classification of the cost
elements –
Demand Related
Energy Related
Customer Related
Expenditure Allocation
Allocation of classified
costs to Consumer
Categories
Model Outputs
Category-wise PP Cost allocation
Category-wise Transmission Cost
allocation
Category-wise Distribution Cost
allocation
Category-wise Consolidated Cost
Summary
Page 48 of 195

Financial Input Sheet
This forms the base for the income and expenses data for the TSNPDCL. The values are as
per the ARR for the year 2017-18.
Technical Input Sheet
This part includes the system data required for the cost of service calculation. The energy
and losses in the system are included along with the data regarding the customers
responsible for the corresponding sales and losses. The percentage loss quoted is the loss
in the distribution system and hence accounts for the energy that is unavailable for sale to
the retail customers.
TSNPDCL customers are segregated into LT and HT customers which includes EHT (220 kV
and 132 kV), Sub-transmission (33kV) and distribution (11kV and LV). The EHT customers
are included as TSNPDCL customers, even though they may be connected at 220 kV or 132
kV. In this study, technical losses experienced in EHT system are covered by EHT, 33kV,
11kV and L.T loads. Hence they need to be apportioned to all loads in the system.
The HT customer categories in the TSNPDCL system are;
HT Customers
Industrial – Cat- I (11KV, 33KV and 220/132 KV) HT Others – Cat- II (11KV, 33KV and 220/132 KV) Irrigation and Agriculture – Cat-IV (11KV, 33KV and 220/132KV) Railway Traction – Cat V (132KV) Colony Consumption Cat – VI (11KV, 33 KV&132 KV) RESCOs ( 11KV)
The LT customer categories in the TSNPDCL system are;
LT Customers
Domestic – category I Non-domestic – category II Industrial – category III Cottage industries – category IV Irrigation and Agriculture – category V Public lighting – category VI General purpose – category VII Temporary – category VIII
Page 49 of 195

Energy Sales in MU, Non- coincident demand and coincident demand data is entered for
the above customer categories
The coincident demand is the estimated contribution of each category to the system peak
demand and the non-coincident demand has been estimated from system load shapes
derived and represents the peak demand of each customer category, irrespective of the
time of day. Values used in this analysis are shown in Table 2-1.
Table 2-1
Coincident Factors and Load Factors used Coincidence
Factor Class Load
Factor
L.T Customers Average Peak
Domestic Category – Category – I 80% 97%
Non-Domestic – Category – II 74% 87%
Industrial – Category – III 82% 87%
Cottage Industries – Category IV 82% 87%
Irrigation and Agriculture – Category V 85% 90%
Public Lighting – Category VI 48% 41%
General Purpose – Category VII 76% 97%
Temporary – Category VIII 76% 97%
H.T Consumers
Industrial– Category I 11KV
33KV
220/132 KV
83% 88%
92% 89%
88% 100%
HT Others – Category II 11KV
33KV
220/132 KV
77% 72%
72% 74%
64% 70%
Irrigation and Agriculture – Category IV 11KV
33KV
220/132 KV
96% 100%
98% 100%
76% 97%
Railway Traction – Category – V (132KV) 81% 87%
RESCOs Cat - 11KV 87% 89%
Colony Consumption Cate-VI – 11KV 75% 77%
Colony Consumption Cate-VI – 33KV 75% 76%
Colony Consumption Cate-VI – 132KV 75% 75%
Page 50 of 195

The DISCOM peak demands, both coincident and non-coincident are estimated using basic
load shape synthesis model. Load shapes of different categories of consumers are
constructed based on the Load Shapes data collected from the field. The following
tabulation provides a derivation of the coincident peak demand, along with the
assumptions for TSNPDCL used in that derivation:
TSNPDCL Energy (MU) Average Coincident
Demand (MW)
Sales 13,866 1,797
Loss as % of input 10.39 % 14.66%
Losses 1,608 309
Sub Total 15,474 2,106
The load factor and coincidence factor included in the Model for each category are
assumed based on a review of the characteristics of the loads and load mix in TSNPDCL.
One of the key assumptions is on the assessment of the timing of the system peak in the
test year and this has a significant bearing on the coincidence factor for each of the
customers. Recent data indicate that:
The system peak demand of TSNPDCL is occurring during Morning hours due to
Agricultural loads.
During the morning peak occurrence , the coincidence factor of agriculture is 100%
and the same is reduced to zero at the time of evening peak
Based on above considerations, it is felt that average demand method would be suitable
for allocation of costs to consumer categories since it allocates the cost equitably on all
consumer categories based on morning and evening peak loads. In the average demand
method, as the name suggests, average of coincident morning peak and coincident
evening peak is taken. In the model there is provision to calculate the cost based on the
coincident morning peak, evening peak and average. The current option selected in the
model is the average method.
Expenditure Functionalization
The new model is developed keeping in view the unbundled nature of the power sector,
hence the expenditure pertaining to NPDCL is taken as per the ARR in the financial input
sheet.
Page 51 of 195

Power Purchase Cost Transmission & SLDC Charges Repairs and maintenance Employee costs Administration and general expenses Depreciation Interest and financial charges Other expenses
Expenditure Classification
This section classifies the expenditure into demand, energy and customer related items.
The options with respect to classification are;
Demand Energy 80% Demand , 20% Customer Customer Manual entry
The fixed costs in the power purchase are treated as demand related expense and the
variable cost of power purchase is treated as energy related expense.
Entire transmission cost is considered to be a demand related expense. The O & M
expenditure in distribution is classified into demand and customer related in the ratio of
80:20. The same has been arrived at based on subjective judgement, as it is felt that some
portion of the assets and employee expenses are used for catering to the needs of the
customer such as customer service/call centers. The other cost elements in distribution viz
ROCE, depreciation and other costs have been fully considered under demand related
costs.
Expenditure Allocation
The expenditures which have been classified into demand, energy and consumer related
are apportioned to the individual customer categories.
Power Purchase Cost Allocation:
Page 52 of 195

Demand related costs of Power Purchase are primarily driven by the system peak. Hence
they are allocated to customer categories based on the Coincident Demand. Energy costs
in Power Purchase are allocated based on the loss-adjusted category energy consumption.
Transmission Cost Allocation:
The transmission costs (including PGCIL and ULDC) are considered as demand related cost
and the same is allocated to LT categories based on Non-coincident demand and
contracted demand (CMD) for HT categories
Distribution Cost Allocation:
a) Operation and Maintenance Expenditure
The demand related portion of O & M expenses are allocated to LT consumer categories
based on non -coincident demand and contracted demand (CMD) for the HT consumer
categories.
The customer related costs are allocated to customer categories based on the number of
customers in each category.
b) ROCE
Return on capital employed is driven by assets and it is fully considered as demand related
expense. ROCE is allocated to LT consumer categories based on non -coincident demand
and contracted capacity for the HT consumer categories.
c) Depreciation
Depreciation expense is driven by the level of fixed assets in the utility and is entirely
considered under demand related expenses. Depreciation is allocated to LT consumer
categories based on non -coincident demand and contracted capacity for the HT consumer
categories.
d) Interest on Consumer Security Deposit
This is allocated to consumer categories based on the energy consumption grossed up for
losses.
Page 53 of 195

A summary of the results of the model are the outputs and these are discussed in the next
section and a comparison of revenues and costs by customers is made in this part of the
computation.
Page 54 of 195

6.3 Results
The following tabulation summarizes the results of the process:
TSNPDCL needs to handle 15,474 MU, which consist of sale of 13,866 MU to its
customers and losses of 1608 MU.
Average Peak demand required by TSNPDCL is 2106 MW, which consist of 1797 MW to
serve the customers, and 309 MW of losses in the system.
The average unit cost of supplying the customers of TSNPDCL is estimated at 7.13
Rs/kWh.
Table – 3.2 provides detailed results for each category:
Category wise sales in MU
Allocated cost and unit allocated cost
Weightage of each category
Subsidies have not been considered.
Page 55 of 195

Cost of Service Model for the FY 2017-18
CONSUMER CATEGORIES
Sale
s in
MU
Allo
cate
d
Exp
en
dit
ure
(Rs/C
rs)
Co
st
of
Serv
ice
Weig
hta
ge
of
Cate
go
ry
( S
ale
s %
)
Low Tension Supply
Domestic - Category I 3343.33 2646.36 7.92 24%
Non-domestic Supply - Category II 667.03 512.83 7.69 5%
Industrial Supply - Category III 248.08 177.69 7.16 2%
Cottage Industries - Category IV 6.65 4.97 7.48 0%
Irrigation and Agriculture - Category V 5263.65 3777.95 7.18 38%
Public Lighting - Category VI 292.03 228.05 7.81 2%
General Purpose - Category VII 48.89 38.49 7.87 0%
Temporary - Category VIII 0.00
Total Low Tension Supply 9869.65 7386.34 7.48 71%
High Tension Supply
Industrial - Cat- I 557.59 419.51 7.52 4%
Industrial Segregated - Cat- I (33KV) 184.21 112.30 6.10 1%
Indusl. Segregated - Cat-I (220/132KV) 694.65 402.00 5.79 5%
HT Others - Cat-II 128.42 88.55 6.90 1%
Indusl. Non-Segregated - Cat- II (33KV) 13.39 10.58 7.90 0%
Indusl. Non-Segre - Cat-II (220/132KV) 3.38 8.10 23.97 0%
Irrigation and Agriculture - Cat-IV 96.04 83.56 8.70 1%
Irrigation and Agriculture - Cat-IV (33KV) 263.92 147.05 5.57 2%
Irrigation and Agriculture - Cat-IV (132KV) 767.71 488.85 6.37 6%
Railway Traction - Cat V (132KV) 422.91 257.95 6.10 3%
Colony Consumption (11KV) 13.06 8.40 6.43 0%
Colony Consumption (33KV) 46.79 27.70 5.92 0%
Colony Consumption (132 KV) 104.19 55.21 5.30 1%
RESCOS Cat VI 699.74 389.74 5.57 5%
Total High Tension Supply 3996.01 2499.52 6.26 29%
TOTAL 13865.66 9885.86 7.13 100%
Page 56 of 195

Appendix –A
Resource Plan for till FY 2018-19 (3rd Control Period):
With reference to the Lt. No. TSERC/Tariff/DD(T-Engg)/T-03/2015/D.No 708/16 dated
19/11/2016, issued by the TSERC, to submit long term system planning for the entire 3rd
Control Period, we hereby submit the following resource plan.
10.1 Sales Projections
Sales Forecast for FY 2017-18 has been developed based primarily on analysis of historic
data for the period FY 2009-10 to FY 2016-17. To historic additions, current proposition of
9 hours of agriculture, water grid and LI schemes have been added in a phased manner
which are expected to become completely operational by end of FY 2018-19. Following
are the additional major plans that have been considered for Sales projections.
9 hours of Agriculture Supply TSDISCOMS are committed to increasing supply to agricultural category from the present
6 hours to 9 hours starting FY 2016-17. Current supply of 6 hours for agricultural
consumers is being given in 2-3 spells spread across day and night. Whereas, by 2018-19
DISCOMs intend to give 9 hours of supply by either giving 9 hours at a stretch during the
day time or split into two spells with maximum time of supply during the day for 6 hours
and remaining 3 hours during the night.
LI schemes & Water Project A number of Lift Irrigation Schemes (LISs) are planned in the state of Telangana to supply
water for irrigation, drinking water and industrial purpose. Major schemes planned in the
region - Pranahita-Chevella, Kalwakurthy, KomaramBheema are expected to be
operational 16 hours every day during August to November every year.
Hyderabad Metro Rail (HMR) Additional load would be added to the energy requirement once HMR becomes operational. Bayyaram Steel Plant One of the major projects and key demand drivers, Bayyaram Steel Plant is expected to
become operational during the Control period.
Page 57 of 195

Sales projections
Following are sales projections for entire state of Telangana:
Category wise Sales Forecast (MU) - Telangana State
Category FY 15-16 FY 16-17 FY 17-18 FY 18-19
LT Category
LT-I Domestic 9,840 10,509 11,372 12,305
LT-II Non-domestic/Commercial 2,760 2,886 3,018 3,157
LT-III Industrial 1,049 1,069 1,106 1,145
LT-IV Cottage Industries 15 16 17 17
LT-V Agriculture 11,190 12,120 12,907 13,555
LT-VI Street Lighting & PWS 987 992 1,039 1,078
LT-VII General Purpose 100 110 119 131
LT-VIII Temporary Supply 1 2 2 2
LT - LR - - - -
LT-Total 25,943 27,703 29,580 31,391
HT Category
HT-I Industrial 10,132 9,673 10,881 11,453
HT-I(B) Ferro Alloys 182 152 166 181
HT-II Commercial 2,064 2,193 2,363 2,537
HT-III Aviation 72 71 73 75
HT-IV Lift Irrigation 760 1,059 2,026 6,260
HT-V Traction 579 570 589 619
HT-VI Townships and Residential Colonies
273 284 298 315
HT-VII Green Power - - - -
HT-VII RESCOs 608 653 700 750
HT-VIII Temporary Supply 38 33 34 34
HT-Total 14,706 14,688 17,129 22,224
LT+HT-Total 40,650 42,391 46,710 53,616
Sales projections for TSNPDCL are as follows:
Category Wise (MU) - TSNPDCL
Category FY 15-16 FY 16-17 FY 17-18 FY 18-19
LT Category
LT-I Domestic 2,819 3,070 3,343 3,641
LT-II Non-domestic/Commercial 572 618 667 720
LT-III Industrial 247 246 248 251
LT-IV Cottage Industries 6 6 7 7
LT-V Agriculture 4,672 4,942 5,264 5,606
LT-VI Street Lighting & PWS 277 281 292 301
LT-VII General Purpose 39 44 49 55
Page 58 of 195

Category Wise (MU) - TSNPDCL
Category FY 15-16 FY 16-17 FY 17-18 FY 18-19
LT-VIII Temporary Supply 0 0 0 0
LT - LR 0 0 0 0
LT-Total 8,633 9,208 9,870 10,580
HT Category
HT-I Industrial 1,241 1,364 1,436 1,630
HT-I(B) Ferro Alloys 26 0 0 0
HT-II Commercial 125 127 137 151
HT-III Aviation 8 8 9 9
HT-IV Lift Irrigation 341 437 1,128 4,261
HT-V Traction 430 422 423 431
HT-VI Townships and Residential Colonies
154 158 164 173
HT-VII Green Power 0 0 0 0
HT-VII RESCOs 608 653 700 750
HT-VIII Temporary Supply 0 0 0 0
HT-Total 2,933 3,168 3,996 7,406
LT+HT-Total 11,566 12,375 13,866 17,986
10.2 Energy Requirement
Sales projections have been grossed up with the approved loss trajectory to compute the
Energy Requirement. Following table show the energy requirement of the DISCOMs for
the control period
Particulars FY 15-16 FY 16-17 FY 17-18 FY 18-19
LT Sales 8,633 9,208 9,870 10,580
Annual LT Loss % 7.19% 5.50% 5.25% 5.00%
LT Loss (MU) 669 536 547 557
11 KV Sales (MU) 1,249 1,317 1,495 1,625
Energy Requirement at 11KV level (MU) 10,551 11,061 11,911 12,762
Annual 11 kV Loss % 4.62% 4.23% 4.20% 4.15%
11 KV loss (MU) 511 489 522 553
33 KV Sales (MU) 286 298 508 661
Energy Requirement at 33 kV level (MU) 11,349 11,847 12,942 13,976
Annual 33 kV Loss % 4.42% 4.00% 4.00% 4.00%
33 KV losses (MU) 524 494 539 582
132 KV Sales (MU) 1,397 1,553 1,993 5,120
Energy Requirement at 132 kV level (MU) 13,270 13,893 15,474 19,677
Cummulative Distribution Losses (MU) 1,704 1,518 1,608 1,692
Cummulative Distribution Losses (%) 12.84% 10.93% 10.39% 8.60%
Cummulative Transmission loss (%) 3.13% 3.38% 3.38% 3.38%
Cummulative Transmission Losses (MU) 429 486 541 688
Total Energy Requirement 13,699 14,379 16,015 20,366
Total T & D loss (MU) 2,133 2,004 2,150 2,380
T & D Loss % 15.57% 13.94% 13.42% 11.69%
Total Sales 11,566 12,375 13,866 17,986
Total Energy Requirement 13,699 14,379.13 16,015 20,366
TSNPDCL Energy Requirement
Page 59 of 195

*Exclusive of PGCIL losses Over all energy requirement of the two DISCOMs along with the PGCIL losses have
considered to compute over all energy requirement at the state level.
10.3 Supply Projections
To meet the energy requirement based on sales projections, state has planned following
capacity additions and other sources to meet the energy deficit.
State Plan
For power supply projections, current plants of Capacity additions by State Genco plants
have been considered. Telangana State has planned Thermal Generation Capacity
additions of 6,480 MW in Damaracherla, Manuguru, Kothagudem and Warangal of which
Kakatiya Thermal Power Plant Stage II has already been commissioned. Out of total
Generation Capacity additions planned, 4,080 MW of Telangana Genco plants would be
commissioned by FY 2018-19.
Particulars FY 15-16 FY 16-17 FY 17-18 FY 18-19
LT Sales 25,943 27,703 29,580 31,391
Annual LT Loss % 7.95% 5.50% 5.25% 5.00%
LT Loss (MU) 2,241 1,612 1,639 1,652
11 KV Sales (MU) 5,684 5,829 6,256 6,624
Energy Requirement at 11KV level (MU) 33,868 35,144 37,476 39,667
Annual 11 kV Loss % 4.94% 4.42% 4.34% 4.22%
11 KV loss (MU) 1,759 1,623 1,699 1,747
33 KV Sales (MU) 4,886 4,418 5,389 5,759
Energy Requirement at 33 kV level (MU) 40,513 41,186 44,563 47,173
Annual 33 kV Loss % 3.62% 3.99% 3.99% 3.99%
33 KV losses (MU) 1,520 1,713 1,853 1,962
132 KV Sales (MU) 4,137 4,441 5,485 9,841
Energy Requirement at 132 kV level (MU) 46,169 47,339 51,901 58,976
Cummulative Distribution Losses (MU) 5,520 4,949 5,191 5,361
Cummulative Distribution Losses (%) 11.96% 10.45% 10.00% 9.09%
Cummulative Transmission loss (%) 3.13% 3.38% 3.38% 3.38%
Cummulative Transmission Losses (MU) 1,492 1,656 1,816 2,063
Total Energy Requirement 47,661 48,995 53,717 61,040
Total T & D loss (MU) 7,012 6,605 7,007 7,424
T & D Loss % 14.71% 13.48% 13.04% 12.16%
Total Sales 40,650 42,391 46,710 53,616
PGCIL Losses 1,078 537 811 861
Total Energy Requirement 48,739 49,533 54,527 61,900
Telangana State Energy Requirement
Page 60 of 195

TSGENCO Generating Station Capacity (MW)
Kakatiya Thermal Power Plant Stage II 600
KTPS Stage VII 800
Managuru TPP Unit 1 270
Managuru TPP Unit 2 270
Managuru TPP Unit 3 270
Managuru TPP Unit 4 270
Damacherla TPP (5x800)* (Only 2 units considered)
1,600
CGS Units
Telangana State is expected to procure additional power of 4,673 MW from Central
Generating Stations which are planned to be commissioned during next five years.
Generating Station Proposed/Contracted Capacity
with TSDISCOMS (MW)
Kudigi 394
Tuticorin 156
Neyveli 72
Kalpakkam 71
NTPC UMPP 4000
Other Long-Term Sources
In order to meet the growing demand, Telangana State also plans to procure power of
3,039MW from other long-term sources which also includes Power from upcoming
Singareni Power Plant - Stage 2.
Generating Station Contracted Capacity of TSDISCOMS (in MW)
Singareni 600
Thermal Power Tech Unit 1 269
Thermal Power Tech Unit 2 570
Chhattisgarh Power Plant 1,000
Singareni Stage 2 600
Renewable Energy
Rise in agricultural demand is planned to be served using Renewable sources, more
specifically using the solar power generation. Total renewable capacity additions as
planned by Telangana State is 1,300 MW by 2018-19 as mentioned in table.
Page 61 of 195

Source Capacity (MW)
NCE - Wind Power Upcoming in FY 16-17 100
NCE - Wind Power Upcoming in FY 17-18 100
NCE - Wind Power Upcoming in FY 18-19 100
NCE-Solar Competitive Bidding Upcoming in FY 18-19 1,000
By taking into account above mentioned capacity additions, Power Purchase Availability
has been projected for the state of Telangana.
Energy Availability projections from various sources (MU)
Period FY 15-16 FY 16-17 FY 17-18 FY 18-19
Thermal Power Stations 17,730 20,302 21,469 26,594
Hydel Power Stations 130 1,012 1,374 1,193
Total (Thermal and Hydel) 17,860 21,313 22,843 27,787
Central Generating Stations (CGS) 10,640 13,682 15,050 16,996
Gas Power Corporation Limited 132 68 92 56
IPPs 3,284 39 0 0
NCE 792 1,635 5,326 6,147
Others 17,739 9,415 20,106 19,821
Total (Without Market Purchase) 50,447 46,153 63,416 70,809
Availability from existing (Without Market Purchase)
32,975 31,071 32,128 32,575
Availability from upcoming 17,471 15,082 31,288 38,233
Market Purchases 1,964 12,228 2,797 -
Grand Total 52,410 58,381 66,213 70,809
Distribution Plan
To achieve the objective of ensuring 24x7 power to all consumers and proposed increase
in number of hours of supply to agricultural consumers, the state has planned significant
investments under various schemes. Investments are planned across various aspects of
distribution infrastructure improvement including (a) load growth and network
strengthening (b) technology upgradation, renovation and modernization schemes (c)
measures for bringing down AT&C losses, and (d) Demand Side Management (DSM)
measures and (e) Other expenditure towards general network improvement
Investments can be broadly categorized as follows: 1. Regular distribution infrastructure works i.e. Business-As-Usual investments
2. Dedicated investments for ensuring 24x7 power supply to rural consumers
under the Deen Dayal Upadhyay Gram Jyoti Yojana (DDUGJY) scheme
Page 62 of 195

3. Dedicated investments for ensuring 24x7 power supply to urban consumers
under the Integrated Power Development Scheme (IPDS)
Distribution plan for state of Telangana:
Summary of infrastructure additions*
Telangana State
Category Units FY 15-16 FY 16-17 FY 17-18 FY 18-19
SS unit additions Nos 254 231 175 202
PTR additions Nos 626 518 457 456
Feeder Additions Km 38866 40630 33916 30773
DTR additions Nos 76982 74982 69110 66777
*Inclusive of Infrastructure additions approved by Commission for 3rd control period
Summary of infrastructure additions*
TSNPDCL
Category Units FY 15-16 FY 16-17 FY 17-18 FY 18-19
SS unit additions Nos 90 87 42 65
PTR additions Nos 67 68 14 12
Feeder Additions Km 9941 10249 3017 1316
DTR additions Nos 36248 35982 31780 31099
*Inclusive of Infrastructure additions approved by Commission for 3rd control period
Category Units FY 2014-15 FY 2015-16 FY 2016-17 FY 2017-18 FY 2018-19 Total
R-APDRP Part A - IT Rs Crs 2 5 - - -
R-APDRP Part A - SCADA/DMS Rs Crs 0 4 7 - -
R-APDRP Part B Rs Crs 18 10 13 - -
RGGVVY XII Plan Rs Crs
Electrification of households not covered under RGGVVY Rs Crs 3 3 3 3 1
Load growth and network strengthening Rs Crs 496 707 760 817 877
Technology upgradation, renovation and modernization schemes Rs Crs 28 29 25 26 28
Measures for bringing down AT&C losses Rs Crs 128 141 2 2 2
DSM measures Rs Crs 1 21 25 27 29
Other Capex Rs Crs 55 86 94 98 100
Load growth and network strengthening Rs Crs - 67 67 - -
Technology upgradation, renovation and modernization schemes Rs Crs - 53 53 - -
Measures for bringing down AT&C losses Rs Crs - 74 74 - -
DSM measures Rs Crs - 7 7 - -
Renewable Energy Measures Rs Crs - 6 6 - -
Load growth and network strengthening Rs Crs - 261 261 - -
Technology upgradation, renovation and modernization schemes Rs Crs - 1 1 - -
Measures for bringing down AT&C losses Rs Crs - 238 238 - -
DSM measures Rs Crs - 5 5 - -
Renewable Energy Measures Rs Crs - 164 164 164 -
Capital expenditure for providing agricultural 9 hrs supply Rs Crs 635
DTR Metering Rs Crs 100 53
Smart Meters for consumers more than 200 units consumption Rs Crs 50 46 59
Total Capex Rs Crs 731.8226612 1880.713974 2590 1237 1097 4924
28
Distribution Plan - TSNPDCL
State-program
2,913
Additional investments - IPDS scheme of GOI
206
Additional investments - DDUGJY scheme of GOI
833
Additional investments for UDAY Scheme and agricultural 9 hrs
944
Page 63 of 195

APPENDIX-B
STATUS ON IMPLEMNTATION
OF DIRECTIVES
Page 64 of 195

Directives 2016-17
Directive No.
Directive Description Action to be taken
A. EARLIER DIRECTIVES
1.
Imported coal The Discoms are directed to verify whether APGENCO is procuring imported coal through the competitive bidding process, or under any guidelines issued in this regard by GoI, before admitting the Station wise power purchase bills claimed/submitted by APGENCO. Regarding NTPC Stations, DISCOMs have to take-up the pricing issue of imported coal, if any, with CERC.
APGENCO vide letter dated:02.09.2016 has informed that they are following Competitive Bidding process for procuring Imported coal. APGENCO further stated that, no imported coal was procured during the FY 2015-16 and met the shortfall of coal from M/s. SCCL.
2.
Quality of domestic coal The Discoms are directed to “appoint independent agency to ensure that the coal of agreed quality and price as per the fuel supply agreement (FSA) is used for generation of power at all coal based Thermal Power Stations. Before making final payment such audit reports should be verified by the concerned officers of the DISCOMs”. TSGENCO is also directed to adopt proper sampling technique both at sending and receiving end for coal supply from each source separately, keeping in view, the importance of coal audit as directed to DISCOMs.
Earlier, the united APERC was requested by united APDISCOMs to appoint Fuel Auditors (Coal/ Fuel) to check the Quality of Domestic Coal as well as the procurement of Imported Coal being carried out by united APGENCO, in a similar manner as appointed by the Punjab State Electricity Regulatory Commission (PSERC). However, the then Commission called for Tenders but could not finalize the same. TSGENCO informed that joint sampling techniques are being followed by TSGENCO and M/s. SCCL at various loading points of M/s. SCCL for the coal supplied to TSGENCO Thermal Stations as per the Fuel Supply Agreement (FSA) entered between TSGENCO and M/s. SCCL. TSGENCO further stated that Bunker Coal analysis is being carried out for the coal fed to bunkers at power station end for all Thermal Power Stations of TSGENCO. APGENCO stated that it is following Bureau of Indian Standards in sampling techniques.
Page 65 of 195

Directive No.
Directive Description Action to be taken
3.
Metering of agricultural DTRs The Discoms are directed to chalk out a timeline program and submit to the Commission for approval for installation of meters to all the agricultural DTRs in order to compute the metered agricultural consumption and losses in the system. In the meantime, for assessing the agricultural consumption based on ISI methodology, provide additional meters to new sample DTRs instead of shifting of the existing sample DTR meters to the new sample DTRs, as prescribed in the ISI methodology. Further, the DISCOMs are directed to follow the report of the Indian Statistical Institution which was submitted to the erstwhile APERC (which was approved) in estimation of agricultural consumption for FY 2017-18.
The AGL consumption is assessing based on ISI methodology by collecting the energy recorded by the 3,168 meters fixed to the LV side of the AGL DTRs on random sampling.
4.
T&D Losses The Discoms are directed to take stringent action to reduce the losses duly spending investment approved for this purpose. The Discoms are directed to examine the possibility of franchising the high loss feeders, to curb the commercial losses, before making claim that the actual losses are more than the approved losses.
The following stringent actions initiated to reduce losses: 55 Sq. mm AAA Conductor is made mandatory for Towns, Municipal Headquarter & Mandal Headquarter feeders. Reconductoring is being done for AGL feeders with more than 100 Amps, 526 Km. 11 kV line and 972.21 Km. LT line reconductoring is done so far. 78 Nos. Agricultural feeders which are having loads more than 150 Amps were bifurcated.
Readings of 12,05,385 services are obtained monthly using IRDA port, by avoiding manual feeding of readings.
All electro mechanical meters in Towns are replaced with electronic meters and steps are taken up to replace at rural areas also. 4,64,207 Nos. meters were replaced so far.
In towns 13,83,199 Nos. services are provided IRDA port meters.
Exceptionals are being attended regularly on top priority without pendency. The statement of distribution losses for 2014-15, 2015-16
Page 66 of 195

Directive No.
Directive Description Action to be taken
& 2016-17 (up to September 2016) is enclosed.
5.
Submission of tariff proposals The Discoms are directed to submit the ARR and Tariff proposals on time i.e., by 30th November of current year in order to make the Tariff Order effective from 1st April of the next year.
Being complied with the Directive for filing ARR in time. The Tariff proposals will be submitted by 31st December 2016.
6.
Replacement of fuses in agriculture DTRs The Discoms are directed to ensure that the field staff, to whom cell phone service (SIM cards) are given, should attend to the fuse off calls within time, on the receipt of calls from a farmer over phone. For ensuring the same, register the time of call, and confirm the action taken from the consumer is required. For achieving this, the Licensee may examine on usage of advanced IT solutions. The Licensee shall examine other alternate approaches to achieve the above objective such as creating a central monitoring team to ensure that the field staff is responding properly to the farmers fuse off calls. The action taken in this regard shall be intimated within two months.
To attend the replacement of fuses of agricultural DTRs within the time, Cell phone service facility is provided down to the level of Linemen Cadre for quick information from the farmers to replace the fuses and attending the power supply complaints. The cell phone numbers of concerned staff is displayed on the notice board at Grama Panchayt Office in every village for consumer notice and also approval is accorded to engage contract for maintenance of DTRs for 1560 un-manned distributions.
7.
Directive on resolving the problems faced by Rural area Consumers a) The Discoms are directed to examine the possibility of
establishing operational crew consisting of two or three staff members with a vehicle and spare parts, to attend rectification of defects in AB switches of substations, DTR structures, carrying the minor repairs to the transformers at site, etc. in rural areas, for improving the quality of supply and to minimize problems faced by rural consumers.
b) During the public hearing it was noticed that the staff members are not staying at headquarters (especially during night time) and causing problems to the consumers. The Discoms are directed to ensure that the staff members and all cadre of officers shall reside at the place of posting so as to make them easily accessible to the consumers and quarterly report ensuring the same shall be furnished to the Commission.
All efforts are being made for improvement of quality of power supply in rural areas by proper and periodical maintenance of distribution lines, DTRs and clearance of tree-branches along the lines and undertaking pre-monsoon inspections. Additional DTRs and re-conductoring works are being carried out wherever low voltage problems are identified. Instructions are issued to all field staff to stay at their designated headquarters accessible to the consumers to attend the power supply complaints immediately.
Page 67 of 195

Directive No.
Directive Description Action to be taken
8.
Unauthorized agricultural loads The Discoms are directed to take necessary steps for removal/regularization of remaining number of un-authorized agricultural services on priority basis.
Instructions are issued to all field officers to conduct raids and to create awareness among the unauthorized AGL pump-set owners. DPE Wing has prepared a plan of action to book the cases as per the Act. Unauthorized AGL pump-sets are being regularized duly collecting the DDs by creating awareness among the unauthorized AGL consumers. The Agricultural services are being released as per the quota approved by the State Government which includes regularization of unauthorized Agricultural connections also. It is programmed to release all pending AGL applications before March 2017. Year-wise details are as follows:
Year Target Number of Agricultural
services released
2012-13 38000 32886
2013-14 25646 26597
2014-15 32897 38105
2015-16 Not
Communicated 37273
2016-17 42635 15879 (Up to
September 2016)
B. NEW DIRECTIVES
9.
Short term purchases The DISCOMS are directed to take the prior approval for the quantum of procurement of power from short term supply sources duly indicating the reasons for such procurement. After obtaining the approval, the Licensees shall follow the guidelines issued by the Ministry of Power, Government of India u/s 63 of the Electricity Act, 2003 i.e., web based competitive procurement, for all such purchases from Short Term Sources. And also take the approval of the price. In
TSPCC on behalf of TSDISCOMs placed Purchase Orders for supply of RTC power to Telangana State under Short Term for a quantum of 2044 MW for the period from June 2016 to May 2017 with rates discovered through Tender floated on e-procurement platform. On 27.10.2016, TSERC has issued approval for Procurement of Power from Short Term Sources for the
Page 68 of 195

Directive No.
Directive Description Action to be taken
case of emergency, any procurement is done through power exchanges the necessity for such procurement should be brought to the notice of the Commission fortnightly once.
period from 27.05.2016 to 25.05.2017 with a cap on drawl of equivalent energy up to a maximum of 1400 MW. In future, Bilateral Power Procurement under short Term will be carried out through National e-bidding Portal (DEEP- Discovery of Efficient Electricity Price).
10.
True-up proposal of Distribution Licensees The DISCOMs are directed to file the true-up of Distribution business for the first two control periods. And also directed to file the true-up of Retail Supply Business under Regulation 1 of 2014 of erstwhile APERC for FY 2014-15 and FY 2015-16 in order to issue necessary directives to improve the performance of DISCOMs even though the DISCOMs have stated that the debts of the DISCOMs are taken over by the Government of Telangana under UDAY scheme.
True-up will be filed along with Tariff Proposal.
11.
Transportation of failed transformers The Discoms shall ensure that the transportation of failed transformers is done at the cost of Discoms. In case, vehicle provided to sub-division, for this purpose, is unable to meet the requirement, replacement of failed DTRs should be done by hiring a private vehicle for this purpose only. For hiring the vehicles (the tractor trailers are available in villages) where ever necessary, the schedule of rates either on kilometer basis or on per day basis may be fixed.
Vehicle is arranged at each Sub-Division level for transportation and replacement of failed DTR and replacing the failed DTRs within the stipulated time. However, some farmers are arranging their own transportation due to their urgency even though it is informed not to do transportation by own arrangements.
12.
Segregation of loads in airports The Commission has directed in the RST Order FY 2015-16, to the TSSPDCL to segregate the aviation activity loads and non-aviation activity loads of the consumer (GMR International Airport at Hyderabad) at the Discom metering point itself so as to have separate metering for both categories of loads. This work ought to have been completed by 30th September, 2015. The Licensee stated that it is segregating the Novotel Hotel loads from the aviation activity loads. The Licensee is directed to examine the possibility of segregation of remaining loads so that separate metering can be provided in order to bill under appropriate category and submit the report to the
Pertains to TSSPDCL.
Page 69 of 195

Directive No.
Directive Description Action to be taken
Commission by the end of August, 2016. The Licensee is also directed to conduct a study on the load pattern of aviation activity for computing the cost of service as directed during FY 2015-16.
13.
Agricultural service connections The DISCOMs have stated that on releasing of new agriculture connections, they are following First In First Out (FIFO) system. While following the FIFO approach, the Licensees are directed to ensure that prospective consumer should be sent status of application through a text message (on number furnished in the application). The status update should include priority number, sanction details, details of payment to be made to the Licensees by the consumer, quantum of major materials (poles, conductor and transformers) allocated with date, material drawn and completion of work. They are also directed to make available, the list of pending applications, and operation section wise in the sequential order of applications pending on the website of the DISCOMs. A similar list should also be displayed at the section office and should be updated monthly. As far as possible, new agricultural connections released hereinafter (After the date of this Order) by the Discoms, the pump sets used by the agriculture consumers should be of 5 (five) star rating as it leads to conservation of energy.
FIFO is implemented for releasing of AGL connections. SMS is sent by the AGL services release application software. Through SMS following information is communicated to the consumers. 1) Registration number and seniority number. 2) Estimate sanction. 3) Work Order issue. 4) Major materials drawn date. 5) Service release details.
14.
Non departmental accidents The DISCOMs are directed to establish a non-departmental accident registration system and give wide publicity. Necessary instructions to the staff shall be issued for acknowledging the accident claim applications at section office/ sub-division office. They are directed to make payment of ex-gratia for the fatal accident cases as per the Commission order on enhancement of ex-gratia amount, within the time specified. This was promised by the Licensees while replying at the public hearings. The report of compliance objector wise shall be furnished to the Commission by end of July, 2016.
TSNPDCL has provided “Accident Reporting System” on Company’s website viz., www.tsnpdcl.in to enable complainants for claiming the ex-gratia along with scanned copies of necessary documents. Necessary instructions are given to field.
Page 70 of 195

Directive No.
Directive Description Action to be taken
15.
Monthly Billing The Licensees are directed to develop a software system in the spot billing machines such that the consumption is limited to the billing month (for example, if previous month reading was taken on 5th day of the month, the next reading taken on 7th day instead of taking on 5th day of current month, the consumption shall be apportioned to 30/31 days depending on the number of days in that particular calendar month so that it avoids the shifting of consumption to higher slabs).
Necessary changes were incorporated in the software for billing. The Software is modified and is implemented from 1st September 2016 onwards.
16.
Staff shortage in rural areas In public hearing it was brought to the notice of the Commission that an acute shortage of operational staff exists in rural areas. We direct the Discoms to examine this issue and initiate appropriate action.
Approval is sought from the Govt. of Telangana for filling up of 558 JLM posts.
17.
Open Access In public hearing it was brought to the notice of the Commission that the applications of consumers who intend to go for open access are being delayed without any valid reasons. We direct the Discoms to dispose of all the applications seeking open access within ten (10) days from the date of receipt of the application.
TSNPDCL is granting Open Access to the applicants duly complying with the concerned Regulatios.
18.
Filing of Multi Year Tariffs and True ups by TSTRANSCO The TS Transco has mentioned that the assets and liabilities of erstwhile AP Transco have not yet been bifurcated between AP and TS Transco. The TS Transco has, hence, stated that it will file the ARR and tariff for the balance of the third control period during the year 2016-17 along with True-up for the second control period vide its letter No. CE/Plg.,Coml. &Co-ordn./DE/RAC/F.ARR(FY16-17)/D.No.68/15 dates 24th November, 2015. The TS Transco is directed to file the ARR and tariff proposals for the balance period of third control period along with filing of true ups for first and second control period before the end of November 2016 without fail.
Pertains to TS TRANSCO.
Page 71 of 195

Directive No.
Directive Description Action to be taken
19.
Filing of Tariff of TSGENCO stations for third control period and PPAs for consent The TSDISCOMs/TSGENCO is directed to file the tariff proposals, station wise for the third control period (FY 2014-15 to FY 2018-19) along with capital cost of new stations which have not been determined by the erstwhile APERC, by end of October 2016. The TSGENCO is also directed to file the station wise PPAs of its stations for Commission’s approval.
Pertains to TS GENCO
20.
Cost of Supply of HT V(B)-HMR Railway Traction Category The Commission directs TSSPDCL to study the consumption pattern for the portion of energy likely to be consumed for the commercial operation (after commencement) of HMR Metro Railways out of the total energy to be consumed during the year FY 2016-17 and propose the Category CoS for the subsequent year so as to examine the same.
Pertains to TSSPDCL.
21.
Non availability of toll free number, developing the IVRS system for registering the consumer complaints such as fuse off Calls, billing issues, etc. During public hearing it was stated by the stakeholders that at many times the toll free number is not reachable or some of them stated that they are not aware of the number. In this regard, the Licensees are directed to widely publicize the toll free number and ensure its operation 24x7. The Licensees should also ensure sufficient lines for the toll free service are available to avoid congestion in communication. The DISCOMs shall ensure that the registered complaint, as per the existing practice, on Fuse off Calls, repair/ replacement of agricultural DTRs and they shall be resolved within the stipulated time as per SoP norms. In the meanwhile the Licensee shall develop a software to register complaint through IVRS system equipped to issue a docket number (i.e. complaint number) along with date and time of registration and send through SMS on registered mobile number. The Complaints once resolved should again be communicated to the consumer through SMS on the registered mobile
The DISCOM has established Centralized Call Center (CCC) under R-APDRP program. The CCC operates 24x7. Initially IVRS is provided and as per the consumers request during the Public Hearing, it is bypassed. The SMS facility is provided to communicate complaint registration number to the consumers. Also, SMS is sent once the complaint is closed.
Page 72 of 195

Directive No.
Directive Description Action to be taken
number by the concerned authority. The SMS after complaint resolution should capture details on time taken to resolve the complaint, hence enabling the consumer to claim compensation as per Standard of Performance (SoP) regulations, in case of delay in compliance.
22.
Reduction of interruptions in GHMC area It has been noticed by the Commission that 11/33 kV lines as well as overhead lines are damaged due to heavy winds and rain causing interruptions in power supply for a large section of GHMC area. Some such outages have continued for more than 24 hours in some parts of the city. The Discoms are directed to prepare a plan for replacing the overhead lines with the underground cable system of appropriate voltage level in a phased manner and submit the proposal for the consolidation of the Commission for investment approval.
Pertains to TSSPDCL.
Page 73 of 195

Distribution Losses (including & excluding EHT)
Sl. No.
Circle 2014-15 2015-16 2016-17 (up to September 2016)
Including EHT Excluding EHT Including EHT Excluding EHT Including EHT Excluding EHT
1 Warangal 13.56% 15.03% 13.09% 14.91% 12.63% 14.90%
2 Karimnagar 11.96% 13.16% 12.08% 13.62% 11.05% 12.90%
3 Khammam 12.46% 14.32% 12.28% 13.96% 10.15% 11.57%
4 Nizamabad 16.44% 16.71% 14.39% 14.39% 15.74% 16.00%
5 Adilabad 11.23% 14.11% 12.08% 14.87% 11.06% 13.67%
Total 13.25% 14.69% 12.84% 14.35% 12.19% 13.93%
Page 74 of 195

APPENDIX-C
PERFORMANCE PARAMETERS
Page 75 of 195

Compensation Paid Consumers under SOP Regulations for the year 2015‐16
WGL KNR KMM NZB ADB TSNPDCL
Normal Fuse ‐ off 0 0 0 0 0 0Over head Line/cable breakdowns 0 0 0 0 0 0Under ground cable breakdowns 0 0 0 0 0 0DTR's Failure 0 0 0 0 0 0Schedule Outage 0 0 0 0 0 0Voltage fluctuations 31200 0 0 0 0 31200Meter Complaints 0 0 0 0 0 0Release of Supply 0 0 0 27900 0 27900Transfer of ownership and conversion of Services 0 0 0 0 0 0 i) Name Change 0 0 0 0 0 0 ii) Category Change 0 0 0 0 3000 3000
Consumers Bills 1450 1850 3100 0 500 6900Reconnection of supply following disconnection due to non‐payment of bills 54400 2800 0 12000 0 69200
Total 87050 4650 3100 39900 3500 138200
Compensation Paid Consumers under SOP Regulations for the year 2016‐17 (Up to 30.09.2016)
WGL KNR KMM NZB ADB TSNPDCL Normal Fuse ‐ off 0 0 0 0 0 0Over head Line/cable breakdowns 0 0 0 0 0 0Under ground cable breakdowns 0 0 0 0 0 0DTR's Failure 0 0 0 0 0 0Schedule Outage 0 0 0 0 0 0Voltage fluctuations 0 0 0 0 0 0Meter Complaints 0 0 0 0 0 0Release of Supply 0 0 0 0 0 0Transfer of ownership and conversion of Services 0 0 0 0 0 0 i) Name Change 0 0 0 0 0 0 ii) Category Change 0 1000 5000 0 0 6000
Consumers Bills 0 0 0 0 0 0Reconnection of supply following disconnection due to non‐payment of bills 0 0 0 0 0 0
Total 0 1000 5000 0 0 6000
Service AreaCompensation paid to Consumers (Rs.)
Service AreaCompensation paid to Consumers (Rs.)
Page 76 of 195

Human beings
AnimalsHuman beings
Amount Animals AmountHuman beings
AnimalsHuman beings
Amount Animals Amount
1 Warangal 41 40 3 29 51.00 40 7.77 45 38 0 10 26.00 26 7.00
2 Karimnagar 23 51 1 12 30.00 51 7.88 28 56 5 8 16.00 22 7.88
3 Khammam 36 43 4 16 20.00 43 24.78 10 61 1 2 6.00 51 25.01
4 Nizamabad 24 29 2 3 5.00 29 6.92 16 31 0 14 34.00 10 4.00
5 Adilabad 15 71 2 7 14.00 71 13.31 18 45 0 2 4.00 30 10.81
139 234 12 67 120.00 234 60.66 117 231 6 36 86.00 139 54.70
Electrical Accidents
Sl.No.
Circle
During 2015‐16 During 2016‐17 (Up to September 2016)
No. of Accidents Exgratia Paid No. of Accidents Exgratia Paid
Fatal AccidentsNon‐fatal Accidents
Fatal Accidents Fatal AccidentsNon‐fatal Accidents
Fatal Accidents
(Amount in Lakhs)
NPDCL Total
Page 77 of 195

Three Phase Single Phase Three Phase Single Phase Three Phase Single Phase Three Phase Single Phase
1 2 3 4 5 6 7 8 9
Warangal 43546 15797 6012 2096 6012 2096 4502 163
Karimnagar 49582 11165 5053 828 5053 828 2582 225
Khammam 23226 9030 3136 793 3136 793 2187 367
Nizamabad 49675 8439 4334 750 4334 750 3926 13
Adilabad 22576 9503 3952 1077 3952 1077 2981 108
NPDCL 188605 53934 22487 5544 22487 5544 16178 876
Three Phase Single Phase Three Phase Single Phase Three Phase Single Phase Three Phase Single Phase
1 2 3 4 5 6 7 8 9
Warangal 44391 15898 3875 904 3875 904 845 101
Karimnagar 51976 11343 3551 551 3551 551 2394 178
Khammam 24405 9148 1969 471 1969 471 1179 118
Nizamabad 51993 8453 3770 388 3770 388 2318 14
Adilabad 23343 9635 2450 564 2450 564 767 132
NPDCL 196108 54477 15615 2878 15615 2878 7503 543
DTRs Failures
Circle
No. of DTRs as on 31.03.2016
No. of DTRs failed during 2015‐16
No. of failed DTRs replaced furing 2015‐16
No. of additional DTRs installed during 2015‐16
Circle
No. of DTRs as on 30.09.2016
No. of DTRs failed during 2016‐17
(Up to September 2016)
No. of failed DTRs replaced during 2016‐17(Up to September 2016)
No. of additional DTRs installed during 2016‐17 (Up to September 2016)
Page 78 of 195

Faulty Meters (Stuck‐up & Burnt)
Single Phase
Three Phase
Single Phase
Three Phase
Single Phase
Three Phase
Single Phase
Three Phase
Warangal 21364 1115 31588 4611 42914 5068 10038 658
Karimnagar 7167 517 47473 3436 48377 3471 6263 482
Khammam 8277 486 39802 3346 42808 3248 5271 584
Nizamabad 10304 1897 60165 3920 66533 4072 3936 1745
Adilabad 9987 837 33824 932 39855 343 3956 1426
Total 57099 4852 212852 16245 240487 16202 29464 4895
Circle
Opening Balance (as on 30.09.2015)
Accurued from 01.10.2015 to 30.09.2016
Replaced from 01.10.2015 to 30.09.2016
Closing Balance(as on 30.09.2016)
Page 79 of 195

Fuse off Calls
No. of Complaints received
No. of Complaints
attended with in time frame
No. of Complaints attended beyond in time frame
No. of Complaints received
No. of Complaints
attended with in time frame
No. of Complaints attended beyond in time frame
No. of Complaints received
No. of Complaints
attended with in time frame
No. of Complaints attended beyond in time frame
No. of Complaints received
No. of Complaints
attended with in time frame
No. of Complaints attended beyond in time frame
1 Warangal 14498 14498 0 10524 10524 0 7980 7980 0 5662 5662 0
2 Karimnagar 10310 10310 0 2251 2251 0 6215 6215 0 1145 1145 0
3 Khammam 17005 17005 0 17388 17388 0 10352 10352 0 8678 8678 0
4 Nizamabad 546 546 0 201 201 0 4913 4913 0 2424 2424 0
5 Adilabad 3126 3126 0 7924 7924 0 2933 2933 0 11738 11738 0
NPDCL 45485 45485 0 38288 38288 0 32393 32393 0 29647 29647 0
Sl.No.
Circle
During 2015‐16 During 2016‐17 (Up to 30.09.2016)
Urban Rural Urban Rural
Page 80 of 195

Sl.No.
Name of the MaterialRate/ Each
Total Value
P.O. No. & Date Remarks
1 P.P Rope 5000 Kgs. 228.90 1144500 PM‐4699, Dt:16.12.2015
2 Rubber Hand Gloves 5000 Nos. 494.00 2470000 PM‐4778, Dt:05.02.2016
3 Earth Discharge rods 10 feet 3000 Nos. 830.00 2490000PM‐4774, Dt:03.02.2016 &PM‐4775, Dt:03.02.2016
4 Fire Extinguishers 1000 Nos. 3958.88 3958880 PM‐4783, Dt:08.02.2016
10063380
Sl.No.
Name of the MaterialRate/ Each
Total Value
P.O. No. & Date Remarks
1 2000 Nos. 657.30 1314600 PM‐4995, Dt:29.08.2016
2 4800 Nos. 657.30 3155040 PM‐4996, Dt:29.08.2016
3 3200 Nos. 657.30 2103360 PM‐4997, Dt:29.08.2016
4 Earth Discharge rods 3 feet 3000 Nos. 378.00 1134000 LOI issued on 28.09.2016
7707000TOTAL
PROCUREMENT OF SAFETY ITEMS FOR THE YEAR 2015‐16
Qty.
TOTAL
PROCUREMENT OF SAFETY ITEMS FOR THE YEAR 2016‐17 (up to 30.09.2016)
Qty.
HRC Fuse Base carrier 500 V400 A with knife type
Page 81 of 195

SCs Amount SCs Amount SCs Amount
1 Warangal 3648 5684.52 9 166.68 3657 5851.20
2 Karimnagar 4368 10319.62 12 516.24 4380 10835.86
3 Khammam 3416 6219.90 35 1199.61 3451 7419.51
4 Nizamabad 7933 19658.34 98 4124.58 8031 23782.92
5 Adilabad 2106 4519.57 108 5626.97 2214 10146.54
Total 21471 46401.95 262 11634.08 21733 58036.03
ABSTRACT
Statement showing circle wise arrears of consumers over Rs.50,000/‐ pending for over 6 months(as on 30.09.2016)
(Rupees in Lakhs)
Sl.No.
Name of the CircleLT Services HT Services Total
Page 82 of 195

LRTime
(Hrs:Mts)LC
Time(Hrs:Mts)
B/DTime
(Hrs:Mts)EL/OL
Time(Hrs:Mts)
ISFTime
(Hrs:Mts)Nos.
Duration(Hrs. Mts)
1 Warangal 104 0 0:00 7799 8137:10 1065 1761:48 6864 826:18 3806 2960:40 19534 13685:57
2 Karimnagar 86 0 0:00 2083 1975:46 0 0:00 2205 614:23 150 652:27 4438 3242:36
3 Khammam 59 0 0:00 228 6502:48 163 4814:52 148 373:55 0 0:00 539 11691:36
4 Nizamabad 58 0 0:00 368 411:25 149 117:35 332 73:55 0 0:00 849 602:55
5 Adilabad 55 0 0:00 2510 1340:41 273 226:45 2155 372:26 4014 1902:52 8952 3842:44
NPDCL 362 0 0:00 12988 18367:50 1650 6921:00 11704 2260:57 7970 5515:59 34312 33065:48
LRTime
(Hrs:Mts)LC
Time(Hrs:Mts)
B/DTime
(Hrs:Mts)EL/OL
Time(Hrs:Mts)
ISFTime
(Hrs:Mts)Nos.
Duration(Hrs. Mts)
1 Warangal 138 0 0:00 2368 4319:05 197 735:45 1653 427:08 2321 2443:42 6539 7925:40
2 Karimnagar 254 0 0:00 229 43:37 0 0:00 0 0:00 154 654:05 383 697:42
3 Khammam 143 0 0:00 218 5514:00 0 0:00 205 823:55 0 0:00 423 6337:55
4 Nizamabad 135 0 0:00 24 22:15 3 1:20 0 0:00 42 36:18 69 59:53
5 Adilabad 133 0 0:00 498 107:21 49 36:04 582 55:20 2614 865:54 3743 1064:39
NPDCL 803 0 0:00 3337 10006:18 249 773:09 2440 1306:23 5131 3999:59 11157 16085:50
11 KV Feeders Towns, Industrial & Other Breakdowns Particulars during the Year 2015‐16
Sl.No.
CircleNo. of 11 KV Feeders
Existing Town
11 KV TOWN Total
Sl.No.
Circle
No. of 11 KV Feeders
existing Indl. & Others
11 KV INDUSTRIAL & OTHERS Total
Page 83 of 195

LRTime
(Hrs:Mts)LC
Time(Hrs:Mts)
B/DTime
(Hrs:Mts)EL/OL
Time(Hrs:Mts)
ISFTime
(Hrs:Mts)Nos.
Duration(Hrs. Mts)
1 Warangal 104 0 0:00 4008 11725:06 698 2473:57 3223 675:02 2280 7983:06 10209 22857:11
2 Karimnagar 86 0 0:00 451 148:43 127 1263:48 504 73:10 716 1057:04 1798 2542:45
3 Khammam 59 0 0:00 109 2696:24 77 1778:24 112 342:00 0 0:00 298 4816:48
4 Nizamabad 59 0 0:00 273 327:05 145 174:35 216 83:50 0 0:00 634 585:30
5 Adilabad 55 0 0:00 4324 6663:34 837 510:02 2703 343:35 2174 409:44 10038 7926:55
Total 363 0 0:00 9165 21560:52 1884 6200:46 6758 1517:37 5170 9449:54 22977 38729:09
LRTime
(Hrs:Mts)LC
Time(Hrs:Mts)
B/DTime
(Hrs:Mts)EL/OL
Time(Hrs:Mts)
ISFTime
(Hrs:Mts)Nos.
Duration(Hrs. Mts)
1 Warangal 144 0 0:00 1731 3499:38 191 1934:10 970 260:50 1653 2172:21 4545 7866:59
2 Karimnagar 251 0 0:00 0 0:00 22 335:29 0 0:00 716 1081:14 738 1416:43
3 Khammam 140 0 0:00 119 4204:48 0 0:00 121 398:24 0 0:00 240 4603:12
4 Nizamabad 132 0 0:00 0 0:00 0 0:00 0 0:00 0 0:00 0 0:00
5 Adilabad 133 0 0:00 572 222:26 142 97:29 686 67:15 603 222:59 2003 610:09
Total 800 0 0:00 2422 7926:52 355 2367:08 1777 726:29 2972 3476:34 7526 14497:03
11 KV Feeders Towns, Industrial & Other Breakdowns Particulars the Year 2016‐17 (Up to 30.09.2016)
Sl.No.
CircleNo. of 11 KV
Feeders Existing Town
11 KV TOWN Total
Sl.No.
CircleNo. of 11 KV
Feeders existing Indl. & Others
11 KV INDUSTRIAL & OTHERS Total
Page 84 of 195

LRTime
(Hrs:Mts)LC
Time(Hrs:Mts)
B/DTime
(Hrs:Mts)EL/OL
Time(Hrs:Mts)
ISFTime
(Hrs:Mts)Nos.
Duration(Hrs. Mts)
1 Warangal 819 0 0:00 48875 101899:46 6218 21143:18 24331.1 4139:35 53922 115925:03 133346 243107:42
2 Karimnagar 894 0 0:00 2272 944:31 1187 958:33 2250 1097:10 2165 1276:06 7874 4276:20
3 Khammam 368 0 0:00 514 820:31 705 918:33 842 160:28 0 0:00 2061 1899:32
4 Nizamabad 753 0 0:00 2082 7051:55 2567 16169:42 1087 2611:29 50 48:00 5785 25881:06
5 Adilabad 399 0 0:00 20152 30141:08 4453 3574:01 24300 2871:16 61825 47096:45 110730 83683:10
Total 3233 0 0:00 73895 140857:51 15130 42764:07 52809.6 10879:58 117962 164345:54 259796 358847:50
LRTime
(Hrs:Mts)LC
Time(Hrs:Mts)
B/DTime
(Hrs:Mts)EL/OL
Time(Hrs:Mts)
ISFTime
(Hrs:Mts)Nos.
Duration(Hrs. Mts)
1 Warangal 48 0 0:00 2950 2099:13 230 410:57 1865 257:06 2509 5959:40 7554 8726:56
2 Karimnagar 40 0 0:00 2122 751:50 277 290:05 2416 643:33 1791 1363:25 6606 3048:53
3 Khammam 40 0 0:00 657 1011:17 641 920:34 740 120:03 0 0:00 2038 2051:54
4 Nizamabad 34 0 0:00 67 78:50 132 193:53 624 171:05 0 0:00 823 443:48
5 Adilabad 46 0 0:00 2378 27857:22 696 645:07 2134 620:05 6259 2456:48 11467 31579:22
Total 208 0 0:00 8174 31798:32 1976 2460:36 7779 1811:52 10559 9779:53 28488 45850:54
11 KV Feeders Rural & MHQ Breakdown & Interruptions Particulars during the Year 2015‐16
Sl.No.
CircleNo. of 11 KV Feeders
Existing Rural
11 KV Rural Total
Sl.No.
CircleNo. of 11 KV Feeders
Existing MHQ
11 KV MHQ Total
Page 85 of 195

LRTime
(Hrs:Mts)LC
Time(Hrs:Mts)
B/DTime
(Hrs:Mts)EL/OL
Time(Hrs:Mts)
ISFTime
(Hrs:Mts)Nos.
Duration(Hrs. Mts)
1 Warangal 722 0 0:00 36518 82880:11 5669 25805:14 15559 2160:54 72607 108443:24 130353 219289:43
2 Karimnagar 895 0 0:00 741 620:31 415 1205:02 736 118:21 660 1627:05 2552 3570:59
3 Khammam 368 0 0:00 313 608:18 873 1681:11 413 65:03 0 0:00 1599 2354:32
4 Nizamabad 753 0 0:00 1232 2222:28 2425 12377:01 936 429:18 0 0:00 4593 15028:47
5 Adilabad 550 0 0:00 35215 15058:01 9677 6551:49 15510 3802:10 18442 13455:38 78844 38867:38
Total 3288 0 0:00 74019 101389:29 19059 47620:17 33154 6575:46 91709 123526:07 217941 279111:39
LRTime
(Hrs:Mts)LC
Time(Hrs:Mts)
B/DTime
(Hrs:Mts)EL/OL
Time(Hrs:Mts)
ISFTime
(Hrs:Mts)Nos.
Duration(Hrs. Mts)
1 Warangal 49 0 0:00 1691 1190:24 136 239:47 920 113:23 1394 706:01 4141 2249:35
2 Karimnagar 40 0 0:00 795 206:59 288 153:24 731 135:59 717 1427:47 2531 1924:09
3 Khammam 40 0 0:00 291 605:15 326 391:48 496 72:04 0 0:00 1113 1069:07
4 Nizamabad 34 0 0:00 130 183:42 380 111:33 361 154:56 0 0:00 871 450:11
5 Adilabad 47 0 0:00 2285 1157:55 1297 658:45 2380 449:52 4068 2840:07 10030 5106:39
Total 210 0 0:00 5192 3344:15 2427 1555:17 4888 926:14 6179 4973:55 18686 10799:41
11 KV Feeders Rural & MHQ Breakdown & Interruptions Particulars during the Year 2016‐17 (up to 30.09.2016)
Sl.No.
CircleNo. of 11 KV Feeders
Existing Rural
11 KV Rural Total
Sl.No.
CircleNo. of 11 KV Feeders
Existing MHQ
11 KV MHQ Total
Page 86 of 195

Opera‐tion
DPE I II III VOth‐ers
Opera‐tion
DPEOpera‐tion
DPEOpera‐tion
DPE I II III VOthers
1 Warangal 8833 3509 0 12342 11782 429 15 114 2 12342 134.45 155.49 289.94 103.11 76.58 179.68 7781 3225 11006 10553 355 10 86 2 11006 93.03 7
2 Karimnagar 7020 3203 0 10223 9891 280 13 34 5 10223 64.50 141.16 205.66 44.01 81.96 125.97 5345 2304 7649 7400 220 9 15 5 7649 64.32 3
3 Khammam 6257 3090 0 9347 8996 185 4 159 3 9347 71.05 86.23 157.28 50.05 34.92 84.97 5922 2735 8657 8331 144 4 172 6 8657 60.90 2
4 Nizamabad 6809 2428 0 9237 8708 443 19 65 2 9237 91.76 109.26 201.02 86.30 69.63 155.93 6549 2338 8887 8405 399 13 66 4 8887 81.70 1
5 Adilabad 6727 3224 0 9951 9726 205 1 15 4 9951 53.62 83.25 136.87 41.85 53.10 94.95 6026 2839 8865 8706 148 2 6 3 8865 63.37 5
Total 35646 15454 0 51100 49103 1542 52 387 16 51100 415.38 575.38 990.76 325.32 316.18 641.50 31623 13441 45064 43395 1266 38 345 20 45064 363.31 18
Realised Assessment Amount Total
No of cases Compounded
Total
Statement showing the Circle‐wise cases reported during 2015‐16(Rs. in Lakhs)
Sl. No
Name of the Circle
No of cases Reported
Thef of
material cases
Total
Case Registered Category‐wise
Total
No. of Cases Compounded Category‐wise
Total
Compo
unding
fee
collected
Person
s arrested
Provisional Assessment Amount Total
Page 87 of 195

Opera‐tion
DPE I II III VOth‐ers
Opera‐tion
DPEOpera‐tion
DPEOpera‐tion
DPE I II III VOthers
1 Warangal 4641 1905 0 6546 6282 237 9 2 1 6531 77.69 131.71 209.40 73.30 50.07 123.37 4981 1994 6975 6655 268 10 40 2 6975 62.74 27
2 Karimnagar 3734 1799 0 5533 5361 148 7 10 7 5533 35.79 78.06 113.85 30.70 53.05 83.76 4091 1925 6016 5800 180 11 20 5 6016 50.81 21
3 Khammam 3246 1605 0 4851 4709 116 1 44 5 4875 32.78 49.60 82.38 45.50 18.94 64.44 3556 1765 5321 5143 135 2 38 3 5321 38.18 8
4 Nizamabad 3316 1409 0 4725 4509 191 5 17 3 4725 37.90 51.88 89.78 49.57 38.67 88.24 3469 1425 4894 4633 232 11 15 3 4894 44.55 21
5 Adilabad 3884 1891 0 5775 5608 135 1 28 3 5775 32.90 44.17 77.07 23.66 31.47 55.13 3756 2022 5778 5616 124 3 32 3 5778 42.15 8
Total 18821 8609 0 27430 26469 827 23 101 19 27439 217.07 355.42 572.49 222.73 192.20 414.93 19853 9131 28984 27847 939 37 145 16 28984 238.43 85
Realised Assessment Amount Total
No of cases Compounded
Total
Statement showing the Circle‐wise cases reported during 2016‐17 (up to 30.09.2016) (Rs. in Lakhs)
Sl. No
Name of the Circle
No of cases Reported
Thef of
material cases
Total
Case Registered Category‐wise
Total
No. of Cases Compounded Category‐wise
Total
Compo
unding
fee
collected
Person
s arrested
Provisional Assessment Amount Total
Page 88 of 195

APPENDIX-D
COURT CASES
Page 89 of 195

No. of Cases
AmountNo. of Cases
AmountNo. of Cases
AmountNo. of Cases
AmountNo. of Cases
Amount
1TSERC (TABLE ‐ A)
5 331.57 11 264.24 4 67.27 3Covered in H.C
23 663.08
2High Court (TABLE ‐ B)
0 0 0 0 5 0.00 4 663.38 9 663.38
3APTEL (TABLE ‐ C)
0 0 2 80.58 1 0 0 0 3 80.58
4Supreme Court (TABLE ‐ D)
1 213.00 1 2.779 6 410.45 0 0 8 626.23
6 544.57 14 347.596 16 477.72 7 663.38 43 2033.27
5APERC (TABLE ‐ E)
4 331.57 11 264.237 4 143.45 3Covered in H.C
22 739.26
Total Cases of IPP Division
Abstract of Court Cases in various forums in respect of IPP Division as on 27.05.2016 (Rs. in Crores)
Sl.No.
Name of the Forum
TotalM/s. RELIANCEM/s. LANCOM/s. SPGLM/s. GVK
Page 90 of 195

(A)
Sl.No
Case Number Petitioner Respondent Gist of the CaseAmount involved
(Rs. in Crs.)
Name of the Advocate
Present Status
1O.P.No.25 of 2015 (O.P.No.12/08 in APERC)
GVK Industries Ltd.
DISCOMs, APPCC &
APTRANSCOIn the matter of MAT, MGO charges etc. 262.09
Sri.Y.Rama Rao,
Advocate
Pending before TSERC
2O.P.No.26 of 2015 (O.P.No.19/09 in APERC)
APTRANSCOGVK
Industries Ltd.limiting the working capital to actual borrowings or as per Provisions of PPA which ever is less
0Sri.Y.Rama
Rao, Advocate
Pending before TSERC
3
O.P.No.54 of 2015 & I.A.No.11 of 2015 [(O.P.No. 24/13 & I.A.No.14/13 in APERC)]
GVK Industries Ltd.
DISCOMs, APPCC &
APTRANSCOCounter in Imbalance Charges ‐ Reg. 1.99
Sri.Y.Rama Rao,
Advocate
Pending before TSERC
4O.P.No.55 of 2015 (O.P.No.23/13 in APERC)
GVK Industries Ltd.
DISCOMs, APPCC &
APTRANSCOCounter Petition on MAT‐ Reg. 67.49
Sri.Y.Rama Rao,
Advocate
Pending before TSERC
5O.P.No.34 of 2014 in APERC) in O.P.No.63 of 2015
GVK Industries LtdAPEPDCL & 5
othersPetition filed for adjudication of disputes between the parties
0Sri.Y.Rama
Rao, Advocate
Pending before APERC
TOTAL 331.57
TABLE ‐ ADetails of Common Cases pending before TSERC as on 27.05.2016
M/s.GVK INDUSTRIES LIMITED (Phase‐I)
Page 91 of 195

(B)
Sl.No
Case Number Petitioner Respondent Gist of the CaseAmount involved
(Rs. in Crs.)
Name of the Advocate
Present Status
1O.P.No.33 of 2015 (O.P.No.57 of 2011 in APERC)
APTRANSCO, DISCOMs & APPCC
Spectrum Power Gen.
Ltd.
Petition seeking modification of the PPA signed between parties in respect of Deletion of usage of Naphtha as Supplementary fuel and others as Alternate fuel.
2.92Sri.Y.Rama
Rao, Advocate
Pending before TSERC
2O.P.No.57 of 2015 (O.P.No.10 of 2014 in APERC)
Spectrum Power Gen. Ltd.
APTRANSCO, DISCOMs & APPCC
For adjudication of disputes between the parties with regard to Minimum Off Take Charges.
1.32Sri.Y.Rama
Rao, Advocate
Pending before TSERC
3
O.P.No.65 of 15 & I.A.No.14 of 15 (O.P.No.37 of 14 & I.A. No.9 of 14 in APERC)
Spectrum Power Gen. Ltd.
APTRANSCO & 5 Others
Seeking direction not to deduct of amounts of Rs.1,07,14,629/‐ claiming to be the recovery of disincentives for the tariff year 2012‐13 from the monthly bills payable to the Petitioner in violation of ther terms of the PPA dt.23.01.1997 (Disincentives for 2012‐13)
1.07Sri.Y.Rama
Rao, Advocate
Pending before TSERC
4O.P.No.66 of 2015 (O.P.No.38 of 2014 in APERC)
Spectrum Power Gen. Ltd.
APTRANSCO & 5 Others
Petition seeking declaration that the petitioner is entitled to incentives of Rs.18,53,49,515/‐ and refund disincentives deducted for an amount of Rs.2,57,26,723/‐ (Disincentives for 2013‐14)
21.11Sri.Y.Rama
Rao, Advocate
Pending before TSERC
5
R.P.No.6 of 2015 (R.P.1 of 2014 in O.P.No.44 of 2013 in APERC)
APTRANSCO & 5 Others
Spectrum Power Gen.
Ltd.
Seeking review of the Commission's order dt.27.07.2013 in O.P.No.44 of 2013
0.40Sri.Y.Rama
Rao, Advocate
Pending before TSERC
M/s.SPECTRUM POWER GENERATION LIMITED
TABLE ‐ ADetails of Common Cases pending before TSERC as on 27.05.2016
Page 92 of 195

(B)
Sl.No
Case Number Petitioner Respondent Gist of the CaseAmount involved
(Rs. in Crs.)
Name of the Advocate
Present Status
6O.P.(SR).No.07 of 15 (O.P.No.56/2014 in APERC)
Spectrum Power Gen. Ltd.
APTRANSCO & 5 Others
Approve and allo the completed capital cost of Rs.972.60 Crs. and direct to make payment outstanding amounts of the claims along with incentives (Rs.972.60 ‐Rs.748.43 Crs. approved capital cost)
224.17Sri.Y.Rama
Rao, Advocate
Pending before TSERC
7O.P.No.69 of 2015 (S.R.No.52/2014 in APERC)
Spectrum Power Gen. Ltd.
APTRANSCO & 7 Others
To recover an amount of Rs.3,49,00,322/‐ deducted from the bills towards for disincentives for the tariff year 2013‐14
3.49Sri.Y.Rama
Rao, Advocate
Pending before TSERC
8O.P.No.70 of 2015 (S.R.No.53 of 2014 in APERC)
Spectrum Power Gen. Ltd.
APTRANSCO & 7 Others
To recover interest amounts of R.1.506 Crores on excess fixed charges paid to the Petitioner
1.51Sri.Y.Rama
Rao, Advocate
Pending before TSERC
9O.P.No.71 of 2015 (S.R.No.61 of 2014 in APERC)
Spectrum Power Gen. Ltd.
APTRANSCO & 7 Others
To recover an amount of Rs.6,17,91,689/‐ due to Petitioner towards differential rebate for the period 2008 to 2014
6.18Sri.Y.Rama
Rao, Advocate
Pending before TSERC
10O.P.No.72 of 2015 (S.R.No.62 of 2014 in APERC)
Spectrum Power Gen. Ltd.
APTRANSCO & 7 Others
To recover an amount of Rs.1,15,81,458/‐ due to Petitioner to towards excess rebate collected by DISCOMs.
1.16Sri.Y.Rama
Rao, Advocate
Pending before TSERC
11O.P.No.73 of 2015 (S.R.No.63 of 2014 in APERC)
Spectrum Power Gen. Ltd.
APTRANSCO & 7 Others
To recover an amount of Rs.91.41 Lakhs due to Petitioner towards difference in variable charges along with interest.
0.91Sri.Y.Rama
Rao, Advocate
Pending before TSERC
TOTAL 264.24
TABLE ‐ ADetails of Common Cases pending before TSERC as on 27.05.2016
M/s.SPECTRUM POWER GENERATION LIMITED
Page 93 of 195

(C)
Sl.No
Case Number Petitioner Respondent Gist of the CaseAmount involved
(Rs. in Crores)
Name of the Advocate
Present Status
1O.P.No.52 of 2015 (O.P.No.85 of 2012 in APERC)
Lanco Kondapalli Power Ltd.
APPCC, APTRANSCO &
DISCOMs
For Reimbursement of Minimum Fuel Off‐Take Charges and other Fuel Transportation Charges being part of monthly bills
56.48Sri.Y.Rama
Rao, Advocate
Pending before TSERC
2O.P.No.27 of 2015 (O.P.No.33 of 2009 in APERC)
Lanco Kondapalli Power Ltd.
APPCC, APTRANSCO &
DISCOMs
Capacity Charges Claimed by M/s LancoThe APTRANSCO failed to pay Rs.76,18,13,282.00 along with Interest
Covered in S.C
(C.A.No.6036 of 2012)
Sri.Y.Rama Rao,
Advocate
Pending before TSERC
3
O.P.No.28 of 2015 & I.A.No.2 of 2015 (O.P.No.42 of 2009 & IA No.4 of 2010 in APERC)
Lanco Kondapalli Power Ltd.
APPCC, APTRANSCO &
DISCOMs
(a) Finance & Procurement Cost Reimbursement: Rs.10.79 Crs for the period from 22.06.2000 to 10.08.2001.(b) Interest for the above
10.79Sri.Y.Rama
Rao, Advocate
Pending before TSERC
4O.P.No.83 of 2015 in TSERC
Lanco Kondapalli Power Ltd.
TSPCC, TSSPDCL & TSNPDCL
Petition seeking to question of non‐payment of supplementary bills by theLicensees.
Sri.Y.Rama Rao,
Advocate
Pending before TSERC
TOTAL 67.27
M/s.LANCO KONDAPALLI LIMITED
TABLE ‐ ADetails of Common Cases pending before TSERC as on 27.05.2016
Page 94 of 195

(D)
Sl.No
Case Number Petitioner Respondent Gist of the CaseAmount involved
(Rs. in Crores)
Name of the Advocate
Present Status
1O.P.No.39 of 2015(OP. No.79/2012 in APERC)
Reliance Infrastructure Ltd.
DISCOMs & APPCC
Deduction of discount on deemed generation from the monthly bills payable to the M/s RIL from the months of April, 2012 and May, 2012.
16.00Sri.Y.Rama
Rao, Advocate
Pending Before TSERC
2
O.P.No.44 of 2015 & I.A.No.09 of 2015(OP. No.60/2013 & IA No.37 of 2013 in APERC)
APPCC & DISCOMsReliance
Infrastructure Ltd.
1) Deletion of Alternate Fuel Clause2) Investigation of the clandestine dismantling of Naphtha tanks.
39.39Sri.Y.Rama
Rao, Advocate
Pending Before TSERC
3
O.P.No.58 of 2015 and I.A.No.12 of 2015 (OP.No.12/2014 & I.A.No.3 of 2014 in APERC)
Reliance Infrastructure Ltd.
DISCOMs & APPCC
Seeking declaration that HSD is a alternative fuel in terms of Article‐1.1.27 of the PPA and refund the unauthorised deductions of Rs.96,68,92,198/‐ made by the Respondents from the bills payable to the Petitioner
96.69Sri.Y.Rama
Rao, Advocate
Pending Before TSERC
TOTAL 152.08
Details of Common Cases pending before TSERC as on 27.05.2016
M/s.Reliance Infrastructure Limited
TABLE ‐ A
Page 95 of 195

A.
Sl.No.
Case Number Petitioner Respondent Description of the CaseAmount involved
(Rs. in Crs.)
Name of the Advocate
Present Status
1WP.No.7838/
2004
M/s.Lanco Kondapalli Power
Pvt. Ltd.APDISCOMS
Challenging the Jurisdiction of APERC. The Honble High Court of AP on 26.04.2004 ordered interim stay of the impugned proceeding purported to be taken by the APERC in pursuance of the impugned notice in O.P.(S.R.)No.10/2004
Sri.R.Vinod Reddy,
SLA/GoTS
Case is pending before High Court, since 2004.
2CMA.No.1284
/ 2008APDISCOMS
M/s.Lanco Kondapalli
Power Pvt. Ltd.
Refixing of Installed Capacity of Lanco from 368.144MW to 351.49MW.
Sri.R.Vinod Reddy,
SLA/GoTS
Filed against order delivered on 08.09.2008 ie stated that interim suspention of the order of Lower court. High Court Order delivered on 05.11.08 that "there shall be ad‐interim stay of all further proceedings persuant to the order of city civil court.
3CMA. No. 1285/2008
APDISCOMSM/s.Lanco Kondapalli
Power Pvt. Ltd.
Revision of Tariff of Lanco as per capital cost approved by CEA in a Final Financial Package.Filed against order delivered on 08.09.2008 of the II Addl. Chief Judge, City Civil Court, Hyderabad in O.P.No.2394 of 2004.
Sri.R.Vinod Reddy,
SLA/GoTSCase is pending before High Court
4WP. No.
25317/2011M/s.LANCO APDISCOMS
APDISCOMS considering the Installed Capacity of the LANCO project as 361.92 MW as against 368.144 MW pending adjudication ‐ Interim order passed by High Court.
Sri.R.Vinod Reddy,
SLA/GoTS
Case is pending before High Court(Connected to W.P.No.7838 of 2004)
5WP. No.
14332/2013APDISCOMS
M/s.Lanco Kondapalli
Power Pvt. Ltd.
(Liquidated Damages matter) ‐ Interest Deduction, Challenging the order in R.P.No.1 of 2011 in O.P.No.23 of 2005 dated 23.04.2013 of APERC.
Sri.R.Vinod Reddy,
SLA/GoTS
Interim orders issued to furnish BG for Rs.28 Cr by M/s.LANCO on 15.5.2013. Lanco has furnished Bank Guarantee. The Case is pending before High Court.
Total: 0.00
TABLE ‐ B (Commercial/IPP DIVISION) LIST OF CASES PENDING BEFORE HIGH COURT as on 27.05.2016
M/s.LANCO Kondapalli Power Limited
Page 96 of 195

B.
Sl. No.
Case Number Petitioner Respondent Description of the CaseAmount involved
(Rs. in Crs.)
Name of the Advocate
Present Status
1WP No.32992/
2014on HSD as Alternate Fuel and other issues related to the billing matters.
235.38 Pending before High Court.
2
W.P.M.P.No.8090 of 2016 (Injunction Petition)
To Restrain Respondent No.1 to 6 from deducting any amounts from the monthly bills of the Petitioner Company raised by the Petitioners Company from time to time as per Article‐3.2 of the Power Purchase Agreement dated 31.03.1997
3
W.P.M.P.No.8891 of 2016
(Direct Petition)
Direct the Respondents No.1 to 6 to refund the sum of Rs.428.00 Crores along with interest.
428.00
4
W.P.M.P.No.8894 of 2016 (Fix an early
date)
To expedite hearing of the Writ Petition No.32992 of 2014 by fixing an early date for hearing and pass
Total: 663.38
M/s.Reliance Infrastructure Limited
M/s. Reliance Infra Structure
Ltd.APDISCOMS
Sri.R.Vinod Reddy,
SLA/GoTS
Counter Affidavits are filed on 18.04.2016 and arguments were
taken up at Court No.30, High Court on 22.04.2016 after arguments between SLA/TSTRANSCO,
SLA/APTRANSCO and Counsels of M/s.RIL, the Hon'ble Judge posted the
case for hearing on 08.08.2016.
Page 97 of 195

Sl.No.
Case Number Petitioner Respondent Description of the CaseName of the
Advocate/AOR
Amount involved
(Rs. in Crs.)Present Status
A.
1Appeal
No.321/2013APTRANSCO
M/s.Spectrum Power Gen. Ltd.
Appeal filed against the orders issued against the APERC orders dated 16.04.2013 favouring M/s SPGL in O.P.No:32/2009 in the matter of Treating the Bridge loan as Equity.
M/s.Swapna Seshadri & Anand K.Ganesan, New Delhi
80.58Posted for hearing on 27.04.2016, pending before APTEL
2Appeal No.257 of 2014 (O.P.No.87 of 2012 in APERC)
M/s.Spectrum Power Generation
Ltd.APTRANSCO
Deduction of an amount of Rs.25,61,35,157/‐ from the monthly bills payable to M/s.SPGL in violation of the terms of Power Purchase Agreement (PPA) dated 23.01.1997.
M/s.Swapna Seshadri & Anand K.Ganesan, New Delhi
M/s.SPGL Appeal dismissed and judgment passed on 18.03.2016 in favour of DISCOMS
Total: 80.58B.
1Appeal No.332/
2013M/s.LANCO APDISCOMS
Against O.P.No.09 of 2011 of APERC order Incentive for the period from 01.01.2009 to 31.12.2009. PLF (I) of Rs.9,80,81,976/‐ to pay the balance amount of Rs.9,34,57,274/‐
M/s.Swapna Seshadri & Anand K.Ganesan, New Delhi
M/s.LANCO Appeal dismissed and judgment passed on 20.01.2016 in favour of DISCOMS
Total: 0
TABLE ‐ C (Commercial/IPP DIVISION) LIST OF CASES PENDING BEFORE APTEL as on 27.05.2016
M/s.SPECTRUM POWER GENERATION LIMITED
M/s.LANCO Kondapalli Power Limited
Page 98 of 195

Sl.No
Case Number Petitioner Respondent Gist of the CaseName of the
AOR/Senior Advocate
Amount involved (Rs. in Crores)
Present Status
(A)
1
C.A.No.5116/15Appeal
No.285/2013 & Appeal
No.260/2013 (filed by
M/s.GVK) in APTEL]
TSDISCOMs& APDISCOMs
M/s.GVK Industries
Ltd.
[Order given by APTEL on Appeal filed against the orders issued by APERC on 13.08.2013 against APDISCOMs in O.P.No:04/2008 in the matter Completed capital Cost of M/s GVK Industries Ltd, Phase 1.]
Sri.Rakesh K.Sharma, AOR, New Delhi.
213.00
The Case is lastly appeared on 16.07.2015 (The case is
admitted in Supreme Court, stay petition will be heard on representation
of Respondents)
(B)
1Civil Appeal
No.5786/2014
M/s.Spectrum Power Generation
Ltd.
TSDISCOMs&
APDISCOMs
In the matter of Minimum Guranteed Off‐take charges
Sri.Rakesh K.Sharma, AOR, New Delhi.
2.779
Pending in Supreme Court (Case to be filed by SPCC) and likely to be listed on
07.10.2015
TABLE ‐ DDetails of Cases pending before Supreme Court as on 27.05.2016
M/s.GVK INDUSTRIES LIMITED (Phase‐I)
M/s.SPECTRUM POWER GENERATION LIMITED
Page 99 of 195

Sl.No
Case Number Petitioner Respondent Gist of the CaseName of the
AOR/Senior Advocate
Amount involved (Rs. in Crores)
Present Status
(C)
1CA. No.
6036/2012APDISCOMS
M/s.Lanco Kondapalli Power Pvt.
Ltd.
Appeal was filed against order dated 02.07.2012 of APTEL in Appeal No.129 of 2011 in the matter of Capacity Charges for Rs.76.18 Crores from 27.07.2000 to 01.01.2001 along with interest
Sri.A.Subba Rao, AOR & Sri.V.Giri, Sr.
Advocate76.18
2CA. No.
6061/2012APDISCOMS
M/s.Lanco Kondapalli Power Pvt.
Ltd.
Appeal was filled against APTEL order dated 02.07.2012 in Appeal No.128 of 2011, MAT for the period 2001 to 2005
Sri.A.Subba Rao, AOR & Sri.V.Giri, Sr.
Advocate26.5
3CA. No.
6138/2012APDISCOMS
M/s.Lanco Kondapalli Power Pvt.
Ltd.
Appeal was filed against Order dated 20.07.2012 of APTEL in Appeal No.113 of 2012, MAT for the period 2006 to 2009
Sri.A.Subba Rao, AOR & Sri.V.Giri, Sr.
Advocate
4S.L.P.No.28634
of 2012APDISCOMS
M/s.Lanco Kondapalli Power Pvt.
Ltd.
Appeal was filed against Order dated 13.06.2011 of APERC in O.P.No.18 of 2009, MAT for the period 2006 to 2009
Sri.A.Subba Rao, AOR & Sri.V.Giri, Sr.
Advocate
5 C.A.
No.9304/2013APDISCOMS
M/s. LANCO Kondapalli Power Limited
Reimbursement of MAT for the period of 2009 to 2012 along with interest, challenging the order dated 08.08.2013 in O.P.No.61 of 2012 passed by APERC.
Sri.A.Subba Rao, AOR & Sri.V.Giri, Sr.
Advocate50 ‐do‐
The Hon'ble Supreme Court dismissed the Appeals for which
judgement passed on 16.10.2015. Note put up to the Board for approval to file Review Petition before the Hon'ble Supreme Court
20 ‐do‐
M/s.LANCO KONDAPALLI LIMITED
Page 100 of 195

Sl.No
Case Number Petitioner Respondent Gist of the CaseName of the
AOR/Senior Advocate
Amount involved (Rs. in Crores)
Present Status
6C.A.No.4463/15
(Appeal No.154/2013)
TSDISCOMs & APDISCOMS
M/s. LANCO Kondapalli Power Limited
Liqudated Damages for Delay in commissining of the Project
Sri.G.Prabhakar Rao, AOR
237.77
On 27.07.15, interim order was issued by the
Supreme Court to deposit an amount of Rs.100.00 Crs. in the Registry within a period of 12 weeks, which amount the
Respondents would be at liberty to withdraw on
furnishing a bank guarantee for the same.
Total: 410.45(D) M/s.Reliance Infrastructure Limited
NIL
Page 101 of 195

Sl.No
Case Number Petitioner Respondent Gist of the CaseAmount involved
(Rs. in Crs.)Name of the Advocate
Present Status
(A)
1 O.P.No.12/08 in APERCGVK Industries
Ltd.DISCOMs, APPCC & APTRANSCO
In the matter of MAT, MGO charges etc.
262.09Sri.Y.Rama
Rao, Advocate
Scheduled for hearing on 23.05.15 before APERC
2 O.P.No.19/09 in APERC APTRANSCO GVK Industries Ltd.limiting the working capital to actual borrowings or as per Provisions of PPA which ever is less
0Sri.Y.Rama
Rao, Advocate
Scheduled for hearing on 23.05.15 before APERC
3O.P.No. 24/13 & I.A.No.14/13 in APERC
GVK Industries Ltd.
DISCOMs, APPCC & APTRANSCO
Counter in Imbalance Charges ‐ Reg.
1.99Sri.Y.Rama
Rao, AdvocatePending in APERC
4 O.P.No.23/13 in APERCGVK Industries
Ltd.DISCOMs, APPCC & APTRANSCO
Counter Petition on MAT‐ Reg. 67.49Sri.Y.Rama
Rao, Advocate
Scheduled for hearing on 30.05.15 before APERC
TOTAL 331.57
TABLE ‐ EDetails of Common Cases pending before APERC as on 27.05.2016
M/s.GVK INDUSTRIES LIMITED (Phase‐I)
Page 102 of 195

Sl.No
Case Number Petitioner Respondent Gist of the CaseAmount involved (Rs. in Crores)
Name of the Advocate
Present Status
(B)
1O.P.No.57 of 2011 in APERC
APTRANSCO, DISCOMs & APPCC
Spectrum Power Gen. Ltd.
Petition seeking modification of the PPA signed between parties in respect of Deletion of usage of Naphtha as Supplementary fuel and others as Alternate fuel.
2.92Sri.Y.Rama
Rao, Advocate
Scheduled for hearing on 30.05.15 before APERC
2O.P.No.10 of 2014 in APERC
Spectrum Power Gen. Ltd.
APTRANSCO, DISCOMs & APPCC
For adjudication of disputes between the parties with regard to Minimum Off Take Charges.
1.32Sri.Y.Rama
Rao, Advocate
Scheduled for hearing on 30.05.15 before APERC
3O.P.No.37 of 2014 & I.A. No.9 of 2014 in APERC
Spectrum Power Gen. Ltd.
APTRANSCO & 5 Others
Seeking direction not to deduct of amounts of Rs.1,07,14,629/‐ claiming to be the recovery of disincentives for the tariff year 2012‐13 from the monthly bills payable to the Petitioner in violation of ther terms of the PPA dt.23.01.1997 (Disincentives for 2012‐13)
1.07Sri.Y.Rama
Rao, Advocate
Scheduled for hearing on 30.05.15 before APERC
4O.P.No.38 of 2014 in APERC
Spectrum Power Gen. Ltd.
APTRANSCO & 5 Others
Petition seeking declaration that the petitioner is entitled to incentives of Rs.18,53,49,515/‐ and refund disincentives deducted for an amount of Rs.2,57,26,723/‐ (Disincentives for 2013‐14)
21.11Sri.Y.Rama
Rao, Advocate
Scheduled for hearing on 30.05.15 before APERC
5R.P.No.1 of 2014 in O.P.No.44 of 2013 in APERC
APTRANSCO & 5 Others
Spectrum Power Gen. Ltd.
Seeking review of the Commission's order dt.27.07.2013 in O.P.No.44 of 2013
0.40Sri.Y.Rama
Rao, Advocate
Scheduled for hearing on 30.05.15 before APERC
M/s.SPECTRUM POWER GENERATION LIMITED
TABLE ‐ EDetails of Common Cases pending before TSERC & APERC as on 27.05.2016
Page 103 of 195

Sl.No
Case Number Petitioner Respondent Gist of the CaseAmount involved
(Rs. in Crores)
Name of the Advocate
Present Status
6 O.P.No.56/2014Spectrum Power
Gen. Ltd.APTRANSCO & 5
OthersCapital Cost 224.17
Sri.Y.Rama Rao, Advocate
Scheduled for hearing on 30.05.15 before APERC
7 S.R.No.52/2014 Spectrum Power
Gen. Ltd.APTRANSCO & 7
Others
To recover an amount of Rs.3,49,00,322/‐ deducted from the bills towards for disincentives for the tariff year 2013‐14
3.49Sri.Y.Rama
Rao, AdvocatePending before TSERC
8 S.R.No.53 of 2014 Spectrum Power
Gen. Ltd.APTRANSCO & 7
Others
To recover interest amounts of R.1.506 Crores on excess fixed charges paid to the Petitioner
1.51Sri.Y.Rama
Rao, AdvocatePending before TSERC
9 S.R.No.61 of 2014 Spectrum Power
Gen. Ltd.APTRANSCO & 7
Others
To recover an amount of Rs.6,17,91,689/‐ due to Petitioner towards differential rebate for the period 2008 to 2014
6.18Sri.Y.Rama
Rao, AdvocatePending before TSERC
10 S.R.No.62 of 2014Spectrum Power
Gen. Ltd.APTRANSCO & 7
Others
To recover an amount of Rs.1,15,81,458/‐ due to Petitioner to towards excess rebate collected by DISCOMs.
1.16Sri.Y.Rama
Rao, AdvocatePending before TSERC
11 S.R.No.63 of 2014Spectrum Power
Gen. Ltd.APTRANSCO & 7
Others
To recover an amount of Rs.91.41 Lakhs due to Petitioner towards difference in variable charges along with interest.
0.91Sri.Y.Rama
Rao, AdvocatePending before TSERC
TOTAL 264.24
Page 104 of 195

Sl.No
Case Number Petitioner Respondent Gist of the CaseAmount involved
(Rs. in Crores)
Name of the Advocate
Present Status
(C)
1O.P.No.85 of 2012 in APERC
Lanco Kondapalli Power Ltd.
APPCC, APTRANSCO &
DISCOMs
For Reimbursement of Minimum Fuel Off‐Take Charges and other Fuel Transportation Charges being part of monthly bills
56.48Sri.Y.Rama
Rao, Advocate
Scheduled for hearing on 05.06.15 before APERC
2O.P.No.33 of 2009 in APERC
Lanco Kondapalli Power Ltd.
APPCC, APTRANSCO &
DISCOMs
Capacity Charges Claimed by M/s LancoThe APTRANSCO failed to pay Rs.76,18,13,282.00. along with Interest
76.18Sri.Y.Rama
Rao, Advocate
Scheduled for hearing on 30.05.15 before APERC
3O.P.No.42 of 2009 & IA No.4 of 2010 in APERC
Lanco Kondapalli Power Ltd.
APPCC, APTRANSCO &
DISCOMs
(a) Finance & Procurement Cost Reimbursement: Rs.10.79 Crs for the period from 22.06.2000 to 10.08.2001.(b) Interest for the above
10.79Sri.Y.Rama
Rao, Advocate
Scheduled for hearing on 05.06.15 before APERC
4O.P.No.83 of 2015 in TSERC
Lanco Kondapalli Power Ltd.
TSPCC, TSSPDCL & TSNPDCL
Petition seeking to question of non‐payment of supplementary bills by theLicensees.
Sri.Y.Rama Rao, Advocate
Pending before APERC
TOTAL 143.45
TABLE ‐ EDetails of Common Cases pending before APERC as on 27.05.2016
M/s.LANCO KONDAPALLI LIMITED
Page 105 of 195

Sl.No
Case Number Petitioner Respondent Gist of the CaseAmount involved
(Rs. in Crores)
Name of the Advocate
Present Status
(D)
1OP.No.79/2012 in APERC
Reliance Infrastructure Ltd.
DISCOMs & APPCC
Deduction of discount on deemed generation from the monthly bills payable to the M/s RIL from the months of April, 2012 and May, 2012.
16 (Coverd in High Court)
Sri.Y.Rama Rao, Advocate
Scheduled for hearing on 05.06.15 before APERC
2OP. No.60/2013 & IA No.37 of 2013 in APERC
APPCC & DISCOMs
Reliance Infrastructure Ltd.
1) Deletion of Alternate Fuel Clause2) Investigation of the clandestine dismantling of Naphtha tanks.
39.39 (Covered in High Court)
Sri.Y.Rama Rao, Advocate
Scheduled for hearing on 05.06.15 before APERC
3OP.No.12/2014 & I.A.No.3 of 2014 in APERC
Reliance Infrastructure Ltd.
DISCOMs & APPCC
Seeking declaration that HSD is a alternative fuel in terms of Article‐1.1.27 of the PPA and refund the unauthorised deductions of Rs.96,68,92,198/‐ made by the Respondents from the bills payable to the Petitioner
96.69 (Covered in High Court)
Sri.Y.Rama Rao, Advocate
Scheduled for hearing on 05.06.15 before APERC
TOTAL
Details of Common Cases pending before APERC as on 27.05.2016
M/s.Reliance Infrastructure Limited
TABLE ‐ E
Page 106 of 195

APPENDIX –E
RETAIL SUPPLY BUSINESS FILING FORMATS.
Page 107 of 195

Company Name TSNPDCL
Filing Date (dd/mm/yy) 30.11.2016
Multi Year Tariff Period FY 2015-19
Year FY2017-18
Commission' s Regulations Reg-4/2005Business type Retail Supply of Electricity
1 Aggregate Revenue Requirement for Retail Supply Business Form 1 2 Transmission Cost Form 1.13 SLDC Charges Form 1.24 Distribution Cost Form 1.35 Power Purchase and Procurement Cost (For Regulated Business) Form 1.46 NCE Generation (Base Year) Form 1.4 (i)7 NCE Generation (Year 1) Form 1.4(ii)8 NCE Generation (Year 2) Form 1.4(iii)9 NCE Generation (Year 3) Form 1.4(iv)
10 NCE Generation (Year 4) Form 1.4(v)11 NCE Generation (Year 5) Form 1.4(vi)12 Power Purchase and Procurement Cost (For Non-regulated Business) Form 1.4a13 Sales to Licensees Form 1.4b14 Discom-Discom Purchases Form 1.4c15 Interest on Consumer Security Deposits Form 1.516 Supply Margin Form 1.617 Other Costs Form 1.7 18 New consumer categories Form A19 Cost of Service: Embedded Cost Method Form 220 Sales Forecast Form 321 Power Purchase Requirement Form 422 Energy Losses (Distribution System) Form 4a23 Transmission Losses Form 4b24 Energy Availability Form 4.125 Energy Dispatch Form 4.226 Revenue from Current Tariffs Form 5 27 Incentives at current Tariffs Form 5a28 Consumers switching to competition Form 5b29 Consumers served under Open Access as per Section 42 and Section 49 of E Act Form 5c30 Non-tariff Income at current charges Form 631 Total Revenue at Current tariff and Charges Form 732 Revenue Deficit/Surplus at current tariff and charges Form 833 Revenue Deficit/Surplus and Proposed Adjustments Form 9 34 Revenue from Proposed Tariffs Form 10 35 Incentives at Proposed Tariffs Form 10a36 Non-tariff Income at proposed charges Form 1137 Total Revenue at Proposed Tariff and Charges Form 12 38 Cost and Revenue Form 13
S. No. Title Form No.
Page 108 of 195

Notes:
1) Base Year Base Year for the First control period FY15-19 is FY2013-142014-15 Year 1 is the First Year of the control Period, FY2014-152015-16 Year 2 is the Second Year of the control Period, FY2015-16 2016-17 Year 3 is the Third Year of the control Period, FY2016-172017-18 Year 4 is the Fourth Year of the control Period, FY2017-182018-19 Year 5 is the Five Year of the control Period, FY2018 -19
2) Filings 2013-14, Licensees shall provideFull projections for FY2015-16Estimates for FY2014-15 based on actuals for first half of the yearActuals for FY2013-14
3)
4)
5) New CategoriesThe Licensees shall add the proposed categories in Form A, the new categories would be then updated automatically in other formsThe new categories are segregated voltage-wise in Form A
6)
7) Phasing of Open Access as per Regulation 2 of 2005 of APERC
Eligibility Criteria for Open Access
Phase Eligibility criteria Commencement date
1 Consumers availing of power from NCE developers irrespective of the quantum of contracted capacity
September, 2005
2 Contracted capcity being greater than 5 MW September, 2005
3 Contracted capacity being greater than 2 MW September, 2006
4 Contracted capacity being greater than 1 MW April, 2008
8) Terminology for Open Access Status1 Load not eligible for Open Access
2 Load Eligible for Open Access
3 Availed (within area of supply)
4 Availed ( Outside Area of supply)
Load within the area of supply of the licensees and satisfying the eligibility criteria to avail open access as per Commission's Regulation during the period under consideration whether availing power through Open Access or not.
Load outside the area of supply of the Licensee but availing power through Open Access from the Licensee under consideration.
Load within the area of supply of the Licensee and availing power through Open Access whether from the same Licensee or any other supplier.
Regulated Business: The retail supply of electricity to (i) consumers within the area of supply of the licensee and not eligible to avail Open Access as per Commission’s Regulations (ii) consumers within the area of supply of the licensee and eligible to avail Open Access but not exercising their option of availing open access.
Non-regulated Business: The retail supply of electricity to consumers availing supply under open access from the licensee either forming the part of area of supply of the licensee or outside the area of supply of the licensee.
Direct Non-Tariff Income: Non-Tariff income which is directly identifiable with a consumer category.
Apportioned Non-Tariff Income: Non-Tariff income which is not directly identifiable with a consumer category. It shall be appropriately apportioned across various consumer categories.
Modification/addition of Slabs/sub categories for LT consumers should be carried out in Form 7 for Current Tariff and Form 12 for Proposed Tariff.See notes in the relevant form for details
Load within the area of supply of the licensees not satisfying the eligibility criteria to avail open access as per Commission's Regulation during the time period under consideration.
Page 109 of 195

Index sheet
Form 1
Amount( In Rs crores)
Base Year 2014-15 2015-16 2016-17 2017-18 2018-19
1 Transmission Cost Form 1.1 227.46 257.81 342.51 432.89 472.27 0.002 SLDC Cost Form 1.2 6.72 10.22 11.02 12.05 13.04 0.003 Distribution Cost Form 1.3 972.60 1,226.76 1,203.15 1,390.17 1,632.93 0.004 PGCIL Expenses 91.23 164.74 135.00 246.18 372.485 ULDC Charges 4.32 2.56 3.47 2.69 3.326 Network and SLDC Cost (1+2+3+4+5) 1,302.33 1,662.09 1,695.15 2,083.98 2,494.05 0.007 Power Purchase / Procurement Cost Form 1.4 4,378.49 5,244.18 6,424.93 6,601.55 7,326.43 0.008 Interest on Consumer Security Deposits Form 1.5 38.65 42.32 41.60 41.91 46.52 0.009 Supply Margin in Retail Supply Business Form 1.6 6.76 7.54 8.99 10.71 13.14 0.0010 Other Costs, if any Form 1.7 0.18 3.26 5.75 5.75 5.75 0.0011 Supply Cost (7+8+9+10) 4,424.08 5,297.30 6,481.26 6,659.92 7,391.84 0.0012 Aggregate Revenue Requirement (6+11) 5,726.41 6,959.39 8,176.42 8,743.89 9,885.89 0.00
Note:1 The Revenue Requirement Items are cost borne for supply of power to consumers within the area of supply of the Licensees and not availing supply under Open Access.2 Transmission Cost refers to the transmission cost borne by the licensee to serve the consumers within the area of the supply and not availing supply under Open Access3 SLDC cost refers to the SLDC Charges paid to serve the consumers within the area of the supply and not availing supply under Open Access4 Distribution Cost refers to the distribution cost borne by the licensee to serve the consumers within the area of the supply and not availing supply under Open Access5 PGCIL and ULDC Expenses to be submitted in this form.
Aggregate Revenue Requirement for Retail Supply Business
Revenue Requirement Item (Rs. Crs.) Details linkFor Control Period
Page 110 of 195

Index sheet
Form 1.1
Base Year
MW Tariff (Rs./kW/month)
Cost(Rs. Crs.) MW Tariff
(Rs./kW/month)Cost
(Rs. Crs.) MW Tariff (Rs./kW/month)
Cost(Rs. Crs.) MW Tariff
(Rs./kW/month)Cost
(Rs. Crs.)
TSTRANSCO 2484.26 61.03 181.93 621.74 61.03 45.53
Total 2484.26 181.93 621.74 45.53 0.00 0.00 0.00 0.00
MW Tariff (Rs./kW/month)
Cost(Rs. Crs.) MW Tariff
(Rs./kW/month)Cost
(Rs. Crs.) MW Tariff (Rs./kW/month)
Cost(Rs. Crs.) MW Tariff
(Rs./kW/month)Cost
(Rs. Crs.)
TSTRANSCO
Total 0.00 0.00 0.00 0.00 0.00 0.00 0.00 0.00
Total Long term + Short term Contracts ((A) + (B)) 2484.26 181.93 621.74 45.53 0.00 0.00 0.00 0.00
(B) Short Term and Temporary Contracts
Load Eligible for Open AccessLoad not eligible for Open Access Name of Transmission service provider
Open Access
Transmission Cost
Transmission Cost to be segregated between Load not eligible for Open Access, Load eligible for Open Access, Load within the area of supply and availing power under Open Access as per Section 42 and 49 of E ACT.(Refer to Notes for the relevant definitions.)
Name of Transmission service provider
1) Loads Eligible for Open Access is as per Section 8.1 of Regulation 2 of 2005 of erstwhile APERCSee Notes Sheet for Phasing of Open Access2) Provide PGCIL and ULDC charges directly in Form 1.
(A) Long Term and Firm Contracts
Load not eligible for Open Access
Open Access
Remarks
Load Eligible for Open Access Availed (within area of supply)
Availed ( Outside Area of supply)
Availed ( Outside Area of supply)
Remarks
Availed (within area of supply)
Page 111 of 195

2014-15 Year 1
MW Tariff (Rs./kW/month)
Cost(Rs. Crs.) MW Tariff
(Rs./kW/month)Cost
(Rs. Crs.) MW Tariff (Rs./kW/month)
Cost(Rs. Crs.) MW Tariff
(Rs./kW/month)Cost
(Rs. Crs.)
TSTRANSCO 2649.04 65.30 207.58 641.00 65.30 50.23TSTRANSCOdiff cost adj.
Total 2649.04 207.58 641.00 50.23 0.00 0.00 0.00 0.00
MW Tariff (Rs./kW/month)
Cost(Rs. Crs.) MW Tariff
(Rs./kW/month)Cost
(Rs. Crs.) MW Tariff (Rs./kW/month)
Cost(Rs. Crs.) MW Tariff
(Rs./kW/month)Cost
(Rs. Crs.)
TSTRANSCO
Total 0.00 0.00 0.00 0.00 0.00 0.00 0.00 0.00
Total Long term + Short term Contracts ((A) + (B)) 2649.04 207.58 641.00 50.23 0.00 0.00 0.00 0.00
Name of Transmission service provider
Open Access
Load not eligible for Open Access
(A) Long Term and Firm Contracts
Load Eligible for Open Access
Remarks
(B) Short Term and Temporary Contracts
Name of Transmission service provider
Availed (within area of supply) Availed ( Outside Area of supply)
Availed (within area of supply)
Remarks
Availed ( Outside Area of supply)Load not eligible for Open Access
Open Access
Load Eligible for Open Access
Page 112 of 195

2015-16 Year 2
MW Tariff (Rs./kW/month)
Cost(Rs. Crs.) MW Tariff
(Rs./kW/month)Cost
(Rs. Crs.) MW Tariff (Rs./kW/month)
Cost(Rs. Crs.) MW Tariff
(Rs./kW/month)Cost
(Rs. Crs.)
TSTRANSCO 3064.45 76.66 281.91 658.81 76.66 60.60
Total 3064.45 281.91 658.81 60.60 0.00 0.00 0.00 0.00
MW Tariff (Rs./kW/month)
Cost(Rs. Crs.) MW Tariff
(Rs./kW/month)Cost
(Rs. Crs.) MW Tariff (Rs./kW/month)
Cost(Rs. Crs.) MW Tariff
(Rs./kW/month)Cost
(Rs. Crs.)
TSTRANSCO
Total 0.00 0.00 0.00 0.00 0.00 0.00 0.00 0.00
Total Long term + Short term Contracts ((A) + (B)) 3064.45 281.91 658.81 60.60 0.00 0.00 0.00 0.00
Availed ( Outside Area of supply)
(B) Short Term and Temporary Contracts
Load Eligible for Open Access
Load not eligible for Open Access
Load not eligible for Open Access
(A) Long Term and Firm Contracts
Name of Transmission service provider Load Eligible for Open Access
Availed ( Outside Area of supply)
Remarks
Availed (within area of supply)
Open Access
Availed (within area of supply)
Remarks
Name of Transmission service provider
Open Access
Page 113 of 195

2016-17 Year 3
MW Tariff (Rs./kW/month)
Cost(Rs. Crs.) MW Tariff
(Rs./kW/month)Cost
(Rs. Crs.) MW Tariff (Rs./kW/month)
Cost(Rs. Crs.) MW Tariff
(Rs./kW/month)Cost
(Rs. Crs.)
TSTRANSCO 3289.80 91.36 360.67 658.81 91.36 72.23
Total 3289.80 360.67 658.81 72.23 0.00 0.00 0.00 0.00
MW Tariff (Rs./kW/month)
Cost(Rs. Crs.) MW Tariff
(Rs./kW/month)Cost
(Rs. Crs.) MW Tariff (Rs./kW/month)
Cost(Rs. Crs.) MW Tariff
(Rs./kW/month)Cost
(Rs. Crs.)
TSTRANSCO
Total 0.00 0.00 0.00 0.00 0.00 0.00 0.00 0.00
Total Long term + Short term Contracts ((A) + (B)) 3289.80 360.67 658.81 72.23 0.00 0.00 0.00 0.00
Name of Transmission service provider
Availed (within area of supply)
Load not eligible for Open Access
(B) Short Term and Temporary Contracts
Remarks
Open Access
Load Eligible for Open Access Availed (within area of supply) Availed ( Outside Area of supply)
Load Eligible for Open Access
Remarks
(A) Long Term and Firm Contracts
Open Access
Load not eligible for Open Access Name of Transmission service provider Availed ( Outside Area of supply)
Page 114 of 195

2017-18 Year 4
MW Tariff (Rs./kW/month)
Cost(Rs. Crs.) MW Tariff
(Rs./kW/month)Cost
(Rs. Crs.) MW Tariff (Rs./kW/month)
Cost(Rs. Crs.) MW Tariff
(Rs./kW/month)Cost
(Rs. Crs.)
TSTRANSCO 3467.87 95.37 396.88 658.81 95.37 75.40
Total 3467.87 396.88 658.81 75.40 0.00 0.00 0.00 0.00
MW Tariff (Rs./kW/month)
Cost(Rs. Crs.) MW Tariff
(Rs./kW/month)Cost
(Rs. Crs.) MW Tariff (Rs./kW/month)
Cost(Rs. Crs.) MW Tariff
(Rs./kW/month)Cost
(Rs. Crs.)
TSTRANSCO
Total 0.00 0.00 0.00 0.00 0.00 0.00 0.00 0.00
Total Long term + Short term Contracts ((A) + (B)) 3467.87 396.88 658.81 75.40 0.00 0.00 0.00 0.00
(B) Short Term and Temporary Contracts
Name of Transmission service providerLoad not eligible for Open Access
Open Access
(A) Long Term and Firm Contracts
Remarks
Load Eligible for Open Access Availed (within area of supply) Availed ( Outside Area of supply)
Name of Transmission service providerLoad not eligible for Open Access
Open Access
Remarks
Load Eligible for Open Access Availed (within area of supply) Availed ( Outside Area of supply)
Page 115 of 195

Form 1.2 SLDC Charges
Base Year
MW Tariff (Rs./MW/year)
Cost(Rs. Crs.) MW Tariff
(Rs./MW/ month)Cost
(Rs. Crs.)
Load not eligible for Open Access 2484.26 4755.66 1.18 2484.26 1406.08 4.19 5.37Open Access
Load Eligible for Open Access 621.74 4755.66 0.30 621.74 1406.08 1.05 1.34Availed (within area of supply) 0.00 0.00 0.00Availed ( Outside Area of supply) 0.00 0.00 0.00
Year 1 2014-15
MW Tariff (Rs./MW/year)
Cost(Rs. Crs.) MW Tariff
(Rs./MW/ month)Cost
(Rs. Crs.)
Load not eligible for Open Access 2649.04 2535.65 0.67 2649.04 2378.11 7.56 8.23Open Access
Load Eligible for Open Access 641.00 2535.65 0.16 641.00 2378.11 1.83 1.99Availed (within area of supply) 0.00 0.00 0.00Availed ( Outside Area of supply) 0.00 0.00 0.00
Year 2 2015-16
MW Tariff (Rs./MW/year)
Cost(Rs. Crs.) MW Tariff
(Rs./MW/ month)Cost
(Rs. Crs.)
Load not eligible for Open Access 3064.45 3092.78 0.95 3064.45 2209.34 8.12 9.07Open Access
Load Eligible for Open Access 658.81 3092.78 0.20 658.81 2209.34 1.75 1.95Availed (within area of supply) 0.00 0.00 0.00Availed ( Outside Area of supply) 0.00 0.00 0.00
Year 3 2016-17
Loads Eligible for Open Access is as per Section 8.1 of Regulation 2 of 2005 of erstwhile APERCSee Notes Sheet for Phasing of Open Access
SLDC Charges to be segregated between Load not eligible for Open Access, Load eligible for Open Access, Load within the area of supply and availing power under Open Access as per Section 42 and 49 of E ACT.(Refer to Notes for the relevant definitions.)
Remarks
ChargesTotal Cost (Rs. Crs.)
Total Cost (Rs. Crs.) Remarks
Annual Fee
Annual Fee Charges
Remarks
Annual Fee ChargesTotal Cost (Rs. Crs.)
Page 116 of 195

MW Tariff (Rs./MW/year)
Cost(Rs. Crs.) MW Tariff
(Rs./MW/ month)Cost
(Rs. Crs.)
Load not eligible for Open Access 3289.80 3533.18 1.16 3289.80 2247.62 8.87 10.04Open Access
Load Eligible for Open Access 658.81 3533.18 0.23 658.81 2247.62 1.78 2.01Availed (within area of supply) 0.00 0.00 0.00Availed ( Outside Area of supply) 0.00 0.00 0.00
Year 4 2017-18
MW Tariff (Rs./MW/year)
Cost(Rs. Crs.) MW Tariff
(Rs./MW/ month)Cost
(Rs. Crs.)
Load not eligible for Open Access 3467.87 3995.39 1.39 3467.87 2300.31 9.57 10.96Open Access
Load Eligible for Open Access 658.81 3995.39 0.26 658.81 2300.31 1.82 2.08Availed (within area of supply) 0.00 0.00 0.00Availed ( Outside Area of supply) 0.00 0.00 0.00
Year 5 2018-19
MW Tariff (Rs./MW/year)
Cost(Rs. Crs.) MW Tariff
(Rs./MW/ month)Cost
(Rs. Crs.)
Load not eligible for Open Access 0.00 0.00 0.00Open Access
Load Eligible for Open Access 0.00 0.00 0.00Availed (within area of supply) 0.00 0.00 0.00Availed ( Outside Area of supply) 0.00 0.00 0.00
Remarks
Annual Fee ChargesTotal Cost (Rs. Crs.) Remarks
Annual Fee ChargesTotal Cost (Rs. Crs.)
Remarks
Annual Fee ChargesTotal Cost (Rs. Crs.)
Page 117 of 195

Form 1.3
Base Year
MWTariff
(Rs./kW/month)
Cost(Rs. Crs.) MW
Tariff (Rs./kW/mont
h)
Cost(Rs. Crs.) MW
Tariff (Rs./kW/mo
nth)
Cost(Rs. Crs.) MW
Tariff (Rs./kW/m
onth)
Cost(Rs. Crs.)
TS NPDCL ( 33 KV) 116.47 23.49 3.28 0.00TS NPDCL ( 11 KV) 22.91 85.94 2.36 0.00TSNPDCL LT 185.52 0.00 0.00Total ( Non Eligible OA Cost) 966.95
Total 0.00 966.95 139.38 5.65 0.00 0.00 0.00 0.00
MWTariff
(Rs./kW/month)
Cost(Rs. Crs.) MW
Tariff (Rs./kW/mont
h)
Cost(Rs. Crs.) MW
Tariff (Rs./kW/mo
nth)
Cost(Rs. Crs.) MW
Tariff (Rs./kW/m
onth)
Cost(Rs. Crs.)
Total 0.00 0.00 0.00 0.00 0.00 0.00 0.00 0.00
Total Long term + Short term Contracts
((A) + (B)) 0.00 966.95 139.38 5.65 0.00 0.00 0.00 0.00
Distribution Cost
(A) Long Term and Firm Contracts
Name of Distribution service provider
Load not eligible for Open AccessOpen Access
(B) Short Term and Temporary Contracts
Distribution Cost to be segregated between Load not eligible for Open Access, Load eligible for Open Access, Load within the area of supply and availing power under Open Access as per Section 42 and 49 of E ACT.(Refer to Notes for the relevant definitions.)
Remarks
Load Eligible for Open Access Availed (within area of supply) Availed ( Outside Area of supply)
Remarks
Open AccessAvailed ( Outside Area of supply)Load Eligible for Open Access
Loads Eligible for Open Access is as per Section 8.1 of Regulation 2 of 2005 of erstwhile APERCSee Notes Sheet for Phasing of Open Access.
Availed (within area of supply)Load not eligible for Open Access Name of Distribution service provider
Page 118 of 195

2014-15
MWTariff
(Rs./kW/month)
Cost(Rs. Crs.) MW
Tariff (Rs./kW/mont
h)
Cost(Rs. Crs.) MW
Tariff (Rs./kW/mo
nth)
Cost(Rs. Crs.) MW
Tariff (Rs./kW/m
onth)
Cost(Rs. Crs.)
TS NPDCL ( 33 KV) 118.22 10.69 1.52TS NPDCL ( 11 KV) 26.41 218.45 6.92TSNPDCL LT 484.50Total ( Non Eligible OA Cost) 1218.32
Total 0.00 1218.32 144.63 8.44 0.00 0.00 0.00 0.00
MWTariff
(Rs./kW/month)
Cost(Rs. Crs.) MW
Tariff (Rs./kW/mont
h)
Cost(Rs. Crs.) MW
Tariff (Rs./kW/mo
nth)
Cost(Rs. Crs.) MW
Tariff (Rs./kW/m
onth)
Cost(Rs. Crs.)
Total 0.00 0.00 0.00 0.00 0.00 0.00 0.00 0.00
Total Long term + Short term Contracts
((A) + (B)) 0.00 1218.32 144.63 8.44 0.00 0.00 0.00 0.00
Remarks
Availed (within area of supply)
Load Eligible for Open Access
Availed ( Outside Area of supply)Load Eligible for Open Access
Remarks
Open Access
Name of Distribution service provider
Load not eligible for Open Access
(B) Short Term and Temporary Contracts
Availed (within area of supply) Availed ( Outside Area of supply) Name of Distribution service provider
Load not eligible for Open AccessOpen Access
(A) Long Term and Firm Contracts
Page 119 of 195

2015-16
MWTariff
(Rs./kW/ month)
Cost(Rs. Crs.) MW Tariff (Rs./kW/
month)Cost
(Rs. Crs.) MWTariff
(Rs./kW/ month)
Cost(Rs. Crs.) MW
Tariff (Rs./kW/m
onth)
Cost(Rs. Crs.)
TS NPDCL ( 33 KV) 111.67 13.74 1.84TS NPDCL ( 11 KV) 23.27 259.09 7.23TSNPDCL LT 576.16Total ( Non Eligible OA Cost) 1194.07
Total 0.00 1194.07 134.94 9.08 0.00 0.00 0.00 0.00
MWTariff
(Rs./kW/month)
Cost(Rs. Crs.) MW
Tariff (Rs./kW/mont
h)
Cost(Rs. Crs.) MW
Tariff (Rs./kW/mo
nth)
Cost(Rs. Crs.) MW
Tariff (Rs./kW/m
onth)
Cost(Rs. Crs.)
Total 0.00 0.00 0.00 0.00 0.00 0.00 0.00 0.00
Total Long term + Short term Contracts
((A) + (B)) 0.00 1194.07 134.94 9.08 0.00 0.00 0.00 0.00
Remarks
(A) Long Term and Firm Contracts
Remarks
Load Eligible for Open Access Availed (within area of supply)
Name of Distribution service provider
Open Access
(B) Short Term and Temporary ContractsOpen Access
Load Eligible for Open AccessLoad not eligible for Open Access
Load not eligible for Open Access Availed ( Outside Area of supply) Name of Distribution service provider
Availed ( Outside Area of supply)Availed (within area of supply)
Page 120 of 195

2016-17
MWTariff
(Rs./kW/month)
Cost(Rs. Crs.) MW
Tariff (Rs./kW/mont
h)
Cost(Rs. Crs.) MW
Tariff (Rs./kW/mo
nth)
Cost(Rs. Crs.) MW
Tariff (Rs./kW/m
onth)
Cost(Rs. Crs.)
TS NPDCL ( 33 KV) 111.67 13.20 1.77TS NPDCL ( 11 KV) 23.27 321.20 8.97TSNPDCL LT 691.33Total ( Non Eligible OA Cost) 1379.43
Total 0.00 1379.43 134.94 10.74 0.00 0.00 0.00 0.00
MWTariff
(Rs./kW/month)
Cost(Rs. Crs.) MW
Tariff (Rs./kW/mont
h)
Cost(Rs. Crs.) MW
Tariff (Rs./kW/mo
nth)
Cost(Rs. Crs.) MW
Tariff (Rs./kW/m
onth)
Cost(Rs. Crs.)
Total 0.00 0.00 0.00 0.00 0.00 0.00 0.00 0.00
Total Long term + Short term Contracts
((A) + (B)) 0.00 1379.43 134.94 10.74 0.00 0.00 0.00 0.00
Load not eligible for Open Access Availed ( Outside Area of supply)
Remarks
(B) Short Term and Temporary ContractsOpen Access
Availed (within area of supply)
Remarks
Load Eligible for Open Access Name of Distribution service provider
(A) Long Term and Firm Contracts
Name of Distribution service provider
Load not eligible for Open Access Load Eligible for Open Access Availed (within area of supply) Availed ( Outside Area of supply)Open Access
Page 121 of 195

2017-18
MWTariff
(Rs./kW/month)
Cost(Rs. Crs.) MW
Tariff (Rs./kW/mont
h)
Cost(Rs. Crs.) MW
Tariff (Rs./kW/mo
nth)
Cost(Rs. Crs.) MW
Tariff (Rs./kW/m
onth)
Cost(Rs. Crs.)
TS NPDCL ( 33 KV) 111.67 14.28 1.91TS NPDCL ( 11 KV) 23.27 32.70 0.91TSNPDCL LT 714.49Total ( Non Eligible OA Cost) 1630.10
Total 0.00 1630.10 134.94 2.83 0.00 0.00 0.00 0.00
MWTariff
(Rs./kW/month)
Cost(Rs. Crs.) MW
Tariff (Rs./kW/mont
h)
Cost(Rs. Crs.) MW
Tariff (Rs./kW/mo
nth)
Cost(Rs. Crs.) MW
Tariff (Rs./kW/m
onth)
Cost(Rs. Crs.)
1632.93
Total 0.00 0.00 0.00 0.00 0.00 0.00 0.00 1632.93
Total Long term + Short term Contracts
((A) + (B)) 0.00 1630.10 134.94 2.83 0.00 0.00 0.00 1632.93
Remarks
Load Eligible for Open Access Availed (within area of supply)
(B) Short Term and Temporary Contracts
Name of Distribution service provider
Availed ( Outside Area of supply)Load not eligible for Open AccessOpen Access
(A) Long Term and Firm Contracts
Name of Distribution service provider
Remarks
Load Eligible for Open Access Availed (within area of supply)Load not eligible for Open AccessOpen Access
Availed ( Outside Area of supply)
Page 122 of 195

Page 123 of 195

heet
Form 1.4 Power Purchase and Procurement Cost (For Regulated Business #)
#Refer to Notes for the definition
Base Year
Generating Station D LinkPlant Type
Must Run = 1Others = 2
Plant Capacity DISCOM's share
DISCOM's share
(MW) (%) (MW) Net Availability Dispatch Fixed Variable Incentive Income Tax Others Total Fixed Incentives Income Tax Others Variable Total
TSGENCOThermalVTPS I 1292.15 1292.15 72.54 304.49 0.00 0.00 0.00 377.02 0.56 0.00 0.00 0.00 2.36 2.92VTPS II 0.00 0.00 0.00 0.00 0.00 0.00 0.00 0.00 0.00 0.00 0.00 0.00 0.00 0.00VTPS III 0.00 0.00 0.00 0.00 0.00 0.00 0.00 0.00 0.00 0.00 0.00 0.00 0.00 0.00VTPS IV 571.23 571.23 77.69 173.11 0.00 0.00 0.00 250.80 1.36 0.00 0.00 0.00 3.03 4.39RTPP I 366.27 366.27 32.60 121.63 0.00 0.00 0.00 154.23 0.89 0.00 0.00 0.00 3.32 4.21RTPP Stage-II 437.41 437.41 65.73 145.25 0.00 0.00 0.00 210.98 1.50 0.00 0.00 0.00 3.32 4.82RTPP Stage-III 203.61 203.61 44.47 67.61 0.00 0.00 0.00 112.09 2.18 0.00 0.00 0.00 3.32 5.50KTPS A 603.73 603.73 46.05 148.62 0.00 0.00 0.00 194.67 0.76 0.00 0.00 0.00 2.46 3.22KTPS B 0.00 0.00 0.00 0.00 0.00 0.00 0.00 0.00 0.00 0.00 0.00 0.00 0.00 0.00KTPS C 0.00 0.00 0.00 0.00 0.00 0.00 0.00 0.00 0.00 0.00 0.00 0.00 0.00 0.00KTPS D 0.00 0.00 0.00 0.00 0.00 0.00 0.00 0.00 0.00 0.00 0.00 0.00 0.00 0.00KTPS Stage VI 513.96 513.96 32.80 100.78 0.00 0.00 0.00 133.58 0.64 0.00 0.00 0.00 1.96 2.60RTS B 63.59 63.59 6.29 15.61 0.00 0.00 0.00 21.90 0.99 0.00 0.00 0.00 2.45 3.44NTS 0.00 0.00 0.00 0.00 0.00 0.00 0.00 0.00 0.00 0.00 0.00 0.00 0.00 0.00Kakatiya Thermal Power Plant Stage I 466.30 466.30 87.14 97.97 0.00 0.00 0.00 185.11 1.87 0.00 0.00 0.00 2.10 3.97Kakatiya Thermal Power Plant Stage II 0.00 0.00 0.00 0.00 0.00 0.00 0.00 0.00 0.00 0.00 0.00 0.00 0.00 0.00KTPS Stage VI Infirm Power 0.00 0.00 93.53 137.60 0.00 0.00 0.00 231.13 0.00 0.00 0.00 0.00 0.00 0.00Thermal Incentive for the FY 2013-14 0.00 0.00 0.00 0.00 2.54 18.71 -156.00 -134.76 0.00 0.00 0.00 0.00 0.00 0.00
514.30 514.30 0.00 0.00 0.00 0.00 0.00 0.00 0.00 0.00 0.00 0.00 0.00 0.000.00 0.00 0.00 0.00 0.00 0.00 0.00 0.00 0.00 0.00 0.00 0.00 0.00 0.000.00 0.00 0.00 0.00 0.00 0.00 0.00 0.00 0.00 0.00 0.00 0.00 0.00 0.000.00 0.00 0.00 0.00 0.00 0.00 0.00 0.00 0.00 0.00 0.00 0.00 0.00 0.000.00 0.00 0.00 0.00 0.00 0.00 0.00 0.00 0.00 0.00 0.00 0.00 0.00 0.00
TOTAL THERMAL 0.00 0.00 5032.54 5032.54 558.85 1312.67 2.54 18.71 -156.00 1736.77 1.11 0.01 0.04 -0.31 2.61 3.45
MACHKUND PH AP Share 49.31 49.31 2.41 0.00 0.00 0.00 0.00 2.41 0.49 0.00 0.00 0.00 0.00 0.49TUNGBHADRA PH AP Share 24.29 24.29 1.65 0.00 0.00 0.00 0.00 1.65 0.68 0.00 0.00 0.00 0.00 0.68USL 71.64 71.64 7.07 0.00 0.00 0.00 0.00 7.07 0.99 0.00 0.00 0.00 0.00 0.99LSR 198.00 198.00 12.10 0.00 0.00 0.00 0.00 12.10 0.61 0.00 0.00 0.00 0.00 0.61DONKARAYI 18.30 18.30 0.00 0.00 0.00 0.00 0.00 0.00 0.00 0.00 0.00 0.00 0.00 0.00SSLM 234.38 234.38 23.10 0.00 0.00 0.00 0.00 23.10 0.99 0.00 0.00 0.00 0.00 0.99NSPH 211.71 211.71 22.93 0.00 0.00 0.00 0.00 22.93 1.08 0.00 0.00 0.00 0.00 1.08NSRCPH 33.23 33.23 0.00 0.00 0.00 0.00 0.00 0.00 0.00 0.00 0.00 0.00 0.00 0.00NSLCPH 15.39 15.39 0.00 0.00 0.00 0.00 0.00 0.00 0.00 0.00 0.00 0.00 0.00 0.00POCHAMPAD PH 10.19 10.19 4.55 0.00 0.00 0.00 0.00 4.55 4.46 0.00 0.00 0.00 0.00 4.46NIZAMSAGAR PH 1.99 1.99 0.00 0.00 0.00 0.00 0.00 0.00 0.02 0.00 0.00 0.00 0.00 0.02PABM 0.76 0.76 0.00 0.00 0.00 0.00 0.00 0.00 -0.02 0.00 0.00 0.00 0.00 -0.02MINI HYDRO&OTHERS 1.49 1.49 0.95 0.00 0.00 0.00 0.00 0.95 6.42 0.00 0.00 0.00 0.00 6.42SINGUR 0.68 0.68 -0.01 0.00 0.00 0.00 0.00 -0.01 -0.14 0.00 0.00 0.00 0.00 -0.14SSLM LCPH 210.31 210.31 78.30 0.00 0.00 0.00 0.00 78.30 3.72 0.00 0.00 0.00 0.00 3.72Nagarjunasagar Tail Pond Dam Power House 0.00 0.00 0.00 0.00 0.00 0.00 0.00 0.00 0.00 0.00 0.00 0.00 0.00 0.00Priyadarshini Jurala Hydro Electric Project- AP Share 42.29 42.29 19.08 0.00 0.00 0.00 0.00 19.08 4.51 0.00 0.00 0.00 0.00 4.51Lower Jurala Hydro Electric Project 0.00 0.00 0.00 0.00 0.00 0.00 0.00 0.00 0.00 0.00 0.00 0.00 0.00 0.00Ramagiri Wind Mills 0.00 0.00 0.00 0.00 0.00 0.00 0.00 0.00 0.00 0.00 0.00 0.00 0.00 0.00PULICHINTAL(New Project) 3.05 3.05 0.85 0.00 0.00 0.00 0.00 0.85 2.79 0.00 0.00 0.00 0.00 2.79
0.00 0.00 0.00 0.00 0.00 0.00 0.00 0.00 0.000.00 0.00 0.00 0.00 0.00 0.00 0.00 0.00 0.000.00 0.00 0.00 0.00 0.00 0.00 0.00 0.00 0.000.00 0.00 0.00 0.00 0.00 0.00 0.00 0.00 0.000.00 0.00 0.00 0.00 0.00 0.00 0.00 0.00 0.000.00 0.00 0.00 0.00 0.00 0.00 0.00 0.00 0.00
TOTAL HYDRO 0.00 0.00 1127.01 1127.01 172.98 0.00 0.00 0.00 0.00 172.98 1.53 0.00 0.00 0.00 0.00 1.53TOTAL TSGENCO 0.00 0.00 6159.56 6159.56 731.83 1312.67 2.54 18.71 -156.00 1909.75 1.19 0.00 0.03 -0.25 2.13 3.10
Central Generating Stations NTPCNTPC (SR) NTPC (SR) 753.96 753.96 46.35 158.77 0.00 0.00 0.00 205.12 0.61 0.00 0.00 0.00 2.11 2.72 NTPC (SR) Stage III 210.30 210.30 19.77 56.45 0.00 0.00 0.00 76.22 0.94 0.00 0.00 0.00 2.68 3.62 Total NTPC(SR) 0.00 0.00 964.26 964.26 66.13 215.22 0.00 0.00 0.00 281.35 0.69 0.00 0.00 0.00 2.23 2.92
NTPC (ER) Farakka 3.25 3.25 1.13 1.76 0.00 0.00 0.00 2.89 3.47 0.00 0.00 0.00 5.42 8.89 Kahalgaon 1.44 1.44 0.10 0.86 0.00 0.00 0.00 0.96 0.71 0.00 0.00 0.00 5.94 6.65 Talcher - Stage 1 2.09 2.09 0.20 0.34 0.00 0.00 0.00 0.54 0.94 0.00 0.00 0.00 1.64 2.58 Talcher Stage 2 432.44 432.44 37.33 65.92 0.00 0.00 0.00 103.25 0.86 0.00 0.00 0.00 1.52 2.39 Others 0.00 0.00 0.00 0.00 0.00 0.00 0.00 0.00 0.00 0.00 0.00 0.00 0.00 0.00 Total NTPC(ER) 0.00 0.00 439.23 439.23 38.76 68.88 0.00 0.00 0.00 107.63 0.88 0.00 0.00 0.00 1.57 2.45
Total NTPC 0.00 0.00 1403.48 1403.48 104.88 284.10 0.00 0.00 0.00 388.98 0.75 0.00 0.00 0.00 2.02 2.77
Availability and Dispatch (MU) Cost (Rs. Crs.)Remarks
Unit Cost (Rs. / kWh)
Page 124 of 195

NLC TS-II Stage-I 130.06 130.06 9.56 27.99 0.00 0.00 0.00 37.55 0.74 0.00 0.00 0.00 2.15 2.89 Stage-II 227.45 227.45 16.17 46.71 0.00 0.00 0.00 62.88 0.71 0.00 0.00 0.00 2.05 2.76 Total NLC 0.00 0.00 357.51 357.51 25.73 74.70 0.00 0.00 0.00 100.43 0.72 0.00 0.00 0.00 2.09 2.81
NPC NPC-MAPS 27.76 27.76 0.00 5.76 0.00 0.00 0.00 5.76 0.00 0.00 0.00 0.00 2.07 2.07 NPC-Kaiga unit I 148.33 148.33 0.84 44.76 0.00 0.00 0.00 45.60 0.06 0.00 0.00 0.00 3.02 3.07 NPC-Kaiga unit II 150.52 150.52 -0.21 45.42 0.00 0.00 0.00 45.20 -0.01 0.00 0.00 0.00 3.02 3.00 Total NPC 0.00 0.00 326.61 326.61 0.63 95.93 0.00 0.00 0.00 96.56 0.02 0.00 0.00 0.00 2.94 2.96
NTPC - SimhadriNTPC Simhadri Stage I 1138.92 1138.92 135.31 271.08 0.00 0.00 0.00 406.39 1.19 0.00 0.00 0.00 2.38 3.57NTPC Simhadri Stage II 506.61 506.61 88.27 121.83 0.00 0.00 0.00 210.10 1.74 0.00 0.00 0.00 2.40 4.15
Total NTPC- Simhadri 0.00 0.00 1645.54 1645.54 223.58 392.91 0.00 0.00 0.00 616.49 1.36 0.00 0.00 0.00 2.39 3.75
CGS - NewVallur Thermal Power Plant 83.21 83.21 17.78 17.78 0.00 0.00 0.00 35.56 2.14 0.00 0.00 0.00 2.14 4.270 0.00 0.00 0.00 0.00 0.00 0.00 0.00 0.00 0.000 0.00 0.00 0.00 0.00 0.00 0.00 0.00 0.00 0.000 0.00 0.00 0.00 0.00 0.00 0.00 0.00 0.00 0.000 0.00 0.00 0.00 0.00 0.00 0.00 0.00 0.00 0.00
TOTAL CGS 0.00 0.00 3816.35 3816.35 372.60 865.42 0.00 0.00 0.00 1238.02 0.98 0.00 0.00 0.00 2.27 3.24
APGPCLAPGPCL I - Allocated capacity 9.52 9.52 0.39 2.47 0.00 0.00 0.00 2.86 0.41 0.00 0.00 0.00 2.60 3.01APGPCL I - Unutilised capacity 1.31 1.31 0.00 0.34 0.00 0.00 0.00 0.34 0.00 0.00 0.00 0.00 2.56 2.56APGPCL II - Allocated capacity 25.58 25.58 0.74 7.10 0.00 0.00 0.00 7.84 0.29 0.00 0.00 0.00 2.77 3.06APGPCL II - Unutilised capacity 1.02 1.02 0.00 0.29 0.00 0.00 0.00 0.29 0.00 0.00 0.00 0.00 2.83 2.83Total APGPCL 0.00 0.00 37.44 37.44 1.13 10.19 0.00 0.00 0.00 11.32 0.30 0.00 0.00 0.00 2.72 3.02
IPPSGVK 151.48 151.48 16.58 33.20 0.00 0.00 0.00 49.78 1.09 0.00 0.00 0.00 2.19 3.29Spectrum 167.23 167.23 16.40 41.42 0.00 0.00 0.00 57.82 0.98 0.00 0.00 0.00 2.48 3.46Kondapalli (Naphtha) 0.00 0.00 0.00 0.00 0.00 0.00 0.00 0.00 0.00 0.00 0.00 0.00 0.00 0.00Kondapalli (Gas) 223.57 223.57 35.18 50.41 0.00 0.00 0.00 85.59 1.57 0.00 0.00 0.00 2.25 3.83BSES 73.08 73.08 7.37 11.97 0.00 0.00 0.00 19.33 1.01 0.00 0.00 0.00 1.64 2.65GVK Extension 0.23 0.23 0.04 0.00 0.00 0.00 -4.62 -4.58 1.81 0.00 0.00 -200.63 0.00 -198.82Vemagiri 24.32 24.32 2.59 18.16 0.00 0.00 0.00 20.75 1.07 0.00 0.00 0.00 7.47 8.53Gautami 0.00 0.00 2.12 0.00 0.00 0.00 -9.10 -6.99 0.00 0.00 0.00 0.00 0.00 0.00Konaseema 0.71 0.71 0.08 0.00 0.00 0.00 -25.36 -25.28 1.10 0.00 0.00 -355.35 0.00 -354.250 0.00 0.00 0.00 0.00 0.00 0.00 0.00 0.00 0.000 0.00 0.00 0.00 0.00 0.00 0.00 0.00 0.00 0.00TOTAL IPPS 0.00 0.00 640.62 640.62 80.36 155.16 0.00 0.00 -39.08 196.44 1.25 0.00 0.00 -0.61 2.42 3.07
NCENCE - Bio-Mass 100.90 100.90 0.00 116.92 0.00 0.00 0.00 116.92 0.00 0.00 0.00 0.00 11.59 11.59NCE - Bagasse 112.57 112.57 0.00 32.63 0.00 0.00 0.00 32.63 0.00 0.00 0.00 0.00 2.90 2.90NCE - Municipal Waste to Energy 0.00 0.00 0.00 0.00 0.00 0.00 0.00 0.00 0.00 0.00 0.00 0.00 0.00 0.00NCE - Industrial Waste based power project 0.00 0.00 0.00 0.00 0.00 0.00 0.00 0.00 0.00 0.00 0.00 0.00 0.00 0.00NCE - Wind Power 0.00 0.00 0.00 0.00 0.00 0.00 0.00 0.00 0.00 0.00 0.00 0.00 0.00 0.00NCE - Mini Hydel 5.25 5.25 0.00 3.92 0.00 0.00 0.00 3.92 0.00 0.00 0.00 0.00 7.47 7.47NCE - NCL Energy Ltd 3.25 3.25 0.00 0.58 0.00 0.00 0.00 0.58 0.00 0.00 0.00 0.00 1.80 1.80NCE-Others 60.47 60.47 0.00 -30.93 0.00 0.00 0.00 -30.93 0.00 0.00 0.00 0.00 -5.11 -5.11TOTAL NCE 0.00 0.00 282.44 282.44 0.00 123.13 0.00 0.00 0.00 123.13 0.00 0.00 0.00 0.00 4.36 4.36
OTHERSSrivathsa 0.00 0.00 0.00 0.00 0.00 0.00 0.00 0.00 0.00 0.00 0.00 0.00 0.00 0.00LVS 0.00 0.00 0.00 0.00 0.00 0.00 0.00 0.00 0.00 0.00 0.00 0.00 0.00 0.00Vishakapatnam Steel Plant 0.00 0.00 0.00 0.00 0.00 0.00 0.00 0.00 0.00 0.00 0.00 0.00 0.00 0.00NB Ferro Alloys 0.00 0.00 0.00 0.00 0.00 0.00 0.00 0.00 0.00 0.00 0.00 0.00 0.00 0.00Sponge Iron * 0.00 0.00 0.00 0.00 0.00 0.00 0.00 0.00 0.00 0.00 0.00 0.00 0.00 0.00Heavy Water Plant * 0.00 0.00 0.00 0.00 0.00 0.00 0.00 0.00 0.00 0.00 0.00 0.00 0.00 0.00Kesoram * 0.00 0.00 0.00 0.00 0.00 0.00 0.00 0.00 0.00 0.00 0.00 0.00 0.00 0.00Essar Steels * 0.00 0.00 0.00 0.00 0.00 0.00 0.00 0.00 0.00 0.00 0.00 0.00 0.00 0.000 0.00 0.00 0.00 0.00 0.00 0.00 0.00 0.00 0.00 0.00 0.00 0.00 0.00 0.00
0.00 0.00 0.00 0.00 0.00 0.00 0.00 0.00 0.00 0.00 0.00 0.00 0.00 0.000.00 0.00 0.00 0.00 0.00 0.00 0.00 0.00 0.00 0.00 0.00 0.00 0.00 0.00
TOTAL OTHERS 0.00 0.00 0.00 0.00 0.00 0.00 0.00 0.00 0.00 0.00 0.00 0.00 0.00 0.00 0.00 0.00
MARKETPTC 0.00 0.00 0.00 0.00 0.00 0.00 0.00 0.00 0.00 0.00 0.00 0.00 0.00 0.00RCL and Short-Term Sources(IG Wells,Kesoram) 0.00 0.00 0.00 0.00 0.00 0.00 0.00 0.00 0.00 0.00 0.00 0.00 0.00 0.00CPDCL 0.00 0.00 0.00 0.00 0.00 0.00 0.00 0.00 0.00 0.00 0.00 0.00 0.00 0.00EPDCL 0.00 0.00 0.00 0.00 0.00 0.00 0.00 0.00 0.00 0.00 0.00 0.00 0.00 0.00NPDCL 0.00 0.00 0.00 0.00 0.00 0.00 0.00 0.00 0.00 0.00 0.00 0.00 0.00 0.00SPDCL 0.00 0.00 0.00 0.00 0.00 0.00 0.00 0.00 0.00 0.00 0.00 0.00 0.00 0.00UI 0.00 0.00 0.00 0.00 0.00 0.00 0.00 0.00 0.00 0.00 0.00 0.00 0.00 0.00Other Short Term Sources 0.00 0.00 0.00 0.00 0.00 0.00 0.00 0.00 0.00 0.00 0.00 0.00 0.00 0.00PGCIL UI Energy 0.00 0.00 0.00 0.00 0.00 0.00 0.00 0.00 0.00 0.00 0.00 0.00 0.00 0.00NTPC Simhadri UI Energy 0.00 0.00 0.00 0.00 0.00 0.00 0.00 0.00 0.00 0.00 0.00 0.00 0.00 0.00
Page 125 of 195

Other Short Term Sources (Net after Sales) 1262.04 1262.04 0.00 791.92 0.00 0.00 0.00 791.92 0.00 0.00 0.00 0.00 6.27 6.27Mediumt Term Sources/Traders (Medium Term) 259.06 259.06 39.71 68.22 0.00 0.00 0.00 107.92 1.53 0.00 0.00 0.00 2.63 4.17
0.00 0.00 0.00 0.00 0.00 0.00 0.00 0.00 0.000.00 0.00 0.00 0.00 0.00 0.00 0.00 0.00 0.000.00 0.00 0.00 0.00 0.00 0.00 0.00 0.00 0.00
TOTAL MARKET 0.00 0.00 1521.10 1521.10 39.71 860.13 0.00 0.00 0.00 899.84 0.26 0.00 0.00 0.00 5.65 5.92
TOTAL (From All Sources) 0.00 0.00 12457.50 12457.50 1225.62 3326.71 2.54 18.71 -195.08 4378.49 0.98 0.00 0.02 -0.16 2.67 3.51
2014-15
Generating Station D LinkPlant Type
Must Run = 1Others = 2
Plant Capacity DISCOM's share
DISCOM's share
(MW) (%) (MW) Net Availability Dispatch Fixed Variable Incentive Inc. Tax Others Total Fixed Inctv Inc. Tax Others Variable Total
TSGENCOThermalVTPS I 1280.03 1280.03 76.44 385.13 0.00 0.00 0.00 461.57 0.60 0.00 0.00 0.00 3.01 3.61VTPS II 0.00 0.00 0.00 0.00 0.00 0.00 0.00 0.00 0.00 0.00 0.00 0.00 0.00 0.00VTPS III 0.00 0.00 0.00 0.00 0.00 0.00 0.00 0.00 0.00 0.00 0.00 0.00 0.00 0.00VTPS IV 536.01 536.01 79.90 155.08 0.00 0.00 0.00 234.98 1.49 0.00 0.00 0.00 2.89 4.38RTPP I 375.13 375.13 35.19 135.01 0.00 0.00 0.00 170.20 0.94 0.00 0.00 0.00 3.60 4.54RTPP Stage-II 426.49 426.49 64.68 145.20 0.00 0.00 0.00 209.88 1.52 0.00 0.00 0.00 3.40 4.92RTPP Stage-III 199.11 199.11 49.06 68.86 0.00 0.00 0.00 117.92 2.46 0.00 0.00 0.00 3.46 5.92KTPS A 626.39 626.39 57.65 161.24 0.00 0.00 0.00 218.89 0.92 0.00 0.00 0.00 2.57 3.49KTPS B 0.00 0.00 0.00 0.00 0.00 0.00 0.00 0.00 0.00 0.00 0.00 0.00 0.00 0.00KTPS C 0.00 0.00 0.00 0.00 0.00 0.00 0.00 0.00 0.00 0.00 0.00 0.00 0.00 0.00KTPS D 490.92 490.92 34.75 102.01 0.00 0.00 0.00 136.76 0.71 0.00 0.00 0.00 2.08 2.79KTPS Stage VI 583.88 583.88 90.73 175.65 0.00 0.00 0.00 266.38 1.55 0.00 0.00 0.00 3.01 4.56RTS B 26.92 26.92 8.37 2.00 0.00 0.00 0.00 10.37 3.11 0.00 0.00 0.00 0.74 3.85NTS 0.00 0.00 0.00 0.00 0.00 0.00 0.00 0.00 0.00 0.00 0.00 0.00 0.00 0.00Kakatiya Thermal Power Plant Stage I 612.83 612.83 105.07 140.02 0.00 0.00 0.00 245.08 1.71 0.00 0.00 0.00 2.28 4.00Kakatiya Thermal Power Plant Stage II 0.00 0.00 0.00 0.00 0.00 0.00 0.00 0.00 0.00 0.00 0.00 0.00 0.00 0.00Damodaram Sanjeevaiah Thermal power plant - I 0.00 0.00 0.00 0.00 0.00 0.00 0.00 0.00 0.00 0.00 0.00 0.00 0.00 0.00Damodaram Sanjeevaiah Thermal power plant - II 0.00 0.00 0.00 0.00 0.00 0.00 0.00
0.00 0.000.00 0.000.00 0.000.00 0.000.00 0.00 0.00 0.00 0.00 0.00 0.00 0.00 0.00
TOTAL THERMAL 0.00 0.00 5157.70 5157.70 601.85 1470.19 0.00 0.00 0.00 2072.04 1.17 0.00 0.00 0.00 2.85 4.02
MACHKUND PH AP Share 28.89 28.89 2.33 0.00 0.00 0.00 0.00 2.33 0.81 0.00 0.00 0.00 0.00 0.81TUNGBHADRA PH AP Share 21.38 21.38 1.60 0.00 0.00 0.00 0.00 1.60 0.75 0.00 0.00 0.00 0.00 0.75USL 15.37 15.37 1.20 0.00 0.00 0.00 0.00 1.20 0.78 0.00 0.00 0.00 0.00 0.78LSR 42.06 42.06 2.30 0.00 0.00 0.00 0.00 2.30 0.55 0.00 0.00 0.00 0.00 0.55DONKARAYI 4.20 4.20 0.12 0.00 0.00 0.00 0.00 0.12 0.30 0.00 0.00 0.00 0.00 0.30SSLM 14.72 14.72 4.21 0.00 0.00 0.00 0.00 4.21 2.86 0.00 0.00 0.00 0.00 2.86NSPH 291.96 291.96 21.40 0.00 0.00 0.00 0.00 21.40 0.73 0.00 0.00 0.00 0.00 0.73NSRCPH 0.00 0.00 0.40 0.00 0.00 0.00 0.00 0.40 0.00 0.00 0.00 0.00 0.00 0.00NSLCPH 12.81 12.81 1.57 0.00 0.00 0.00 0.00 1.57 1.23 0.00 0.00 0.00 0.00 1.23POCHAMPAD PH 1.44 1.44 2.01 0.00 0.00 0.00 0.00 2.01 13.94 0.00 0.00 0.00 0.00 13.94NIZAMSAGAR PH 1.24 1.24 0.74 0.00 0.00 0.00 0.00 0.74 6.00 0.00 0.00 0.00 0.00 6.00PABM -0.01 -0.01 0.25 0.00 0.00 0.00 0.00 0.25 -214.78 0.00 0.00 0.00 0.00 -214.78MINI HYDRO&OTHERS 0.24 0.24 0.69 0.00 0.00 0.00 0.00 0.69 28.22 0.00 0.00 0.00 0.00 28.22SINGUR 1.46 1.46 1.35 0.00 0.00 0.00 0.00 1.35 9.24 0.00 0.00 0.00 0.00 9.24SSLM LCPH 519.12 519.12 79.70 0.00 0.00 0.00 0.00 79.70 1.54 0.00 0.00 0.00 0.00 1.54Nagarjunasagar Tail Pond Dam Power House 0.00 0.00 0.00 0.00 0.00 0.00 0.00 0.00 0.00 0.00 0.00 0.00 0.00 0.00Priyadarshini Jurala Hydro Electric Project- AP Share 0.00 0.00 0.00 0.00 0.00 0.00 0.00 0.00 0.00 0.00 0.00 0.00 0.00 0.00Lower Jurala Hydro Electric Project 59.65 59.65 11.49 0.00 0.00 0.00 0.00 11.49 1.93 0.00 0.00 0.00 0.00 1.93POCHAMPAD Stig-II 0.73 0.73 0.00 0.00 0.00 0.00 0.00 0.00 0.00 0.00 0.00 0.00 0.00 0.00PULICHINTAL(New Project) 0.00 0.00 0.00 0.00 0.00 0.00 0.00 0.00 0.00 0.00 0.00 0.00 0.00 0.00Mini HYDRO(Chettaipeta) 0.12 0.12 0.15 0.00 0.00 0.00 0.00 0.15 13.29 0.00 0.00 0.00 0.00 13.29Ramagiri Wind Mills 0.00 0.00 0.00 0.00 0.00 0.00 0.00 0.00 0.00 0.00 0.00 0.00 0.00 0.00Pochampad Stig-VI 0.13 0.13 0.79 0.00 0.00 0.00 0.00 0.79 60.39 0.00 0.00 0.00 0.00 60.390 0.00 0.00 0.00 0.00 0.00 0.00 0.00 0.00 0.00
0.00 0.00 0.00 0.00 0.00 0.00 0.00 0.00 0.00TOTAL HYDRO 0.00 0.00 1015.51 1015.51 132.31 0.00 0.00 0.00 0.00 132.31 1.30 0.00 0.00 0.00 0.00 1.30TOTAL TSGENCO 0.00 0.00 6173.21 6173.21 734.16 1470.19 0.00 0.00 0.00 2204.35 1.19 0.00 0.00 0.00 2.38 3.57
Central Generating Stations NTPCNTPC (SR) NTPC (SR) 811.74 811.74 45.73 199.56 0.00 0.00 0.00 245.29 0.56 0.00 0.00 0.00 2.46 3.02 NTPC (SR) Stage III 204.74 204.74 18.88 52.02 0.00 0.00 0.00 70.90 0.92 0.00 0.00 0.00 2.54 3.46 Total NTPC(SR) 0.00 0.00 1016.48 1016.48 64.61 251.58 0.00 0.00 0.00 316.19 0.64 0.00 0.00 0.00 2.48 3.11
NTPC (ER) Farakka 0.00 0.00 -0.03 -0.01 0.00 0.00 0.00 -0.04 0.00 0.00 0.00 0.00 0.00 0.00 Kahalgaon 0.00 0.00 0.02 0.00 0.00 0.00 0.00 0.02 0.00 0.00 0.00 0.00 0.00 0.00
RemarksUnit Cost
(Rs. / kWh)
Note: 1) Details of NCE Plant wise to be filled in Form 1.4 [i,ii,iii,iv] 2) Hydro cost break up details to be provided based on appropriate methodology. In case it is not possible to segregate the cost Station wise, provide the total details in the empty rows in the TSGENCO Hydro stations section saying ALL TSGENCO Hydro (Combined)
Availability and Dispatch (MU) Cost (Rs. Crs.)
Page 126 of 195

Talcher - Stage 1 0.00 0.00 0.00 0.00 0.00 0.00 0.00 0.00 0.00 0.00 0.00 0.00 0.00 0.00 Talcher Stage 2 481.81 481.81 37.84 70.33 0.00 0.00 0.00 108.17 0.79 0.00 0.00 0.00 1.46 2.24 Others 0.00 0.00 -0.06 -0.25 0.00 0.00 0.00 -0.31 0.00 0.00 0.00 0.00 0.00 0.00 Total NTPC(ER) 0.00 0.00 481.81 481.81 37.77 70.07 0.00 0.00 0.00 107.84 0.78 0.00 0.00 0.00 1.45 2.24
Total NTPC 0.00 0.00 1498.29 1498.29 102.38 321.65 0.00 0.00 0.00 424.03 0.68 0.00 0.00 0.00 2.15 2.83
NLC TS-II Stage-I 128.66 128.66 7.95 28.71 0.00 0.00 0.00 36.67 0.62 0.00 0.00 0.00 2.23 2.85 Stage-II 225.08 225.08 14.10 61.04 0.00 0.00 0.00 75.15 0.63 0.00 0.00 0.00 2.71 3.34 Total NLC 0.00 0.00 353.74 353.74 22.06 89.76 0.00 0.00 0.00 111.81 0.62 0.00 0.00 0.00 2.54 3.16
NPC NPC-MAPS 34.66 34.66 0.00 7.20 0.00 0.00 0.00 7.20 0.00 0.00 0.00 0.00 2.08 2.08 NPC-Kaiga unit I 138.10 138.10 1.56 41.33 0.00 0.00 0.00 42.90 0.11 0.00 0.00 0.00 2.99 3.11 NPC-Kaiga unit II 156.32 156.32 0.00 47.86 0.00 0.00 0.00 47.86 0.00 0.00 0.00 0.00 3.06 3.06 Total NPC 0.00 0.00 329.08 329.08 1.56 96.40 0.00 0.00 0.00 97.96 0.05 0.00 0.00 0.00 2.93 2.98
NTPC - SimhadriNTPC Simhadri Stage I 1168.79 1168.79 108.29 306.91 0.00 0.00 0.00 415.21 0.93 0.00 0.00 0.00 2.63 3.55NTPC Simhadri Stage II 514.66 514.66 88.04 133.54 0.00 0.00 0.00 221.58 1.71 0.00 0.00 0.00 2.59 4.31
Total NTPC- Simhadri 0.00 0.00 1683.45 1683.45 196.34 440.45 0.00 0.00 0.00 636.79 1.17 0.00 0.00 0.00 2.62 3.78
CGS - NewVallur Thermal Power Plant 128.34 128.34 23.24 24.87 0.00 0.00 0.00 48.11 1.81 0.00 0.00 0.00 1.94 3.75NTPC NVVNL Bundled Power Coal (CP) 0.00 0.00 0.00 0.00 0.00 0.00 0.00 0.00 0.00 0.00 0.00 0.00 0.00 0.00NTPC NVVNL Bundled Power Coal (NP) 61.75 61.75 0.43 18.79 0.00 0.00 0.00 19.22 0.07 0.00 0.00 0.00 3.04 3.110 0.00 0.00 0.00 0.00 0.00 0.00 0.00 0.00 0.000 0.00 0.00 0.00 0.00 0.00 0.00 0.00 0.00 0.00
TOTAL CGS 0.00 0.00 4054.65 4054.65 346.01 991.92 0.00 0.00 0.00 1337.93 0.85 0.00 0.00 0.00 2.45 3.30
APGPCLAPGPCL I - Allocated capacity 4.92 4.92 0.56 1.36 0.00 0.00 0.00 1.92 1.15 0.00 0.00 0.00 2.76 3.91APGPCL I - Unutilised capacity 0.24 0.24 0.00 0.07 0.00 0.00 0.00 0.07 0.00 0.00 0.00 0.00 2.77 2.77APGPCL II - Allocated capacity 16.67 16.67 0.78 4.36 0.00 0.00 0.00 5.14 0.47 0.00 0.00 0.00 2.61 3.08APGPCL II - Unutilised capacity 0.22 0.22 0.00 0.06 0.00 0.00 0.00 0.06 0.00 0.00 0.00 0.00 2.61 2.61Total APGPCL 0.00 0.00 22.05 22.05 1.35 5.84 0.00 0.00 0.00 7.19 0.61 0.00 0.00 0.00 2.65 3.26
IPPSGVK 91.84 91.84 17.24 27.50 0.00 0.00 0.00 44.74 1.88 0.00 0.00 0.00 2.99 4.87Spectrum 86.84 86.84 19.87 27.32 0.00 0.00 0.00 47.20 2.29 0.00 0.00 0.00 3.15 5.43Kondapalli (Naphtha) 0.00 0.00 0.00 0.00 0.00 0.00 0.00 0.00 0.00 0.00 0.00 0.00 0.00 0.00Kondapalli (Gas) 79.74 79.74 19.22 41.20 0.00 0.00 0.00 60.42 2.41 0.00 0.00 0.00 5.17 7.58BSES 0.00 0.00 0.00 0.00 0.00 0.00 0.00 0.00 0.00 0.00 0.00 0.00 0.00 0.00GVK Extension 0.00 0.00 0.00 0.00 0.00 0.00 0.00 0.00 0.00 0.00 0.00 0.00 0.00 0.00Vemagiri 0.00 0.00 0.00 0.00 0.00 0.00 0.00 0.00 0.00 0.00 0.00 0.00 0.00 0.00Gautami 0.00 0.00 0.00 0.00 0.00 0.00 0.00 0.00 0.00 0.00 0.00 0.00 0.00 0.00Konaseema 0.00 0.00 0.00 0.00 0.00 0.00 0.00 0.00 0.00 0.00 0.00 0.00 0.00 0.00Reliance Infrastructure 26.52 26.52 1.90 6.68 0.00 0.00 0.00 8.58 0.72 0.00 0.00 0.00 2.52 3.230 0.00 0.00 0.00 0.00 0.00 0.00 0.00 0.00 0.000 0.00 0.00 0.00 0.00 0.00 0.00 0.00 0.00 0.000 0.00 0.00 0.00 0.00 0.00 0.00 0.00 0.00 0.000 0.00 0.00 0.00 0.00 0.00 0.00 0.00 0.00 0.00TOTAL IPPS 0.00 0.00 284.94 284.94 58.24 102.70 0.00 0.00 0.00 160.94 2.04 0.00 0.00 0.00 3.60 5.65
NCENCE - Bio-Mass 113.27 113.27 0.00 77.56 0.00 0.00 0.00 77.56 0.00 0.00 0.00 0.00 6.85 6.85NCE - Bagasse 78.13 78.13 0.00 29.06 0.00 0.00 0.00 29.06 0.00 0.00 0.00 0.00 3.72 3.72NCE - Municipal Waste to Energy 0.00 0.00 0.00 0.00 0.00 0.00 0.00 0.00 0.00 0.00 0.00 0.00 0.00 0.00NCE - Industrial Waste based power project 0.00 0.00 0.00 0.00 0.00 0.00 0.00 0.00 0.00 0.00 0.00 0.00 0.00 0.00NCE - Wind Power 0.00 0.00 0.00 0.00 0.00 0.00 0.00 0.00 0.00 0.00 0.00 0.00 0.00 0.00NCE - Mini Hydel 2.73 2.73 0.00 0.51 0.00 0.00 0.00 0.51 0.00 0.00 0.00 0.00 1.88 1.88NCE - NCL Energy Ltd 0.00 0.00 0.00 0.00 0.00 0.00 0.00 0.00 0.00 0.00 0.00 0.00 0.00 0.00NCE-Others 24.62 24.62 0.07 21.69 0.00 0.00 0.00 21.76 0.03 0.00 0.00 0.00 8.81 8.84TOTAL NCE 0.00 0.00 218.75 218.75 0.07 128.82 0.00 0.00 0.00 128.89 0.00 0.00 0.00 0.00 5.89 5.89
OTHERSSrivathsa 0.00 0.00 0.00 0.00 0.00 0.00 0.00 0.00 0.00 0.00 0.00 0.00 0.00 0.00LVS 0.00 0.00 0.00 0.00 0.00 0.00 0.00 0.00 0.00 0.00 0.00 0.00 0.00 0.00Vishakapatnam Steel Plant 0.00 0.00 0.00 0.00 0.00 0.00 0.00 0.00 0.00 0.00 0.00 0.00 0.00 0.00NB Ferro Alloys 0.00 0.00 0.00 0.00 0.00 0.00 0.00 0.00 0.00 0.00 0.00 0.00 0.00 0.00Sponge Iron 0.00 0.00 0.00 0.00 0.00 0.00 0.00 0.00 0.00 0.00 0.00 0.00 0.00 0.000 0.00 0.00 0.00 0.00 0.00 0.00 0.00 0.00 0.00 0.00 0.00 0.00 0.00 0.000 0.00 0.00 0.00 0.00 0.00 0.00 0.00 0.00 0.00 0.00 0.00 0.00 0.00 0.00Essar steels 0.00 0.00 0.00 0.00 0.00 0.00 0.00 0.00 0.00 0.00 0.00 0.00 0.00 0.00KSK Mahanadi (MT) 0.00 0.00 0.00 0.00 0.00 0.00 0.00 0.00 0.00 0.00 0.00 0.00 0.00 0.00Hinduja 0.00 0.00 0.00 0.00 0.00 0.00 0.00 0.00 0.00 0.00 0.00 0.00 0.00 0.00RLNG 0.00 0.00 0.00 0.00 0.00 0.00 0.00 0.00 0.00 0.00 0.00 0.00 0.00 0.00TOTAL OTHERS 0.00 0.00 0.00 0.00 0.00 0.00 0.00 0.00 0.00 0.00 0.00 0.00 0.00 0.00 0.00 0.00
MARKET
Page 127 of 195

PTC 0.00 0.00 0.00 0.00 0.00 0.00 0.00 0.00 0.00 0.00 0.00 0.00 0.00 0.00RCL and Short-Term Sources(IG Wells,Kesoram) 0.00 0.00 0.00 0.00 0.00 0.00 0.00 0.00 0.00 0.00 0.00 0.00 0.00 0.00
0.00 0.00 0.00 0.00 0.00 0.00 0.00 0.00 0.00 0.00 0.00 0.00 0.00 0.000.00 0.00 0.00 0.00 0.00 0.00 0.00 0.00 0.00 0.00 0.00 0.00 0.00 0.000.00 0.00 0.00 0.00 0.00 0.00 0.00 0.00 0.00 0.00 0.00 0.00 0.00 0.00
APSPDCL 0.00 0.00 0.00 0.00 0.00 0.00 0.00 0.00 0.00 0.00 0.00 0.00 0.00 0.00UI 162.33 162.33 0.00 53.19 0.00 0.00 0.00 53.19 0.00 0.00 0.00 0.00 3.28 3.28Other Short Term Sources 0.00 0.00 0.00 0.00 0.00 0.00 0.00 0.00 0.00 0.00 0.00 0.00 0.00 0.00Pool Transaction (Purchases) 0.00 0.00 0.00 0.00 0.00 0.00 0.00 0.00 0.00 0.00 0.00 0.00 0.00 0.00Medium Term Open Access Traders 452.27 452.27 68.29 104.02 0.00 0.00 0.00 172.31 1.51 0.00 0.00 0.00 2.30 3.81Short Term Open Access Traders 2084.90 2084.90 63.75 1115.65 0.00 0.00 0.00 1179.39 0.31 0.00 0.00 0.00 5.35 5.66Bi-lateral Puchases 0.00 0.00 0.00 0.00 0.00 0.00 0.00 0.00 0.00 0.00 0.00 0.00 0.00 0.00Jhajjar 0.00 0.00 0.00 0.00 0.00 0.00 0.00 0.00 0.00 0.00 0.00 0.00 0.00 0.00Pool Purchase 0.00 0.00 0.00 0.00 0.00 0.00 0.00 0.00 0.00 0.00 0.00 0.00 0.00 0.00Pool Sales 0.00 0.00 0.00 0.00 0.00 0.00 0.00 0.00 0.00 0.00 0.00 0.00 0.00 0.00TOTAL MARKET 0.00 0.00 2699.50 2699.50 132.03 1272.86 0.00 0.00 0.00 1404.89 0.49 0.00 0.00 0.00 4.72 5.20
TOTAL (From All Sources) 0.00 0.00 13453.10 13453.10 1271.85 3972.33 0.00 0.00 0.00 5244.18 0.95 0.00 0.00 0.00 2.95 3.90
2015-16
Generating Station D LinkPlant Type
Must Run = 1Others = 2
Plant Capacity DISCOM's share
DISCOM's share
(MW) (%) (MW) Net Availability Dispatch Fixed Variable Incentive Income Tax Others Total Fixed Incentives Income Tax Others Variable Total
TSGENCOThermalVTPS I 1337.18 1337.18 72.54 428.15 0.00 0.00 0.00 500.69 0.54 0.00 0.00 0.00 3.20 3.74VTPS II 0.00 0.00 0.00 0.00 0.00 0.00 0.00 0.00 0.00 0.00 0.00 0.00 0.00 0.00VTPS III 0.00 0.00 0.00 0.00 0.00 0.00 0.00 0.00 0.00 0.00 0.00 0.00 0.00 0.00VTPS IV 466.87 466.87 77.69 140.68 0.00 0.00 0.00 218.37 1.66 0.00 0.00 0.00 3.01 4.68RTPP I 435.36 435.36 35.61 151.95 0.00 0.00 0.00 187.56 0.82 0.00 0.00 0.00 3.49 4.31RTPP Stage-II 447.45 447.45 65.73 150.35 0.00 0.00 0.00 216.08 1.47 0.00 0.00 0.00 3.36 4.83RTPP Stage-III 214.97 214.97 44.47 73.22 0.00 0.00 0.00 117.69 2.07 0.00 0.00 0.00 3.41 5.47KTPS A 620.36 620.36 61.93 156.50 0.00 0.00 0.00 218.43 1.00 0.00 0.00 0.00 2.52 3.52KTPS B 0.00 0.00 0.00 0.00 0.00 0.00 0.00 0.00 0.00 0.00 0.00 0.00 0.00 0.00KTPS C 0.00 0.00 0.00 0.00 0.00 0.00 0.00 0.00 0.00 0.00 0.00 0.00 0.00 0.00KTPS D 502.70 502.70 37.48 104.24 0.00 0.00 0.00 141.71 0.75 0.00 0.00 0.00 2.07 2.82KTPS Stage VI 344.19 344.19 91.90 90.49 0.00 0.00 0.00 182.38 2.67 0.00 0.00 0.00 2.63 5.30RTS B 57.72 57.72 7.64 15.58 0.00 0.00 0.00 23.21 1.32 0.00 0.00 0.00 2.70 4.02NTS 0.00 0.00 0.00 0.00 0.00 0.00 0.00 0.00 0.00 0.00 0.00 0.00 0.00 0.00Kakatiya Thermal Power Plant Stage I 408.13 408.13 91.86 100.50 0.00 0.00 0.00 192.36 2.25 0.00 0.00 0.00 2.46 4.71Kakatiya Thermal Power Plant Stage II 0.00 0.00 0.00 0.00 0.00 0.00 0.00 0.00 0.00 0.00 0.00 0.00 0.00 0.00Damodaram Sanjeevaiah Thermal power plant - I 0.00 0.00 0.00 0.00 0.00 0.00 0.00 0.00 0.00 0.00 0.00 0.00 0.00 0.00Damodaram Sanjeevaiah Thermal power plant - II 0.00 0.00 0.00 0.00 0.00 0.00 0.00 0.00 0.00 0.00 0.00 0.00 0.00 0.00Thermal Incentive 15-16 0.00 0.00 0.00 0.00 0.11 0.00 0.00 0.11 0.00 0.00 0.00 0.00 0.00 0.00KTPP II Infirm Power 0.00 95.61 31.48 0.00 0.00 0.00 0.00 31.48 3.29 0.00 0.00 0.00 0.00 3.29TSGENCO Thermal stations True Up 15-16 0.00 0.00 -4.12 0.00 0.00 0.00 0.00 -4.12 0.00 0.00 0.00 0.00 0.00 0.00
0.00 0.00 0.00 0.00 0.00 0.00 0.00 0.00 0.000.00 0.00 0.00 0.00 0.00 0.00 0.00 0.00 0.00
TOTAL THERMAL 0.00 0.00 4834.93 4930.54 614.22 1411.65 0.11 0.00 0.00 2025.98 1.25 0.00 0.00 0.00 2.86 4.11
MACHKUND PH TS Share 0.00 0.00 0.00 0.00 0.00 0.00 0.00 0.00 0.00 0.00 0.00 0.00 0.00 0.00TUNGBHADRA PH TSShare 0.00 0.00 0.00 0.00 0.00 0.00 0.00 0.00 0.00 0.00 0.00 0.00 0.00 0.00USL 0.00 0.00 0.00 0.00 0.00 0.00 0.00 0.00 0.00 0.00 0.00 0.00 0.00 0.00LSR 0.00 0.00 0.00 0.00 0.00 0.00 0.00 0.00 0.00 0.00 0.00 0.00 0.00 0.00DONKARAYI 0.00 0.00 0.00 0.00 0.00 0.00 0.00 0.00 0.00 0.00 0.00 0.00 0.00 0.00SSLM 0.00 0.00 0.00 0.00 0.00 0.00 0.00 0.00 0.00 0.00 0.00 0.00 0.00 0.00NSPH 25.93 25.93 41.16 0.00 0.00 0.00 0.00 41.16 15.87 0.00 0.00 0.00 0.00 15.87NSRCPH 0.00 0.00 0.00 0.00 0.00 0.00 0.00 0.00 0.00 0.00 0.00 0.00 0.00 0.00NSLCPH 0.00 0.00 3.03 0.00 0.00 0.00 0.00 3.03 -131812.91 0.00 0.00 0.00 0.00 ########POCHAMPAD PH -0.05 -0.05 3.41 0.00 0.00 0.00 0.00 3.41 -650.92 0.00 0.00 0.00 0.00 -650.92NIZAMSAGAR PH -0.05 -0.05 1.26 0.00 0.00 0.00 0.00 1.26 -252.71 0.00 0.00 0.00 0.00 -252.71PABM 0.00 0.00 0.00 0.00 0.00 0.00 0.00 0.00 0.00 0.00 0.00 0.00 0.00 0.00MINI HYDRO&OTHERS 0.00 0.00 1.74 0.00 0.00 0.00 0.00 1.74 29927.87 0.00 0.00 0.00 0.00 29927.87SINGUR -0.08 -0.08 1.89 0.00 0.00 0.00 0.00 1.89 -237.05 0.00 0.00 0.00 0.00 -237.05SSLM LCPH 43.29 43.29 139.38 0.00 0.00 0.00 0.00 139.38 32.20 0.00 0.00 0.00 0.00 32.20Nagarjunasagar Tail Pond Dam Power House 0.00 0.00 0.00 0.00 0.00 0.00 0.00 0.00 0.00 0.00 0.00 0.00 0.00 0.00Priyadarshini Jurala Hydro Electric Project- TS Share 0.00 0.00 0.00 0.00 0.00 0.00 0.00 0.00 0.00 0.00 0.00 0.00 0.00 0.00Lower Jurala Hydro Electric Project 5.95 5.95 18.08 0.00 0.00 0.00 0.00 18.08 30.40 0.00 0.00 0.00 0.00 30.40POCHAMPAD Stig-II 0.00 0.00 0.00 0.00 0.00 0.00 0.00 0.00 0.00 0.00 0.00 0.00 0.00 0.00PULICHINTAL(New Project) 0.00 0.00 0.00 0.00 0.00 0.00 0.00 0.00 0.00 0.00 0.00 0.00 0.00 0.00Pochampad Stig-VI 0.00 0.00 1.58 0.00 0.00 0.00 0.00 1.58 0.00 0.00 0.00 0.00 0.00 0.00APGE-Hydel-Interstate 30.80 30.80 4.06 0.00 0.00 0.00 0.00 4.06 1.32 0.00 0.00 0.00 0.00 1.32Lower Jurala-I&II Infirm Power 2.54 2.54 12.32 0.00 0.00 0.00 0.00 12.32 48.45 0.00 0.00 0.00 0.00 48.45TSGENCO Hydel Stations True Up 14-15 0.00 0.00 -14.90 0.00 0.00 0.00 0.00 -14.90 0.00 0.00 0.00 0.00 0.00 0.00
0.00 0.00 0.00 0.00 0.00 0.00 0.00 0.00 0.00TOTAL HYDRO 0.00 0.00 108.33 108.33 213.01 0.00 0.00 0.00 0.00 213.01 19.66 0.00 0.00 0.00 0.00 19.66TOTAL TSGENCO 0.00 0.00 4943.26 5038.88 827.22 1411.65 0.11 0.00 0.00 2238.98 1.64 0.00 0.00 0.00 2.80 4.44
Remarks
Note: 1) Details of NCE Plant wise to be filled in Form 1.4 [i,ii,iii,iv] 2) Hydro cost break up details to be provided based on appropriate methodology. In case it is not possible to segregate the cost Station wise, provide the total details in the empty rows in the TSGENCO Hydro stations section saying ALL TSGENCO Hydro (Combined)
Unit Cost (Rs. / kWh)Availability and Dispatch (MU) Cost (Rs. Crs.)
Page 128 of 195

Central Generating Stations NTPCNTPC (SR) NTPC (SR) 699.52 699.52 34.06 155.94 0.00 0.00 0.00 190.00 0.49 0.00 0.00 0.00 2.23 2.72 NTPC (SR) Stage III 169.96 169.96 14.33 38.03 0.00 0.00 0.00 52.36 0.84 0.00 0.00 0.00 2.24 3.08 Total NTPC(SR) 0.00 0.00 869.48 869.48 48.39 193.97 0.00 0.00 0.00 242.36 0.56 0.00 0.00 0.00 2.23 2.79
NTPC (ER) Farakka 0.00 0.00 0.00 0.00 0.00 0.00 0.00 0.00 0.00 0.00 0.00 0.00 0.00 0.00 Kahalgaon 0.00 0.00 0.00 0.00 0.00 0.00 0.00 0.00 0.00 0.00 0.00 0.00 0.00 0.00 Talcher - Stage 1 0.00 0.00 0.00 0.00 0.00 0.00 0.00 0.00 0.00 0.00 0.00 0.00 0.00 0.00 Talcher Stage 2 471.27 471.27 33.93 60.86 0.00 0.00 0.00 94.78 0.72 0.00 0.00 0.00 1.29 2.01 Others 0.00 0.00 0.00 0.00 0.00 0.00 0.00 0.00 0.00 0.00 0.00 0.00 0.00 0.00 Total NTPC(ER) 0.00 0.00 471.27 471.27 33.92 60.86 0.00 0.00 0.00 94.78 0.72 0.00 0.00 0.00 1.29 2.01
Total NTPC 0.00 0.00 1340.75 1340.75 82.32 254.82 0.00 0.00 0.00 337.14 0.61 0.00 0.00 0.00 1.90 2.51
NLC TS-II Stage-I 108.14 108.14 7.34 25.51 0.00 0.00 0.00 32.84 0.68 0.00 0.00 0.00 2.36 3.04 Stage-II 185.68 185.68 13.17 43.84 0.00 0.00 0.00 57.01 0.71 0.00 0.00 0.00 2.36 3.07 Total NLC 0.00 0.00 293.83 293.83 20.50 69.34 0.00 0.00 0.00 89.85 0.70 0.00 0.00 0.00 2.36 3.06
NPC NPC-MAPS 42.99 42.99 0.00 8.97 0.00 0.00 0.00 8.97 0.00 0.00 0.00 0.00 2.09 2.09 NPC-Kaiga unit I 165.34 165.34 0.00 50.13 0.00 0.00 0.00 50.13 0.00 0.00 0.00 0.00 3.03 3.03 NPC-Kaiga unit II 180.74 180.74 2.03 54.80 0.00 0.00 0.00 56.83 0.11 0.00 0.00 0.00 3.03 3.14 Total NPC 0.00 0.00 389.07 389.07 2.03 113.90 0.00 0.00 0.00 115.93 0.05 0.00 0.00 0.00 2.93 2.98
NTPC - SimhadriNTPC Simhadri Stage I 1025.89 1025.89 110.39 247.68 0.00 0.00 0.00 358.07 1.08 0.00 0.00 0.00 2.41 3.49NTPC Simhadri Stage II 399.99 399.99 60.61 95.58 0.00 0.00 0.00 156.19 1.52 0.00 0.00 0.00 2.39 3.90
Total NTPC- Simhadri 0.00 0.00 1425.89 1425.89 171.00 343.26 0.00 0.00 0.00 514.26 1.20 0.00 0.00 0.00 2.41 3.61
CGS - New Vallur Thermal Power Plant 154.56 154.56 26.14 30.65 0.00 0.00 0.00 56.78 1.69 0.00 0.00 0.00 1.98 3.67
NTPC ARAVALI POWER 505.45 505.45 106.21 179.68 0.00 0.00 0.00 285.89 2.10 0.00 0.00 0.00 3.55 5.66NLC Tamilnadu Power Ltd 121.16 121.16 21.16 28.05 0.00 0.00 0.00 49.21 1.75 0.00 0.00 0.00 2.31 4.06
NTPC NVVNL Bundled Power Coal (NP) 15.54 15.54 0.11 16.49 0.00 0.00 0.00 16.59 0.07 0.00 0.00 0.00 10.61 10.68NTPC NVVNL Bundled Power Solar (NP) 99.35 99.35 0.70 27.27 0.00 0.00 0.00 27.97 0.07 0.00 0.00 0.00 2.75 2.82
TOTAL CGS 0.00 0.00 4345.60 4345.60 430.15 1063.46 0.00 0.00 0.00 1493.61 0.99 0.00 0.00 0.00 2.45 3.44
APGPCLAPGPCL I - Allocated capacity 4.19 4.19 0.23 1.33 0.00 0.00 0.00 1.57 0.56 0.00 0.00 0.00 3.18 3.74APGPCL I - Unutilised capacity 0.00 0.00 0.00 0.00 0.00 0.00 0.00 0.00 0.00 0.00 0.00 0.00 0.00 0.00APGPCL II - Allocated capacity 14.81 14.81 0.52 4.24 0.00 0.00 0.00 4.75 0.35 0.00 0.00 0.00 2.86 3.21APGPCL II - Unutilised capacity 0.00 0.00 0.00 0.00 0.00 0.00 0.00 0.00 0.00 0.00 0.00 0.00 0.00 0.00Total APGPCL 0.00 0.00 19.00 19.00 0.75 5.57 0.00 0.00 0.00 6.32 0.39 0.00 0.00 0.00 2.93 3.33
IPPSGVK 26.95 26.95 4.10 7.64 0.00 0.00 0.00 11.74 1.52 0.00 0.00 0.00 2.84 4.36Spectrum 74.01 74.01 17.37 20.60 0.00 0.00 0.00 37.97 2.35 0.00 0.00 0.00 2.78 5.13Kondapalli (Naphtha) 0.00 0.00 0.00 0.00 0.00 0.00 0.00 0.00 0.00 0.00 0.00 0.00 0.00 0.00Kondapalli (Gas) 30.19 30.19 14.56 9.46 0.00 0.00 0.00 24.02 4.82 0.00 0.00 0.00 3.13 7.96BSES 0.00 0.00 0.00 0.00 0.00 0.00 0.00 0.00 0.00 0.00 0.00 0.00 0.00 0.00GVK Extension 18.86 18.86 0.00 8.86 0.00 0.00 0.00 8.86 0.00 0.00 0.00 0.00 4.70 4.70Vemagiri 24.89 24.89 2.78 9.89 0.00 0.00 0.00 12.67 1.12 0.00 0.00 0.00 3.98 5.09Gautami 32.62 32.62 1.88 11.04 0.00 0.00 0.00 12.92 0.58 0.00 0.00 0.00 3.38 3.96Konaseema 0.00 0.00 0.00 0.00 0.00 0.00 0.00 0.00 0.00 0.00 0.00 0.00 0.00 0.00
0.00 0.00 0.00 0.00 0.00 0.00 0.00 0.00 0.000.00 0.00 0.00 0.00 0.00 0.00 0.00 0.00 0.000.00 0.00 0.00 0.00 0.00 0.00 0.00 0.00 0.000.00 0.00 0.00 0.00 0.00 0.00 0.00 0.00 0.000.00 0.00 0.00 0.00 0.00 0.00 0.00 0.00 0.00
TOTAL IPPS 0.00 0.00 207.51 207.51 40.68 67.50 0.00 0.00 0.00 108.19 1.96 0.00 0.00 0.00 3.25 5.21
NCENCE - Bio-Mass 122.35 122.35 0.00 79.68 0.00 0.00 0.00 79.68 0.00 0.00 0.00 0.00 6.51 6.51NCE - Bagasse 51.63 51.63 0.00 26.85 0.00 0.00 0.00 26.85 0.00 0.00 0.00 0.00 5.20 5.20NCE - Municipal Waste to Energy 0.00 0.00 0.00 0.00 0.00 0.00 0.00 0.00 0.00 0.00 0.00 0.00 0.00 0.00NCE - Industrial Waste based power project 0.00 0.00 0.00 0.00 0.00 0.00 0.00 0.00 0.00 0.00 0.00 0.00 0.00 0.00NCE - Wind Power 0.00 0.00 0.00 0.00 0.00 0.00 0.00 0.00 0.00 0.00 0.00 0.00 0.00 0.00NCE - Mini Hydel 0.06 0.06 0.00 0.01 0.00 0.00 0.00 0.01 0.00 0.00 0.00 0.00 2.33 2.33NCE - NCL Energy Ltd 0.00 0.00 0.00 0.00 0.00 0.00 0.00 0.00 0.00 0.00 0.00 0.00 0.00 0.00NCE-Others 23.56 23.56 0.00 17.39 0.00 0.00 0.00 17.39 0.00 0.00 0.00 0.00 7.38 7.38TOTAL NCE 0.00 0.00 197.60 197.60 0.00 123.94 0.00 0.00 0.00 123.94 0.00 0.00 0.00 0.00 6.27 6.27
OTHERSSrivathsa 0.00 0.00 0.00 0.00 0.00 0.00 0.00 0.00 0.00 0.00 0.00 0.00 0.00 0.00LVS 0.00 0.00 0.00 0.00 0.00 0.00 0.00 0.00 0.00 0.00 0.00 0.00 0.00 0.00Vishakapatnam Steel Plant 0.00 0.00 0.00 0.00 0.00 0.00 0.00 0.00 0.00 0.00 0.00 0.00 0.00 0.00
Page 129 of 195

NB Ferro Alloys 0.00 0.00 0.00 0.00 0.00 0.00 0.00 0.00 0.00 0.00 0.00 0.00 0.00 0.00Corporate Power (MT) 0.00 0.00 0.00 0.00 0.00 0.00 0.00 0.00 0.00 0.00 0.00 0.00 0.00 0.00KSK Mahanadi (MT) 0.00 0.00 0.00 0.00 0.00 0.00 0.00 0.00 0.00 0.00 0.00 0.00 0.00 0.00Hinduja 0.00 0.00 0.00 0.00 0.00 0.00 0.00 0.00 0.00 0.00 0.00 0.00 0.00 0.00Singareni 0.00 0.00 0.00 0.00 0.00 0.00 0.00 0.00 0.00 0.00 0.00 0.00 0.00 0.00Thermal Power 592.14 592.14 117.93 105.46 0.00 0.00 0.00 223.40 1.99 0.00 0.00 0.00 1.78 3.77
0.00 0.00 0.00 0.00 0.00 0.00 0.00 0.00 0.000.00 0.00 0.00 0.00 0.00 0.00 0.00 0.00 0.00
TOTAL OTHERS 0.00 0.00 592.14 592.14 117.93 105.46 0.00 0.00 0.00 223.40 1.99 0.00 0.00 0.00 1.78 3.77
MARKETPTC 0.00 0.00 0.00 0.00 0.00 0.00 0.00 0.00 0.00 0.00 0.00 0.00 0.00 0.00RCL and Short-Term Sources(IG Wells,Kesoram) 0.00 0.00 0.00 0.00 0.00 0.00 0.00 0.00 0.00 0.00 0.00 0.00 0.00 0.00CPDCL 0.00 0.00 0.00 0.00 0.00 0.00 0.00 0.00 0.00 0.00 0.00 0.00 0.00 0.00EPDCL 0.00 0.00 0.00 0.00 0.00 0.00 0.00 0.00 0.00 0.00 0.00 0.00 0.00 0.00NPDCL 0.00 0.00 0.00 0.00 0.00 0.00 0.00 0.00 0.00 0.00 0.00 0.00 0.00 0.00SPDCL 0.00 0.00 0.00 0.00 0.00 0.00 0.00 0.00 0.00 0.00 0.00 0.00 0.00 0.00UI 120.31 120.31 0.00 9.49 0.00 0.00 0.00 9.49 0.00 0.00 0.00 0.00 0.79 0.79Other Short Term Sources 4079.14 4079.14 0.00 2221.00 0.00 0.00 0.00 2221.00 0.00 0.00 0.00 0.00 5.44 5.44Bi-lateral Puchases 0.00 0.00 0.00 0.00 0.00 0.00 0.00 0.00 0.00 0.00 0.00 0.00 0.00 0.00Jhajjar 0.00 0.00 0.00 0.00 0.00 0.00 0.00 0.00 0.00 0.00 0.00 0.00 0.00 0.00Pool Purchase 0.00 0.00 0.00 0.00 0.00 0.00 0.00 0.00 0.00 0.00 0.00 0.00 0.00 0.00Pool Sales 0.00 0.00 0.00 0.00 0.00 0.00 0.00 0.00 0.00 0.00 0.00 0.00 0.00 0.00
0 0.00 0.00 0.00 0.00 0.00 0.00 0.00 0.00 0.000 0.00 0.00 0.00 0.00 0.00 0.00 0.00 0.00 0.000 0.00 0.00 0.00 0.00 0.00 0.00 0.00 0.00 0.00
TOTAL MARKET 0.00 0.00 4199.45 4199.45 0.00 2230.49 0.00 0.00 0.00 2230.49 0.00 0.00 0.00 0.00 5.31 5.31
TOTAL (From All Sources) 0.00 0.00 14504.57 14600.18 1416.74 5008.07 0.11 0.00 0.00 6424.93 0.97 0.00 0.00 0.00 3.43 4.40
2016-17
Generating Station D LinkPlant Type
Must Run = 1Others = 2
Plant Capacity DISCOM's share
DISCOM's share
(MW) (%) (MW) Net Availability Dispatch Fixed Variable Incentive Income Tax Others Total Fixed Incentives Income Tax Others Variable Total
TSGENCOThermalVTPS I 423.17 423.17 34.70 135.41 0.00 0.00 0.00 170.12 0.82 0.00 0.00 0.00 3.20 4.02VTPS II 423.17 419.57 34.70 134.26 0.00 0.00 0.00 168.97 0.83 0.00 0.00 0.00 3.20 4.03VTPS III 423.17 385.31 34.70 123.30 0.00 0.00 0.00 158.00 0.90 0.00 0.00 0.00 3.20 4.10VTPS IV 571.24 571.24 69.13 172.52 0.00 0.00 0.00 241.65 1.21 0.00 0.00 0.00 3.02 4.23RTPP I 439.04 330.43 42.48 125.23 0.00 0.00 0.00 167.72 1.29 0.00 0.00 0.00 3.79 5.08RTPP Stage-II 440.15 440.15 67.45 137.99 0.00 0.00 0.00 205.44 1.53 0.00 0.00 0.00 3.14 4.67RTPP Stage-III 216.55 180.27 45.21 68.32 0.00 0.00 0.00 113.53 2.51 0.00 0.00 0.00 3.79 6.30KTPS A 206.66 206.66 27.91 57.87 0.00 0.93 9.99 96.69 1.35 0.00 0.04 0.48 2.80 4.68KTPS B 206.66 206.66 27.91 57.87 0.00 0.93 9.99 96.69 1.35 0.00 0.04 0.48 2.80 4.68KTPS C 215.78 215.78 27.91 60.42 0.00 0.93 9.99 99.25 1.29 0.00 0.04 0.46 2.80 4.60KTPS D 471.70 471.70 42.29 100.27 0.00 1.94 20.80 165.30 0.90 0.00 0.04 0.44 2.13 3.50KTPS Stage VI 496.59 496.59 89.65 140.58 0.00 1.94 20.80 252.97 1.81 0.00 0.04 0.42 2.83 5.09RTS B 63.32 57.61 7.92 19.15 0.00 0.24 2.60 29.92 1.38 0.00 0.04 0.45 3.32 5.19NTS 0.00 0.00 0.00 0.00 0.00 0.00 0.00 0.00 0.00 0.00 0.00 0.00 0.00 0.00Kakatiya Thermal Power Plant Stage I 479.92 479.92 89.75 127.96 0.00 1.94 20.80 240.46 1.87 0.00 0.04 0.43 2.67 5.01Kakatiya Thermal Power Plant Stage II 901.50 901.50 275.41 239.06 0.00 0.00 0.00 514.47 3.06 0.00 0.00 0.00 2.65 5.71
0.00 0.00 0.00 0.00 0.00 0.00 0.00 0.00 0.00 0.00 0.00 0.00 0.00 0.000.00 0.00 0.00 0.00 0.00 0.00 0.00 0.00 0.000.00 0.00 0.00 0.00 0.00 0.00 0.00 0.00 0.000.00 0.00 0.00 0.00 0.00 0.00 0.00 0.00 0.000.00 0.00 0.00 0.00 0.00 0.00 0.00 0.00 0.000.00 0.00 0.00 0.00 0.00 0.00 0.00 0.00 0.000.00 0.00 0.00 0.00 0.00 0.00 0.00 0.00 0.000.00 0.00 0.00 0.00 0.00 0.00 0.00 0.00 0.000.00 0.00 0.00 0.00 0.00 0.00 0.00 0.00 0.000.00 0.00 0.00 0.00 0.00 0.00 0.00 0.00 0.00
TOTAL THERMAL 0.00 0.00 5978.63 5786.57 917.14 1700.23 0.00 8.83 94.97 2721.17 1.58 0.00 0.02 0.16 2.94 4.70
MACHKUND PH TS Share 20.99 20.99 4.69 0.00 0.00 0.00 0.00 4.69 2.23 0.00 0.00 0.00 0.00 2.23TUNGBHADRA PH TSShare 2.04 2.04 3.20 0.00 0.00 0.00 0.00 3.20 15.69 0.00 0.00 0.00 0.00 15.69USL 0.00 0.00 0.00 0.00 0.00 0.00 0.00 0.00 0.00 0.00 0.00 0.00 0.00 0.00LSR 0.00 0.00 0.00 0.00 0.00 0.00 0.00 0.00 0.00 0.00 0.00 0.00 0.00 0.00DONKARAYI 0.00 0.00 0.00 0.00 0.00 0.00 0.00 0.00 0.00 0.00 0.00 0.00 0.00 0.00SSLM 0.00 0.00 0.00 0.00 0.00 0.00 0.00 0.00 0.00 0.00 0.00 0.00 0.00 0.00NSPH 73.31 73.31 55.35 0.00 0.00 0.00 0.00 55.35 7.55 0.00 0.00 0.00 0.00 7.55NSRCPH 0.00 0.00 0.00 0.00 0.00 0.00 0.00 0.00 0.00 0.00 0.00 0.00 0.00 0.00NSLCPH 3.75 3.75 4.07 0.00 0.00 0.00 0.00 4.07 10.86 0.00 0.00 0.00 0.00 10.86POCHAMPAD PH 7.35 7.35 5.15 0.00 0.00 0.00 0.00 5.15 7.01 0.00 0.00 0.00 0.00 7.01NIZAMSAGAR PH 1.62 1.62 1.91 0.00 0.00 0.00 0.00 1.91 11.81 0.00 0.00 0.00 0.00 11.81PABM 0.00 0.00 0.00 0.00 0.00 0.00 0.00 0.00 0.00 0.00 0.00 0.00 0.00 0.00MINI HYDRO&OTHERS 0.00 0.00 0.00 0.00 0.00 0.00 0.00 0.00 0.00 0.00 0.00 0.00 0.00 0.00SINGUR 1.41 1.41 2.86 0.00 0.00 0.00 0.00 2.86 20.32 0.00 0.00 0.00 0.00 20.32
RemarksCost (Rs. Crs.)
Note: 1) Details of NCE Plant wise to be filled in Form 1.4 [i,ii,iii,iv] 2) Hydro cost break up details to be provided based on appropriate methodology. In case it is not possible to segregate the cost Station wise, provide the total details in the empty rows in the TSGENCO Hydro stations section saying ALL TSGENCO Hydro (Combined)
Availability and Dispatch (MU) Unit Cost (Rs. / kWh)
Page 130 of 195

SSLM LCPH 115.51 115.51 140.59 0.00 0.00 0.00 0.00 140.59 12.17 0.00 0.00 0.00 0.00 12.17Nagarjunasagar Tail Pond Dam Power House 0.00 0.00 0.00 0.00 0.00 0.00 0.00 0.00 0.00 0.00 0.00 0.00 0.00 0.00Priyadarshini Jurala Hydro Electric Project-TSShare 22.00 22.00 18.21 0.00 0.00 0.00 0.00 18.21 8.28 0.00 0.00 0.00 0.00 8.28Lower Jurala Hydro Electric Project 41.57 41.57 63.30 0.00 0.00 0.00 0.00 63.30 15.23 0.00 0.00 0.00 0.00 15.23POCHAMPAD PH Stage 2 2.33 2.33 2.06 0.00 0.00 0.00 0.00 2.06 8.85 0.00 0.00 0.00 0.00 8.85PULICHINTAL(New Project) 8.34 8.34 6.29 0.00 0.00 0.00 0.00 6.29 7.54 0.00 0.00 0.00 0.00 7.54Mini hydel & others 0.45 0.45 1.63 0.00 0.00 0.00 0.00 1.63 36.46 0.00 0.00 0.00 0.00 36.46Ramagiri wind mills 0.00 0.00 0.00 0.00 0.00 0.00 0.00 0.00 0.00 0.00 0.00 0.00 0.00 0.00
0.00 0.00 0.00 0.00 0.00 0.00 0.00 0.00 0.000.00 0.00 0.00 0.00 0.00 0.00 0.00 0.00 0.000.00 0.00 0.00 0.00 0.00 0.00 0.00 0.00 0.000.00 0.00 0.00 0.00 0.00 0.00 0.00 0.00 0.000.00 0.00 0.00 0.00 0.00 0.00 0.00 0.00 0.00
TOTAL HYDRO 0.00 0.00 300.66 300.66 309.32 0.00 0.00 0.00 0.00 309.32 10.29 0.00 0.00 0.00 0.00 10.29TOTAL TSGENCO 0.00 0.00 6279.29 6087.23 1226.46 1700.23 0.00 8.83 94.97 3030.49 2.01 0.00 0.01 0.16 2.79 4.98
Central Generating Stations NTPCNTPC (SR) NTPC (SR) 733.83 733.83 35.84 153.72 1.47 0.00 0.00 191.03 0.49 0.02 0.00 0.00 2.09 2.60 NTPC (SR) Stage III 176.61 176.61 15.06 37.66 0.00 0.00 0.00 52.72 0.85 0.00 0.00 0.00 2.13 2.99 Total NTPC(SR) 0.00 0.00 910.45 910.45 50.90 191.38 1.47 0.00 0.00 243.75 0.56 0.02 0.00 0.00 2.10 2.68
NTPC (ER) Farakka 0.00 0.00 0.00 0.00 0.00 0.00 0.00 0.00 0.00 0.00 0.00 0.00 0.00 0.00 Kahalgaon 0.00 0.00 0.00 0.02 0.00 0.00 0.00 0.02 0.00 0.00 0.00 0.00 0.00 0.00 Talcher - Stage 1 0.00 0.00 0.01 0.00 0.00 0.00 0.00 0.01 0.00 0.00 0.00 0.00 0.00 0.00 Talcher Stage 2 469.02 469.02 35.27 75.13 0.65 0.00 0.00 111.05 0.75 0.01 0.00 0.00 1.60 2.37 Others 0.00 0.00 0.00 0.00 0.00 0.00 0.00 0.00 0.00 0.00 0.00 0.00 0.00 0.00 Total NTPC(ER) 0.00 0.00 469.02 469.02 35.29 75.15 0.65 0.00 0.00 111.09 0.75 0.01 0.00 0.00 1.60 2.37
Total NTPC 0.00 0.00 1379.47 1379.47 86.19 266.53 2.12 0.00 0.00 354.84 0.62 0.02 0.00 0.00 1.93 2.57
NLC TS-II Stage-I 86.59 78.28 6.88 23.09 0.00 0.00 0.00 29.97 0.88 0.00 0.00 0.00 2.95 3.83 Stage-II 172.65 172.65 14.49 52.90 0.02 0.00 0.00 67.41 0.84 0.00 0.00 0.00 3.06 3.90 Total NLC 0.00 0.00 259.24 250.93 21.37 75.99 0.02 0.00 0.00 97.38 0.85 0.00 0.00 0.00 3.03 3.88
NPC NPC-MAPS 38.20 38.20 0.00 8.32 0.00 0.00 0.00 8.32 0.00 0.00 0.00 0.00 2.18 2.18 NPC-Kaiga unit I 137.71 137.71 0.00 43.05 0.00 0.00 0.00 43.05 0.00 0.00 0.00 0.00 3.13 3.13 NPC-Kaiga unit II 132.60 132.60 0.00 41.24 0.00 0.00 0.00 41.24 0.00 0.00 0.00 0.00 3.11 3.11 Total NPC 0.00 0.00 308.51 308.51 0.00 92.61 0.00 0.00 0.00 92.61 0.00 0.00 0.00 0.00 3.00 3.00
NTPC - SimhadriNTPC Simhadri Stage I 1139.88 1139.88 99.40 306.14 0.50 0.00 0.00 406.05 0.87 0.00 0.00 0.00 2.69 3.56NTPC Simhadri Stage II 460.78 460.78 69.95 119.11 0.00 0.00 0.00 189.07 1.52 0.00 0.00 0.00 2.59 4.10
Total NTPC- Simhadri 0.00 0.00 1600.66 1600.66 169.36 425.26 0.50 0.00 0.00 595.12 1.06 0.00 0.00 0.00 2.66 3.72
CGS - New Vallur Thermal Power Plant 200.74 200.74 34.94 43.59 0.05 0.00 0.00 78.57 1.74 0.00 0.00 0.00 2.17 3.91 Tuticorin 266.97 266.97 45.10 61.22 0.00 0.00 0.02 106.34 1.69 0.00 0.00 0.00 2.29 3.98NVVNL Bundled Power -SOLAR 13.69 13.69 0.00 13.85 0.00 0.00 0.00 13.85 0.00 0.00 0.00 0.00 10.12 10.12NVVNL Bundled Power -COAL 13.01 13.01 0.00 29.00 0.00 0.00 0.00 29.00 0.00 0.00 0.00 0.00 22.29 22.29
Kudigi 97.68 97.68 3.16 2.59 0.00 0.00 0.00 5.75 0.32 0.00 0.00 0.00 0.26 0.59
TOTAL CGS 0.00 0.00 4139.98 4131.67 360.12 1010.63 2.69 0.00 0.02 1373.45 0.87 0.01 0.00 0.00 2.45 3.32
APGPCLAPGPCL I - Allocated capacity 4.26 4.26 0.50 1.21 0.00 0.00 0.00 1.71 1.18 0.00 0.00 0.00 2.84 4.03APGPCL I - Unutilised capacity 0.00 0.00 0.00 0.00 0.00 0.00 0.00 0.00 0.00 0.00 0.00 0.00 0.00 0.00APGPCL II - Allocated capacity 15.63 15.63 0.86 3.64 0.00 0.00 0.00 4.50 0.55 0.00 0.00 0.00 2.33 2.88APGPCL II - Unutilised capacity 0.00 0.00 0.00 0.00 0.00 0.00 0.00 0.00 0.00 0.00 0.00 0.00 0.00 0.00Total APGPCL 0.00 0.00 19.88 19.88 1.37 4.85 0.00 0.00 0.00 6.22 0.69 0.00 0.00 0.00 2.44 3.13
IPPSGVK 0.00 0.00 0.00 0.00 0.00 0.00 0.00 0.00 0.00 0.00 0.00 0.00 0.00 0.00Spectrum 0.00 0.00 0.00 0.00 0.00 0.00 0.00 0.00 0.00 0.00 0.00 0.00 0.00 0.00Kondapalli (Naphtha) 0.00 0.00 0.00 0.00 0.00 0.00 0.00 0.00 0.00 0.00 0.00 0.00 0.00 0.00Kondapalli (Gas) 0.00 0.00 0.00 0.00 0.00 25.90 0.00 25.90 0.00 0.00 0.00 0.00 0.00 0.00BSES 0.00 0.00 0.00 0.00 0.00 0.00 0.00 0.00 0.00 0.00 0.00 0.00 0.00 0.00GVK Extension 11.63 11.63 0.00 5.40 0.00 0.00 0.00 5.40 0.00 0.00 0.00 0.00 4.65 4.65Vemagiri 0.00 0.00 0.00 0.00 0.00 0.00 0.00 0.00 0.00 0.00 0.00 0.00 0.00 0.00Gautami 0.00 0.00 0.00 0.00 0.00 0.00 0.00 0.00 0.00 0.00 0.00 0.00 0.00 0.00Konaseema 0.00 0.00 0.00 0.00 0.00 0.00 0.00 0.00 0.00 0.00 0.00 0.00 0.00 0.00Pioneer Gas Power Limited 0.00 104.39 0.00 49.06 0.00 0.00 0.00 49.06 0.00 0.00 0.00 0.00 4.70 4.70
0.00 0.00 0.00 0.00 0.00 0.00 0.00 0.00 0.00 0.00 0.00 0.00 0.00 0.000.00 0.00 0.00 0.00 0.00 0.00 0.00 0.00 0.000.00 0.00 0.00 0.00 0.00 0.00 0.00 0.00 0.000.00 0.00 0.00 0.00 0.00 0.00 0.00 0.00 0.00
TOTAL IPPS 0.00 0.00 11.63 116.02 0.00 54.46 0.00 25.90 0.00 80.36 0.00 0.00 2.23 0.00 4.69 6.93
NCE
Page 131 of 195

NCE - Bio-Mass 97.70 97.70 21.56 55.64 0.00 0.00 0.00 77.20 2.21 0.00 0.00 0.00 5.70 7.90NCE - Bagasse 0.01 0.01 0.00 0.00 0.00 0.00 0.00 0.01 1.39 0.00 0.00 0.00 3.28 4.67NCE - Municipal Waste to Energy 0.00 0.00 0.00 0.00 0.00 0.00 0.00 0.00 0.00 0.00 0.00 0.00 0.00 0.00NCE - Industrial Waste based power project 0.00 0.00 0.00 0.00 0.00 0.00 0.00 0.00 0.00 0.00 0.00 0.00 0.00 0.00NCE - Wind Power 0.00 0.00 0.00 0.00 0.00 0.00 0.00 0.00 0.00 0.00 0.00 0.00 0.00 0.00NCE - Mini Hydel 0.00 0.00 0.00 0.00 0.00 0.00 0.00 0.00 0.00 0.00 0.00 0.00 0.00 0.00NCE - NCL Energy Ltd 0.00 0.00 0.00 0.00 0.00 0.00 0.00 0.00 0.00 0.00 0.00 0.00 0.00 0.00NCE-Others 86.25 86.25 0.00 58.73 0.00 0.00 0.00 58.73 0.00 0.00 0.00 0.00 6.81 6.81TOTAL NCE 0.00 0.00 183.96 183.96 21.56 114.38 0.00 0.00 0.00 135.94 1.17 0.00 0.00 0.00 6.22 7.39
OTHERSSrivathsa 0.00 0.00 0.00 0.00 0.00 0.00 0.00 0.00 0.00 0.00 0.00 0.00 0.00 0.00LVS 0.00 0.00 0.00 0.00 0.00 0.00 0.00 0.00 0.00 0.00 0.00 0.00 0.00 0.00Vishakapatnam Steel Plant 0.00 0.00 0.00 0.00 0.00 0.00 0.00 0.00 0.00 0.00 0.00 0.00 0.00 0.00NB Ferro Alloys 0.00 0.00 0.00 0.00 0.00 0.00 0.00 0.00 0.00 0.00 0.00 0.00 0.00 0.00KSK Mahanadi (MT) 0.00 0.00 0.00 0.00 0.00 0.00 0.00 0.00 0.00 0.00 0.00 0.00 0.00 0.00Singareni 682.28 682.28 134.07 151.06 0.00 9.21 0.05 294.39 1.97 0.00 0.14 0.00 2.21 4.31Thermal Power Unit 1 542.34 542.34 100.73 99.74 0.00 0.00 0.00 200.47 1.86 0.00 0.00 0.00 1.84 3.70Thermal Power Unit 2 379.71 379.71 91.34 77.84 0.00 6.28 0.05 175.51 2.41 0.00 0.17 0.00 2.05 4.62TOTAL OTHERS 0.00 0.00 2772.70 2772.70 610.26 523.78 0.00 15.49 0.10 1149.62 2.20 0.00 0.06 0.00 1.89 4.15
MARKETPTC 0.00 0.00 0.00 0.00 0.00 0.00 0.00 0.00 0.00RCL and Short-Term Sources(IG Wells,Kesoram) 0.00 0.00 0.00 0.00 0.00 0.00 0.00 0.00 0.00CPDCL 0.00 0.00 0.00 0.00 0.00 0.00 0.00 0.00 0.00EPDCL 0.00 0.00 0.00 0.00 0.00 0.00 0.00 0.00 0.00NPDCL 0.00 0.00 0.00 0.00 0.00 0.00 0.00 0.00 0.00SPDCL 0.00 0.00 0.00 0.00 0.00 0.00 0.00 0.00 0.00UI 0.00 0.00 0.00 0.00 0.00 0.00 0.00 0.00 0.00Other Short Term Sources 3686.42 1244.10 0.00 756.41 0.00 0.00 0.00 756.41 0.00 0.00 0.00 0.00 6.08 6.08NTPC - Aravali Power Co. Pvt Ltd 22.00 22.00 1.94 6.79 0.00 0.00 0.00 8.73 0.88 0.00 0.00 0.00 3.09 3.97D-D Sales/Bilateral Purchases 0.00 122.64 0.00 60.33 0.00 0.00 0.00 60.33 0.00 0.00 0.00 0.00 4.92 4.92Interstate sale 0.00 0.00 0.00 0.00 0.00 0.00 0.00 0.00 0.00
0.00 0.00 0.00 0.00 0.00 0.00 0.00 0.00 0.000.00 0.00 0.00 0.00 0.00 0.00 0.00 0.00 0.000.00 0.00 0.00 0.00 0.00 0.00 0.00 0.00 0.000.00 0.00 0.00 0.00 0.00 0.00 0.00 0.00 0.000.00 0.00 0.00 0.00 0.00 0.00 0.00 0.00 0.00
TOTAL MARKET 0.00 0.00 3708.41 1388.74 1.94 823.53 0.00 0.00 0.00 825.47 0.01 0.00 0.00 0.00 5.93 5.94
TOTAL (From All Sources) 0.00 0.00 17115.86 14700.20 2221.70 4231.86 2.69 50.22 95.09 6601.55 1.51 0.00 0.03 0.06 2.88 4.49 6592.83
2017-18
Generating Station D LinkPlant Type
Must Run = 1Others = 2
Plant Capacity DISCOM's share
DISCOM's share
(MW) (%) (MW) Net Availability Dispatch Fixed Variable Incentive Income Tax Others Total Fixed Incentives Income Tax Others Variable Total
TSGENCOThermalVTPS I 426.24 127.05 35.63 41.47 0.00 0.00 0.00 77.10 2.80 0.00 0.00 0.00 3.26 6.07VTPS II 426.24 75.57 35.63 24.67 0.00 0.00 0.00 60.29 4.71 0.00 0.00 0.00 3.26 7.98VTPS III 426.24 75.51 35.63 24.64 0.00 0.00 0.00 60.27 4.72 0.00 0.00 0.00 3.26 7.98VTPS IV 514.38 292.45 72.47 87.49 0.00 0.00 0.00 159.97 2.48 0.00 0.00 0.00 2.99 5.47RTPP I 425.07 37.65 43.07 13.68 0.00 0.00 0.00 56.75 11.44 0.00 0.00 0.00 3.63 15.07RTPP Stage-II 425.07 194.98 65.76 62.35 0.00 0.00 0.00 128.11 3.37 0.00 0.00 0.00 3.20 6.57RTPP Stage-III 212.54 25.95 43.95 9.43 0.00 0.00 0.00 53.37 16.94 0.00 0.00 0.00 3.63 20.57KTPS A 241.03 241.03 29.69 60.26 0.00 0.00 11.01 100.96 1.23 0.00 0.00 0.46 2.50 4.19KTPS B 241.03 241.03 29.69 60.26 0.00 0.00 11.01 100.96 1.23 0.00 0.00 0.46 2.50 4.19KTPS C 241.03 241.03 29.69 60.26 0.00 0.00 11.01 100.96 1.23 0.00 0.00 0.46 2.50 4.19KTPS D 506.04 506.04 49.51 109.72 0.00 0.00 22.94 182.18 0.98 0.00 0.00 0.45 2.17 3.60KTPS Stage VI 514.38 514.38 89.59 128.59 0.00 0.00 22.94 241.13 1.74 0.00 0.00 0.45 2.50 4.69RTS B 63.25 11.21 8.10 3.80 0.00 0.00 2.87 14.77 7.23 0.00 0.00 2.56 3.39 13.18NTS 0.00 0.00 0.00 0.00 0.00 0.00 0.00 0.00 0.00 0.00 0.00 0.00 0.00 0.00Kakatiya Thermal Power Plant Stage I 514.38 514.38 89.55 128.59 0.00 0.00 22.94 241.09 1.74 0.00 0.00 0.45 2.50 4.69Kakatiya Thermal Power Plant Stage II 1145.40 1145.40 311.85 286.35 0.00 0.00 0.00 598.20 2.72 0.00 0.00 0.00 2.50 5.22Damodaram Sanjeevaiah Thermal power plant 0.00 0.00 0.00 0.00 0.00 0.00 0.00 0.00 0.00 0.00 0.00 0.00 0.00 0.00
0.00 0.00 0.00 0.00 0.00 0.00 0.00 0.00 0.000.00 0.00 0.00 0.00 0.00 0.00 0.00 0.00 0.000.00 0.00 0.00 0.00 0.00 0.00 0.00 0.00 0.000.00 0.00 0.00 0.00 0.00 0.00 0.00 0.00 0.000.00 0.00 0.00 0.00 0.00 0.00 0.00 0.00 0.000.00 0.00 0.00 0.00 0.00 0.00 0.00 0.00 0.000.00 0.00 0.00 0.00 0.00 0.00 0.00 0.00 0.000.00 0.00 0.00 0.00 0.00 0.00 0.00 0.00 0.000.00 0.00 0.00 0.00 0.00 0.00 0.00 0.00 0.00
TOTAL THERMAL 0.00 0.00 6322.31 4243.63 969.80 1101.56 0.00 0.00 104.74 2176.10 2.29 0.00 0.00 0.25 2.60 5.13
MACHKUND PH TS Share 17.77 17.77 4.87 0.00 0.00 0.00 0.00 4.87 2.74 0.00 0.00 0.00 0.00 2.74
Availability and Dispatch (MU) Cost (Rs. Crs.) Unit Cost (Rs. / kWh) Remarks
Note: 1) Details of NCE Plant wise to be filled in Form 1.4 [i,ii,iii,iv] 2) Hydro cost break up details to be provided based on appropriate methodology. In case it is not possible to segregate the cost Station wise, provide the total details in the empty rows in the TSGENCO Hydro stations section saying ALL TSGENCO Hydro (Combined)
Page 132 of 195

TUNGBHADRA PH TS Share 7.87 7.87 3.34 0.00 0.00 0.00 0.00 3.34 4.24 0.00 0.00 0.00 0.00 4.24USL 0.00 0.00 0.00 0.00 0.00 0.00 0.00 0.00 0.00 0.00 0.00 0.00 0.00 0.00LSR 0.00 0.00 0.00 0.00 0.00 0.00 0.00 0.00 0.00 0.00 0.00 0.00 0.00 0.00DONKARAYI 0.00 0.00 0.00 0.00 0.00 0.00 0.00 0.00 0.00 0.00 0.00 0.00 0.00 0.00SSLM 0.00 0.00 0.00 0.00 0.00 0.00 0.00 0.00 0.00 0.00 0.00 0.00 0.00 0.00NSPH 145.31 145.31 71.25 0.00 0.00 0.00 0.00 71.25 4.90 0.00 0.00 0.00 0.00 4.90NSRCPH 0.00 0.00 0.00 0.00 0.00 0.00 0.00 0.00 0.00 0.00 0.00 0.00 0.00 0.00NSLCPH 6.68 6.68 5.24 0.00 0.00 0.00 0.00 5.24 7.85 0.00 0.00 0.00 0.00 7.85POCHAMPAD PH 5.49 5.49 5.63 0.00 0.00 0.00 0.00 5.63 10.26 0.00 0.00 0.00 0.00 10.26NIZAMSAGAR PH 2.53 2.53 2.08 0.00 0.00 0.00 0.00 2.08 8.24 0.00 0.00 0.00 0.00 8.24PABM 0.00 0.00 0.00 0.00 0.00 0.00 0.00 0.00 0.00 0.00 0.00 0.00 0.00 0.00MINI HYDRO&OTHERS 0.00 0.00 0.00 0.00 0.00 0.00 0.00 0.00 0.00 0.00 0.00 0.00 0.00 0.00SINGUR 2.61 2.61 3.13 0.00 0.00 0.00 0.00 3.13 11.97 0.00 0.00 0.00 0.00 11.97SSLM LCPH 139.12 139.12 141.76 0.00 0.00 0.00 0.00 141.76 10.19 0.00 0.00 0.00 0.00 10.19Nagarjunasagar Tail Pond Dam Power House 0.00 0.00 0.00 0.00 0.00 0.00 0.00 0.00 0.00 0.00 0.00 0.00 0.00 0.00Priyadarshini Jurala Hydro Electric Project- TS Share 18.90 18.90 18.84 0.00 0.00 0.00 0.00 18.84 9.97 0.00 0.00 0.00 0.00 9.97Lower Jurala Hydro Electric Project 13.64 13.64 116.39 0.00 0.00 0.00 0.00 116.39 85.35 0.00 0.00 0.00 0.00 85.35POCHAMPAD Stig-II 0.00 1.83 2.60 0.00 0.00 0.00 0.00 2.60 14.21 0.00 0.00 0.00 0.00 14.21PULICHINTAL(New Project) 0.00 44.68 38.47 0.00 0.00 0.00 0.00 38.47 8.61 0.00 0.00 0.00 0.00 8.61Mini Hydel & Others (Peddapalli, Palair) 412.28 5.86 2.67 0.00 0.00 0.00 0.00 2.67 4.55 0.00 0.00 0.00 0.00 4.55Ramagiri Wind Mills (AP) 6734.59 0.00 0.00 0.00 0.00 0.00 0.00 0.00 0.00 0.00 0.00 0.00 0.00 0.00
0.00 0.00 0.00 0.00 0.00 0.00 0.00 0.00 0.000.00 0.00 0.00 0.00 0.00 0.00 0.00 0.00 0.000.00 0.00 0.00 0.00 0.00 0.00 0.00 0.00 0.000.00 0.00 0.00 0.00 0.00 0.00 0.00 0.00 0.000.00 0.00 0.00 0.00 0.00 0.00 0.00 0.00 0.00
TOTAL HYDRO 0.00 0.00 7506.79 412.28 416.25 0.00 0.00 0.00 0.00 416.25 10.10 0.00 0.00 0.00 0.00 10.10TOTAL TSGENCO 0.00 0.00 13829.09 4655.92 1386.05 1101.56 0.00 0.00 104.74 2592.35 2.98 0.00 0.00 0.22 2.37 5.57
Central Generating Stations NTPCNTPC (SR) NTPC (SR) 734.20 734.20 40.68 151.83 0.00 0.00 0.00 192.52 0.55 0.00 0.00 0.00 2.07 2.62 NTPC (SR) Stage III 185.38 185.38 16.84 37.65 0.00 0.00 0.00 54.49 0.91 0.00 0.00 0.00 2.03 2.94 Total NTPC(SR) 0.00 0.00 919.59 919.59 57.52 189.48 0.00 0.00 0.00 247.01 0.63 0.00 0.00 0.00 2.06 2.69
NTPC (ER) Farakka 0.00 0.00 0.00 0.00 0.00 0.00 0.00 0.00 0.00 0.00 0.00 0.00 0.00 0.00 Kahalgaon 0.00 0.00 0.00 0.00 0.00 0.00 0.00 0.00 0.00 0.00 0.00 0.00 0.00 0.00 Talcher - Stage 1 0.00 0.00 0.00 0.00 0.00 0.00 0.00 0.00 0.00 0.00 0.00 0.00 0.00 0.00 Talcher Stage 2 467.07 467.07 32.35 69.46 0.00 0.00 0.00 101.81 0.69 0.00 0.00 0.00 1.49 2.18 Others 0.00 0.00 0.00 0.00 0.00 0.00 0.00 0.00 0.00 0.00 0.00 0.00 0.00 0.00 Total NTPC(ER) 0.00 0.00 467.07 467.07 32.35 69.46 0.00 0.00 0.00 101.81 0.69 0.00 0.00 0.00 1.49 2.18
Total NTPC 0.00 0.00 1386.66 1386.66 89.88 258.95 0.00 0.00 0.00 348.82 0.65 0.00 0.00 0.00 1.87 2.52
NLC TS-II Stage-I 92.47 15.07 7.26 5.22 0.00 0.00 0.00 12.48 4.82 0.00 0.00 0.00 3.47 8.28 Stage-II 170.79 5.52 17.63 2.07 0.00 0.00 0.00 19.70 31.94 0.00 0.00 0.00 3.75 35.69 Total NLC 0.00 0.00 263.26 20.59 24.89 7.29 0.00 0.00 0.00 32.18 12.09 0.00 0.00 0.00 3.54 15.63
NPC NPC-MAPS 40.54 40.54 0.00 8.56 0.00 0.00 0.00 8.56 0.00 0.00 0.00 0.00 2.11 2.11 NPC-Kaiga unit I 135.75 135.75 0.00 42.52 0.00 0.00 0.00 42.52 0.00 0.00 0.00 0.00 3.13 3.13 NPC-Kaiga unit II 135.75 135.75 0.00 42.52 0.00 0.00 0.00 42.52 0.00 0.00 0.00 0.00 3.13 3.13 Total NPC 0.00 0.00 312.03 312.03 0.00 93.61 0.00 0.00 0.00 93.61 0.00 0.00 0.00 0.00 3.00 3.00
NTPC - SimhadriNTPC Simhadri Stage I 1119.64 1061.94 100.17 288.31 0.00 0.00 0.00 388.48 0.94 0.00 0.00 0.00 2.71 3.66NTPC Simhadri Stage II 514.22 383.24 76.73 104.70 0.00 0.00 0.00 181.44 2.00 0.00 0.00 0.00 2.73 4.73
Total NTPC- Simhadri 0.00 0.00 1633.86 1445.17 176.90 393.02 0.00 0.00 0.00 569.92 1.22 0.00 0.00 0.00 2.72 3.94
CGS - New Vallur Thermal Power Plant 222.20 222.20 31.73 46.24 0.00 0.00 0.00 77.97 1.43 0.00 0.00 0.00 2.08 3.51 Tuticorin 311.85 311.85 46.40 72.19 0.00 0.00 0.05 118.65 1.49 0.00 0.00 0.00 2.32 3.80NVVNL Bundled Power -SOLAR 12.89 12.89 0.00 13.76 0.00 0.00 0.00 13.76 0.00 0.00 0.00 0.00 10.68 10.68NVVNL Bundled Power -COAL 99.07 99.07 0.00 29.04 0.00 0.00 0.00 29.04 0.00 0.00 0.00 0.00 2.93 2.93Kudigi 302.30 302.30 69.83 57.13 0.00 0.00 0.00 126.97 2.31 0.00 0.00 0.00 1.89 4.20
TOTAL CGS 0.00 0.00 4544.11 4112.76 439.62 971.23 0.00 0.00 0.05 1410.91 1.07 0.00 0.00 0.00 2.36 3.43
APGPCLAPGPCL I - Allocated capacity 5.89 5.89 0.22 1.37 0.00 0.00 0.00 1.59 0.38 0.00 0.00 0.00 2.33 2.71APGPCL I - Unutilised capacity 0.00 0.00 0.00 0.00 0.00 0.00 0.00 0.00 0.00 0.00 0.00 0.00 0.00 0.00APGPCL II - Allocated capacity 21.06 21.06 0.89 4.38 0.00 0.00 0.00 5.27 0.42 0.00 0.00 0.00 2.08 2.50APGPCL II - Unutilised capacity 0.00 0.00 0.00 0.00 0.00 0.00 0.00 0.00 0.00 0.00 0.00 0.00 0.00 0.00Total APGPCL 0.00 0.00 26.95 26.95 1.12 5.75 0.00 0.00 0.00 6.87 0.41 0.00 0.00 0.00 2.13 2.55
IPPSGVK 0.00 0.00 0.00 0.00 0.00 0.00 0.00 0.00 0.00 0.00 0.00 0.00 0.00 0.00Spectrum 0.00 0.00 0.00 0.00 0.00 0.00 0.00 0.00 0.00 0.00 0.00 0.00 0.00 0.00Kondapalli (Naphtha) 0.00 0.00 0.00 0.00 0.00 0.00 0.00 0.00 0.00 0.00 0.00 0.00 0.00 0.00Kondapalli (Gas) 0.00 0.00 0.00 0.00 0.00 0.00 0.00 0.00 0.00 0.00 0.00 0.00 0.00 0.00
Page 133 of 195

BSES 0.00 0.00 0.00 0.00 0.00 0.00 0.00 0.00 0.00 0.00 0.00 0.00 0.00 0.00GVK Extension 0.00 0.00 0.00 0.00 0.00 0.00 0.00 0.00 0.00 0.00 0.00 0.00 0.00 0.00Vemagiri 0.00 0.00 0.00 0.00 0.00 0.00 0.00 0.00 0.00 0.00 0.00 0.00 0.00 0.00Gautami 0.00 0.00 0.00 0.00 0.00 0.00 0.00 0.00 0.00 0.00 0.00 0.00 0.00 0.00Konaseema 0.00 0.00 0.00 0.00 0.00 0.00 0.00 0.00 0.00 0.00 0.00 0.00 0.00 0.00
0.00 0.00 0.00 0.00 0.00 0.00 0.00 0.00 0.000.00 0.00 0.00 0.00 0.00 0.00 0.00 0.00 0.000.00 0.00 0.00 0.00 0.00 0.00 0.00 0.00 0.000.00 0.00 0.00 0.00 0.00 0.00 0.00 0.00 0.000.00 0.00 0.00 0.00 0.00 0.00 0.00 0.00 0.00
TOTAL IPPS 0.00 0.00 0.00 0.00 0.00 0.00 0.00 0.00 0.00 0.00 0.00 0.00 0.00 0.00 0.00 0.00
NCENCE - Bio-Mass 95.22 95.22 14.15 41.61 0.00 0.00 0.00 55.76 1.49 0.00 0.00 0.00 4.37 5.86NCE - Bagasse 1.57 1.57 0.22 0.44 0.00 0.00 0.00 0.66 1.41 0.00 0.00 0.00 2.78 4.19NCE - Municipal Waste to Energy 61.50 61.50 20.91 23.55 0.00 0.00 0.00 44.46 3.40 0.00 0.00 0.00 3.83 7.23NCE - Industrial Waste based power project 0.00 0.00 0.00 0.00 0.00 0.00 0.00 0.00 0.00 0.00 0.00 0.00 0.00 0.00NCE - Wind Power 0.00 0.00 0.00 0.00 0.00 0.00 0.00 0.00 0.00 0.00 0.00 0.00 0.00 0.00NCE - Mini Hydel 0.00 0.00 0.00 0.00 0.00 0.00 0.00 0.00 0.00 0.00 0.00 0.00 0.00 0.00NCE - NCL Energy Ltd 0.00 0.00 0.00 0.00 0.00 0.00 0.00 0.00 0.00 0.00 0.00 0.00 0.00 0.00NCE-Others 1385.01 1385.01 0.00 808.84 0.00 0.00 0.00 808.84 0.00 0.00 0.00 0.00 5.84 5.84TOTAL NCE 0.00 0.00 1543.29 1543.29 35.28 874.44 0.00 0.00 0.00 909.73 0.23 0.00 0.00 0.00 5.67 5.89
OTHERSSrivathsa 0.00 0.00 0.00 0.00 0.00 0.00 0.00 0.00 0.00 0.00 0.00 0.00 0.00 0.00LVS 0.00 0.00 0.00 0.00 0.00 0.00 0.00 0.00 0.00 0.00 0.00 0.00 0.00 0.00Vishakapatnam Steel Plant 0.00 0.00 0.00 0.00 0.00 0.00 0.00 0.00 0.00 0.00 0.00 0.00 0.00 0.00NB Ferro Alloys 0.00 0.00 0.00 0.00 0.00 0.00 0.00 0.00 0.00 0.00 0.00 0.00 0.00 0.00Corporate Power (MT) 0.00 0.00 0.00 0.00 0.00 0.00 0.00 0.00 0.00 0.00 0.00 0.00 0.00 0.00Singareni Unit I 0.00 1145.40 246.26 206.17 0.00 0.00 0.00 452.43 2.15 0.00 0.00 0.00 1.80 3.95Thermal Power Unit 1 1145.40 552.44 105.17 104.41 0.00 0.00 0.00 209.58 1.90 0.00 0.00 0.00 1.89 3.79CSPGCL 552.44 1908.99 515.43 229.08 0.00 0.00 0.00 744.51 2.70 0.00 0.00 0.00 1.20 3.90Thermal Power Unit 2 1908.99 1168.63 295.66 212.69 0.00 0.00 0.00 508.36 2.53 0.00 0.00 0.00 1.82 4.35Manuguru Thermal Power Plant 0.00 0.00 0.00 0.00 0.00 0.00 0.00 0.00 0.00 0.00 0.00 0.00 0.00 0.00Singareni Unit II 1145.40 1145.40 246.26 206.17 0.00 0.00 0.00 452.43 2.15 0.00 0.00 0.00 1.80 3.95
TOTAL OTHERS 0.00 0.00 4752.22 5920.86 1408.78 958.52 0.00 0.00 0.00 2367.31 2.38 0.00 0.00 0.00 1.62 4.00
MARKETPTC 0.00 0.00 0.00 0.00 0.00 0.00 0.00 0.00 0.00RCL and Short-Term Sources(IG Wells,Kesoram) 0.00 0.00 0.00 0.00 0.00 0.00 0.00 0.00 0.00CPDCL 0.00 0.00 0.00 0.00 0.00 0.00 0.00 0.00 0.00EPDCL 0.00 0.00 0.00 0.00 0.00 0.00 0.00 0.00 0.00NPDCL 0.00 0.00 0.00 0.00 0.00 0.00 0.00 0.00 0.00SPDCL 0.00 0.00 0.00 0.00 0.00 0.00 0.00 0.00 0.00UI 0.00 0.00 0.00 0.00 0.00 0.00 0.00 0.00 0.00Other Short Term Sources 823.66 0.00 0.00 0.00 0.00 0.00 0.00 0.00 0.00 0.00 0.00 0.00 0.00 0.00NTPC - Aravali Power Co. Pvt Ltd 0.00 0.00 0.00 0.00 0.00 0.00 0.00 0.00 0.00 0.00 0.00 0.00 0.00 0.00D-D Sales/Bilateral Purchases 0.00 63.33 0.00 39.28 0.00 0.00 0.00 39.28 0.00 0.00 0.00 0.00 6.20 6.20
0.00 0.00 0.00 0.00 0.00 0.00 0.00 0.00 0.000.00 0.00 0.00 0.00 0.00 0.00 0.00 0.00 0.00
Bi-lateral Purchases( PTC etc.) 0.00 0.00 0.00 0.00 0.00 0.00 0.00 0.00 0.00Pool Transaction (Purchases) 0.00 0.00 0.00 0.00 0.00 0.00 0.00 0.00 0.00Pool Transaction ( Sales) 0.00 0.00 0.00 0.00 0.00 0.00 0.00 0.00 0.00
0.00 0.00 0.00 0.00 0.00 0.00 0.00 0.00 0.00TOTAL MARKET 0.00 0.00 823.66 63.33 0.00 39.28 0.00 0.00 0.00 39.28 0.00 0.00 0.00 0.00 6.20 6.20
TOTAL (From All Sources) 0.00 0.00 25519.34 16323.11 3270.85 3950.79 0.00 0.00 104.79 7326.43 2.00 0.00 0.00 0.06 2.42 4.49 7326.43
1) Details of NCE Plant wise to be filled in Form 1.4 [i,ii,iii,iv] 2) Hydro cost break up details to be provided based on appropriate methodology. In case it is not possible to segregate the cost
Page 134 of 195

Form 1.4(i) NCE Generation (Base Year) 2013-14
Plant Capacity
DISCOM's share
DISCOM's share
(MW) (%) (MW) Net Availability Dispatch Fixed Variable Incentive Inc. Tax Others Total Fixed Incentives Inc. Tax Others Variable TotalBio-Mass Gowthami Bio Energy Ltd Gopalpuram6.00 100.00 6.00 41.60 41.60 0.00 38.48 38.48 0.00 0.00 0.00 0.00 9.25 9.25Bio-Mass Shalivahana Green Energy Ltd Mancherial 6.00 100.00 6.00 23.22 23.22 0.00 28.76 28.76 0.00 0.00 0.00 0.00 12.39 12.39Bio-Mass Ritwik Power Projects Pvt. Limited Tekulapalli 6.00 100.00 6.00 33.05 33.05 0.00 32.81 32.81 0.00 0.00 0.00 0.00 9.93 9.93Bio-Mass Indur Green Power Ltd.(NSL) Renjal/Niza6.00 100.00 6.00 3.03 3.03 0.00 16.88 16.88 0.00 0.00 0.00 0.00 55.61 55.61Bio-Mass 0.00 0.00 0.00 0.00 0.00 0.00 0.00
TOTAL Bio-mass 24.00 24.00 100.90 100.90 0.00 116.92 0.00 0.00 0.00 116.92 0.00 0.00 0.00 0.00 11.59 11.59Bagasse NCS Sugars Ltd Dichpally/N6.00 100.00 6.00 5.05 5.05 0.00 1.29 1.29 0.00 0.00 0.00 0.00 2.56 2.56Bagasse Kakatiya Cement Sugar & Ind. Ltd Kalluru/Kha16.70 100.00 16.70 82.98 82.98 0.00 19.67 19.67 0.00 0.00 0.00 0.00 2.37 2.37Bagasse Nizam Daccan Sugars Ltd. Bhodhan/N20.00 100.00 20.00 20.21 20.21 0.00 7.96 7.96 0.00 0.00 0.00 0.00 3.94 3.94Bagasse GSR Sugars Ltd Bhodhan/N16.30 100.00 16.30 4.34 4.34 0.00 3.71 3.71 0.00 0.00 0.00 0.00 8.56 8.56
TOTAL Bagasse 59.00 59.00 112.57 112.57 0.00 32.63 0.00 0.00 0.00 32.63 0.00 0.00 0.00 0.00 2.90 2.90Municipal Waste to Energy 0.00 0.00 0.00 0.00 0.00 0.00 0.00
TOTAL Municipal Waste to Energy 0.00 0.00 0.00 0.00 0.00 0.00 0.00 0.00 0.00 0.00 0.00 0.00 0.00 0.00 0.00 0.00Industrial Waste based power project 0.00 0.00 0.00 0.00 0.00 0.00 0.00
TOTAL Industrial Waste 0.00 0.00 0.00 0.00 0.00 0.00 0.00 0.00 0.00 0.00 0.00 0.00 0.00 0.00 0.00 0.00Wind Power 0.00 0.00 0.00 0.00 0.00 0.00 0.00
TOTAL Wind Power 0.00 0.00 0.00 0.00 0.00 0.00 0.00 0.00 0.00 0.00 0.00 0.00 0.00 0.00 0.00 0.00Mini Hydel Saraswathi Power & Ind. Pvt. Ltd Chintakunt 3.00 100.00 3.00 1.91 1.91 0.00 1.58 1.58 0.00 0.00 0.00 0.00 8.30 8.30Mini Hydel Kallam Spinning Mills Ltd Nelakonda 4.00 100.00 4.00 3.34 3.34 0.00 2.34 2.34 0.00 0.00 0.00 0.00 7.00 7.00Mini Hydel 0.00 0.00 0.00 0.00 0.00 0.00 0.00
TOTAL Mini Hydel 7.00 7.00 5.25 5.25 0.00 3.92 0.00 0.00 0.00 3.92 0.00 0.00 0.00 0.00 7.47 7.47NCL Energy Ltd NCL TB Dam 8.25 15.87 1.31 3.25 3.25 0.00 0.58 0.58 0.00 0.00 0.00 0.00 1.80 1.80NCL Energy Ltd 0.00 0.00 0.00 0.00 0.00 0.00 0.00
TOTAL- NCL Energy Ltd 8.25 1.31 3.25 3.25 0.00 0.58 0.00 0.00 0.00 0.58 0.00 0.00 0.00 0.00 1.80 1.80NCE-Others NCE others 0.00 0.00 0.00 60.47 60.47 0.00 -30.93 -30.93 0.00 0.00 0.00 0.00 -5.11 -5.11NCE-Others 0.00 0.00 0.00 0.00 0.00 0.00 0.00
TOTAL NCE - Others 0.00 0.00 60.47 60.47 0.00 -30.93 0.00 0.00 0.00 -30.93 0.00 0.00 0.00 0.00 -5.11 -5.11
Total NCE 98.25 91.31 282.44 282.44 0.00 123.13 0.00 0.00 0.00 123.13 0.00 0.00 0.00 0.00 4.36 4.36
Unit Cost (Rs. / kWh) Remarks
Plant wise NCE Generation and Cost Details for Base Year. The total should be consistent with values provided in Form 1.4 under NCE.
TYPE Name LocationAvailability and Dispatch (MU) Cost (Rs. Crs.)
Page 135 of 195

Form 1.4(ii) NCE Generation (Year 1) 2014-15
Plant Capacity
DISCOM's share
DISCOM's share
(MW) (%) (MW) Net Availability Dispatch Fixed Variable Incentive Income
Tax Others Total Fixed Incentives
Income Tax Others Variable Total
Bio-Mass Gowthami Bio Energy alpuram/Khamm 6.00 100.00 6.00 42.45 42.45 0.00 30.66 0.00 0.00 0.00 30.66 0.00 0.00 0.00 0.00 7.22 7.22Bio-Mass Shalivahana Projets ancherial/Adilab 6.00 100.00 6.00 29.31 29.31 0.00 19.22 0.00 0.00 0.00 19.22 0.00 0.00 0.00 0.00 6.56 6.56Bio-Mass Rithwik Power Ltd., kulapalli/Khamm 6.00 100.00 6.00 41.51 41.51 0.00 27.67 0.00 0.00 0.00 27.67 0.00 0.00 0.00 0.00 6.67 6.67Bio-Mass 0.00 0.00 0.00 0.00 0.00 0.00 0.00
TOTAL Bio-mass 18.00 18.00 113.27 113.27 0.00 77.56 0.00 0.00 0.00 77.56 0.00 0.00 0.00 0.00 6.85 6.85Bagasse Kakatiya Cements & Sugars Ltd., alluru/Khamma 16.70 100.00 16.70 46.10 46.10 0.00 20.03 0.00 0.00 0.00 20.03 0.00 0.00 0.00 0.00 4.35 4.35Bagasse Gayathri Sugars (Nizamsagar) odhan/Nizamab 16.10 100.00 16.10 18.07 18.07 0.00 5.35 0.00 0.00 0.00 5.35 0.00 0.00 0.00 0.00 2.96 2.96Bagasse Nizam Deccan Sugars odhan/Nizamab 20.00 100.00 20.00 8.60 8.60 0.00 1.89 0.00 0.00 0.00 1.89 0.00 0.00 0.00 0.00 2.20 2.20Bagasse NCS Gayatri Sugars (Kamareddy) chpally/Nizamab 6.00 100.00 6.00 5.36 5.36 0.00 1.79 0.00 0.00 0.00 1.79 0.00 0.00 0.00 0.00 3.33 3.33
TOTAL Bagasse 58.80 58.80 78.13 78.13 0.00 29.06 0.00 0.00 0.00 29.06 0.00 0.00 0.00 0.00 3.72 3.72Municipal Waste to Energy 0.00 0.00 0.00 0.00 0.00 0.00 0.00
TOTAL Municipal Waste to Energy 0.00 0.00 0.00 0.00 0.00 0.00 0.00 0.00 0.00 0.00 0.00 0.00 0.00 0.00 0.00 0.00ndustrial Waste based power project 0.00 0.00 0.00 0.00 0.00 0.00 0.00
TOTAL Industrial Waste 0.00 0.00 0.00 0.00 0.00 0.00 0.00 0.00 0.00 0.00 0.00 0.00 0.00 0.00 0.00 0.00
Wind Power 0.00 0.00 0.00 0.00 0.00 0.00 0.00TOTAL Wind Power 0.00 0.00 0.00 0.00 0.00 0.00 0.00 0.00 0.00 0.00 0.00 0.00 0.00 0.00 0.00 0.00
Mini Hydel Kallam Spinning Ltd., ondapally/Kham 4.00 100.00 4.00 2.66 2.66 0.00 0.50 0.00 0.00 0.00 0.50 0.00 0.00 0.00 0.00 1.89 1.89Mini Hydel Saraswathi Power takunta/Karimn 2.00 100.00 2.00 0.07 0.07 0.00 0.01 0.00 0.00 0.00 0.01 0.00 0.00 0.00 0.00 1.65 1.65
TOTAL Mini Hydel 6.00 6.00 2.73 2.73 0.00 0.51 0.00 0.00 0.00 0.51 0.00 0.00 0.00 0.00 1.88 1.88NCL Energy Ltd 0.00 0.00 0.00 0.00 0.00 0.00 0.00
TOTAL- NCL Energy Ltd 0.00 0.00 0.00 0.00 0.00 0.00 0.00 0.00 0.00 0.00 0.00 0.00 0.00 0.00 0.00 0.00NCE-Others NCE- Others 24.62 24.62 0.07 21.69 0.00 0.00 0.00 21.76 0.03 0.00 0.00 0.00 8.81 8.84NCE-Others 0.00 0.00 0.00 0.00 0.00 0.00 0.00NCE-Others 0.00 0.00 0.00 0.00 0.00 0.00 0.00
TOTAL NCE - Others 0.00 0.00 24.62 24.62 0.07 21.69 0.00 0.00 0.00 21.76 0.03 0.00 0.00 0.00 8.81 8.84
Total NCE 82.80 82.80 218.75 218.75 0.07 128.82 0.00 0.00 0.00 128.89 0.00 0.00 0.00 0.00 5.89 5.89
Unit Cost (Rs. / kWh)
Remarks
Plant wise NCE Generation and Cost Details for Year1. The total should be consistent with values provided in Form 1.4 under NCE.
TYPE Name Location
Availability and Dispatch (MU) Cost (Rs. Crs.)
Page 136 of 195

Form 1.4(iii) NCE Generation (Year 2) 2015-16
Plant Capacity
DISCOM's share
DISCOM's share
(MW) (%) (MW) Net Availability Dispatch Fixed Variable Incentive Income
Tax Others Total Fixed Incentives
Income Tax Others Variable Total
Bio-Mass Gowthami Bio Energy Ltd alpuram/Khamm 6.00 100.00 6.00 47.05 47.05 0.00 30.24 0.00 0.00 (2.20) 28.04 0.00 0.00 0.00 -0.47 6.43 5.96Bio-Mass Shalivahana Green Energy Ltd ancherial/Adilab 6.00 100.00 6.00 36.33 36.33 0.00 23.75 0.00 0.00 (1.61) 22.14 0.00 0.00 0.00 -0.44 6.54 6.09Bio-Mass Ritwik Power Projects Pvt. Limited kulapalli/Khamm 6.00 100.00 6.00 38.96 38.96 0.00 25.57 0.00 0.00 (1.94) 23.63 0.00 0.00 0.00 -0.50 6.56 6.07Bio-Mass 0.00 0.00 0.00 0.00 0.00 0.00 0.00
TOTAL Bio-mass 18.00 18.00 122.35 122.35 0.00 79.56 0.00 0.00 -5.75 73.81 0.00 0.00 0.00 -0.47 6.50 6.03Bagasse Kakatiya Cements & Sugars Ltd., alluru/Khamma 16.70 100.00 16.70 30.22 30.22 0.00 13.67 0.00 0.00 0.00 13.67 0.00 0.00 0.00 0.00 4.52 4.52Bagasse Gayathri Sugars (Nizamsagar) odhan/Nizamab 16.10 100.00 16.10 15.89 15.89 0.00 10.82 0.00 0.00 0.00 10.82 0.00 0.00 0.00 0.00 6.81 6.81Bagasse Nizam Deccan Sugars odhan/Nizamab 20.00 100.00 20.00 0.00 0.00 0.00 0.00 0.00 0.00 0.00 0.00 0.00 0.00 0.00 0.00 0.00 0.00Bagasse NCS Gayatri Sugars (Kamareddy) chpally/Nizamab 6.00 100.00 6.00 5.51 5.51 0.00 2.37 0.00 0.00 0.00 2.37 0.00 0.00 0.00 0.00 4.30 4.30
TOTAL Bagasse 58.80 58.80 51.63 51.63 0.00 26.85 0.00 0.00 0.00 26.85 0.00 0.00 0.00 0.00 5.20 5.20Municipal Waste to Energy 0.00 0.00 0.00 0.00 0.00 0.00 0.00 0.00 0.00 0.00 0.00 0.00 0.00 0.00 0.00 0.00 0.00 0.00 0.00
TOTAL Municipal Waste to Energy 0.00 0.00 0.00 0.00 0.00 0.00 0.00 0.00 0.00 0.00 0.00 0.00 0.00 0.00 0.00 0.00ndustrial Waste based power project 0.00 0.00 0.00 0.00 0.00 0.00 0.00
TOTAL Industrial Waste 0.00 0.00 0.00 0.00 0.00 0.00 0.00 0.00 0.00 0.00 0.00 0.00 0.00 0.00 0.00 0.00
Wind Power 0.00 0.00 0.00 0.00 0.00 0.00 0.00TOTAL Wind Power 0.00 0.00 0.00 0.00 0.00 0.00 0.00 0.00 0.00 0.00 0.00 0.00 0.00 0.00 0.00 0.00
Mini Hydel Kallam Spinning Ltd., ondapally/Kham 4.00 100.00 4.00 0.06 0.06 0.00 0.01 0.00 0.00 0.00 0.01 0.00 0.00 0.00 0.00 2.33 2.33Mini Hydel 0.00 0.00 0.00 0.00 0.00 0.00 0.00
TOTAL Mini Hydel 4.00 4.00 0.06 0.06 0.00 0.01 0.00 0.00 0.00 0.01 0.00 0.00 0.00 0.00 2.33 2.33NCL Energy Ltd 0.00 0.00 0.00 0.00 0.00 0.00 0.00
TOTAL- NCL Energy Ltd 0.00 0.00 0.00 0.00 0.00 0.00 0.00 0.00 0.00 0.00 0.00 0.00 0.00 0.00 0.00 0.00NCE-Others Essel Mining -Salakpur (Solar) Salakpur 10.00 100.00 10.00 16.65 16.65 0.00 11.11 0.00 0.00 0.00 11.11 0.00 0.00 0.00 0.00 6.67 6.67NCE-Others NTPC Ramagundam Solar PV Ramagundam 0.00 0.00 0.00 6.31 6.31 0.00 5.90 0.00 0.00 0.00 5.90 0.00 0.00 0.00 0.00 9.35 9.35NCE-Others SMW New Era Emviro Ventures Manakonduru 5.00 100.00 5.00 0.60 0.60 0.00 0.39 0.00 0.00 0.00 0.39 0.00 0.00 0.00 0.00 6.45 6.45
TOTAL NCE - Others 15.00 15.00 23.56 23.56 0.00 17.39 0.00 0.00 0.00 17.39 0.00 0.00 0.00 0.00 7.38 7.38
Total NCE 95.80 95.80 197.60 197.60 0.00 123.82 0.00 0.00 ‐5.75 118.07 0.00 0.00 0.00 -0.29 6.27 5.98
Unit Cost (Rs. / kWh)
Remarks
Plant wise NCE Generation and Cost Details for Year1. The total should be consistent with values provided in Form 1.4 under NCE.
TYPE Name Location
Availability and Dispatch (MU) Cost (Rs. Crs.)
Page 137 of 195

Form 1.4(iv) NCE Generation (Year 3) 2016-17
Plant Capacity
DISCOM's share
DISCOM's share
(MW) (%) (MW) Net Availability Dispatch Fixed Variable Incentive Income
Tax Others Total Fixed Incentives
Income Tax Others Variable Total
Bio-Mass Gowthami Bio Energy Ltd alpuram/Khamm 6.00 100.00 6.00 29.50 29.50 7.19 16.80 0.00 0.00 0.00 23.99 2.44 0.00 0.00 0.00 5.69 8.13Bio-Mass Shalivahana Green Energy Ltd ancherial/Adilab 6.00 100.00 6.00 26.10 26.10 7.19 14.86 0.00 0.00 0.00 22.05 2.75 0.00 0.00 0.00 5.69 8.45Bio-Mass Ritwik Power Projects Pvt. Limited kulapalli/Khamm 6.00 100.00 6.00 38.29 38.29 7.19 21.81 0.00 0.00 0.00 28.99 1.88 0.00 0.00 0.00 5.69 7.57Bio-Mass Indur Green Power Ltd.(NSL) Renjal/Nizamaba 6.00 100.00 6.00 0.00 0.00 0.00 0.00 0.00 0.00 0.00 0.00 0.00 0.00 0.00 0.00 0.00 0.00Bio-Mass MSR Mega Bio Ragunathpally 7.50 100.00 7.50 3.81 3.81 0.00 2.17 0.00 0.00 0.00 2.17 0.00 0.00 0.00 0.00 5.69 5.69
TOTAL Bio-mass 31.50 31.50 97.70 97.70 21.56 55.64 0.00 0.00 0.00 77.20 2.21 0.00 0.00 0.00 5.69 7.90Bagasse Kakatiya Cements & Sugars Ltd., alluru/Khamma 16.70 100.00 16.70 0.01 0.01 0.00 0.00 0.00 0.00 0.00 0.01 1.39 0.00 0.00 0.00 3.28 4.67Bagasse Gayathri Sugars (Nizamsagar) odhan/Nizamab 16.10 100.00 16.10 0.00 0.00 0.00 0.00 0.00 0.00 0.00 0.00 0.00 0.00 0.00 0.00 0.00 0.00Bagasse Nizam Deccan Sugars odhan/Nizamab 20.00 100.00 20.00 0.00 0.00 0.00 0.00 0.00 0.00 0.00 0.00 0.00 0.00 0.00 0.00 0.00 0.00Bagasse NCS Gayatri Sugars (Kamareddy) chpally/Nizamab 6.00 100.00 6.00 0.00 0.00 0.00 0.00 0.00 0.00 0.00 0.00 0.00 0.00 0.00 0.00 0.00 0.00
TOTAL Bagasse 58.80 58.80 0.01 0.01 0.00 0.00 0.00 0.00 0.00 0.01 1.39 0.00 0.00 0.00 3.28 4.67Municipal Waste to Energy 0.00 0.00 0.00 0.00 0.00 0.00 0.00
TOTAL Municipal Waste to Energy 0.00 0.00 0.00 0.00 0.00 0.00 0.00 0.00 0.00 0.00 0.00 0.00 0.00 0.00 0.00 0.00ndustrial Waste based power project 0.00 0.00 0.00 0.00 0.00 0.00 0.00
TOTAL Industrial Waste 0.00 0.00 0.00 0.00 0.00 0.00 0.00Wind Power 0.00 0.00 0.00 0.00 0.00 0.00 0.00
TOTAL Wind Power 0.00 0.00 0.00 0.00 0.00 0.00 0.00 0.00 0.00 0.00 0.00 0.00 0.00 0.00 0.00 0.00Mini Hydel Kallam Spinning Ltd., 0.00 0.00 0.00 0.00 0.00 0.00 0.00 0.00 0.00 0.00 0.00 0.00 0.00 0.00 0.00 0.00 0.00 0.00Mini Hydel 0.00 0.00 0.00 0.00 0.00 0.00 0.00
TOTAL Mini Hydel 0.00 0.00 0.00 0.00 0.00 0.00 0.00 0.00 0.00 0.00 0.00 0.00 0.00 0.00 0.00 0.00NCL Energy Ltd 0.00 0.00 0.00 0.00 0.00 0.00 0.00
TOTAL- NCL Energy Ltd 0.00 0.00 0.00 0.00 0.00 0.00 0.00 0.00 0.00 0.00 0.00 0.00 0.00 0.00 0.00 0.00NCE-Others Essel Mining -Salakpur (Solar) Salakpur 10.00 100.00 10.00 7.54 7.54 0.00 4.89 0.00 0.00 0.00 4.89 0.00 0.00 0.00 0.00 6.49 6.49NCE-Others SMW New Era Emviro Ventures Manakonduru 5.00 100.00 5.00 3.93 3.93 0.00 2.54 0.00 0.00 0.00 2.54 0.00 0.00 0.00 0.00 6.45 6.45NCE-Others New ERA Emviro Ventures (KRMR) (P) Ltd. Ellanthakunta 0.00 0.00 0.00 8.12 8.12 0.00 5.24 0.00 0.00 0.00 5.24 0.00 0.00 0.00 0.00 6.45 6.45
TOTAL NCE - Others 15.00 15.00 19.59 19.59 0.00 12.67 0.00 0.00 0.00 12.67 0.00 0.00 0.00 0.00 6.47 6.47
Total NCE 105.30 105.30 117.31 117.31 21.56 68.31 0.00 0.00 0.00 89.87 1.84 0.00 0.00 0.00 5.82 7.66
Unit Cost (Rs. / kWh)
Remarks
Plant wise NCE Generation and Cost Details for Year1. The total should be consistent with values provided in Form 1.4 under NCE.
TYPE Name Location
Availability and Dispatch (MU) Cost (Rs. Crs.)
Page 138 of 195

Form 1.4(iv) NCE Generation (Year 4) 2017-18
Plant Capacity
DISCOM's share
DISCOM's share
(MW) (%) (MW) Net Availability Dispatch Fixed Variable Incentive Income
Tax Others Total Fixed Incentives
Income Tax Others Variable Total
Bio-Mass Gowthami Bio Energy Ltd alpuram/Khamm 6.00 100.00 6.00 28.36 28.36 4.72 12.39 0.00 0.00 0.00 17.11 1.66 0.00 0.00 0.00 4.37 6.03Bio-Mass Shalivahana Green Energy Ltd ancherial/Adilab 6.00 100.00 6.00 28.28 28.28 4.72 12.36 0.00 0.00 0.00 17.07 1.67 0.00 0.00 0.00 4.37 6.04Bio-Mass Ritwik Power Projects Pvt. Limited kulapalli/Khamm 6.00 100.00 6.00 38.58 38.58 4.72 16.86 0.00 0.00 0.00 21.58 1.22 0.00 0.00 0.00 4.37 5.59Bio-Mass Indur Green Power Ltd.(NSL) Renjal/Nizamaba 6.00 100.00 6.00 0.00 0.00 0.00 0.00 0.00 0.00 0.00 0.00 0.00 0.00 0.00 0.00 0.00 0.00Bio-Mass MSR Mega Bio Ragunathpally 7.50 100.00 7.50 0.00 0.00 0.00 0.00 0.00 0.00 0.00 0.00 0.00 0.00 0.00 0.00 0.00 0.00
TOTAL Bio-mass 31.50 31.50 95.22 95.22 14.15 41.61 0.00 0.00 0.00 55.76 1.49 0.00 0.00 0.00 4.37 5.86Bagasse Kakatiya Cements & Sugars Ltd., alluru/Khamma 16.70 100.00 16.70 1.57 1.57 0.22 0.44 0.00 0.00 0.00 0.66 1.40 0.00 0.00 0.00 2.80 4.19Bagasse Gayathri Sugars (Nizamsagar) odhan/Nizamab 16.10 100.00 16.10 0.00 0.00 0.00 0.00 0.00 0.00 0.00 0.00 0.00 0.00 0.00 0.00 0.00 0.00Bagasse Nizam Deccan Sugars odhan/Nizamab 20.00 100.00 20.00 0.00 0.00 0.00 0.00 0.00 0.00 0.00 0.00 0.00 0.00 0.00 0.00 0.00 0.00Bagasse NCS Gayatri Sugars (Kamareddy) chpally/Nizamab 6.00 100.00 6.00 0.00 0.00 0.00 0.00 0.00 0.00 0.00 0.00 0.00 0.00 0.00 0.00 0.00 0.00
TOTAL Bagasse 58.80 58.80 1.57 1.57 0.22 0.44 0.00 0.00 0.00 0.66 1.40 0.00 0.00 0.00 2.80 4.19Municipal Waste to Energy Shalivahana Energy Ltd suglampally 0.00 100.00 0.00 61.50 61.50 20.91 23.55 0.00 0.00 0.00 44.46 3.40 0.00 0.00 0.00 3.83 7.23
TOTAL Municipal Waste to Energy 0.00 0.00 61.50 61.50 20.91 23.55 0.00 0.00 0.00 44.46 3.40 0.00 0.00 0.00 3.83 7.23ndustrial Waste based power project 0.00 0.00 0.00 0.00 0.00 0.00 0.00
TOTAL Industrial Waste 0.00 0.00 0.00 0.00 0.00 0.00 0.00Wind Power 0.00 0.00 0.00 0.00 0.00 0.00 0.00
TOTAL Wind Power 0.00 0.00 0.00 0.00 0.00 0.00 0.00 0.00 0.00 0.00 0.00 0.00 0.00 0.00 0.00 0.00Mini Hydel 0.00 0.00 0.00 0.00 0.00 0.00 0.00 0.00 0.00 0.00 0.00 0.00 0.00 0.00 0.00 0.00 0.00 0.00 0.00Mini Hydel 0.00 0.00 0.00 0.00 0.00 0.00 0.00
TOTAL Mini Hydel 0.00 0.00 0.00 0.00 0.00 0.00 0.00 0.00 0.00 0.00 0.00 0.00 0.00 0.00 0.00 0.00NCL Energy Ltd 0.00 0.00 0.00 0.00 0.00 0.00 0.00
TOTAL- NCL Energy Ltd 0.00 0.00 0.00 0.00 0.00 0.00 0.00 0.00 0.00 0.00 0.00 0.00 0.00 0.00 0.00 0.00NCE-Others NCE-others (Solar) 0.00 0.00 0.00 0.00 1,385.01 1,385.01 0.00 808.84 0.00 0.00 0.00 808.84 0.00 0.00 0.00 0.00 5.84 5.84NCE-Others 0.00 0.00 0.00 0.00 0.00 0.00 0.00 0.00NCE-Others 0.00 0.00 0.00 0.00 0.00 0.00 0.00 0.00
TOTAL NCE - Others 0.00 0.00 1385.01 1385.01 0.00 808.84 0.00 0.00 0.00 808.84 0.00 0.00 0.00 0.00 5.84 5.84
Total NCE 90.30 90.30 1543.29 1543.29 35.28 874.45 0.00 0.00 0.00 909.73 0.23 0.00 0.00 0.00 5.67 5.89
Unit Cost (Rs. / kWh)
Remarks
Plant wise NCE Generation and Cost Details for Year1. The total should be consistent with values provided in Form 1.4 under NCE.
TYPE Name Location
Availability and Dispatch (MU) Cost (Rs. Crs.)
Page 139 of 195

Index Sheet
Form 1.5
Amount (In Rs crores)
Base Year 2014-15 2015-16 2016-17 2017-18 2018-19 Base Year 2014-15 2015-16 2016-17 2017-18 2018-19
A Opening Balance 422.40 499.46 531.42 587.64 654.19 724.06
B Additions during the Year 77.06 31.96 56.23 66.55 69.87 0.00
C Deductions during the Year 0.00 0.00 0.00 0.00 0.00 0.00
D Closing Balance 499.46 531.42 587.64 654.19 724.06 724.06
E Average Balance ((A+D)/2) 460.93 515.44 559.53 620.92 689.13 724.06
F Interest @ % p.a. # 8.38 8.21 7.44 6.75 6.75
G Interest Cost (E*F) 38.65 42.32 41.60 41.91 46.52 0.00
Note: Interest Rate to be entered as a number, e.g. interest rate of 4.56% should be typed as "4.56" in the cells.
Details of Actuals incurred (based on audited Annual Acounts)I Interest @ % p.a. # 8.38 8.21 7.44 6.75 6.75 0.00J Interest Cost (E*F) 38.65 42.32 41.60 41.91 46.52 0.00
Remarks
Interest on Consumer Security Deposits
Revenue Requirement Item (Rs. Crs.) Details linkFor Control Period
Page 140 of 195

Index Sheet
Form 1.6 Supply Margin
Amount (In Rs crores)
Base Year 2014-15 2015-16 2016-17 2017-18 2018-19 Base Year 2014-15 2015-16 2016-17 2017-18 2018-19
A Supply Margin Amount 6.76 7.54 8.99 10.71 13.14
Particulars Details linkFor Control Period Remarks
Page 141 of 195

Index sheet
Form 1.7
Amount (In Rs crores)
Base Year 2014-15 2015-16 2016-17 2017-18 2018-19 Base Year 2014-15 2015-16 2016-17 2017-18 2018-191 Reactive charges 0.18 2.16 1.16 1.16 1.162 Assets Maintenance charges 0.08 0.08 0.083 Wheeling charges KPTCL 1.10 1.15 1.15 1.154 Others 3.30 3.30 3.305 Conjestion charges 0.06 0.06 0.066789
101112
Total 0.18 3.26 5.75 5.75 5.75 0.00
Remarks
Other Costs
Details linkS.No.
For Control PeriodParticulars
Page 142 of 195

Index sheet
Form 2Cost of Service: Embedded Cost Method
Total Cost Allocation (Rs.Crs)
Sales (MU) CoS (Rs/unit)
Total Cost Allocation (Rs.Crs)
Sales (MU) CoS (Rs/unit)
Total Cost Allocation (Rs.Crs)
Sales (MU) CoS (Rs/unit)
Total Cost Allocation (Rs.Crs)
Sales (MU) CoS (Rs/unit)
Total Cost Allocation (Rs.Crs)
Sales (MU) CoS (Rs/unit)
Total Cost Allocation (Rs.Crs)
Sales (MU) CoS (Rs/unit)
LT Category 0.00 7682.48 0.00 0.00 8270.53 0.00 0.00 8632.80 0.00 0.00 9207.57 0.00 0.00 9869.65 0.00 0.00 0.00 0.00Category I (A&B) - Domestic Form-3 2276.69 0.00 2442.49 0.00 2819.02 0.00 3070.00 0.00 3343.33 0.00 0.00 0.00Category II (A,B, C & D) - Non-domestic/Commercial Form-13 473.62 0.00 502.62 0.00 572.43 0.00 617.92 0.00 667.03 0.00 0.00 0.00Category III - Industrial 266.38 0.00 268.40 0.00 247.05 0.00 245.62 0.00 248.08 0.00 0.00 0.00Category IV (A,&B) - Cottage Industries & Agrobased Ind. 5.85 0.00 6.00 0.00 6.32 0.00 6.48 0.00 6.65 0.00 0.00 0.00Category V (A, B & C) - Irrigation and Agriculture 4361.35 0.00 4738.38 0.00 4671.95 0.00 4942.39 0.00 5263.65 0.00 0.00 0.00Category VI (A & B) - Local Bodies, St. Lighting & PWS 267.24 0.00 279.45 0.00 277.34 0.00 281.44 0.00 292.03 0.00 0.00 0.00Category VII (A & B) - General Purpose & Religious Places 31.35 0.00 33.19 0.00 38.69 0.00 43.72 0.00 48.89 0.00 0.00 0.00Category VIII -Temporary Supply 0.00 0.00 0.00 0.00 0.00 0.00 0.00 0.00 0.00 0.00 0.00 0.00
0.00 0.00 0.00 0.00 0.00 0.00 0.00 0.00 0.00 0.00 0.00 0.000.00 0.00 0.00 0.00 0.00 0.00 0.00 0.00 0.00 0.00 0.00 0.000.00 0.00 0.00 0.00 0.00 0.00 0.00 0.00 0.00 0.00 0.00 0.000.00 0.00 0.00 0.00 0.00 0.00 0.00 0.00 0.00 0.00 0.00 0.000.00 0.00 0.00 0.00 0.00 0.00 0.00 0.00 0.00 0.00 0.00 0.000.00 0.00 0.00 0.00 0.00 0.00 0.00 0.00 0.00 0.00 0.00 0.000.00 0.00 0.00 0.00 0.00 0.00 0.00 0.00 0.00 0.00 0.00 0.000.00 0.00 0.00 0.00 0.00 0.00 0.00 0.00 0.00 0.00 0.00 0.000.00 0.00 0.00 0.00 0.00 0.00 0.00 0.00 0.00 0.00 0.00 0.00
HT Category at 11 KV 0.00 1057.83 0.00 0.00 1241.10 0.00 0.00 1249.32 0.00 0.00 1317.04 0.00 0.00 1494.85 0.00 0.00 0.00 0.00HT-I Industry 396.47 0.00 502.65 0.00 488.62 0.00 498.33 0.00 557.59 0.00 0.00 0.00
HT-I (B) Ferro-Alloys 0.00 0.00 0.00 0.00 0.00 0.00 0.00 0.00 0.00 0.00 0.00 0.00HT-II - Others 74.00 0.00 86.65 0.00 99.38 0.00 107.55 0.00 119.82 0.00 0.00 0.00HT-III Airports, Railway and Busstations 6.94 0.00 7.59 0.00 7.97 0.00 8.02 0.00 8.60 0.00 0.00 0.00HT-IV A Lift Irrigation & Agriculture 18.22 0.00 26.95 0.00 13.72 0.00 14.78 0.00 14.78 0.00 0.00 0.00HT - IV (B) Composite P.W.S Schemes 11.03 0.00 15.63 0.00 17.64 0.00 22.75 0.00 81.26 0.00 0.00 0.00
HT-VI Townships and Residential Colonies 15.71 0.00 15.79 0.00 14.48 0.00 12.80 0.00 13.06 0.00 0.00 0.00HT-VII - Green Power 0.00 0.00 0.00 0.00 0.00 0.00HT - VII - Temporary Supply 0.00 0.00 0.00 0.00 0.00 0.00 0.00 0.00 0.00 0.00 0.00 0.00HT- RESCOs 535.47 0.00 585.83 0.00 607.52 0.00 652.80 0.00 699.74 0.00 0.00 0.00
0.00 0.00 0.00 0.00 0.00 0.00 0.00 0.00 0.00 0.00 0.00 0.000.00 0.00 0.00 0.00 0.00 0.00 0.00 0.00 0.00 0.00 0.00 0.000.00 0.00 0.00 0.00 0.00 0.00 0.00 0.00 0.00 0.00 0.00 0.000.00 0.00 0.00 0.00 0.00 0.00 0.00 0.00 0.00 0.00 0.00 0.00
0.00 0.00 0.00 0.00 0.00 0.00 0.00 0.00 0.00 0.00 0.00 0.00 0.00
Cost of Service: Embedded Cost Method
Consumer Categories Detail Links
2016-17Base Year 2014-15 2015-16 2018-192017-18
Page 143 of 195

HT Category at 33 KV 0.00 295.15 0.00 0.00 339.20 0.00 0.00 286.39 0.00 0.00 297.92 0.00 0.00 508.32 0.00 0.00 0.00 0.00HT-I Industry 161.95 0.00 172.68 0.00 181.06 0.00 180.48 0.00 184.21 0.00 0.00 0.00
HT-I (B) Ferro-Alloys 37.30 0.00 43.50 0.00 0.00 0.00 0.02 0.00 0.00 0.00 0.00 0.00HT-II - Others 6.75 0.00 10.80 0.00 26.39 0.00 13.13 0.00 13.39 0.00 0.00 0.00HT-III Airports, Railway and Busstations 0.00 0.00 0.00 0.00 13.48 0.00 0.00 0.00 0.00 0.00 0.00 0.00HT-IV A Lift Irrigation & Agriculture 14.83 0.00 20.51 0.00 21.63 0.00 27.80 0.00 27.80 0.00 0.00 0.00HT - IV (B) Composite P.W.S Schemes 0.00 0.00 0.00 0.00 0.05 0.00 31.23 0.00 236.12 0.00 0.00 0.00HT-VI Townships and Residential Colonies 35.54 0.00 38.19 0.00 43.78 0.00 45.26 0.00 46.79 0.00 0.00 0.00HT-VII - Green Power 0.00 0.00 0.00 0.00 0.00 0.00HT - VII - Temporary Supply 0.00 0.00 0.00 0.00 0.00 0.00 0.00 0.00 0.00 0.00 0.00 0.00HT- RESCOs 38.79 0.00 53.53 0.00 0.00 0.00 0.00 0.00 0.00 0.00 0.00 0.00 0.00 0.00 0.00 0.00 0.00 0.00 0.00 0.00 0.00 0.00 0.00 0.00
0.00 0.00 0.00 0.00 0.00 0.00 0.00 0.00 0.00 0.00 0.00 0.000.00 0.00 0.00 0.00 0.00 0.00 0.00 0.00 0.00 0.00 0.00 0.000.00 0.00 0.00 0.00 0.00 0.00 0.00 0.00 0.00 0.00 0.00 0.000.00 0.00 0.00 0.00 0.00 0.00 0.00 0.00 0.00 0.00 0.00 0.00
HT Category at 132 KV 0.00 1251.21 0.00 0.00 1253.97 0.00 0.00 1397.17 0.00 0.00 1552.55 0.00 0.00 1992.84 0.00 0.00 0.00 0.00HT-I Industry 585.12 0.00 516.62 0.00 570.94 0.00 684.89 0.00 694.65 0.00 0.00 0.00
HT-I (B) Ferro-Alloys 0.00 0.00 0.00 0.00 0.00 0.00 0.00 0.00 0.00 0.00 0.00 0.00HT-II - Others 2.26 0.00 1.42 0.00 12.39 0.00 6.12 0.00 3.38 0.00 0.00 0.00HT-III Airports, Railway and Busstations 0.00 0.00 0.00 0.00 0.00 0.00 0.00 0.00 0.00 0.00 0.00 0.00HT-IV A Lift Irrigation & Agriculture 131.38 0.00 205.41 0.00 287.74 0.00 339.94 0.00 767.71 0.00 0.00 0.00HT - IV (B) Composite P.W.S Schemes 0.00 0.00 0.00 0.00 0.00 0.00 0.00 0.00 0.00 0.00 0.00 0.00HT-V (A) Railway Traction 441.55 0.00 441.95 0.00 430.40 0.00 421.74 0.00 422.91 0.00 0.00 0.00HT-V (B) HMR 0.00 0.00 0.00 0.00 0.00 0.00HT-VI Townships and Residential Colonies 90.89 0.00 88.57 0.00 95.70 0.00 99.86 0.00 104.19 0.00 0.00 0.00HT-VII - Green Power 0.00 0.00 0.00 0.00 0.00 0.00HT - VII - Temporary Supply 0.00 0.00 0.00 0.00 0.00 0.00 0.00 0.00 0.00 0.00 0.00 0.00HT- RESCOs 0.00 0.00 0.00 0.00 0.00 0.00 0.00 0.00 0.00 0.00 0.00 0.00
0.00 0.00 0.00 0.00 0.00 0.00 0.00 0.00 0.00 0.00 0.00 0.000.00 0.00 0.00 0.00 0.00 0.00 0.00 0.00 0.00 0.00 0.00 0.000.00 0.00 0.00 0.00 0.00 0.00 0.00 0.00 0.00 0.00 0.00 0.000.00 0.00 0.00 0.00 0.00 0.00 0.00 0.00 0.00 0.00 0.00 0.00
0.00 0.00 0.00 0.00 0.00 0.00 0.00 0.00 0.00 0.00 0.00 0.00
Total 0.00 10286.68 0.00 0.00 11104.79 0.00 0.00 11565.68 0.00 0.00 12375.08 0.00 0.00 13865.66 0.00 0.00 0.00 0.00
Page 144 of 195

Index sheet
Form 3 Sales Forecast
Base YearSales / Forecast Sales (MU) D Link April May June July August September October November December January February March Total Remarks
LT Category 638.49 597.75 471.06 547.71 665.44 707.12 643.14 514.65 622.68 770.38 721.88 782.19 7682.48Category I (A&B) - Domestic 186.80 216.83 236.58 204.21 188.26 201.15 205.79 201.10 174.66 150.78 155.84 154.72 2276.69Category II (A,B & C) - Non-domestic/Commercial 39.26 43.78 49.76 40.47 38.27 40.32 41.75 40.09 37.28 34.88 35.02 32.73 473.62Category III (A & B) - Industrial 24.28 25.25 25.67 20.35 18.02 18.91 16.97 17.82 25.49 30.22 24.29 19.13 266.38Category IV (A,&B) - Cottage Industries & Agrobased Ind. 0.52 0.55 0.56 0.50 0.49 0.48 0.57 0.45 0.46 0.46 0.42 0.39 5.85Category V (A, B & C) - Irrigation and Agriculture 360.79 286.83 132.52 257.23 396.57 421.75 353.39 230.58 359.70 528.89 481.63 551.46 4361.35Category VI (A & B) - Local Bodies, St. Lighting & PWS 22.80 22.48 24.00 22.38 21.15 21.73 21.92 21.95 22.43 22.73 22.35 21.31 267.24Category VII (A & B) - General Purpose & Religious Places 4.04 2.04 1.97 2.57 2.68 2.79 2.75 2.65 2.66 2.43 2.33 2.45 31.35Category VIII -Temporary Supply 0.00 0.00 0.00 0.00 0.00 0.00 0.00 0.00 0.00 0.00 0.00 0.00 0.00
0.000.000.000.000.000.000.000.000.00
HT Category at 11 KV 92.67 77.53 73.79 94.08 79.00 87.38 76.41 73.99 92.34 108.56 110.52 91.56 1057.83HT-I Industry 35.50 31.50 28.39 32.05 25.52 24.50 22.71 35.02 44.52 43.15 41.68 31.93 396.47
HT-I (B) Ferro-Alloys 0.00 0.00 0.00 0.00 0.00 0.00 0.00 0.00 0.00 0.00 0.00 0.00 0.00HT-II - Others 6.58 7.25 6.74 6.66 6.14 6.21 6.11 5.66 5.16 5.31 6.06 6.13 74.00HT-III Airports, Railway and Busstations 0.51 0.75 0.70 0.56 0.56 0.59 0.63 0.57 0.52 0.52 0.51 0.49 6.94HT-IV A Lift Irrigation & Agriculture 2.33 0.72 0.22 0.57 0.72 2.14 1.27 1.08 1.01 2.28 3.07 2.80 18.22HT- IV B - CP Water Supply Schemes 0.88 0.99 0.90 0.58 0.72 0.88 0.89 0.99 1.04 1.05 1.11 1.00 11.03
HT-VI Townships and Residential Colonies 1.48 1.63 1.64 1.32 1.36 1.34 1.35 1.21 1.22 1.03 1.03 1.10 15.71HT-VII - Green Power 0.00HT - VIII - Temporary Supply 0.00HT- RESCOs 45.39 34.69 35.19 52.34 43.99 51.72 43.45 29.46 38.87 55.21 57.06 48.10 535.47
0.000.000.000.000.000.00
HT Category at 33 KV 22.11 20.46 20.72 23.14 22.57 32.18 23.09 22.36 24.86 27.73 29.86 26.07 295.15HT-I Industry 13.14 12.23 12.87 13.89 12.58 14.49 12.70 13.46 15.35 13.46 14.95 12.83 161.95
HT-I (B) Ferro-Alloys 2.17 2.40 2.43 2.89 3.15 3.34 3.18 3.53 3.66 3.29 3.63 3.63 37.30HT-II - Others 0.53 0.40 0.39 0.29 0.48 0.57 0.57 0.64 0.61 0.69 0.85 0.73 6.75HT-III Airports, Railway and Busstations 0.00 0.00 0.00 0.00 0.00 0.00 0.00 0.00 0.00 0.00 0.00 0.00 0.00HT-IV A Lift Irrigation & Agriculture 0.32 0.06 0.07 0.07 0.44 7.06 1.01 0.42 0.13 1.87 1.98 1.39 14.83HT- IV B - CP Water Supply Schemes 0.00 0.00 0.00 0.00 0.00 0.00 0.00 0.00 0.00 0.00 0.00 0.00 0.00
HT-VI Townships and Residential Colonies 3.29 3.37 3.06 3.22 3.03 3.22 3.04 2.53 2.65 2.69 2.85 2.59 35.54HT-VII - Green Power 0.00HT - VIII - Temporary Supply 0.00HT- RESCOs 2.66 2.00 1.90 2.78 2.89 3.49 2.59 1.78 2.47 5.73 5.59 4.90 38.79
0.000.000.000.000.000.00
HT Category at 132 KV 95.14 89.14 92.75 90.39 113.98 143.91 123.12 94.51 89.02 100.99 113.09 105.19 1251.21HT-I Industry 47.43 43.75 46.01 45.97 46.62 52.39 50.14 51.04 47.33 51.80 53.77 48.87 585.12
HT-I (B) Ferro-Alloys 0.00HT-II - Others 0.36 0.14 0.11 0.29 0.29 0.01 0.11 0.01 0.02 0.01 0.48 0.44 2.26HT-III Airports, Railway and Busstations 0.00 0.00 0.00 0.00 0.00 0.00 0.00 0.00 0.00 0.00 0.00 0.00 0.00HT-IV A Lift Irrigation & Agriculture 1.02 0.54 0.59 1.33 23.05 43.58 25.91 1.11 0.38 5.23 15.55 13.09 131.38HT- IV B - CP Water Supply Schemes 0.00 0.00 0.00 0.00 0.00 0.00 0.00 0.00 0.00 0.00 0.00 0.00 0.00HT-V Railway Traction 37.72 35.59 37.19 34.70 36.39 39.79 37.59 35.66 35.67 38.16 37.01 36.08 441.55HT-VI Townships and Residential Colonies 8.61 9.12 8.85 8.09 7.62 8.14 9.37 6.70 5.61 5.80 6.27 6.70 90.89HT-VII - Green Power 0.00HT - VIII - Temporary Supply 0.00HT- RESCOs 0.00
0.000.000.00
Page 145 of 195

0.000.000.00
Total 848.41 784.87 658.32 755.32 880.98 970.58 865.76 705.51 828.90 1007.67 975.35 1005.00 10286.68
2014-15Sales / Forecast Sales (MU) D Link April May June July August September October November December January February March Total Remarks
LT Category 722.79 529.93 551.12 665.93 757.72 763.57 805.99 597.37 663.49 698.25 689.89 824.49 8270.53Category I (A&B) - Domestic 200.51 226.40 252.70 214.90 204.00 215.23 230.33 191.13 180.68 170.95 169.96 185.69 2442.49Category II (A,B & C) - Non-domestic/Commercial 41.07 44.25 50.07 45.92 40.91 42.10 45.38 38.17 38.68 37.66 37.82 40.60 502.62Category III (A & B) - Industrial 19.50 23.66 25.37 21.83 20.04 19.84 18.26 20.03 25.73 28.39 25.00 20.77 268.40Category IV (A,&B) - Cottage Industries & Agrobased Ind. 0.49 0.64 0.53 0.49 0.48 0.46 0.48 0.50 0.49 0.51 0.46 0.49 6.00Category V (A, B & C) - Irrigation and Agriculture 435.48 210.09 195.97 356.95 466.07 459.12 485.76 321.82 391.09 434.12 430.13 551.78 4738.38Category VI (A & B) - Local Bodies, St. Lighting & PWS 22.69 22.50 24.29 23.19 23.30 23.80 22.77 22.89 23.87 23.92 23.86 22.36 279.45Category VII (A & B) - General Purpose & Religious Places 3.05 2.38 2.20 2.65 2.92 3.02 3.02 2.84 2.96 2.70 2.65 2.79 33.19Category VIII -Temporary Supply 0.00 0.00 0.00 0.00 0.00 0.00 0.00 0.00 0.00 0.00 0.00 0.00 0.00
0.000.000.000.000.000.000.000.000.00
HT Category at 11 KV 108.27 90.80 91.11 101.23 106.61 103.08 93.97 96.69 113.96 115.33 120.02 100.03 1241.10HT-I Industry 35.73 41.00 39.54 38.84 37.55 37.39 29.38 43.13 54.63 53.67 52.00 39.79 502.65
HT-I (B) Ferro-Alloys 0.00 0.00 0.00 0.00 0.00 0.00 0.00 0.00 0.00 0.00 0.00 0.00 0.00HT-II - Others 7.88 8.08 8.65 7.67 7.36 7.63 6.63 7.08 6.23 5.81 6.75 6.87 86.65HT-III Airports, Railway and Busstations 0.67 0.74 0.82 0.70 0.63 0.63 0.58 0.60 0.54 0.51 0.56 0.61 7.59HT-IV A Lift Irrigation & Agriculture 3.49 0.86 0.16 0.89 2.69 2.29 3.73 3.01 2.08 2.46 3.00 2.28 26.95HT- IV B - CP Water Supply Schemes 1.32 1.20 1.27 1.08 1.15 1.31 1.21 1.45 1.40 1.39 1.57 1.28 15.63
HT-VI Townships and Residential Colonies 1.39 1.48 1.70 1.41 1.32 1.32 1.25 1.25 1.15 1.16 1.22 1.13 15.79HT-VII - Green Power 0.00 0.00 0.00 0.00 0.00 0.00 0.00 0.00 0.00 0.00 0.00 0.00 0.00HT -VIII - Temporary Supply 0.00 0.00 0.00 0.00 0.00 0.00 0.00 0.00 0.00 0.00 0.00 0.00 0.00HT - RESCOs 57.80 37.44 38.96 50.63 55.89 52.52 51.18 40.17 47.94 50.33 54.90 48.07 585.83
0.000.000.000.000.00
HT Category at 33 KV 31.49 24.63 25.24 26.11 27.86 31.08 31.23 30.56 27.26 28.68 29.44 25.63 339.20HT-I Industry 15.42 14.02 13.88 13.15 13.92 14.54 12.06 14.54 14.98 15.78 15.96 14.43 172.68
HT-I (B) Ferro-Alloys 3.86 3.55 3.95 3.74 4.09 4.07 3.94 3.74 3.66 3.58 3.65 1.67 43.50HT-II - Others 0.99 0.87 0.76 0.72 0.79 0.85 0.79 1.00 0.97 0.94 1.07 1.05 10.80HT-III Airports, Railway and Busstations 0.00 0.00 0.00 0.00 0.00 0.00 0.00 0.00 0.00 0.00 0.00 0.00 0.00HT-IV A Lift Irrigation & Agriculture 2.24 0.18 0.08 0.32 0.43 3.49 6.69 5.55 0.48 0.32 0.44 0.28 20.51HT- IV B - CP Water Supply Schemes 0.00 0.00 0.00 0.00 0.00 0.00 0.00 0.00 0.00 0.00 0.00 0.00 0.00
HT-VI Townships and Residential Colonies 3.35 3.34 3.57 3.30 3.21 3.19 2.85 2.68 3.00 3.07 3.15 3.48 38.19HT-VII - Green Power 0.00 0.00 0.00 0.00 0.00 0.00 0.00 0.00 0.00 0.00 0.00 0.00 0.00HT -VIII - Temporary Supply 0.00 0.00 0.00 0.00 0.00 0.00 0.00 0.00 0.00 0.00 0.00 0.00 0.00HT - RESCOs 5.63 2.67 3.00 4.87 5.41 4.94 4.91 3.04 4.18 4.99 5.16 4.73 53.53
0.000.000.000.000.00
HT Category at 132 KV 108.91 94.02 91.53 95.27 112.41 152.84 140.58 125.52 82.04 82.33 86.57 81.96 1253.97HT-I Industry 46.47 45.70 44.59 49.19 42.12 48.37 36.44 44.71 39.09 38.58 41.46 39.88 516.62
HT-I (B) Ferro-Alloys 0.00HT-II - Others 0.57 0.00 0.01 0.01 0.04 0.01 0.01 0.05 0.23 0.00 0.33 0.17 1.42HT-III Airports, Railway and Busstations 0.00 0.00 0.00 0.00 0.00 0.00 0.00 0.00 0.00 0.00 0.00 0.00 0.00HT-IV A Lift Irrigation & Agriculture 16.71 2.14 0.51 0.89 25.88 59.61 59.94 37.43 0.68 0.60 0.56 0.47 205.41HT- IV B - CP Water Supply Schemes 0.00 0.00 0.00 0.00 0.00 0.00 0.00 0.00 0.00 0.00 0.00 0.00 0.00HT-V Railway Traction 36.33 37.52 37.15 37.15 36.82 36.80 36.57 36.79 36.37 37.40 38.29 34.76 441.95HT-VI Townships and Residential Colonies 8.83 8.66 9.27 8.03 7.54 8.05 7.61 6.55 5.67 5.75 5.92 6.69 88.57HT-VII - Green Power 0.00HT -VIII - Temporary Supply 0.00HT - RESCOs 0.00
0.00Page 146 of 195

0.000.000.000.00
Total 971.46 739.38 758.99 888.54 1004.59 1050.57 1071.78 850.13 886.75 924.58 925.91 1032.11 11104.79
2015-16Sales / Forecast Sales (MU) D Link April May June July August September October November December January February March Total Remarks
LT Category 632.54 568.39 503.80 775.63 803.55 772.36 943.90 682.57 722.19 716.91 742.98 767.97 8632.80 3960.85Category I (A&B) - Domestic 236.06 243.48 269.71 236.73 255.20 250.05 243.88 243.21 219.20 201.89 198.63 221.00 2819.02Category II (A,B & C) - Non-domestic/Commercial 48.55 51.27 55.75 45.07 49.29 48.30 46.45 48.02 44.35 44.68 43.42 47.28 572.43Category III (A & B) - Industrial 21.51 21.80 23.28 18.01 17.94 17.61 16.50 17.97 21.09 27.32 23.07 20.94 247.05Category IV (A,&B) - Cottage Industries & Agrobased Ind. 0.55 0.53 0.59 0.49 0.52 0.52 0.51 0.53 0.49 0.54 0.53 0.51 6.32Category V (A, B & C) - Irrigation and Agriculture 298.56 225.62 128.49 450.75 455.13 429.87 609.78 345.88 410.26 415.05 450.81 451.75 4671.95Category VI (A & B) - Local Bodies, St. Lighting & PWS 23.90 23.08 23.58 21.67 22.00 22.29 23.31 23.90 23.37 24.10 23.38 22.75 277.34Category VII (A & B) - General Purpose & Religious Places 3.40 2.61 2.40 2.92 3.46 3.73 3.47 3.05 3.44 3.32 3.14 3.74 38.69Category VIII -Temporary Supply 0.00 0.00 0.00 0.00 0.00 0.00 0.00 0.00 0.00 0.00 0.00 0.00 0.00
0.000.000.000.000.000.000.000.000.00
HT Category at 11 KV 113.90 90.24 87.95 99.30 102.68 103.78 99.51 108.93 111.08 115.30 114.04 102.61 1249.32HT-I Industry 39.32 37.97 39.17 35.16 33.98 34.02 32.46 43.18 53.81 50.10 50.37 39.08 488.62
HT-I (B) Ferro-Alloys 0.00HT-II - Others 8.55 8.90 8.96 8.21 8.49 9.01 8.34 8.41 7.66 6.63 7.91 8.32 99.38HT-III Airports, Railway and Busstations 0.74 0.75 0.80 0.67 0.70 0.71 0.61 0.64 0.59 0.56 0.61 0.59 7.97HT-IV A Lift Irrigation & Agriculture 1.77 0.91 0.40 0.33 1.01 1.44 1.66 1.78 0.84 1.12 1.39 1.08 13.72HT- IV B - CP Water Supply Schemes 1.54 1.52 1.44 1.52 1.44 1.53 1.44 1.65 1.44 1.44 1.29 1.38 17.64
HT-VI Townships and Residential Colonies 1.52 1.59 1.65 1.44 1.22 1.17 1.07 1.07 0.97 0.89 0.94 0.95 14.48HT-VII - Green Power 0.00HT -VIII - Temporary Supply 0.00HT - RESCOs 60.46 38.60 35.52 51.97 55.85 55.90 53.93 52.20 45.77 54.57 51.52 51.23 607.52
0.000.000.000.000.00
HT Category at 33 KV 23.67 23.50 24.11 22.64 27.34 29.54 28.48 24.66 21.37 21.07 20.77 19.23 286.39HT-I Industry 15.64 14.66 14.73 14.30 14.59 15.29 14.40 15.49 16.11 15.80 15.71 14.32 181.06
HT-I (B) Ferro-Alloys 0.00HT-II - Others 2.64 3.59 3.98 3.52 4.07 3.93 3.78 0.88 0.00 0.00 0.00 0.00 26.39HT-III Airports, Railway and Busstations 1.20 1.19 1.08 0.95 1.12 1.19 1.12 1.12 1.14 1.15 1.10 1.12 13.48HT-IV A Lift Irrigation & Agriculture 0.48 0.10 0.07 0.06 3.87 5.06 5.75 3.57 0.84 0.96 0.51 0.36 21.63HT- IV B - CP Water Supply Schemes 0.00 0.00 0.00 0.00 0.00 0.00 0.01 0.01 0.01 0.01 0.01 0.01 0.05
HT-VI Townships and Residential Colonies 3.71 3.96 4.24 3.81 3.69 4.06 3.43 3.58 3.27 3.16 3.43 3.42 43.78HT-VII - Green Power 0.00HT -VIII - Temporary Supply 0.00HT - RESCOs 0.00
0.000.000.000.000.00
HT Category at 132 KV 88.96 83.63 89.56 108.65 163.10 160.82 159.51 138.94 97.10 100.26 104.74 101.90 1397.17HT-I Industry 42.37 38.30 42.00 40.69 50.26 45.56 47.45 44.57 53.19 53.74 58.27 54.53 570.94
HT-I (B) Ferro-Alloys 0.00HT-II - Others 0.13 0.00 0.14 0.00 0.32 0.37 0.39 0.72 0.81 2.28 1.40 5.83 12.39HT-III Airports, Railway and Busstations 0.00HT-IV A Lift Irrigation & Agriculture 0.52 0.52 0.63 25.59 67.35 69.21 68.91 50.95 2.04 0.52 0.85 0.64 287.74HT- IV B - CP Water Supply Schemes 0.00 0.00 0.00 0.00 0.00 0.00 0.00 0.00 0.00 0.00 0.00 0.00 0.00HT-V Railway Traction 37.87 36.41 37.73 35.14 36.62 36.72 34.49 35.05 33.76 36.99 36.72 32.90 430.40HT-VI Townships and Residential Colonies 8.06 8.40 9.07 7.24 8.54 8.95 8.27 7.65 7.30 6.73 7.50 7.99 95.70HT-VII - Green Power 0.00HT -VIII - Temporary Supply 0.00HT - RESCOs 0.00
Page 147 of 195

0.000.000.000.000.00
Total 859.06 765.76 705.43 1006.23 1096.67 1066.50 1231.40 955.10 951.74 953.55 982.53 991.72 11565.68
2016-17Sales / Forecast Sales (MU) D Link April May June July August September October November December January February March Total Remarks
LT Category 696.64 575.64 542.96 710.12 970.91 691.31 1037.55 747.24 791.81 785.67 815.15 842.57 9207.57Category I (A&B) - Domestic 270.98 283.10 289.78 264.59 254.49 261.04 265.59 264.87 238.71 219.86 216.32 240.67 3070.00Category II (A,B,C & D) - Non-domestic/Commercial 55.59 56.07 57.56 52.84 48.98 50.89 50.14 51.83 47.87 48.23 46.87 51.04 617.92Category III - Industrial 22.11 20.09 20.30 18.87 17.33 17.49 16.84 18.33 21.51 27.87 23.54 21.36 245.62Category IV (A,&B) - Cottage Industries & Agrobased Ind. 0.59 0.55 0.56 0.55 0.51 0.52 0.53 0.54 0.50 0.56 0.55 0.53 6.48Category V (A, B & C) - Irrigation and Agriculture 320.02 189.43 149.55 346.98 623.41 334.30 676.85 383.93 455.39 460.70 500.40 501.44 4942.39Category VI (A & B) - Local Bodies, St. Lighting & PWS 23.48 23.48 22.58 22.63 22.03 22.99 23.75 24.35 24.01 24.76 24.00 23.38 281.44Category VII (A & B) - General Purpose 3.87 2.92 2.63 3.66 4.16 4.08 3.86 3.39 3.82 3.69 3.48 4.16 43.72Category VIII -Temporary Supply 0.00 0.00 0.00 0.00 0.00 0.00 0.00 0.00 0.00 0.00 0.00 0.00 0.00
0.000.000.000.000.000.000.000.000.00
HT Category at 11 KV 112.84 83.65 91.47 92.49 110.40 116.53 107.24 117.13 121.49 126.25 124.85 112.70 1317.04HT-I Industry Segregated 38.86 34.26 35.60 34.16 34.81 34.73 34.50 45.89 57.19 53.25 53.54 41.53 498.33
HT-I (B) Ferro-Alloys 0.00 0.00 0.00 0.00 0.00 0.00 0.00 0.00 0.00 0.00 0.00 0.00 0.00HT-II - Others 10.34 10.08 9.43 8.04 9.28 9.22 9.03 9.10 8.29 7.17 8.56 9.00 107.55HT-III Airports, Railway and Busstations 0.79 0.77 0.81 0.64 0.68 0.69 0.63 0.65 0.60 0.57 0.62 0.60 8.02HT -IV A Govt Lift Irrigation 1.26 0.87 0.17 0.27 1.75 2.58 1.66 1.78 0.84 1.12 1.39 1.08 14.78HT- IV B - CP Water Supply Schemes 1.38 1.11 1.06 1.11 1.30 1.16 1.14 1.31 3.34 3.34 3.22 3.29 22.75
HT-VI Townships and Residential Colonies 1.25 1.09 1.15 0.99 1.02 1.04 1.14 1.13 1.03 0.95 1.00 1.01 12.80HT -VII - Temporary Supply 0.00 0.00 0.00 0.00 0.00 0.00 0.00 0.00 0.00 0.00 0.00 0.00 0.00HT - RESCOs 58.96 35.48 43.25 47.27 61.55 67.11 59.15 57.26 50.20 59.86 56.51 56.20 652.80
0.000.000.000.000.00
HT Category at 33 KV 21.65 20.15 19.94 18.09 26.55 26.80 25.14 24.24 29.61 29.31 29.01 27.45 297.92HT-I Industry Segregated 16.11 14.97 14.72 13.27 14.24 13.41 14.70 15.82 16.45 16.13 16.04 14.62 180.48
HT-I (B) Ferro-Alloys 0.01 0.01 0.00 0.00 0.00 0.00 0.00 0.00 0.00 0.00 0.00 0.00 0.02HT-II - Others 1.20 1.02 0.91 0.99 1.12 1.07 1.13 1.14 1.15 1.16 1.11 1.14 13.13HT-III Airports, Railway and Busstations 0.00 0.00 0.00 0.00 0.00 0.00 0.00 0.00 0.00 0.00 0.00 0.00 0.00HT -IV A Govt Lift Irrigation 0.22 0.18 0.06 0.04 6.78 8.53 5.75 3.57 0.84 0.96 0.51 0.36 27.80HT- IV B - CP Water Supply Schemes 0.01 0.01 0.00 0.00 0.00 0.00 0.01 0.01 7.79 7.80 7.80 7.80 31.23
HT-VI Townships and Residential Colonies 4.11 3.97 4.24 3.78 4.40 3.78 3.55 3.70 3.38 3.26 3.55 3.54 45.26HT -VII - Temporary Supply 0.00HT - RESCOs 0.00
0.000.000.000.000.00
HT Category at 132 KV 101.75 103.82 109.84 140.67 178.52 184.34 165.72 144.48 103.50 105.28 111.19 103.44 1552.55HT-I Industry Segregated 54.74 52.34 57.59 53.24 57.39 62.12 52.88 49.68 59.29 59.90 64.95 60.78 684.89
HT-I (B) Ferro-Alloys 0.00 0.00 0.00 0.00 0.00 0.00 0.00 0.00 0.00 0.00 0.00 0.00 0.00HT-II - Others 2.22 1.14 0.38 0.49 0.41 0.27 0.20 0.20 0.20 0.20 0.20 0.20 6.12HT-III Airports, Railway and Busstations 0.00 0.00 0.00 0.00 0.00 0.00 0.00 0.00 0.00 0.00 0.00 0.00 0.00HT -IV A Govt Lift Irrigation 0.55 7.12 7.47 45.91 76.44 78.54 68.91 50.95 2.04 0.52 0.85 0.64 339.94HT- IV B - CP Water Supply Schemes 0.00 0.00 0.00 0.00 0.00 0.00 0.00 0.00 0.00 0.00 0.00 0.00 0.00HT-V (A) Railway Traction 35.23 34.28 35.19 32.95 35.97 34.54 35.10 35.66 34.35 37.63 37.36 33.48 421.74HT-V (B) HMR 0.00 0.00 0.00 0.00 0.00 0.00 0.00 0.00 0.00 0.00 0.00 0.00HT-VI Townships and Residential Colonies 9.00 8.94 9.22 8.09 8.31 8.88 8.63 7.99 7.62 7.03 7.82 8.34 99.86HT -VII - Temporary Supply 0.00HT - RESCOs 0.00
0.00Page 148 of 195

0.000.000.000.00
Total 932.88 783.26 764.21 961.37 1286.37 1018.99 1335.64 1033.09 1046.41 1046.51 1080.19 1086.16 12375.08
2017-18Sales / Forecast Sales (MU) D Link April May June July August September October November December January February March Total Remarks
LT Category 747.63 619.13 584.52 762.01 989.59 791.93 1110.77 801.46 847.91 840.54 872.05 902.12 9869.65Category I (A&B) - Domestic 295.10 308.30 315.58 288.15 277.15 284.29 289.24 288.45 259.97 239.43 235.58 262.10 3343.33Category II (A,B,C & D) - Non-domestic/Commercial 60.01 60.53 62.13 57.04 52.88 54.93 54.12 55.95 51.68 52.07 50.59 55.10 667.03Category III - Industrial 22.33 20.29 20.50 19.06 17.50 17.66 17.00 18.52 21.73 28.15 23.77 21.57 248.08Category IV (A,&B) - Cottage Industries & Agrobased Ind. 0.61 0.57 0.58 0.57 0.52 0.53 0.54 0.55 0.51 0.57 0.56 0.54 6.65Category V (A, B & C) - Irrigation and Agriculture 340.82 201.74 159.27 369.53 613.93 406.03 720.85 408.88 484.99 490.65 532.92 534.03 5263.65Category VI (A & B) - Local Bodies, St. Lighting & PWS 24.43 24.44 23.51 23.57 22.96 23.93 24.71 25.31 24.77 25.53 24.73 24.13 292.03Category VII (A & B) - General Purpose 4.33 3.27 2.94 4.09 4.65 4.56 4.31 3.79 4.27 4.13 3.90 4.65 48.89Category VIII -Temporary Supply 0.00
0.000.000.000.000.000.000.000.000.00
HT Category at 11 KV 128.53 97.19 105.54 106.61 125.77 132.18 122.37 133.38 136.38 141.23 139.44 126.23 1494.85HT-I Industry Segregated 43.48 38.33 39.83 38.22 38.95 38.86 38.60 51.35 63.99 59.58 59.90 46.47 557.59
HT-I (B) Ferro-Alloys 0.00 0.00 0.00 0.00 0.00 0.00 0.00 0.00 0.00 0.00 0.00 0.00 0.00HT-II - Others 11.52 11.23 10.51 8.96 10.34 10.27 10.05 10.13 9.24 7.99 9.54 10.03 119.82HT-III Airports, Railway and Busstations 0.85 0.83 0.86 0.68 0.72 0.73 0.67 0.70 0.64 0.61 0.66 0.64 8.60HT -IV A Govt Lift Irrigation 1.26 0.87 0.17 0.27 1.75 2.58 1.66 1.78 0.84 1.12 1.39 1.08 14.78HT- IV B - CP Water Supply Schemes 6.95 6.78 6.62 6.79 6.98 6.73 6.82 6.88 6.80 6.80 6.35 6.75 81.26
HT-VI Townships and Residential Colonies 1.27 1.12 1.17 1.01 1.04 1.06 1.16 1.16 1.05 0.97 1.02 1.03 13.06HT -VII - Temporary Supply 0.00 0.00 0.00 0.00 0.00 0.00 0.00 0.00 0.00 0.00 0.00 0.00 0.00HT - RESCOs 63.20 38.03 46.36 50.67 65.97 71.94 63.41 61.37 53.81 64.16 60.57 60.24 699.74
0.000.000.000.000.00
HT Category at 33 KV 41.67 40.52 39.93 38.43 46.93 46.76 45.50 44.24 42.16 41.84 40.38 39.96 508.32HT-I Industry Segregated 16.45 15.28 15.03 13.54 14.54 13.69 15.00 16.14 16.79 16.46 16.37 14.92 184.21
HT-I (B) Ferro-Alloys 0.00 0.00 0.00 0.00 0.00 0.00 0.00 0.00 0.00 0.00 0.00 0.00 0.00HT-II - Others 1.22 1.04 0.92 1.01 1.14 1.09 1.15 1.16 1.17 1.19 1.13 1.16 13.39HT-III Airports, Railway and Busstations 0.00 0.00 0.00 0.00 0.00 0.00 0.00 0.00 0.00 0.00 0.00 0.00 0.00HT -IV A Govt Lift Irrigation 0.22 0.18 0.06 0.04 6.78 8.53 5.75 3.57 0.84 0.96 0.51 0.36 27.80HT- IV B - CP Water Supply Schemes 19.54 19.93 19.53 19.92 19.92 19.53 19.93 19.54 19.86 19.86 18.70 19.86 236.12
HT-VI Townships and Residential Colonies 4.24 4.10 4.38 3.91 4.55 3.91 3.67 3.83 3.50 3.37 3.67 3.65 46.79HT -VII - Temporary Supply 0.00HT - RESCOs 0.00
0.000.000.000.000.00
HT Category at 132 KV 101.07 104.19 111.06 141.58 322.33 328.33 309.61 145.71 104.85 106.63 112.64 104.85 1992.84HT-I Industry Segregated 55.52 53.08 58.41 53.91 58.28 63.03 53.64 50.39 60.13 60.76 65.87 61.65 694.65
HT-I (B) Ferro-Alloys 0.00 0.00 0.00 0.00 0.00 0.00 0.00 0.00 0.00 0.00 0.00 0.00 0.00HT-II - Others 0.28 0.28 0.28 0.28 0.28 0.28 0.28 0.28 0.28 0.28 0.28 0.28 3.38HT-III Airports, Railway and Busstations 0.00 0.00 0.00 0.00 0.00 0.00 0.00 0.00 0.00 0.00 0.00 0.00 0.00HT -IV A Govt Lift Irrigation 0.55 7.12 7.47 45.91 219.03 221.13 211.50 50.95 2.04 0.52 0.85 0.64 767.71HT- IV B - CP Water Supply Schemes 0.00 0.00 0.00 0.00 0.00 0.00 0.00 0.00 0.00 0.00 0.00 0.00 0.00HT-V (A) Railway Traction 35.33 34.38 35.29 33.04 36.07 34.63 35.19 35.76 34.44 37.74 37.47 33.57 422.91HT-V (B) HMR 0.00 0.00 0.00 0.00 0.00 0.00 0.00 0.00 0.00 0.00 0.00 0.00HT-VI Townships and Residential Colonies 9.39 9.32 9.62 8.44 8.67 9.26 9.00 8.33 7.95 7.33 8.16 8.70 104.19HT -VII - Temporary Supply 0.00HT - RESCOs 0.00
0.000.000.000.000.00
Total 1018.90 861.03 841.04 1048.63 1484.62 1299.20 1588.25 1124.79 1131.30 1130.23 1164.51 1173.16 13865.66
Page 149 of 195

Form 4
Total Sales, MU 10286.68 11104.79 11565.68 12375.08 13865.66 0.00Sales ( LT, 11kV, 33kV) (MU) Form 3 9035.47 9850.82 10168.51 10822.53 11872.82 0.00EHT Sales (MU) Form 3 1251.21 1253.97 1397.17 1552.55 1992.84 0.00
Total Losses, MU 2170.82 2348.30 2268.26 2325.12 2457.60 0.00Distribution System Losses (MU) Form 4a 1580.99 1696.82 1704.26 1518.04 1608.32 0.00Transmission System Losses (MU) 589.83 651.49 564.00 807.09 849.28 0.00
Total Losses, (%) 17.43 17.46 16.40 15.82 15.06 0.00Transmission Losses (%) 4.73 4.84 4.08 5.49 5.20 0.00Distribution System Losses(%) Form 4a 14.89 14.69 14.35 12.30 11.93 0.00Input to Distribution System 10616.46 11547.64 11872.77 12340.57 13481.14 0.00
Power Purchase Requirement (MU) 12457.50 13453.10 13833.93 14700.20 16323.26 0.00 Availability Form 4.1 12457.50 13453.10 14600.18 17115.86 19593.47 0.00 Dispatch Form 4.2 12457.50 13453.10 14600.18 14700.20 16323.11 0.00
Surplus /(deficit) 0.00 0.00 766.24 2415.65 3270.21 0.00
Note: 1. Transmission Losses percentage e.g. 4.52 % to be entered in numbers as 4.52 in Form 4b only2. Transmission Losses to include PGCIL Losses.3. The Transmission Losses percentage should be consistent with calculations in Form 4b
Power Purchase Requirement
Particulars Detail Links Base Year 2014-15 2015-16 2016-17 2017-18 2018-19
Page 150 of 195

Base Year 2014-15 2015-16 2016-17 2017-18 2018-19Total Transmission Losses (Inclusive of PGCIL) (%)
Input to TSTransco Network (MU)
TSTransco Losses (%) 4.73 4.84 4.08 5.49 5.20
inclusive of PGCIL losses
inclusive of PGCIL losses
inclusive of PGCIL losses
TSTransco Losses (MU)
Input to PGCIL (For CGS) (MU)PGCIL Losses (%) (For CGS)PGCIL Losses (MU) (For CGS)
Relates to detailed calculation of the Transmission Losses percentage entered in Form 4. The working of the losses (MU & percentages) to be entered under working notes Form 4b.
2017-18 2018-19 Remarks
Form 4B - Transmission Losses
Particulars Detail Links Base Year 2014-15 2015-16 2016-17
Page 151 of 195

Index sheet
Form 4a Energy Losses (Distribution System)
D - Link Base Year 2014-15 2015-16 2016-17 2017-18 2018-19I. Losses in 33 KV System and Connected Equipment
(i) Total Energy delivered into 33 KV Distribution System from EHT SSs A 10616.46 11547.64 11872.77 12340.57 13481.14
(ii) Energy delivered by all other Generating Stations at 33kV B
(iii) Energy consumed by HT consumers at 33KV (Sales + Third Party) X 295.15 339.20 286.39 297.92 508.32
(iv) Energy Delivered into 11 KV and LT System from 33/11 KV SSs C 9843.57 10691.10 11062.13 11549.03 12433.58
Losses (33 kV System) (A + B) - (C + X) 477.74 517.33 524.25 493.62 539.25 0.00
% Losses (33 kV System) 100 x [(A+B)-(C+X)] / (A+B) 4.50 4.48 4.42 4.00 4.00 0.00
II. Losses in 11 KV System and Connected Equipment
(i) Energy delivered into 11 KV system from 33/11kV SSs C 9843.57 10691.10 11062.13 11549.03 12433.58
(ii) Energy delivered into 11 KV Distribution System from EHT SSs D
(iii) Energy delivered at 11kV from all other Generating Stations E
(iv) Total Energy delivered into 11 KV and LT Distribution System C+D+E 9843.57 10691.10 11062.13 11549.03 12433.58 0.00
(v) Energy consumed by HT consumers at 11KV (Sales + Third Party) Y 1057.83 1241.10 1249.32 1317.04 1494.85
(vi) Total Output from 11kV to LT F 8318.17 8947.53 9301.89 9743.46 10416.52
Losses (11kV System) (C + D + E) - (Y + F) 467.57 502.48 510.93 488.52 522.21 0.00
% Losses (11kV System) [(C+D+E)-(Y+F)] x 100 / (C+D+E) 4.75 4.70 4.62 4.23 4.20 0.00
III. Losses in LT system and connected equipment
(i) Energy delivered to LT system from 11/400 V DTRs F 8318.17 8947.53 9301.89 9743.46 10416.52
(ii) Energy sold to metered categories Z 3321.13 3532.14 3960.85 4265.18 4606.01
(iii) Energy sold to un-metered categories N 4361.35 4738.38 4671.95 4942.39 5263.65
Losses (LT System) F-(Z+N) 635.68 677.00 669.08 535.89 546.87 0.00
% Losses (LT System) [F-(Z+N)] x 100 / (F) 7.64 7.57 7.19 5.50 5.25 0.00
IV. Total losses in the Distribution System(i) Total Input to the distribution system A + B + D + E 10616.46 11547.64 11872.77 12340.57 13481.14 0.00
(ii) Total Output from the Distribution Sytem X + Y + Z + N 9035.47 9850.82 10168.51 10822.53 11872.82 0.00
(iii) EHT Sales G 1251.21 1253.97 1397.17 1552.55 1992.84 0.00
Distribution System Losses (A + B + D + E)-(X + Y + Z + N) 1580.99 1696.82 1704.26 1518.04 1608.32 0.00
% Distribution System Losses ( Excluding EHT Sales) [(A+B+D+E)-(X+Y+Z+N)] x 100 / (A+B+D+E) 14.89 14.69 14.35 12.30 11.93 0.00
% Distribution System Losses ( Including EHT Sales) [(A+B+D+E)-(X+Y+Z+N)] x 100 / (A+B+D+E +G) 13.32 13.25 12.84 10.93 10.39 0.00
Particulars
Page 152 of 195

Index sheet
Form 4.1
Base Year
April May June July August September October November December January February March Total
TSGENCOThermalVTPS I 111.78 121.85 99.63 113.96 87.37 107.19 72.46 97.42 110.23 125.69 116.13 128.43 1292.15 1292.15VTPS II 0.00 0.00 0.00 0.00 0.00 0.00 0.00 0.00 0.00 0.00 0.00 0.00 0.00 0.00VTPS III 0.00 0.00 0.00 0.00 0.00 0.00 0.00 0.00 0.00 0.00 0.00 0.00 0.00 0.00VTPS IV 53.24 51.47 43.95 49.30 49.10 47.70 39.61 47.00 44.78 50.41 48.20 46.47 571.23 571.23RTPP I 39.44 40.40 37.39 23.67 16.41 10.95 25.77 23.91 36.89 39.27 34.54 37.63 366.27 366.27RTPP Stage-II 42.60 41.69 39.55 40.00 38.81 22.01 26.84 35.97 28.69 41.08 40.39 39.79 437.41 437.41RTPP Stage-III 15.54 20.92 18.91 19.25 17.21 14.36 14.35 15.24 9.40 20.06 19.47 18.93 203.61 203.61KTPS A 56.60 57.91 48.34 39.57 35.73 46.92 50.29 51.67 56.05 54.61 47.22 58.81 603.73 603.73KTPS B 0.00 0.00 0.00 0.00 0.00 0.00 0.00 0.00 0.00 0.00 0.00 0.00 0.00 0.00KTPS C 0.00 0.00 0.00 0.00 0.00 0.00 0.00 0.00 0.00 0.00 0.00 0.00 0.00 0.00KTPS D 0.00 0.00 0.00 0.00 0.00 0.00 0.00 0.00 0.00 0.00 0.00 0.00 0.00 0.00KTPS Stage VI 45.43 48.55 30.55 38.38 35.94 44.32 44.48 46.66 47.18 44.54 39.87 48.07 513.96 513.96RTS B 5.34 6.18 5.27 5.35 5.23 5.14 5.18 5.61 4.44 6.11 4.69 5.05 63.59 63.59NTS 0.00 0.00 0.00 0.00 0.00 0.00 0.00 0.00 0.00 0.00 0.00 0.00 0.00 0.00Kakatiya Thermal Power Plant Stage I 41.03 51.37 36.83 3.86 32.52 42.74 40.83 37.95 45.50 49.96 37.86 45.85 466.30 466.30Kakatiya Thermal Power Plant Stage II 0.00 0.00 0.00 0.00 0.00 0.00 0.00 0.00 0.00 0.00 0.00 0.00 0.00 0.00Damodaram Sanjeevaiah Thermal power plant - I 0.00 0.00 0.00 0.00 0.00 0.00 0.00 0.00 0.00 0.00 0.00 0.00 0.00 0.00Damodaram Sanjeevaiah Thermal power plant - II 0.00 0.00 0.00 0.00 0.00 0.00 0.00 0.00 0.00 0.00 0.00 0.00 0.00 0.00KTPS Stage VI Infirm Power 52.31 46.19 45.13 34.99 0.48 36.82 45.39 49.22 50.06 53.23 48.66 51.81 514.30 514.30
0.00 0.00
0.00 0.000.00 0.000.00 0.00
TOTAL THERMAL 463.31 486.53 405.55 368.31 318.81 378.15 365.21 410.65 433.21 484.97 437.02 480.84 5032.54 0.00 5032.54
MACHKUND PH AP Share 5.37 6.11 3.94 4.32 4.00 4.44 3.22 3.70 3.66 3.52 3.04 3.99 49.31 49.31TUNGBHADRA PH AP Share 0.41 0.62 -0.08 1.80 4.63 3.63 2.92 2.98 1.40 2.60 1.84 1.54 24.29 24.29USL 7.92 2.27 4.94 6.62 1.67 2.96 6.46 7.76 7.14 7.97 6.28 9.65 71.64 71.64LSR 18.62 18.12 13.44 15.00 16.36 12.94 16.72 17.77 17.88 18.15 14.00 19.00 198.00 198.00DONKARAYI 1.51 1.16 0.59 0.70 1.63 1.65 2.16 2.20 2.21 2.11 0.81 1.57 18.30 18.30SSLM 21.41 9.46 3.97 14.90 58.69 38.89 14.48 7.60 8.25 14.94 19.88 21.90 234.38 234.38NSPH 6.11 -0.08 -0.07 0.53 76.08 49.54 25.73 8.17 8.78 12.17 9.13 15.61 211.71 211.71NSRCPH 0.00 0.00 0.00 0.00 5.49 6.60 5.88 6.54 4.72 3.24 0.77 0.00 33.23 33.23NSLCPH 0.00 0.00 0.00 0.00 3.60 4.48 2.56 2.43 1.66 0.66 0.00 0.00 15.39 15.39POCHAMPAD PH 0.00 0.00 0.00 0.52 2.03 1.46 1.91 0.19 0.43 1.15 1.27 1.25 10.19 10.19NIZAMSAGAR PH 0.00 0.00 0.00 0.00 0.00 0.26 0.14 0.00 0.11 0.57 0.45 0.48 1.99 1.99PABM 0.00 0.00 0.00 0.04 0.33 0.21 0.00 0.00 0.00 0.00 0.08 0.13 0.76 0.76MINI HYDRO&OTHERS 0.02 0.00 0.01 0.06 0.21 0.20 0.23 0.06 0.19 0.18 0.17 0.18 1.49 1.49SINGUR 0.07 0.00 0.00 0.00 0.00 0.06 0.00 0.00 0.00 0.06 0.12 0.39 0.68 0.68SSLM LCPH 0.53 -0.01 0.00 0.43 83.24 61.53 31.30 3.73 2.31 2.51 7.01 17.73 210.31 210.31Nagarjunasagar Tail Pond Dam Power House 0.00 0.00 0.00 0.00 0.00 0.00 0.00 0.00 0.00 0.00 0.00 0.00 0.00 0.00Priyadarshini Jurala Hydro Electric Project- AP Share -0.01 -0.01 -0.01 5.91 16.59 9.60 7.86 1.64 0.58 0.17 -0.01 -0.02 42.29 42.29Lower Jurala Hydro Electric Project 0.00 0.00 0.00 0.00 0.00 0.00 0.00 0.00 0.00 0.00 0.00 0.00 0.00 0.00Ramagiri Wind Mills 0.00 0.00 0.00 0.00 0.00 0.00 0.00 0.00 0.00 0.00 0.00 0.00 0.00 0.00POCHAMPAD PH Stage 2 0.00 0.00 0.00 0.14 0.31 0.25 0.67 0.02 0.03 0.53 0.53 0.56 3.05 3.05
0.00 0.000.00 0.000.00 0.000.00 0.000.00 0.000.00 0.00
TOTAL HYDRO 61.95 37.63 26.72 50.97 274.87 198.68 122.22 64.77 59.34 70.53 65.37 93.96 1127.01 0.00 1127.01TOTAL TSGENCO 525.27 524.16 432.26 419.28 593.68 576.83 487.43 475.42 492.55 555.50 502.38 574.80 6159.56 0.00 6159.56
Central Generating Stations NTPCNTPC (SR) NTPC (SR) 71.66 74.39 53.12 58.06 48.23 51.48 50.60 65.11 72.45 66.89 68.88 73.08 753.96 753.96 NTPC (SR) Stage III 18.46 18.37 16.00 16.74 16.12 16.42 15.94 18.14 13.74 23.09 19.53 17.74 210.30 210.30 Total NTPC(SR) 90.13 92.76 69.12 74.80 64.36 67.90 66.54 83.25 86.19 89.98 88.41 90.82 964.26 0.00 964.26
NTPC (ER) Farakka 3.25 0.00 0.00 0.00 0.00 0.00 0.00 0.00 0.00 0.00 0.00 0.00 3.25 3.25 Kahalgaon 1.44 0.00 0.00 0.00 0.00 0.00 0.00 0.00 0.00 0.00 0.00 0.00 1.44 1.44 Talcher - Stage 1 2.09 0.00 0.00 0.00 0.00 0.00 0.00 0.00 0.00 0.00 0.00 0.00 2.09 2.09
Yearly Auxiliary Consumption
(MU)
Net Energy Availability
(MU)
Energy Availability
Variable Cost (Rs. / kWh)
Gross Energy Availability (MU)
Generating Station D LinkPLF (%)
Page 153 of 195

Talcher Stage 2 28.32 26.33 32.08 34.49 34.34 34.95 31.51 40.91 41.76 43.70 39.00 45.05 432.44 432.44 Others 0.00 0.00 0.00 0.00 0.00 0.00 0.00 0.00 0.00 0.00 0.00 0.00 0.00 0.00 Total NTPC(ER) 35.10 26.33 32.08 34.49 34.34 34.95 31.51 40.91 41.76 43.70 39.00 45.05 439.23 0.00 439.23
Total NTPC 125.23 119.09 101.21 109.29 98.70 102.85 98.05 124.16 127.95 133.68 127.42 135.86 1403.48 0.00 1403.48
NLC TS-II Stage-I 11.65 11.95 10.67 12.74 11.09 10.01 6.83 9.17 8.17 13.92 11.08 12.78 130.06 130.06 Stage-II 20.50 20.10 20.14 19.55 12.86 13.51 16.78 16.14 21.11 25.09 19.39 22.28 227.45 227.45 Total NLC 32.14 32.05 30.80 32.29 23.95 23.52 23.61 25.32 29.28 39.01 30.47 35.06 357.51 0.00 357.51
NPC NPC-MAPS 1.54 1.53 1.54 1.63 1.63 1.57 3.20 2.19 3.38 3.39 2.78 3.40 27.76 27.76 NPC-Kaiga unit I 12.08 13.03 13.03 14.17 14.53 13.91 13.57 10.96 8.82 11.44 10.79 11.99 148.33 148.33 NPC-Kaiga unit II 11.21 14.20 13.64 14.74 15.24 10.74 10.84 7.75 15.63 14.58 13.14 8.81 150.52 150.52 Total NPC 24.83 28.76 28.21 30.54 31.40 26.23 27.61 20.90 27.83 29.41 26.70 24.20 326.61 0.00 326.61
NTPC - SimhadriNTPC Simhadri Stage I 101.49 93.84 100.58 92.43 105.95 98.03 88.40 59.11 92.65 99.42 98.43 108.58 1138.92 1138.92NTPC Simhadri Stage II 44.30 40.45 44.72 36.10 23.26 32.98 30.64 44.33 49.76 58.32 51.18 50.57 506.61 506.61
Total NTPC- Simhadri 145.79 134.29 145.29 128.53 129.21 131.02 119.05 103.44 142.41 157.74 149.61 159.15 1645.54 0.00 1645.54
CGS - NewVallur Thermal Power Plant 4.84 3.54 2.70 5.82 1.61 5.98 7.53 7.51 7.11 16.52 10.81 9.26 83.21 83.21
0.00 0.000.00 0.00
TOTAL CGS 332.83 317.73 308.21 306.47 284.87 289.59 275.84 281.33 334.57 376.36 345.01 363.54 3816.35 0.00 3816.35
APGPCLAPGPCL I - Allocated capacity 0.69 0.64 0.80 0.78 0.67 0.66 0.63 0.64 0.74 0.70 1.00 1.59 9.52 9.52APGPCL I - Unutilised capacity 0.46 0.01 0.03 0.02 0.03 0.03 0.01 0.01 0.08 0.11 0.17 0.36 1.31 1.31APGPCL II - Allocated capacity 2.41 2.30 2.43 2.73 2.37 2.29 2.22 2.22 2.77 2.55 1.30 0.00 25.58 25.58APGPCL II - Unutilised capacity 0.60 0.41 0.00 0.00 0.00 0.00 0.00 0.00 0.00 0.00 0.00 0.00 1.02 1.02Total APGPCL 4.16 3.36 3.26 3.52 3.07 2.97 2.86 2.87 3.59 3.36 2.47 1.94 37.44 0.00 37.44
IPPSGVK 11.96 11.84 13.15 12.28 11.30 10.83 11.43 13.08 15.65 15.21 13.29 11.46 151.48 151.48Spectrum 13.26 12.30 12.56 12.53 11.80 10.76 11.52 14.31 19.22 17.85 15.52 15.59 167.23 167.23Kondapalli (Naphtha) 0.00 0.00 0.00 0.00 0.00 0.00 0.00 0.00 0.00 0.00 0.00 0.00 0.00 0.00Kondapalli (Gas) 23.60 22.35 19.14 18.42 17.10 15.38 18.18 18.53 8.52 15.70 21.06 25.58 223.57 223.57BSES 5.62 5.15 8.14 7.27 5.94 5.66 5.46 5.83 8.49 6.83 5.11 3.58 73.08 73.08GVK Extension 0.00 0.16 0.07 0.00 0.00 0.00 0.00 0.00 0.00 0.00 0.00 0.00 0.23 0.23Vemagiri 17.48 6.85 0.00 0.00 0.00 0.00 0.00 0.00 0.00 0.00 0.00 0.00 24.32 24.32Gautami 0.00 0.00 0.00 0.00 0.00 0.00 0.00 0.00 0.00 0.00 0.00 0.00 0.00 0.00Konaseema 0.71 0.00 0.00 0.00 0.00 0.00 0.00 0.00 0.00 0.00 0.00 0.00 0.71 0.71
0.00 0.000.00 0.000.00 0.000.00 0.000.00 0.00
TOTAL IPPS 72.63 58.64 53.06 50.50 46.14 42.64 46.59 51.74 51.89 55.60 54.98 56.21 640.62 0.00 640.62
NCENCE - Bio-Mass 8.95 7.96 7.13 8.71 7.83 7.25 6.79 7.30 8.26 9.70 10.06 10.97 100.90 100.90NCE - Bagasse 8.29 4.28 5.10 10.52 6.14 4.18 0.00 4.50 11.08 10.22 6.07 42.17 112.57 112.57NCE - Municipal Waste to Energy 0.00 0.00 0.00 0.00 0.00 0.00 0.00 0.00 0.00 0.00 0.00 0.00 0.00 0.00NCE - Industrial Waste based power project 0.00 0.00 0.00 0.00 0.00 0.00 0.00 0.00 0.00 0.00 0.00 0.00 0.00 0.00NCE - Wind Power 0.00 0.00 0.00 0.00 0.00 0.00 0.00 0.00 0.00 0.00 0.00 0.00 0.00 0.00NCE - Mini Hydel 0.00 0.14 0.00 0.00 1.43 0.63 0.79 0.50 0.29 0.44 0.42 0.62 5.25 5.25NCE - NCL Energy Ltd 0.00 0.00 0.00 0.34 0.66 0.54 0.62 0.55 0.42 0.12 0.00 0.00 3.25 3.25NCE-Others 1.83 2.83 2.98 3.34 4.85 5.19 5.77 6.13 6.60 6.67 6.78 7.50 60.47 60.47TOTAL NCE 19.08 15.20 15.21 22.92 20.91 17.79 13.97 18.98 26.64 27.15 23.33 61.26 282.44 0.00 282.44
OTHERSSrivathsa 0.00 0.00 0.00 0.00 0.00 0.00 0.00 0.00 0.00 0.00 0.00 0.00 0.00 0.00LVS 0.00 0.00 0.00 0.00 0.00 0.00 0.00 0.00 0.00 0.00 0.00 0.00 0.00 0.00Vishakapatnam Steel Plant 0.00 0.00 0.00 0.00 0.00 0.00 0.00 0.00 0.00 0.00 0.00 0.00 0.00 0.00NB Ferro Alloys 0.00 0.00 0.00 0.00 0.00 0.00 0.00 0.00 0.00 0.00 0.00 0.00 0.00 0.00Sponge Iron * 0.00 0.00 0.00 0.00 0.00 0.00 0.00 0.00 0.00 0.00 0.00 0.00 0.00 0.00Heavy Water Plant * 0.00 0.00 0.00 0.00 0.00 0.00 0.00 0.00 0.00 0.00 0.00 0.00 0.00 0.00Kesoram * 0.00 0.00 0.00 0.00 0.00 0.00 0.00 0.00 0.00 0.00 0.00 0.00 0.00 0.00Essar Steels * 0.00 0.00 0.00 0.00 0.00 0.00 0.00 0.00 0.00 0.00 0.00 0.00 0.00 0.00
0.00 0.000.00 0.000.00 0.00
TOTAL OTHERS 0.00 0.00 0.00 0.00 0.00 0.00 0.00 0.00 0.00 0.00 0.00 0.00 0.00 0.00 0.00
MARKETPTC 0.00 0.00 0.00 0.00 0.00 0.00 0.00 0.00 0.00 0.00 0.00 0.00 0.00 0.00
Page 154 of 195

RCL and Short-Term Sources(IG Wells,Kesoram) 0.00 0.00 0.00 0.00 0.00 0.00 0.00 0.00 0.00 0.00 0.00 0.00 0.00 0.00CPDCL 0.00 0.00 0.00 0.00 0.00 0.00 0.00 0.00 0.00 0.00 0.00 0.00 0.00 0.00EPDCL 0.00 0.00 0.00 0.00 0.00 0.00 0.00 0.00 0.00 0.00 0.00 0.00 0.00 0.00NPDCL 0.00 0.00 0.00 0.00 0.00 0.00 0.00 0.00 0.00 0.00 0.00 0.00 0.00 0.00SPDCL 0.00 0.00 0.00 0.00 0.00 0.00 0.00 0.00 0.00 0.00 0.00 0.00 0.00 0.00UI 0.00 0.00 0.00 0.00 0.00 0.00 0.00 0.00 0.00 0.00 0.00 0.00 0.00 0.00Other Short Term Sources 0.00 0.00 0.00 0.00 0.00 0.00 0.00 0.00 0.00 0.00 0.00 0.00 0.00 0.00PGCIL UI Energy 0.00 0.00 0.00 0.00 0.00 0.00 0.00 0.00 0.00 0.00 0.00 0.00 0.00 0.00NTPC Simhadri UI Energy 0.00 0.00 0.00 0.00 0.00 0.00 0.00 0.00 0.00 0.00 0.00 0.00 0.00 0.00Other Short Term Sources/Traders 74.25 2.02 -45.13 92.88 141.27 252.67 139.23 -30.81 63.53 198.94 236.32 136.88 1262.04 1262.04Mediumt Term Sources/Traders (Medium Term) 0.00 0.00 0.00 0.00 16.54 20.63 25.48 41.04 40.06 43.69 32.83 38.77 259.06 259.06
0.00 0.000.00 0.000.00 0.00
TOTAL MARKET 74.25 2.02 -45.13 92.88 157.81 273.30 164.71 10.23 103.59 242.64 269.16 175.65 1521.10 0.00 1521.10
TOTAL (From All Sources) 1028.21 921.12 766.88 895.57 1106.48 1203.12 991.40 840.57 1012.83 1260.60 1197.32 1233.41 12457.50 0.00 12457.50
2014-15
April May June July August September October November December January February March Total
TSGENCOThermalVTPS I 115.39 111.91 108.81 104.35 80.28 81.54 93.29 115.49 121.04 119.04 105.91 122.96 1280.03 1280.03VTPS II 0.00 0.00 0.00 0.00 0.00 0.00 0.00 0.00 0.00 0.00 0.00 0.00 0.00 0.00VTPS III 0.00 0.00 0.00 0.00 0.00 0.00 0.00 0.00 0.00 0.00 0.00 0.00 0.00 0.00VTPS IV 47.51 43.23 51.64 44.69 46.08 40.31 45.71 48.98 25.72 52.68 44.51 44.95 536.01 536.01RTPP I 34.60 27.96 24.07 22.61 26.35 30.67 36.10 34.29 33.58 34.11 33.17 37.62 375.13 375.13RTPP Stage-II 41.54 36.41 35.29 26.43 36.16 27.11 39.32 31.49 37.12 38.68 34.62 42.33 426.49 426.49RTPP Stage-III 20.07 16.58 17.51 16.45 6.20 13.86 19.00 16.77 16.76 17.61 17.16 21.12 199.11 199.11KTPS A 53.01 48.73 46.87 49.36 46.59 40.49 58.12 54.25 51.08 51.29 59.10 67.50 626.39 626.39KTPS B 0.00 0.00 0.00 0.00 0.00 0.00 0.00 0.00 0.00 0.00 0.00 0.00 0.00 0.00KTPS C 0.00 0.00 0.00 0.00 0.00 0.00 0.00 0.00 0.00 0.00 0.00 0.00 0.00 0.00KTPS D 45.29 41.92 41.51 40.33 39.24 35.40 40.00 27.11 25.78 53.15 46.19 54.99 490.92 490.92KTPS Stage VI 48.50 45.33 47.73 50.89 44.70 42.78 51.36 49.57 52.64 47.65 46.99 55.74 583.88 583.88RTS B 4.98 5.31 4.94 4.78 4.79 2.01 -0.07 -0.13 0.52 -0.07 -0.06 -0.07 26.92 26.92NTS 0.00 0.00 0.00 0.00 0.00 0.00 0.00 0.00 0.00 0.00 0.00 0.00 0.00 0.00Kakatiya Thermal Power Plant Stage I 51.91 51.24 48.99 53.46 52.26 48.10 54.19 52.48 54.11 52.71 43.91 49.47 612.83 612.83Kakatiya Thermal Power Plant Stage II 0.00 0.00 0.00 0.00 0.00 0.00 0.00 0.00 0.00 0.00 0.00 0.00 0.00 0.00Damodaram Sanjeevaiah Thermal power plant - I 0.00 0.00 0.00 0.00 0.00 0.00 0.00 0.00 0.00 0.00 0.00 0.00 0.00 0.00Damodaram Sanjeevaiah Thermal power plant - II 0.00 0.00 0.00 0.00 0.00 0.00 0.00 0.00 0.00 0.00 0.00 0.00 0.00 0.00
0.00 0.000.00 0.000.00 0.000.00 0.000.00 0.00
TOTAL THERMAL 462.79 428.62 427.36 413.35 382.65 362.28 437.02 430.31 418.34 466.86 431.50 496.61 5157.70 0.00 5157.70
MACHKUND PH AP Share 4.67 3.23 2.57 2.44 0.46 3.13 2.34 2.38 2.06 2.36 1.96 1.28 28.89 28.89TUNGBHADRA PH AP Share 0.27 -0.09 0.00 0.00 0.30 2.85 2.76 2.58 3.00 3.26 3.19 3.25 21.38 21.38USL 9.09 6.28 0.00 0.00 0.00 0.00 0.00 0.00 0.00 0.00 0.00 0.00 15.37 15.37LSR 20.76 20.52 0.79 0.00 0.00 0.00 0.00 0.00 0.00 0.00 0.00 0.00 42.06 42.06DONKARAYI 2.07 2.04 0.09 0.00 0.00 0.00 0.00 0.00 0.00 0.00 0.00 0.00 4.20 4.20SSLM 14.15 0.27 0.30 0.00 0.00 0.00 0.00 0.00 0.00 0.00 0.00 0.00 14.72 14.72NSPH 1.50 -0.08 2.22 7.04 47.34 116.88 73.04 27.04 7.00 0.03 2.52 7.42 291.96 291.96NSRCPH 0.00 0.00 0.00 0.00 0.00 0.00 0.00 0.00 0.00 0.00 0.00 0.00 0.00 0.00NSLCPH 0.00 0.00 0.00 0.00 0.23 2.23 3.56 3.78 2.59 0.42 0.00 0.00 12.81 12.81POCHAMPAD PH 0.69 0.00 0.00 0.00 0.00 0.05 0.32 0.00 0.34 0.00 0.03 0.03 1.44 1.44NIZAMSAGAR PH 0.00 0.00 -0.01 -0.01 0.18 0.56 0.48 -0.01 -0.01 -0.01 0.07 -0.01 1.24 1.24PABM -0.01 -0.01 0.00 0.00 0.00 0.00 0.00 0.00 0.00 0.00 0.00 0.00 -0.01 -0.01MINI HYDRO&OTHERS 0.00 0.00 0.00 0.00 0.00 0.06 0.02 0.02 0.10 0.03 0.01 0.00 0.24 0.24SINGUR 0.41 0.06 -0.01 0.17 0.06 0.10 0.10 0.20 0.08 0.05 0.12 0.12 1.46 1.46SSLM LCPH 11.62 -0.08 -0.18 2.74 139.56 153.86 84.80 21.34 40.57 22.54 19.27 23.09 519.12 519.12Nagarjunasagar Tail Pond Dam Power House 0.00 0.00 0.00 0.00 0.00 0.00 0.00 0.00 0.00 0.00 0.00 0.00 0.00 0.00Priyadarshini Jurala Hydro Electric Project- AP Share 0.00 0.00 0.00 0.00 0.00 0.00 0.00 0.00 0.00 0.00 0.00 0.00 0.00 0.00Lower Jurala Hydro Electric Project -0.02 -0.02 -0.05 0.49 24.59 33.37 0.41 0.97 -0.01 0.00 0.00 -0.06 59.65 59.65POCHAMPAD Stig-II 0.31 0.00 0.00 0.00 0.00 0.03 0.36 0.00 0.04 0.00 0.00 0.00 0.73 0.73PULICHINTAL(New Project) 0.00 0.00 0.00 0.00 0.00 0.00 0.00 0.00 0.00 0.00 0.00 0.00 0.00 0.00Mini HYDRO(Chettaipeta) 0.12 0.00 0.00 0.00 0.00 0.00 0.00 0.00 0.00 0.00 0.00 0.00 0.12 0.12Ramagiri Wind Mills 0.00 0.00 0.00 0.00 0.00 0.00 0.00 0.00 0.00 0.00 0.00 0.00 0.00 0.00Pochampad Stig-VI 0.13 0.00 0.00 0.00 0.00 0.00 0.00 0.00 0.00 0.00 0.00 0.00 0.13 0.13
0.00 0.000.00 0.00
TOTAL HYDRO 65.76 32.12 5.72 12.86 212.72 313.11 168.18 58.30 55.76 28.68 27.17 35.13 1015.51 0.00 1015.51TOTAL TSGENCO 528.56 460.74 433.08 426.22 595.37 675.39 605.20 488.61 474.10 495.54 458.67 531.74 6173.21 0.00 6173.21
Central Generating Stations NTPCNTPC (SR) NTPC (SR) 73.77 59.37 57.53 67.04 72.24 50.32 63.02 69.46 81.12 74.17 70.27 73.44 811.74 811.74
Variable Cost (Rs. / kWh)
Gross Energy Availability (MU) Yearly Auxiliary Consumption
(MU)
Net Energy Availability
(MU)Generating Station D Link
PLF (%)
Page 155 of 195

NTPC (SR) Stage III 19.75 17.95 16.78 15.49 7.51 15.28 20.39 18.03 21.49 18.15 17.98 15.94 204.74 204.74 Total NTPC(SR) 93.52 77.32 74.31 82.53 79.75 65.60 83.42 87.49 102.61 92.32 88.24 89.38 1016.48 0.00 1016.48
NTPC (ER) Farakka 0.00 0.00 0.00 0.00 0.00 0.00 0.00 0.00 0.00 0.00 0.00 0.00 0.00 0.00 Kahalgaon 0.00 0.00 0.00 0.00 0.00 0.00 0.00 0.00 0.00 0.00 0.00 0.00 0.00 0.00 Talcher - Stage 1 0.00 0.00 0.00 0.00 0.00 0.00 0.00 0.00 0.00 0.00 0.00 0.00 0.00 0.00 Talcher Stage 2 42.17 43.12 30.63 32.53 37.78 39.83 44.01 40.86 44.67 42.62 39.55 44.04 481.81 481.81 Others 0.00 0.00 Total NTPC(ER) 42.17 43.12 30.63 32.53 37.78 39.83 44.01 40.86 44.67 42.62 39.55 44.04 481.81 0.00 481.81
Total NTPC 135.68 120.44 104.94 115.06 117.53 105.43 127.42 128.35 147.28 134.94 127.79 133.42 1498.29 0.00 1498.29
NLC TS-II Stage-I 12.20 11.79 11.14 12.76 12.04 10.38 5.70 8.56 9.26 11.75 11.15 11.92 128.66 128.66 Stage-II 21.01 20.15 18.34 17.28 17.24 16.02 18.43 16.04 18.00 21.74 19.56 21.26 225.08 225.08 Total NLC 33.21 31.94 29.48 30.04 29.28 26.40 24.13 24.60 27.26 33.49 30.71 33.19 353.74 0.00 353.74
NPC NPC-MAPS 3.25 2.91 3.15 3.41 3.41 3.22 1.82 2.33 0.80 2.96 3.43 3.97 34.66 34.66 NPC-Kaiga unit I 11.43 11.90 10.98 11.74 11.87 11.36 11.71 6.36 12.12 13.75 13.16 11.74 138.10 138.10 NPC-Kaiga unit II 9.34 10.85 9.92 11.19 13.74 13.93 14.51 13.96 13.52 15.90 15.08 14.37 156.32 156.32 Total NPC 24.02 25.66 24.05 26.34 29.02 28.51 28.05 22.65 26.43 32.60 31.66 30.08 329.08 0.00 329.08
NTPC - SimhadriNTPC Simhadri Stage I 109.35 109.37 107.06 109.81 91.26 99.71 81.58 61.89 89.04 102.12 97.87 109.74 1168.79 1168.79NTPC Simhadri Stage II 53.60 48.06 43.16 53.65 34.41 20.29 28.22 45.37 49.72 45.49 45.56 47.12 514.66 514.66
Total NTPC- Simhadri 162.95 157.43 150.22 163.45 125.66 120.00 109.81 107.26 138.76 147.62 143.42 156.86 1683.45 0.00 1683.45
CGS - NewVallur Thermal Power Plant 12.80 13.13 9.77 14.17 10.47 6.39 8.94 9.22 7.82 11.34 10.50 13.78 128.34 128.34NTPC NVVNL Bundled Power Coal (CP) 0.00 0.00 0.00 0.00 0.00 0.00 0.00 0.00 0.00 0.00 0.00 0.00 0.00 0.00NTPC NVVNL Bundled Power Coal (NP) 5.48 5.18 4.55 4.45 4.41 4.18 4.69 -7.22 9.29 8.93 8.40 9.41 61.75 61.75
0.00 0.000.00 0.00
TOTAL CGS 374.16 353.79 323.01 353.52 316.37 290.91 303.04 284.87 356.83 368.92 352.49 376.74 4054.65 0.00 4054.65
APGPCLAPGPCL I - Allocated capacity 0.85 0.63 0.65 0.29 0.00 0.00 0.00 0.31 0.69 0.59 0.45 0.48 4.92 4.92APGPCL I - Unutilised capacity 0.02 0.08 0.10 0.04 0.00 0.00 0.00 0.00 0.00 0.00 0.00 0.00 0.24 0.24APGPCL II - Allocated capacity 1.78 2.40 2.37 1.08 0.00 0.00 0.00 1.04 2.50 2.15 1.61 1.73 16.67 16.67APGPCL II - Unutilised capacity 0.21 0.00 0.00 0.01 0.00 0.00 0.00 0.00 0.00 0.00 0.00 0.00 0.22 0.22Total APGPCL 2.86 3.11 3.12 1.42 0.00 0.00 0.00 1.35 3.19 2.74 2.05 2.21 22.05 0.00 22.05
IPPSGVK 10.90 8.07 8.67 2.14 0.00 0.00 4.78 10.92 11.27 11.46 10.49 13.14 91.84 91.84Spectrum 11.29 12.28 8.95 2.04 -0.11 -0.04 1.08 10.80 14.06 9.64 8.07 8.77 86.84 86.84Kondapalli (Naphtha) 0.00 0.00 0.00 0.00 0.00 0.00 0.00 0.00 0.00 0.00 0.00 0.00 0.00 0.00Kondapalli (Gas) 21.75 21.27 15.19 6.78 1.04 0.03 0.01 0.00 0.00 3.77 4.71 5.20 79.74 79.74BSES 0.00 0.00 0.00 0.00 0.00 0.00 0.00 0.00 0.00 0.00 0.00 0.00 0.00 0.00GVK Extension 0.00 0.00 0.00 0.00 0.00 0.00 0.00 0.00 0.00 0.00 0.00 0.00 0.00 0.00Vemagiri 0.00 0.00 0.00 0.00 0.00 0.00 0.00 0.00 0.00 0.00 0.00 0.00 0.00 0.00Gautami 0.00 0.00 0.00 0.00 0.00 0.00 0.00 0.00 0.00 0.00 0.00 0.00 0.00 0.00Konaseema 0.00 0.00 0.00 0.00 0.00 0.00 0.00 0.00 0.00 0.00 0.00 0.00 0.00 0.00Reliance Infrastructure 0.87 3.86 4.85 1.51 0.00 0.00 3.07 6.11 4.98 1.26 0.00 0.00 26.52 26.52
0.00 0.000.00 0.000.00 0.000.00 0.00
TOTAL IPPS 44.81 45.49 37.66 12.47 0.92 -0.01 8.95 27.83 30.30 26.14 23.26 27.12 284.94 0.00 284.94
NCENCE - Bio-Mass 7.64 8.27 9.35 10.30 10.30 8.61 9.74 7.17 9.78 8.58 11.43 12.12 113.27 113.27NCE - Bagasse 3.21 6.46 2.78 6.30 6.71 4.95 5.77 1.38 12.59 13.44 8.77 5.76 78.13 78.13NCE - Municipal Waste to Energy 0.00 0.00 0.00 0.00 0.00 0.00 0.00 0.00 0.00 0.00 0.00 0.00 0.00 0.00NCE - Industrial Waste based power project 0.00 0.00 0.00 0.00 0.00 0.00 0.00 0.00 0.00 0.00 0.00 0.00 0.00 0.00NCE - Wind Power 0.00 0.00 0.00 0.00 0.00 0.00 0.00 0.00 0.00 0.00 0.00 0.00 0.00 0.00NCE - Mini Hydel 0.19 0.00 0.00 0.00 0.00 0.00 0.90 0.42 0.49 0.34 0.24 0.14 2.73 2.73NCE - NCL Energy Ltd 0.00 0.00 0.00 0.00 0.00 0.00 0.00 0.00 0.00 0.00 0.00 0.00 0.00 0.00NCE-Others 2.09 1.97 1.76 1.59 1.39 1.52 3.07 -2.24 2.87 2.98 3.44 4.19 24.62 24.62TOTAL NCE 13.14 16.70 13.89 18.19 18.40 15.08 19.48 6.72 25.73 25.35 23.88 22.21 218.75 0.00 218.75
OTHERSSrivathsa 0.00 0.00LVS 0.00 0.00Vishakapatnam Steel Plant 0.00 0.00NB Ferro Alloys 0.00 0.00Sponge Iron 0.00 0.00
Page 156 of 195

0.00 0.000.00 0.00
Essar steels 0.00 0.00KSK Mahanadi (MT) 0.00 0.00Hinduja 0.00 0.00RLNG 0.00 0.00TOTAL OTHERS 0.00 0.00 0.00 0.00 0.00 0.00 0.00 0.00 0.00 0.00 0.00 0.00 0.00 0.00 0.00
MARKETPTC 0.00 0.00RCL and Short-Term Sources(IG Wells,Kesoram) 0.00 0.00
0.00 0.000.00 0.000.00 0.00
APSPDCL 0.00 0.00UI 10.48 6.89 0.00 27.83 15.47 4.99 14.22 15.18 18.71 15.29 19.97 13.29 162.33 162.33Other Short Term Sources 0.00 0.00 0.00 0.00 0.00 0.00 0.00 0.00 0.00 0.00 0.00 0.00 0.00 0.00Pool Transaction (Purchases) 0.00 0.00 0.00 0.00 0.00 0.00 0.00 0.00 0.00 0.00 0.00 0.00 0.00 0.00Medium Term Open Access Traders 39.13 32.82 7.79 45.71 30.73 43.52 43.81 38.33 46.66 38.78 41.68 43.31 452.27 452.27Short Term Open Access Traders 167.90 -23.18 73.25 217.13 240.04 242.64 329.39 160.05 107.61 144.23 208.61 217.24 2084.90 2084.90Bi-lateral Puchases 0.00 0.00 0.00 0.00 0.00 0.00 0.00 0.00 0.00 0.00 0.00 0.00 0.00 0.00Jhajjar 0.00 0.00 0.00 0.00 0.00 0.00 0.00 0.00 0.00 0.00 0.00 0.00 0.00 0.00Pool Purchase 0.00 0.00 0.00 0.00 0.00 0.00 0.00 0.00 0.00 0.00 0.00 0.00 0.00 0.00Pool Sales 0.00 0.00 0.00 0.00 0.00 0.00 0.00 0.00 0.00 0.00 0.00 0.00 0.00 0.00
TOTAL MARKET 217.52 16.53 81.03 290.67 286.24 291.15 387.42 213.57 172.98 198.30 270.25 273.83 2699.50 0.00 2699.50
TOTAL (From All Sources) 1181.05 896.36 891.80 1102.48 1217.30 1272.52 1324.08 1022.95 1063.14 1116.98 1130.60 1233.84 13453.10 0.00 13453.10
2015-16
April May June July August September October November December January February March Total
TSGENCOThermalVTPS I 114.10 115.68 93.76 105.34 111.71 96.01 110.75 113.63 124.76 123.46 113.45 114.55 1337.18 1337.18VTPS II 0.00 0.00 0.00 0.00 0.00 0.00 0.00 0.00 0.00 0.00 0.00 0.00 0.00 0.00VTPS III 0.00 0.00 0.00 0.00 0.00 0.00 0.00 0.00 0.00 0.00 0.00 0.00 0.00 0.00VTPS IV 40.05 44.51 38.62 49.96 48.20 41.93 52.10 14.07 0.00 36.26 49.22 51.93 466.87 466.87RTPP I 32.42 36.10 32.01 29.31 34.41 34.51 39.68 40.25 41.09 41.24 39.44 34.91 435.36 435.36RTPP Stage-II 35.88 41.17 32.84 40.82 29.81 37.08 39.52 32.54 38.84 41.31 39.24 38.39 447.45 447.45RTPP Stage-III 18.00 19.65 15.40 20.01 6.11 18.15 19.62 17.67 20.40 21.07 19.68 19.21 214.97 214.97KTPS A 52.29 61.30 40.02 46.87 56.70 50.38 60.27 48.18 53.32 48.38 50.70 51.97 620.36 620.36KTPS B 0.00 0.00 0.00 0.00 0.00 0.00 0.00 0.00 0.00 0.00 0.00 0.00 0.00 0.00KTPS C 0.00 0.00 0.00 0.00 0.00 0.00 0.00 0.00 0.00 0.00 0.00 0.00 0.00 0.00KTPS D 44.67 52.18 34.88 45.24 46.93 36.19 37.69 44.56 29.76 28.91 47.72 53.95 502.70 502.70KTPS Stage VI 19.53 32.56 10.07 33.30 32.60 29.16 30.80 39.15 31.71 26.25 26.99 32.08 344.19 344.19RTS B -0.23 3.91 5.12 5.90 4.57 4.37 5.65 5.41 5.94 5.59 6.22 5.27 57.72 57.72NTS 0.00 0.00 0.00 0.00 0.00 0.00 0.00 0.00 0.00 0.00 0.00 0.00 0.00 0.00Kakatiya Thermal Power Plant Stage I 37.71 40.58 31.31 50.78 47.44 38.55 25.26 41.18 31.88 4.41 30.43 28.59 408.13 408.13Kakatiya Thermal Power Plant Stage II 0.00 0.00 0.00 0.00 0.00 0.00 0.00 0.00 0.00 0.00 0.00 0.00 0.00 0.00Damodaram Sanjeevaiah Thermal power plant - I 0.00 0.00 0.00 0.00 0.00 0.00 0.00 0.00 0.00 0.00 0.00 0.00 0.00 0.00Damodaram Sanjeevaiah Thermal power plant - II 0.00 0.00 0.00 0.00 0.00 0.00 0.00 0.00 0.00 0.00 0.00 0.00 0.00 0.00Thermal Incentive 15-16 0.00 0.00 0.00 0.00 0.00 0.00 0.00 0.00 0.00 0.00 0.00 0.00 0.00 0.00KTPP II Infirm Power 0.00 0.00 0.00 0.00 0.00 0.00 0.00 0.00 0.00 0.00 0.00 95.61 95.61 95.61TSGENCO Thermal stations True Up 15-16 0.00 0.00 0.00 0.00 0.00 0.00 0.00 0.00 0.00 0.00 0.00 0.00 0.00 0.00
0.00 0.000.00 0.000.00 0.000.00 0.000.00 0.00
TOTAL THERMAL 394.42 447.64 334.03 427.53 418.49 386.33 421.35 396.65 377.70 376.88 423.09 526.45 4930.54 0.00 4930.54
MACHKUND PH TS Share 0.00 0.00 0.00 0.00 0.00 0.00 0.00 0.00 0.00 0.00 0.00 0.00 0.00 0.00TUNGBHADRA PH TS Share 0.00 0.00 0.00 0.00 0.00 0.00 0.00 0.00 0.00 0.00 0.00 0.00 0.00 0.00USL 0.00 0.00 0.00 0.00 0.00 0.00 0.00 0.00 0.00 0.00 0.00 0.00 0.00 0.00LSR 0.00 0.00 0.00 0.00 0.00 0.00 0.00 0.00 0.00 0.00 0.00 0.00 0.00 0.00DONKARAYI 0.00 0.00 0.00 0.00 0.00 0.00 0.00 0.00 0.00 0.00 0.00 0.00 0.00 0.00SSLM 0.00 0.00 0.00 0.00 0.00 0.00 0.00 0.00 0.00 0.00 0.00 0.00 0.00 0.00NSPH 4.34 1.01 -0.05 0.03 -0.09 -0.11 -0.11 6.41 4.86 1.12 5.58 2.93 25.93 25.93NSRCPH 0.00 0.00 0.00 0.00 0.00 0.00 0.00 0.00 0.00 0.00 0.00 0.00 0.00 0.00NSLCPH 0.00 0.00 0.00 0.00 0.00 0.00 0.00 0.00 0.00 0.00 0.00 0.00 0.00 0.00POCHAMPAD PH 0.00 -0.01 -0.01 0.00 0.00 0.00 0.00 0.00 0.00 0.00 0.00 0.00 -0.05 -0.05NIZAMSAGAR PH -0.01 -0.01 -0.01 0.02 -0.01 -0.01 0.00 -0.01 -0.01 -0.01 -0.01 -0.01 -0.05 -0.05PABM 0.00 0.00 0.00 0.00 0.00 0.00 0.00 0.00 0.00 0.00 0.00 0.00 0.00 0.00MINI HYDRO&OTHERS 0.02 0.00 0.00 0.00 0.00 0.00 0.00 0.00 0.00 0.00 0.00 0.00 0.00 0.00SINGUR -0.01 -0.01 -0.01 -0.01 -0.01 -0.01 -0.01 -0.01 -0.01 -0.01 -0.01 -0.01 -0.08 -0.08SSLM LCPH 2.35 -0.03 -0.21 -0.23 -0.23 3.08 5.16 12.59 4.00 -0.15 7.64 9.32 43.29 43.29Nagarjunasagar Tail Pond Dam Power House 0.00 0.00 0.00 0.00 0.00 0.00 0.00 0.00 0.00 0.00 0.00 0.00 0.00 0.00Priyadarshini Jurala Hydro Electric Project- TS Share 0.00 0.00 0.00 0.00 0.00 0.00 0.00 0.00 0.00 0.00 0.00 0.00 0.00 0.00Lower Jurala Hydro Electric Project -0.07 -0.08 -0.06 -0.07 -0.07 4.24 2.13 0.00 0.00 -0.03 -0.02 -0.02 5.95 5.95POCHAMPAD Stig-II 0.00 0.00 0.00 0.00 0.00 0.00 0.00 0.00 0.00 0.00 0.00 0.00 0.00 0.00PULICHINTAL(New Project) 0.00 0.00 0.00 0.00 0.00 0.00 0.00 0.00 0.00 0.00 0.00 0.00 0.00 0.00
Variable Cost (Rs. / kWh)
Gross Energy Availability (MU) Yearly Auxiliary Consumption
(MU)
Net Energy Availability
(MU)Generating Station D Link
PLF (%)
Page 157 of 195

Pochampad Stig-VI 0.00 0.00 0.00 0.00 0.00 0.00 0.00 0.00 0.00 0.00 0.00 0.00 0.00 0.00APGE-Hydel-Interstate 3.16 1.42 1.23 2.63 3.16 3.07 3.19 3.09 2.92 2.36 2.21 2.36 30.80 30.80Lower Jurala-I&II Infirm Power 0.00 0.00 0.00 0.00 0.00 0.00 0.00 0.00 0.00 0.00 0.00 2.54 2.54 2.54TSGENCO Hydel Stations True Up 14-15 0.00 0.00 0.00 0.00 0.00 0.00 0.00 0.00 0.00 0.00 0.00 0.00 0.00 0.00
0.00 0.000.00 0.00
TOTAL HYDRO 9.79 2.30 0.89 2.36 2.75 10.27 10.36 22.07 11.76 3.28 15.39 17.12 108.33 0.00 108.33TOTAL TSGENCO 404.21 449.94 334.92 429.90 421.24 396.59 431.71 418.71 389.46 380.16 438.47 543.56 5038.88 0.00 5038.88
Central Generating Stations NTPCNTPC (SR) NTPC (SR) 62.27 63.85 39.20 51.70 59.95 47.37 52.27 63.90 65.56 58.51 65.23 69.70 699.52 699.52 NTPC (SR) Stage III 15.08 14.83 9.41 14.05 11.18 13.18 10.84 16.36 15.28 15.27 16.77 17.71 169.96 169.96 Total NTPC(SR) 77.36 78.68 48.61 65.75 71.13 60.55 63.11 80.27 80.84 73.78 81.99 87.41 869.48 0.00 869.48
NTPC (ER) Farakka 0.00 0.00 0.00 0.00 0.00 0.00 0.00 0.00 0.00 0.00 0.00 0.00 0.00 0.00 Kahalgaon 0.00 0.00 0.00 0.00 0.00 0.00 0.00 0.00 0.00 0.00 0.00 0.00 0.00 0.00 Talcher - Stage 1 0.00 0.00 0.00 0.00 0.00 0.00 0.00 0.00 0.00 0.00 0.00 0.00 0.00 0.00 Talcher Stage 2 41.37 43.34 29.17 41.05 32.70 39.93 40.55 39.72 41.83 39.65 40.14 41.84 471.27 471.27 Others 0.00 0.00 0.00 0.00 0.00 0.00 0.00 0.00 0.00 0.00 0.00 0.00 0.00 0.00 Total NTPC(ER) 41.37 43.34 29.17 41.05 32.70 39.93 40.55 39.72 41.83 39.65 40.14 41.84 471.27 0.00 471.27
Total NTPC 118.72 122.02 77.78 106.80 103.83 100.48 103.66 119.99 122.67 113.44 122.13 129.25 1340.75 0.00 1340.75
NLC TS-II Stage-I 10.65 11.19 8.79 11.78 11.47 9.10 8.32 6.49 4.87 9.02 10.34 6.13 108.14 108.14 Stage-II 19.17 19.96 16.26 15.31 15.81 14.36 16.52 11.05 11.91 15.06 18.44 11.81 185.68 185.68 Total NLC 29.82 31.16 25.05 27.09 27.28 23.47 24.85 17.55 16.78 24.08 28.78 17.94 293.83 0.00 293.83
NPC NPC-MAPS 3.91 4.06 4.02 4.31 4.14 3.24 3.90 2.90 2.02 2.89 3.78 3.83 42.99 42.99 NPC-Kaiga unit I 13.40 15.03 15.23 13.59 13.35 14.24 12.30 12.05 14.47 13.90 13.71 14.08 165.34 165.34 NPC-Kaiga unit II 16.02 17.25 15.78 15.42 8.36 15.68 14.75 15.22 15.71 15.87 14.85 15.82 180.74 180.74 Total NPC 33.34 36.34 35.02 33.32 25.85 33.16 30.95 30.17 32.20 32.65 32.34 33.73 389.07 0.00 389.07
NTPC - SimhadriNTPC Simhadri Stage I 88.37 77.55 77.74 82.24 83.18 88.68 105.31 80.40 51.09 88.42 94.34 108.57 1025.89 1025.89NTPC Simhadri Stage II 33.50 28.41 24.01 28.74 20.05 17.47 48.81 51.13 41.72 25.31 41.13 39.71 399.99 399.99
Total NTPC- Simhadri 121.87 105.96 101.75 110.98 103.22 106.15 154.12 131.53 92.82 113.73 135.47 148.28 1425.89 0.00 1425.89
CGS - New Vallur Thermal Power Plant 13.68 15.04 11.24 12.36 12.57 11.24 15.69 12.06 10.74 13.46 16.75 9.75 154.56 154.56
NTPC ARAVALI POWER 33.90 32.25 21.66 33.69 33.52 33.69 54.79 62.39 59.04 55.91 46.12 38.48 505.45 505.45NLC Tamilnadu Power Ltd 0.00 0.00 3.34 4.28 6.77 9.35 12.64 16.88 16.94 17.58 22.06 11.33 121.16 121.16
NTPC NVVNL Bundled Power Coal (NP) 1.58 1.47 1.09 1.10 1.04 1.13 1.41 0.97 1.34 1.36 1.42 1.63 15.54 15.54NTPC NVVNL Bundled Power Solar (NP) 8.53 8.68 7.14 8.29 8.41 7.28 8.35 8.05 8.68 8.36 8.33 9.24 99.35 99.35
TOTAL CGS 361.44 352.91 284.07 337.89 322.49 325.96 406.45 399.58 361.21 380.57 413.40 399.63 4345.60 0.00 4345.60
APGPCLAPGPCL I - Allocated capacity 0.51 0.36 0.51 0.44 0.38 0.36 0.33 0.24 0.24 0.25 0.27 0.31 4.19 4.19APGPCL I - Unutilised capacity 0.00 0.00 0.00 0.00 0.00 0.00 0.00 0.00 0.00 0.00 0.00 0.00 0.00 0.00APGPCL II - Allocated capacity 1.79 1.26 1.79 1.54 1.31 1.21 1.11 0.82 0.82 0.93 0.98 1.24 14.81 14.81APGPCL II - Unutilised capacity 0.00 0.00 0.00 0.00 0.00 0.00 0.00 0.00 0.00 0.00 0.00 0.00 0.00 0.00Total APGPCL 2.30 1.62 2.30 1.98 1.69 1.57 1.44 1.06 1.06 1.18 1.25 1.55 19.00 0.00 19.00
IPPSGVK 9.28 10.87 0.00 0.00 0.00 0.00 7.65 0.00 0.00 0.00 0.00 -0.85 26.95 26.95Spectrum 6.80 8.72 9.93 8.73 5.33 4.16 3.24 4.77 8.37 6.48 5.15 2.32 74.01 74.01Kondapalli (Naphtha) 0.00 0.00 0.00 0.00 0.00 0.00 0.00 0.00 0.00 0.00 0.00 0.00 0.00 0.00Kondapalli (Gas) 4.17 1.67 0.82 0.49 1.82 2.25 4.09 5.98 6.62 2.11 0.00 0.16 30.19 30.19BSES 0.00 0.00 0.00 0.00 0.00 0.00 0.00 0.00 0.00 0.00 0.00 0.00 0.00 0.00GVK Extension 0.00 0.00 0.00 0.00 0.00 0.00 0.00 9.29 9.28 0.29 0.00 0.00 18.86 18.86Vemagiri 7.78 17.10 0.00 0.00 0.00 0.00 0.00 0.00 0.00 0.00 0.00 0.00 24.89 24.89Gautami 16.53 16.09 0.00 0.00 0.00 0.00 0.00 0.00 0.00 0.00 0.00 0.00 32.62 32.62Konaseema 0.00 0.00 0.00 0.00 0.00 0.00 0.00 0.00 0.00 0.00 0.00 0.00 0.00 0.00
0.00 0.000.00 0.000.00 0.000.00 0.000.00 0.00
TOTAL IPPS 44.56 54.45 10.75 9.23 7.16 6.40 14.98 20.04 24.27 8.88 5.15 1.64 207.51 0.00 207.51
NCENCE - Bio-Mass 7.91 10.15 9.05 11.18 11.40 10.10 9.58 9.26 9.05 9.70 11.83 13.14 122.35 122.35NCE - Bagasse 0.00 0.00 0.00 0.00 0.00 0.21 6.94 7.92 10.45 9.81 10.57 5.73 51.63 51.63NCE - Municipal Waste to Energy 0.00 0.00 0.00 0.00 0.00 0.00 0.00 0.00 0.00 0.00 0.00 0.00 0.00 0.00NCE - Industrial Waste based power project 0.00 0.00 0.00 0.00 0.00 0.00 0.00 0.00 0.00 0.00 0.00 0.00 0.00 0.00
Page 158 of 195

NCE - Wind Power 0.00 0.00 0.00 0.00 0.00 0.00 0.00 0.00 0.00 0.00 0.00 0.00 0.00 0.00NCE - Mini Hydel 0.06 0.00 0.00 0.00 0.00 0.00 0.00 0.00 0.00 0.00 0.00 0.00 0.06 0.06NCE - NCL Energy Ltd 0.00 0.00 0.00 0.00 0.00 0.00 0.00 0.00 0.00 0.00 0.00 0.00 0.00 0.00NCE-Others 1.76 2.13 1.66 1.93 1.68 1.69 1.88 1.80 1.90 2.07 2.11 2.94 23.56 23.56TOTAL NCE 9.72 12.29 10.71 13.11 13.08 12.01 18.40 18.99 21.40 21.57 24.51 21.81 197.60 0.00 197.60
OTHERSSrivathsa 0.00 0.00 0.00 0.00 0.00 0.00 0.00 0.00 0.00 0.00 0.00 0.00 0.00 0.00LVS 0.00 0.00 0.00 0.00 0.00 0.00 0.00 0.00 0.00 0.00 0.00 0.00 0.00 0.00Vishakapatnam Steel Plant 0.00 0.00 0.00 0.00 0.00 0.00 0.00 0.00 0.00 0.00 0.00 0.00 0.00 0.00NB Ferro Alloys 0.00 0.00 0.00 0.00 0.00 0.00 0.00 0.00 0.00 0.00 0.00 0.00 0.00 0.00Corporate Power (MT) 0.00 0.00 0.00 0.00 0.00 0.00 0.00 0.00 0.00 0.00 0.00 0.00 0.00 0.00KSK Mahanadi (MT) 0.00 0.00 0.00 0.00 0.00 0.00 0.00 0.00 0.00 0.00 0.00 0.00 0.00 0.00Hinduja 0.00 0.00 0.00 0.00 0.00 0.00 0.00 0.00 0.00 0.00 0.00 0.00 0.00 0.00Singareni 0.00 0.00 0.00 0.00 0.00 0.00 0.00 0.00 0.00 0.00 0.00 0.00 0.00 0.00Thermal Power 19.56 30.96 51.51 51.97 43.30 55.76 59.02 51.34 58.31 57.00 55.06 58.34 592.14 592.14
0.00 0.000.00 0.000.00 0.000.00 0.000.00 0.00
TOTAL OTHERS 19.56 30.96 51.51 51.97 43.30 55.76 59.02 51.34 58.31 57.00 55.06 58.34 592.14 0.00 592.14
MARKETPTC 0.00 0.00 0.00 0.00 0.00 0.00 0.00 0.00 0.00 0.00 0.00 0.00 0.00 0.00RCL and Short-Term Sources(IG Wells,Kesoram) 0.00 0.00 0.00 0.00 0.00 0.00 0.00 0.00 0.00 0.00 0.00 0.00 0.00 0.00CPDCL 0.00 0.00 0.00 0.00 0.00 0.00 0.00 0.00 0.00 0.00 0.00 0.00 0.00 0.00EPDCL 0.00 0.00 0.00 0.00 0.00 0.00 0.00 0.00 0.00 0.00 0.00 0.00 0.00 0.00NPDCL 0.00 0.00 0.00 0.00 0.00 0.00 0.00 0.00 0.00 0.00 0.00 0.00 0.00 0.00SPDCL 0.00 0.00 0.00 0.00 0.00 0.00 0.00 0.00 0.00 0.00 0.00 0.00 0.00 0.00UI 13.76 10.00 11.24 14.16 10.11 2.70 9.03 9.55 9.23 10.75 11.63 8.16 120.31 120.31Other Short Term Sources 285.79 285.92 312.89 414.25 501.70 466.58 434.30 261.82 317.84 285.19 210.54 302.30 4079.14 4079.14Bi-lateral Puchases 0.00 0.00 0.00 0.00 0.00 0.00 0.00 0.00 0.00 0.00 0.00 0.00 0.00 0.00Jhajjar 0.00 0.00 0.00 0.00 0.00 0.00 0.00 0.00 0.00 0.00 0.00 0.00 0.00 0.00Pool Purchase 0.00 0.00 0.00 0.00 0.00 0.00 0.00 0.00 0.00 0.00 0.00 0.00 0.00 0.00Pool Sales 0.00 0.00 0.00 0.00 0.00 0.00 0.00 0.00 0.00 0.00 0.00 0.00 0.00 0.00
0.00 0.00 0.00 0.00 0.00 0.00 0.00 0.00 0.00 0.00 0.00 0.00 0.00 0.000.00 0.00 0.00 0.00 0.00 0.00 0.00 0.00 0.00 0.00 0.00 0.00 0.00 0.000.00 0.00 0.00 0.00 0.00 0.00 0.00 0.00 0.00 0.00 0.00 0.00 0.00 0.00
TOTAL MARKET 299.55 295.93 324.13 428.41 511.81 469.28 443.33 271.37 327.07 295.94 222.17 310.46 4199.45 0.00 4199.45
TOTAL (From All Sources) 1141.34 1198.09 1018.39 1272.48 1320.78 1267.58 1375.33 1181.09 1182.78 1145.31 1160.02 1336.99 14600.18 0.00 14600.18
2016-17
April May June July August September October November December January February March Total
TSGENCOThermalVTPS I 36.15 39.84 29.41 32.74 37.43 34.48 36.30 35.13 36.30 36.30 32.79 36.30 423.17 423.17VTPS II 36.15 39.84 29.41 32.74 37.43 34.48 36.30 35.13 36.30 36.30 32.79 36.30 423.17 423.17VTPS III 36.15 39.84 29.41 32.74 37.43 34.48 37.86 27.48 37.86 37.86 34.20 37.86 423.17 423.17VTPS IV 48.54 49.86 54.20 55.22 53.30 52.94 48.03 23.24 46.48 48.03 43.38 48.03 571.24 571.24RTPP I 36.87 41.46 28.79 44.08 42.93 32.37 36.20 35.03 36.20 36.20 32.70 36.20 439.04 439.04RTPP Stage-II 36.51 40.38 42.50 34.18 43.70 30.34 36.20 35.03 36.20 36.20 32.70 36.20 440.15 440.15RTPP Stage-III 18.43 16.52 21.25 21.75 10.60 21.73 18.10 17.52 18.10 18.10 16.35 18.10 216.55 216.55KTPS A 17.02 17.22 15.64 16.90 17.42 14.42 16.14 15.08 16.49 18.94 19.65 21.75 206.66 206.66KTPS B 17.02 17.22 15.64 16.90 17.42 14.42 10.88 17.54 16.49 21.75 19.65 21.75 206.66 206.66KTPS C 17.02 17.22 15.64 16.90 17.42 14.42 21.75 21.05 16.49 16.49 19.65 21.75 215.78 215.78KTPS D 47.96 48.00 36.30 35.51 20.38 30.55 43.10 41.71 43.10 43.10 38.93 43.10 471.70 471.70KTPS Stage VI 39.36 38.99 39.31 40.35 42.76 38.62 43.81 42.39 43.81 43.81 39.57 43.81 496.59 496.59RTS B 5.46 6.04 5.86 5.48 4.86 5.79 2.03 5.52 5.71 5.71 5.16 5.71 63.32 63.32NTS 0.00 0.00 0.00 0.00 0.00 0.00 0.00 0.00 0.00 0.00 0.00 0.00 0.00 0.00Kakatiya Thermal Power Plant Stage I 34.68 39.38 33.20 39.64 34.13 41.71 43.81 42.39 43.81 43.81 39.57 43.81 479.92 479.92Kakatiya Thermal Power Plant Stage II 64.36 55.54 89.73 70.28 49.20 -0.32 97.55 94.40 97.55 97.55 88.11 97.55 901.50 901.50Damodaram Sanjeevaiah Thermal power plant - I 0.00 0.00Damodaram Sanjeevaiah Thermal power plant - II 0.00 0.00
0.00 0.000.00 0.000.00 0.000.00 0.000.00 0.000.00 0.000.00 0.000.00 0.00
TOTAL THERMAL 491.69 507.33 486.30 495.39 466.39 400.44 528.04 488.66 530.88 540.14 495.16 548.21 5978.63 0.00 5978.63
MACHKUND PH TS Share 2.29 2.36 2.29 2.36 2.36 2.29 1.18 1.18 1.18 1.18 1.18 1.18 20.99 20.99TUNGBHADRA PH TSShare 0.00 0.00 0.00 0.00 0.30 0.34 0.23 0.23 0.23 0.23 0.23 0.23 2.04 2.04USL 0.00 0.00 0.00 0.00 0.00 0.00 0.00 0.00 0.00 0.00 0.00 0.00 0.00 0.00LSR 0.00 0.00 0.00 0.00 0.00 0.00 0.00 0.00 0.00 0.00 0.00 0.00 0.00 0.00
Variable Cost (Rs. / kWh)
Gross Energy Availability (MU) Yearly Auxiliary Consumption
(MU)
Net Energy Availability
(MU)Generating Station D Link
PLF (%)
Page 159 of 195

DONKARAYI 0.00 0.00 0.00 0.00 0.00 0.00 0.00 0.00 0.00 0.00 0.00 0.00 0.00 0.00SSLM 0.00 0.00 0.00 0.00 0.00 0.00 0.00 0.00 0.00 0.00 0.00 0.00 0.00 0.00NSPH -0.11 1.92 2.63 -0.11 29.53 -0.08 16.30 8.15 4.89 4.89 2.45 2.85 73.31 73.31NSRCPH 0.00 0.00 0.00 0.00 0.00 0.00 0.00 0.00 0.00 0.00 0.00 0.00 0.00 0.00NSLCPH 0.00 0.00 0.00 0.00 0.00 0.00 1.39 1.06 0.73 0.41 0.16 0.00 3.75 3.75POCHAMPAD PH 0.00 -0.01 0.00 0.00 1.22 2.22 0.98 0.55 0.43 0.61 0.67 0.69 7.35 7.35NIZAMSAGAR PH -0.01 -0.01 -0.01 -0.01 -0.01 -0.01 0.14 0.07 0.92 0.01 0.30 0.22 1.62 1.62PABM 0.00 0.00 0.00 0.00 0.00 0.00 0.00 0.00 0.00 0.00 0.00 0.00 0.00 0.00MINI HYDRO&OTHERS 0.00 0.00 0.00 0.00 0.00 0.00 0.00 0.00 0.00 0.00 0.00 0.00 0.00 0.00SINGUR -0.01 -0.01 -0.01 -0.01 -0.01 0.19 0.44 0.16 0.16 0.16 0.16 0.16 1.41 1.41SSLM LCPH -0.20 -0.16 -0.16 2.52 36.30 41.67 13.99 3.50 3.63 3.79 5.16 5.47 115.51 115.51Nagarjunasagar Tail Pond Dam Power House 0.00 0.00 0.00 0.00 0.00 0.00 0.00 0.00 0.00 0.00 0.00 0.00 0.00 0.00Priyadarshini Jurala Hydro Electric Project- TS Share -0.02 -0.03 -0.04 2.65 15.92 0.01 2.45 0.82 0.24 0.00 0.00 0.00 22.00 22.00Lower Jurala Hydro Electric Project 0.00 0.00 0.00 3.11 13.71 14.64 6.11 2.04 1.22 0.41 0.16 0.16 41.57 41.57POCHAMPAD PH Stage 2 0.00 0.00 0.00 0.00 0.73 0.29 0.33 0.18 0.14 0.20 0.22 0.23 2.33 2.33PULICHINTAL(New Project) 0.00 0.00 0.00 0.00 0.00 0.00 1.82 0.64 1.32 1.46 1.98 1.12 8.34 8.34Mini hydel & others 0.00 0.00 0.00 0.00 0.00 0.03 0.08 0.06 0.05 0.06 0.09 0.08 0.45 0.45Ramagiri wind mills 0.00 0.00 0.00 0.00 0.00 0.00 0.00 0.00 0.00 0.00 0.00 0.00 0.00 0.00
0.00 0.000.00 0.000.00 0.000.00 0.000.00 0.00
TOTAL HYDRO 1.94 4.08 4.70 10.50 100.06 61.59 45.43 18.64 15.14 13.41 12.76 12.41 300.66 0.00 300.66TOTAL TSGENCO 493.63 511.41 490.99 505.90 566.45 462.02 573.47 507.30 546.02 553.56 507.92 560.62 6279.29 0.00 6279.29
Central Generating Stations NTPCNTPC (SR) NTPC (SR) 65.70 62.49 51.27 52.06 52.03 55.86 67.29 60.92 65.79 68.80 62.48 69.15 733.83 733.83 NTPC (SR) Stage III 16.67 14.79 15.23 15.93 14.90 14.78 0.26 16.59 17.06 17.22 15.74 17.43 176.61 176.61 Total NTPC(SR) 82.37 77.28 66.50 67.99 66.93 70.63 67.56 77.51 82.85 86.02 78.22 86.58 910.45 0.00 910.45
NTPC (ER) Farakka 0.00 0.00 0.00 0.00 0.00 0.00 0.00 0.00 0.00 0.00 0.00 0.00 0.00 0.00 Kahalgaon 0.00 0.00 0.00 0.00 0.00 0.00 0.00 0.00 0.00 0.00 0.00 0.00 0.00 0.00 Talcher - Stage 1 0.00 0.00 0.00 0.00 0.00 0.00 0.00 0.00 0.00 0.00 0.00 0.00 0.00 0.00 Talcher Stage 2 40.28 39.51 37.29 42.25 35.20 28.58 36.21 41.66 43.06 43.06 38.87 43.06 469.02 469.02 Others 0.00 0.00 0.00 0.00 0.00 0.00 0.00 0.00 0.00 0.00 0.00 0.00 0.00 0.00 Total NTPC(ER) 40.28 39.51 37.29 42.25 35.20 28.58 36.21 41.66 43.06 43.06 38.87 43.06 469.02 0.00 469.02
Total NTPC 122.64 116.79 103.79 110.24 102.13 99.21 103.76 119.17 125.91 129.08 117.09 129.64 1379.47 0.00 1379.47
NLC TS-II Stage-I 5.75 7.57 7.66 6.55 10.23 8.95 5.61 3.74 5.42 8.31 8.00 8.80 86.59 86.59 Stage-II 12.39 13.70 10.58 11.71 15.62 16.11 12.97 15.34 15.78 16.71 15.12 16.63 172.65 172.65 Total NLC 18.14 21.27 18.24 18.26 25.85 25.07 18.58 19.08 21.20 25.01 23.12 25.44 259.24 0.00 259.24
NPC NPC-MAPS 2.70 3.57 3.44 3.70 3.74 2.25 3.50 2.31 2.73 3.50 3.26 3.50 38.20 38.20 NPC-Kaiga unit I 9.48 10.28 11.01 14.35 14.27 13.63 10.78 10.78 10.78 10.78 10.78 10.78 137.71 137.71 NPC-Kaiga unit II 15.24 6.56 7.30 7.67 7.64 7.35 13.48 13.48 13.48 13.48 13.48 13.48 132.60 132.60 Total NPC 27.41 20.42 21.75 25.72 25.65 23.22 27.76 26.57 26.99 27.76 27.52 27.76 308.51 0.00 308.51
NTPC - SimhadriNTPC Simhadri Stage I 105.88 96.45 87.92 97.52 96.50 87.31 96.81 93.63 96.81 96.81 87.44 96.81 1139.88 1139.88NTPC Simhadri Stage II 39.25 36.62 35.48 35.39 37.59 33.64 44.70 37.92 30.41 44.70 40.40 44.70 460.78 460.78
Total NTPC- Simhadri 145.13 133.07 123.40 132.91 134.09 120.95 141.50 131.55 127.21 141.50 127.84 141.50 1600.66 0.00 1600.66
CGS - New Vallur Thermal Power Plant 14.73 14.06 11.28 12.70 18.54 17.60 14.44 19.34 19.99 19.99 18.06 19.99 200.74 200.74 Tuticorin 15.06 19.24 12.29 20.74 20.94 24.04 26.30 25.46 26.30 26.39 23.87 26.34 266.97 266.97Kudigi 0.00 0.00 0.00 0.00 0.00 0.00 0.00 0.00 0.00 4.71 4.26 4.71 13.69 13.69NVVNL Bundled Power -SOLAR 1.63 1.54 1.00 0.88 0.75 0.63 1.63 1.54 1.00 0.88 0.75 0.75 13.01 13.01NVVNL Bundled Power -COAL 9.02 8.56 7.21 7.55 7.55 7.34 8.41 8.41 8.41 8.41 8.41 8.41 97.68 97.68
TOTAL CGS 353.75 334.94 298.96 329.01 335.51 318.06 342.38 351.12 357.02 383.75 350.92 384.56 4139.98 0.00 4139.98
APGPCLAPGPCL I - Allocated capacity 0.30 0.24 0.46 0.27 0.16 0.14 0.24 0.48 0.50 0.50 0.45 0.50 4.26 4.26APGPCL I - Unutilised capacity 0.00 0.00 0.00 0.00 0.00 0.00 0.00 0.00 0.00 0.00 0.00 0.00 0.00 0.00APGPCL II - Allocated capacity 1.18 0.96 1.81 1.05 0.59 0.48 0.87 1.73 1.79 1.77 1.62 1.79 15.63 15.63APGPCL II - Unutilised capacity 0.00 0.00 0.00 0.00 0.00 0.00 0.00 0.00 0.00 0.00 0.00 0.00 0.00 0.00Total APGPCL 1.47 1.20 2.27 1.32 0.75 0.63 1.10 2.22 2.29 2.27 2.07 2.29 19.88 0.00 19.88
IPPSGVK 0.00 0.00 0.00 0.00 0.00 0.00 0.00 0.00 0.00 0.00 0.00 0.00 0.00 0.00Spectrum 0.00 0.00 0.00 0.00 0.00 0.00 0.00 0.00 0.00 0.00 0.00 0.00 0.00 0.00Kondapalli (Naphtha) 0.00 0.00 0.00 0.00 0.00 0.00 0.00 0.00 0.00 0.00 0.00 0.00 0.00 0.00Kondapalli (Gas) 0.00 0.00 0.00 0.00 0.00 0.00 0.00 0.00 0.00 0.00 0.00 0.00 0.00 0.00BSES 0.00 0.00 0.00 0.00 0.00 0.00 0.00 0.00 0.00 0.00 0.00 0.00 0.00 0.00
Page 160 of 195

GVK Extension 0.00 0.00 0.00 0.00 0.00 11.63 0.00 0.00 0.00 0.00 0.00 0.00 11.63 11.63Vemagiri 0.00 0.00 0.00 0.00 0.00 0.00 0.00 0.00 0.00 0.00 0.00 0.00 0.00 0.00Gautami 0.00 0.00 0.00 0.00 0.00 0.00 0.00 0.00 0.00 0.00 0.00 0.00 0.00 0.00Konaseema 0.00 0.00 0.00 0.00 0.00 0.00 0.00 0.00 0.00 0.00 0.00 0.00 0.00 0.00Pioneer Gas Power Limited 0.00 0.00
0.00 0.000.00 0.000.00 0.000.00 0.00
TOTAL IPPS 0.00 0.00 0.00 0.00 0.00 11.63 0.00 0.00 0.00 0.00 0.00 0.00 11.63 0.00 11.63
NCENCE - Bio-Mass 7.34 8.68 8.27 9.68 6.67 7.73 7.61 9.05 7.34 8.68 7.61 9.05 97.70 97.70NCE - Bagasse 0.01 0.00 0.00 0.00 0.00 0.00 0.00 0.00 0.01 0.00 0.00 0.00 0.01 0.01NCE - Municipal Waste to Energy 0.00 0.00 0.00 0.00 0.00 0.00 0.00 0.00 0.00 0.00 0.00 0.00 0.00 0.00NCE - Industrial Waste based power project 0.00 0.00 0.00 0.00 0.00 0.00 0.00 0.00 0.00 0.00 0.00 0.00 0.00 0.00NCE - Wind Power 0.00 0.00 0.00 0.00 0.00 0.00 0.00 0.00 0.00 0.00 0.00 0.00 0.00 0.00NCE - Mini Hydel 0.00 0.00 0.00 0.00 0.00 0.00 0.00 0.00 0.00 0.00 0.00 0.00 0.00 0.00NCE - NCL Energy Ltd 0.00 0.00 0.00 0.00 0.00 0.00 0.00 0.00 0.00 0.00 0.00 0.00 0.00 0.00NCE-Others 2.86 5.27 5.08 4.52 6.77 5.81 6.69 6.69 6.69 9.46 10.49 15.94 86.25 86.25TOTAL NCE 10.21 13.95 13.35 14.19 13.44 13.53 14.29 15.73 14.03 18.14 18.10 24.98 183.96 0.00 183.96
OTHERSSrivathsa 0.00 0.00 0.00 0.00 0.00 0.00 0.00 0.00 0.00 0.00 0.00 0.00 0.00 0.00LVS 0.00 0.00 0.00 0.00 0.00 0.00 0.00 0.00 0.00 0.00 0.00 0.00 0.00 0.00Vishakapatnam Steel Plant 0.00 0.00 0.00 0.00 0.00 0.00 0.00 0.00 0.00 0.00 0.00 0.00 0.00 0.00NB Ferro Alloys 0.00 0.00 0.00 0.00 0.00 0.00 0.00 0.00 0.00 0.00 0.00 0.00 0.00 0.00KSK Mahanadi (MT) 0.00 0.00 0.00 0.00 0.00 0.00 0.00 0.00 0.00 0.00 0.00 0.00 0.00 0.00Singareni-1 0.33 0.00 16.35 19.54 25.73 63.67 82.83 94.14 97.28 97.28 87.87 97.28 682.28 682.28Thermal Power Unit 1 30.65 39.47 48.39 51.21 54.83 39.75 47.36 45.83 47.36 47.36 42.78 47.36 542.34 542.34Thermal Power Unit 2 61.54 84.69 105.96 110.85 123.40 93.73 100.18 96.95 100.18 100.18 90.49 100.18 1168.36 1168.36Singareni-2 0.00 0.00 0.00 0.00 0.00 0.00 0.00 0.00 97.28 97.28 87.87 97.28 379.71 379.71TOTAL OTHERS 92.52 124.16 170.70 181.60 203.97 197.15 230.37 236.93 342.10 342.10 309.00 342.10 2772.70 0.00 2772.70
MARKETPTC 0.00 0.00RCL and Short-Term Sources(IG Wells,Kesoram) 0.00 0.00CPDCL 0.00 0.00EPDCL 0.00 0.00NPDCL 0.00 0.00SPDCL 0.00 0.00UI 0.00 0.00Other Short Term Sources 318.20 133.65 88.69 119.52 231.78 167.44 435.92 422.32 434.00 458.82 415.80 460.29 3686.42 3686.42NTPC - Aravali Power Co. Pvt Ltd 10.24 11.76 0.00 0.00 0.00 0.00 0.00 0.00 0.00 0.00 0.00 0.00 22.00 22.00D-D Sales/Bilateral Purchases 0.00 0.00Interstate Sale 0.00 0.00
0.00 0.000.00 0.000.00 0.000.00 0.000.00 0.00
TOTAL MARKET 328.44 145.41 88.69 119.52 231.78 167.44 435.92 422.32 434.00 458.82 415.80 460.29 3708.41 0.00 3708.41
TOTAL (From All Sources) 1280.02 1131.07 1064.97 1151.53 1351.89 1170.47 1597.55 1535.62 1695.46 1758.64 1603.80 1774.84 17115.86 0.00 17115.86
2017-18
April May June July August September October November December January February March Total
TSGENCOThermalVTPS I 38.23 39.50 19.11 19.75 39.50 38.23 39.50 38.23 39.50 39.50 35.68 39.50 426.24 426.24VTPS II 36.53 37.75 36.53 37.75 28.62 36.53 28.62 36.53 37.75 37.75 34.10 37.75 426.24 426.24VTPS III 36.53 37.75 36.53 37.75 37.75 27.40 37.75 27.40 37.75 37.75 34.10 37.75 426.24 426.24VTPS IV 44.22 45.69 44.22 45.69 45.69 44.22 45.69 22.11 44.22 45.69 41.27 45.69 514.38 514.38RTPP I 36.43 37.65 36.43 28.54 37.65 27.33 37.65 36.43 37.65 37.65 34.01 37.65 425.07 425.07RTPP Stage-II 38.07 39.34 38.07 29.82 39.34 28.55 20.30 38.07 39.34 39.34 35.53 39.34 425.07 425.07RTPP Stage-III 18.22 18.82 18.22 18.82 9.72 18.22 18.82 18.22 18.82 18.82 17.00 18.82 212.54 212.54KTPS A 20.66 21.35 20.66 21.35 21.35 20.66 18.77 18.08 18.77 18.77 19.28 21.35 241.03 241.03KTPS B 21.58 22.30 21.58 22.30 22.30 10.79 11.51 21.58 22.30 22.30 20.15 22.30 241.03 241.03KTPS C 20.66 21.35 20.66 21.35 16.18 20.66 21.35 20.66 16.18 21.35 19.28 21.35 241.03 241.03KTPS D 42.46 43.88 31.85 43.88 43.88 42.46 43.88 42.46 43.88 43.88 39.63 43.88 506.04 506.04KTPS Stage VI 44.09 45.56 26.45 41.15 45.56 44.09 45.56 44.09 45.56 45.56 41.15 45.56 514.38 514.38RTS B 5.42 5.60 5.42 5.60 5.60 5.42 5.60 2.71 5.60 5.60 5.06 5.60 63.25 63.25NTS 0.00 0.00 0.00 0.00 0.00 0.00 0.00 0.00 0.00 0.00 0.00 0.00 0.00 0.00Kakatiya Thermal Power Plant Stage I 44.73 46.22 44.73 16.40 46.22 44.73 46.22 44.73 46.22 46.22 41.75 46.22 514.38 514.38Kakatiya Thermal Power Plant Stage II 99.60 102.92 99.60 102.92 36.52 99.60 102.92 99.60 102.92 102.92 92.96 102.92 1145.40 1145.40Damodaram Sanjeevaiah Thermal power plant 0.00 0.00
0.00 0.000.00 0.000.00 0.00
Net Energy Availability
Gross Energy Availability (MU) Yearly Auxiliary Consumption Generating Station D Link
PLF (%)
Variable Cost (Rs. / kWh)
Page 161 of 195

0.00 0.000.00 0.000.00 0.000.00 0.000.00 0.000.00 0.00
TOTAL THERMAL 547.44 565.69 500.07 493.08 475.88 508.89 524.15 510.90 556.47 563.11 510.94 565.69 6322.31 0.00 6322.31
MACHKUND PH AP Share 1.48 1.52 1.23 1.43 1.61 1.59 1.62 1.41 1.40 1.55 1.46 1.48 17.77 17.77TUNGBHADRA PH AP Share 0.15 0.03 0.00 0.35 1.24 1.25 1.14 1.02 0.81 0.79 0.56 0.53 7.87 7.87USL 0.00 0.00 0.00 0.00 0.00 0.00 0.00 0.00 0.00 0.00 0.00 0.00 0.00 0.00LSR 0.00 0.00 0.00 0.00 0.00 0.00 0.00 0.00 0.00 0.00 0.00 0.00 0.00 0.00DONKARAYI 0.00 0.00 0.00 0.00 0.00 0.00 0.00 0.00 0.00 0.00 0.00 0.00 0.00 0.00SSLM 0.00 0.00 0.00 0.00 0.00 0.00 0.00 0.00 0.00 0.00 0.00 0.00 0.00 0.00NSPH 5.77 2.25 3.10 12.79 25.13 30.03 23.80 11.86 7.27 7.65 6.91 8.73 145.31 145.31NSRCPH 0.00 0.00 0.00 0.00 0.00 0.00 0.00 0.00 0.00 0.00 0.00 0.00 0.00 0.00NSLCPH 0.04 0.00 0.00 0.05 0.66 1.37 1.62 1.29 0.86 0.51 0.19 0.08 6.68 6.68POCHAMPAD PH 0.00 0.00 0.31 0.39 0.63 0.55 0.94 0.71 0.55 0.63 0.47 0.31 5.49 5.49NIZAMSAGAR PH 0.05 0.00 0.00 0.02 0.19 0.57 0.33 0.00 0.26 0.31 0.31 0.47 2.53 2.53PABM 0.00 0.00 0.00 0.00 0.00 0.00 0.00 0.00 0.00 0.00 0.00 0.00 0.00 0.00MINI HYDRO&OTHERS 0.00 0.00 0.00 0.00 0.00 0.00 0.00 0.00 0.00 0.00 0.00 0.00 0.00 0.00SINGUR 0.10 0.10 0.10 0.10 0.10 0.42 0.42 0.31 0.31 0.21 0.21 0.21 2.61 2.61SSLM LCPH 4.72 1.68 1.19 6.66 30.57 34.72 19.76 8.63 6.42 6.80 8.29 9.67 139.12 139.12Nagarjunasagar Tail Pond Dam Power House 0.00 0.00 0.00 0.00 0.00 0.00 0.00 0.00 0.00 0.00 0.00 0.00 0.00 0.00Priyadarshini Jurala Hydro Electric Project- AP Share 0.00 0.00 0.04 1.67 6.97 6.55 2.10 0.67 0.38 0.24 0.17 0.11 18.90 18.90Lower Jurala Hydro Electric Project 0.00 0.00 0.00 1.18 2.71 2.67 1.56 1.11 1.11 1.10 1.09 1.10 13.64 13.64POCHAMPAD PH Stage 2 0.00 0.00 0.10 0.13 0.21 0.18 0.31 0.24 0.18 0.21 0.16 0.10 1.83 1.83Pulichintala New project 0.04 0.07 4.51 4.66 4.66 4.51 7.00 2.46 5.07 3.75 5.07 2.88 44.68 44.68Mini hydel & others 0.00 0.00 0.21 0.42 0.63 0.67 0.71 0.69 0.63 0.70 0.71 0.50 5.86 5.86Ramagiri wind mills 0.00 0.00 0.00 0.00 0.00 0.00 0.00 0.00 0.00 0.00 0.00 0.00 0.00 0.00
0.00 0.000.00 0.000.00 0.000.00 0.000.00 0.00
TOTAL HYDRO 12.37 5.65 10.81 29.85 75.32 85.09 61.31 30.41 25.26 24.46 25.60 26.17 412.28 0.00 412.28TOTAL TSGENCO 559.81 571.33 510.88 522.93 551.20 593.97 585.46 541.32 581.72 587.56 536.54 591.86 6734.59 0.00 6734.59
Central Generating Stations NTPCNTPC (SR) NTPC (SR) 62.70 64.11 55.86 53.81 53.49 59.36 64.72 63.52 65.30 65.74 59.50 66.08 734.20 734.20 NTPC (SR) Stage III 15.26 15.60 15.08 15.41 15.58 15.08 15.67 15.43 15.95 15.95 14.41 15.96 185.38 185.38 Total NTPC(SR) 77.96 79.71 70.94 69.22 69.07 74.45 80.39 78.95 81.25 81.69 73.92 82.04 919.59 0.00 919.59
NTPC (ER) Farakka 0.00 0.00 0.00 0.00 0.00 0.00 0.00 0.00 0.00 0.00 0.00 0.00 0.00 0.00 Kahalgaon 0.00 0.00 0.00 0.00 0.00 0.00 0.00 0.00 0.00 0.00 0.00 0.00 0.00 0.00 Talcher - Stage 1 0.00 0.00 0.00 0.00 0.00 0.00 0.00 0.00 0.00 0.00 0.00 0.00 0.00 0.00 Talcher Stage 2 40.41 41.75 40.41 33.96 37.14 40.41 37.90 31.93 41.80 41.80 37.76 41.80 467.07 467.07 Others 0.00 0.00 0.00 0.00 0.00 0.00 0.00 0.00 0.00 0.00 0.00 0.00 0.00 0.00 Total NTPC(ER) 40.41 41.75 40.41 33.96 37.14 40.41 37.90 31.93 41.80 41.80 37.76 41.80 467.07 0.00 467.07
Total NTPC 118.37 121.46 111.35 103.18 106.21 114.85 118.29 110.89 123.05 123.49 111.67 123.84 1386.66 0.00 1386.66
NLC TS-II Stage-I 8.69 9.02 8.55 5.80 7.07 5.91 8.00 7.73 5.67 8.99 8.09 8.94 92.47 92.47 Stage-II 15.93 16.49 11.82 15.45 12.23 15.12 11.34 10.82 14.00 16.45 14.78 16.37 170.79 170.79 Total NLC 24.62 25.51 20.37 21.25 19.29 21.03 19.34 18.55 19.67 25.44 22.87 25.31 263.26 0.00 263.26
NPC NPC-MAPS 3.35 3.47 3.23 3.38 3.48 3.27 3.48 3.24 3.45 3.48 3.18 3.50 40.54 40.54 NPC-Kaiga unit I 11.31 11.31 11.31 11.31 11.31 11.31 11.31 11.31 11.31 11.31 11.31 11.31 135.75 135.75 NPC-Kaiga unit II 11.31 11.31 11.31 11.31 11.31 11.31 11.31 11.31 11.31 11.31 11.31 11.31 135.75 135.75 Total NPC 25.97 26.09 25.85 26.00 26.11 25.90 26.11 25.87 26.08 26.11 25.81 26.12 312.03 0.00 312.03
Page 162 of 195

NTPC - SimhadriNTPC Simhadri Stage I 95.51 98.63 95.51 98.63 98.63 95.51 88.40 63.81 98.63 98.63 89.11 98.63 1119.64 1119.64NTPC Simhadri Stage II 43.80 45.24 43.80 45.24 26.72 43.80 45.24 43.80 45.24 45.24 40.87 45.24 514.22 514.22
Total NTPC- Simhadri 139.31 143.87 139.31 143.87 125.36 139.31 133.64 107.62 143.87 143.87 129.98 143.87 1633.86 0.00 1633.86
CGS - NewVallur Thermal Power Plant 19.47 20.03 19.13 17.68 14.08 19.21 17.38 18.87 19.49 19.58 17.69 19.58 222.20 222.20 Tuticorin 26.86 27.82 26.86 27.72 27.72 26.81 27.17 19.65 20.55 27.82 25.06 27.82 311.85 311.85NVVNL Bundled Power -SOLAR 1.60 1.51 0.99 0.87 0.74 0.74 1.60 1.51 0.99 0.87 0.74 0.74 12.89 12.89NVVNL Bundled Power -COAL 8.26 8.26 8.26 8.26 8.26 8.26 8.26 8.26 8.26 8.26 8.26 8.26 99.07 99.07Kudigi 12.93 13.36 12.93 13.36 26.73 25.87 26.73 25.87 26.73 40.07 36.21 41.50 302.30 302.30
TOTAL CGS 377.40 387.92 365.05 362.18 354.50 381.98 378.50 337.07 388.68 415.51 378.28 417.04 4544.11 0.00 4544.11
APGPCLAPGPCL I - Allocated capacity 0.48 0.50 0.48 0.50 0.50 0.48 0.49 0.48 0.50 0.50 0.45 0.50 5.89 5.89APGPCL I - Unutilised capacity 0.00 0.00 0.00 0.00 0.00 0.00 0.00 0.00 0.00 0.00 0.00 0.00 0.00 0.00APGPCL II - Allocated capacity 1.73 1.79 1.73 1.79 1.79 1.73 1.77 1.73 1.79 1.79 1.62 1.79 21.06 21.06APGPCL II - Unutilised capacity 0.00 0.00 0.00 0.00 0.00 0.00 0.00 0.00 0.00 0.00 0.00 0.00 0.00 0.00Total APGPCL 2.22 2.29 2.22 2.29 2.29 2.22 2.26 2.22 2.29 2.29 2.07 2.29 26.95 0.00 26.95
IPPSGVK 0.00 0.00 0.00 0.00 0.00 0.00 0.00 0.00 0.00 0.00 0.00 0.00 0.00 0.00Spectrum 0.00 0.00 0.00 0.00 0.00 0.00 0.00 0.00 0.00 0.00 0.00 0.00 0.00 0.00Kondapalli (Naphtha) 0.00 0.00 0.00 0.00 0.00 0.00 0.00 0.00 0.00 0.00 0.00 0.00 0.00 0.00Kondapalli (Gas) 0.00 0.00 0.00 0.00 0.00 0.00 0.00 0.00 0.00 0.00 0.00 0.00 0.00 0.00BSES 0.00 0.00 0.00 0.00 0.00 0.00 0.00 0.00 0.00 0.00 0.00 0.00 0.00 0.00GVK Extension 0.00 0.00 0.00 0.00 0.00 0.00 0.00 0.00 0.00 0.00 0.00 0.00 0.00 0.00Vemagiri 0.00 0.00 0.00 0.00 0.00 0.00 0.00 0.00 0.00 0.00 0.00 0.00 0.00 0.00Gautami 0.00 0.00 0.00 0.00 0.00 0.00 0.00 0.00 0.00 0.00 0.00 0.00 0.00 0.00Konaseema 0.00 0.00 0.00 0.00 0.00 0.00 0.00 0.00 0.00 0.00 0.00 0.00 0.00 0.00
0.00 0.000.00 0.000.00 0.000.00 0.000.00 0.00
TOTAL IPPS 0.00 0.00 0.00 0.00 0.00 0.00 0.00 0.00 0.00 0.00 0.00 0.00 0.00 0.00 0.00
NCENCE - Bio-Mass 7.13 8.43 7.39 8.79 7.13 8.43 7.39 8.79 7.13 8.43 7.39 8.79 95.22 95.22NCE - Bagasse 0.52 0.00 0.00 0.00 0.52 0.00 0.00 0.00 0.52 0.00 0.00 0.00 1.57 1.57NCE - Municipal Waste to Energy 5.12 5.12 5.12 5.12 5.12 5.12 5.12 5.12 5.12 5.12 5.12 5.12 61.50 61.50NCE - Industrial Waste based power project 0.00 0.00 0.00 0.00 0.00 0.00 0.00 0.00 0.00 0.00 0.00 0.00 0.00 0.00NCE - Wind Power 0.00 0.00 0.00 0.00 0.00 0.00 0.00 0.00 0.00 0.00 0.00 0.00 0.00 0.00NCE - Mini Hydel 0.00 0.00 0.00 0.00 0.00 0.00 0.00 0.00 0.00 0.00 0.00 0.00 0.00 0.00NCE - NCL Energy Ltd 0.00 0.00 0.00 0.00 0.00 0.00 0.00 0.00 0.00 0.00 0.00 0.00 0.00 0.00NCE-Others 55.02 83.77 124.62 124.62 124.62 124.62 124.62 124.62 124.62 124.62 124.62 124.62 1385.01 1385.01TOTAL NCE 67.80 97.33 137.14 138.53 137.40 138.18 137.14 138.53 137.40 138.18 137.14 138.53 1543.29 0.00 1543.29
OTHERSSrivathsa 0.00 0.00 0.00 0.00 0.00 0.00 0.00 0.00 0.00 0.00 0.00 0.00 0.00 0.00LVS 0.00 0.00 0.00 0.00 0.00 0.00 0.00 0.00 0.00 0.00 0.00 0.00 0.00 0.00Vishakapatnam Steel Plant 0.00 0.00 0.00 0.00 0.00 0.00 0.00 0.00 0.00 0.00 0.00 0.00 0.00 0.00NB Ferro Alloys 0.00 0.00 0.00 0.00 0.00 0.00 0.00 0.00 0.00 0.00 0.00 0.00 0.00 0.00Corporate Power (MT) 0.00 0.00 0.00 0.00 0.00 0.00 0.00 0.00 0.00 0.00 0.00 0.00 0.00 0.00KSK Mahanadi (MT) 0.00 0.00 0.00 0.00 0.00 0.00 0.00 0.00 0.00 0.00 0.00 0.00 0.00 0.00Singareni Unit I 94.14 97.28 94.14 97.28 97.28 94.14 97.28 94.14 97.28 97.28 87.87 97.28 1145.40 1145.40Thermal Power Unit 1 45.41 46.92 45.41 46.92 46.92 45.41 46.92 45.41 46.92 46.92 42.38 46.92 552.44 552.44CSPGCL 156.47 161.69 156.47 161.69 161.69 156.47 161.69 156.47 161.69 161.69 151.26 161.69 1908.99 1908.99Thermal Power Unit 2 96.05 99.25 96.05 99.25 99.25 96.05 99.25 96.05 99.25 99.25 89.65 99.25 1168.63 1168.63Manuguru Thermal Power Plant 0.00 0.00 0.00 0.00 0.00 0.00 0.00 0.00 0.00 0.00 0.00 0.00 0.00 0.00Singareni Unit II 94.14 97.28 94.14 97.28 97.28 94.14 97.28 94.14 97.28 97.28 87.87 97.28 1145.40 1145.40
TOTAL OTHERS 486.22 502.42 486.22 502.42 502.42 486.22 502.42 486.22 502.42 502.42 459.02 502.42 5920.86 0.00 5920.86
MARKETPTC 0.00 0.00RCL and Short-Term Sources(IG Wells,Kesoram) 0.00 0.00CPDCL 0.00 0.00EPDCL 0.00 0.00NPDCL 0.00 0.00SPDCL 0.00 0.00UI 0.00 0.00Other Short Term Sources 433.51 390.16 0.00 0.00 0.00 0.00 0.00 0.00 0.00 0.00 0.00 0.00 823.66 823.66NTPC - Aravali Power Co. Pvt Ltd 0.00 0.00 0.00 0.00 0.00 0.00 0.00 0.00 0.00 0.00 0.00 0.00 0.00 0.00
0.00 0.000.00 0.00
Bi-lateral Purchases( PTC etc.) 0.00 0.00Pool Transaction ( Purchases) 0.00 0.00Pool Transaction ( Sales) 0.00 0.00
0.00 0.00TOTAL MARKET 433.51 390.16 0.00 0.00 0.00 0.00 0.00 0.00 0.00 0.00 0.00 0.00 823.66 0.00 823.66
TOTAL (From All Sources) 1926.95 1951.45 1501.50 1528.37 1547.82 1602.57 1605.78 1505.35 1612.52 1645.96 1513.05 1652.15 19593.47 0.00 19593.47
Page 163 of 195

Index sheet
Form 4.2 Energy Dispatch
Base Year
April May June July August September October November December January February March Total
TSGENCOThermalVTPS I 111.78 121.85 99.63 113.96 87.37 107.19 72.46 97.42 110.23 125.69 116.13 128.43 1292.15VTPS II 0.00 0.00 0.00 0.00 0.00 0.00 0.00 0.00 0.00 0.00 0.00 0.00 0.00VTPS III 0.00 0.00 0.00 0.00 0.00 0.00 0.00 0.00 0.00 0.00 0.00 0.00 0.00VTPS IV 53.24 51.47 43.95 49.30 49.10 47.70 39.61 47.00 44.78 50.41 48.20 46.47 571.23RTPP I 39.44 40.40 37.39 23.67 16.41 10.95 25.77 23.91 36.89 39.27 34.54 37.63 366.27RTPP Stage-II 42.60 41.69 39.55 40.00 38.81 22.01 26.84 35.97 28.69 41.08 40.39 39.79 437.41RTPP Stage-III 15.54 20.92 18.91 19.25 17.21 14.36 14.35 15.24 9.40 20.06 19.47 18.93 203.61KTPS A 56.60 57.91 48.34 39.57 35.73 46.92 50.29 51.67 56.05 54.61 47.22 58.81 603.73KTPS B 0.00 0.00 0.00 0.00 0.00 0.00 0.00 0.00 0.00 0.00 0.00 0.00 0.00KTPS C 0.00 0.00 0.00 0.00 0.00 0.00 0.00 0.00 0.00 0.00 0.00 0.00 0.00KTPS D 0.00 0.00 0.00 0.00 0.00 0.00 0.00 0.00 0.00 0.00 0.00 0.00 0.00KTPS Stage VI 45.43 48.55 30.55 38.38 35.94 44.32 44.48 46.66 47.18 44.54 39.87 48.07 513.96RTS B 5.34 6.18 5.27 5.35 5.23 5.14 5.18 5.61 4.44 6.11 4.69 5.05 63.59NTS 0.00 0.00 0.00 0.00 0.00 0.00 0.00 0.00 0.00 0.00 0.00 0.00 0.00Kakatiya Thermal Power Plant Stage I 41.03 51.37 36.83 3.86 32.52 42.74 40.83 37.95 45.50 49.96 37.86 45.85 466.30Kakatiya Thermal Power Plant Stage II 0.00 0.00 0.00 0.00 0.00 0.00 0.00 0.00 0.00 0.00 0.00 0.00 0.00Damodaram Sanjeevaiah Thermal power plant - I 0.00 0.00 0.00 0.00 0.00 0.00 0.00 0.00 0.00 0.00 0.00 0.00 0.00Damodaram Sanjeevaiah Thermal power plant - II 0.00 0.00 0.00 0.00 0.00 0.00 0.00 0.00 0.00 0.00 0.00 0.00 0.00KTPS Stage VI Infirm Power 52.31 46.19 45.13 34.99 0.48 36.82 45.39 49.22 50.06 53.23 48.66 51.81 514.30
0.000.000.000.00
TOTAL THERMAL 463.31 486.53 405.55 368.31 318.81 378.15 365.21 410.65 433.21 484.97 437.02 480.84 5032.54
MACHKUND PH AP Share 5.37 6.11 3.94 4.32 4.00 4.44 3.22 3.70 3.66 3.52 3.04 3.99 49.31TUNGBHADRA PH AP Share 0.41 0.62 -0.08 1.80 4.63 3.63 2.92 2.98 1.40 2.60 1.84 1.54 24.29USL 7.92 2.27 4.94 6.62 1.67 2.96 6.46 7.76 7.14 7.97 6.28 9.65 71.64LSR 18.62 18.12 13.44 15.00 16.36 12.94 16.72 17.77 17.88 18.15 14.00 19.00 198.00DONKARAYI 1.51 1.16 0.59 0.70 1.63 1.65 2.16 2.20 2.21 2.11 0.81 1.57 18.30SSLM 21.41 9.46 3.97 14.90 58.69 38.89 14.48 7.60 8.25 14.94 19.88 21.90 234.38NSPH 6.11 -0.08 -0.07 0.53 76.08 49.54 25.73 8.17 8.78 12.17 9.13 15.61 211.71NSRCPH 0.00 0.00 0.00 0.00 5.49 6.60 5.88 6.54 4.72 3.24 0.77 0.00 33.23NSLCPH 0.00 0.00 0.00 0.00 3.60 4.48 2.56 2.43 1.66 0.66 0.00 0.00 15.39POCHAMPAD PH 0.00 0.00 0.00 0.52 2.03 1.46 1.91 0.19 0.43 1.15 1.27 1.25 10.19NIZAMSAGAR PH 0.00 0.00 0.00 0.00 0.00 0.26 0.14 0.00 0.11 0.57 0.45 0.48 1.99PABM 0.00 0.00 0.00 0.04 0.33 0.21 0.00 0.00 0.00 0.00 0.08 0.13 0.76MINI HYDRO&OTHERS 0.02 0.00 0.01 0.06 0.21 0.20 0.23 0.06 0.19 0.18 0.17 0.18 1.49SINGUR 0.07 0.00 0.00 0.00 0.00 0.06 0.00 0.00 0.00 0.06 0.12 0.39 0.68SSLM LCPH 0.53 -0.01 0.00 0.43 83.24 61.53 31.30 3.73 2.31 2.51 7.01 17.73 210.31Nagarjunasagar Tail Pond Dam Power House 0.00 0.00 0.00 0.00 0.00 0.00 0.00 0.00 0.00 0.00 0.00 0.00 0.00Priyadarshini Jurala Hydro Electric Project- AP Share -0.01 -0.01 -0.01 5.91 16.59 9.60 7.86 1.64 0.58 0.17 -0.01 -0.02 42.29Lower Jurala Hydro Electric Project 0.00 0.00 0.00 0.00 0.00 0.00 0.00 0.00 0.00 0.00 0.00 0.00 0.00Ramagiri Wind Mills 0.00 0.00 0.00 0.00 0.00 0.00 0.00 0.00 0.00 0.00 0.00 0.00 0.00POCHAMPAD PH Stage 2 0.00 0.00 0.00 0.14 0.31 0.25 0.67 0.02 0.03 0.53 0.53 0.56 3.05
0.00 0.00 0.00 0.00 0.00 0.00 0.00 0.00 0.00 0.00 0.00 0.00 0.000.00 0.00 0.00 0.00 0.00 0.00 0.00 0.00 0.00 0.00 0.00 0.00 0.00
0.000.000.000.00
Generating Station D Link
Variable Cost (Rs.
/ kWh)
Energy Dispatch (MU)
Page 164 of 195

TOTAL HYDRO 61.95 37.63 26.72 50.97 274.87 198.68 122.22 64.77 59.34 70.53 65.37 93.96 1127.01TOTAL TSGENCO 525.27 524.16 432.26 419.28 593.68 576.83 487.43 475.42 492.55 555.50 502.38 574.80 6159.56
Central Generating Stations NTPCNTPC (SR) NTPC (SR) 71.66 74.39 53.12 58.06 48.23 51.48 50.60 65.11 72.45 66.89 68.88 73.08 753.96 NTPC (SR) Stage III 18.46 18.37 16.00 16.74 16.12 16.42 15.94 18.14 13.74 23.09 19.53 17.74 210.30 Total NTPC(SR) 90.13 92.76 69.12 74.80 64.36 67.90 66.54 83.25 86.19 89.98 88.41 90.82 964.26
NTPC (ER) Farakka 3.25 0.00 0.00 0.00 0.00 0.00 0.00 0.00 0.00 0.00 0.00 0.00 3.25 Kahalgaon 1.44 0.00 0.00 0.00 0.00 0.00 0.00 0.00 0.00 0.00 0.00 0.00 1.44 Talcher - Stage 1 2.09 0.00 0.00 0.00 0.00 0.00 0.00 0.00 0.00 0.00 0.00 0.00 2.09 Talcher Stage 2 28.32 26.33 32.08 34.49 34.34 34.95 31.51 40.91 41.76 43.70 39.00 45.05 432.44 Others 0.00 0.00 0.00 0.00 0.00 0.00 0.00 0.00 0.00 0.00 0.00 0.00 0.00 Total NTPC(ER) 35.10 26.33 32.08 34.49 34.34 34.95 31.51 40.91 41.76 43.70 39.00 45.05 439.23
Total NTPC 125.23 119.09 101.21 109.29 98.70 102.85 98.05 124.16 127.95 133.68 127.42 135.86 1403.48
NLC TS-II Stage-I 11.65 11.95 10.67 12.74 11.09 10.01 6.83 9.17 8.17 13.92 11.08 12.78 130.06 Stage-II 20.50 20.10 20.14 19.55 12.86 13.51 16.78 16.14 21.11 25.09 19.39 22.28 227.45 Total NLC 32.14 32.05 30.80 32.29 23.95 23.52 23.61 25.32 29.28 39.01 30.47 35.06 357.51
NPC NPC-MAPS 1.54 1.53 1.54 1.63 1.63 1.57 3.20 2.19 3.38 3.39 2.78 3.40 27.76 NPC-Kaiga unit I 12.08 13.03 13.03 14.17 14.53 13.91 13.57 10.96 8.82 11.44 10.79 11.99 148.33 NPC-Kaiga unit II 11.21 14.20 13.64 14.74 15.24 10.74 10.84 7.75 15.63 14.58 13.14 8.81 150.52 Total NPC 24.83 28.76 28.21 30.54 31.40 26.23 27.61 20.90 27.83 29.41 26.70 24.20 326.61
NTPC - SimhadriNTPC Simhadri Stage I 101.49 93.84 100.58 92.43 105.95 98.03 88.40 59.11 92.65 99.42 98.43 108.58 1138.92NTPC Simhadri Stage II 44.30 40.45 44.72 36.10 23.26 32.98 30.64 44.33 49.76 58.32 51.18 50.57 506.61
Total NTPC- Simhadri 145.79 134.29 145.29 128.53 129.21 131.02 119.05 103.44 142.41 157.74 149.61 159.15 1645.54
CGS - NewVallur Thermal Power Plant 4.84 3.54 2.70 5.82 1.61 5.98 7.53 7.51 7.11 16.52 10.81 9.26 83.21
0.00 0.00 0.00 0.00 0.00 0.00 0.00 0.00 0.00 0.00 0.00 0.00 0.00 0.000.00 0.00 0.00 0.00 0.00 0.00 0.00 0.00 0.00 0.00 0.00 0.00 0.00 0.000.00 0.00 0.00 0.00 0.00 0.00 0.00 0.00 0.00 0.00 0.00 0.00 0.00 0.000.00 0.00 0.00 0.00 0.00 0.00 0.00 0.00 0.00 0.00 0.00 0.00 0.00 0.00
TOTAL CGS 332.83 317.73 308.21 306.47 284.87 289.59 275.84 281.33 334.57 376.36 345.01 363.54 3816.35
APGPCLAPGPCL I - Allocated capacity 0.69 0.64 0.80 0.78 0.67 0.66 0.63 0.64 0.74 0.70 1.00 1.59 9.52APGPCL I - Unutilised capacity 0.46 0.01 0.03 0.02 0.03 0.03 0.01 0.01 0.08 0.11 0.17 0.36 1.31APGPCL II - Allocated capacity 2.41 2.30 2.43 2.73 2.37 2.29 2.22 2.22 2.77 2.55 1.30 0.00 25.58APGPCL II - Unutilised capacity 0.60 0.41 0.00 0.00 0.00 0.00 0.00 0.00 0.00 0.00 0.00 0.00 1.02Total APGPCL 4.16 3.36 3.26 3.52 3.07 2.97 2.86 2.87 3.59 3.36 2.47 1.94 37.44
IPPSGVK 11.96 11.84 13.15 12.28 11.30 10.83 11.43 13.08 15.65 15.21 13.29 11.46 151.48Spectrum 13.26 12.30 12.56 12.53 11.80 10.76 11.52 14.31 19.22 17.85 15.52 15.59 167.23Kondapalli (Naphtha) 0.00 0.00 0.00 0.00 0.00 0.00 0.00 0.00 0.00 0.00 0.00 0.00 0.00Kondapalli (Gas) 23.60 22.35 19.14 18.42 17.10 15.38 18.18 18.53 8.52 15.70 21.06 25.58 223.57BSES 5.62 5.15 8.14 7.27 5.94 5.66 5.46 5.83 8.49 6.83 5.11 3.58 73.08GVK Extension 0.00 0.16 0.07 0.00 0.00 0.00 0.00 0.00 0.00 0.00 0.00 0.00 0.23Vemagiri 17.48 6.85 0.00 0.00 0.00 0.00 0.00 0.00 0.00 0.00 0.00 0.00 24.32Gautami 0.00 0.00 0.00 0.00 0.00 0.00 0.00 0.00 0.00 0.00 0.00 0.00 0.00
Page 165 of 195

Konaseema 0.71 0.00 0.00 0.00 0.00 0.00 0.00 0.00 0.00 0.00 0.00 0.00 0.710.00 0.00 0.00 0.00 0.00 0.00 0.00 0.00 0.00 0.00 0.00 0.00 0.00 0.000.00 0.00 0.00 0.00 0.00 0.00 0.00 0.00 0.00 0.00 0.00 0.00 0.00 0.000.00 0.00 0.00 0.00 0.00 0.00 0.00 0.00 0.00 0.00 0.00 0.00 0.00 0.000.00 0.00 0.00 0.00 0.00 0.00 0.00 0.00 0.00 0.00 0.00 0.00 0.00 0.000.00 0.00 0.00 0.00 0.00 0.00 0.00 0.00 0.00 0.00 0.00 0.00 0.00 0.00
TOTAL IPPS 72.63 58.64 53.06 50.50 46.14 42.64 46.59 51.74 51.89 55.60 54.98 56.21 640.62
NCENCE - Bio-Mass 8.95 7.96 7.13 8.71 7.83 7.25 6.79 7.30 8.26 9.70 10.06 10.97 100.90NCE - Bagasse 8.29 4.28 5.10 10.52 6.14 4.18 0.00 4.50 11.08 10.22 6.07 42.17 112.57NCE - Municipal Waste to Energy 0.00 0.00 0.00 0.00 0.00 0.00 0.00 0.00 0.00 0.00 0.00 0.00 0.00NCE - Industrial Waste based power project 0.00 0.00 0.00 0.00 0.00 0.00 0.00 0.00 0.00 0.00 0.00 0.00 0.00NCE - Wind Power 0.00 0.00 0.00 0.00 0.00 0.00 0.00 0.00 0.00 0.00 0.00 0.00 0.00NCE - Mini Hydel 0.00 0.14 0.00 0.00 1.43 0.63 0.79 0.50 0.29 0.44 0.42 0.62 5.25NCE - NCL Energy Ltd 0.00 0.00 0.00 0.34 0.66 0.54 0.62 0.55 0.42 0.12 0.00 0.00 3.25NCE-Others 1.83 2.83 2.98 3.34 4.85 5.19 5.77 6.13 6.60 6.67 6.78 7.50 60.47TOTAL NCE 19.08 15.20 15.21 22.92 20.91 17.79 13.97 18.98 26.64 27.15 23.33 61.26 282.44
OTHERSSrivathsa 0.00 0.00 0.00 0.00 0.00 0.00 0.00 0.00 0.00 0.00 0.00 0.00 0.00LVS 0.00 0.00 0.00 0.00 0.00 0.00 0.00 0.00 0.00 0.00 0.00 0.00 0.00Vishakapatnam Steel Plant 0.00 0.00 0.00 0.00 0.00 0.00 0.00 0.00 0.00 0.00 0.00 0.00 0.00NB Ferro Alloys 0.00 0.00 0.00 0.00 0.00 0.00 0.00 0.00 0.00 0.00 0.00 0.00 0.00Sponge Iron * 0.00 0.00 0.00 0.00 0.00 0.00 0.00 0.00 0.00 0.00 0.00 0.00 0.00Heavy Water Plant * 0.00 0.00 0.00 0.00 0.00 0.00 0.00 0.00 0.00 0.00 0.00 0.00 0.00Kesoram * 0.00 0.00 0.00 0.00 0.00 0.00 0.00 0.00 0.00 0.00 0.00 0.00 0.00Essar Steels * 0.00 0.00 0.00 0.00 0.00 0.00 0.00 0.00 0.00 0.00 0.00 0.00 0.00
0.00 0.00 0.00 0.00 0.00 0.00 0.00 0.00 0.00 0.00 0.00 0.00 0.00 0.000.00 0.00 0.00 0.00 0.00 0.00 0.00 0.00 0.00 0.00 0.00 0.00 0.00 0.000.00 0.00 0.00 0.00 0.00 0.00 0.00 0.00 0.00 0.00 0.00 0.00 0.00 0.00
TOTAL OTHERS 0.00 0.00 0.00 0.00 0.00 0.00 0.00 0.00 0.00 0.00 0.00 0.00 0.00
MARKETPTC 0.00 0.00 0.00 0.00 0.00 0.00 0.00 0.00 0.00 0.00 0.00 0.00 0.00RCL and Short-Term Sources(IG Wells,Kesoram) 0.00 0.00 0.00 0.00 0.00 0.00 0.00 0.00 0.00 0.00 0.00 0.00 0.00CPDCL 0.00 0.00 0.00 0.00 0.00 0.00 0.00 0.00 0.00 0.00 0.00 0.00 0.00EPDCL 0.00 0.00 0.00 0.00 0.00 0.00 0.00 0.00 0.00 0.00 0.00 0.00 0.00NPDCL 0.00 0.00 0.00 0.00 0.00 0.00 0.00 0.00 0.00 0.00 0.00 0.00 0.00SPDCL 0.00 0.00 0.00 0.00 0.00 0.00 0.00 0.00 0.00 0.00 0.00 0.00 0.00UI 0.00 0.00 0.00 0.00 0.00 0.00 0.00 0.00 0.00 0.00 0.00 0.00 0.00Other Short Term Sources 0.00 0.00 0.00 0.00 0.00 0.00 0.00 0.00 0.00 0.00 0.00 0.00 0.00PGCIL UI Energy 0.00 0.00 0.00 0.00 0.00 0.00 0.00 0.00 0.00 0.00 0.00 0.00 0.00NTPC Simhadri UI Energy 0.00 0.00 0.00 0.00 0.00 0.00 0.00 0.00 0.00 0.00 0.00 0.00 0.00Other Short Term Sources/Traders 74.25 2.02 -45.13 92.88 141.27 252.67 139.23 -30.81 63.53 198.94 236.32 136.88 1262.04Mediumt Term Sources/Traders (Medium Term) 0.00 0.00 0.00 0.00 16.54 20.63 25.48 41.04 40.06 43.69 32.83 38.77 259.06
0.00 0.00 0.00 0.00 0.00 0.00 0.00 0.00 0.00 0.00 0.00 0.00 0.00 0.000.00 0.00 0.00 0.00 0.00 0.00 0.00 0.00 0.00 0.00 0.00 0.00 0.00 0.000.00 0.00 0.00 0.00 0.00 0.00 0.00 0.00 0.00 0.00 0.00 0.00 0.00 0.00
TOTAL MARKET 74.25 2.02 -45.13 92.88 157.81 273.30 164.71 10.23 103.59 242.64 269.16 175.65 1521.10
TOTAL (From All Sources) 1028.21 921.12 766.88 895.57 1106.48 1203.12 991.40 840.57 1012.83 1260.60 1197.32 1233.41 12457.50
2014-15
April May June July August September October November December January February March Total
TSGENCOThermalVTPS I 115.39 111.91 108.81 104.35 80.28 81.54 93.29 115.49 121.04 119.04 105.91 122.96 1280.03VTPS II 0.00 0.00 0.00 0.00 0.00 0.00 0.00 0.00 0.00 0.00 0.00 0.00 0.00
D LinkCost (Rs.
/ kWh)Energy Dispatch (MU)
Generating Station
Page 166 of 195

VTPS III 0.00 0.00 0.00 0.00 0.00 0.00 0.00 0.00 0.00 0.00 0.00 0.00 0.00VTPS IV 47.51 43.23 51.64 44.69 46.08 40.31 45.71 48.98 25.72 52.68 44.51 44.95 536.01RTPP I 34.60 27.96 24.07 22.61 26.35 30.67 36.10 34.29 33.58 34.11 33.17 37.62 375.13RTPP Stage-II 41.54 36.41 35.29 26.43 36.16 27.11 39.32 31.49 37.12 38.68 34.62 42.33 426.49RTPP Stage-III 20.07 16.58 17.51 16.45 6.20 13.86 19.00 16.77 16.76 17.61 17.16 21.12 199.11KTPS A 53.01 48.73 46.87 49.36 46.59 40.49 58.12 54.25 51.08 51.29 59.10 67.50 626.39KTPS B 0.00 0.00 0.00 0.00 0.00 0.00 0.00 0.00 0.00 0.00 0.00 0.00 0.00KTPS C 0.00 0.00 0.00 0.00 0.00 0.00 0.00 0.00 0.00 0.00 0.00 0.00 0.00KTPS D 45.29 41.92 41.51 40.33 39.24 35.40 40.00 27.11 25.78 53.15 46.19 54.99 490.92KTPS Stage VI 48.50 45.33 47.73 50.89 44.70 42.78 51.36 49.57 52.64 47.65 46.99 55.74 583.88RTS B 4.98 5.31 4.94 4.78 4.79 2.01 -0.07 -0.13 0.52 -0.07 -0.06 -0.07 26.92NTS 0.00 0.00 0.00 0.00 0.00 0.00 0.00 0.00 0.00 0.00 0.00 0.00 0.00Kakatiya Thermal Power Plant Stage I 51.91 51.24 48.99 53.46 52.26 48.10 54.19 52.48 54.11 52.71 43.91 49.47 612.83Kakatiya Thermal Power Plant Stage II 0.00 0.00 0.00 0.00 0.00 0.00 0.00 0.00 0.00 0.00 0.00 0.00 0.00Damodaram Sanjeevaiah Thermal power plant - I 0.00 0.00 0.00 0.00 0.00 0.00 0.00 0.00 0.00 0.00 0.00 0.00 0.00Damodaram Sanjeevaiah Thermal power plant - II 0.00 0.00 0.00 0.00 0.00 0.00 0.00 0.00 0.00 0.00 0.00 0.00 0.00
0.000.000.000.000.00
TOTAL THERMAL 462.79 428.62 427.36 413.35 382.65 362.28 437.02 430.31 418.34 466.86 431.50 496.61 5157.70
MACHKUND PH AP Share 4.67 3.23 2.57 2.44 0.46 3.13 2.34 2.38 2.06 2.36 1.96 1.28 28.89TUNGBHADRA PH AP Share 0.27 -0.09 0.00 0.00 0.30 2.85 2.76 2.58 3.00 3.26 3.19 3.25 21.38USL 9.09 6.28 0.00 0.00 0.00 0.00 0.00 0.00 0.00 0.00 0.00 0.00 15.37LSR 20.76 20.52 0.79 0.00 0.00 0.00 0.00 0.00 0.00 0.00 0.00 0.00 42.06DONKARAYI 2.07 2.04 0.09 0.00 0.00 0.00 0.00 0.00 0.00 0.00 0.00 0.00 4.20SSLM 14.15 0.27 0.30 0.00 0.00 0.00 0.00 0.00 0.00 0.00 0.00 0.00 14.72NSPH 1.50 -0.08 2.22 7.04 47.34 116.88 73.04 27.04 7.00 0.03 2.52 7.42 291.96NSRCPH 0.00 0.00 0.00 0.00 0.00 0.00 0.00 0.00 0.00 0.00 0.00 0.00 0.00NSLCPH 0.00 0.00 0.00 0.00 0.23 2.23 3.56 3.78 2.59 0.42 0.00 0.00 12.81POCHAMPAD PH 0.69 0.00 0.00 0.00 0.00 0.05 0.32 0.00 0.34 0.00 0.03 0.03 1.44NIZAMSAGAR PH 0.00 0.00 -0.01 -0.01 0.18 0.56 0.48 -0.01 -0.01 -0.01 0.07 -0.01 1.24PABM -0.01 -0.01 0.00 0.00 0.00 0.00 0.00 0.00 0.00 0.00 0.00 0.00 -0.01MINI HYDRO&OTHERS 0.00 0.00 0.00 0.00 0.00 0.06 0.02 0.02 0.10 0.03 0.01 0.00 0.24SINGUR 0.41 0.06 -0.01 0.17 0.06 0.10 0.10 0.20 0.08 0.05 0.12 0.12 1.46SSLM LCPH 11.62 -0.08 -0.18 2.74 139.56 153.86 84.80 21.34 40.57 22.54 19.27 23.09 519.12Nagarjunasagar Tail Pond Dam Power House 0.00 0.00 0.00 0.00 0.00 0.00 0.00 0.00 0.00 0.00 0.00 0.00 0.00Priyadarshini Jurala Hydro Electric Project- AP Share 0.00 0.00 0.00 0.00 0.00 0.00 0.00 0.00 0.00 0.00 0.00 0.00 0.00Lower Jurala Hydro Electric Project -0.02 -0.02 -0.05 0.49 24.59 33.37 0.41 0.97 -0.01 0.00 0.00 -0.06 59.65POCHAMPAD Stig-II 0.31 0.00 0.00 0.00 0.00 0.03 0.36 0.00 0.04 0.00 0.00 0.00 0.73PULICHINTAL(New Project) 0.00 0.00 0.00 0.00 0.00 0.00 0.00 0.00 0.00 0.00 0.00 0.00 0.00
Mini HYDRO(Chettaipeta) 0.12 0.00 0.00 0.00 0.00 0.00 0.00 0.00 0.00 0.00 0.00 0.00 0.12Ramagiri Wind Mills 0.00 0.00 0.00 0.00 0.00 0.00 0.00 0.00 0.00 0.00 0.00 0.00 0.00Pochampad Stig-VI 0.13 0.00 0.00 0.00 0.00 0.00 0.00 0.00 0.00 0.00 0.00 0.00 0.130 0.00 0.00 0.00 0.00 0.00 0.00 0.00 0.00 0.00 0.00 0.00 0.00 0.00Hydel Adjusted Energy & Backing down 0.00 0.00 0.00 0.00 0.00 0.00 0.00 0.00 0.00 0.00 0.00 0.00 0.00TOTAL HYDRO 65.76 32.12 5.72 12.86 212.72 313.11 168.18 58.30 55.76 28.68 27.17 35.13 1015.51TOTAL TSGENCO 528.56 460.74 433.08 426.22 595.37 675.39 605.20 488.61 474.10 495.54 458.67 531.74 6173.21
Central Generating Stations NTPCNTPC (SR) NTPC (SR) 73.77 59.37 57.53 67.04 72.24 50.32 63.02 69.46 81.12 74.17 70.27 73.44 811.74 NTPC (SR) Stage III 19.75 17.95 16.78 15.49 7.51 15.28 20.39 18.03 21.49 18.15 17.98 15.94 204.74 Total NTPC(SR) 93.52 77.32 74.31 82.53 79.75 65.60 83.42 87.49 102.61 92.32 88.24 89.38 1016.48
NTPC (ER) Farakka 0.00 0.00 0.00 0.00 0.00 0.00 0.00 0.00 0.00 0.00 0.00 0.00 0.00 Kahalgaon 0.00 0.00 0.00 0.00 0.00 0.00 0.00 0.00 0.00 0.00 0.00 0.00 0.00 Talcher - Stage 1 0.00 0.00 0.00 0.00 0.00 0.00 0.00 0.00 0.00 0.00 0.00 0.00 0.00
Page 167 of 195

Talcher Stage 2 42.17 43.12 30.63 32.53 37.78 39.83 44.01 40.86 44.67 42.62 39.55 44.04 481.81 Others 0.00 Total NTPC(ER) 42.17 43.12 30.63 32.53 37.78 39.83 44.01 40.86 44.67 42.62 39.55 44.04 481.81
Total NTPC 135.68 120.44 104.94 115.06 117.53 105.43 127.42 128.35 147.28 134.94 127.79 133.42 1498.29
NLC TS-II Stage-I 12.20 11.79 11.14 12.76 12.04 10.38 5.70 8.56 9.26 11.75 11.15 11.92 128.66 Stage-II 21.01 20.15 18.34 17.28 17.24 16.02 18.43 16.04 18.00 21.74 19.56 21.26 225.08 Total NLC 33.21 31.94 29.48 30.04 29.28 26.40 24.13 24.60 27.26 33.49 30.71 33.19 353.74
NPC NPC-MAPS 3.25 2.91 3.15 3.41 3.41 3.22 1.82 2.33 0.80 2.96 3.43 3.97 34.66 NPC-Kaiga unit I 11.43 11.90 10.98 11.74 11.87 11.36 11.71 6.36 12.12 13.75 13.16 11.74 138.10 NPC-Kaiga unit II 9.34 10.85 9.92 11.19 13.74 13.93 14.51 13.96 13.52 15.90 15.08 14.37 156.32 Total NPC 24.02 25.66 24.05 26.34 29.02 28.51 28.05 22.65 26.43 32.60 31.66 30.08 329.08
NTPC - SimhadriNTPC Simhadri Stage I 109.35 109.37 107.06 109.81 91.26 99.71 81.58 61.89 89.04 102.12 97.87 109.74 1168.79NTPC Simhadri Stage II 53.60 48.06 43.16 53.65 34.41 20.29 28.22 45.37 49.72 45.49 45.56 47.12 514.66
Total NTPC- Simhadri 162.95 157.43 150.22 163.45 125.66 120.00 109.81 107.26 138.76 147.62 143.42 156.86 1683.45
CGS - NewVallur Thermal Power Plant 12.80 13.13 9.77 14.17 10.47 6.39 8.94 9.22 7.82 11.34 10.50 13.78 128.34NTPC NVVNL Bundled Power Coal (CP) 0.00 0.00 0.00 0.00 0.00 0.00 0.00 0.00 0.00 0.00 0.00 0.00 0.00NTPC NVVNL Bundled Power Coal (NP) 5.48 5.18 4.55 4.45 4.41 4.18 4.69 -7.22 9.29 8.93 8.40 9.41 61.75
0.00 0.000.00 0.00
TOTAL CGS 374.16 353.79 323.01 353.52 316.37 290.91 303.04 284.87 356.83 368.92 352.49 376.74 4054.65
APGPCLAPGPCL I - Allocated capacity 0.85 0.63 0.65 0.29 0.00 0.00 0.00 0.31 0.69 0.59 0.45 0.48 4.92APGPCL I - Unutilised capacity 0.02 0.08 0.10 0.04 0.00 0.00 0.00 0.00 0.00 0.00 0.00 0.00 0.24APGPCL II - Allocated capacity 1.78 2.40 2.37 1.08 0.00 0.00 0.00 1.04 2.50 2.15 1.61 1.73 16.67APGPCL II - Unutilised capacity 0.21 0.00 0.00 0.01 0.00 0.00 0.00 0.00 0.00 0.00 0.00 0.00 0.22Total APGPCL 2.86 3.11 3.12 1.42 0.00 0.00 0.00 1.35 3.19 2.74 2.05 2.21 22.05
IPPSGVK 10.90 8.07 8.67 2.14 0.00 0.00 4.78 10.92 11.27 11.46 10.49 13.14 91.84Spectrum 11.29 12.28 8.95 2.04 -0.11 -0.04 1.08 10.80 14.06 9.64 8.07 8.77 86.84Kondapalli (Naphtha) 0.00 0.00 0.00 0.00 0.00 0.00 0.00 0.00 0.00 0.00 0.00 0.00 0.00Kondapalli (Gas) 21.75 21.27 15.19 6.78 1.04 0.03 0.01 0.00 0.00 3.77 4.71 5.20 79.74BSES 0.00 0.00 0.00 0.00 0.00 0.00 0.00 0.00 0.00 0.00 0.00 0.00 0.00GVK Extension 0.00 0.00 0.00 0.00 0.00 0.00 0.00 0.00 0.00 0.00 0.00 0.00 0.00Vemagiri 0.00 0.00 0.00 0.00 0.00 0.00 0.00 0.00 0.00 0.00 0.00 0.00 0.00Gautami 0.00 0.00 0.00 0.00 0.00 0.00 0.00 0.00 0.00 0.00 0.00 0.00 0.00Konaseema 0.00 0.00 0.00 0.00 0.00 0.00 0.00 0.00 0.00 0.00 0.00 0.00 0.00Reliance Infrastructure 0.87 3.86 4.85 1.51 0.00 0.00 3.07 6.11 4.98 1.26 0.00 0.00 26.52
0.00 0.000.00 0.000.00 0.000.00 0.00
TOTAL IPPS 44.81 45.49 37.66 12.47 0.92 -0.01 8.95 27.83 30.30 26.14 23.26 27.12 284.94
NCENCE - Bio-Mass 7.64 8.27 9.35 10.30 10.30 8.61 9.74 7.17 9.78 8.58 11.43 12.12 113.27NCE - Bagasse 3.21 6.46 2.78 6.30 6.71 4.95 5.77 1.38 12.59 13.44 8.77 5.76 78.13NCE - Municipal Waste to Energy 0.00 0.00 0.00 0.00 0.00 0.00 0.00 0.00 0.00 0.00 0.00 0.00 0.00NCE - Industrial Waste based power project 0.00 0.00 0.00 0.00 0.00 0.00 0.00 0.00 0.00 0.00 0.00 0.00 0.00
Page 168 of 195

NCE - Wind Power 0.00 0.00 0.00 0.00 0.00 0.00 0.00 0.00 0.00 0.00 0.00 0.00 0.00NCE - Mini Hydel 0.19 0.00 0.00 0.00 0.00 0.00 0.90 0.42 0.49 0.34 0.24 0.14 2.73NCE - NCL Energy Ltd 0.00 0.00 0.00 0.00 0.00 0.00 0.00 0.00 0.00 0.00 0.00 0.00 0.00NCE-Others 2.09 1.97 1.76 1.59 1.39 1.52 3.07 -2.24 2.87 2.98 3.44 4.19 24.62TOTAL NCE 13.14 16.70 13.89 18.19 18.40 15.08 19.48 6.72 25.73 25.35 23.88 22.21 218.75
OTHERSSrivathsa 0.00 0.00 0.00 0.00 0.00 0.00 0.00 0.00 0.00 0.00 0.00 0.00 0.00LVS 0.00 0.00 0.00 0.00 0.00 0.00 0.00 0.00 0.00 0.00 0.00 0.00 0.00Vishakapatnam Steel Plant 0.00 0.00 0.00 0.00 0.00 0.00 0.00 0.00 0.00 0.00 0.00 0.00 0.00NB Ferro Alloys 0.00 0.00 0.00 0.00 0.00 0.00 0.00 0.00 0.00 0.00 0.00 0.00 0.00
0.00 0.00 0.00 0.00 0.00 0.00 0.00 0.00 0.00 0.00 0.00 0.00 0.000.00 0.00 0.00 0.00 0.00 0.00 0.00 0.00 0.00 0.00 0.00 0.00 0.000.00 0.00 0.00 0.00 0.00 0.00 0.00 0.00 0.00 0.00 0.00 0.00 0.00
Essar steels 0.00 0.00 0.00 0.00 0.00 0.00 0.00 0.00 0.00 0.00 0.00 0.00 0.00KSK Mahanadi (MT) 0.00 0.00 0.00 0.00 0.00 0.00 0.00 0.00 0.00 0.00 0.00 0.00 0.00Hinduja 0.00 0.00 0.00 0.00 0.00 0.00 0.00 0.00 0.00 0.00 0.00 0.00 0.00RLNG 0.00 0.00 0.00 0.00 0.00 0.00 0.00 0.00 0.00 0.00 0.00 0.00 0.00TOTAL OTHERS 0.00 0.00 0.00 0.00 0.00 0.00 0.00 0.00 0.00 0.00 0.00 0.00 0.00
MARKETPTC 0.00 0.00 0.00 0.00 0.00 0.00 0.00 0.00 0.00 0.00 0.00 0.00 0.00RCL and Short-Term Sources(IG Wells,Kesoram) 0.00 0.00 0.00 0.00 0.00 0.00 0.00 0.00 0.00 0.00 0.00 0.00 0.00
0.00 0.00 0.00 0.00 0.00 0.00 0.00 0.00 0.00 0.00 0.00 0.00 0.000.00 0.00 0.00 0.00 0.00 0.00 0.00 0.00 0.00 0.00 0.00 0.00 0.000.00 0.00 0.00 0.00 0.00 0.00 0.00 0.00 0.00 0.00 0.00 0.00 0.00
APSPDCL 0.00 0.00 0.00 0.00 0.00 0.00 0.00 0.00 0.00 0.00 0.00 0.00 0.00UI 10.48 6.89 0.00 27.83 15.47 4.99 14.22 15.18 18.71 15.29 19.97 13.29 162.33Other Short Term Sources 0.00 0.00 0.00 0.00 0.00 0.00 0.00 0.00 0.00 0.00 0.00 0.00 0.00Pool Transaction (Purchases) 0.00 0.00 0.00 0.00 0.00 0.00 0.00 0.00 0.00 0.00 0.00 0.00 0.00Medium Term Open Access Traders 39.13 32.82 7.79 45.71 30.73 43.52 43.81 38.33 46.66 38.78 41.68 43.31 452.27Short Term Open Access Traders 167.90 -23.18 73.25 217.13 240.04 242.64 329.39 160.05 107.61 144.23 208.61 217.24 2084.90Bi-lateral Puchases 0.00 0.00 0.00 0.00 0.00 0.00 0.00 0.00 0.00 0.00 0.00 0.00 0.00Jhajjar 0.00 0.00 0.00 0.00 0.00 0.00 0.00 0.00 0.00 0.00 0.00 0.00 0.00Pool Purchase 0.00 0.00 0.00 0.00 0.00 0.00 0.00 0.00 0.00 0.00 0.00 0.00 0.00Pool Sales 0.00 0.00 0.00 0.00 0.00 0.00 0.00 0.00 0.00 0.00 0.00 0.00 0.00TOTAL MARKET 217.52 16.53 81.03 290.67 286.24 291.15 387.42 213.57 172.98 198.30 270.25 273.83 2699.50
TOTAL (From All Sources) 1181.05 896.36 891.80 1102.48 1217.30 1272.52 1324.08 1022.95 1063.14 1116.98 1130.60 1233.84 13453.10
2015-16
April May June July August September October November December January February March Total
TSGENCOThermalVTPS I 114.10 115.68 93.76 105.34 111.71 96.01 110.75 113.63 124.76 123.46 113.45 114.55 1337.18VTPS II 0.00 0.00 0.00 0.00 0.00 0.00 0.00 0.00 0.00 0.00 0.00 0.00 0.00VTPS III 0.00 0.00 0.00 0.00 0.00 0.00 0.00 0.00 0.00 0.00 0.00 0.00 0.00VTPS IV 40.05 44.51 38.62 49.96 48.20 41.93 52.10 14.07 0.00 36.26 49.22 51.93 466.87RTPP I 32.42 36.10 32.01 29.31 34.41 34.51 39.68 40.25 41.09 41.24 39.44 34.91 435.36RTPP Stage-II 35.88 41.17 32.84 40.82 29.81 37.08 39.52 32.54 38.84 41.31 39.24 38.39 447.45RTPP Stage-III 18.00 19.65 15.40 20.01 6.11 18.15 19.62 17.67 20.40 21.07 19.68 19.21 214.97KTPS A 52.29 61.30 40.02 46.87 56.70 50.38 60.27 48.18 53.32 48.38 50.70 51.97 620.36KTPS B 0.00 0.00 0.00 0.00 0.00 0.00 0.00 0.00 0.00 0.00 0.00 0.00 0.00KTPS C 0.00 0.00 0.00 0.00 0.00 0.00 0.00 0.00 0.00 0.00 0.00 0.00 0.00KTPS D 44.67 52.18 34.88 45.24 46.93 36.19 37.69 44.56 29.76 28.91 47.72 53.95 502.70KTPS Stage VI 19.53 32.56 10.07 33.30 32.60 29.16 30.80 39.15 31.71 26.25 26.99 32.08 344.19RTS B -0.23 3.91 5.12 5.90 4.57 4.37 5.65 5.41 5.94 5.59 6.22 5.27 57.72NTS 0.00 0.00 0.00 0.00 0.00 0.00 0.00 0.00 0.00 0.00 0.00 0.00 0.00Kakatiya Thermal Power Plant Stage I 37.71 40.58 31.31 50.78 47.44 38.55 25.26 41.18 31.88 4.41 30.43 28.59 408.13Kakatiya Thermal Power Plant Stage II 0.00 0.00 0.00 0.00 0.00 0.00 0.00 0.00 0.00 0.00 0.00 0.00 0.00Damodaram Sanjeevaiah Thermal power plant - I 0.00 0.00 0.00 0.00 0.00 0.00 0.00 0.00 0.00 0.00 0.00 0.00 0.00
Generating Station D LinkCost (Rs.
/ kWh)Energy Dispatch (MU)
Page 169 of 195

Damodaram Sanjeevaiah Thermal power plant - II 0.00 0.00 0.00 0.00 0.00 0.00 0.00 0.00 0.00 0.00 0.00 0.00 0.00Thermal Incentive 15-16 0.00 0.00 0.00 0.00 0.00 0.00 0.00 0.00 0.00 0.00 0.00 0.00 0.00KTPP II Infirm Power 0.00 0.00 0.00 0.00 0.00 0.00 0.00 0.00 0.00 0.00 0.00 95.61 95.61TSGENCO Thermal stations True Up 15-16 0.00 0.00 0.00 0.00 0.00 0.00 0.00 0.00 0.00 0.00 0.00 0.00 0.00
0.000.00
TOTAL THERMAL 394.42 447.64 334.03 427.53 418.49 386.33 421.35 396.65 377.70 376.88 423.09 526.45 4930.54
MACHKUND PH TS Share 0.00 0.00 0.00 0.00 0.00 0.00 0.00 0.00 0.00 0.00 0.00 0.00 0.00TUNGBHADRA PH TS Share 0.00 0.00 0.00 0.00 0.00 0.00 0.00 0.00 0.00 0.00 0.00 0.00 0.00USL 0.00 0.00 0.00 0.00 0.00 0.00 0.00 0.00 0.00 0.00 0.00 0.00 0.00LSR 0.00 0.00 0.00 0.00 0.00 0.00 0.00 0.00 0.00 0.00 0.00 0.00 0.00DONKARAYI 0.00 0.00 0.00 0.00 0.00 0.00 0.00 0.00 0.00 0.00 0.00 0.00 0.00SSLM 0.00 0.00 0.00 0.00 0.00 0.00 0.00 0.00 0.00 0.00 0.00 0.00 0.00NSPH 4.34 1.01 -0.05 0.03 -0.09 -0.11 -0.11 6.41 4.86 1.12 5.58 2.93 25.93NSRCPH 0.00 0.00 0.00 0.00 0.00 0.00 0.00 0.00 0.00 0.00 0.00 0.00 0.00NSLCPH 0.00 0.00 0.00 0.00 0.00 0.00 0.00 0.00 0.00 0.00 0.00 0.00 0.00POCHAMPAD PH 0.00 -0.01 -0.01 0.00 0.00 0.00 0.00 0.00 0.00 0.00 0.00 0.00 -0.05NIZAMSAGAR PH -0.01 -0.01 -0.01 0.02 -0.01 -0.01 0.00 -0.01 -0.01 -0.01 -0.01 -0.01 -0.05PABM 0.00 0.00 0.00 0.00 0.00 0.00 0.00 0.00 0.00 0.00 0.00 0.00 0.00MINI HYDRO&OTHERS 0.02 0.00 0.00 0.00 0.00 0.00 0.00 0.00 0.00 0.00 0.00 0.00 0.00SINGUR -0.01 -0.01 -0.01 -0.01 -0.01 -0.01 -0.01 -0.01 -0.01 -0.01 -0.01 -0.01 -0.08SSLM LCPH 2.35 -0.03 -0.21 -0.23 -0.23 3.08 5.16 12.59 4.00 -0.15 7.64 9.32 43.29Nagarjunasagar Tail Pond Dam Power House 0.00 0.00 0.00 0.00 0.00 0.00 0.00 0.00 0.00 0.00 0.00 0.00 0.00Priyadarshini Jurala Hydro Electric Project- TS Share 0.00 0.00 0.00 0.00 0.00 0.00 0.00 0.00 0.00 0.00 0.00 0.00 0.00Lower Jurala Hydro Electric Project -0.07 -0.08 -0.06 -0.07 -0.07 4.24 2.13 0.00 0.00 -0.03 -0.02 -0.02 5.95POCHAMPAD Stig-II 0.00 0.00 0.00 0.00 0.00 0.00 0.00 0.00 0.00 0.00 0.00 0.00 0.00PULICHINTAL(New Project) 0.00 0.00 0.00 0.00 0.00 0.00 0.00 0.00 0.00 0.00 0.00 0.00 0.00Pochampad Stig-VI 0.00 0.00 0.00 0.00 0.00 0.00 0.00 0.00 0.00 0.00 0.00 0.00 0.00APGE-Hydel-Interstate 3.16 1.42 1.23 2.63 3.16 3.07 3.19 3.09 2.92 2.36 2.21 2.36 30.80Lower Jurala-I&II Infirm Power 0.00 0.00 0.00 0.00 0.00 0.00 0.00 0.00 0.00 0.00 0.00 2.54 2.54TSGENCO Hydel Stations True Up 14-15 0.00 0.00 0.00 0.00 0.00 0.00 0.00 0.00 0.00 0.00 0.00 0.00 0.00
0.00TOTAL HYDRO 9.79 2.30 0.89 2.36 2.75 10.27 10.36 22.07 11.76 3.28 15.39 17.12 108.33TOTAL TSGENCO 404.21 449.94 334.92 429.90 421.24 396.59 431.71 418.71 389.46 380.16 438.47 543.56 5038.88
Central Generating Stations NTPCNTPC (SR) NTPC (SR) 62.27 63.85 39.20 51.70 59.95 47.37 52.27 63.90 65.56 58.51 65.23 69.70 699.52 NTPC (SR) Stage III 15.08 14.83 9.41 14.05 11.18 13.18 10.84 16.36 15.28 15.27 16.77 17.71 169.96 Total NTPC(SR) 77.36 78.68 48.61 65.75 71.13 60.55 63.11 80.27 80.84 73.78 81.99 87.41 869.48
NTPC (ER) Farakka 0.00 0.00 0.00 0.00 0.00 0.00 0.00 0.00 0.00 0.00 0.00 0.00 0.00 Kahalgaon 0.00 0.00 0.00 0.00 0.00 0.00 0.00 0.00 0.00 0.00 0.00 0.00 0.00 Talcher - Stage 1 0.00 0.00 0.00 0.00 0.00 0.00 0.00 0.00 0.00 0.00 0.00 0.00 0.00 Talcher Stage 2 41.37 43.34 29.17 41.05 32.70 39.93 40.55 39.72 41.83 39.65 40.14 41.84 471.27 Others 0.00 0.00 0.00 0.00 0.00 0.00 0.00 0.00 0.00 0.00 0.00 0.00 0.00 Total NTPC(ER) 41.37 43.34 29.17 41.05 32.70 39.93 40.55 39.72 41.83 39.65 40.14 41.84 471.27
Total NTPC 118.72 122.02 77.78 106.80 103.83 100.48 103.66 119.99 122.67 113.44 122.13 129.25 1340.75
NLC TS-II Stage-I 10.65 11.19 8.79 11.78 11.47 9.10 8.32 6.49 4.87 9.02 10.34 6.13 108.14 Stage-II 19.17 19.96 16.26 15.31 15.81 14.36 16.52 11.05 11.91 15.06 18.44 11.81 185.68 Total NLC 29.82 31.16 25.05 27.09 27.28 23.47 24.85 17.55 16.78 24.08 28.78 17.94 293.83
NPC NPC-MAPS 3.91 4.06 4.02 4.31 4.14 3.24 3.90 2.90 2.02 2.89 3.78 3.83 42.99 NPC-Kaiga unit I 13.40 15.03 15.23 13.59 13.35 14.24 12.30 12.05 14.47 13.90 13.71 14.08 165.34
Page 170 of 195

NPC-Kaiga unit II 16.02 17.25 15.78 15.42 8.36 15.68 14.75 15.22 15.71 15.87 14.85 15.82 180.74 Total NPC 33.34 36.34 35.02 33.32 25.85 33.16 30.95 30.17 32.20 32.65 32.34 33.73 389.07
NTPC - SimhadriNTPC Simhadri Stage I 88.37 77.55 77.74 82.24 83.18 88.68 105.31 80.40 51.09 88.42 94.34 108.57 1025.89NTPC Simhadri Stage II 33.50 28.41 24.01 28.74 20.05 17.47 48.81 51.13 41.72 25.31 41.13 39.71 399.99
Total NTPC- Simhadri 121.87 105.96 101.75 110.98 103.22 106.15 154.12 131.53 92.82 113.73 135.47 148.28 1425.89
CGS - New Vallur Thermal Power Plant 13.68 15.04 11.24 12.36 12.57 11.24 15.69 12.06 10.74 13.46 16.75 9.75 154.56NTPC ARAVALI POWER 33.90 32.25 21.66 33.69 33.52 33.69 54.79 62.39 59.04 55.91 46.12 38.48 505.45NLC Tamilnadu Power Ltd 0.00 0.00 3.34 4.28 6.77 9.35 12.64 16.88 16.94 17.58 22.06 11.33 121.16NTPC NVVNL Bundled Power Coal (NP) 1.58 1.47 1.09 1.10 1.04 1.13 1.41 0.97 1.34 1.36 1.42 1.63 15.54NTPC NVVNL Bundled Power Solar (NP) 8.53 8.68 7.14 8.29 8.41 7.28 8.35 8.05 8.68 8.36 8.33 9.24 99.35TOTAL CGS 361.44 352.91 284.07 337.89 322.49 325.96 406.45 399.58 361.21 380.57 413.40 399.63 4345.60
APGPCLAPGPCL I - Allocated capacity 0.51 0.36 0.51 0.44 0.38 0.36 0.33 0.24 0.24 0.25 0.27 0.31 4.19APGPCL I - Unutilised capacity 0.00 0.00 0.00 0.00 0.00 0.00 0.00 0.00 0.00 0.00 0.00 0.00 0.00APGPCL II - Allocated capacity 1.79 1.26 1.79 1.54 1.31 1.21 1.11 0.82 0.82 0.93 0.98 1.24 14.81APGPCL II - Unutilised capacity 0.00 0.00 0.00 0.00 0.00 0.00 0.00 0.00 0.00 0.00 0.00 0.00 0.00Total APGPCL 2.30 1.62 2.30 1.98 1.69 1.57 1.44 1.06 1.06 1.18 1.25 1.55 19.00
IPPSGVK 9.28 10.87 0.00 0.00 0.00 0.00 7.65 0.00 0.00 0.00 0.00 -0.85 26.95Spectrum 6.80 8.72 9.93 8.73 5.33 4.16 3.24 4.77 8.37 6.48 5.15 2.32 74.01Kondapalli (Naphtha) 0.00 0.00 0.00 0.00 0.00 0.00 0.00 0.00 0.00 0.00 0.00 0.00 0.00Kondapalli (Gas) 4.17 1.67 0.82 0.49 1.82 2.25 4.09 5.98 6.62 2.11 0.00 0.16 30.19BSES 0.00 0.00 0.00 0.00 0.00 0.00 0.00 0.00 0.00 0.00 0.00 0.00 0.00GVK Extension 0.00 0.00 0.00 0.00 0.00 0.00 0.00 9.29 9.28 0.29 0.00 0.00 18.86Vemagiri 7.78 17.10 0.00 0.00 0.00 0.00 0.00 0.00 0.00 0.00 0.00 0.00 24.89Gautami 16.53 16.09 0.00 0.00 0.00 0.00 0.00 0.00 0.00 0.00 0.00 0.00 32.62Konaseema 0.00 0.00 0.00 0.00 0.00 0.00 0.00 0.00 0.00 0.00 0.00 0.00 0.00
0.000.000.000.000.00
TOTAL IPPS 44.56 54.45 10.75 9.23 7.16 6.40 14.98 20.04 24.27 8.88 5.15 1.64 207.51
NCENCE - Bio-Mass 7.91 10.15 9.05 11.18 11.40 10.10 9.58 9.26 9.05 9.70 11.83 13.14 122.35NCE - Bagasse 0.00 0.00 0.00 0.00 0.00 0.21 6.94 7.92 10.45 9.81 10.57 5.73 51.63NCE - Municipal Waste to Energy 0.00 0.00 0.00 0.00 0.00 0.00 0.00 0.00 0.00 0.00 0.00 0.00 0.00NCE - Industrial Waste based power project 0.00 0.00 0.00 0.00 0.00 0.00 0.00 0.00 0.00 0.00 0.00 0.00 0.00NCE - Wind Power 0.00 0.00 0.00 0.00 0.00 0.00 0.00 0.00 0.00 0.00 0.00 0.00 0.00NCE - Mini Hydel 0.06 0.00 0.00 0.00 0.00 0.00 0.00 0.00 0.00 0.00 0.00 0.00 0.06NCE - NCL Energy Ltd 0.00 0.00 0.00 0.00 0.00 0.00 0.00 0.00 0.00 0.00 0.00 0.00 0.00NCE-Others 1.76 2.13 1.66 1.93 1.68 1.69 1.88 1.80 1.90 2.07 2.11 2.94 23.56TOTAL NCE 9.72 12.29 10.71 13.11 13.08 12.01 18.40 18.99 21.40 21.57 24.51 21.81 197.60
OTHERSSrivathsa 0.00 0.00 0.00 0.00 0.00 0.00 0.00 0.00 0.00 0.00 0.00 0.00 0.00LVS 0.00 0.00 0.00 0.00 0.00 0.00 0.00 0.00 0.00 0.00 0.00 0.00 0.00Vishakapatnam Steel Plant 0.00 0.00 0.00 0.00 0.00 0.00 0.00 0.00 0.00 0.00 0.00 0.00 0.00NB Ferro Alloys 0.00 0.00 0.00 0.00 0.00 0.00 0.00 0.00 0.00 0.00 0.00 0.00 0.00Corporate Power (MT) 0.00 0.00 0.00 0.00 0.00 0.00 0.00 0.00 0.00 0.00 0.00 0.00 0.00KSK Mahanadi (MT) 0.00 0.00 0.00 0.00 0.00 0.00 0.00 0.00 0.00 0.00 0.00 0.00 0.00Hinduja 0.00 0.00 0.00 0.00 0.00 0.00 0.00 0.00 0.00 0.00 0.00 0.00 0.00Singareni 0.00 0.00 0.00 0.00 0.00 0.00 0.00 0.00 0.00 0.00 0.00 0.00 0.00
Page 171 of 195

Thermal Power 19.56 30.96 51.51 51.97 43.30 55.76 59.02 51.34 58.31 57.00 55.06 58.34 592.140.000.00
TOTAL OTHERS 19.56 30.96 51.51 51.97 43.30 55.76 59.02 51.34 58.31 57.00 55.06 58.34 592.14
MARKETPTC 0.00 0.00 0.00 0.00 0.00 0.00 0.00 0.00 0.00 0.00 0.00 0.00 0.00RCL and Short-Term Sources(IG Wells,Kesoram) 0.00 0.00 0.00 0.00 0.00 0.00 0.00 0.00 0.00 0.00 0.00 0.00 0.00CPDCL 0.00 0.00 0.00 0.00 0.00 0.00 0.00 0.00 0.00 0.00 0.00 0.00 0.00EPDCL 0.00 0.00 0.00 0.00 0.00 0.00 0.00 0.00 0.00 0.00 0.00 0.00 0.00NPDCL 0.00 0.00 0.00 0.00 0.00 0.00 0.00 0.00 0.00 0.00 0.00 0.00 0.00SPDCL 0.00 0.00 0.00 0.00 0.00 0.00 0.00 0.00 0.00 0.00 0.00 0.00 0.00UI 13.76 10.00 11.24 14.16 10.11 2.70 9.03 9.55 9.23 10.75 11.63 8.16 120.31Other Short Term Sources 285.79 285.92 312.89 414.25 501.70 466.58 434.30 261.82 317.84 285.19 210.54 302.30 4079.14Bi-lateral Puchases 0.00 0.00 0.00 0.00 0.00 0.00 0.00 0.00 0.00 0.00 0.00 0.00 0.00Jhajjar 0.00 0.00 0.00 0.00 0.00 0.00 0.00 0.00 0.00 0.00 0.00 0.00 0.00Pool Purchase 0.00 0.00 0.00 0.00 0.00 0.00 0.00 0.00 0.00 0.00 0.00 0.00 0.00Pool Sales 0.00 0.00 0.00 0.00 0.00 0.00 0.00 0.00 0.00 0.00 0.00 0.00 0.00
0.00 0.00 0.00 0.00 0.00 0.00 0.00 0.00 0.00 0.00 0.00 0.00 0.00 0.000.00 0.00 0.00 0.00 0.00 0.00 0.00 0.00 0.00 0.00 0.00 0.00 0.00 0.000.00 0.00 0.00 0.00 0.00 0.00 0.00 0.00 0.00 0.00 0.00 0.00 0.00 0.00
TOTAL MARKET 299.55 295.93 324.13 428.41 511.81 469.28 443.33 271.37 327.07 295.94 222.17 310.46 4199.45
TOTAL (From All Sources) 1141.34 1198.09 1018.39 1272.48 1320.78 1267.58 1375.33 1181.09 1182.78 1145.31 1160.02 1336.99 14600.18
2016-17
April May June July August September October November December January February March Total
TSGENCOThermalVTPS I 36.15 39.84 29.41 32.74 37.43 34.48 36.30 35.13 36.30 36.30 32.79 36.30 423.17VTPS II 36.15 39.84 29.41 32.74 37.43 34.48 36.30 35.13 36.30 32.70 32.79 36.30 419.57VTPS III 36.15 39.84 29.41 32.74 37.43 34.48 37.86 27.48 37.86 0.00 34.20 37.86 385.31VTPS IV 48.54 49.86 54.20 55.22 53.30 52.94 48.03 23.24 46.48 48.03 43.38 48.03 571.24RTPP I 36.87 41.46 28.79 44.08 42.93 32.37 36.20 35.03 0.00 0.00 32.70 0.00 330.43RTPP Stage-II 36.51 40.38 42.50 34.18 43.70 30.34 36.20 35.03 36.20 36.20 32.70 36.20 440.15RTPP Stage-III 18.43 16.52 21.25 21.75 10.60 21.73 18.10 17.52 1.72 0.00 16.35 16.30 180.27KTPS A 17.02 17.22 15.64 16.90 17.42 14.42 16.14 15.08 16.49 18.94 19.65 21.75 206.66KTPS B 17.02 17.22 15.64 16.90 17.42 14.42 10.88 17.54 16.49 21.75 19.65 21.75 206.66KTPS C 17.02 17.22 15.64 16.90 17.42 14.42 21.75 21.05 16.49 16.49 19.65 21.75 215.78KTPS D 47.96 48.00 36.30 35.51 20.38 30.55 43.10 41.71 43.10 43.10 38.93 43.10 471.70KTPS Stage VI 39.36 38.99 39.31 40.35 42.76 38.62 43.81 42.39 43.81 43.81 39.57 43.81 496.59RTS B 5.46 6.04 5.86 5.48 4.86 5.79 2.03 5.52 5.71 0.00 5.16 5.71 57.61NTS 0.00 0.00 0.00 0.00 0.00 0.00 0.00 0.00 0.00 0.00 0.00 0.00 0.00Kakatiya Thermal Power Plant Stage I 34.68 39.38 33.20 39.64 34.13 41.71 43.81 42.39 43.81 43.81 39.57 43.81 479.92Kakatiya Thermal Power Plant Stage II 64.36 55.54 89.73 70.28 49.20 -0.32 97.55 94.40 97.55 97.55 88.11 97.55 901.50Damodaram Sanjeevaiah Thermal power plant - I 0.00 0.00 0.00 0.00 0.00 0.00 0.00 0.00 0.00 0.00 0.00 0.00 0.00Damodaram Sanjeevaiah Thermal power plant - II 0.00 0.00 0.00 0.00 0.00 0.00 0.00 0.00 0.00 0.00 0.00 0.00 0.00
0.000.000.000.000.000.000.000.00
TOTAL THERMAL 491.69 507.33 486.30 495.39 466.39 400.44 528.04 488.66 478.29 438.67 495.16 510.21 5786.57
MACHKUND PH TS Share 2.29 2.36 2.29 2.36 2.36 2.29 1.18 1.18 1.18 1.18 1.18 1.18 20.99TUNGBHADRA PH TS Share 0.00 0.00 0.00 0.00 0.30 0.34 0.23 0.23 0.23 0.23 0.23 0.23 2.04USL 0.00 0.00 0.00 0.00 0.00 0.00 0.00 0.00 0.00 0.00 0.00 0.00 0.00LSR 0.00 0.00 0.00 0.00 0.00 0.00 0.00 0.00 0.00 0.00 0.00 0.00 0.00
Generating Station D LinkCost (Rs.
/ kWh)Energy Dispatch (MU)
Page 172 of 195

DONKARAYI 0.00 0.00 0.00 0.00 0.00 0.00 0.00 0.00 0.00 0.00 0.00 0.00 0.00SSLM 0.00 0.00 0.00 0.00 0.00 0.00 0.00 0.00 0.00 0.00 0.00 0.00 0.00NSPH -0.11 1.92 2.63 -0.11 29.53 -0.08 16.30 8.15 4.89 4.89 2.45 2.85 73.31NSRCPH 0.00 0.00 0.00 0.00 0.00 0.00 0.00 0.00 0.00 0.00 0.00 0.00 0.00NSLCPH 0.00 0.00 0.00 0.00 0.00 0.00 1.39 1.06 0.73 0.41 0.16 0.00 3.75POCHAMPAD PH 0.00 -0.01 0.00 0.00 1.22 2.22 0.98 0.55 0.43 0.61 0.67 0.69 7.35NIZAMSAGAR PH -0.01 -0.01 -0.01 -0.01 -0.01 -0.01 0.14 0.07 0.92 0.01 0.30 0.22 1.62PABM 0.00 0.00 0.00 0.00 0.00 0.00 0.00 0.00 0.00 0.00 0.00 0.00 0.00MINI HYDRO&OTHERS 0.00 0.00 0.00 0.00 0.00 0.00 0.00 0.00 0.00 0.00 0.00 0.00 0.00SINGUR -0.01 -0.01 -0.01 -0.01 -0.01 0.19 0.44 0.16 0.16 0.16 0.16 0.16 1.41SSLM LCPH -0.20 -0.16 -0.16 2.52 36.30 41.67 13.99 3.50 3.63 3.79 5.16 5.47 115.51Nagarjunasagar Tail Pond Dam Power House 0.00 0.00 0.00 0.00 0.00 0.00 0.00 0.00 0.00 0.00 0.00 0.00 0.00Priyadarshini Jurala Hydro Electric Project- TS Share -0.02 -0.03 -0.04 2.65 15.92 0.01 2.45 0.82 0.24 0.00 0.00 0.00 22.00Lower Jurala Hydro Electric Project 0.00 0.00 0.00 3.11 13.71 14.64 6.11 2.04 1.22 0.41 0.16 0.16 41.57POCHAMPAD PH Stage 2 0.00 0.00 0.00 0.00 0.73 0.29 0.33 0.18 0.14 0.20 0.22 0.23 2.33Pulichintala New project 0.00 0.00 0.00 0.00 0.00 0.00 1.82 0.64 1.32 1.46 1.98 1.12 8.34Mini hydel & others 0.00 0.00 0.00 0.00 0.00 0.03 0.08 0.06 0.05 0.06 0.09 0.08 0.45Ramagiri wind mills 0.00 0.00 0.00 0.00 0.00 0.00 0.00 0.00 0.00 0.00 0.00 0.00 0.00
0.000.000.000.000.00
TOTAL HYDRO 1.94 4.08 4.70 10.50 100.06 61.59 45.43 18.64 15.14 13.41 12.76 12.41 300.66TOTAL TSGENCO 493.63 511.41 490.99 505.90 566.45 462.02 573.47 507.30 493.43 452.09 507.92 522.62 6087.23
Central Generating Stations NTPCNTPC (SR) NTPC (SR) 65.70 62.49 51.27 52.06 52.03 55.86 67.29 60.92 65.79 68.80 62.48 69.15 733.83 NTPC (SR) Stage III 16.67 14.79 15.23 15.93 14.90 14.78 0.26 16.59 17.06 17.22 15.74 17.43 176.61 Total NTPC(SR) 82.37 77.28 66.50 67.99 66.93 70.63 67.56 77.51 82.85 86.02 78.22 86.58 910.45
NTPC (ER) Farakka 0.00 0.00 0.00 0.00 0.00 0.00 0.00 0.00 0.00 0.00 0.00 0.00 0.00 Kahalgaon 0.00 0.00 0.00 0.00 0.00 0.00 0.00 0.00 0.00 0.00 0.00 0.00 0.00 Talcher - Stage 1 0.00 0.00 0.00 0.00 0.00 0.00 0.00 0.00 0.00 0.00 0.00 0.00 0.00 Talcher Stage 2 40.28 39.51 37.29 42.25 35.20 28.58 36.21 41.66 43.06 43.06 38.87 43.06 469.02 Others 0.00 0.00 0.00 0.00 0.00 0.00 0.00 0.00 0.00 0.00 0.00 0.00 0.00 Total NTPC(ER) 40.28 39.51 37.29 42.25 35.20 28.58 36.21 41.66 43.06 43.06 38.87 43.06 469.02
Total NTPC 122.64 116.79 103.79 110.24 102.13 99.21 103.76 119.17 125.91 129.08 117.09 129.64 1379.47
NLC TS-II Stage-I 5.75 7.57 7.66 6.55 10.23 8.95 5.61 3.74 5.42 0.00 8.00 8.80 78.28 Stage-II 12.39 13.70 10.58 11.71 15.62 16.11 12.97 15.34 15.78 16.71 15.12 16.63 172.65 Total NLC 18.14 21.27 18.24 18.26 25.85 25.07 18.58 19.08 21.20 16.71 23.12 25.44 250.93
NPC NPC-MAPS 2.70 3.57 3.44 3.70 3.74 2.25 3.50 2.31 2.73 3.50 3.26 3.50 38.20 NPC-Kaiga unit I 9.48 10.28 11.01 14.35 14.27 13.63 10.78 10.78 10.78 10.78 10.78 10.78 137.71 NPC-Kaiga unit II 15.24 6.56 7.30 7.67 7.64 7.35 13.48 13.48 13.48 13.48 13.48 13.48 132.60 Total NPC 27.41 20.42 21.75 25.72 25.65 23.22 27.76 26.57 26.99 27.76 27.52 27.76 308.51
NTPC - SimhadriNTPC Simhadri Stage I 105.88 96.45 87.92 97.52 96.50 87.31 96.81 93.63 96.81 96.81 87.44 96.81 1139.88NTPC Simhadri Stage II 39.25 36.62 35.48 35.39 37.59 33.64 44.70 37.92 30.41 44.70 40.40 44.70 460.78
Total NTPC- Simhadri 145.13 133.07 123.40 132.91 134.09 120.95 141.50 131.55 127.21 141.50 127.84 141.50 1600.66
CGS - New Vallur Thermal Power Plant 14.73 14.06 11.28 12.70 18.54 17.60 14.44 19.34 19.99 19.99 18.06 19.99 200.74
Page 173 of 195

Tuticorin 15.06 19.24 12.29 20.74 20.94 24.04 26.30 25.46 26.30 26.39 23.87 26.34 266.97Kudigi 0.00 0.00 0.00 0.00 0.00 0.00 0.00 0.00 0.00 4.71 4.26 4.71 13.69NVVNL Bundled Power -SOLAR 1.63 1.54 1.00 0.88 0.75 0.63 1.63 1.54 1.00 0.88 0.75 0.75 13.01NVVNL Bundled Power -COAL 9.02 8.56 7.21 7.55 7.55 7.34 8.41 8.41 8.41 8.41 8.41 8.41 97.68
TOTAL CGS 353.75 334.94 298.96 329.01 335.51 318.06 342.38 351.12 357.02 375.44 350.92 384.56 4131.67
APGPCLAPGPCL I - Allocated capacity 0.30 0.24 0.46 0.27 0.16 0.14 0.24 0.48 0.50 0.50 0.45 0.50 4.26APGPCL I - Unutilised capacity 0.00 0.00 0.00 0.00 0.00 0.00 0.00 0.00 0.00 0.00 0.00 0.00 0.00APGPCL II - Allocated capacity 1.18 0.96 1.81 1.05 0.59 0.48 0.87 1.73 1.79 1.77 1.62 1.79 15.63APGPCL II - Unutilised capacity 0.00 0.00 0.00 0.00 0.00 0.00 0.00 0.00 0.00 0.00 0.00 0.00 0.00Total APGPCL 1.47 1.20 2.27 1.32 0.75 0.63 1.10 2.22 2.29 2.27 2.07 2.29 19.88
IPPSGVK 0.00 0.00 0.00 0.00 0.00 0.00 0.00 0.00 0.00 0.00 0.00 0.00 0.00Spectrum 0.00 0.00 0.00 0.00 0.00 0.00 0.00 0.00 0.00 0.00 0.00 0.00 0.00Kondapalli (Naphtha) 0.00 0.00 0.00 0.00 0.00 0.00 0.00 0.00 0.00 0.00 0.00 0.00 0.00Kondapalli (Gas) 0.00 0.00 0.00 0.00 0.00 0.00 0.00 0.00 0.00 0.00 0.00 0.00 0.00BSES 0.00 0.00 0.00 0.00 0.00 0.00 0.00 0.00 0.00 0.00 0.00 0.00 0.00GVK Extension 0.00 0.00 0.00 0.00 0.00 11.63 0.00 0.00 0.00 0.00 0.00 0.00 11.63Vemagiri 0.00 0.00 0.00 0.00 0.00 0.00 0.00 0.00 0.00 0.00 0.00 0.00 0.00Gautami 0.00 0.00 0.00 0.00 0.00 0.00 0.00 0.00 0.00 0.00 0.00 0.00 0.00Konaseema 0.00 0.00 0.00 0.00 0.00 0.00 0.00 0.00 0.00 0.00 0.00 0.00 0.00Pioneer Gas Power Limited 0.00 0.00 0.00 0.00 0.00 0.00 48.41 48.41 0.00 0.00 7.56 0.00 104.39
0.000.000.000.00
TOTAL IPPS 0.00 0.00 0.00 0.00 0.00 11.63 48.41 48.41 0.00 0.00 7.56 0.00 116.02
NCENCE - Bio-Mass 7.34 8.68 8.27 9.68 6.67 7.73 7.61 9.05 7.34 8.68 7.61 9.05 97.70NCE - Bagasse 0.01 0.00 0.00 0.00 0.00 0.00 0.00 0.00 0.01 0.00 0.00 0.00 0.01NCE - Municipal Waste to Energy 0.00 0.00 0.00 0.00 0.00 0.00 0.00 0.00 0.00 0.00 0.00 0.00 0.00NCE - Industrial Waste based power project 0.00 0.00 0.00 0.00 0.00 0.00 0.00 0.00 0.00 0.00 0.00 0.00 0.00NCE - Wind Power 0.00 0.00 0.00 0.00 0.00 0.00 0.00 0.00 0.00 0.00 0.00 0.00 0.00NCE - Mini Hydel 0.00 0.00 0.00 0.00 0.00 0.00 0.00 0.00 0.00 0.00 0.00 0.00 0.00NCE - NCL Energy Ltd 0.00 0.00 0.00 0.00 0.00 0.00 0.00 0.00 0.00 0.00 0.00 0.00 0.00NCE-Others 2.86 5.27 5.08 4.52 6.77 5.81 6.69 6.69 6.69 9.46 10.49 15.94 86.25TOTAL NCE 10.21 13.95 13.35 14.19 13.44 13.53 14.29 15.73 14.03 18.14 18.10 24.98 183.96
OTHERSSrivathsa 0.00 0.00 0.00 0.00 0.00 0.00 0.00 0.00 0.00 0.00 0.00 0.00 0.00LVS 0.00 0.00 0.00 0.00 0.00 0.00 0.00 0.00 0.00 0.00 0.00 0.00 0.00Vishakapatnam Steel Plant 0.00 0.00 0.00 0.00 0.00 0.00 0.00 0.00 0.00 0.00 0.00 0.00 0.00NB Ferro Alloys 0.00 0.00 0.00 0.00 0.00 0.00 0.00 0.00 0.00 0.00 0.00 0.00 0.00KSK Mahanadi (MT) 0.00 0.00 0.00 0.00 0.00 0.00 0.00 0.00 0.00 0.00 0.00 0.00 0.00Singareni-1 0.33 0.00 16.35 19.54 25.73 63.67 82.83 94.14 97.28 97.28 87.87 97.28 682.28Thermal Power Unit 1 30.65 39.47 48.39 51.21 54.83 39.75 47.36 45.83 47.36 47.36 42.78 47.36 542.34
0.000.00
Thermal Power Unit 2 61.54 84.69 105.96 110.85 123.40 93.73 100.18 96.95 100.18 100.18 90.49 100.18 1168.36Singareni-2 0.00 0.00 0.00 0.00 0.00 0.00 0.00 0.00 97.28 97.28 87.87 97.28 379.71TOTAL OTHERS 92.52 124.16 170.70 181.60 203.97 197.15 230.37 236.93 342.10 342.10 309.00 342.10 2772.70
MARKETPTC 0.00RCL and Short-Term Sources(IG Wells,Kesoram) 0.00CPDCL 0.00
Page 174 of 195

EPDCL 0.00NPDCL 0.00SPDCL 0.00UI 0.00Other Short Term Sources 318.20 133.65 88.69 119.52 231.78 167.44 151.85 32.98 0.00 0.00 0.00 0.00 1244.10NTPC - Aravali Power Co. Pvt Ltd 10.24 11.76 0.00 0.00 0.00 0.00 0.00 0.00 0.00 0.00 0.00 0.00 22.00D-D Sales/Bilateral Purchases -136.02 -198.51 -131.77 24.20 155.77 34.51 208.62 16.50 24.16 43.65 76.42 5.11 122.64Interstate Sale 0.00
0.000.00
0.000.00
TOTAL MARKET 192.42 -53.11 -43.08 143.72 387.55 201.95 360.46 49.48 24.16 43.65 76.42 5.11 1388.74
TOTAL (From All Sources) 1144.00 932.55 933.20 1175.73 1507.67 1204.98 1570.50 1211.19 1233.04 1233.69 1271.99 1281.66 14700.20
2017-18
April May June July August September October November December January February March Total
TSGENCOThermalVTPS I 38.23 0.00 0.00 0.00 39.50 0.00 39.50 5.93 0.00 0.00 3.88 0.00 127.05VTPS II 18.34 0.00 0.00 0.00 28.62 0.00 28.62 0.00 0.00 0.00 0.00 0.00 75.57VTPS III 0.00 0.00 0.00 0.00 37.75 0.00 37.75 0.00 0.00 0.00 0.00 0.00 75.51VTPS IV 44.22 0.00 0.00 0.00 45.69 35.36 45.69 22.11 12.43 0.00 41.27 45.69 292.45RTPP I 0.00 0.00 0.00 0.00 37.65 0.00 0.00 0.00 0.00 0.00 0.00 0.00 37.65RTPP Stage-II 38.07 0.00 0.00 0.00 39.34 0.00 20.30 38.07 0.00 0.00 35.53 23.68 194.98RTPP Stage-III 0.00 0.00 0.00 0.00 9.72 0.00 16.23 0.00 0.00 0.00 0.00 0.00 25.95KTPS A 20.66 21.35 20.66 21.35 21.35 20.66 18.77 18.08 18.77 18.77 19.28 21.35 241.03KTPS B 21.58 22.30 21.58 22.30 22.30 10.79 11.51 21.58 22.30 22.30 20.15 22.30 241.03KTPS C 20.66 21.35 20.66 21.35 16.18 20.66 21.35 20.66 16.18 21.35 19.28 21.35 241.03KTPS D 42.46 43.88 31.85 43.88 43.88 42.46 43.88 42.46 43.88 43.88 39.63 43.88 506.04KTPS Stage VI 44.09 45.56 26.45 41.15 45.56 44.09 45.56 44.09 45.56 45.56 41.15 45.56 514.38RTS B 0.00 0.00 0.00 0.00 5.60 0.00 5.60 0.00 0.00 0.00 0.00 0.00 11.21NTS 0.00 0.00 0.00 0.00 0.00 0.00 0.00 0.00 0.00 0.00 0.00 0.00 0.00Kakatiya Thermal Power Plant Stage I 44.73 46.22 44.73 16.40 46.22 44.73 46.22 44.73 46.22 46.22 41.75 46.22 514.38Kakatiya Thermal Power Plant Stage II 99.60 102.92 99.60 102.92 36.52 99.60 102.92 99.60 102.92 102.92 92.96 102.92 1145.40
Damodaram Sanjeevaiah Thermal power plant 0.000.000.000.000.000.000.000.000.000.00
TOTAL THERMAL 432.63 303.58 265.53 269.35 475.88 318.35 483.91 357.31 308.26 301.00 354.88 372.95 4243.63
MACHKUND PH AP Share 1.48 1.52 1.23 1.43 1.61 1.59 1.62 1.41 1.40 1.55 1.46 1.48 17.77TUNGBHADRA PH AP Share 0.15 0.03 0.00 0.35 1.24 1.25 1.14 1.02 0.81 0.79 0.56 0.53 7.87USL 0.00 0.00 0.00 0.00 0.00 0.00 0.00 0.00 0.00 0.00 0.00 0.00 0.00LSR 0.00 0.00 0.00 0.00 0.00 0.00 0.00 0.00 0.00 0.00 0.00 0.00 0.00DONKARAYI 0.00 0.00 0.00 0.00 0.00 0.00 0.00 0.00 0.00 0.00 0.00 0.00 0.00SSLM 0.00 0.00 0.00 0.00 0.00 0.00 0.00 0.00 0.00 0.00 0.00 0.00 0.00NSPH 5.77 2.25 3.10 12.79 25.13 30.03 23.80 11.86 7.27 7.65 6.91 8.73 145.31NSRCPH 0.00 0.00 0.00 0.00 0.00 0.00 0.00 0.00 0.00 0.00 0.00 0.00 0.00NSLCPH 0.04 0.00 0.00 0.05 0.66 1.37 1.62 1.29 0.86 0.51 0.19 0.08 6.68POCHAMPAD PH 0.00 0.00 0.31 0.39 0.63 0.55 0.94 0.71 0.55 0.63 0.47 0.31 5.49NIZAMSAGAR PH 0.05 0.00 0.00 0.02 0.19 0.57 0.33 0.00 0.26 0.31 0.31 0.47 2.53
Generating Station D LinkCost (Rs.
/ kWh)Energy Dispatch (MU)
Page 175 of 195

PABM 0.00 0.00 0.00 0.00 0.00 0.00 0.00 0.00 0.00 0.00 0.00 0.00 0.00MINI HYDRO&OTHERS 0.00 0.00 0.00 0.00 0.00 0.00 0.00 0.00 0.00 0.00 0.00 0.00 0.00SINGUR 0.10 0.10 0.10 0.10 0.10 0.42 0.42 0.31 0.31 0.21 0.21 0.21 2.61SSLM LCPH 4.72 1.68 1.19 6.66 30.57 34.72 19.76 8.63 6.42 6.80 8.29 9.67 139.12Nagarjunasagar Tail Pond Dam Power House 0.00 0.00 0.00 0.00 0.00 0.00 0.00 0.00 0.00 0.00 0.00 0.00 0.00Priyadarshini Jurala Hydro Electric Project- AP Share 0.00 0.00 0.04 1.67 6.97 6.55 2.10 0.67 0.38 0.24 0.17 0.11 18.90Lower Jurala Hydro Electric Project 0.00 0.00 0.00 1.18 2.71 2.67 1.56 1.11 1.11 1.10 1.09 1.10 13.64POCHAMPAD PH Stage 2 0.00 0.00 0.10 0.13 0.21 0.18 0.31 0.24 0.18 0.21 0.16 0.10 1.83Pulichintala New project 0.04 0.07 4.51 4.66 4.66 4.51 7.00 2.46 5.07 3.75 5.07 2.88 44.68Mini hydel & others 0.00 0.00 0.21 0.42 0.63 0.67 0.71 0.69 0.63 0.70 0.71 0.50 5.86Ramagiri wind mills 0.00 0.00 0.00 0.00 0.00 0.00 0.00 0.00 0.00 0.00 0.00 0.00 0.00
0.000.000.000.000.00
TOTAL HYDRO 12.37 5.65 10.81 29.85 75.32 85.09 61.31 30.41 25.26 24.46 25.60 26.17 412.28TOTAL TSGENCO 445.00 309.23 276.34 299.20 551.20 403.44 545.22 387.72 333.51 325.46 380.48 399.12 4655.92
Central Generating Stations NTPCNTPC (SR) NTPC (SR) 62.70 64.11 55.86 53.81 53.49 59.36 64.72 63.52 65.30 65.74 59.50 66.08 734.20 NTPC (SR) Stage III 15.26 15.60 15.08 15.41 15.58 15.08 15.67 15.43 15.95 15.95 14.41 15.96 185.38 Total NTPC(SR) 77.96 79.71 70.94 69.22 69.07 74.45 80.39 78.95 81.25 81.69 73.92 82.04 919.59
NTPC (ER) Farakka 0.00 0.00 0.00 0.00 0.00 0.00 0.00 0.00 0.00 0.00 0.00 0.00 0.00 Kahalgaon 0.00 0.00 0.00 0.00 0.00 0.00 0.00 0.00 0.00 0.00 0.00 0.00 0.00 Talcher - Stage 1 0.00 0.00 0.00 0.00 0.00 0.00 0.00 0.00 0.00 0.00 0.00 0.00 0.00 Talcher Stage 2 40.41 41.75 40.41 33.96 37.14 40.41 37.90 31.93 41.80 41.80 37.76 41.80 467.07 Others 0.00 0.00 0.00 0.00 0.00 0.00 0.00 0.00 0.00 0.00 0.00 0.00 0.00 Total NTPC(ER) 40.41 41.75 40.41 33.96 37.14 40.41 37.90 31.93 41.80 41.80 37.76 41.80 467.07
Total NTPC 118.37 121.46 111.35 103.18 106.21 114.85 118.29 110.89 123.05 123.49 111.67 123.84 1386.66
NLC TS-II Stage-I 0.00 0.00 0.00 0.00 7.07 0.00 8.00 0.00 0.00 0.00 0.00 0.00 15.07 Stage-II 0.00 0.00 0.00 0.00 5.52 0.00 0.00 0.00 0.00 0.00 0.00 0.00 5.52 Total NLC 0.00 0.00 0.00 0.00 12.59 0.00 8.00 0.00 0.00 0.00 0.00 0.00 20.59
NPC NPC-MAPS 3.35 3.47 3.23 3.38 3.48 3.27 3.48 3.24 3.45 3.48 3.18 3.50 40.54 NPC-Kaiga unit I 11.31 11.31 11.31 11.31 11.31 11.31 11.31 11.31 11.31 11.31 11.31 11.31 135.75 NPC-Kaiga unit II 11.31 11.31 11.31 11.31 11.31 11.31 11.31 11.31 11.31 11.31 11.31 11.31 135.75 Total NPC 25.97 26.09 25.85 26.00 26.11 25.90 26.11 25.87 26.08 26.11 25.81 26.12 312.03
NTPC - SimhadriNTPC Simhadri Stage I 95.51 98.63 37.80 98.63 98.63 95.51 88.40 63.81 98.63 98.63 89.11 98.63 1061.94NTPC Simhadri Stage II 43.80 13.76 0.00 18.70 26.72 43.80 45.24 43.80 45.24 16.07 40.87 45.24 383.24
Total NTPC- Simhadri 139.31 112.39 37.80 117.34 125.36 139.31 133.64 107.62 143.87 114.70 129.98 143.87 1445.17
CGS - NewVallur Thermal Power Plant 19.47 20.03 19.13 17.68 14.08 19.21 17.38 18.87 19.49 19.58 17.69 19.58 222.20 Tuticorin 26.86 27.82 26.86 27.72 27.72 26.81 27.17 19.65 20.55 27.82 25.06 27.82 311.85NVVNL Bundled Power -SOLAR 1.60 1.51 0.99 0.87 0.74 0.74 1.60 1.51 0.99 0.87 0.74 0.74 12.89NVVNL Bundled Power -COAL 8.26 8.26 8.26 8.26 8.26 8.26 8.26 8.26 8.26 8.26 8.26 8.26 99.07Kudigi 12.93 13.36 12.93 13.36 26.73 25.87 26.73 25.87 26.73 40.07 36.21 41.50 302.30
TOTAL CGS 352.78 330.93 243.17 314.40 347.80 360.95 367.16 318.52 369.01 360.90 355.42 391.73 4112.76
APGPCLAPGPCL I - Allocated capacity 0.48 0.50 0.48 0.50 0.50 0.48 0.49 0.48 0.50 0.50 0.45 0.50 5.89APGPCL I - Unutilised capacity 0.00 0.00 0.00 0.00 0.00 0.00 0.00 0.00 0.00 0.00 0.00 0.00 0.00APGPCL II - Allocated capacity 1.73 1.79 1.73 1.79 1.79 1.73 1.77 1.73 1.79 1.79 1.62 1.79 21.06APGPCL II - Unutilised capacity 0.00 0.00 0.00 0.00 0.00 0.00 0.00 0.00 0.00 0.00 0.00 0.00 0.00
Page 176 of 195

Total APGPCL 2.22 2.29 2.22 2.29 2.29 2.22 2.26 2.22 2.29 2.29 2.07 2.29 26.95
IPPSGVK 0.00 0.00 0.00 0.00 0.00 0.00 0.00 0.00 0.00 0.00 0.00 0.00 0.00Spectrum 0.00 0.00 0.00 0.00 0.00 0.00 0.00 0.00 0.00 0.00 0.00 0.00 0.00Kondapalli (Naphtha) 0.00 0.00 0.00 0.00 0.00 0.00 0.00 0.00 0.00 0.00 0.00 0.00 0.00Kondapalli (Gas) 0.00 0.00 0.00 0.00 0.00 0.00 0.00 0.00 0.00 0.00 0.00 0.00 0.00BSES 0.00 0.00 0.00 0.00 0.00 0.00 0.00 0.00 0.00 0.00 0.00 0.00 0.00GVK Extension 0.00 0.00 0.00 0.00 0.00 0.00 0.00 0.00 0.00 0.00 0.00 0.00 0.00Vemagiri 0.00 0.00 0.00 0.00 0.00 0.00 0.00 0.00 0.00 0.00 0.00 0.00 0.00Gautami 0.00 0.00 0.00 0.00 0.00 0.00 0.00 0.00 0.00 0.00 0.00 0.00 0.00Konaseema 0.00 0.00 0.00 0.00 0.00 0.00 0.00 0.00 0.00 0.00 0.00 0.00 0.00
0.000.000.000.000.00
TOTAL IPPS 0.00 0.00 0.00 0.00 0.00 0.00 0.00 0.00 0.00 0.00 0.00 0.00 0.00
NCENCE - Bio-Mass 7.13 8.43 7.39 8.79 7.13 8.43 7.39 8.79 7.13 8.43 7.39 8.79 95.22NCE - Bagasse 0.52 0.00 0.00 0.00 0.52 0.00 0.00 0.00 0.52 0.00 0.00 0.00 1.57NCE - Municipal Waste to Energy 5.12 5.12 5.12 5.12 5.12 5.12 5.12 5.12 5.12 5.12 5.12 5.12 61.50NCE - Industrial Waste based power project 0.00 0.00 0.00 0.00 0.00 0.00 0.00 0.00 0.00 0.00 0.00 0.00 0.00NCE - Wind Power 0.00 0.00 0.00 0.00 0.00 0.00 0.00 0.00 0.00 0.00 0.00 0.00 0.00NCE - Mini Hydel 0.00 0.00 0.00 0.00 0.00 0.00 0.00 0.00 0.00 0.00 0.00 0.00 0.00NCE - NCL Energy Ltd 0.00 0.00 0.00 0.00 0.00 0.00 0.00 0.00 0.00 0.00 0.00 0.00 0.00NCE-Others 55.02 83.77 124.62 124.62 124.62 124.62 124.62 124.62 124.62 124.62 124.62 124.62 1385.01TOTAL NCE 67.80 97.33 137.14 138.53 137.40 138.18 137.14 138.53 137.40 138.18 137.14 138.53 1543.29
OTHERSSrivathsa 0.00 0.00 0.00 0.00 0.00 0.00 0.00 0.00 0.00 0.00 0.00 0.00 0.00LVS 0.00 0.00 0.00 0.00 0.00 0.00 0.00 0.00 0.00 0.00 0.00 0.00 0.00Vishakapatnam Steel Plant 0.00 0.00 0.00 0.00 0.00 0.00 0.00 0.00 0.00 0.00 0.00 0.00 0.00NB Ferro Alloys 0.00 0.00 0.00 0.00 0.00 0.00 0.00 0.00 0.00 0.00 0.00 0.00 0.00Corporate Power (MT) 0.00 0.00 0.00 0.00 0.00 0.00 0.00 0.00 0.00 0.00 0.00 0.00 0.00Singareni Unit I 94.14 97.28 94.14 97.28 97.28 94.14 97.28 94.14 97.28 97.28 87.87 97.28 1145.40Thermal Power Unit 1 45.41 46.92 45.41 46.92 46.92 45.41 46.92 45.41 46.92 46.92 42.38 46.92 552.44CSPGCL 156.47 161.69 156.47 161.69 161.69 156.47 161.69 156.47 161.69 161.69 151.26 161.69 1908.99Thermal Power Unit 2 96.05 99.25 96.05 99.25 99.25 96.05 99.25 96.05 99.25 99.25 89.65 99.25 1168.63Manuguru Thermal Power Plant 0.00 0.00 0.00 0.00 0.00 0.00 0.00 0.00 0.00 0.00 0.00 0.00 0.00Singareni Unit II 94.14 97.28 94.14 97.28 97.28 94.14 97.28 94.14 97.28 97.28 87.87 97.28 1145.40
TOTAL OTHERS 486.22 502.42 486.22 502.42 502.42 486.22 502.42 486.22 502.42 502.42 459.02 502.42 5920.86
MARKETPTC 0.00RCL and Short-Term Sources(IG Wells,Kesoram) 0.00CPDCL 0.00EPDCL 0.00NPDCL 0.00SPDCL 0.00UI 0.00Other Short Term Sources 0.00 0.00 0.00 0.00 0.00 0.00 0.00 0.00 0.00 0.00 0.00 0.00 0.00NTPC - Aravali Power Co. Pvt Ltd 0.00 0.00 0.00 0.00 0.00 0.00 0.00 0.00 0.00 0.00 0.00 0.00 0.00D-D Sales/Bilateral Purchases -149.38 -224.57 -152.45 -19.06 188.12 116.31 303.54 -7.88 -3.92 10.88 44.44 -42.70 63.33
0.00Bi-lateral Purchases( PTC etc.) 0.00Pool Transaction ( Purchases) 0.00Pool Transaction ( Sales) 0.00
0.000.00
TOTAL MARKET -149.38 -224.57 -152.45 -19.06 188.12 116.31 303.54 -7.88 -3.92 10.88 44.44 -42.70 63.33
TOTAL (From All Sources) 1204.63 1017.63 992.63 1237.79 1729.23 1507.31 1857.75 1325.34 1340.72 1340.12 1378.56 1391.40 16323.11Page 177 of 195

Index sheet
Form 5 Revenue from Current Tariffs
Gross Revenue Incentives Net
Revenue Surcharge Additional surcharge
LT Category 1551.82 0.00 1551.82 0.00 0.00 0.00 1551.82Category I (A&B) - Domestic Form-7 689.21 0.00 689.21 689.21Category II (A,B,C & D) - Non-domestic/Commercial Form-5a 428.16 0.00 428.16 428.16Category III (A & B) - Industrial 227.09 0.00 227.09 227.09Category IV (A,B &C) - Cottage Industries & Dhobighats 2.79 0.00 2.79 2.79Category V (A,B & C) - Irrigation and Agriculture 35.87 0.00 35.87 35.87Category VI (A & B) - Local Bodies, St. Lighting & PWS 142.42 0.00 142.42 142.42Category VII (A & B) - General Purpose 24.67 0.00 24.67 24.67Category VIII (A & B) -Temporary Supply 1.62 0.00 1.62 1.62
0.00 0.00 0.00 0.00
0.00 0.00 0.000.00 0.00 0.000.00 0.00 0.000.00 0.00 0.000.00 0.00 0.000.00 0.00 0.000.00 0.00 0.000.00 0.00 0.000.00 0.00 0.00
HT Category at 11 KV 469.58 0.00 469.58 0.00 0.00 0.00 469.58HT-I Industry Segregated 331.90 0.00 331.90 331.90HT-I (B) Ferro-Alloys 0.00 0.00 0.00 0.00HT-II - Others 77.06 0.00 77.06 77.06HT-III Airports, Railways and Bustations 5.43 0.00 5.43 5.43HT-IVA Lift Irrigation & Agriculture 13.80 0.00 13.80 13.80HT - IV (B) Composite P.W.S Schemes 4.18 0.00 4.18 4.18
HT-VI Townships and Residential Colonies 9.87 0.00 9.87 9.87HT-VII - Green Power 0.00 0.00 0.00 0.00HT - Temporary Supply 0.00 0.00 0.00 0.00 RESCOs 27.33 0.00 27.33 27.33 0.00 0.00 0.00
0.00 0.00 0.000.00 0.00 0.00
0.00 0.00 0.00 0.00 0.00 0.00 0.00 0.00 0.00 0.00 0.00 0.00
HT Category at 33 KV 172.30 0.00 172.30 0.00 0.00 0.00 172.30HT-I Industry Segregated 111.10 0.00 111.10 111.10HT-I (B) Ferro-Alloys 18.57 0.00 18.57 18.57HT-II - Others 8.97 0.00 8.97 8.97HT-III Airports, Railways and Bustations 0.00 0.00 0.00 0.00HT-IVA Lift Irrigation & Agriculture 9.55 0.00 9.55 9.55HT - IV (B) Composite P.W.S Schemes 0.00 0.00 0.00 0.00
HT-VI Townships and Residential Colonies 22.13 0.00 22.13 22.13HT-VII - Green Power 0.00 0.00 0.00 0.00HT - Temporary Supply 0.00 0.00 0.00 0.00 RESCOs 1.98 0.00 1.98 1.98
0.00 0.00 0.000.00 0.00 0.00
0.00 0.00 0.00 0.00 0.00 0.00 0.00 0.00 0.00 0.00 0.00 0.00
HT Category at 132 KV 787.35 0.00 787.35 0.00 0.00 0.00 787.35HT-I Industry Segregated 358.28 0.00 358.28 358.28
HT-I (B) Ferro-Alloys 0.00 0.00 0.00 0.00HT-II - Others 9.41 0.00 9.41 9.41HT-III Airports, Railways and Bustations 0.00 0.00 0.00 0.00HT-IVA Lift Irrigation & Agriculture 84.43 0.00 84.43 84.43HT - IV (C) Composite P.W.S Schemes 0.00 0.00 0.00 0.00HT-V (A) Railway Traction 278.72 0.00 278.72 278.72HT-V (B) HMRHT-VI Townships and Residential Colonies 56.51 0.00 56.51 56.51HT-VII - Green Power 0.00 0.00 0.00 0.00HT - Temporary Supply 0.00 0.00 0.00 0.00HT- RESCOs 0.00 0.00 0.00 0.00 0.00 0.00 0.00 0.00
0.00 0.00 0.00
0.00 0.00 0.00 0.00 0.00 0.00 0.00 0.00 0.00 0.00 0.00 0.00 0.00 0.00 0.00
Total 2981.05 0.00 2981.05 0.00 0.00 0.00 2981.05
Total Revenue
Grid Support Charges
Revenue from Current Tariffs (Rs. Crs.) Retail Supply (Regulated Business)Detail Links
Surcharges (Open Access)
Base Year
Page 178 of 195

Form 5
LT CategoryCategory I (A&B) - DomesticCategory II (A,B,C & D) - Non-domestic/CommercialCategory III (A & B) - IndustrialCategory IV (A,B &C) - Cottage Industries & DhobighatsCategory V (A,B & C) - Irrigation and AgricultureCategory VI (A & B) - Local Bodies, St. Lighting & PWSCategory VII (A & B) - General PurposeCategory VIII (A & B) -Temporary Supply
HT Category at 11 KVHT-I Industry SegregatedHT-I (B) Ferro-AlloysHT-II - OthersHT-III Airports, Railways and BustationsHT-IVA Lift Irrigation & AgricultureHT - IV (B) Composite P.W.S Schemes
HT-VI Townships and Residential ColoniesHT-VII - Green PowerHT - Temporary Supply RESCOs
HT Category at 33 KVHT-I Industry SegregatedHT-I (B) Ferro-AlloysHT-II - OthersHT-III Airports, Railways and BustationsHT-IVA Lift Irrigation & AgricultureHT - IV (B) Composite P.W.S Schemes
HT-VI Townships and Residential ColoniesHT-VII - Green PowerHT - Temporary Supply RESCOs
HT Category at 132 KVHT-I Industry Segregated
HT-I (B) Ferro-AlloysHT-II - OthersHT-III Airports, Railways and BustationsHT-IVA Lift Irrigation & AgricultureHT - IV (C) Composite P.W.S SchemesHT-V (A) Railway TractionHT-V (B) HMRHT-VI Townships and Residential ColoniesHT-VII - Green PowerHT - Temporary SupplyHT- RESCOs
Total
Revenue from Current Tariffs (Rs. Crs.)
Gross Revenue Incentives Net
Revenue Surcharge Additional surcharge
1617.95 0.00 1617.95 0.00 0.00 0.00 1617.95742.89 0.00 742.89 742.89448.01 0.00 448.01 448.01217.93 0.00 217.93 217.93
2.65 0.00 2.65 2.6538.67 0.00 38.67 38.67
144.32 0.00 144.32 144.3223.48 0.00 23.48 23.48
0.00 0.00 0.00 0.000.00 0.00 0.00 0.00
0.00 0.00 0.000.00 0.00 0.000.00 0.00 0.000.00 0.00 0.000.00 0.00 0.000.00 0.00 0.000.00 0.00 0.000.00 0.00 0.000.00 0.00 0.00
577.02 0.00 577.02 0.00 0.00 0.00 577.02411.89 0.00 411.89 411.89
0.00 0.00 0.00 0.0077.51 0.00 77.51 77.51
6.39 0.00 6.39 6.3914.67 0.00 14.67 14.67
6.95 0.00 6.95 6.959.23 0.00 9.23 9.230.00 0.00 0.00 0.000.00 0.00 0.00 0.00
50.38 0.00 50.38 50.380.00 0.00 0.00 0.00
0.00 0.00 0.000.00 0.00 0.000.00 0.00 0.000.00 0.00 0.000.00 0.00 0.000.00 0.00 0.00
190.20 0.00 190.20 0.00 0.00 0.00 190.20120.55 0.00 120.55 120.55
21.66 0.00 21.66 21.6610.15 0.00 10.15 10.15
0.00 0.00 0.00 0.0011.03 0.00 11.03 11.03
0.00 0.00 0.00 0.0022.21 0.00 22.21 22.21
0.00 0.00 0.00 0.000.00 0.00 0.00 0.004.60 0.00 4.60 4.60
0.00 0.00 0.000.00 0.00 0.000.00 0.00 0.000.00 0.00 0.000.00 0.00 0.000.00 0.00 0.00
793.50 0.00 793.50 0.00 0.00 0.00 793.50333.78 0.00 333.78 333.78
0.00 0.00 0.00 0.0010.94 0.00 10.94 10.94
0.00 0.00 0.00 0.00112.48 0.00 112.48 112.48
0.00 0.00 0.00 0.00284.93 0.00 284.93 284.93
51.37 0.00 51.37 51.370.00 0.00 0.00 0.000.00 0.00 0.00 0.000.00 0.00 0.00 0.000.00 0.00 0.00 0.00
0.00 0.00 0.00
0.00 0.00 0.000.00 0.00 0.000.00 0.00 0.000.00 0.00 0.000.00 0.00 0.00
3178.67 0.00 3178.67 0.00 0.00 0.00 3178.67
Surcharges (Open Access) Grid Support Charges
2014-15
Retail Supply (Regulated Business)Total
Revenue
Page 179 of 195

Form 5
LT CategoryCategory I (A&B) - DomesticCategory II (A,B,C & D) - Non-domestic/CommercialCategory III (A & B) - IndustrialCategory IV (A,B &C) - Cottage Industries & DhobighatsCategory V (A,B & C) - Irrigation and AgricultureCategory VI (A & B) - Local Bodies, St. Lighting & PWSCategory VII (A & B) - General PurposeCategory VIII (A & B) -Temporary Supply
HT Category at 11 KVHT-I Industry SegregatedHT-I (B) Ferro-AlloysHT-II - OthersHT-III Airports, Railways and BustationsHT-IVA Lift Irrigation & AgricultureHT - IV (B) Composite P.W.S Schemes
HT-VI Townships and Residential ColoniesHT-VII - Green PowerHT - Temporary Supply RESCOs
HT Category at 33 KVHT-I Industry SegregatedHT-I (B) Ferro-AlloysHT-II - OthersHT-III Airports, Railways and BustationsHT-IVA Lift Irrigation & AgricultureHT - IV (B) Composite P.W.S Schemes
HT-VI Townships and Residential ColoniesHT-VII - Green PowerHT - Temporary Supply RESCOs
HT Category at 132 KVHT-I Industry Segregated
HT-I (B) Ferro-AlloysHT-II - OthersHT-III Airports, Railways and BustationsHT-IVA Lift Irrigation & AgricultureHT - IV (C) Composite P.W.S SchemesHT-V (A) Railway TractionHT-V (B) HMRHT-VI Townships and Residential ColoniesHT-VII - Green PowerHT - Temporary SupplyHT- RESCOs
Total
Revenue from Current Tariffs (Rs. Crs.)
Gross Revenue Incentives Net
Revenue Surcharge Additional surcharge
1848.67 0.00 1848.67 0.00 0.00 0.00 1848.67877.46 0.00 877.46 877.46540.17 0.00 540.17 540.17210.09 0.00 210.09 210.09
2.84 0.00 2.84 2.8432.46 0.00 32.46 32.46
155.91 0.00 155.91 155.9127.74 0.00 27.74 27.74
1.99 0.00 1.99 1.990.00 0.00 0.00 0.00
0.00 0.00 0.000.00 0.00 0.000.00 0.00 0.000.00 0.00 0.000.00 0.00 0.000.00 0.00 0.000.00 0.00 0.000.00 0.00 0.000.00 0.00 0.00
659.20 0.00 659.20 0.00 0.00 0.00 659.20429.77 0.00 429.77 429.77
0.00 0.00 0.00 0.00104.33 0.00 104.33 104.33
6.87 0.00 6.87 6.8735.62 0.00 35.62 35.62
8.20 0.00 8.20 8.2011.71 0.00 11.71 11.71
0.00 0.00 0.00 0.002.44 0.00 2.44 2.44
60.26 0.00 60.26 60.260.00 0.00 0.00 0.00
0.00 0.00 0.000.00 0.00 0.000.00 0.00 0.000.00 0.00 0.000.00 0.00 0.000.00 0.00 0.00
189.83 0.00 189.83 0.00 0.00 0.00 189.83124.09 0.00 124.09 124.09
13.99 0.00 13.99 13.9912.57 0.00 12.57 12.57
0.00 0.00 0.00 0.0012.35 0.00 12.35 12.35
0.02 0.00 0.02 0.0226.82 0.00 26.82 26.82
0.00 0.00 0.00 0.000.00 0.00 0.00 0.000.00 0.00 0.00 0.00
0.00 0.00 0.000.00 0.00 0.000.00 0.00 0.000.00 0.00 0.000.00 0.00 0.000.00 0.00 0.00
910.51 0.00 910.51 0.00 0.00 0.00 910.51368.80 0.00 368.80 368.80
0.00 0.00 0.00 0.0023.38 0.00 23.38 23.38
0.00 0.00 0.00 0.00164.05 0.00 164.05 164.05
0.00 0.00 0.00 0.00295.74 0.00 295.74 295.74
58.54 0.00 58.54 58.540.00 0.00 0.000.00 0.00 0.00 0.000.00 0.00 0.00 0.000.00 0.00 0.00 0.00
0.00 0.00 0.00
0.00 0.00 0.000.00 0.00 0.000.00 0.00 0.000.00 0.00 0.000.00 0.00 0.00
3608.21 0.00 3608.21 0.00 0.00 0.00 3608.21
2015-16
Grid Support Charges
Retail Supply (Regulated Business)Total
Revenue
Surcharges (Open Access)
Page 180 of 195

Form 6
Items of Non - Tariff Income (Rs. Crs.) Detail Links Base Year 2014-15 2015-16 2016-17 2017-18 2018-19
Recoveries from theft of power or malpractices 5.24 8.16 8.19Power Purchase Rebates earned 20.98 5.03 14.61Disincentive recovery from GVK, RIL & Spectram IPP 13.96 0.00 0.00Compensation 1.25 0.00 0.00Reconnection Fee LT 10.07 10.10 9.57Reconnection Fee HT 0.32 0.41 0.38Application Registration Fee 0.71 0.54 1.13Supervision Charges from customers 0.50 0.64 0.86Capacitor Charges 6.36 2.84 3.85Transformer Testing Charges 0.01 0.00 0.00Meter Testing / Shifting Charges 0.31 0.38 0.55Other Miscellaneous Income 9.29 12.41 61.53
Total Non tariff income 69.00 40.50 100.68 0.00 0.00 0.00
Non-tariff Income at Current Charges
This form refers to income other than the income derived from tariffs and does not include cross subsidy surcharge, additional surcharge, etc.
Page 181 of 195

Base Year
Energy Charges
(Rs/kWh) or (Rs/kVAh)
Demand charges
(Rs/kVA/Yr)
Demand charges
(Rs/HP/Yr)
Energy Sales (MU)
Energy sales (MVAh)
Connected Load/ Contract
Demand (MVA)
Connected Load/ Contract Demand
(HP)
Energy Charges
(Rs Crores)
Demand /Fixed charges
(Rs Crores)
Minimum Charges
(Rs Crores)
Customer Charges
(Rs crores)
Others (Rs Crores)
Gross Tariff Revenue
(Rs Crores)
Surcharge (Rs.Crs)
Additional Surcharge (Rs.Crs)
Direct Apportioned
LT Total - (Existing Categories) 4882081 9720.00 2160.00 7682.48 0.00 3088.36 4075442.36 1261.00 67.17 14.59 150.47 58.60 1551.82 0.00 1551.82 0.00 0.00 0.00 0.00 51.53 1603.35Category- Domestic (All) 3478098 0.00 0.00 2277 0 1943 0 565.02 0.00 12.58 98.83 12.77 689.21 0.00 689.21 0.00 0.00 0.00 0.00 15.27 704.48 Cat I(A) Domestic - upto 50 units/month 2103295 1.45 556.72 913.28 80.72 0.00 12.58 49.17 12.77 155.25 15.27 15.27 Cat I(B) Domestic - >50 and upto 100 units/month 798176 0.00 0.00 759.47 0.00 477.24 0.00 137.00 0.00 0.00 25.19 0.00 162.20 0.00 0.00 0.00
0 - 50 units 0 1.45 525.73 0.00 76.23 0.00 0.00 0.00 76.2351 - 100 units 798176 2.60 233.74 477.24 60.77 0.00 25.19 0.00 85.96
Cat I(c) Domestic- above 100 & upto 200 units/month 463238 0.00 0.00 654.87 0.00 390.35 0.00 187.82 0.00 0.00 18.95 0.00 206.77 0.00 0.00 0.000 - 50 units 0 2.60 239.68 0.00 62.32 0.00 0.00 0.00 62.32
51 - 100 units 0 2.60 239.68 0.00 62.32 0.00 0.00 0.00 62.32 101 - 150 units 317384 3.60 142.97 252.07 51.47 0.00 12.99 0.00 64.46 151 - 200 units 145854 3.60 32.53 138.28 11.71 0.00 5.97 0.00 17.68
Cat-I(D) Domestic, > 200 Units/Month 113389 0.00 0.00 305.64 0.00 161.87 0.00 159.48 0.00 0.00 5.51 0.00 164.99 0.00 0.00 0.00 0 - 50 units 0 2.60 48.95 0.00 12.73 0.00 0.00 0.00 12.73
51 - 100 units 0 3.25 48.95 0.00 15.91 0.00 0.00 0.00 15.91101 - 150 units 0 4.88 48.95 0.00 23.89 0.00 0.00 0.00 23.89151 - 200 units 0 5.63 48.95 0.00 27.56 0.00 0.00 0.00 27.56201 - 250 units 50599 6.38 36.52 56.09 23.30 0.00 2.37 0.00 25.66251 - 300 units 26901 6.88 19.70 34.91 13.55 0.00 1.26 0.00 14.81301 - 400 units 19431 7.38 19.20 30.75 14.17 0.00 1.02 0.00 15.19401 - 500 units 7653 7.88 9.36 15.01 7.38 0.00 0.40 0.00 7.78above 500units 8805 8.38 25.05 25.11 20.99 0.00 0.46 0.00 21.46
0.00 0.00 0.00 0.00 0.00Category II - Non-domestic/Commrl (A,B &C) 319226 4200.00 600.00 473.62 0.00 492.90 0.00 379.54 29.57 1.88 10.65 6.52 428.16 0.00 428.16 0.00 0.00 0.00 0.00 3.18 431.33Category II - Non-domestic/Commrl (A & B) 319073 3600.00 0.00 473.35 0.00 492.57 0.00 379.24 29.55 1.88 10.64 6.52 427.83 3.18
Lt - II (A) Upto 50 units/month 226270 5.40 600.00 0.00 48.15 0.00 225.28 0.00 26.00 13.52 1.88 6.58 6.52 54.490-50 units 226270 5.40 600.00 48.15 225.28 26.00 13.52 1.88 6.58 6.52 54.49
Lt - II (B) >50 Units/month 92803 3000.00 0.00 425.20 0.00 267.29 0.00 353.24 16.04 0.00 4.06 0.00 373.340-50 units 0 6.63 600.00 66.04 0.00 43.79 0.00 0.00 0.00 43.7951- 100 units 42399 7.38 600.00 48.86 43.15 36.06 2.59 1.62 0.00 40.27101- 300 units 30607 8.13 600.00 79.31 55.13 64.48 3.31 1.48 0.00 69.27301- 500 units 6935 8.63 600.00 39.49 25.67 34.08 1.54 0.34 0.00 35.95
Above 500 units 12862 9.13 600.00 191.50 143.34 174.84 8.60 0.62 0.00 184.06LT-II (C) Advertising Hoardings 153 11.03 600.00 600.00 0.27 0.32 0.30 0.02 0.01 0.00 0.33 0.00 0.00
Category III Industrial 30183 3480.00 0.00 266.38 0.00 496.59 0.00 161.79 29.78 0.00 4.39 31.13 227.09 0.00 227.09 0.00 0.00 0.00 1.79 228.88Category III - Industrial 30183 3480.00 0.00 266.38 0.00 496.59 0.00 161.79 29.78 0.00 4.39 31.13 227.09
Industrial Normal 29465 6.08 600.00 263.52 493.04 160.22 29.58 4.37 31.13 225.30Pisciculture/Prawn culture 38 4.63 240.00 0.35 0.46 0.16 0.01 0.00 0.00 0.18Sugarcane Crushing 0 4.63 240.00 0.00 0.00 0.00 0.00 0.00 0.00 0.00Poultry Farms 680 5.63 600.00 2.51 3.09 1.41 0.19 0.02 0.00 1.62Mushroom & Rabbit Farms 0 5.63 600.00 0.00 0.00 0.00 0.00 0.00 0.00 0.00Floriculture in Green House 0 5.63 600.00 0.00 0.00 0.00 0.00 0.00 0.00 0.00Seasonal Industries 0 6.75 600.00 0.00 0.00 0.00 0.00 0.00
Category IV- Cottage Industries 5753 480.00 0.00 5.85 0.00 18.44 0.00 2.19 0.44 0.00 0.15 0.00 2.79 0.00 2.79 0.00 0.00 0.00 0.04 2.83Cat -IV(A) - Cottage Indstr. Upto 10 HP 5753 3.75 240.00 5.85 18.44 2.19 0.44 0.15 0.00 2.79Cat -IV(B) - Agro Based Acticity upto 10 HP 0 3.75 240.00 0.00 0.00 0.00 - 0.00 0.00 0.00
Category V (A,B & C) - Agriculture (1+2) 978815 0.00 480.00 4361.35 0.00 0.00 3970958.54 1.36 0.00 0.00 33.47 1.05 35.87 0.00 35.87 0.00 0.00 0.00 29.25 65.13Category V(A&B) - Agriculture 978815 0.00 0.00 4361.35 0.00 0.00 3970958.54 1.36 0.00 0.00 33.47 1.05 35.87
LT (A) with DSM 975729 0.00 0.00 4355.58 0.00 0.00 3961071.92 0.62 0.00 0.00 33.36 1.05 35.03Corporate Farmers & IT Assesses 322 2.50 0.91 1560.12 0.23 - 0.01 0.00 0.24Wet Land Farmers (Holdings >2.5 acre) 2164 0.50 6.34 10854.75 0.32 - 0.07 0.00 0.39Dry Land Farmers (Connections > 3 nos.) 652 0.50 1.51 2586.91 0.08 - 0.02 0.00 0.10Wet Land Farmers (Holdings <= 2.5 acre) 274444 0.00 1444.61 1300237.41 0.00 - 9.38 0.00 9.38Dry Land Farmers (Connections <= 3 nos.) 698147 0.00 2902.21 2645832.73 0.00 - 23.87 1.05 24.92LT (B) without DSM 3086 0.00 0.00 5.77 0.00 0.00 9886.62 0.74 0.00 0.00 0.11 0.00 0.84Corporate Farmers & IT Assesses 227 3.50 0.64 1103.06 0.23 - 0.01 0.00 0.23Wet Land Farmers (Holdings >2.5 acre) 1734 1.00 3.09 5293.66 0.31 - 0.06 0.00 0.37Dry Land Farmers (Connections > 3 nos.) 1125 1.00 2.04 3489.90 0.20 - 0.04 0.00 0.24Wet Land Farmers (Holdings <= 2.5 acre) 0 0.50 0.00 0.00 0.00 - 0.00 0.00 0.00Dry Land Farmers (Connections <= 3 nos.) 0 0.50 0.00 0.00 0.00 - 0.00 0.00 0.00Category LT V(C) - Others - (2) 0 0.00 480.00 0.00 0.00 0.00 0.00 0.00 0.00 0.00 0.00 0.00 0.00Salt Farming Units with CL upto15HP 0 3.70 240.00 0.00 0.00 0.00 - 0.00 0.00 0.00Rural Horticulture Nurseries upto 15 HP 0 3.70 240.00 0.00 0.00 0.00 - 0.00 0.00 0.00
Category VI - Street Lighting & PWS 44527 1080.00 1080.00 267.24 0.00 104.94 104483.81 131.26 6.58 0.00 1.67 2.90 142.42 0.00 142.42 0.00 0.00 0.00 1.79 144.21VI(A) - Street Lighting 22591 1080.00 0.00 105.99 0.00 104.94 0.00 59.03 3.78 0.00 0.85 1.30 64.96
Panchayats 17403 5.37 360.00 76.82 66.40 0.00 41.25 2.39 0.65 0.91 45.21Municipalities 3049 5.87 360.00 16.00 18.75 0.00 9.39 0.67 0.11 0.21 10.39Muncipal Corporations 2139 6.37 360.00 13.17 19.79 0.00 8.39 0.71 0.08 0.19 9.37
Vi(B) - PWS Schemes 21936 0.00 1080.00 161.24 0.00 0.00 104483.81 72.23 2.81 0.00 0.83 1.59 77.45Panchayats 20264 4.37 360.00 145.97 0.00 90825.22 63.79 2.44 0.76 1.41 68.40Municipalities 1209 5.37 360.00 10.57 0.00 8285.89 5.68 0.22 0.05 0.13 6.07Municipal Corporations 463 5.87 360.00 4.70 0.00 5372.71 2.76 0.14 0.02 0.06 2.98
Category VII (A&B) 25479 480.00 0.00 31.35 0.00 32.76 0.00 19.83 0.79 0.13 1.30 2.62 24.67 0.00 24.67 0.00 0.00 0.00 0.21 24.88Cat VII (A) - General Purpose 21319 6.53 240.00 27.84 31.50 0.00 18.18 0.76 0.13 1.09 2.62 22.77Cat VII-B - Religious Places (CL <=2KW) 4160 4.70 240.00 3.51 1.26 0.00 1.65 0.03 0.00 0.22 0.00 1.90
For all Units 4160 4.70 240.00 3.51 1.26 0.00 1.65 0.03 0.00 0.22 0.00 1.900.00 0.00 0.00
Category VIII-Temporary Supply 0 0.00 0.00 0.00 0.00 0.00 0.00 0.00 0.00 1.62 1.62 0.00 1.62 0.00 0.00 0.00 0.00 1.62Temp. Supply (for all units) 9.43 240.00 0.00 0.00 0.00 1.62 1.62 0.00
0.00 0.00 0.00New L T Categories ( Total ) 0 0 0 0 0 0.00 0.00 0.00 0.00 0.00 0.00 0.00 0.00 0.00 0.00 0.00 0.00 0.00 0.00
0 0 0.000 0 0.000 0 0.000 0 0.000 0 0.000 0 0.000 0 0.000 0 0.000 0 0.000 0 0.000 0 0.000 0 0.000 0 0.000 0 0.000 0 0.00
Consumer Categories No of consumers
Components of tariff Relevant sales related data
Grid Support Charges(Rs. Crs)
Full year revenue excluding external subsidy Non - tariff Income (Rs crores)
Surcharges(Open Access)
Net Revenue from Tariff
(Rs. Crores)
Total Revenue( Net of incentives)
(Rs.Crs)
Incentives(Rs. Crs)
Page 182 of 195

0.000.000.000.000.000.000.000.000.000.000.000.000.00
TOTAL (LT including new categories) 4882081 7682.48 0.00 3088.36 4075442.36 1261.00 67.17 14.59 150.47 58.60 1551.82 0.00 1551.82 0.00 0.00 0.00 0.00 51.53 1603.35HIGH TENSION 1893 574.26 2029.94 840.98 0.00 1204.21 184.00 0.00 2.47 38.55 1429.23 0.00 1429.23 0.00 0.00 0.00 0.00 17.47 1446.69HT Category at 11 kV 1794 535.47 522.37 326.92 0.00 359.94 102.17 0.00 2.29 5.19 469.58 0.00 469.58 0.00 0.00 0.00 0.00 7.10 476.67
HT-I Indl General (Segregated) 1299 5.73 4200.00 341.01 206.50 195.40 86.73 0.00 1.64 9.29 293.06 0.00 293.06 0.00 0.00 0.00 2.27 295.33Lights & Fans 0 5.73 0.00 0.00 0.00 0.00 0.00 0.00 0.00 0.00 0.00 0.00 0.00 0.00Industrial Colony consumption 0 5.68 0.00 0.00 0.00 0.00 0.00 0.00 0.00 0.00 0.00 0.00 0.00 0.00Seasonal Industries 0 6.90 4200.00 0.00 0.00 0.00 0.00 0.00 0.00 0.00 0.00 0.00 0.00 0.00
HT-I Indrl. Time-of-Day Tariff (6 PM to 10 PM) 0 6.73 0.00 57.72 0.00 38.85 0.00 0.00 0.00 0.00 38.85 38.85 0.39 39.23HT - I( B) Ferro-alloys 0 5.41 0.00 0.00 0.00 0.00 0.00 0.00 0.00 0.00 0.00 0.00 0.00 0.00 0.00 0.00 0.00 0.00HT-II - Others 274 6.90 4200.00 55.35 33.41 38.19 14.03 0.00 0.36 11.00 63.58 0.00 63.58 0.00 0.00 0.00 0.35 63.93HT-II - Others Time-of-Day Tariff (6 PM to 10 PM) 0 7.90 0.00 17.06 0.00 13.47 0.00 0.00 0.00 0.00 13.47 13.47 0.11 13.59HT III: Airports, Bus Stations and Railway Stations 10 6.58 4200.00 4.87 2.74 3.20 1.15 0.00 0.02 0.00 4.37 0.00 4.37 0.00 0.00 0.00 0.07 4.44HT-III- Airport etc Time-of-Day Tariff (6 PM to 10 PM) 0 7.58 0.00 1.40 0.00 1.06 0.00 0.00 0.00 0.00 1.06 1.06 0.01 1.07HT -IV A Lift Irrigation & Agriculture 156 5.37 0.00 19.84 46.29 10.65 0.00 0.00 0.20 2.95 13.80 0.00 13.80 0.00 0.00 0.00 0.12 13.93HT- IV B - CP Water Supply Schemes 37 4.39 0.00 9.40 8.64 4.13 0.00 0.00 0.05 0.00 4.18 0.00 4.18 0.00 0.00 0.00 0.07 4.25HT-VI - Townships & Colony Supply 17 5.68 600.00 15.71 4.21 8.93 0.25 0.00 0.02 0.67 9.87 0.00 9.87 0.00 0.00 0.00 0.11 9.97HT- VII Green Power 0 10.78 0.00 0.00 0.00 0.00 0.00 0.00 0.00 0.00 0.00 0.00 0.00 0.00 0.00 0.00 0.00 0.00HT- VIII Temporary 0 0.00 0.00 0.00 0.00 0.00 0.00 0.00 0.00 0.00 0.00 0.00 0.00 0.00 0.00 0.00 0.00 0.00RESCOs 1 0.86 0.00 535.47 25.12 46.05 0.00 0.00 0.00 -18.72 27.33 0.00 27.33 0.00 0.00 0.00 3.59 30.93
0.00 0.00 0.00 0.00 0.00 0.00 0.00 0.00 0.000.00 0.00 0.00 0.00 0.000.00 0.00 0.00 0.00 0.000.00 0.00 0.00 0.00 0.000.00 0.00 0.00 0.00 0.000.00 0.00 0.00 0.00 0.000.00 0.00 0.00 0.00 0.000.00 0.00 0.00 0.00 0.000.00 0.00 0.00 0.00 0.000.00 0.00 0.00 0.00 0.00
HT Category at 33 kV 60 38.79 256.36 127.76 0.00 143.06 22.63 0.00 0.08 6.53 172.30 0.00 172.30 0.00 0.00 0.00 0.00 1.98 174.28HT-I Indl General (Segregated) 32 5.30 4200.00 133.97 44.74 71.00 18.79 0.00 0.04 3.63 93.47 0.00 93.47 0.00 0.00 0.00 0.95 94.42
Lights & Fans 0 5.30 0.00 0.00 0.00 0.00 0.00 0.00 0.00 0.00 0.00 0.00 0.00 0.00Industrial Colony consumption 0 5.68 0.00 0.00 0.00 0.00 0.00 0.00 0.00 0.00 0.00 0.00 0.00 0.00Seasonal Industries 0 6.28 4200.00 0.00 0.00 0.00 0.00 0.00 0.00 0.00 0.00 0.00 0.00 0.00
HT-I Indrl. Time-of-Day Tariff (6 PM to 10 PM) 0 6.30 0.00 27.98 0.00 17.63 0.00 0.00 0.00 0.00 17.63 17.63 0.19 17.82HT - I( B) Ferro-alloys 1 4.98 0.00 37.30 4.00 18.57 0.00 0.00 0.00 0.00 18.57 0.00 18.57 0.00 0.00 0.00 0.20 18.77HT-II - Others 9 6.28 4200.00 5.47 8.10 3.43 3.40 0.00 0.01 1.20 8.04 0.00 8.04 0.00 0.00 0.00 0.04 8.08HT-II - Others Time-of-Day Tariff (6 PM to 10 PM) 0 7.28 0.00 1.28 0.00 0.93 0.00 0.00 0.00 0.00 0.93 0.93 0.01 0.94HT III: Airports, Bus Stations and Railway Stations 0 6.01 4200.00 0.00 0.00 0.00 0.00 0.00 0.00 0.00 0.00 0.00 0.00 0.00 0.00 0.00 0.00 0.00HT-III- Airport etc Time-of-Day Tariff (6 PM to 10 PM) 0 7.01 0.00 0.00 0.00 0.00 0.00 0.00 0.00 0.00 0.00 0.00 0.00 0.00HT -IV A Lift Irrigation & Agriculture 12 5.37 0.00 14.83 35.67 7.96 0.00 0.00 0.02 1.57 9.55 0.00 9.55 0.00 0.00 0.00 0.10 9.65HT- IV B - CP Water Supply Schemes 0 4.39 0.00 0.00 0.00 0.00 0.00 0.00 0.00 0.00 0.00 0.00 0.00 0.00 0.00 0.00 0.00 0.00HT-VI - Townships & Colony Supply 6 5.68 600.00 35.54 7.26 20.19 0.44 0.00 0.01 1.50 22.13 0.00 22.13 0.00 0.00 0.00 0.24 22.37HT- VII Green Power 0 10.78 0.00 0.00 0.00 0.00 0.00 0.00 0.00 0.00 0.00 0.00 0.00 0.00 0.00 0.00 0.00 0.00HT- VIII Temporary 0 0.00 0.00 0.00 0.00 0.00 0.00 0.00 0.00 0.00 0.00 0.00 0.00 0.00 0.00 0.00 0.00 0.00RESCOs 0 0.86 0.00 38.79 28.00 3.34 0.00 0.00 0.00 -1.36 1.98 0.00 1.98 0.00 0.00 0.00 0.26 2.24
0.00 0.00 0.00 0.00 0.00 0.000.00 0.00 0.00 0.00 0.00 0.00 0.00 0.00 0.000.00 0.00 0.00 0.00 0.00 0.00 0.00 0.00 0.000.00 0.00 0.00 0.00 0.000.00 0.00 0.00 0.00 0.000.00 0.00 0.00 0.00 0.000.00 0.00 0.00 0.00 0.000.00 0.00 0.00 0.00 0.000.00 0.00 0.00 0.00 0.000.00 0.00 0.00 0.00 0.00
HT Category at 132 kV 39 0.00 1251.21 386.30 0.00 701.22 59.21 0.00 0.10 26.82 787.35 0.00 787.35 0.00 0.00 0.00 0.00 8.39 795.74HT-I Indl General (Segregated) 15 4.90 4200.00 484.46 122.46 237.38 51.43 0.00 0.04 10.03 298.89 0.00 298.89 0.00 0.00 0.00 3.24 302.13
Lights & Fans 0 4.90 0.00 0.00 0.00 0.00 0.00 0.00 0.00 0.00 0.00 0.00 0.00 0.00Industrial Colony consumption 0 5.68 0.00 0.00 0.00 0.00 0.00 0.00 0.00 0.00 0.00 0.00 0.00 0.00Seasonal Industries 0 6.03 4200.00 0.00 0.00 0.00 0.00 0.00 0.00 0.00 0.00 0.00 0.00 0.00
HT-I Indrl. Time-of-Day Tariff (6 PM to 10 PM) 0 5.90 0.00 100.67 0.00 59.39 0.00 0.00 0.00 0.00 59.39 59.39 0.68 60.07HT - I( B) Ferro-alloys 0 4.58 0.00 0.00 0.00 0.00 0.00 0.00 0.00 0.00 0.00 0.00 0.00 0.00 0.00 0.00 0.00 0.00HT-II - Others 2 6.03 4200.00 1.58 16.00 0.96 6.72 0.00 0.01 1.25 8.94 0.00 8.94 0.00 0.00 0.00 0.02 8.96HT-II - Others Time-of-Day Tariff (6 PM to 10 PM) 0 7.03 0.00 0.68 0.00 0.48 0.00 0.00 0.00 0.00 0.48 0.48 0.00 0.48HT III: Airports, Bus Stations and Railway Stations 0 5.72 4200.00 0.00 0.00 0.00 0.00 0.00 0.00 0.00 0.00 0.00 0.00 0.00 0.00 0.00 0.00 0.00HT-III- Airport etc Time-of-Day Tariff (6 PM to 10 PM) 0 6.72 0.00 0.00 0.00 0.00 0.00 0.00 0.00 0.00 0.00 0.00 0.00 0.00HT -IV A Lift Irrigation & Agriculture 10 5.37 0.00 131.38 102.64 70.55 0.00 0.00 0.03 13.85 84.43 0.00 84.43 0.00 0.00 0.00 0.88 85.31HT- IV B - CP Water Supply Schemes 0 4.39 0.00 0.00 0.00 0.00 0.00 0.00 0.00 0.00 0.00 0.00 0.00 0.00 0.00 0.00 0.00 0.00HT-V – RailwayTraction 10 6.36 0.00 441.55 127.60 280.83 0.00 0.00 0.03 -2.14 278.72 0.00 278.72 0.00 0.00 0.00 2.96 281.68HT-VI - Townships & Colony Supply 2 5.68 600.00 90.89 17.60 51.63 1.06 0.00 0.01 3.83 56.51 0.00 56.51 0.00 0.00 0.00 0.61 57.12HT- VII Green Power 0 10.78 0.00 0.00 0.00 0.00 0.00 0.00 0.00 0.00 0.00 0.00 0.00 0.00 0.00 0.00 0.00 0.00HT- VIII Temporary 0 0.00 0.00 0.00 0.00 0.00 0.00 0.00 0.00 0.00 0.00 0.00 0.00 0.00 0.00 0.00 0.00 0.00RESCOs 0 0.86 0.00 0.00 0.00 0.00 0.00 0.00 0.00 0.00 0.00 0.00 0.00 0.00 0.00 0.00 0.00
0.00 0.00 0.00 0.00 0.00 0.00 0.00 0.00 0.00 0.000.00 0.00 0.00 0.00 0.00 0.00 0.00 0.00 0.00 0.000.00 0.00 0.00 0.00 0.000.00 0.00 0.00 0.00 0.000.00 0.00 0.00 0.00 0.000.00 0.00 0.00 0.00 0.000.00 0.00 0.00 0.00 0.000.00 0.00 0.00 0.00 0.000.00 0.00 0.00 0.00 0.000.00 0.00 0.00 0.00 0.00
TOTAL( LT + HT) 4883974 8256.74 2029.94 3929.33 4075442.36 2465.21 251.17 14.59 152.94 97.15 2981.05 0.00 2981.05 0.00 0.00 0.00 0.00 69.00 3050.05
292
Page 183 of 195

2014-15
Energy Charges
(Rs/kWh) or (Rs.kVAh)
Demand charges
(Rs/kVA/Yr)
Demand charges
(Rs/HP/Yr)
Energy Sales (MU)
Energy sales (MVAh)
Connected Load/ Contract
Demand (MW)
Connected Load/ Contract Demand
(HP)
Energy Charges
(Rs crores)
Demand /Fixed charges
(Rs crores)
Minimum Charges
(Rs crores)
Customer Charges
(Rs crores)
Others (Rs crores)
Gross Revenue from Tariff (Rs crores)
Surcharge (Rs.Crs)
Additional Surcharge (Rs.Crs)
Direct Apportioned
LT Total - (Existing Categories) 4378660 6720.00 6240.00 8270.53 0.00 2957.80 4255914.66 1364.17 63.37 13.62 153.37 23.42 1617.95 0.00 1617.95 0.00 0.00 0.00 0.00 30.16 1648.11Category- Domestic (All) 2996429.00 2442.49 0.00 1933.74 0.00 631.15 0.00 11.67 100.07 0.00 742.89 0.00 742.89 0.00 0.00 0.00 0.00 8.91 751.80 Cat I(A) Domestic - upto 50 units/month 1505992 1.45 493.79 787.78 71.60 0.00 11.67 43.95 0.00 127.22 0.00 Cat I(B) Domestic - >50 and upto 100 units/month 940877 0.00 0.00 810.14 0.00 609.34 0.00 145.72 0.00 0.00 32.95 0.00 178.66 0.00 8.91 8.91
0 - 50 units 0 1.45 564.53 0.00 81.86 0.00 0.00 0.00 81.8651 - 100 units 940877 2.60 245.61 609.34 63.86 0.00 32.95 0.00 96.81
Cat I(c) Domestic- > 100 & upto 200 units/month 456176 0.00 0.00 782.97 0.00 403.25 0.00 227.13 0.00 0.00 18.64 0.00 245.77 0.00 0.00 0.000 - 50 units 0 2.60 273.71 0.00 71.16 0.00 0.00 0.00 71.16
51 - 100 units 0 2.60 273.71 0.00 71.16 0.00 0.00 0.00 71.16 101 - 150 units 303958 3.60 189.19 253.32 68.11 0.00 12.42 0.00 80.53 151 - 200 units 152218 3.60 46.37 149.92 16.69 0.00 6.22 0.00 22.91
Cat-I(D) Domestic, > 200 Units/Month 93384 0.00 0.00 355.59 0.00 133.38 0.00 186.71 0.00 0.00 4.53 0.00 191.24 0.00 0.00 0.00 0.00 0.00 0.00 0 - 50 units 0 2.60 56.03 0.00 14.57 0.00 0.00 0.00 14.57
51 - 100 units 0 3.25 56.03 0.00 18.21 0.00 0.00 0.00 18.21101 - 150 units 0 4.88 56.03 0.00 27.34 0.00 0.00 0.00 27.34151 - 200 units 0 5.63 56.03 0.00 31.55 0.00 0.00 0.00 31.55201 - 250 units 41372 6.38 43.53 46.80 27.77 0.00 1.93 0.00 29.71251 - 300 units 22456 6.88 22.94 29.54 15.78 0.00 1.05 0.00 16.83301 - 400 units 16407 7.38 22.20 25.54 16.38 0.00 0.86 0.00 17.24401 - 500 units 6235 7.88 15.17 11.96 11.95 0.00 0.33 0.00 12.28above 500units 6914 8.38 27.63 19.54 23.15 0.00 0.36 0.00 23.52
Category II - Non-domestic/Commrl 281540 1200.00 0.00 502.62 0.00 453.32 0.00 408.34 27.20 1.84 10.64 0.00 448.01 0.00 448.01 0.00 0.00 0.00 1.83 449.85Category II - Non-domestic/Commrl (A & B) 281293 600.00 0.00 502.03 0.00 452.66 0.00 407.69 27.16 1.84 10.63 0.00 447.32 0.00 447.32 0.00 0.00 0.00 447.32
Lt - II(A) Upto 50 units/month 170672 600.00 0.00 37.62 0.00 157.79 0.00 20.32 9.47 1.84 5.85 0.00 37.460-50 units 170672 5.40 600 37.62 157.79 20.32 9.47 1.84 5.85 0.00 37.46
Lt - II (B) >50 Units/month 110621.00 464.41 0.00 294.86 0.00 387.38 17.69 0.00 4.79 0.00 409.860-50 units 0 6.63 600.00 66.37 0.00 44.01 0.00 0.00 0.00 44.0151- 100 units 46140 7.38 600.00 55.96 48.98 41.30 2.94 1.84 0.00 46.08101- 300 units 34119 8.13 600.00 79.96 54.67 65.01 3.28 1.56 0.00 69.85301- 500 units 14594 8.63 600.00 45.03 30.23 38.86 1.81 0.67 0.00 41.34
Above 500 units 15768 9.13 600.00 217.10 160.98 198.21 9.66 0.72 0.00 208.59LT-II (C) Advertising Hoardings 247 11.03 600.00 0.58 0.66 0.00 0.64 0.04 0.01 0.00 0.69 0.00 0.69 0.69
Category III Industrial 20008 3480.00 0.00 268.40 0.00 458.57 0.00 162.68 27.48 0.00 4.35 23.42 217.93 0.00 217.93 0.00 0.00 0.00 0.98 218.91Category III - Industrial (1) 20008 3480.00 0.00 268.40 0.00 458.57 0.00 162.68 27.48 0.00 4.35 23.42 217.93
Industrial Normal 18418 6.08 600.00 258.52 448.52 157.18 26.91 0.00 4.30 23.42 211.82Pisciculture/Prawn culture 62 4.63 240.00 0.65 0.81 0.30 0.02 0.00 0.00 0.32Sugarcane crushing 0 4.63 240.00 0.00 0.00 0.00 - 0.00 0.00 0.00Poultry farms 1528 5.63 600.00 9.22 9.24 5.19 0.55 0.04 0.00 5.79Mushroom & Rabbit Farms 0 5.63 600.00 0.00 0.00 0.00 - 0.00 0.00 0.00Floriculture in Green House 0 5.63 600.00 0.00 0.00 0.00 - 0.00 0.00 0.00Seasonal Industries 0 6.75 600.00 0.00 0.00 0.00 0.00 0.00 0.00 0.00
Category IV- Cottage Industries & Others 4445 480.00 480.00 6.00 0.00 9.87 0.00 2.25 0.24 0.00 0.16 0.00 2.65 0.00 2.65 0.00 0.00 0.00 0.02 2.67Cat -IV(A) - Cottage Indstr. Upto 10 HP 4404 3.75 240.00 240.00 5.97 9.76 2.24 0.23 0.16 0.00 2.63Cat -IV(B) - Agro Based Acticity upto 10 HP 41 3.75 240.00 240.00 0.03 0.11 0.01 0.00 0.00 0.00 0.02
Category LT V(A,B&C) - Agriculture (1+2+3) 1009811 0.00 4680.00 4738.38 0.00 0.00 4153202.30 1.48 1.72 0.00 35.46 0.00 38.67 0.00 38.67 0.00 0.00 0.00 17.28 55.95Category V(A&B) - Agriculture 1009745 0.00 4200.00 4738.36 0.00 0.00 4152621.13 1.47 1.71 0.00 35.46 0.00 38.64
LT (A) with DSM 1006561 0.00 1050.00 4732.09 0.00 0.00 4142176.62 0.67 0.73 0.00 35.34 0.00 36.75Corporate Farmers & IT Assesses 332 2.50 0.00 0.99 1620.83 0.25 0.00 0.01 0.00 0.26Wet Land Farmers (Holdings >2.5 acre) 2167 0.50 525.00 6.86 11264.28 0.34 0.59 0.08 0.00 1.01Dry Land Farmers (Connections > 3 nos.) 673 0.50 525.00 1.64 2709.67 0.08 0.14 0.02 0.00 0.25Wet Land Farmers (Holdings <= 2.5 acre) 283134 0.00 0.00 1569.50 1352043.39 0.00 0.00 9.94 0.00 9.94Dry Land Farmers (Connections <= 3 nos.) 720255 0.00 0.00 3153.10 2774538.45 0.00 0.00 25.29 0.00 25.29LT (B) without DSM 3184 0.00 3150.00 6.27 0.00 0.00 10444.50 0.80 0.98 0.00 0.11 0.00 1.89Corporate Farmers & IT Assesses 234 3.50 0.00 0.70 1145.64 0.24 0.00 0.01 0.00 0.25Wet Land Farmers (Holdings >2.5 acre) 1789 1.00 1050.00 3.36 5605.01 0.34 0.59 0.06 0.00 0.99Dry Land Farmers (Connections > 3 nos.) 1161 1.00 1050.00 2.21 3693.86 0.22 0.39 0.04 0.00 0.65Wet Land Farmers (Holdings <= 2.5 acre) 0 0.50 525.00 0.00 0.00 0.00 0.00 0.00 0.00 0.00Dry Land Farmers (Connections <= 3 nos.) 0 0.50 525.00 0.00 0.00 0.00 0.00 0.00 0.00 0.00 0.00Category LT V(C) - Others - (2) 66 0.00 480.00 0.02 0.00 0.00 581.17 0.01 0.01 0.00 0.00 0.00 0.02 0.00 0.00Salt Farming Units with CL upto15HP 0 3.70 240.00 0.00 0.00 0.00 - 0.00 0.00 0.00Rural Horticulture Nurseries upto 15 HP 66 3.70 240.00 0.02 581.17 0.01 0.01 0.00 0.00 0.02
Category VI - Local Bodies, St. Lighting & PWS 46041 1080.00 1080.00 279.45 0.00 47.78 102712.37 137.26 5.42 0.00 1.64 0.00 144.32 0.00 144.32 0.00 0.00 0.00 1.02 145.34VI(A) - Street Lighting 23359 1080.00 0.00 110.84 0.00 47.78 0.00 61.73 1.72 0.00 0.83 0.00 64.28
Panchayats 17994 5.37 360.00 80.33 35.43 43.14 1.28 0.64 0.00 45.05Municipalities 3153 5.87 360.00 16.73 6.91 9.82 0.25 0.11 0.00 10.18Muncipal Corporations 2212 6.37 360.00 13.78 5.44 8.78 0.20 0.08 0.00 9.05
VI(B) PWS Schemes 22682 0.00 1080.00 168.61 0.00 0.00 102712.37 75.53 3.70 0.00 0.81 0.00 80.04Panchayats 20953 4.37 360.00 152.64 93927.42 66.70 3.38 0.75 0.00 70.84Muncipalities 1250 5.37 360.00 11.05 6331.60 5.94 0.23 0.04 0.00 6.21Corporations 479 5.87 360.00 4.92 2453.34 2.89 0.09 0.02 0.00 2.99
Category VII (A&B) 20386 480.00 0.00 33.19 0.00 54.51 0.00 21.01 1.31 0.11 1.05 0.00 23.48 0.00 23.48 0.00 0.00 0.00 0.12 23.60Cat VII (A) - General Purpose 16930 6.53 240.00 29.58 28.63 19.31 0.69 0.11 0.87 0.00 20.98 20.98 20.98Cat VII-B - Religious Places (CL <=2KW) 3456 240.00 0.00 3.61 0.00 25.88 0.00 1.70 0.62 0.00 0.18 0.00 2.50 2.50 2.50
For All Units 3456 4.70 240.00 3.61 25.88 0.00 1.70 0.62 0.00 0.18 0.00 2.500.00 0.00 0.00
Category VIII-Temporary Supply 0 0.00 0.00 0.00 0.00 0.00 0.00 0.00 0.00 0.00 0.00 0.00 0.00 0.00 0.00 0.00 0.00 0.00Temp. Supply (for ALL UNITS) 9.43 240.00 0.00 0.00 0.00
0.00 0.00 0.00New L T Categories ( Total ) 0 0.00 0.00 0.00 0.00 0.00 0.00 0.00 0.00 0.00 0.00 0.00 0.00 0.00 0.00 0.00 0.00 0.00 0.00
0 0 0 0.00 0.00 0.00 0.00 0.00 0.000 0 0 0.00 0.00 0.00 0.00 0.00 0.000 0 0 0.00 0.00 0.00 0.00 0.00 0.000 0 0 0.00 0.00 0.00 0.00 0.00 0.000 0 0 0.00 0.00 0.00 0.00 0.00 0.00
0.00 0.00 0.00 0.00 0.00 0.00 0.00 0.000.00 0.00 0.00 0.00 0.00 0.00 0.00 0.000.00 0.00 0.00 0.00 0.00 0.00 0.00 0.000.00 0.00 0.00 0.00 0.00 0.00 0.00 0.00
0.00 0.000.00 0.000.00 0.00
Full year revenue excluding external subsidyRelevant sales related data Surcharges(Open Access)
Non - tariff Income (Rs crores)Components of tariff
Total Revenue( Net of incentives)Consumer Categories Incentives
(Rs. Crs)
Net Revenue from Tariff
(Rs. Crores)
Grid Support Charges(Rs. Crs)
No of consumers
Page 184 of 195

0.00 0.000.00 0.000.00 0.000.00 0.000.00 0.000.00 0.000.00 0.000.00 0.000.00 0.000.00 0.000.00 0.000.00 0.000.00 0.000.00 0.000.00 0.000.00 0.00
TOTAL (LT including new categories) 4378660 8270.53 0.00 2957.80 4255914.66 1364.17 63.37 13.62 153.37 23.42 1617.95 0.00 1617.95 0.00 0.00 0.00 0.00 30.16 1648.11HIGH TENSION 2032 639.36 2194.91 877.57 0.00 1310.35 186.04 0.00 2.69 61.64 1560.72 0.00 1560.72 0.00 0.00 0.00 0.00 10.34 1571.05HT Category at 11 kV 1932 585.83 655.27 350.12 0.00 444.23 105.83 0.00 2.49 24.46 577.02 0.00 577.02 0.00 0.00 0.00 0.00 4.53 581.54
HT-I Indl General (Segregated) 1367 5.73 4200.00 408.29 212.38 233.95 89.20 1.78 24.13 349.06 0.00 349.06 0.00 0.00 0.00 1.49 350.55Lights & Fans 9 5.73 0.00 6.85 2.85 3.92 0.00 0.00 0.00 3.92 3.92 0.02 3.95Industrial Colony consumption 0 5.68 0.00 0.00 0.00 0.00 0.00 0.00 0.00 0.00 0.00 0.00 0.00Seasonal Industries 0 6.90 4200.00 0.00 0.00 0.00 0.00 0.00 0.00 0.00 0.00 0.00 0.00
HT-I Indrl. Time-of-Day Tariff (6 PM to 10 PM) 0 6.73 0.00 87.51 0.00 58.90 0.00 0.00 0.00 58.90 58.90 0.32 59.22HT - I( B) Ferro-alloys 0 5.41 0.00 0.00 0.00 0.00 0.00 0.00 0.00 0.00 0.00 0.00 0.00 0.00 0.00 0.00 0.00HT-II - Others (Non- Industrial) 306 6.90 4200.00 68.23 36.89 47.08 15.49 0.39 0.00 62.97 0.00 62.97 0.00 0.00 0.00 0.25 63.21HT-II Others - Time-of-Day Tariff (6 PM to 10 PM) 0 7.90 0.00 18.42 0.00 14.55 0.00 0.00 0.00 14.55 14.55 0.07 14.62HT III: Airports, Bus Stations and Railway Stations 17 6.58 4200.00 6.11 2.13 4.02 0.90 0.02 0.33 5.27 0.00 5.27 0.00 0.00 0.00 0.02 5.29HT-III - Aviation Time-of-Day Tariff (6 PM to 10 PM) 0 7.58 0.00 1.48 0.00 1.12 0.00 0.00 0.00 1.12 1.12 0.01 1.13HT -IV A Lift Irrigation & Agriculture 155 5.37 0.00 26.95 42.09 14.47 0.00 0.19 0.00 14.67 0.00 14.67 0.00 0.00 0.00 0.10 14.76HT- IV B - CP Water Supply Schemes 61 4.39 0.00 15.63 12.64 6.86 0.00 0.08 0.00 6.95 0.00 6.95 0.00 0.00 0.00 0.06 7.00HT-VI - Townships & Colony Supply 16 5.68 600.00 15.79 4.01 8.97 0.24 0.02 0.00 9.23 0.00 9.23 0.00 0.00 0.00 0.06 9.29HT- VII Green Power 0 10.78 0.00 0.00 0.00 0.00 0.00 0.00 0.00 0.00 0.00 0.00 0.00 0.00 0.00 0.00 0.00HT- VIII Temporary 0.00 0.00 0.00 0.00 0.00 0.00 0.00 0.00 0.00 0.00 0.00 0.00 0.00 0.00RESCOs 1 0.86 0.00 585.83 37.12 50.38 0.00 0.00 0.00 50.38 0.00 50.38 0.00 0.00 0.00 2.14 52.52
0.00 0.00 0.00 0.00 0.00 0.00 0.00 0.00 0.00 0.000.00 0.00 0.00 0.00 0.00 0.00 0.00 0.00 0.000.00 0.00 0.00 0.00 0.00 0.00 0.00 0.00 0.000.00 0.00 0.00 0.00 0.00 0.00 0.00 0.00 0.000.00 0.00 0.00 0.00 0.00 0.00 0.00 0.00 0.000.00 0.00 0.00 0.00 0.000.00 0.00 0.00 0.00 0.000.00 0.00 0.00 0.00 0.000.00 0.00 0.00 0.00 0.000.00 0.00 0.00 0.00 0.00
HT Category at 33 kV 59 53.53 285.67 129.31 0.00 160.65 21.15 0.00 0.08 8.33 190.20 0.00 190.20 0.00 0.00 0.00 0.00 1.24 191.44HT-I Indl General (Segregated) 28 5.30 4200.00 141.14 41.69 74.80 17.51 0.04 8.33 100.68 0.00 100.68 0.00 0.00 0.00 0.51 101.19
Lights & Fans 0 5.30 0.00 0.00 0.00 0.00 0.00 0.00 0.00 0.00 0.00 0.00 0.00Industrial Colony consumption 0 5.68 0.00 0.00 0.00 0.00 0.00 0.00 0.00 0.00 0.00 0.00 0.00Seasonal Industries 0 6.28 4200.00 0.00 0.00 0.00 0.00 0.00 0.00 0.00 0.00 0.00 0.00
HT-I Indrl. Time-of-Day Tariff (6 PM to 10 PM) 0 6.30 0.00 31.54 0.00 19.87 0.00 0.00 0.00 19.87 19.87 0.12 19.98HT - I( B) Ferro-alloys 1 4.98 0.00 43.50 4.00 21.66 0.00 0.00 0.00 21.66 0.00 21.66 0.00 0.00 0.00 0.16 21.82HT-II - Others (Non- Industrial) 9 6.28 4200.00 8.56 7.46 5.38 3.13 0.01 0.00 8.52 0.00 8.52 0.00 0.00 0.00 0.03 8.55HT-II Others - Time-of-Day Tariff (6 PM to 10 PM) 0 7.28 0.00 2.24 0.00 1.63 0.00 0.00 0.00 1.63 1.63 0.01 1.64HT III: Airports, Bus Stations and Railway Stations 0 6.01 4200.00 0.00 0.00 0.00 0.00 0.00 0.00 0.00 0.00 0.00 0.00 0.00 0.00 0.00 0.00HT-III - Aviation Time-of-Day Tariff (6 PM to 10 PM) 0 7.01 0.00 0.00 0.00 0.00 0.00 0.00 0.00 0.00 0.00 0.00 0.00HT -IV A Lift Irrigation & Agriculture 14 5.37 0.00 20.51 39.71 11.01 0.00 0.02 0.00 11.03 0.00 11.03 0.00 0.00 0.00 0.07 11.10HT- IV B - CP Water Supply Schemes 0 4.39 0.00 0.00 0.00 0.00 0.00 0.00 0.00 0.00 0.00 0.00 0.00 0.00 0.00 0.00 0.00HT-VI - Townships & Colony Supply 7 5.68 600.00 38.19 8.46 21.69 0.51 0.01 0.00 22.21 0.00 22.21 0.00 0.00 0.00 0.14 22.35HT- VII Green Power 0 10.78 0.00 0.00 0.00 0.00 0.00 0.00 0.00 0.00 0.00 0.00 0.00 0.00 0.00 0.00 0.00HT- VIII Temporary 0 0.00 0.00 0.00 0.00 0.00 0.00 0.00 0.00 0.00 0.00 0.00 0.00 0.00 0.00RESCOs 0 0.86 0.00 53.53 28.00 4.60 0.00 0.00 0.00 4.60 0.00 4.60 0.00 0.00 0.00 0.20 4.80
0.00 0.00 0.00 0.00 0.00 0.00 0.00 0.00 0.000.00 0.00 0.00 0.00 0.00 0.00 0.00 0.00 0.000.00 0.00 0.00 0.00 0.00 0.00 0.00 0.00 0.000.00 0.00 0.00 0.00 0.00 0.00 0.00 0.00 0.000.00 0.00 0.00 0.00 0.00 0.00 0.00 0.00 0.000.00 0.00 0.00 0.00 0.000.00 0.00 0.00 0.00 0.000.00 0.00 0.00 0.00 0.000.00 0.00 0.00 0.00 0.000.00 0.00 0.00 0.00 0.00
HT Category at 132 kV 41 0.00 1253.97 398.14 0.00 705.48 59.06 0.00 0.12 28.85 793.50 0.00 793.50 0.00 0.00 0.00 0.00 4.57 798.07HT-I Indl General (Segregated) 15 4.90 4200.00 419.05 122.10 205.33 51.28 0.04 19.56 276.22 0.00 276.22 0.00 0.00 0.00 1.53 277.74
Lights & Fans 0 4.90 0.00 0.00 0.00 0.00 0.00 0.00 0.00 0.00 0.00 0.00 0.00Industrial Colony consumption 0 5.68 0.00 0.00 0.00 0.00 0.00 0.00 0.00 0.00 0.00 0.00 0.00Seasonal Industries 0 6.03 4200.00 0.00 0.00 0.00 0.00 0.00 0.00 0.00 0.00 0.00 0.00
HT-I Indrl. Time-of-Day Tariff (6 PM to 10 PM) 0 5.90 0.00 97.57 0.00 57.56 0.00 0.00 0.00 57.56 57.56 0.36 57.92HT - I( B) Ferro-alloys 0 4.58 0.00 0.00 0.00 0.00 0.00 0.00 0.00 0.00 0.00 0.00 0.00 0.00 0.00 0.00 0.00HT-II - Others (Non- Industrial) 2 6.03 4200.00 1.15 16.00 0.70 6.72 0.01 3.33 10.76 0.00 10.76 0.00 0.00 0.00 0.00 10.76HT-II Others - Time-of-Day Tariff (6 PM to 10 PM) 0 7.03 0.00 0.27 0.00 0.19 0.00 0.00 0.00 0.19 0.19 0.00 0.19HT III: Airports, Bus Stations and Railway Stations 0 5.72 4200.00 0.00 0.00 0.00 0.00 0.00 0.00 0.00 0.00 0.00 0.00 0.00 0.00 0.00 0.00HT-III - Aviation Time-of-Day Tariff (6 PM to 10 PM) 0 6.72 0.00 0.00 0.00 0.00 0.00 0.00 0.00 0.00 0.00 0.00 0.00HT -IV A Lift Irrigation & Agriculture 12 5.37 0.00 205.41 111.64 110.31 0.00 0.03 2.14 112.48 0.00 112.48 0.00 0.00 0.00 0.75 113.23HT- IV B - CP Water Supply Schemes 0 4.39 0.00 0.00 0.00 0.00 0.00 0.00 0.00 0.00 0.00 0.00 0.00 0.00 0.00 0.00 0.00HT-V – RailwayTraction 10 6.36 0.00 441.95 130.80 281.08 0.00 0.03 3.82 284.93 0.00 284.93 0.00 0.00 0.00 1.61 286.54HT-VI - Townships & Colony Supply 2 5.68 600.00 88.57 17.60 50.31 1.06 0.01 0.00 51.37 0.00 51.37 0.00 0.00 0.00 0.32 51.69HT- VII Green Power 0 10.78 0.00 0.00 0.00 0.00 0.00 0.00 0.00 0.00 0.00 0.00 0.00 0.00 0.00 0.00 0.00HT- VIII Temporary 0 0.00 0.00 0.00 0.00 0.00 0.00 0.00 0.00 0.00 0.00 0.00 0.00 0.00 0.00RESCOs 0 0.86 0.00 0.00 0.00 0.00 0.00 0.00 0.00 0.00 0.00 0.00 0.00 0.00 0.00 0.00 0.00
0.00 0.00 0.00 0.00 0.00 0.00 0.00 0.000.00 0.00 0.00 0.00 0.00 0.00 0.00 0.000.00 0.00 0.00 0.00 0.000.00 0.00 0.00 0.00 0.000.00 0.00 0.00 0.00 0.000.00 0.00 0.00 0.00 0.000.00 0.00 0.00 0.00 0.000.00 0.00 0.00 0.00 0.000.00 0.00 0.00 0.00 0.000.00 0.00 0.00 0.00 0.00
TOTAL( LT + HT) 4380692 8909.88 2194.91 3835.37 4255914.66 2674.53 249.41 13.62 156.05 85.06 3178.67 0.00 3178.67 0.00 0.00 0.00 0.00 40.50 3219.16
Page 185 of 195

2015-16
Energy Charges
(Rs/kWh) or (Rs.kVAh)
Demand charges
(Rs/kVA/Yr)
Demand charges
(Rs/HP/Yr)
Energy Sales (MU)
Energy sales (MVAh)
Connected Load/ Contract
Demand (MW)
Connected Load/ Contract Demand
(HP)
Energy Charges
(Rs Crores)
Demand /Fixed charges
(Rs Crores)
Minimum Charges
(Rs Crores)
Customer Charges
(Rs crores)
Others (Rs Crores)
Gross Tariff Revenue
(Rs Crores)
Surcharge (Rs.Crs)
Additional Surcharge (Rs.Crs)
Direct Apportioned
LT Total - (Existing Categories) 4468667 10164.00 5592.00 8632.80 0.00 3123.26 4457992.03 1575.57 69.64 6.56 161.12 35.78 1848.67 0.00 1848.67 0.00 0.00 0.00 0.00 75.15 1923.82Category- Domestic (All) 3034707 0.00 0.00 2819.02 0.00 2048.42 0.00 754.95 0.00 4.91 107.76 9.84 877.46 0.00 877.46 0.00 24.54 902.00 Cat I(A) Domestic - upto 50 units/month 1340424 1.45 0 523.97 734.13 0.00 75.98 0.00 4.91 40.81 9.84 131.53 Cat I(B) Domestic - >50 and upto 100 units/month 1022218 0.00 0.00 893.24 0.00 656.07 0.00 161.71 0.00 0.00 37.35 0.00 199.06 0.00 24.54 24.54
0 - 50 units 0 1.45 - 613.33 - - 88.93 0.00 - - - 88.93 24.54 51 - 100 units 1022218 2.60 - 279.91 656.07 - 72.78 0.00 - 37.35 - 110.12
Cat I(c) Domestic- > 100 & upto 200 units/month 554075 0.00 0.00 955.77 0.00 487.40 0.00 277.59 0.00 0.00 23.62 0.00 301.20 0.00 0.00 0.000 - 50 units 0 2.60 - 332.44 - - 86.44 0.00 - - - 86.44
51 - 100 units 0 2.60 - 332.44 - - 86.44 0.00 - - - 86.44 101 - 150 units 359644 3.60 - 229.75 297.08 - 82.71 0.00 - 15.33 - 98.04 151 - 200 units 194431 3.60 - 61.13 190.32 - 22.01 0.00 - 8.29 - 30.29
Category I Domestic 117990 0.00 0.00 446.04 0.00 170.81 0.00 239.68 0.00 0.00 5.99 0.00 245.67 245.67 0.00 0.00 0.00 0.00 0.00 245.670 - 50 units 0 2.60 - 70.79 - - 18.41 0.00 - - - 18.4151 - 100 units 0 3.25 - 70.79 - - 23.01 0.00 - - - 23.01101 - 150 units 0 4.90 - 70.79 - - 34.69 0.00 - - - 34.69151 - 200 units 0 5.65 - 70.79 - - 40.00 0.00 - - - 40.00201 - 250 units 49609 6.80 - 53.59 55.68 - 36.44 0.00 - 2.42 - 38.86251 - 300 units 29193 7.30 - 30.41 37.80 - 22.20 0.00 - 1.42 - 23.62301 - 400 units 19908 7.80 - 29.92 30.80 - 23.34 0.00 - 1.09 - 24.43401 - 500 units 19280 8.50 - 48.94 46.54 - 41.59 0.00 - 1.06 - 42.65More than 500 units 0.00 0.00 0.00
Category II - Non-domestic/Commrl (A,B & C) 292629 4380.00 0.00 572.43 0.00 500.17 0.00 491.57 31.23 1.54 11.59 4.25 540.17 0.00 540.17 0.00 0.00 0.00 4.98 545.16Category II - Non-domestic/Commrl (A & B) 292285 3744.00 0.00 571.52 0.00 499.18 0.00 490.51 31.16 1.54 11.58 4.25 539.04 0.00 0.00Lt - II (A) upto 50 units 168383 600.00 0.00 38.08 0.00 162.07 0.00 20.56 9.72 1.54 6.00 4.25 42.07
0-50 units 168383 5.40 600.00 38.08 162.07 - 20.56 9.72 1.54 6.00 4.25 42.07Lt - II (B) above 50 units 123902 3144.00 0.00 533.44 0.00 337.11 0.00 469.95 21.44 0.00 5.58 0.00 496.97
0-50 units 0 6.60 600.00 74.22 - - 48.98 0.00 - - - 48.9851- 100 units 51569 7.80 636.00 56.65 50.73 - 44.19 3.23 - 2.14 - 49.56101- 300 units 43844 8.60 636.00 97.34 66.82 - 83.72 4.25 - 2.08 - 90.05301- 500 units 9624 9.10 636.00 50.18 30.64 - 45.66 1.95 - 0.46 - 48.07
Above 500 units 18865 9.70 636.00 255.05 188.92 - 247.40 12.02 - 0.90 - 260.31LT-II(C) Advertising Hoardings 344 11.70 636.00 0.90 0.99 - 1.06 0.06 - 0.01 - 1.13 0.00 1.13 1.13
Category III Industrial 20094 3648.00 0.00 247.05 0.00 457.90 0.00 155.59 29.06 0.00 4.25 21.19 210.09 0.00 210.09 0.00 0.00 0.00 2.15 212.24Category III - Industrial 20094 3648.00 0.00 247.05 0.00 457.90 0.00 155.59 29.06 0.00 4.25 21.19 210.09
Industrial Normal 18831 6.40 636.00 237.74 446.72 - 152.15 28.41 - 4.22 21.19 205.98Pisciculture/Prawn culture 0 7.10 636.00 - - - 0.00 0.00 - - - 0.00Sugarcane crushing 59 4.90 252.00 0.61 0.59 - 0.30 0.01 - 0.00 - 0.31Poultry farms 0 4.90 252.00 - - - 0.00 0.00 - - - 0.00Mushroom & Rabbit Farms 1204 3.60 600.00 8.70 10.58 - 3.13 0.63 - 0.03 - 3.80Floriculture in Green House 0 6.00 636.00 - - - 0.00 0.00 - - - 0.00Seasonal Industries 0 6.00 636.00 - - - 0.00 0.00 - - - 0.00
Category IV- Cottage &Agrobased Industries 4667 480.00 0.00 6.32 0.00 10.54 0.00 2.37 0.25 0.00 0.17 0.05 2.84 0.00 2.84 0.00 0.00 0.00 0.05 2.90Cat -IV(A) - Cottage Indstr. & Dhobhi Ghats 4627 3.75 240.00 6.28 10.42 - 2.36 0.25 - 0.17 0.05 2.83Cat -IV(B) - Agro based Industries 40 3.75 240.00 0.04 0.11 - 0.01 0.00 - 0.00 - 0.02
Category V (A,B & C) - Irrig & Agriculture 1050182 0.00 4440.00 4671.95 0.00 0.00 4355057.30 1.46 1.82 0.00 34.67 -5.49 32.46 0.00 32.46 0.00 0.00 0.00 40.67 73.13Category V(A&B) - Agriculture 1050113 0.00 4200.00 4671.93 0.00 0.00 4354461.13 1.45 1.80 0.00 34.67 -5.49 32.44
Cat V(A) - Agriculture with DSM measures 1046802 0.00 1050.00 4665.75 0.00 0.00 4343381.62 0.66 0.76 0.00 34.56 -5.49 30.50Corporate Farmers & IT Assesses 345 2.50 - - 0.98 - 1,685.83 0.24 0.00 - 0.01 (5.49) -5.23Wet Land Farmers (Holdings >2.5 acre) 2254 0.50 - 525.00 6.77 - 11,699.28 0.34 0.61 - 0.07 - 1.03Dry Land Farmers (Connections > 3 nos.) 700 0.50 - 525.00 1.62 - 2,844.67 0.08 0.15 - 0.02 - 0.25Wet Land Farmers (Holdings <= 2.5 acre) 294453 0.00 - - 1,547.49 - 1,408,638.39 0.00 0.00 - 9.72 - 9.72Dry Land Farmers (Connections <= 3 nos.) 749050 0.00 - - 3,108.89 - 2,918,513.45 0.00 0.00 - 24.73 - 24.73Cat V(B) - Agriculture with Non-DSM measures 3311 0.00 3150.00 6.18 0.00 0.00 11079.50 0.79 1.04 0.00 0.11 0.00 1.94Corporate Farmers & IT Assesses 243 3.50 - - 0.69 - 1,190.64 0.24 0.00 - 0.01 - 0.25Wet Land Farmers (Holdings >2.5 acre) 1861 1.00 - 1,050.00 3.31 - 5,965.01 0.33 0.63 - 0.06 - 1.02Dry Land Farmers (Connections > 3 nos.) 1207 1.00 - 1,050.00 2.18 - 3,923.86 0.22 0.41 - 0.04 - 0.67Wet Land Farmers (Holdings <= 2.5 acre) 0 0.50 - 525.00 - - - 0.00 0.00 - - - 0.00Dry Land Farmers (Connections <= 3 nos.) 0 0.50 - 525.00 - - - 0.00 0.00 - - - 0.00Category LT V(C) - Others 69.00 0.00 240.00 0.02 0.00 0.00 596.17 0.01 0.01 0.00 0.00 0.00 0.02 0.00 0.00 0.00 0.00
Rural Horticulture Nurseries 69 3.70 0.00 240.00 0.02 - 596.17 0.01 0.01 - 0.00 - 0.02Category VI - Local Bodies, St. Lighting & PWS 46563 1152.00 1152.00 277.34 0.00 49.07 102934.74 143.86 5.84 0.00 1.74 4.47 155.91 0.00 155.91 0.00 0.00 0.00 2.41 158.33
VI(A) - Street Lighting 23624 1152.00 0.00 110.00 0.00 49.07 0.00 64.90 1.88 0.00 0.88 4.47 72.13Panchayats 18198 5.70 384.00 79.73 36.45 - 45.44 1.40 - 0.68 4.47 51.99Municipalities 3189 6.20 384.00 16.60 6.71 - 10.29 0.26 - 0.12 - 10.67Muncipal Corporations 2237 6.70 384.00 13.67 5.91 - 9.16 0.23 - 0.08 - 9.47
VI(B) PWS Schemes 22939 0.00 1152.00 167.34 0.00 0.00 102934.74 78.97 3.95 0.00 0.86 0.00 83.78Panchayats 21191 4.60 0.00 384.00 151.49 - 93,751.75 69.69 3.60 - 0.80 - 74.08Muncipalities 1264 5.70 0.00 384.00 10.97 - 6,465.60 6.25 0.25 - 0.05 - 6.55Corporations 484 6.20 0.00 384.00 4.88 - 2,717.39 3.03 0.10 - 0.02 - 3.15
Category VII (A&B) 19825 504.00 0.00 38.69 0.00 57.17 0.00 25.77 1.44 0.11 0.94 -0.52 27.74 0.00 27.74 0.00 0.00 0.00 0.34 28.08Cat VII (A) - General Purpose 16148 6.90 252 33.81 29.41 - 23.33 0.74 0.11 0.77 (0.52) 24.43Cat VII-B - Religious Places (CL <=2KW) 3677.00 252.00 0.00 4.88 0.00 27.76 0.00 2.44 0.70 0.00 0.17 0.00 3.31
All units 3677 5.00 252 4.88 27.76 - 2.44 0.70 - 0.17 - 3.31Category VIII-Temporary Supply 0 0.00 0.00 0.00 0.00 0.00 0.00 0.00 0.00 0.00 0.00 1.99 1.99 0.00 1.99 0.00 0.00 0.00 1.99
Temp. Supply (for ALL UNITS) 0.00 0.00 1.99 1.99New L T Categories ( Total ) 0 0.00 0.00 0.00 0.00 0.00 0.00 0.00 0.00 0.00 0.00 0.00 0.00 0.00 0.00 0.00 0.00 0.00 0.00
0.00 0.00 0 0.00 0.00 0.00 0.00 0.00 0.000.00 0.00 0 0.00 0.00 0.00 0.00 0.00 0.000.00 0.00 0 0.00 0.00 0.00 0.00 0.00 0.000.00 0.00 0 0.00 0.00 0.00 0.00 0.00 0.000.00 0.00 0 0.00 0.00 0.00 0.00 0.00 0.00
0.00 0.00 0.00 0.00 0.00 0.000.00 0.00 0.00 0.00 0.00 0.000.00 0.00 0.00 0.00 0.00 0.000.00 0.00 0.00 0.00 0.00 0.00
0.00 0.000.00 0.000.00 0.000.00 0.000.00 0.000.00 0.00
Total Revenue( Net of incentives)
No of consumers
Full year revenue excluding external subsidyComponents of tariff
Consumer Categories
Surcharges(Open Access)
Net Revenue from Tariff
(Rs. Crores)
Relevant sales related data
Incentives(Rs. Crs)
Grid Support Charges
(Rs. Crores)
Non - tariff Income (Rs crores)
Page 186 of 195

0.00 0.000.00 0.000.00 0.000.00 0.000.00 0.000.00 0.000.00 0.000.00 0.000.00 0.000.00 0.000.00 0.000.00 0.000.00 0.00
TOTAL (LT including new categories) 4468667.0 8632.80 0.00 3123.26 4457992.03 1575.57 69.64 6.56 161.12 35.78 1848.67 0.00 1848.67 0.00 0.00 0.00 0.00 75.15 1923.82HIGH TENSION 2138 607.52 2325.36 926.89 0.00 1450.95 219.54 0.00 2.81 86.24 1759.54 0.00 1759.54 0.00 0.00 0.00 0.00 25.53 1785.07HT Category at 11 kV 2027 607.52 641.80 380.76 0.00 460.51 112.89 0.00 2.61 83.20 659.20 0.00 659.20 0.00 0.00 0.00 0.00 10.88 670.08
HT-I Indl General (Segregated) 1406 6.00 4440.00 395.27 208.14 237.16 92.42 0.00 1.82 34.23 365.62 0.00 365.62 0.00 0.00 0.00 3.44 369.06Lights & Fans 6.00 0.00 0.00 0.00 0.00 0.00 0.00 0.00 0.00 0.00 0.00 0.00 0.00Poultry farms 9 4.00 4440.00 6.55 2.28 2.62 1.01 0.00 0.01 0.00 3.64 3.64 0.06 3.70Industrial Colony consumption 5.00 0.00 1.31 0.00 0.66 0.00 0.00 0.00 0.00 0.66 0.66 0.01 0.67Seasonal Industries 7.30 4440.00 0.00 0.00 0.00 0.00 0.00 0.00 0.00 0.00 0.00 0.00 0.00HT-I Indrl. Time-of-Day Tariff (6 PM to 10 PM) 7.00 0.00 85.50 0.00 59.85 0.00 0.00 0.00 0.00 59.85 59.85 0.74 60.59HT - I( B) Ferro-alloys 5.70 0.00 0.00 0.00 0.00 0.00 0.00 0.00 0.00 0.00 0.00 0.00 0.00 0.00 0.00 0.00 0.00
HT-II - Others (Non- Industrial) 341 7.30 4440.00 79.00 41.20 57.67 18.29 0.00 0.43 11.03 87.42 0.00 87.42 0.00 0.00 0.00 0.69 88.10HT-II Others - Time-of-Day Tariff (6 PM to 10 PM) 0 8.30 0.00 20.38 0.00 16.91 0.00 0.00 0.00 0.00 16.91 16.91 0.18 17.09HT III: Airports, Bus Stations and Railway Stations 20 7.00 4440.00 6.34 2.13 4.44 0.95 0.00 0.02 0.16 5.56 0.00 5.56 0.00 0.00 0.00 0.06 5.62HT-III - Time-of-Day Tariff (6 PM to 10 PM) 8.00 0.00 1.63 0.00 1.31 0.00 0.00 0.00 0.00 1.31 1.31 0.01 1.32HT -IV A Lift Irrigation & Agriculture 169 5.70 0.00 13.72 45.66 7.82 0.00 0.00 0.23 27.58 35.62 0.00 35.62 0.00 0.00 0.00 0.12 35.74HT- IV B - CP Water Supply Schemes 65 4.60 0.00 17.64 12.84 8.11 0.00 0.00 0.08 0.00 8.20 0.00 8.20 0.00 0.00 0.00 0.15 8.35HT-VI - Townships & Colony Supply 16 6.00 636.00 14.48 3.37 8.69 0.21 0.00 0.02 2.79 11.71 0.00 11.71 0.00 0.00 0.00 0.13 11.84HT- VII Green Power 8.50 0.00 0.00 0.00 0.00 0.00 0.00 0.00 0.00 0.00 0.00 0.00 0.00 0.00 0.00 0.00 0.00HT- Temporary 0.00 0.00 0.00 0.00 0.00 0.00 0.00 0.00 2.44 2.44 0.00 2.44 0.00 0.00 0.00 0.00 2.44Rural co-operartives 1 0.91 0.00 607.52 65.12 55.28 0.00 0.00 0.00 4.98 60.26 0.00 60.26 0.00 0.00 0.00 5.29 65.55
0.00 0.00 0.00 0.00 0.00 0.00 0.00 0.00 0.000.00 0.00 0.00 0.00 0.00 0.00 0.00 0.00 0.000.00 0.00 0.00 0.00 0.00 0.00 0.00 0.00 0.000.00 0.00 0.00 0.00 0.00 0.00 0.00 0.00 0.000.00 0.00 0.00 0.00 0.00 0.00 0.00 0.000.00 0.00 0.00 0.00 0.000.00 0.00 0.00 0.00 0.000.00 0.00 0.00 0.00 0.000.00 0.00 0.00 0.00 0.000.00 0.00 0.00 0.00 0.00
HT Category at 33 kV 63 0.00 286.39 97.99 0.00 167.20 22.55 0.00 0.08 0.00 189.83 0.00 189.83 0.00 0.00 0.00 0.00 2.49 192.32HT-I Indl General (Segregated) 30 5.60 4440.00 140.87 41.97 78.89 18.63 0.00 0.04 0.00 97.56 0.00 97.56 0.00 0.00 0.00 1.23 98.79
Lights & Fans 0 5.60 0.00 0.00 0.00 0.00 0.00 0.00 0.00 0.00 0.00 0.00 0.00 0.00Poultry farms 0 0.00 0.00 0.00 0.00 0.00 0.00 0.00 0.00 0.00 0.00 0.00 0.00 0.00Industrial Colony consumption 0 6.00 0.00 0.00 0.00 0.00 0.00 0.00 0.00 0.00 0.00 0.00 0.00 0.00Seasonal Industries 0 6.60 4440.00 0.00 0.00 0.00 0.00 0.00 0.00 0.00 0.00 0.00 0.00 0.00HT-I Indrl. Time-of-Day Tariff (6 PM to 10 PM) 0 6.60 0.00 40.19 0.00 26.52 0.00 0.00 0.00 0.00 26.52 26.52 0.35 26.87HT - I( B) Ferro-alloys 1 5.30 0.00 26.39 0.07 13.99 0.00 0.00 0.00 0.00 13.99 0.00 13.99 0.00 0.00 0.00 0.23 14.22
HT-II - Others (Non- Industrial) 9 6.60 4440.00 10.62 7.60 7.01 3.38 0.00 0.01 0.00 10.40 0.00 10.40 0.00 0.00 0.00 0.09 10.49HT-II Others - Time-of-Day Tariff (6 PM to 10 PM) 0 7.60 0.00 2.86 0.00 2.17 0.00 0.00 0.00 0.00 2.17 2.17 0.02 2.20
HT III: Airports, Bus Stations and Railway Stations 0 6.40 4440.00 0.00 0.00 0.00 0.00 0.00 0.00 0.00 0.00 0.00 0.00 0.00 0.00 0.00 0.00 0.00HT-III - Time-of-Day Tariff (6 PM to 10 PM) 0 7.40 0.00 0.00 0.00 0.00 0.00 0.00 0.00 0.00 0.00 0.00 0.00 0.00
HT -IV A Lift Irrigation & Agriculture 14 5.70 0.00 21.63 39.71 12.33 0.00 0.00 0.02 0.00 12.35 0.00 12.35 0.00 0.00 0.00 0.19 12.54HT- IV B - CP Water Supply Schemes 2 4.60 0.00 0.05 0.18 0.02 0.00 0.00 0.00 0.00 0.02 0.00 0.02 0.00 0.00 0.00 0.00 0.02HT-VI - Townships & Colony Supply 7 6.00 636.00 43.78 8.46 26.27 0.54 0.00 0.01 0.00 26.82 0.00 26.82 0.00 0.00 0.00 0.38 27.20HT- VII Green Power 0 8.50 0.00 0.00 0.00 0.00 0.00 0.00 0.00 0.00 0.00 0.00 0.00 0.00 0.00 0.00 0.00 0.00HT- Temporary 0 0.00 0.00 0.00 0.00 0.00 0.00 0.00 0.00 0.00 0.00 0.00 0.00 0.00 0.00 0.00 0.00 0.00Rural co-operartives 0 0.91 0.00 0.00 0.00 0.00 0.00 0.00 0.00 0.00 0.00 0.00 0.00 0.00 0.00 0.00 0.00
0.00 0.00 0.00 0.00 0.00 0.00 0.00 0.00 0.000.00 0.00 0.00 0.00 0.00 0.00 0.00 0.00 0.000.00 0.00 0.00 0.00 0.00 0.00 0.00 0.00 0.000.00 0.00 0.00 0.00 0.000.00 0.00 0.00 0.00 0.000.00 0.00 0.00 0.00 0.000.00 0.00 0.00 0.00 0.000.00 0.00 0.00 0.00 0.000.00 0.00 0.00 0.00 0.000.00 0.00 0.00 0.00 0.00
HT Category at 132 kV 48 0.00 1397.17 448.14 0.00 823.24 84.10 0.00 0.12 3.04 910.51 0.00 910.51 0.00 0.00 0.00 0.00 12.16 922.67HT-I Indl General (Segregated) 19 5.10 4440.00 472.29 152.50 240.87 67.71 0.00 0.05 0.00 308.63 0.00 308.63 0.00 0.00 0.00 4.11 312.74
Lights & Fans 0 5.10 0.00 0.00 0.00 0.00 0.00 0.00 0.00 0.00 0.00 0.00 0.00 0.00Industrial Colony consumption 0 6.00 0.00 0.00 0.00 0.00 0.00 0.00 0.00 0.00 0.00 0.00 0.00 0.00Seasonal Industries 0 6.40 4440.00 0.00 0.00 0.00 0.00 0.00 0.00 0.00 0.00 0.00 0.00 0.00HT-I Indrl. Time-of-Day Tariff (6 PM to 10 PM) 0 6.10 0.00 98.65 0.00 60.18 0.00 0.00 0.00 0.00 60.18 60.18 0.86 61.03HT - I( B) Ferro-alloys 0 4.80 0.00 0.00 0.00 0.00 0.00 0.00 0.00 0.00 0.00 0.00 0.00 0.00 0.00 0.00 0.00 0.00
HT-II - Others (Non- Industrial) 5 6.40 4440.00 10.73 34.40 6.87 15.27 0.00 0.01 0.00 22.15 0.00 22.15 0.00 0.00 0.00 0.09 22.25HT-II Others - Time-of-Day Tariff (6 PM to 10 PM) 0 7.40 0.00 1.66 0.00 1.23 0.00 0.00 0.00 0.00 1.23 1.23 0.01 1.24
HT III: Airports, Bus Stations and Railway Stations 0 6.00 4440.00 0.00 0.00 0.00 0.00 0.00 0.00 0.00 0.00 0.00 0.00 0.00 0.00 0.00 0.00 0.00HT-III - Time-of-Day Tariff (6 PM to 10 PM) 0 7.00 0.00 0.00 0.00 0.00 0.00 0.00 0.00 0.00 0.00 0.00 0.00 0.00
HT -IV A Lift Irrigation & Agriculture 12 5.70 0.00 287.74 111.64 164.01 0.00 0.00 0.03 0.00 164.05 0.00 164.05 0.00 0.00 0.00 2.50 166.55HT- IV B - CP Water Supply Schemes 0 4.60 0.00 0.00 0.00 0.00 0.00 0.00 0.00 0.00 0.00 0.00 0.00 0.00 0.00 0.00 0.00 0.00HT-V – RailwayTraction 10 6.80 0.00 430.40 132.00 292.67 0.00 0.00 0.03 3.04 295.74 0.00 295.74 0.00 0.00 0.00 3.75 299.49HT-VI - Townships & Colony Supply 2 6.00 636.00 95.70 17.60 57.42 1.12 0.00 0.00 0.00 58.54 0.00 58.54 0.00 0.00 0.00 0.83 59.37HT- VII Green Power 0 8.50 0.00 0.00 0.00 0.00 0.00 0.00 0.00 0.00 0.00 0.00 0.00 0.00 0.00 0.00 0.00 0.00HT- Temporary 0 0.00 0.00 0.00 0.00 0.00 0.00 0.00 0.00 0.00 0.00 0.00 0.00 0.00 0.00 0.00 0.00 0.00Rural co-operartives 0 0.00 0.00 0.00 0.00 0.00 0.00 0.00 0.00 0.00 0.00 0.00 0.00 0.00 0.00 0.00 0.00 0.00
0.00 0.00 0.00 0.00 0.00 0.00 0.00 0.00 0.00 0.000.00 0.00 0.00 0.00 0.00 0.00 0.00 0.00 0.000.00 0.00 0.00 0.00 0.00 0.00 0.00 0.00 0.000.00 0.00 0.00 0.00 0.00 0.00 0.00 0.00 0.000.00 0.00 0.00 0.00 0.000.00 0.00 0.00 0.00 0.000.00 0.00 0.00 0.00 0.000.00 0.00 0.00 0.00 0.000.00 0.00 0.00 0.00 0.000.00 0.00 0.00 0.00 0.00
TOTAL( LT + HT) 4470805 9240.32 2325.36 4050.15 4457992.03 3026.53 289.17 6.56 163.94 122 3608.21 0.00 3608.21 0.00 0.00 0.00 0.00 100.68 3708.89
Page 187 of 195

APPENDIX –F
COST OF SERVICE (CoS) FILING FORMATS
Page 188 of 195

Company Name TSNPDCL Base Year FY 2013-14Filing Date (dd/mm/yy) 30/11/2016 1st year FY 2014-15
Multi Year Tariff Period FY 2014-2019 2nd Year FY 2015-16
Year of ARR filing FY 2017-18 3rd Year FY 2016-17
Data Type CoS Inputs 4th year FY 2017-18
5th year FY 2018-19
1 New Consumer Categories Form 12 ARR -Retail Supply Business Form 23 Percentage Cost Allocation Form 34 Cost Allocation Factors Form 45 Transmission Contracts Form 56 Percentage Losses Form 67 Classification of Asset Base Form 7
S. No. Title Form No.
Page 189 of 195

Form 2 Aggregate Revenue Requirement for Retail Supply Business
Demand Energy Customer Demand Energy Customer1 Transmission Cost2 SLDC Cost3 Distribution Cost4 PGCIL Expenses5 ULDC Charges6 Network and SLDC Cost (1+2+3+4+5) 0.00 0.00 0.00 0.00 0.00 0.00 0.00 0.007 Power Purhcase / Procurement Cost8 Interest on Consumer Security Deposits9 Supply Margin in Retail Supply Business
10 Other Costs, if any11 Supply Cost (7+8+9+10) 0.00 0.00 0.00 0.00 0.00 0.00 0.00 0.0012 Aggregate Revenue Requirement (6+11) 0.00 0.00 0.00 0.00 0.00 0.00 0.00 0.00
Demand Energy Customer Demand Energy Customer1 Transmission Cost 472.27 472.272 SLDC Cost 13.04 13.043 Distribution Cost 1632.93 1357.81 69.86 205.264 PGCIL Expenses 372.48 372.485 ULDC Charges 3.32 3.326 Network and SLDC Cost (1+2+3+4+5) 0.00 0.00 0.00 0.00 2494.05 2218.94 69.86 205.267 Power Purhcase / Procurement Cost 7326.43 3375.65 3950.798 Interest on Consumer Security Deposits 46.52 46.529 Supply Margin in Retail Supply Business 13.14 13.14
10 Other Costs, if any 5.75 5.7511 Supply Cost (7+8+9+10) 0.00 0.00 0.00 0.00 7391.84 3381.39 3950.79 59.6612 Aggregate Revenue Requirement (6+11) 0.00 0.00 0.00 0.00 9885.89 5600.33 4020.65 264.92
Cost Allocation(Rs crores)
FY 2014-15Cost Allocation
(Rs crores)Amount (Rs crores)
Amount (Rs crores)
Cost Allocation(Rs crores)Revenue Requirement Item
FY 2017-18
Revenue Requirement Item
FY 2016-17
Amount (Rs crores)
Cost Allocation(Rs crores)
FY 2013-14
Amount (Rs crores)
Page 190 of 195

Demand Energy Customer Demand Energy Customer
Total Power Purchase Cost0.00 7326.43
Fixed Cost 3270.85 100.00
Variable Cost 3950.79 100.00
Incentive 0.00 100.00
Income Tax 0.00 100.00
Others 104.79 100.00
Interest on Consumer Security Deposits 46.52 100.00
Supply Margin in Retail Supply Business 13.14 100.00
Other Costs, if any 5.75 100.00
Total Supply Cost 0.00 7391.84
ParticularsFY 2016-17 FY 2017-18
Amount (Rs crores)
% allocation Amount (Rs crores)
% allocation
Page 191 of 195

Form 4 Cost Allocation Factor
FY 2017-18
Energy MU
Capacity MW
Commercial Loss
%
Non-coincident Demand
%
Coincident Demand Morning
%
Coincident Demand Evening
%
Class Load
Factor
Class Coincidence Factor - Morning
Class Coincidence
Factor - Evening
LT Category 9869.65 6965.15 4804231 0.00 7386.34Category I Domestic 3343.33 2201.99 3262231 29.81 0.30 0.32 0.32 0.80 0.97 0.97 2646.36 7.92Category II - Non-domestic/Commercial 667.03 547.87 320505 5.95 6.47 6.22 6.22 74.34 86.69 86.69 512.83 7.69Category III (A & B) - Industrial 248.08 486.54 21392 2.21 2.20 2.14 2.14 81.67 87.10 87.10 177.69 7.16Category IV - Cottage Industries & Dhobighats 6.65 11.62 5147 0.06 0.06 0.06 0.06 81.67 87.10 87.10 4.97 7.48Category V (A), A(I) & A(II) - Irrigation and Agriculture 5263.65 3513.67 1121172 46.93 44.79 45.53 45.53 84.75 90.16 90.16 3777.95 7.18Category V (B) - Agriculture (Tatkal)Category VI - Local Bodies, St. Lighting & PWS 292.03 139.24 51513 2.60 4.35 1.97 1.97 48.38 40.65 40.65 228.05 7.81Category VII (A &B) - General & Religious Purposes 48.89 64.23 22271 0.44 0.46 0.50 0.50 76.38 96.88 96.88 38.49 7.87Category VIII-Temporary Supply 0.00 0.00 0 0.00 0.00 0.00 0.00 0.00
HT Category at 11 KV 1494.85 465.32 2420 0.00 989.76HT-I Industry Segregated 557.59 267.50 1707 4.48 4.34 4.27 4.27 83.38 87.77 87.77 419.51 7.52HT-II Industrial Non-Segregated 128.42 54.21 418 1.03 1.10 0.87 0.87 77.15 72.24 72.24 88.55 6.90HT-IV A Govt. Lift Irrigation Schemes 96.04 69.68 276 0.77 0.65 0.73 0.73 96.38 100.00 100.00 83.56 8.70HT-IV B AgricultureHT-IVC - Composite Public Water Supply SchemesHT-VI Townships and Residential Colonies 13.06 3.60 18 0.10 0.11 0.10 0.10 75.16 76.83 76.83 8.40 6.43HT-VII - Green PowerRESCOs 699.74 70.33 1 5.62 5.20 5.14 5.14 87.44 88.60 88.60 389.74 5.57Temporary Supply
HT Category at 33 KV 508.32 116.47 75 0.00 297.67HT-I Industry Segregated 184.21 55.90 38 0.00 0.00 0.00 0.00 92.40 88.75 88.75 112.34 6.10HT-I (B) Ferro-AlloysHT-II Industrial Non-Segregated 13.39 8.85 12 0.00 0.00 0.00 0.00 72.20 73.76 73.76 10.58 7.90HT-IV A Govt. Lift Irrigation Schemes 263.92 43.26 18 0.00 0.00 0.00 0.00 97.52 100.00 100.00 147.05 5.57HT-IV B AgricultureHT-IVC - Composite Public Water Supply SchemesHT-VI Townships and Residential Colonies 46.79 8.46 7 0.00 0.00 0.00 0.00 75.16 76.07 76.07 27.70 5.92HT-VII - Green PowerRESCOsTemporary Supply
HT Category at 132 KV 1992.84 536.20 50 100.00 1212.12HT-I Industry Segregated 694.65 152.50 19.00 0.00 0.00 0.00 0.00 87.82 100.00 100.00 402.00 5.79HT-II Industrial Non-Segregated 3.38 14.40 4.00 0.00 0.00 0.00 0.00 63.83 70.00 70.00 8.10 23.97HT-IV A Govt. Lift Irrigation Schemes 767.71 219.70 15.00 0.00 0.00 0.00 0.00 76.46 96.63 96.63 488.85 6.37HT-IV B AgricultureHT-IVC - Composite Public Water Supply Schemes
HT-V Railway Traction 422.91 132.00 10.00 0.00 0.00 0.00 0.00 80.77 87.45 87.45 257.95 6.10HT-VI Townships and Residential Colonies 104.19 17.60 2.00 0.00 0.00 0.00 0.00 75.16 75.32 75.32 55.21 5.30HT-VII - Green PowerRESCOsTemporary SupplyTotal 13865.66 8083.14 4806776 100.00 9885.89 7.13
Consumer Category
Sales
Number of Consumers
Load (MVA / MW) - HP
Converted to MVA
Approved
Commercial Loss
Remarks
FACTORS
Cost allocation
(Rs Cr)
Cost to Serve (Rs/
kWh)
Page 192 of 195

Form 5 Transmission Contracts
FY 2013-14 FY 2014-15 FY 2015-16Total Installed Generation Capacity - Discom's Share (MW)Transmission Contracts of Discoms with TSTransco (MW/MVA)Transmission Contracts of Discoms with PGCIL (MW/MVA)
Discom's Share in CGS (MW)Discom's NCP (MW)Discom's CP (MW)
FY 2016-17 FY 2017-18 FY 2018-19Total Installed Generation Capacity - Discom's Share (MW) 4249.64Transmission Contracts of Discoms with TSTransco (MW/MVA) 2292.48Transmission Contracts of Discoms with PGCIL (MW/MVA) 513.41
Discom's Share in CGS (MW) 603.14Discom's NCP (MW) 1946.47Discom's CP (MW) 1743.87
RemarksParticulars FY 2013-14 FY 2014-15 FY 2015-16
Particulars FY 2017-18 FY 2018-19Remarks
FY 2016-17
Page 193 of 195
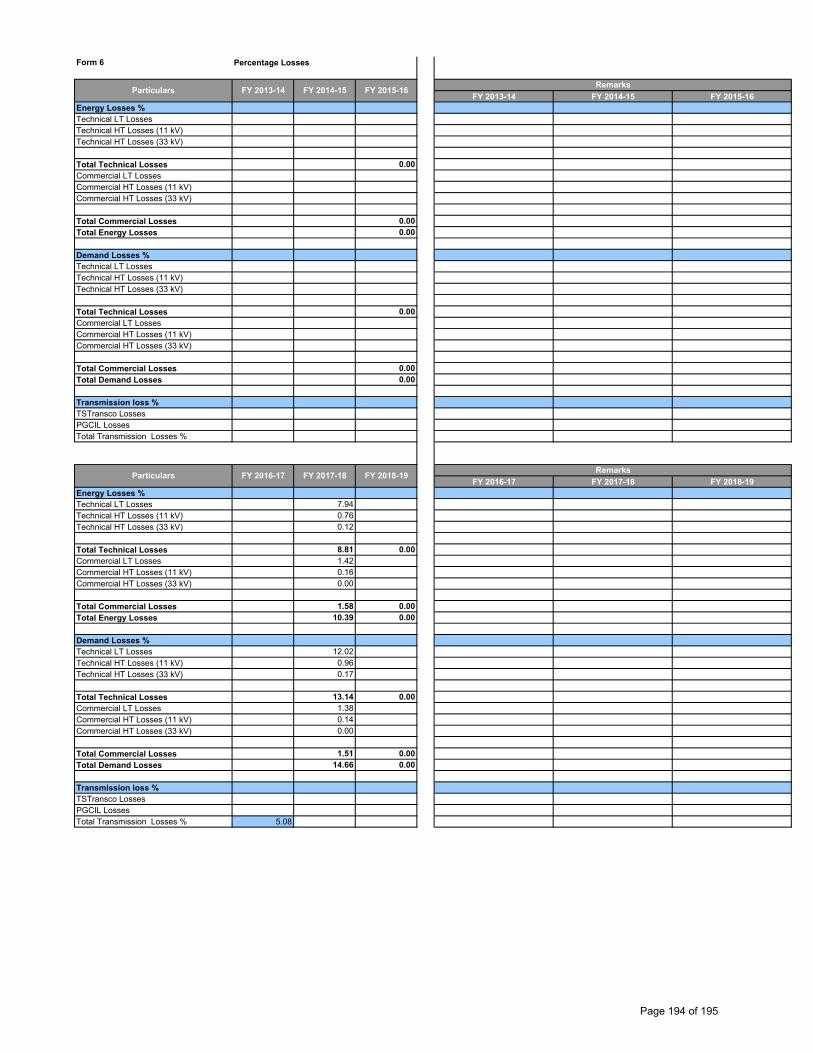
Form 6 Percentage Losses
FY 2013-14 FY 2014-15 FY 2015-16Energy Losses %Technical LT LossesTechnical HT Losses (11 kV)Technical HT Losses (33 kV)
Total Technical Losses 0.00Commercial LT LossesCommercial HT Losses (11 kV)Commercial HT Losses (33 kV)
Total Commercial Losses 0.00Total Energy Losses 0.00
Demand Losses %Technical LT LossesTechnical HT Losses (11 kV)Technical HT Losses (33 kV)
Total Technical Losses 0.00Commercial LT LossesCommercial HT Losses (11 kV)Commercial HT Losses (33 kV)
Total Commercial Losses 0.00Total Demand Losses 0.00
Transmission loss %TSTransco LossesPGCIL LossesTotal Transmission Losses %
FY 2016-17 FY 2017-18 FY 2018-19Energy Losses %Technical LT Losses 7.94Technical HT Losses (11 kV) 0.76Technical HT Losses (33 kV) 0.12
Total Technical Losses 8.81 0.00Commercial LT Losses 1.42Commercial HT Losses (11 kV) 0.16Commercial HT Losses (33 kV) 0.00
Total Commercial Losses 1.58 0.00Total Energy Losses 10.39 0.00
Demand Losses %Technical LT Losses 12.02Technical HT Losses (11 kV) 0.96Technical HT Losses (33 kV) 0.17
Total Technical Losses 13.14 0.00Commercial LT Losses 1.38Commercial HT Losses (11 kV) 0.14Commercial HT Losses (33 kV) 0.00
Total Commercial Losses 1.51 0.00Total Demand Losses 14.66 0.00
Transmission loss %TSTransco LossesPGCIL LossesTotal Transmission Losses % 5.08
Particulars FY 2013-14 FY 2014-15
Particulars FY 2016-17 FY 2017-18 FY 2018-19
FY 2015-16 Remarks
Remarks
Page 194 of 195

Form 7 Classification of Asset Base
Demand Energy Customer Demand Energy Customer Demand Energy CustomerAssets Base for DiscomLand & RightsBuildingsHydraulic WorksOther Civil WorksPlant & MachineryLines, Cable, Network, etc.VehiclesFurniture and FixturesOffice EquipmentsSpare parts and other assetsBorrowings for Working CapitalLess: Contribution, Grants, SubsidiesTotal Assets With Adjustments 0.00 0.00 0.00
Voltage wise-Distibution Assets 0.00 0.00 0.00LT
11kV33kV
Assets Base for GenerationTotal Assets
Assets Base for TransmissionTotal Assets
Form 7 Classification of Asset Base
Demand Energy Customer Demand Energy Customer Demand Energy CustomerAssets Base for DiscomLand & Rights 4.80 80.00 20.00Buildings 137.73 80.00 20.00Hydraulic Works 0.00 80.00 20.00Other Civil Works 0.00 80.00 20.00Plant & Machinery 3268.75 80.00 20.00Lines, Cable, Network, etc. 2743.74 80.00 20.00Vehicles 2.96 80.00 20.00Furniture and Fixtures 3.87 80.00 20.00Office Equipments 21.01 80.00 20.00Spare parts and other assets 457.32 80.00 20.00Borrowings for Working Capital 80.00 20.00Less: Contribution, Grants, Subsidies 1221.37 80.00 20.00Total Assets With Adjustments 0.00 5,418.80 0.00
Voltage wise-Distibution Assets 0.00 5,418.80 0.00LT 318.93
11kV 2318.5133kV 2781.37
Assets Base for GenerationTotal Assets
Assets Base for TransmissionTotal Assets
Asset
FY 2016-17 FY 2017-18 FY 2018-19
Total AssetsRs crores
% allocationTotal Assets
Rs crores
% allocationTotal Assets
Rs crores
% allocation
FY 2015-16
Asset Total AssetsRs crores
FY 2014-15
Total AssetsRs crores
% allocationFY 2013-14
% allocationTotal Assets
Rs crores
% allocation
Page 195 of 195