EASTERN POWER DISTRIBUTION COMPANY OF A.P ...
255
EASTERN POWER DISTRIBUTION COMPANY OF A.P LIMITED CORPORATE OFFICE : :VISAKIIAPATNAM From The Chief General Manager, PPA , RA&QC APEPDCL, Corporate Office, Seethammadhara, To The Secretary, APERC, 11-4-660, 4th Floor, Singareni Bhavan, Red Hills Lakdikapul, Hyderabad-04. Visakhapatnam-13. LrNo._CGMRPA. RA&OCIAPEPDC,LIVspf tIAcn}.No. \l.q` /2020 dt. £v!±]±f l2f i Sir, Sub : APEPDCL, VSP - Submission of ARR & Tariff Proposals for the FY 2021 -22 -Submitted -Regarding. Ref : APERC Proceedings. No.T-87/07/2020 Date: 17-09-2020 *** In compliance to the directions of the Hon'ble Commission, the licensee is herewith submitting the Aggregate Revenue Requirement for Retail sale and Tariff Proposals for FY 2021-22 along with Cross subsidy surcharge for FY 2021-22 for kind consideration of Hon'ble APERC. Encl:-ARR & Tariff proposals in 6 original copies Yours faithfully,
-
Upload
khangminh22 -
Category
Documents
-
view
0 -
download
0
Transcript of EASTERN POWER DISTRIBUTION COMPANY OF A.P ...

EASTERN POWER DISTRIBUTION COMPANY OF A.P LIMITEDCORPORATE OFFICE : :VISAKIIAPATNAM
From
The Chief General Manager,PPA , RA&QCAPEPDCL, Corporate Office,Seethammadhara,
To
The Secretary, APERC,11-4-660, 4th Floor,
Singareni Bhavan, Red HillsLakdikapul, Hyderabad-04.
Visakhapatnam-13.
LrNo._CGMRPA. RA&OCIAPEPDC,LIVspf tIAcn}.No. \l.q` /2020 dt. £v!±]±f l2f i
Sir,Sub : APEPDCL, VSP - Submission of ARR & Tariff Proposals for the
FY 2021 -22 -Submitted -Regarding.
Ref : APERC Proceedings. No.T-87/07/2020 Date: 17-09-2020
***
In compliance to the directions of the Hon'ble Commission, the licensee is
herewith submitting the Aggregate Revenue Requirement for Retail sale and Tariff
Proposals for FY 2021-22 along with Cross subsidy surcharge for FY 2021-22 for kind
consideration of Hon'ble APERC.
Encl:-ARR & Tariff proposals in 6 original copies
Yours faithfully,
E
~
*
-EI
i
BEFORE THE HONOURABLE ANDHRA PRADESH ELECTRICITY REGULATORY COMMISSION
AT ITS OFFICE AT 4th FLOOR, SINGARENI BHAVAN, RED HILLS, HYDERABAD
FILING NO.______/2020
CASE NO. _______/2020
In the matter of: Filing of the ARR application in respect of Retail Supply Business and proposed Tariffsfor the FY 2021-22 under multi-year tariff principles in accordance with the “Andhra Pradesh
Electricity Regulatory Commission (Terms And Conditions For Determination Of Tariff For Wheeling And Retail Sale Of Electricity) Regulation, 2005” by the Eastern Power Distribution Company of Andhra Pradesh Limited („APEPDCL‟ or „the Company‟ or „the
Licensee‟) as the Distribution and Retail Supply Licensee.
In the matter of:
EASTERN POWER DISTRIBUTION COMPANY OF ANDHRA PRADESH LIMITED
… Applicant
AFFIDAVIT OF APPLICANT VERIFYING THE APPLICATION ACCOMPANYING FILING AS PER TERMS AND CONDITIONS OF TARIFF FOR WHEELING AND RETAIL SALE OF ELECTRICITY
I, Sri N. Gangadhar, son of Sri N. Pallarao, aged about 58 Years, working for gain at the Eastern Power Distribution Company of Andhra Pradesh Limited do solemnly affirm and say as follows:
1 I am the Chief General Manager/PPA, RA& QC of APEPDCL, the Licensee that has, vide the
Honourable Commission‟s approval in proceedings no. APERC/Secy/Engg/No.6, dt.31.3.2000, been granted the distribution and retail supply functions that APTransco was authorised to conduct or carry out under the Act and the license, with respect to the business of distribution and retail supply of electricity in the Eastern distribution zone in Andhra Pradesh. On December 27, 2000, the Honourable Commission has awarded a Distribution and Retail Supply License to APEPDCL, to be effective from April 1, 2001. I am competent and duly authorised by APEPDCL to affirm, swear, execute and file this affidavit in the present proceedings.
2 As such, I submit that I have been duly authorised by the Board of Directors of APEPDCL to
submit the application, as per Terms and Conditions of Tariff for Wheeling and Retail Sale of Electricity (Regulation 4 of 2005) of APEPDCL for the FY 2021-22 to the Honourable Commission.

3 I submit that I have read and understood the contents of the appended application ofAPEPDCL. The facts stated in the application are true to the best of my knowledge, which arederived from the official records made available and certain facts stated are based oninformation and advice which, I believe to be true and correct.
I submit that for the reasons, and facts stated in the appended application this Applicant praythat the Honourable Commission may be pleased to
(a) Take the accompanying ARR, Tariff Proposal along with Cross Subsidy SurchargeApplication of APEPDCL on record and treat it as complete;
(b) Grant suitable opportunity to APEPDCL within a reasonable time frame to fileadditional material information that may be subsequently available;
(c) Consider and approve APEPDCL's ARR and Tariff application including allrequested regulatory treatments in the filing;
(d) Pass such order as the Honourable Commission may deem fit and proper in the factsand circumstances of the case.
VERIFICATION:A.E?Etp#.!.efu\ `
VIS^KHARATqut9-I, the above named Deponent solemnly affim at Visakhapatnam on this2,? day of November,
2020 that the contents of the above affidavit are true to my knowledge, no part of it is false and
nothing material has been concealed there from.
so'i€i!.iyva.ffi+inedJa#rgrrfforemeLfam pamy secr©ungrte
cORP®RATE OFFICEEastrm REer Distribution
Comp&.tip Of A.P+ Ltd.,`'TqA.KHAPATNAM
A.E?##.S.efulvisAKLne.RE
iii
BEFORE THE HONOURABLE ANDHRA PRADESH ELECTRICITY REGULATORY COMMISSION
AT ITS OFFICE AT 4th FLOOR, SINGARENI BHAVAN, RED HILLS, HYDERABAD 500 004
FILING NO.______/2020
CASE NO. _______/2020
In the matter of:
Filing of the ARR application in respect of Retail Supply Business and proposed Tariffs for the FY 2021-22 under multi-year tariff principles in accordance with the “Andhra Pradesh
Electricity Regulatory Commission (Terms And Conditions For Determination Of Tariff For Wheeling And Retail Sale Of Electricity) Regulation, 2005 and First Amendment Regulation, 2014” by the Eastern Power Distribution Company of Andhra Pradesh Limited („APEPDCL‟ or „the Company‟ or „the Licensee‟) as the Distribution and Retail Supply
Licensee.
In the matter of:
EASTERNPOWER DISTRIBUTION COMPANY OF ANDHRA PRADESH LIMITED
… Applicant
The Applicant respectfully submits as under:
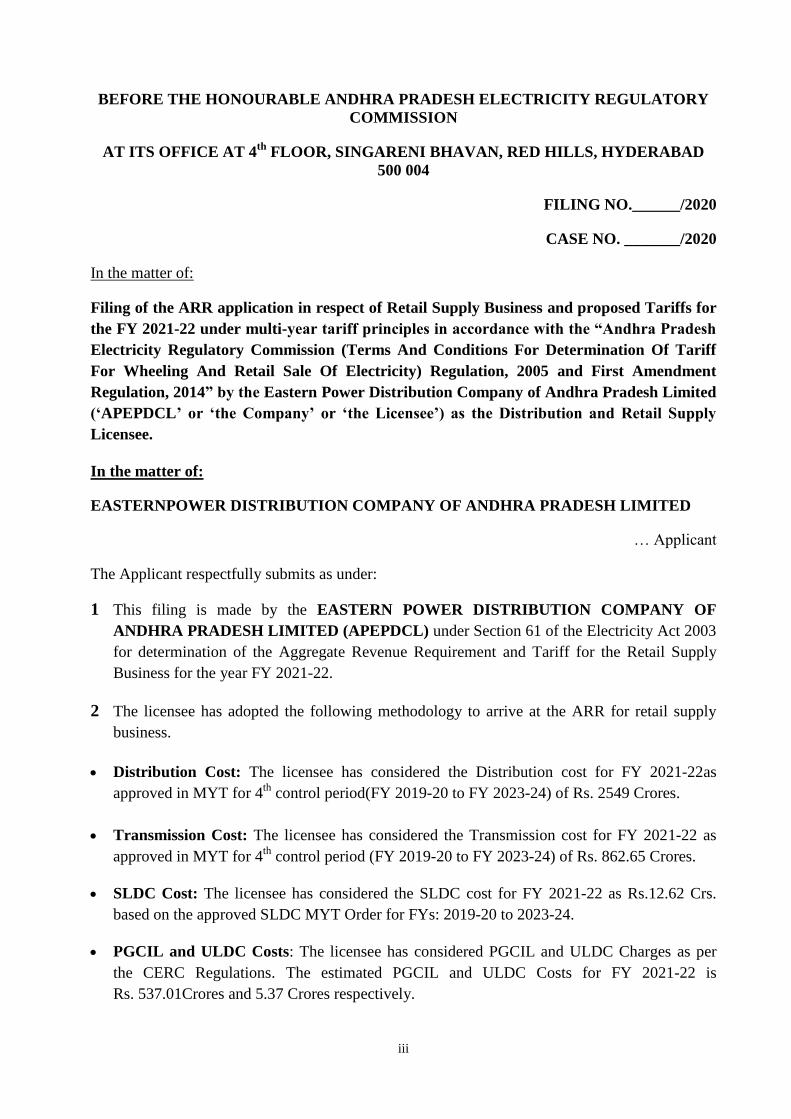
1 This filing is made by the EASTERN POWER DISTRIBUTION COMPANY OF ANDHRA PRADESH LIMITED (APEPDCL) under Section 61 of the Electricity Act 2003 for determination of the Aggregate Revenue Requirement and Tariff for the Retail Supply Business for the year FY 2021-22.
2 The licensee has adopted the following methodology to arrive at the ARR for retail supply business.
Distribution Cost: The licensee has considered the Distribution cost for FY 2021-22as approved in MYT for 4th control period(FY 2019-20 to FY 2023-24) of Rs. 2549 Crores.
Transmission Cost: The licensee has considered the Transmission cost for FY 2021-22 as approved in MYT for 4th control period (FY 2019-20 to FY 2023-24) of Rs. 862.65 Crores.
SLDC Cost: The licensee has considered the SLDC cost for FY 2021-22 as Rs.12.62 Crs. based on the approved SLDC MYT Order for FYs: 2019-20 to 2023-24.
PGCIL and ULDC Costs: The licensee has considered PGCIL and ULDC Charges as per the CERC Regulations. The estimated PGCIL and ULDC Costs for FY 2021-22 is Rs. 537.01Crores and 5.37 Crores respectively.
iv
Distribution losses: The licensee has considered losses for FY 2021-22as approved for 4th control period (FY 2019-20 to FY 2023-24) as LT:3.97%, 11kV:3.10%& 33kV:2.77%.
Transmission &PGCIL Losses: The Licensee has considered the Transmission loss as approved for 4th Control period(FY 2019-20 to FY 2023-24) and added 0.4% towards external CTU losses as 3.46% (including external PGCIL losses) .
3 Filing of Retail Supply ARR for FY 2021-22
As per Regulation No. 4 of 2005, the licensee is required to file the Aggregate Revenue Requirement (ARR) for Retail Supply Business and Tariff proposal for the entire control period i.e., for the period from FY 2019-20 to FY 2023-24. However, the licensee requested the Honourable Commission to allow for submission of the ARR and Tariff filing for Retail Supply Business for FY 2021-22 on yearly basis.
The Honourable Commission has been kind enough in granting permission to submit the ARR & Tariff petitions relating to Retail Supply Business on Annual basis for FY 2021-22 vide APERC proceeding number T-87/07/2020, Dated:17.09.2020.
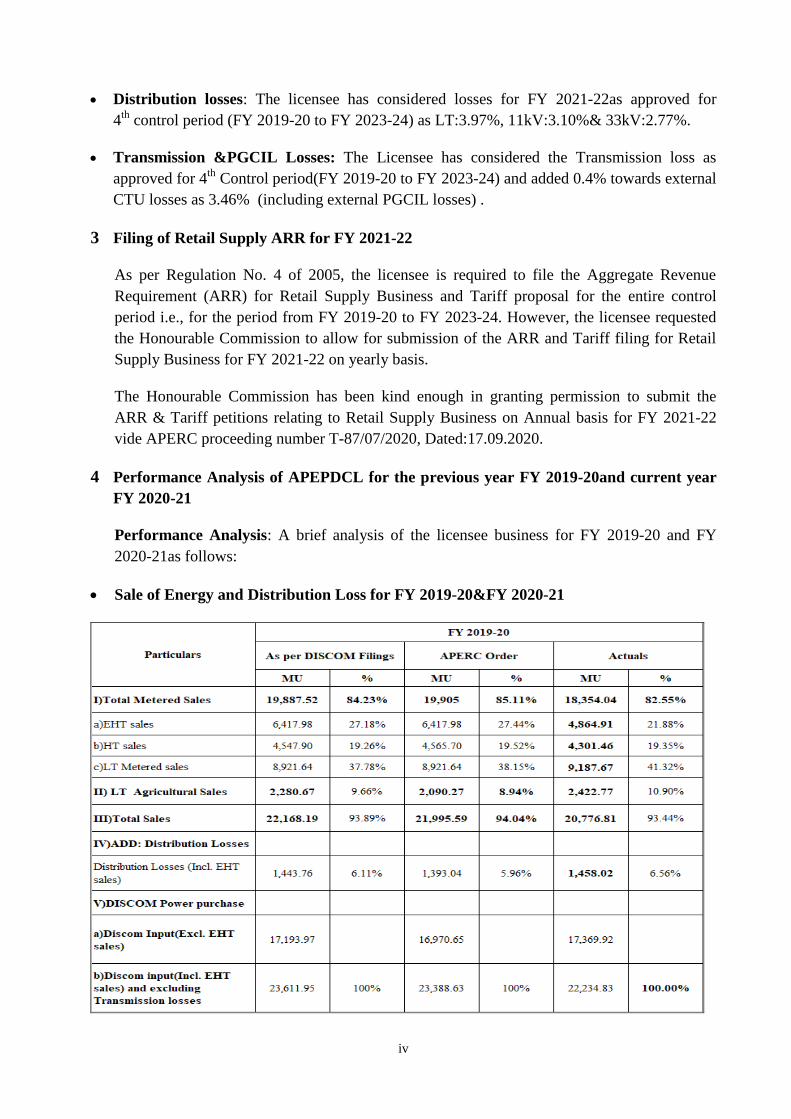
4 Performance Analysis of APEPDCL for the previous year FY 2019-20and current year FY 2020-21
Performance Analysis: A brief analysis of the licensee business for FY 2019-20 and FY 2020-21as follows:
Sale of Energy and Distribution Loss for FY 2019-20&FY 2020-21

v
Revenue
The table below shows a comparison of the revenue from various consumer categories as approved in the Tariff Order and as billed (FY 2019-20) and expected to be billed (FY 2020-21) by APEPDCL.
Category Wise Revenue: (Figures shown in Rs Crores)

vi
5 Retail Supply Business Provisional True-up for FY 2019-20
Hon‟ble Commission has issued orders on 26.11.2020 on the Petitions filed by the licensee for True-up claims in respect of Retail Supply Business for FY 2014-15, FY2016-17, FY 2017-18 and FY 2018-19.
The provisional True-up/down of power purchase cost for FY 2019-20 as per the latest information is given below. The annual accounts for FY 2019-20 are under finalization. Necessary Statutory Audit has been commenced and C&AG audit to be completed. Once Audit is completed the DISCOM will file True-Up/ True-Down petition in pursuant to the regulations. Liberty may be granted to the DISCOM to file True-Up/ True-Down for FY 2019-20 upon completion of the Audit please
The station wise estimated power purchase cost for FY 2019-20 is as per Retail Supply Format No.1.4 PP Cost.
6 ARR Projections for FY 2021-22
Sales Estimates for FY 2021-22
1. The licensee has been adopting Compounded Annual Growth Rate (CAGR) with adjustments, based approach for Sales forecasting for the purpose of Annual ARR filings for Retail Supply Business (RSB)for several years. The CAGR forecast takes into account the first year and the last year of the historical period in the formula and all the observed values in the intermediate years are left unprocessed. In the past Annual Sales for the ensuing year are forecasted first based on CAGR approach and monthly split of the sales was carried out based on same proportion/ratio of the sales in previous year.
2. The CAGR based approach is observed to forecast the sales in an exponential manner rather than on a linear line. Annual ARR exercise requires sales forecast for a shorter period of one to one & half years unlike for a Multi-Year Tariff Exercise which requires for 5 years. But in linear trend approach which is dependent on regression analysis devising a linear equation, all the values of the observed time period in the history are mathematically involved in the analysis and amply considered.
3. In view of the above, Licensee is attempting to deviate from CAGR approach to Monthly Trend based on Time Series Data approach for forecasting of sales for Annual ARR exercise, in the present filings.

vii
4. The Monthly Linear Trend method is a time series model of sales forecasting which assumes that the underlying factors, which drive the demand for electricity, are expected to follow the same monthly /annual trend as in the past and hence the forecast for electricity is also based on the assumption that the past trend in consumption of electricity will continue in the future. The strength of this method, when used with balanced judgment, lies in its ability to reflect recent changes and therefore is probably best suited for a short-term projection as used for the ARR/ Tariff filing.
5. However, the trend-based approach has to be adjusted for judgment on the characteristics of the specific consumer groups/ categories. For example, while this method may provide a better estimate of consumption by the domestic and commercial, Industrial & Institutional categories of consumers, it may not be very suitable for the Agriculture / Lift Irrigation category because of the high dependence of demand on the end-use.
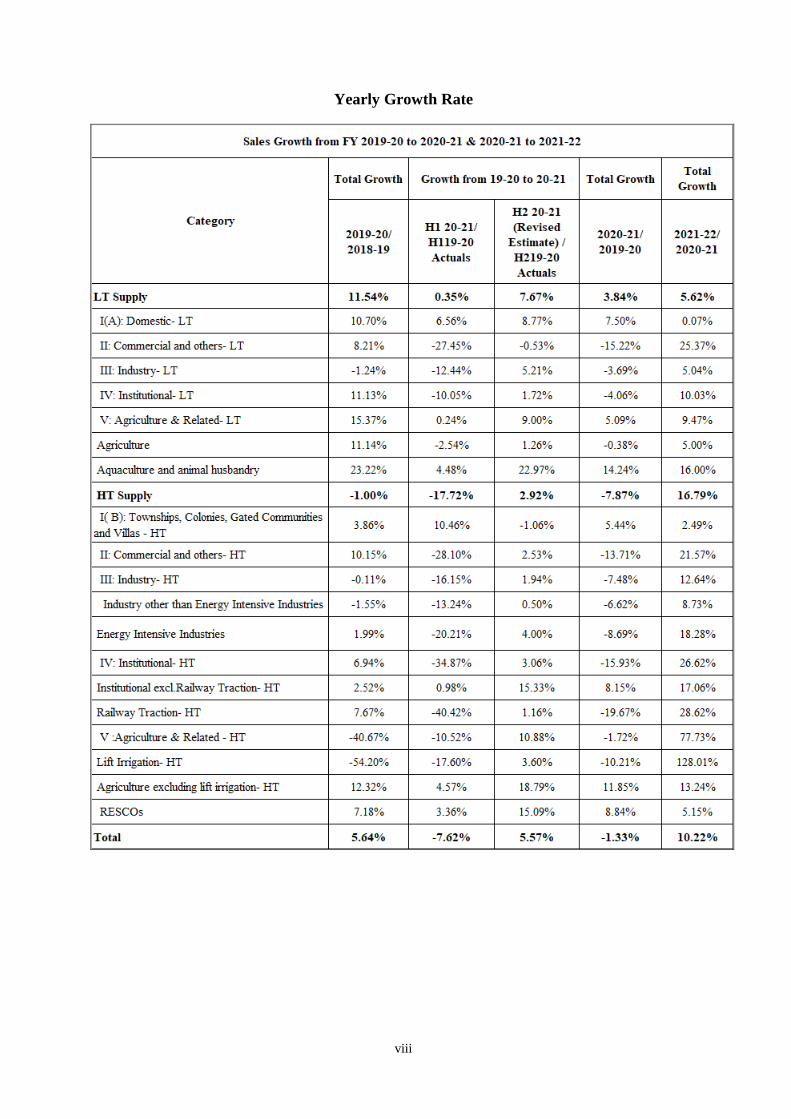
6. Sales forecast is carried out based on actuals for the period from FY 2014-15 to FY 2019-20. The forecast is carried out based on time series data from October‟20 to March‟22. The total sales forecast for key categories is as follows:
viii
Yearly Growth Rate
ix
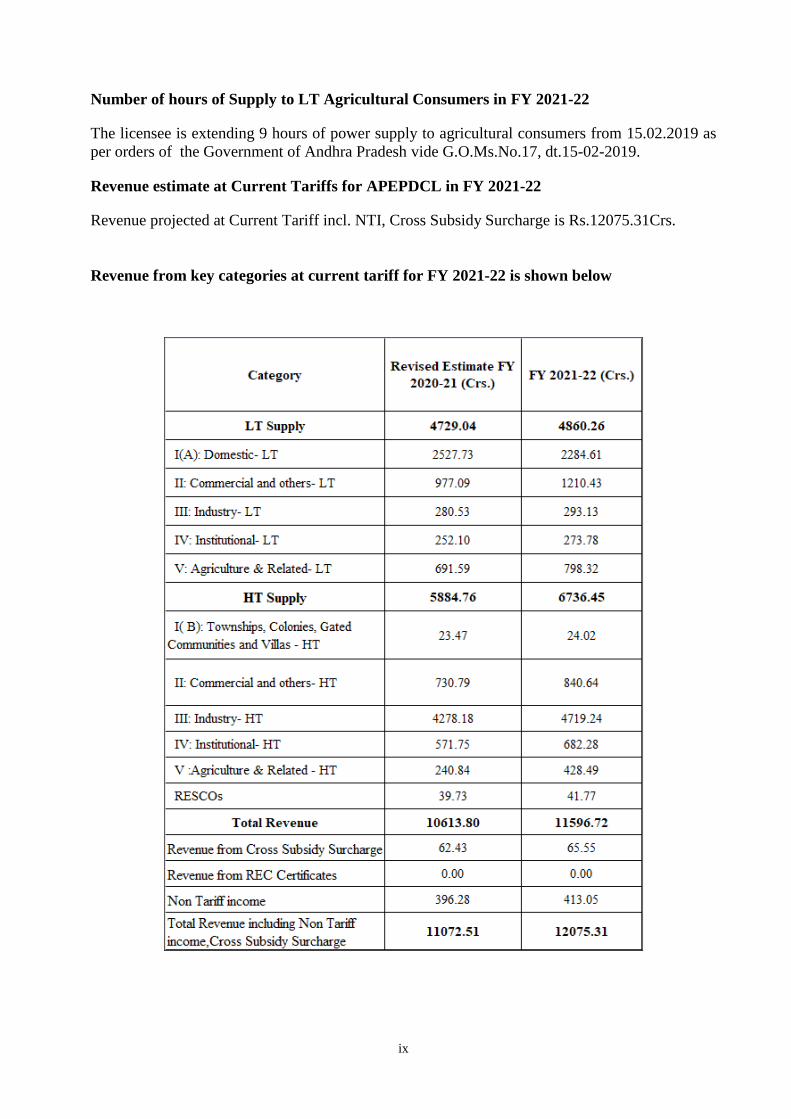
Number of hours of Supply to LT Agricultural Consumers in FY 2021-22
The licensee is extending 9 hours of power supply to agricultural consumers from 15.02.2019 as per orders of the Government of Andhra Pradesh vide G.O.Ms.No.17, dt.15-02-2019.
Revenue estimate at Current Tariffs for APEPDCL in FY 2021-22
Revenue projected at Current Tariff incl. NTI, Cross Subsidy Surcharge is Rs.12075.31Crs. Revenue from key categories at current tariff for FY 2021-22 is shown below

x
7. Capacity, Availability & PP Cost for H2 FY 2020-21and FY2021-22
Power Purchase Requirement and Cost Estimate for the state of Andhra Pradesh and for APEPDCL for FY 2021-22
Consequent to the bifurcation of the erstwhile State of Andhra Pradesh as per the Andhra Pradesh Reorganization Act, 2014 (Central Act No. 6 of 2014, dated 01.03.2014), the Southern Power Distribution Company of AP Ltd. (APSPDCL) and the Eastern Power Distribution Company of AP Ltd. (APEPDCL) emerged as the Distribution Licensees of the present State of Andhra Pradesh. Two more Districts viz. Kurnool & Anantapur were segregated from the erstwhile APCPDCL (now TSSPDCL) and included into the service area of APSPDCL with effect from 2nd June 2014. The State Government after careful consideration in December 2019 have carved out APCPDCL consisting of Krishna, Guntur & Prakasam Districts, from the service area of APSPDCL. Ever since the third transfer scheme has been notified in the year 2005, the PPAs have been vested with the APDISCOMs. The contracted capacities in the PPAs have been shared proportionately based on Ratios fixed by the State Govt. from time to time, with an exception to Non-Conventional / Renewable Energy sources which were shared based on geographical locations for the most part of the previous period. Vide Go RT No. 118, dt 27-07-2017 State Govt. ordered that the NCE Capacities shall be allocated in power sharing ratio for APEPDCL & APSPDCL. Later vide Go RT No. 116, dt 01-10-2019 orders were issued for cancellation of the previous GO, with regard to sharing of NCE/RE PPAs. Accordingly, for the Current Financial Year (CY) and the Ensuing Financial Year (EY), the NCE/RE projects have been considered on geographical basis for the purpose of evaluation of Power Purchase costs of APDISCOMs. Consequent to formation of APCPDCL which has commenced business operations w.e.f. 1st April 2020, the State Govt vide GO Ms No 13, dt 6th April 2020 have specified Ratios to the three DISCOMs, that will be applicable for all the existing Power Purchase Agreements (PPAs) of combined purchases in respect of all ongoing and under construction Generation Stations for which PPAs have been signed except for the projects exclusively allocated on the basis of geographical location by the Government of Andhra Pradesh and other PPAs entered into by individual DISCOMs. Presently the ratios of APEPDCL, APSPDCL and APCPDCL (Distribution Licensees in AP) in the Power Purchase Agreements (PPAs) in pursuant to the above, are indicated as below:
Sl.No. Name of Discom Allocated Share in %
1 APSPDCL 40.44% 2 APEPDCL 36.22% 3 APCPDCL 23.34% Total 100.00%

xi
The following are the key assumptions considered by the licensee with regard to power purchase availability by the licensee –
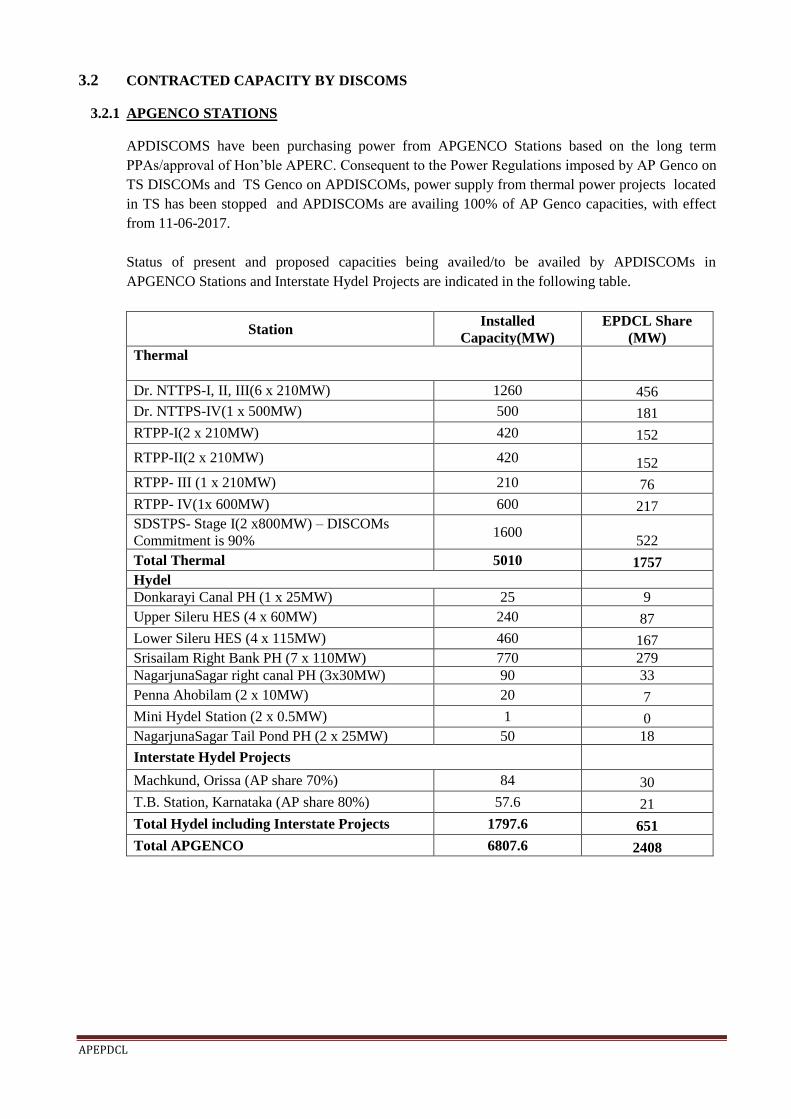
APGENCO Stations
APDISCOMS have been purchasing power from APGENCO Stations based on the long term PPAs/approval of Hon‟ble APERC. Consequent to the Power Regulations imposed by APGenco on TS DISCOMs and TS Genco on APDISCOMs, power supply from thermal power projects located in TS has been stopped and APDISCOMs are availing 100% of AP Genco capacities, with effect from 11-06-2017.
Central Generating stations
APDISCOMS have been purchasing power from Central Generating Stations owned /controlled by Central Public Sector Undertakings (CPSUs) based on the long term PPAs.
The PPA with NTPC Ramagundam I & II was expired on 31.10.2017 and the PPA with NLC TPS-II Stage-I & II is going to expire by 31.03.2021. Power procurement is continued from Ramagundam I & II plant owing to its low price. Relevant clause which allows the DISCOMs to continue to procure power from these plants is indicated as below:
Provided that this Agreement may be mutually extended/ renewed or replaced by another agreement on such terms and for such further period of time as the parties may mutually agree. In case the bulk power recipient continues to get the power from the plant, even after expiry of this agreement without further renewal, or formal extension thereof, then all the provisions of this agreement shall continue to operate till this agreement is formally renewed /extended or replaced.
These two projects are old stations with pithead fuel facility, and are presently operating as “Base
Load Stations” in AP Power System with cheaper cost. Average Central Transmission Charges
to the extent of Rs 0.8/Unit is currently incurred towards Inter State Transmission Charges under PoC regime, for the procurement of power from all CGS Stations (except Simhadri-I) and other IPPs (Sembcorp Energy& KSK) connected at CTU interface. New PoC regulation has been enacted by the Central Electricity Regulatory Commission (CERC) with effect from 1st Novemebr‟2020 which changed the paradigm of transmission service usage based charges .With the commencement of new PoC Regulation, CTU charges are expected to be altered and the first bill is expected to be issued in the month of January-21. Based on the results of new PoC regime, and the adequacy of the “Base Load” thermal capacity in the system to extend 24X7 reliable,
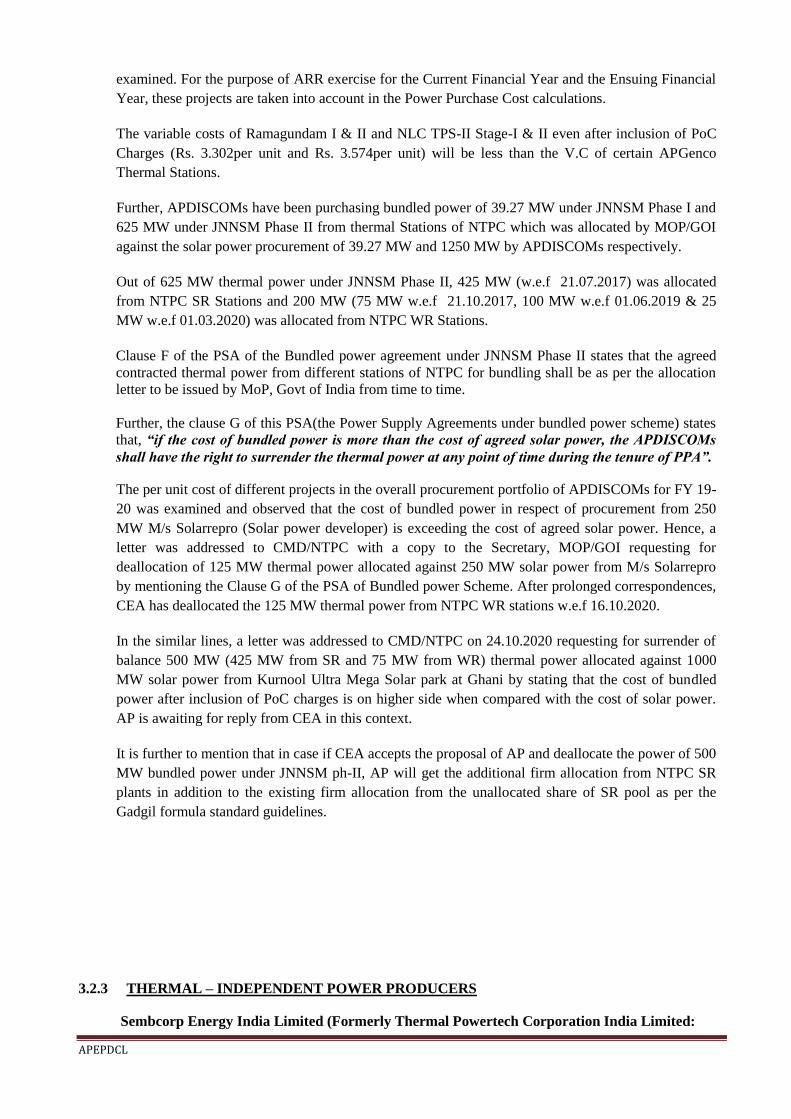
secured and cost effective power supply to the Consumers, continuance of procurement of power from these pithead stations would be examined. For the purpose of ARR exercise for the Current Financial Year and the Ensuing Financial Year, these projects are taken into account in the Power Purchase Cost calculations.
xii
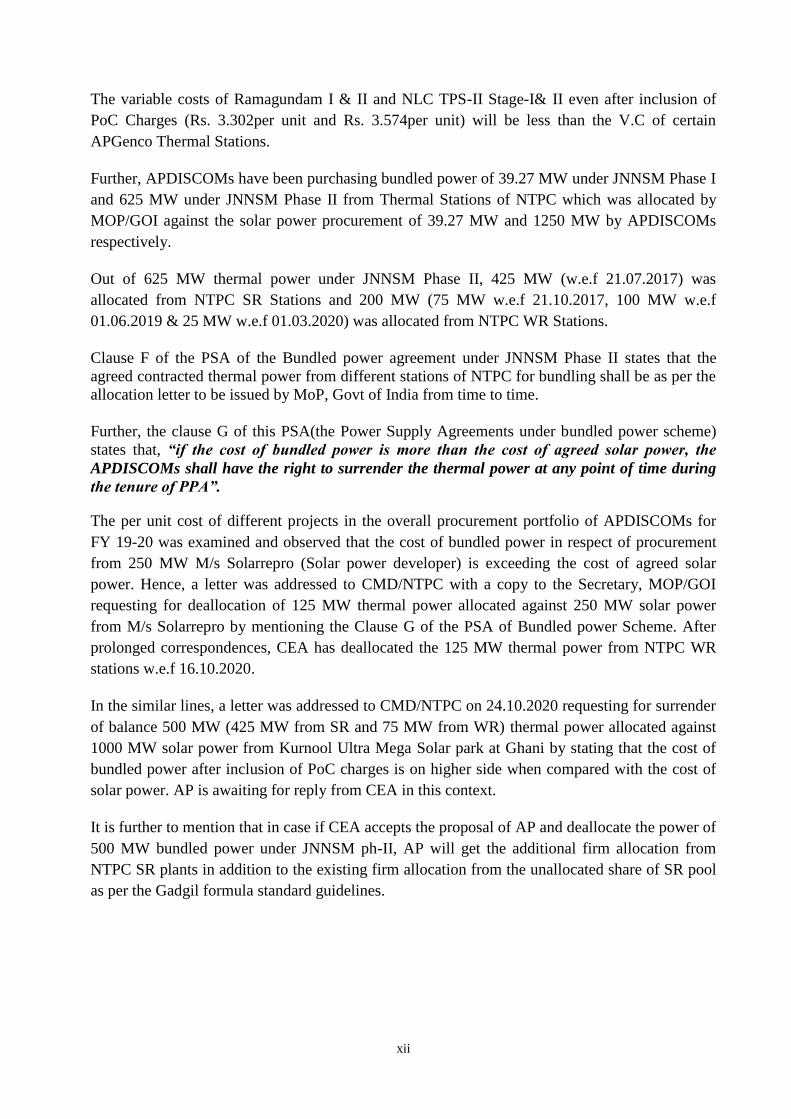
The variable costs of Ramagundam I & II and NLC TPS-II Stage-I& II even after inclusion of PoC Charges (Rs. 3.302per unit and Rs. 3.574per unit) will be less than the V.C of certain APGenco Thermal Stations.
Further, APDISCOMs have been purchasing bundled power of 39.27 MW under JNNSM Phase I and 625 MW under JNNSM Phase II from Thermal Stations of NTPC which was allocated by MOP/GOI against the solar power procurement of 39.27 MW and 1250 MW by APDISCOMs respectively.
Out of 625 MW thermal power under JNNSM Phase II, 425 MW (w.e.f 21.07.2017) was allocated from NTPC SR Stations and 200 MW (75 MW w.e.f 21.10.2017, 100 MW w.e.f 01.06.2019 & 25 MW w.e.f 01.03.2020) was allocated from NTPC WR Stations.
Clause F of the PSA of the Bundled power agreement under JNNSM Phase II states that the agreed contracted thermal power from different stations of NTPC for bundling shall be as per the allocation letter to be issued by MoP, Govt of India from time to time. Further, the clause G of this PSA(the Power Supply Agreements under bundled power scheme) states that, “if the cost of bundled power is more than the cost of agreed solar power, the
APDISCOMs shall have the right to surrender the thermal power at any point of time during the tenure of PPA”.
The per unit cost of different projects in the overall procurement portfolio of APDISCOMs for FY 19-20 was examined and observed that the cost of bundled power in respect of procurement from 250 MW M/s Solarrepro (Solar power developer) is exceeding the cost of agreed solar power. Hence, a letter was addressed to CMD/NTPC with a copy to the Secretary, MOP/GOI requesting for deallocation of 125 MW thermal power allocated against 250 MW solar power from M/s Solarrepro by mentioning the Clause G of the PSA of Bundled power Scheme. After prolonged correspondences, CEA has deallocated the 125 MW thermal power from NTPC WR stations w.e.f 16.10.2020.
In the similar lines, a letter was addressed to CMD/NTPC on 24.10.2020 requesting for surrender of balance 500 MW (425 MW from SR and 75 MW from WR) thermal power allocated against 1000 MW solar power from Kurnool Ultra Mega Solar park at Ghani by stating that the cost of bundled power after inclusion of PoC charges is on higher side when compared with the cost of solar power. AP is awaiting for reply from CEA in this context.
It is further to mention that in case if CEA accepts the proposal of AP and deallocate the power of 500 MW bundled power under JNNSM ph-II, AP will get the additional firm allocation from NTPC SR plants in addition to the existing firm allocation from the unallocated share of SR pool as per the Gadgil formula standard guidelines.

xiii
Thermal – Independent Power Producers
Sembcorp Energy India Limited (Formerly Thermal Powertech Corporation India Limited: APDISCOMs and Telangana DISCOMs signed PPA with the company for a contracted capacity of 500 MW under Long term basis through case-I bidding for a period of 25 years w.e.f. 20.04.2015. APDISCOMs share of contracted capacity in the plant is 46.11% i.e., 230.55 MW out of the said total contracted capacity of 500 MW. The plant is connected to CTU network in AP. As per the PPA, APDISCOMs are obligated to reimburse the applicable Long Term Open Access (LTOA) charges to the generator. KSK Mahanadi Power Corporation Limited: APDISCOMs have PPA with KSK Mahanadi Power Corporation Limited for a contracted capacity of 400 MW. The PPA is valid up to 31.03.2021. The plant is located in Western Region and is connected to the CTU network. As per the PPA, APDISCOMs are obligated to reimburse the applicable Medium Term Open Access (MTOA) charges to the generator. The generator is not supplying power since 13-07-2020 and is not expected to resume supply in the Current Financial Year. Since the PPA is expiring by 31st March-2021, availability from this plant is not considered in the ARR calculations. Hinduja: M/s Hinduja has set up 1040 MW (2X520 MW) Thermal Power Plant at Visakhapatnam. In pursuant to the directions of Hon‟ble APTEL power was availed till 18
th July 2020. The issue of procurement of power from this plant is presently subjudice at Hon‟ble Supreme Court of India
and as such power is not procured from this plant. Gas Based Projects:
GGPP (Godavari Gas Power Plant-216.824 MW, formerly GVK PHASE-I)
The PPA with GVK-I expired on 19.06.2015.Subsequently, APDISCOMs bought the power plant on 22.04.2016 and renamed it as GGPP. The plant is being operated by the employees deputed from APGENCO. GoAP vide letter dated 04.05.2018 approved the proposal of APDISCOMs to hand over the plant to APGENCO. The process of handing over the plant is under progress. APDISCOMs are at present dispatching the energy from this plant based on the approval given by Hon‟ble APERC in the Retail Tariff Order for FY 2020-21. APDISCOMs propose to avail the power from this plant during FY 2021-22 also subject to the approval of Hon‟ble APERC.

xiv
SPGL(Spectrum Power Generation Limited-205.187MW:
The PPA with the plant got expired on 18.04.2016, APDISCOMs are presently procuring power from M/s SPGL on short term basis during the Financial Year 2021 as per the orders issued by the Hon‟ble APERC in vogue.
Lanco Kondapalli Power- 362 MW:
The PPA with the plant got expired on 01-01-2016, APDISCOMs are presently procuring power from M/s Lanco on short term basis during the Financial Year 2021 as per the orders issued by the Hon‟ble APERC in vogue.
It is further to state that, the tenure of the Gas Supply Agreements (GSAs) pertaining to M/s SPGL and M/s Lanco with GAIL is ending by 5th July, 2021 and the AP State Govt has already requesting concerned authorities in Ministry of Petroleum and Natural Gas (MoPNG) and Ministry of Power (MoP) to reallocate cheaper APM Gas to the DISCOMs‟ owned GGPP plant
for operating the same at optimum level, in the interest of Electricity consumers in the State.
GAS – NEW Independent Power Producers
APDISCOMs of erstwhile united AP State entered into long term PPAs with GVK Extension (220 MW), GVPGL(GMR Vemagiri Power Generation Limited-370 MW), Gouthami CCPP(464 MW) and Konaseema Gas Power Limited(444.08 MW). These new IPPs were commissioned during the years 2006 (GVPGL), 2009 (GVK Extension, Gouthami CCPP) and 2010 (Konaseema Gas Power Limited). After bifurcation of AP State, APDISCOMs of the present AP State were allocated 46.11% of share of capacity in these plants. The Natural gas supplies from RIL KG D-6 fields to the aforesaid IPPs became zero w.e.f. 01.03.2013. As a result, there is no generation from these plants as of now. Further, there is no official communication from MoP&NG on the availability of natural gas to these plants. The e-bid RLNG Scheme ended by 31.03.2017and MoP/GOI has not extended the scheme. Therefore, APDISCOMs are not proposing to procure any power from these plants. Further, APDISCOMs are not presently paying any fixed charges to these plants.
APGPCL (AP GAS POWER CORPORATION LIMITED)
APGPCL is a joint sector gas-based power project wherein AP Transco is a one of the participating industry. APDISCOMs are availing power from this project to the extent of APTRANSCO‟s equity share in the project. There is a change in the share pattern of APGPCL
during the current financial year, by which APGPCL transferred the APTRANSCO shares of Stage-II (42.80MW) to the some of the participating industries as per Article 6 of Articles of Association of the company. Further, Govt. of AP addressed letter to MoP&NG cancellation of allocation of APM Gas to APGPCL and reallocate to GGPP (Godavari Gas Power Plant) owned by APDISCOMs/APGENCO to run at full capacity in the interest of consumers in the state vide letter dated 05.10.2020.The Power is being procured to the extent of share holding of APTRANSCO in this project and APGPCL didn‟t furnish any particulars on expected power allocation to AP DISCOMs for the ensuing FY 2021-22.

xv
Renewable Energy Based Power Plants
APDISCOMs are having PPAs with Non-Conventional/Renewable Energy plants for the second half of FY 2020-21 and FY 2021-22 and presently these NCE/RE projects have been allocated to the APDISCOMs based on Geographical Location.
New Thermal Projects:
APGENCO (Thermal) – NTTPS (Stage-V) (formerly VTPS-V)of 800 MW and APPDCL (Thermal) – SDSTPS (Stage-II) of 800 MW
The Amended and Restated PPAs are not signed as on date with APGENCO/ APPDCL by APDICOMs for supply of power to APDISCOMs.
MARKET
The rates for energy procured from Market sources is taken as per the discovered prices while taking up the actual procurement. For the purpose estimation of power purchase cost in this ARR exercise a weighted average single part price of Rs 3.70 per Unit is considered, basing on a 10% increase to the weighted average price realized for the First Half of the Current Financial Year.
ENERGY REQUIREMENT
The DISCOM wise Energy Requirement are tabulated below.
DISCOM FY 2020-21 FY 2021-22
APEPDCL 22581.25 25016.18
APCPDCL 15088.41 15956.64
APSPDCL 24850.05 27395.59
Total 62519.72 68368.42
xvi
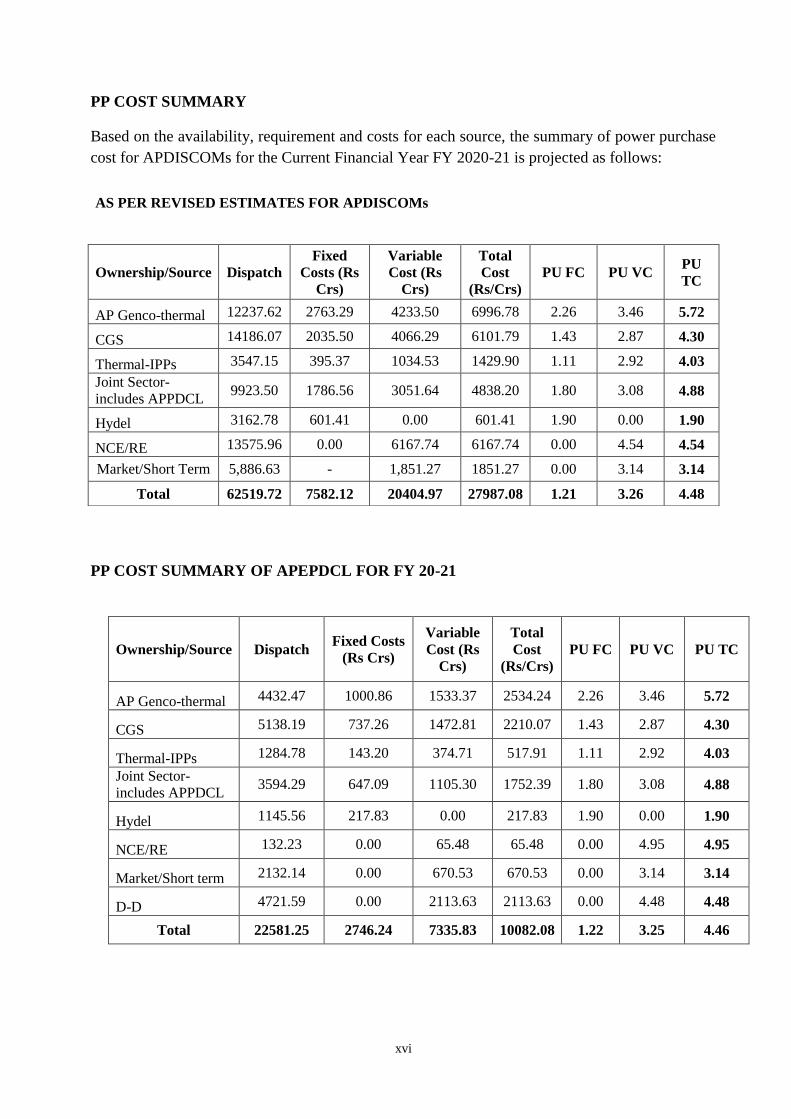
PP COST SUMMARY
Based on the availability, requirement and costs for each source, the summary of power purchase cost for APDISCOMs for the Current Financial Year FY 2020-21 is projected as follows:
PP COST SUMMARY OF APEPDCL FOR FY 20-21
Ownership/Source Dispatch Fixed Costs
(Rs Crs)
Variable Cost (Rs
Crs)
Total Cost
(Rs/Crs) PU FC PU VC PU TC
AP Genco-thermal 4432.47 1000.86 1533.37 2534.24 2.26 3.46 5.72
CGS 5138.19 737.26 1472.81 2210.07 1.43 2.87 4.30
Thermal-IPPs 1284.78 143.20 374.71 517.91 1.11 2.92 4.03
Joint Sector-includes APPDCL
3594.29 647.09 1105.30 1752.39 1.80 3.08 4.88
Hydel 1145.56 217.83 0.00 217.83 1.90 0.00 1.90
NCE/RE 132.23 0.00 65.48 65.48 0.00 4.95 4.95
Market/Short term 2132.14 0.00 670.53 670.53 0.00 3.14 3.14
D-D 4721.59 0.00 2113.63 2113.63 0.00 4.48 4.48
Total 22581.25 2746.24 7335.83 10082.08 1.22 3.25 4.46
AS PER REVISED ESTIMATES FOR APDISCOMs
Ownership/Source Dispatch
Fixed Costs (Rs
Crs)
Variable Cost (Rs
Crs)
Total Cost
(Rs/Crs) PU FC PU VC
PU TC
AP Genco-thermal 12237.62 2763.29 4233.50 6996.78 2.26 3.46 5.72
CGS 14186.07 2035.50 4066.29 6101.79 1.43 2.87 4.30
Thermal-IPPs 3547.15 395.37 1034.53 1429.90 1.11 2.92 4.03
Joint Sector-includes APPDCL
9923.50 1786.56 3051.64 4838.20 1.80 3.08 4.88
Hydel 3162.78 601.41 0.00 601.41 1.90 0.00 1.90
NCE/RE 13575.96 0.00 6167.74 6167.74 0.00 4.54 4.54
Market/Short Term 5,886.63 - 1,851.27 1851.27 0.00 3.14 3.14
Total 62519.72 7582.12 20404.97 27987.08 1.21 3.26 4.48

xvii
Based on the availability, requirement and costs for each source, the summary of power purchase cost for Andhra Pradesh for FY 2021-22 is projected as follows:
PROJECTIONS FOR FY 2021-22 OF AP DISCOMS
Ownership/Source Dispatch
Fixed Costs (Rs Crs)
Variable Cost (Rs
Crs)
Total Cost
(Rs/Crs) PU FC PU VC
PU TC
AP Genco-thermal 19246.47 2738.07 6674.01 9412.08 1.42 3.47 4.89
CGS 17241.17 2012.74 5254.34 7267.08 1.17 3.05 4.21
Thermal-IPPs 1687.48 286.14 412.25 698.40 1.70 2.44 4.14
Joint Sector-includes APPDCL
12160.31 1809.02 3712.33 5521.35 1.49 3.05 4.54
Hydel 3212.67 614.26 0.00 614.26 1.91 0.00 1.91
NCE/RE 14427.51 0.00 6547.86 6547.86 0.00 4.54 4.54
Market/Short term 392.81 - 145.18 145.18 0.00 3.70 3.70
Total 68368.42 7460.22 22745.96 30206.19 1.09 3.33 4.42
PP COST SUMMARY OF APEPDCL FOR FY 21-22
Ownership/Source Dispatch Fixed Costs
(Rs Crs)
Variable Cost (Rs
Crs)
Total Cost
(Rs/Crs) PU FC PU VC PU TC
AP Genco-thermal 6971.07 991.73 2417.33 3409.05 1.42 3.47 4.89
CGS 6244.75 729.01 1903.12 2632.14 1.17 3.05 4.21
Thermal-IPPs 611.21 103.64 149.32 252.96 1.70 2.44 4.14
Joint Sector-includes APPDCL
4404.46 655.23 1344.61 1999.83 1.49 3.05 4.54
Hydel 1163.63 222.48 0.00 222.48 1.91 0.00 1.91
NCE/RE 180.03 0.00 89.32 89.32 0.00 4.96 4.96
Market/Short term 142.27 0.00 52.58 52.58 0.00 3.70 3.70
D-D 5298.76 0.00 2341.07 2341.07 0.00 4.42 4.42
Total 25016.18 2702.09 8297.35 10999.44 1.08 3.32 4.40
xviii
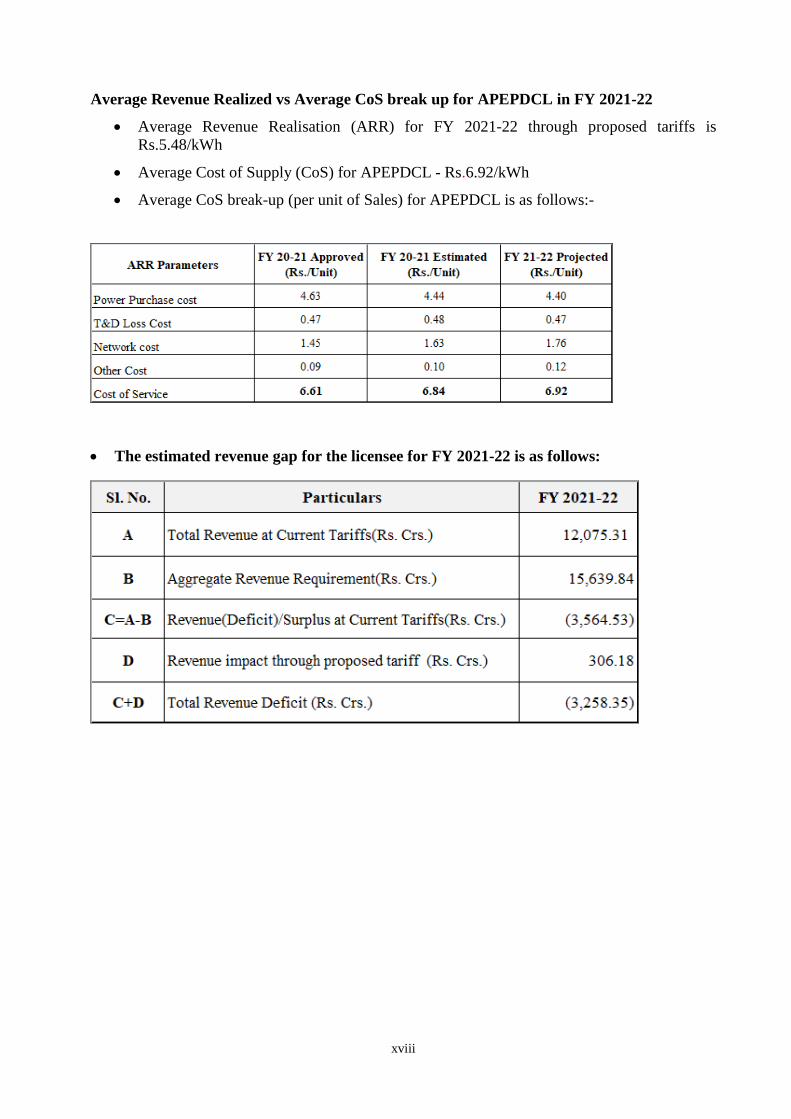
Average Revenue Realized vs Average CoS break up for APEPDCL in FY 2021-22
Average Revenue Realisation (ARR) for FY 2021-22 through proposed tariffs is Rs.5.48/kWh
Average Cost of Supply (CoS) for APEPDCL - Rs.6.92/kWh
Average CoS break-up (per unit of Sales) for APEPDCL is as follows:-
The estimated revenue gap for the licensee for FY 2021-22 is as follows:

xix
8. Tariff Proposals
Licensees proposes to continue with the same 5 Main categories in LT as well as 5 Main categories in HT as approved by Hon‟ble Commission during FY 2019-20.
The following changes have been proposed:
Category - I(A): Domestic-LT :The Licensee proposes to remove Monthly minimum charges in LT domestic category and levy a Fixed Charges of Rs 10/KW/Month and part thereof on contracted load, due to which the revenue would increase by 1.07%
Existing minimum charges
Proposed Fixed Charges
1-ph <= 0.5 KW Rs.25
Rs 10 /KW/Month and part thereof
1-ph > 0.5KW Rs.50
3-ph load Rs.150
Category - I(B): Townships, Colonies, Gated Communities & Villas-HT :
The licensee proposes to include all new Group housing societies, Apartment Complexes/Buildings, Townships, Industrial Colonies, Gated Communities and will be given the single point HT connection facility under this category.
The classification of these categories will be as per the building permits/layout permits issued by competent authority.
The licensee proposed that the existing housing societies, consumer(s)/ residents‟ associations, Apartment complexes/buildings, townships, colonies, gated communities etc. may opt for this facility and conversion will be done at free of cost.
The licensee proposes to reduce the existing Energy Charges from Rs. 7.00 per unit to Rs. 5.95 per unit for this category, due to which the revenue would decrease by 14.11%.
The licensee proposed to rename the existing category - I(B) : Townships, Colonies, Gated Communities & Villas-HT as Category - I: Domestic-HT.
Commercial & Others:
Category - LT –II A(iv): Function Halls/Auditoria:
The Licensee proposes to remove existing Fixed Charges of Rs 100/KW/Month in this category, due to which the revenue would decrease by 16 % and improves the sales in this category.

xx
Category - II(B): Startup Power –LT :
The Licensee proposed to include Merchant Plants / IPPs which don‟t
have PPAs with AP DISCOMs in this category.
Category - II(B): Startup Power –HT :
The Licensee proposed to include Merchant Plants / IPPs which don‟t
have PPAs with AP DISCOMs in this category.
Category – III: Industry- HT :
i)Licensee proposes to modify the Morning Peak ToD Timings from 6:00AM-10:00AM to 4:00AM- 8:00AM in line with the incidence of Agriculture Load. Accordingly new ToD Off Peak Timings are 10:00 PM to 4:00 AM.
ii) The licensee proposes to with draw the existing Load Factor incentive.
Category-V: Agriculture and related-LT:
V (C) :Poultry & Aquaculture –LT : The licensee proposes to merge the existing categories V C (i) Poultry Hatcheries and Poultry Feed mixing plants V C (ii) Aqua Hatcheries and Aqua Feed mixing plants into Category III- A Industrial General-LT due to which the revenue increases by 36.11 %.
Category-V: Agriculture and related -HT
V (C) : Poultry & Aquaculture –HT : The licensee proposes to merge the existing categories V C (i) Poultry Hatcheries and Poultry Feed mixing plants V C (ii) Aqua Hatcheries and Aqua Feed mixing plants into Category III- A Industrial General-HT respective voltage levels Due to which the revenue increases by 5.12 %.
RESCO:
The RESCOs draw power from Licensee and the activities of RESCOs are similar to that of the Licensee in implementing similar tariffs in their respective areas as approved by the Hon‟ble commission. The licensee
proposes to increase both RESCOs Tariff at a rate of Rs 7.15 per unit each which equal to the CoS of Licensee.
Other Proposal:
Proposed para in the ARR writeup to impose restriction on Time of Use / Intra Day procurement by the Bulk Consumers
1. It is observed that certain bulk consumers who are eligible for Inter State Open Access are obtaining the necessary permissions from SLDC for short term OA and are procuring power during day time & off peak hours (Time of the day basis as per their convenience) from the power exchanges (IEX & PXL).
xxi
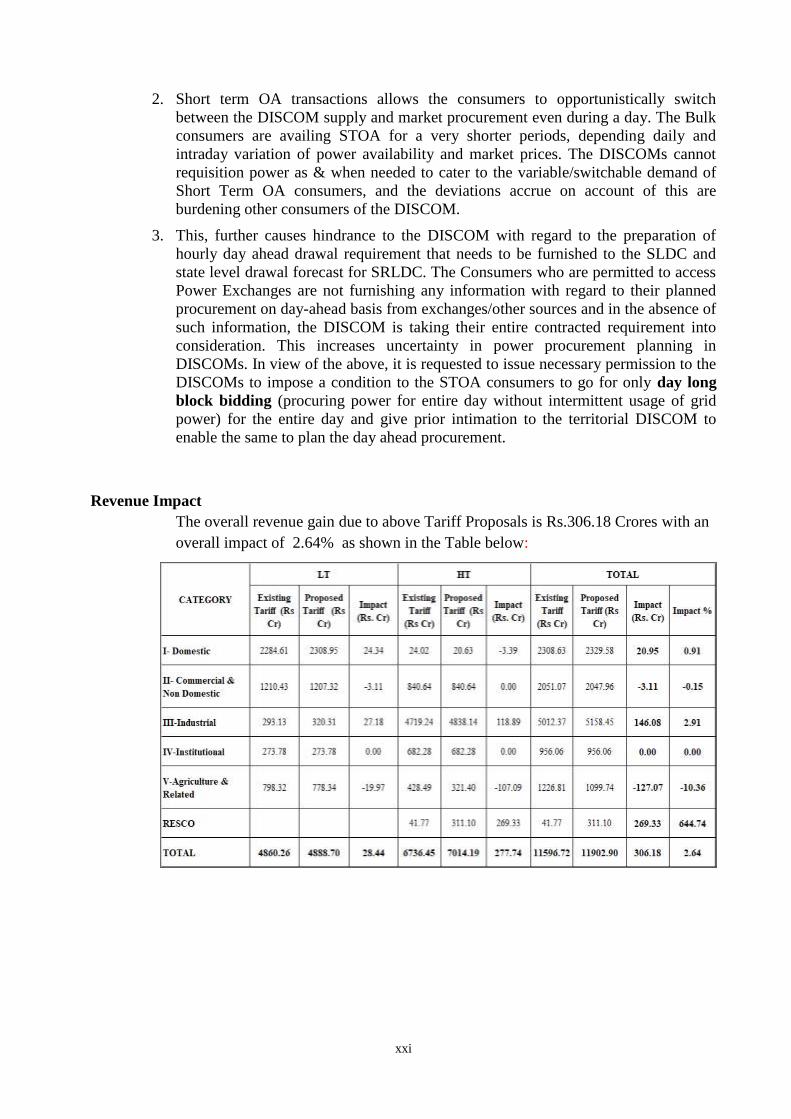
2. Short term OA transactions allows the consumers to opportunistically switch between the DISCOM supply and market procurement even during a day. The Bulk consumers are availing STOA for a very shorter periods, depending daily and intraday variation of power availability and market prices. The DISCOMs cannot requisition power as & when needed to cater to the variable/switchable demand of Short Term OA consumers, and the deviations accrue on account of this are burdening other consumers of the DISCOM.
3. This, further causes hindrance to the DISCOM with regard to the preparation of hourly day ahead drawal requirement that needs to be furnished to the SLDC and state level drawal forecast for SRLDC. The Consumers who are permitted to access Power Exchanges are not furnishing any information with regard to their planned procurement on day-ahead basis from exchanges/other sources and in the absence of such information, the DISCOM is taking their entire contracted requirement into consideration. This increases uncertainty in power procurement planning in DISCOMs. In view of the above, it is requested to issue necessary permission to the DISCOMs to impose a condition to the STOA consumers to go for only day long block bidding (procuring power for entire day without intermittent usage of grid power) for the entire day and give prior intimation to the territorial DISCOM to enable the same to plan the day ahead procurement.
Revenue Impact
The overall revenue gain due to above Tariff Proposals is Rs.306.18 Crores with an overall impact of 2.64% as shown in the Table below:

xxii
9 Cross Subsidy Surcharge
The licensee has calculated the cross surcharge subsidy based on the formula specified in the
revised National Tariff Policy issued on 28.01.16.
As per the said Tariff Policy, the surcharge is to be computed as per the following formula;
S= T – [C/ (1-L/100) + D+ R]
Where,
„S‟ in Rs./unit is the Cross Subsidy Surcharge ,
„T‟ is the tariff payable by the relevant category of consumers in Rs./unit, including reflecting
the Renewable Purchase Obligation,
„C‟ is the per unit weighted average cost of power purchase by the Licensee, including
meeting the Renewable Purchase Obligation in Rs./unit ,
„D‟ is the aggregate of transmission, distribution and wheeling charge applicable to the
relevant voltage level in Rs./unit and „L‟ in percentage is the aggregate of transmission,
distribution and commercial losses, applicable to the relevant voltage level and
„R‟ is the cost of carrying regulatory assets in Rs./kWh.
Provided that the surcharge shall not exceed 20% of the tariff applicable to the category of the
consumers seeking open access.
The category-wise CSS computation for APEPDCL for FY 2021-22is as follows:

10 Additional Surcharge
As per the directions given by the Hon 'ble Commission in Tariff Order FY 2020-21, the Licensee shall file the Additional Surcharge in supplementary filings.
Based on the information available, the Applicant has made sincere efforts to comply with the Regulation of the Honourable Commission and discharge its obligations to the best of its abilities. However, should any further material information become available in the near future, the Applicant shall file such additional information and consequently amend/ revise the application.
In the aforesaid facts and circumstances, the Applicant requests that this Honourable Commission may be pleased to:
a. Take the accompanying ARR, Tariff Proposal along with Cross Subsidy Surcharge of APEPDCL on record and treat it as complete;
b. Grant suitable opportunity to APEPDCL within a reasonable time frame to file additional material information that may be subsequently available;
c. Consider and approve APEPDCL's ARR and Tariff application including all requested regulatory treatments in the filing;
d. Pass such order as the Honourable Commission may deem fit and proper in the facts and circumstances of the case.
EASTERN POWER DISTRIBUTION COMPANY OF ANDHRA PRADESH LIMITED (APPLICANT)
Through
ief General Mana~(w PPA, RA & QC : : APEPDCL
Place: Visakhapatnam Dated: '.Al 11.2020
xxiii

APEPDCL
Contents
1 Introduction 3
1.1 Filings based on Multi-Year Tariff (MYT) Principles 3
1.2 Filing Contents 3
2 Analysis of expected performance for Current Year2020-21for Retail Supply Business 5
2.1 Introduction 5
2.2 Operating Performance 5 2.2.1 Distribution Loss 6 2.2.2 Metered Sales 6
2.3 Financial Performance 7 2.3.1 Financial Performance of previous Year FY 2019-20 7 2.3.2 Financial performance of current year FY 2020-21 9
3 CAPACITY, AVAILABILITY &PP COST FOR H2 FY 2020-21 AND FY2021-22 11
3.1 INTRODUCTION 11
3.2 CONTRACTED CAPACITY BY DISCOMS 12 3.2.1 APGENCO STATIONS 12 3.2.2 Central Generating stations 13 3.2.3 THERMAL – INDEPENDENT POWER PRODUCERS 14 3.2.4 GAS – NEW INDEPENDENT POWER PRODUCERS 16 3.2.5 APGPCL (AP GAS POWER CORPORATION LIMITED) 16 3.2.6 RENEWABLE ENERGY PLANTS 17
3.3 ENERGY AVAILABILITY& DISPATCH 17 3.3.1 Availability: 17 3.3.2 SUMMARY OF ENERGY DISPATCHES(MU) 19 3.3.3 DEFICIT / SURPLUS 20
3.4 POWER PURCHASE COST 20 3.4.1 APGENCO STATIONS 20 3.4.2 CENTRAL GENERATING STATIONS 23 3.4.3 Sri Damodaram Sanjeevaiah Thermal Power Project (SDSTPS)- Krishnapatnam: 25 3.4.4 SEMBCORP ENERGY AND KSK MAHANADI 25 3.4.5 APGPCL 26 3.4.6 OLD GAS BASEDIPPs 26 3.4.7 NEW GAS BASED IPPs 27 3.4.8 MARKET 27
3.5 PP COST SUMMARY 28
4 LOSSES 30
4.1 DISCOM losses 30
4.2 Transmission Losses 30
5 Expenditure Projections for APEPDCL 31
5.1 Power Purchase and Procurement Cost 31
5.2 AP Transco Transmission Charges 31
5.3 SLDC Charges 32
5.4 PGCIL 32
5.5 ULDC Charges 33
1
APEPDCL
5.6 Distribution Costs 33
5.7 Addl. Interest on Pension Bonds – Payable to APGENCO: 34
5.8 Interest on Consumer Security Deposits 35
5.9 Supply Margin 36
5.10 Other Costs 36
5.11 Aggregate Revenue Requirement (ARR) for Retail Supply Business 37
6 Revenue Projections 38
6.1 Sales Forecast (Linear Regression Method) 38 6.1.1 Sales Estimation for the FY 2020-21 46 6.1.2 Sales Projections for the year FY 2021-22 48 6.1.3 Forecasting Sales: Category- V(A): Agriculture -LT 49 6.1.4 Process of Estimation: 49
6.2 Gross Revenue 54 6.2.1 Revenue from Current Tariffs (Excl. Non-Tariff Income) 54 6.2.2 Non-Tariff Income at Current Charges Rs. Crs. 56 6.2.3 Revenue from Theft of Power or Malpractices 56 6.2.4 Interest income from Bank Deposits / investments 56 6.2.5 Power Purchase Rebates earned 56 6.2.6 Miscellaneous /Other Receipts 57 6.2.7 R.C. fees and Application fees 57 6.2.8 Delayed Payment Surcharge (DPS) 57 6.2.9 Cross Subsidy Surcharge 57 6.2.10 Revenue at Current Tariffs and Charges 58
7 Average Revenue Realized vs Average CoS break up for APEPDCL in FY 2021-22 63
8 Energy Conservation measures taken up by APEPDCL 64
8.1 Energy Efficiency Initiatives 64
8.2 Energy Conservation Initiatives taken by APEPDCL 64
8.3 Solar Roof Top Project 64
8.4 IT Initiatives 65
9 Performance Reports 67
10 Cost of Service Methodology for 2021-22 84
11 True-Up 86
12 Tariff Proposals 87
13 Revenue Impact 89
14 Tariff Table for all Consumer Categories 90
15 Cross Subsidy Surcharge for FY 2021-22 91
16 Additional Surcharges 93
17 Directives for FY2020-21 94
18 Subsidies 108
19 Prayer 109
2
APEPDCL
1 Introduction
1.1 Filings based on Multi-Year Tariff (MYT) Principles
The Andhra Pradesh Electricity Regulatory Commission framed the “Terms and Conditions for
determination of Tariff for Wheeling and retail supply of electricity” Regulation 4 of 2005 and First
Amendment Regulation 2014 (“Regulation”), lays down the principles for determination of Aggregate
Revenue Requirement (ARR) for (a) Distribution Business and (b) Retail Supply Business of the
licensees. The ARR so determined for each of the businesses will form the basis for fixation of
charges for wheeling and for retail sale of electricity.
In the Regulation, the Commission has also laid down the procedures for filing under multi-year tariff
principles. The multi-year period is defined as the Control Period and the first Control Period is
defined as the three year period starting from financial year 2006-07 and continuing till the end of
financial year 2008-09.The second control period was defined as five year period starting from FY
2009-10to FY 2013-14. The third control period was defined as the five year period starting from FY
2014-15 to FY 2018-19. The current filing pertains to the fourth Control Period (FY 2019-20 to FY
2023-24). The Commission has specified in Para 6.2 of the Regulation the following procedure for
ARR filing for the distribution and retail supply business:
“The ARR filing for the Distribution business shall be for the entire Control Period. For the Retail
Supply business the ARR filing will be on annual basis …...”
On obeying the APERC, orders vide APERC proceeding number T-87/07/2020, Dated: 17.09.2020,
current filing is being done following the principles laid down under Regulation for determination of
the ARR for the retail supply business for the year FY 2021-22, which is the third year of the Fourth
Control Period.
1.2 Filing Contents
The filing is structured in the following way:
a) Section 2 provides analysis of expected performance for current year for Retail supply Business
comprising
Operating Performance
Financial Performance
A brief analysis of the financial and operational performance of the licensee during the previous year
(2019-20) and the current year (2020-21) is given.
b) Section 3 provides the ARR for Retail Supply Business for third year of the Fourth Control Period
and the basis of projections of the expense and revenue items comprising:
Expenditure Projections
o Power Purchase and Procurement Cost
o Transmission Charges
o PGCIL& ULDC Charges
o SLDC Charges
o Distribution Cost
o Interest on Consumer Security Deposits
3

APEPDCL
o Supply Margin
o Other Costs
o Aggregate Revenue Requirement for Retail Supply Business
Revenue Projections
o Sales Forecast
o Revenue from Current Tariffs
o Non-tariff Income at Current Charges
o Revenue from Cross Subsidy Surcharge
o Revenue at Current Tariffs and Charges
Revenue Gap
o Revenue Deficit / Surplus at Current Tariff and Charges
o Proposals to handle the Deficit/Surplus
o Government Subsidy Requirement
Other Filings
o Cross Subsidy Surcharge
The sales forecast is used to determine the revenue from tariff from retail sale of electricity for the
third year of the fourth control period and the energy input required for meeting the demand. The
power procurement plan is based on the availability of the generation sources during the ensuing year,
the cost (fixed, variable and others) and the merit order dispatch of various sources to meet the
demand expected during various months for FY2021-22.
4

APEPDCL
2 Analysis of expected performance for Current Year2020-21for Retail Supply Business
2.1 Introduction
This chapter analyses the performance of the licensee during the Current Year as compared to the
previous year & also with the Tariff Order 2020-21. Only the key operating and financial parameters
have been considered for this analysis.
2.2 Operating Performance
5

APEPDCL
2.2.1 Distribution Loss
It is expected to reduce the losses further with the implementation of the following measures.
i) Reduction of both technical and commercial losses by vigorously conducting 11 KV feeder wise
energy audits.
ii) During the year 2019-20 energy audit was conducted to all the existing 3622Nos. 11 KV
feeders. With the addition of 80Nos. during 2020-21 up to October, the total no. of 11KV
feeders existing is 3702Nos. and for all these feeders, energy audit is being carried out.
iii) For the year 2019-20, 36Nos. 33/11 KV sub-stations were charged and in the current year 2020-
21,11 Nos.33/11 KV sub-stations charged by the end of October‟2020,to reduce over loading of
33 KV & 11 KV lines and to maintain good voltage profiles up to the consumer‟s end.
2.2.2 Metered Sales
As seen from the above table, the percentage of actual metered sales in FY 2019-20 has decreased
than the Tariff Order level by 2.56 %. In 2020-21 also, the metered sales are expected to decrease by
0.26% over 2019-20 levels due to reduction in consumption.
6
APEPDCL
Agricultural Sales
In the previous year 2019-20 the actual Agriculture Consumption is 2422.77 MU as against the
approved 2090.27 MU. In the current year 2020-21 during the first half of the year, the agriculture
consumption is 1017.01MU and the sales estimate for second half of FY 2020-21 for this category
are 1396.64 MU.
2.3 Financial Performance
2.3.1 Financial Performance of previous Year FY 2019-20
2.3.1.1 Revenues from sale of electricity
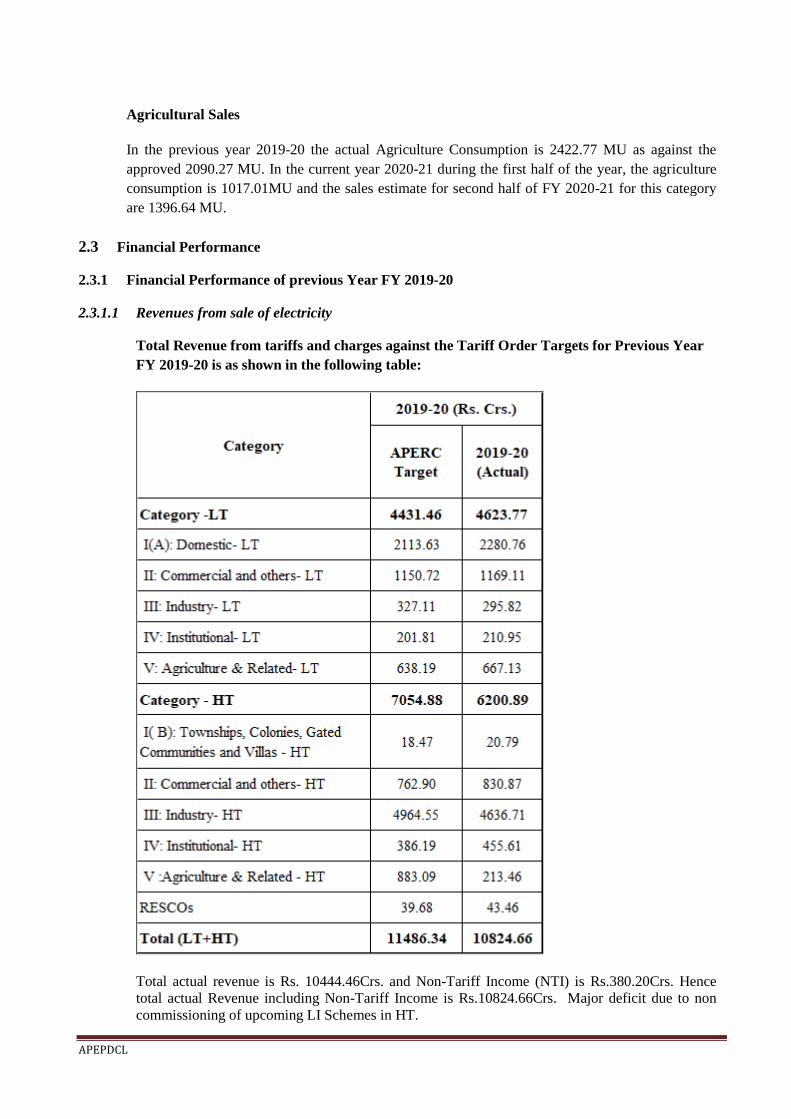
Total Revenue from tariffs and charges against the Tariff Order Targets for Previous Year
FY 2019-20 is as shown in the following table:
Total actual revenue is Rs. 10444.46Crs. and Non-Tariff Income (NTI) is Rs.380.20Crs. Hence
total actual Revenue including Non-Tariff Income is Rs.10824.66Crs. Major deficit due to non
commissioning of upcoming LI Schemes in HT.
7

APEPDCL
2.3.1.2 Revenue Surplus / Deficit of FY 2019-20
The financial performance on the actual for the FY: 2019-20 are as under.
8

APEPDCL
2.3.2 Financial performance of current year FY 2020-21
2.3.2.1 Revenue from sale of electricity:
The actual revenue for FY 2019-20 excluding NTI is Rs.10444.46 Crs. and for FY: 2020-21 it is
estimated to be Rs.10613.80Crs.
For the key categories, the licensee has estimated the revenue as below:
9

APEPDCL
2.3.2.2 Revenue Surplus / Deficit of current year FY 2020-21
For the period 2020-21, the Licensee projects that it might incur a loss of Rs.137.09Crs.
10

APEPDCL
3 CAPACITY, AVAILABILITY &PP COST FOR H2 FY 2020-21 AND FY2021-22
3.1 INTRODUCTION
Consequent to the bifurcation of the erstwhile State of Andhra Pradesh as per the Andhra Pradesh
Reorganization Act, 2014 (Central Act No. 6 of 2014, dated 01.03.2014), the Southern Power
Distribution Company of AP Ltd. (APSPDCL) and the Eastern Power Distribution Company of AP
Ltd. (APEPDCL) emerged as the Distribution Licensees of the present State of Andhra Pradesh.
Two more Districts viz. Kurnool & Anantapur were segregated from the erstwhile APCPDCL (now
TSSPDCL) and included into the service area of APSPDCL with effect from 2nd
June 2014. The
State Government after careful consideration in December 2019 have carved out APCPDCL
consisting of Krishna, Guntur & Prakasam Districts, from the service area of APSPDCL.
Ever since the third transfer scheme has been notified in the year 2005, the PPAs have been vested
with the APDISCOMs. The contracted capacities in the PPAs have been shared proportionately
based on Ratios fixed by the State Govt. from time to time, with an exception to Non-Conventional /
Renewable Energy sources which were shared based on geographical locations for the most part of
the previous period. Vide Go RT No. 118, dt 27-07-2017 State Govt. ordered that the NCE
Capacities shall be allocated in power sharing ratio for APEPDCL & APSPDCL. Later vide Go RT
No. 116, dt 1-10-2019 orders were issued for cancellation of the previous GO, with regard to
sharing of NCE/RE PPAs. Accordingly, for the Current Financial Year (CY) and the Ensuing
Financial Year (EY), the NCE/RE projects have been considered on geographical basis for the
purpose of evaluation of Power Purchase costs of APDISCOMs.
Consequent to formation of APCPDCL which has commenced business operations w.e.f. 1st April
2020, the State Govt vide GO Ms No 13, dt 6th April 2020 have specified Ratios to the three
DISCOMs, that will be applicable for all the existing Power Purchase Agreements (PPAs) of
combined purchases in respect of all ongoing and under construction Generation Stations for which
PPAs have been signed except for the projects exclusively allocated on the basis of geographical
location by the Government of Andhra Pradesh and other PPAs entered into by individual
DISCOMs.
Presently the ratios of APEPDCL, APSPDCL and APCPDCL (Distribution Licensees in AP) in the
Power Purchase Agreements (PPAs) in pursuant to the above, are indicated as below:
The details of capacities being availed by APDISCOMs from various power stations have been
described in the subsequent paragraphs
Sl. No. Name of
DISCOM
Allocated
Share in %
1 APSPDCL 40.44%
2 APEPDCL 36.22%
3 APCPDCL 23.34%
Total 100.00%
11
APEPDCL
3.2 CONTRACTED CAPACITY BY DISCOMS
3.2.1 APGENCO STATIONS
APDISCOMS have been purchasing power from APGENCO Stations based on the long term
PPAs/approval of Hon‟ble APERC. Consequent to the Power Regulations imposed by AP Genco on
TS DISCOMs and TS Genco on APDISCOMs, power supply from thermal power projects located
in TS has been stopped and APDISCOMs are availing 100% of AP Genco capacities, with effect
from 11-06-2017.
Status of present and proposed capacities being availed/to be availed by APDISCOMs in
APGENCO Stations and Interstate Hydel Projects are indicated in the following table.
Station Installed
Capacity(MW)
EPDCL Share
(MW)
Thermal
Dr. NTTPS-I, II, III(6 x 210MW) 1260 456
Dr. NTTPS-IV(1 x 500MW) 500 181
RTPP-I(2 x 210MW) 420 152
RTPP-II(2 x 210MW) 420 152
RTPP- III (1 x 210MW) 210 76
RTPP- IV(1x 600MW) 600 217
SDSTPS- Stage I(2 x800MW) – DISCOMs
Commitment is 90% 1600
522
Total Thermal 5010 1757
Hydel
Donkarayi Canal PH (1 x 25MW) 25 9
Upper Sileru HES (4 x 60MW) 240 87
Lower Sileru HES (4 x 115MW) 460 167
Srisailam Right Bank PH (7 x 110MW) 770 279
NagarjunaSagar right canal PH (3x30MW) 90 33
Penna Ahobilam (2 x 10MW) 20 7
Mini Hydel Station (2 x 0.5MW) 1 0
NagarjunaSagar Tail Pond PH (2 x 25MW) 50 18
Interstate Hydel Projects
Machkund, Orissa (AP share 70%) 84 30
T.B. Station, Karnataka (AP share 80%) 57.6 21
Total Hydel including Interstate Projects 1797.6 651
Total APGENCO 6807.6 2408
12

APEPDCL
3.2.2 Central Generating stations
APDISCOMS have been purchasing power from Central Generating Stations owned /controlled by
Central Public Sector Undertakings (CPSUs) based on the long term PPAs. The list of the Stations
along with the APDISCOMs‟ share of power from these Stations (as per the Regional Energy
Account issued by SRPC for the month of Oct‟20) are indicated in the following table.
Station Capacity
Share(MW)
APEPDCL Share
(MW)
NTPC-(SR) Ramagundam I & II 273.42 150.15
NTPC-(SR) Ramagundam- III 68.8 37.37
NTPC-Talcher-II 175.2 81.71
NTPC Simhadri Stage-I 461.1 167.01
NTPC Simhadri Stage-II 190 93.70
NLC TS II Stage-I 47.65 17.26
NLC TS II Stage-II 86.93 31.48
NPC-MAPS 18.4 6.66
NPC-Kaiga 1 & 2 56.28 42.10
NPC-Kaiga 3 & 4 59.95
Vallur (JV) NTPC with TANGEDCO 87.9 31.85
NLC-TNPL Tuticorin 123.23 44.63
NTPC-Kudgi 215.04 139.33
NTPC JNNSM Phase I 39.27 0.00
NTPC JNNSM Phase II 500 0.00
NNTPS 52.8 19.12
Total CGS 2455.94 862.38
The PPA with NTPC Ramagundam I & II was expired on 31.10.2017 and the PPA with NLC TPS-II
Stage-I & II is going to expire by 31.03.2021. Power procurement is continued from Ramagundam I
& II plant owing to its low price. Relevant clause which allows the DISCOMs to continue to procure
power from these plants is indicated as below:
Provided that this Agreement may be mutually extended/ renewed or replaced by another
agreement on such terms and for such further period of time as the parties may mutually agree. In
case the bulk power recipient continues to get the power from the plant, even after expiry of this
agreement without further renewal, or formal extension thereof, then all the provisions of this
agreement shall continue to operate till this agreement is formally renewed /extended or replaced.
These two projects are old stations with pithead fuel facility, and are presently operating as “Base
Load Stations” in AP Power System with cheaper cost. Average Central Transmission Charges to
the extent of Rs 0.8/Unit is currently incurred towards Inter State Transmission Charges under PoC
regime, for the procurement of power from all CGS Stations (except Simhadri-I) and other IPPs
(Sembcorp Energy& KSK) connected at CTU interface. New PoC regulation has been enacted by
the Central Electricity Regulatory Commission (CERC) with effect from 1st Novemebr,2020 which
changed the paradigm of transmission service usage based charges .With the commencement of new
PoC Regulation, CTU charges are expected to be altered and the first bill is expected to be issued in
the month of January-21. Based on the results of new PoC regime, and the adequacy of the “Base
Load” thermal capacity in the system to extend 24X7 reliable, secured and cost effective power
supply to the Consumers, continuance of procurement of power from these pithead stations would be
13
APEPDCL
examined. For the purpose of ARR exercise for the Current Financial Year and the Ensuing Financial
Year, these projects are taken into account in the Power Purchase Cost calculations.
The variable costs of Ramagundam I & II and NLC TPS-II Stage-I & II even after inclusion of PoC
Charges (Rs. 3.302per unit and Rs. 3.574per unit) will be less than the V.C of certain APGenco
Thermal Stations.
Further, APDISCOMs have been purchasing bundled power of 39.27 MW under JNNSM Phase I and
625 MW under JNNSM Phase II from thermal Stations of NTPC which was allocated by MOP/GOI
against the solar power procurement of 39.27 MW and 1250 MW by APDISCOMs respectively.
Out of 625 MW thermal power under JNNSM Phase II, 425 MW (w.e.f 21.07.2017) was allocated
from NTPC SR Stations and 200 MW (75 MW w.e.f 21.10.2017, 100 MW w.e.f 01.06.2019 & 25
MW w.e.f 01.03.2020) was allocated from NTPC WR Stations.
Clause F of the PSA of the Bundled power agreement under JNNSM Phase II states that the agreed
contracted thermal power from different stations of NTPC for bundling shall be as per the allocation
letter to be issued by MoP, Govt of India from time to time.
Further, the clause G of this PSA(the Power Supply Agreements under bundled power scheme) states
that, “if the cost of bundled power is more than the cost of agreed solar power, the APDISCOMs
shall have the right to surrender the thermal power at any point of time during the tenure of PPA”.
The per unit cost of different projects in the overall procurement portfolio of APDISCOMs for FY 19-
20 was examined and observed that the cost of bundled power in respect of procurement from 250
MW M/s Solarrepro (Solar power developer) is exceeding the cost of agreed solar power. Hence, a
letter was addressed to CMD/NTPC with a copy to the Secretary, MOP/GOI requesting for
deallocation of 125 MW thermal power allocated against 250 MW solar power from M/s Solarrepro
by mentioning the Clause G of the PSA of Bundled power Scheme. After prolonged correspondences,
CEA has deallocated the 125 MW thermal power from NTPC WR stations w.e.f 16.10.2020.
In the similar lines, a letter was addressed to CMD/NTPC on 24.10.2020 requesting for surrender of
balance 500 MW (425 MW from SR and 75 MW from WR) thermal power allocated against 1000
MW solar power from Kurnool Ultra Mega Solar park at Ghani by stating that the cost of bundled
power after inclusion of PoC charges is on higher side when compared with the cost of solar power.
AP is awaiting for reply from CEA in this context.
It is further to mention that in case if CEA accepts the proposal of AP and deallocate the power of 500
MW bundled power under JNNSM ph-II, AP will get the additional firm allocation from NTPC SR
plants in addition to the existing firm allocation from the unallocated share of SR pool as per the
Gadgil formula standard guidelines.
3.2.3 THERMAL – INDEPENDENT POWER PRODUCERS
Sembcorp Energy India Limited (Formerly Thermal Powertech Corporation India Limited:
14

APEPDCL
APDISCOMs and Telangana DISCOMs signed PPA with the company for a contracted capacity of
500 MW under Long term basis through case-I bidding for a period of 25 years w.e.f. 20.04.2015.
APDISCOMs share of contracted capacity in the plant is 46.11% i.e., 230.55 MW out of the said
total contracted capacity of 500 MW. The plant is connected to CTU network in AP. As per the PPA,
APDISCOMs are obligated to reimburse the applicable Long Term Open Access (LTOA) charges to
the generator.
KSK Mahanadi Power Corporation Limited:
APDISCOMs have PPA with KSK Mahanadi Power Corporation Limited for a contracted capacity
of 400 MW. The PPA is valid up to 31.03.2021. The plant is located in Western Region and is
connected to the CTU network. As per the PPA, APDISCOMs are obligated to reimburse the
applicable Medium Term Open Access(MTOA) charges to the generator. The generator is not
supplying power since 13-07-2020 and is not expected to resume supply in the Current Financial
Year. Since the PPA is expiring by 31st March-2021, availability from this plant is not considered in
the ARR calculations.
Hinduja:
M/s Hinduja has set up 1040 MW (2X520 MW) Thermal Power Plant at Visakhapatnam. In pursuant
to the directions of Hon‟ble APTEL power was availed till 18th July 2020. The issue of procurement
of power from this plant is presently subjudice at Hon‟ble Supreme Court of India and as such power
is not procured from this plant.
Gas Based Projects:
The installed capacities of the three old Gas based projects, from which APDISCOMs are procuring
power under different contractual obligations are as tabulated below.
Station Capacity (MW) APEPDCL Share (MW)
GGPP 216.824 78.24
SPGL 205.187 0.00
Lanco 362.00 0.00
Total 784.011 78.24
GGPP (Godavari Gas Power Plant- 216.824 MW, formerly GVK PHASE-I)
The PPA with GVK-I expired on 19.06.2015.Subsequently, APDISCOMs bought the power plant on
22.04.2016 and renamed it as GGPP. The plant is being operated by the employees deputed from
APGENCO. GoAP vide letter dated 04.05.2018 approved the proposal of APDISCOMs to hand over
the plant to APGENCO. The process of handing over the plant is under progress. APDISCOMs are at
present dispatching the energy from this plant based on the approval given by Hon‟ble APERC in the
Retail Tariff Order for FY 2020-21. APDISCOMs propose to avail the power from this plant during
FY 2021-22 also subject to the approval of Hon‟ble APERC.
SPGL (Spectrum Power Generation Limited- 205.187 MW:
The PPA with the plant got expired on 18.04.2016, APDISCOMs are presently procuring power from
15

APEPDCL
M/s SPGL on short term basis during the Financial Year 2021 as per the orders issued by the Hon‟ble
APERC in vogue.
Lanco Kondapalli Power- 362 MW:
The PPA with the plant got expired on 01-01-2016, APDISCOMs are presently procuring power
from M/s Lanco on short term basis during the Financial Year 2021 as per the orders issued by the
Hon‟ble APERC in vogue.
It is further to state that, the tenure of the Gas Supply Agreements (GSAs) pertaining to M/s
SPGL and M/s Lanco with GAIL is ending by 5th July, 2021 and the AP State Govt has already
requesting concerned authorities in Ministry of Petroleum and Natural Gas (MoPNG) and
Ministry of Power (MoP) to reallocate cheaper APM Gas to the DISCOMs‟ owned GGPP plant
for operating the same at optimum level, in the interest of Electricity consumers in the State.
3.2.4 GAS – NEW INDEPENDENT POWER PRODUCERS
APDISCOMs of erstwhile united AP State entered into long term PPAs with GVK Extension (220
MW), GVPGL(GMR Vemagiri Power Generation Limited-370 MW), Gouthami CCPP(464 MW)
and Konaseema Gas Power Limited(444.08 MW). These new IPPs were commissioned during the
years 2006 (GVPGL), 2009 (GVK Extension, Gouthami CCPP) and 2010 (Konaseema Gas Power
Limited). After bifurcation of AP State, APDISCOMs of the present AP State were allocated
46.11% of share of capacity in these plants. The Natural gas supplies from RIL KG D-6 fields to the
aforesaid IPPs became zero w.e.f. 01.03.2013. As a result, there is no generation from these plants
as of now. Further, there is no official communication from MoP&NG on the availability of natural
gas to these plants. The e-bid RLNG Scheme ended by 31.03.2017and MoP/GOI has not extended
the scheme. Therefore, APDISCOMs are not proposing to procure any power from these plants.
Further, APDISCOMs are not presently paying any fixed charges to these plants.
3.2.5 APGPCL (AP GAS POWER CORPORATION LIMITED)
APGPCL is a joint sector gas-based power project wherein AP Transco is a one of the participating
industry. APDISCOMs are availing power from this project to the extent of APTRANSCO‟s equity
share in the project. There is a change in the share pattern of APGPCL during the current financial
year, by which APGPCL transferred the APTRANSCO shares of Stage-II (42.80MW) to the some
of the participating industries as per Article 6 of Articles of Association of the company.
The latest share holding pattern is Tabulated below:
Station
Capacity Share to
AP(MW) as on 1st
April-2020
Capacity Share to
AP(MW) as on1st
Nov -2020CY
Capacity Share to
AP(MW) as on 1st
April-2020
Capacity Share to
AP(MW) as on 1st
Nov -2020CY
APGPCL
Stage-I
16 16 6 6
APGPCL
Stage-II
42.8 0 16 0
Total 58.8 16 22 6
Further, Govt. of AP addressed letter to MoP&NG cancellation of allocation of APM Gas to
APGPCL and reallocate to GGPP(Godavari Gas Power Plant) owned by APDISCOMs/
APGENCO to run at full capacity in the interest of consumers in the state vide letter dated
05.10.2020. The Power is being procured to the extent of share holding of APTRNSCO in this
project and APGPCL didn‟t furnish any particulars on expected power allocation to AP DISCOMs
for the ensuing FY 2021-22.
16

APEPDCL
3.2.6 RENEWABLE ENERGY PLANTS
APDISCOMs are having PPAs with the following Non-Conventional/Renewable Energy plants for
the second half of FY 2020-21 and FY 2021-22 as given below. Presently these NCE/RE projects
have been allocated to the APDISCOMs based on Geographical Location
Thus, as per Geographical location, the following are the NCE/RE capacities in APEPDCL
jurisdiction.
NCE/RE FY 20-21(MW) FY 21-22(MW)
Total NCE Others 83 97
NCE Solar 12 12
New Thermal Projects:
APGENCO (Thermal) – NTTPS (Stage-V) (formerly VTPS-V) of 800 MW and APPDCL (Thermal)
– SDSTPS (Stage-II) of 800 MW
The Amended and Restated PPAs are not signed as on date with APGENCO/ APPDCL by
APDISCOMs for supply of power to APDISCOMs.
3.3 ENERGY AVAILABILITY& DISPATCH
3.3.1 Availability:
The energy dispatches have been estimated after considering the Generators‟ projections, actual
performance of the generating Stations during FY 2019-20 and H1 of FY 2020-21, the availabilities
approved in the Retail Tariff Order for FY 2020-21, the availability of fuel, breakdown of units,
expiry of the existing PPAs during FY 2020-21 H2 and FY 2021-22, expected commissioning of new
stations and the need to maintain the spinning reserve. The expected availability of Energy as per the
Revised Estimates for FY 2020-21 and ARR estimates for the FY 2021-22 in MU are indicated in the
following tables.
TYPE OF NCE PROJECT CAPACITY SHARE
(MW) FY 2020-21 H2
CAPACITY
SHARE(MW) FY
2021-22
Biomass power projects including Co-gen 134.5 96.5
Bagasse Co generation 94.5 82
Mini hydel power projects 51.85 50.45
Industrial waste based power projects 21.66 21.66
Municipal waste 0 30
Solar 1966.4 2466.4
Wind 3757.15 3757.15
JNNSM-Ph-I -Bundled_Solar 39 39
JNNSM-Ph-II -Bundled_Solar 1250 1250
Total 7315.06 7793.16
17

APEPDCL
SI
No. Generating Station/Stage
AP Discoms
FY 2020-21
Availability
AP Discoms
FY 2021-22
Availability
APEPDCL
FY 20-21
Availability
APEPDCL
FY 21-22
Availability
AP Genco-Thermal
1 Dr. NTTPS 9261.3 8081.87 3354.44 2927.25
2 Dr. NTTPS-IV 3498.22 3690.75 1267.06 1336.79
3 RTPP Stage-I 3072.91 2729.83 1113.01 988.74
4 RTPP Stage-II 3181.89 2896.37 1152.48 1049.06
5 RTPP Stage-III 1565.3 1339.7 566.95 485.24
6 RTPP Stage-IV 4498.62 3889.26 1629.40 1408.69
7 Genco-Thermal Total 25078.24 22627.77 9083.34 8195.78
8 Srisailam RCPH 957.05 928.56 346.64 336.32
9 NSRCPH 75.03 112.79 27.17 40.85
10 NSTPDC PH 69.66 89.1 25.23 32.27
11 Upper Sileru 342.04 467.66 123.89 169.39
12 Lower Sileru 943.58 1089.51 341.77 394.62
13 Donkarayi 297.1 101.12 107.61 36.63
14 Penna Ahobilam 27.29 5.53 9.89 2.00
15 Minihydel(Chettipet) 2.29 2.62 0.83 0.95
16 Machkund AP Share 335.15 294.63 121.39 106.72
17 TB Dam AP Share 113.59 121.14 41.14 43.88
18 Genco Hydel Total 3162.79 3212.67 1145.56 1163.63
19 APGENCO-TOTAL 28241.03 25840.44 10228.90 9359.41
20 APGPCL Stage-I 57.2 0 20.72 0.00
21 APGPCL Stage-II 130.51 0 47.27 0.00
22 APPDCL Stage-I 10614.3 11141.01 3844.50 4035.27
23 Godavari Gas Power Plant 733.37 1019.3 265.63 369.19
24 Joint Sector-TOTAL 11535.38 12160.31 4178.11 4404.46
25 NTPC(SR) Ramagundam I & II 1861.73 1823.71 674.32 660.55
26 NTPC(SR) Simhadri Stage-I 3512.2 3594.27 1272.12 1301.85
27 NTPC(SR) Simhadri Stage-II 1412.08 1448.75 511.46 524.74
28 NTPC(SR) Talcher Stage-II 1299.05 1289.91 470.52 467.21
29 NTPC(SR) Ramagundam III 434.4 455.73 157.34 165.07
30 NTPC Kudgi Stage-I 1679.19 1502.59 608.20 544.24
31 NTECL Valluru 617.3 468.79 223.59 169.80
32 NLC Stage-I 266.29 280.59 96.45 101.63
33 NLC Stage-II 366.02 520.73 132.57 188.61
34 NPC(MAPS) 50.26 51.81 18.20 18.77
35 NPC(KAIGA unit I,II,III,IV) 792.99 815.81 287.22 295.49
36 NTPL(NLC TamilNadu) 922.64 875 334.18 316.93
37 NLC NNTPS 256.81 368.16 93.02 133.35
38 JNNSM Ph-1 Thermal 216.32 274.82 78.35 99.54
39 JNNSM Ph-2 Thermal 3079.29 3494.55 1115.32 1265.73
40 CGS TOTAL 16766.57 17265.22 6072.85 6253.46
41 KSK Mahanadi 810.4 0 293.53 0.00
42
Sembcorp Energy ( Formerly
Thermal Powertech Corporation) 1788.01 1687.48 647.62 611.21
18
APEPDCL
SI
No. Generating Station/Stage
AP Discoms
FY 2020-21
Availability
AP Discoms
FY 2021-22
Availability
APEPDCL
FY 20-21
Availability
APEPDCL
FY 21-22
Availability
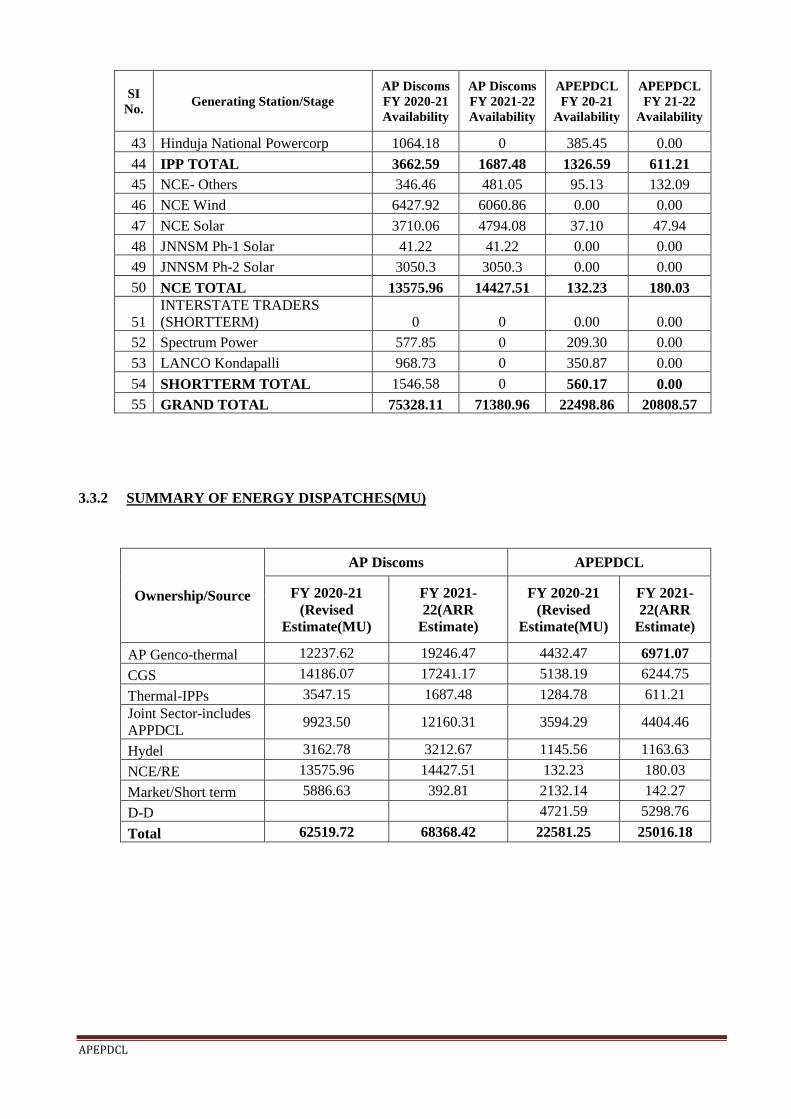
43 Hinduja National Powercorp 1064.18 0 385.45 0.00
44 IPP TOTAL 3662.59 1687.48 1326.59 611.21
45 NCE- Others 346.46 481.05 95.13 132.09
46 NCE Wind 6427.92 6060.86 0.00 0.00
47 NCE Solar 3710.06 4794.08 37.10 47.94
48 JNNSM Ph-1 Solar 41.22 41.22 0.00 0.00
49 JNNSM Ph-2 Solar 3050.3 3050.3 0.00 0.00
50 NCE TOTAL 13575.96 14427.51 132.23 180.03
51
INTERSTATE TRADERS
(SHORTTERM) 0 0 0.00 0.00
52 Spectrum Power 577.85 0 209.30 0.00
53 LANCO Kondapalli 968.73 0 350.87 0.00
54 SHORTTERM TOTAL 1546.58 0 560.17 0.00
55 GRAND TOTAL 75328.11 71380.96 22498.86 20808.57
3.3.2 SUMMARY OF ENERGY DISPATCHES(MU)
Ownership/Source
AP Discoms APEPDCL
FY 2020-21
(Revised
Estimate(MU)
FY 2021-
22(ARR
Estimate)
FY 2020-21
(Revised
Estimate(MU)
FY 2021-
22(ARR
Estimate)
AP Genco-thermal 12237.62 19246.47 4432.47 6971.07
CGS 14186.07 17241.17 5138.19 6244.75
Thermal-IPPs 3547.15 1687.48 1284.78 611.21
Joint Sector-includes
APPDCL 9923.50 12160.31 3594.29 4404.46
Hydel 3162.78 3212.67 1145.56 1163.63
NCE/RE 13575.96 14427.51 132.23 180.03
Market/Short term 5886.63 392.81 2132.14 142.27
D-D 4721.59 5298.76
Total 62519.72 68368.42 22581.25 25016.18
19

APEPDCL
3.3.3 DEFICIT / SURPLUS
Adequacy of resources from all available generating plants to meet the grid demand is given below.
After considering the generation from above availabilities from different kinds of plants on monthly
basis, there are deficits/surpluses for different months across the State as shown in the following
Table:
Month
AP Discoms
Grid Energy
Requirement (MU)
Availability from all
Stations (MU) Deficit/ (Surplus)
21-Apr 5571.36 6088.84 517.48
21-May 5719.49 6155.26 435.77
21-Jun 5463.99 5915.28 451.29
21-Jul 5608.07 6111.52 503.45
21-Aug 5646.75 6468.99 822.24
21-Sep 5590.6 5954.62 364.02
21-Oct 5727.16 5614.6 -112.56
21-Nov 5640.1 5359.85 -280.25
21-Dec 5566.75 5597.95 31.20
22-Jan 5798.94 5865.18 66.24
22-Feb 5797.29 5855.26 57.97
22-Mar 6237.93 6393.6 155.67
Total 68368.43 71380.95 3012.52
Total Deficit (MU) -392.81
Total Surplus (MU) 3405.33
DISCOMs proposes to bridge the monthly deficit wherever it is incidental though procurement from
Market such as from Energy exchanges (IEX & PXL) or through DEEP-E Bidding portal or through
any other competitive means.
3.4 POWER PURCHASE COST
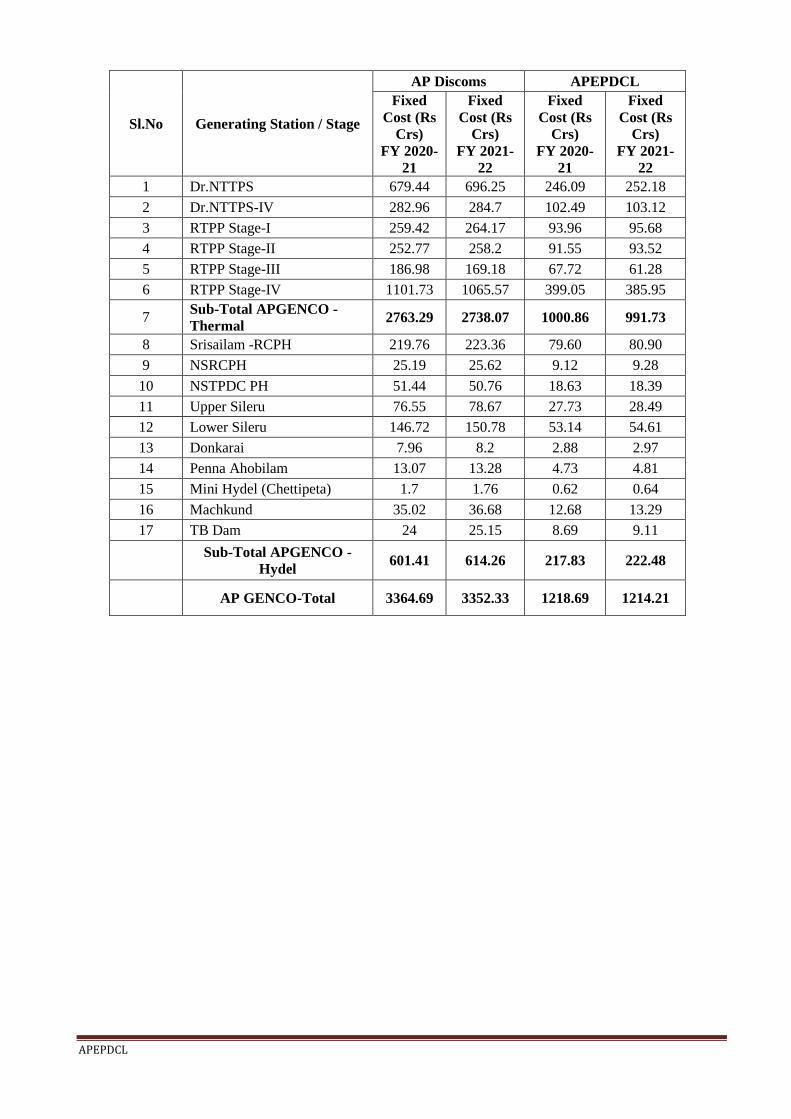
3.4.1 APGENCO STATIONS
FIXED COSTS IN RS.CRS
In respect of Dr NTTPS-I,II,III & IV and RTPP -I,II,III, the fixed costs for FY 2020-21 H2 and for the
ensuing financial year FY 2021-22were adopted as per the AP Genco Tariff Order for the 4th Control
period dated 29-04-2019 issued by the Hon‟ble APERC. For RTPP-IV, the fixed charges as indicated
in the AP Genco filings in OP No. 35 of 2018 are adopted as the matter of determination of tariffs is
under examination of the Hon‟ble APERC.
20
APEPDCL
Sl.No Generating Station / Stage
AP Discoms APEPDCL
Fixed
Cost (Rs
Crs)
FY 2020-
21
Fixed
Cost (Rs
Crs)
FY 2021-
22
Fixed
Cost (Rs
Crs)
FY 2020-
21
Fixed
Cost (Rs
Crs)
FY 2021-
22
1 Dr.NTTPS 679.44 696.25 246.09 252.18
2 Dr.NTTPS-IV 282.96 284.7 102.49 103.12
3 RTPP Stage-I 259.42 264.17 93.96 95.68
4 RTPP Stage-II 252.77 258.2 91.55 93.52
5 RTPP Stage-III 186.98 169.18 67.72 61.28
6 RTPP Stage-IV 1101.73 1065.57 399.05 385.95
7 Sub-Total APGENCO -
Thermal 2763.29 2738.07 1000.86 991.73
8 Srisailam -RCPH 219.76 223.36 79.60 80.90
9 NSRCPH 25.19 25.62 9.12 9.28
10 NSTPDC PH 51.44 50.76 18.63 18.39
11 Upper Sileru 76.55 78.67 27.73 28.49
12 Lower Sileru 146.72 150.78 53.14 54.61
13 Donkarai 7.96 8.2 2.88 2.97
14 Penna Ahobilam 13.07 13.28 4.73 4.81
15 Mini Hydel (Chettipeta) 1.7 1.76 0.62 0.64
16 Machkund 35.02 36.68 12.68 13.29
17 TB Dam 24 25.15 8.69 9.11
Sub-Total APGENCO -
Hydel 601.41 614.26 217.83 222.48
AP GENCO-Total 3364.69 3352.33 1218.69 1214.21
21
APEPDCL
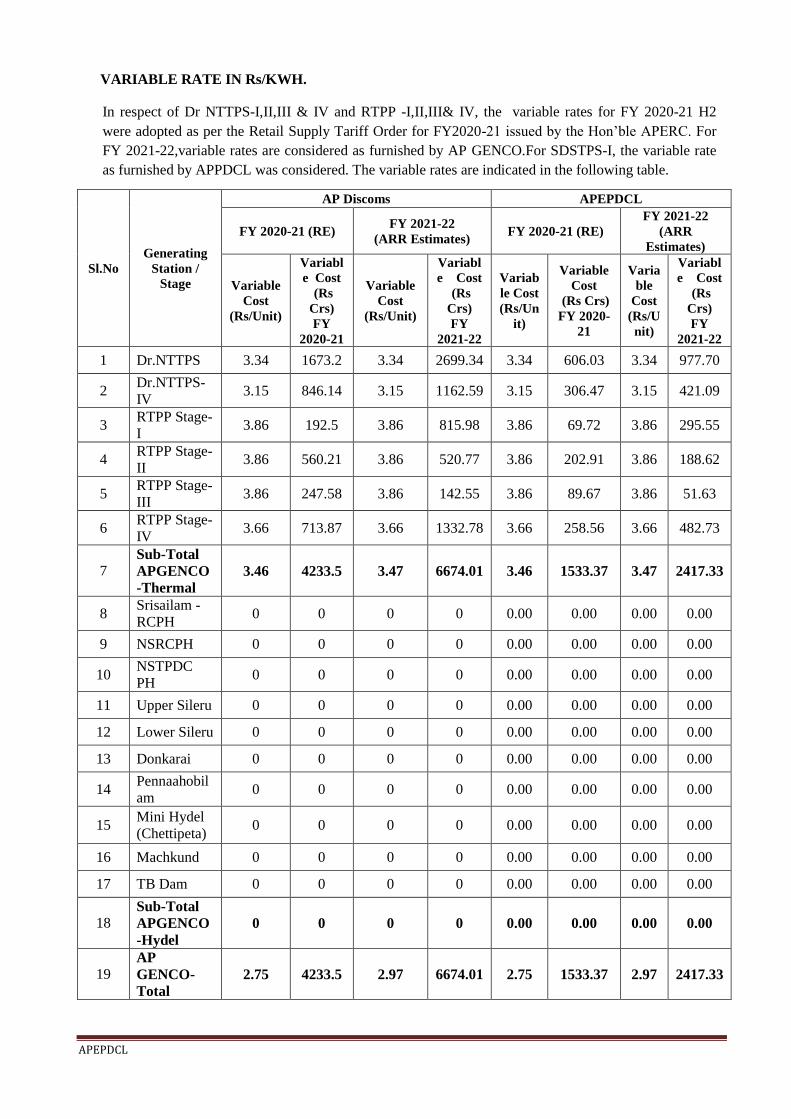
VARIABLE RATE IN Rs/KWH.
In respect of Dr NTTPS-I,II,III & IV and RTPP -I,II,III& IV, the variable rates for FY 2020-21 H2
were adopted as per the Retail Supply Tariff Order for FY2020-21 issued by the Hon‟ble APERC. For
FY 2021-22,variable rates are considered as furnished by AP GENCO.For SDSTPS-I, the variable rate
as furnished by APPDCL was considered. The variable rates are indicated in the following table.
Sl.No
Generating
Station /
Stage
AP Discoms APEPDCL
FY 2020-21 (RE) FY 2021-22
(ARR Estimates) FY 2020-21 (RE)
FY 2021-22
(ARR
Estimates)
Variable
Cost
(Rs/Unit)
Variabl
e Cost
(Rs
Crs)
FY
2020-21
Variable
Cost
(Rs/Unit)
Variabl
e Cost
(Rs
Crs)
FY
2021-22
Variab
le Cost
(Rs/Un
it)
Variable
Cost
(Rs Crs)
FY 2020-
21
Varia
ble
Cost
(Rs/U
nit)
Variabl
e Cost
(Rs
Crs)
FY
2021-22
1 Dr.NTTPS 3.34 1673.2 3.34 2699.34 3.34 606.03 3.34 977.70
2 Dr.NTTPS-
IV 3.15 846.14 3.15 1162.59 3.15 306.47 3.15 421.09
3 RTPP Stage-
I 3.86 192.5 3.86 815.98 3.86 69.72 3.86 295.55
4 RTPP Stage-
II 3.86 560.21 3.86 520.77 3.86 202.91 3.86 188.62
5 RTPP Stage-
III 3.86 247.58 3.86 142.55 3.86 89.67 3.86 51.63
6 RTPP Stage-
IV 3.66 713.87 3.66 1332.78 3.66 258.56 3.66 482.73
7 Sub-Total
APGENCO
-Thermal
3.46 4233.5 3.47 6674.01 3.46 1533.37 3.47 2417.33
8 Srisailam -
RCPH 0 0 0 0 0.00 0.00 0.00 0.00
9 NSRCPH 0 0 0 0 0.00 0.00 0.00 0.00
10 NSTPDC
PH 0 0 0 0 0.00 0.00 0.00 0.00
11 Upper Sileru 0 0 0 0 0.00 0.00 0.00 0.00
12 Lower Sileru 0 0 0 0 0.00 0.00 0.00 0.00
13 Donkarai 0 0 0 0 0.00 0.00 0.00 0.00
14 Pennaahobil
am 0 0 0 0 0.00 0.00 0.00 0.00
15 Mini Hydel
(Chettipeta) 0 0 0 0 0.00 0.00 0.00 0.00
16 Machkund 0 0 0 0 0.00 0.00 0.00 0.00
17 TB Dam 0 0 0 0 0.00 0.00 0.00 0.00
18 Sub-Total
APGENCO
-Hydel
0 0 0 0 0.00 0.00 0.00 0.00
19 AP
GENCO-
Total
2.75 4233.5 2.97 6674.01 2.75 1533.37 2.97 2417.33
22
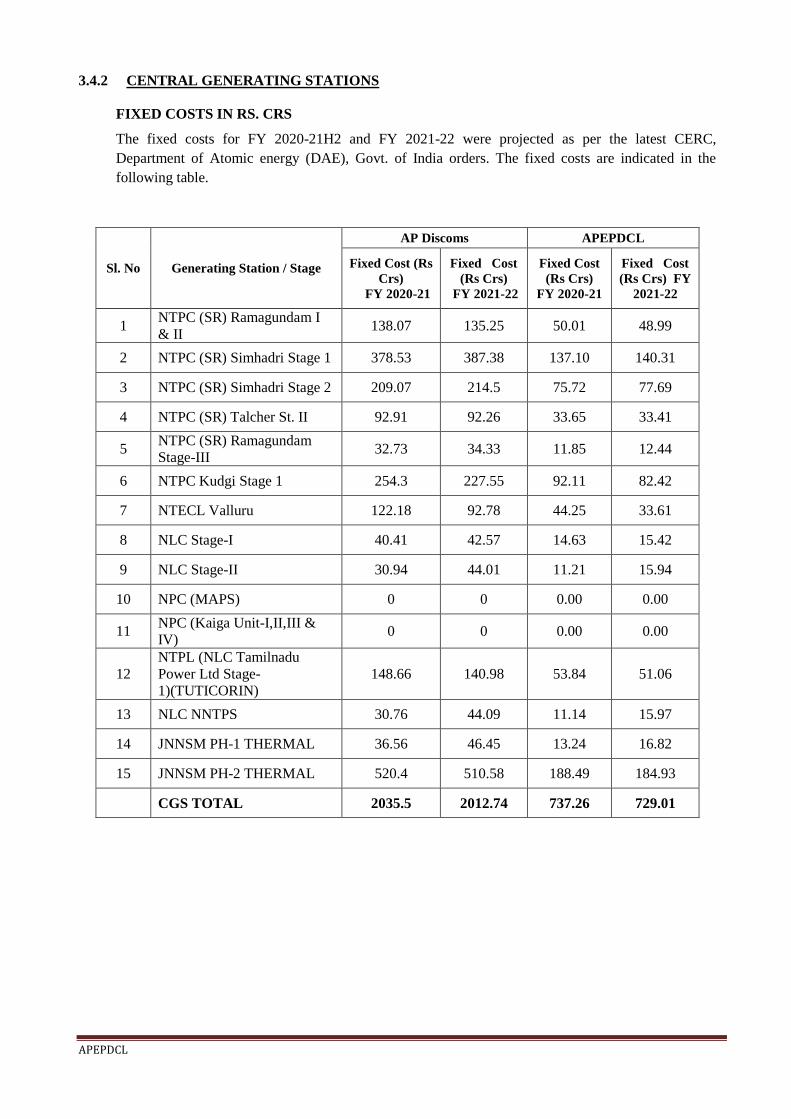
APEPDCL
3.4.2 CENTRAL GENERATING STATIONS
FIXED COSTS IN RS. CRS
The fixed costs for FY 2020-21H2 and FY 2021-22 were projected as per the latest CERC,
Department of Atomic energy (DAE), Govt. of India orders. The fixed costs are indicated in the
following table.
Sl. No Generating Station / Stage
AP Discoms APEPDCL
Fixed Cost (Rs
Crs)
FY 2020-21
Fixed Cost
(Rs Crs)
FY 2021-22
Fixed Cost
(Rs Crs)
FY 2020-21
Fixed Cost
(Rs Crs) FY
2021-22
1 NTPC (SR) Ramagundam I
& II 138.07 135.25 50.01 48.99
2 NTPC (SR) Simhadri Stage 1 378.53 387.38 137.10 140.31
3 NTPC (SR) Simhadri Stage 2 209.07 214.5 75.72 77.69
4 NTPC (SR) Talcher St. II 92.91 92.26 33.65 33.41
5 NTPC (SR) Ramagundam
Stage-III 32.73 34.33 11.85 12.44
6 NTPC Kudgi Stage 1 254.3 227.55 92.11 82.42
7 NTECL Valluru 122.18 92.78 44.25 33.61
8 NLC Stage-I 40.41 42.57 14.63 15.42
9 NLC Stage-II 30.94 44.01 11.21 15.94
10 NPC (MAPS) 0 0 0.00 0.00
11 NPC (Kaiga Unit-I,II,III &
IV) 0 0 0.00 0.00
12
NTPL (NLC Tamilnadu
Power Ltd Stage-
1)(TUTICORIN)
148.66 140.98 53.84 51.06
13 NLC NNTPS 30.76 44.09 11.14 15.97
14 JNNSM PH-1 THERMAL 36.56 46.45 13.24 16.82
15 JNNSM PH-2 THERMAL 520.4 510.58 188.49 184.93
CGS TOTAL 2035.5 2012.74 737.26 729.01
23

APEPDCL
VARIABLE RATES IN Rs/KWH
The variable Cost Rates for FY 2021-22 were projected as per the actual weighted average variable cost of
H1 FY 2020-11 with a 5% escalation to cover up the increase in Fuel Cost. .The variable rates are indicated
in the following table.
Sl.No
Generating
Station / Stage
AP Discoms APEPDCL
FY 2020-21 (RE) FY 2021-22 (ARR
Estimates) FY 2020-21 (RE)
FY 2021-22 (ARR
Estimates)
Variab
le Cost
(Rs/
Unit)
Variable
Cost
(Rs Crs)
FY 2020-
21
Varia
ble
Cost
(Rs/
Unit)
Variable
Cost (Rs
Crs) FY
2021-22
Variabl
e Cost
(Rs/
Unit)for
FY 20-
21
Variable
Cost
(Rs Crs)
FY
2020-21
Variable
Cost
(Rs/Unit
) for FY
21-22
Variable
Cost
(Rs Crs)
FY
2021-22
1
NTPC (SR)
Ramagundam
I & II
2.44 418.81 2.56 467.23 2.44 151.69 2.56 169.23
2
NTPC (SR)
Simhadri
Stage 1
3.15 860.5 3.3 1186.92 3.15 311.67 3.30 429.90
3
NTPC (SR)
Simhadri
Stage 2
3.09 373.76 3.24 470.05 3.09 135.38 3.24 170.25
4 NTPC (SR)
Talcher St. II 1.98 248.86 2.08 268.58 1.98 90.14 2.08 97.28
5
NTPC (SR)
Ramagundam
Stage-III
2.4 96.5 2.52 114.84 2.40 34.95 2.52 41.60
6 NTPC Kudgi
Stage 1 3.49 285.01 3.66 549.84 3.49 103.23 3.66 199.15
7 NTECL
Valluru 3.42 115.94 3.59 168.15 3.42 41.99 3.59 60.90
8 NLC Stage-I 2.88 75.88 3.02 84.73 2.88 27.48 3.02 30.69
9 NLC Stage-II 2.77 97.97 2.91 151.51 2.77 35.48 2.91 54.88
10 NPC (MAPS) 2.61 13.13 2.74 14.22 2.61 4.76 2.74 5.15
11
NPC (Kaiga
Unit-I,II,III &
IV)
3.48 275.57 3.65 297.67 3.48 99.81 3.65 107.82
12
NTPL (NLC
Tamilnadu
Power Ltd
Stage-
1)(TUTICORI
N)
2.9 225.44 3.04 266.35 2.90 81.66 3.04 96.47
13 NLC NNTPS 2.34 59.53 2.46 90.46 2.34 21.56 2.46 32.76
14 JNNSM PH-1
THERMAL 3.58 77.41 3.76 94.21 3.58 28.04 3.76 34.12
15 JNNSM PH-2
THERMAL 2.81 841.98 2.95 1029.6 2.81 304.97 2.95 372.92
CGS TOTAL 2.87 4066.29 3.05 5254.34 2.87 1472.81 3.05 1903.12
24

APEPDCL
3.4.3 Sri Damodaram Sanjeevaiah Thermal Power Project (SDSTPS)- Krishnapatnam:
For SDSTPS-I , the fixed charges are considered as indicated in the APPDCL filings in O.P No.53
of 2019 for determination of tariffs for FY2019-20 to FY2023-24 duly limiting to APDISCOMs
contracted share of 90% of plant capacity, the same is yet to be approved by Hon‟ble commission.
The fixed charges computed based on the above are indicated in the following table.
FIXED COSTS IN RS. CRS.
Station AP Discoms APEPDCL
FY 2020-21 FY 2021-22 FY 2020-21 FY 2021-22
SDSTPS-Stage-I 1756.38 1781.19 636.16 645.15
VARIABLE RATES RS/KWH
Station AP Discoms APEPDCL
FY 2020-21 FY 2021-22 FY 2020-21 FY 2021-22
SDSTPS-Stage-I 3.14 3.14 3.14 3.14
3.4.4 SEMBCORP ENERGY AND KSK MAHANADI
FIXED COSTS IN RS. CRS.
These are the bid based projects and the tariffs discovered in the bids were adopted by APERC.
Therefore, the fixed costs and variable costs for these Stations have been computed based on the
rates discovered in the bid. The fixed costs are indicated in the following table.
FIXED COSTS IN RS. CRS.
Station AP Discoms APEPDCL
FY 2020-21 FY 2021-22 FY 2020-21 FY 2021-22
Sembcorp Energy India
Limited 267.07 286.14 96.73 103.64
KSK Mahanadi Power
Corporation Limited 128.3 0 46.47 0.00
VARIABLE RATES RS/KWH
Station AP Discoms APEPDCL
FY 2020-21 FY 2021-22 FY 2020-21 FY 2021-22
Sembcorp Energy India
Limited 2.334 2.443 2.33 2.44
KSK Mahanadi Power
Corporation Limited 2.955 0 2.96 0.00
25
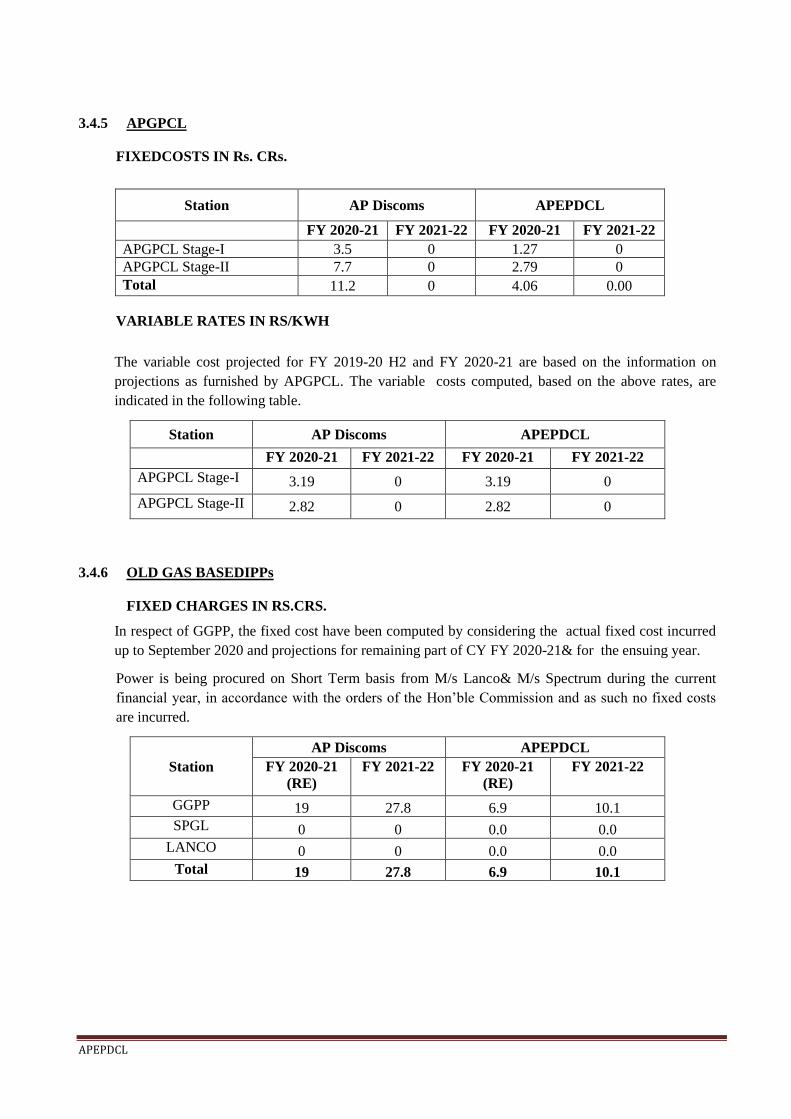
APEPDCL
3.4.5 APGPCL
FIXEDCOSTS IN Rs. CRs.
Station AP Discoms APEPDCL
FY 2020-21 FY 2021-22 FY 2020-21 FY 2021-22
APGPCL Stage-I 3.5 0 1.27 0
APGPCL Stage-II 7.7 0 2.79 0
Total 11.2 0 4.06 0.00
VARIABLE RATES IN RS/KWH
The variable cost projected for FY 2019-20 H2 and FY 2020-21 are based on the information on
projections as furnished by APGPCL. The variable costs computed, based on the above rates, are
indicated in the following table.
Station AP Discoms APEPDCL
FY 2020-21 FY 2021-22 FY 2020-21 FY 2021-22
APGPCL Stage-I 3.19 0 3.19 0
APGPCL Stage-II 2.82 0 2.82 0
3.4.6 OLD GAS BASEDIPPs
FIXED CHARGES IN RS.CRS.
In respect of GGPP, the fixed cost have been computed by considering the actual fixed cost incurred
up to September 2020 and projections for remaining part of CY FY 2020-21& for the ensuing year.
Power is being procured on Short Term basis from M/s Lanco& M/s Spectrum during the current
financial year, in accordance with the orders of the Hon‟ble Commission and as such no fixed costs
are incurred.
Station
AP Discoms APEPDCL
FY 2020-21
(RE)
FY 2021-22 FY 2020-21
(RE)
FY 2021-22
GGPP 19 27.8 6.9 10.1
SPGL 0 0 0.0 0.0
LANCO 0 0 0.0 0.0
Total 19 27.8 6.9 10.1
26

APEPDCL
VARIABLE RATES IN RS/KWH
In respect of GGPP, the variable rates have been computed by considering the GCVs, SHR, Auxiliary
Consumption and latest actual gas price which is effective from 1st October,2020 ($1.79/MMBTU) for
H2 of FY 2020-21& Full Year of FY 2021-22.
In respect of M/s Spectrum &Lanco from whom power is being procured on Short Term basis the
weighted average Rate for FY 2020-21 works out to Rs 2.58/Unit and Rs 2.52/Unit respectively.
Station AP Discoms APEPDCL
FY 2020-21 FY 2021-22 FY 2020-21 FY 2021-22
GGPP 2.32 2.1 2.32 2.1
SPGL 2.58 0 2.6 0.0
LANCO 2.52 0 2.5 0.0
3.4.7 NEW GAS BASED IPPs
Fixed and variable costs have not been projected for these plants as there is no generation from these
plants.
3.4.8 MARKET
The rates for energy procured from Market sources is taken as per the discovered prices while taking
up the actual procurement. For the purpose estimation of power purchase cost in this ARR exercise
a weighted average single part price of Rs 3.70 per Unit is considered, basing on a 10% increase to
the weighted average price realized for the First Half of the Current Financial Year.
ENERGY REQUIREMENT
The DISCOM wise Energy Requirement are tabulated below.
The energy requirement of APDISCOMs has been arrived at by grossing up the sales with appropriate
transmission and distribution losses. The external losses (PGCIL losses) on the power purchased from
CGS (excluding NTPC Simhadri-I), KSK Mahanadi and Sembcorp Energy India Limited have also
been factored for arriving at the above energy requirement.
DISCOM FY 2020-21 FY 2021-22
APEPDCL 22581.25 25016.18
APCPDCL 15088.41 15956.64
APSPDCL 24850.05 27395.59
Total 62519.72 68368.42
27
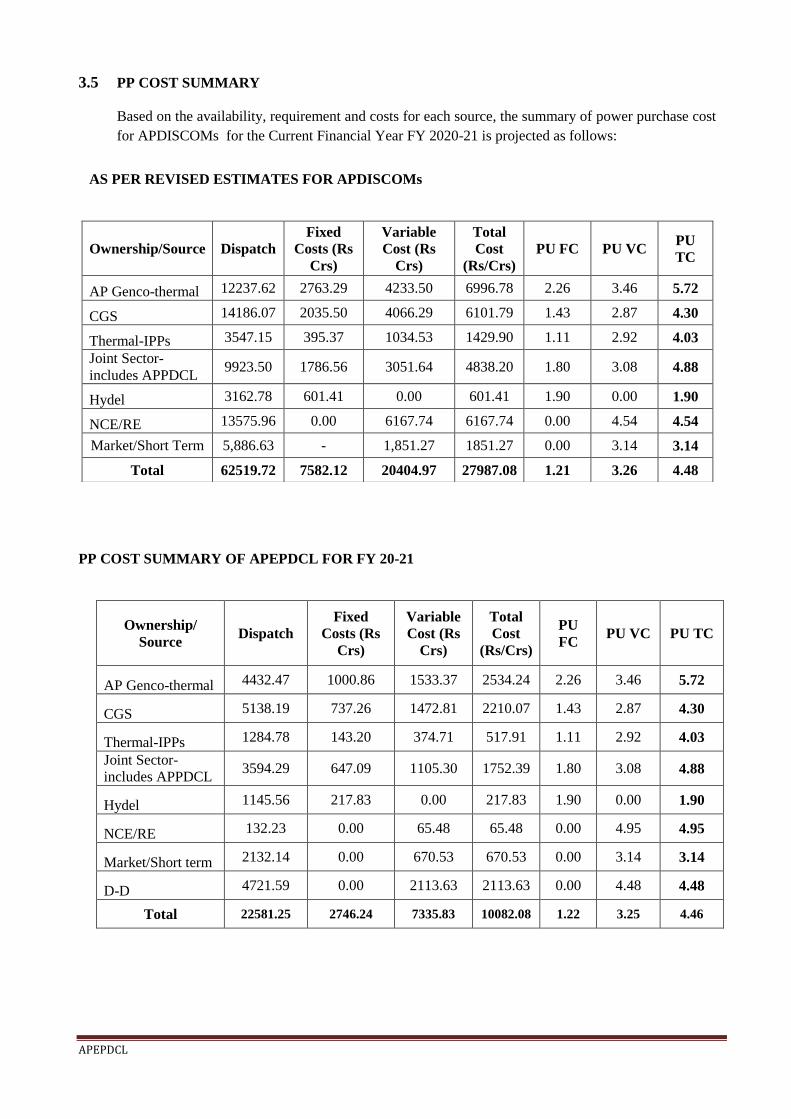
APEPDCL
3.5 PP COST SUMMARY
Based on the availability, requirement and costs for each source, the summary of power purchase cost
for APDISCOMs for the Current Financial Year FY 2020-21 is projected as follows:
PP COST SUMMARY OF APEPDCL FOR FY 20-21
Ownership/
Source Dispatch
Fixed
Costs (Rs
Crs)
Variable
Cost (Rs
Crs)
Total
Cost
(Rs/Crs)
PU
FC PU VC PU TC
AP Genco-thermal 4432.47 1000.86 1533.37 2534.24 2.26 3.46 5.72
CGS 5138.19 737.26 1472.81 2210.07 1.43 2.87 4.30
Thermal-IPPs 1284.78 143.20 374.71 517.91 1.11 2.92 4.03
Joint Sector-
includes APPDCL 3594.29 647.09 1105.30 1752.39 1.80 3.08 4.88
Hydel 1145.56 217.83 0.00 217.83 1.90 0.00 1.90
NCE/RE 132.23 0.00 65.48 65.48 0.00 4.95 4.95
Market/Short term 2132.14 0.00 670.53 670.53 0.00 3.14 3.14
D-D 4721.59 0.00 2113.63 2113.63 0.00 4.48 4.48
Total 22581.25 2746.24 7335.83 10082.08 1.22 3.25 4.46
AS PER REVISED ESTIMATES FOR APDISCOMs
Ownership/Source Dispatch
Fixed
Costs (Rs
Crs)
Variable
Cost (Rs
Crs)
Total
Cost
(Rs/Crs)
PU FC PU VC PU
TC
AP Genco-thermal 12237.62 2763.29 4233.50 6996.78 2.26 3.46 5.72
CGS 14186.07 2035.50 4066.29 6101.79 1.43 2.87 4.30
Thermal-IPPs 3547.15 395.37 1034.53 1429.90 1.11 2.92 4.03
Joint Sector-
includes APPDCL 9923.50 1786.56 3051.64 4838.20 1.80 3.08 4.88
Hydel 3162.78 601.41 0.00 601.41 1.90 0.00 1.90
NCE/RE 13575.96 0.00 6167.74 6167.74 0.00 4.54 4.54
Market/Short Term 5,886.63 - 1,851.27 1851.27 0.00 3.14 3.14
Total 62519.72 7582.12 20404.97 27987.08 1.21 3.26 4.48
28
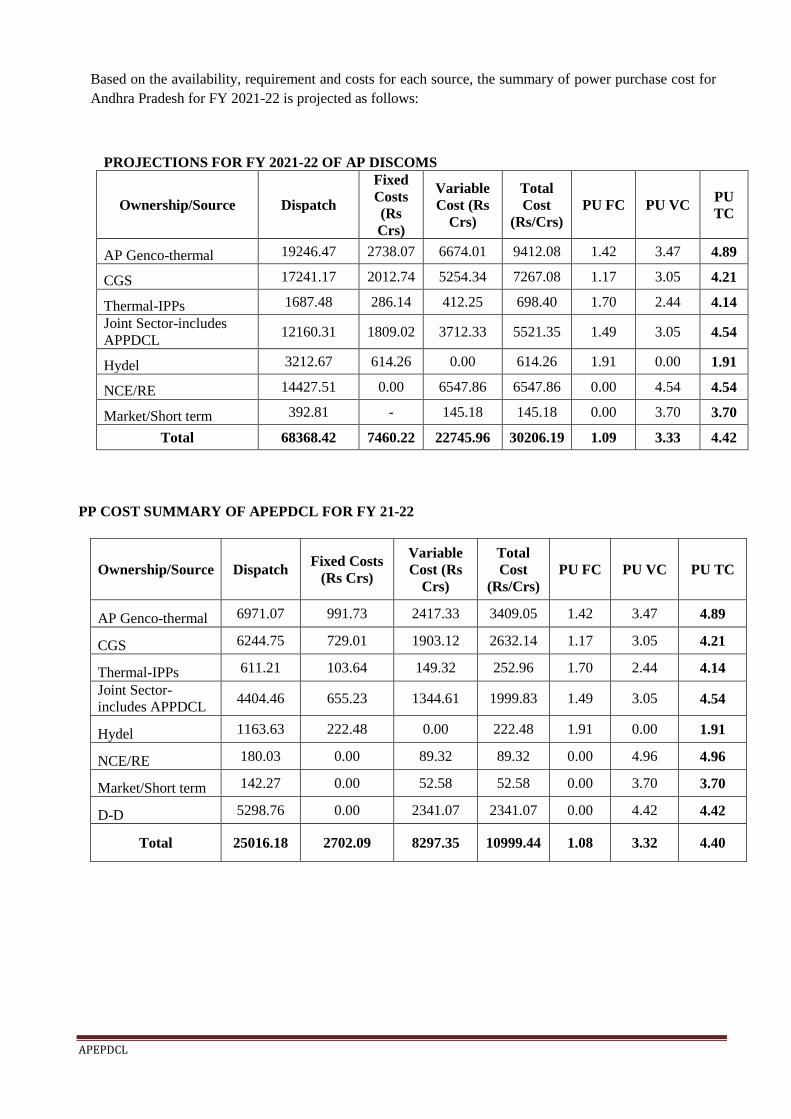
APEPDCL
Based on the availability, requirement and costs for each source, the summary of power purchase cost for
Andhra Pradesh for FY 2021-22 is projected as follows:
PROJECTIONS FOR FY 2021-22 OF AP DISCOMS
Ownership/Source Dispatch
Fixed
Costs
(Rs
Crs)
Variable
Cost (Rs
Crs)
Total
Cost
(Rs/Crs)
PU FC PU VC PU
TC
AP Genco-thermal 19246.47 2738.07 6674.01 9412.08 1.42 3.47 4.89
CGS 17241.17 2012.74 5254.34 7267.08 1.17 3.05 4.21
Thermal-IPPs 1687.48 286.14 412.25 698.40 1.70 2.44 4.14
Joint Sector-includes
APPDCL 12160.31 1809.02 3712.33 5521.35 1.49 3.05 4.54
Hydel 3212.67 614.26 0.00 614.26 1.91 0.00 1.91
NCE/RE 14427.51 0.00 6547.86 6547.86 0.00 4.54 4.54
Market/Short term 392.81 - 145.18 145.18 0.00 3.70 3.70
Total 68368.42 7460.22 22745.96 30206.19 1.09 3.33 4.42
PP COST SUMMARY OF APEPDCL FOR FY 21-22
Ownership/Source Dispatch Fixed Costs
(Rs Crs)
Variable
Cost (Rs
Crs)
Total
Cost
(Rs/Crs)
PU FC PU VC PU TC
AP Genco-thermal 6971.07 991.73 2417.33 3409.05 1.42 3.47 4.89
CGS 6244.75 729.01 1903.12 2632.14 1.17 3.05 4.21
Thermal-IPPs 611.21 103.64 149.32 252.96 1.70 2.44 4.14
Joint Sector-
includes APPDCL 4404.46 655.23 1344.61 1999.83 1.49 3.05 4.54
Hydel 1163.63 222.48 0.00 222.48 1.91 0.00 1.91
NCE/RE 180.03 0.00 89.32 89.32 0.00 4.96 4.96
Market/Short term 142.27 0.00 52.58 52.58 0.00 3.70 3.70
D-D 5298.76 0.00 2341.07 2341.07 0.00 4.42 4.42
Total 25016.18 2702.09 8297.35 10999.44 1.08 3.32 4.40
29
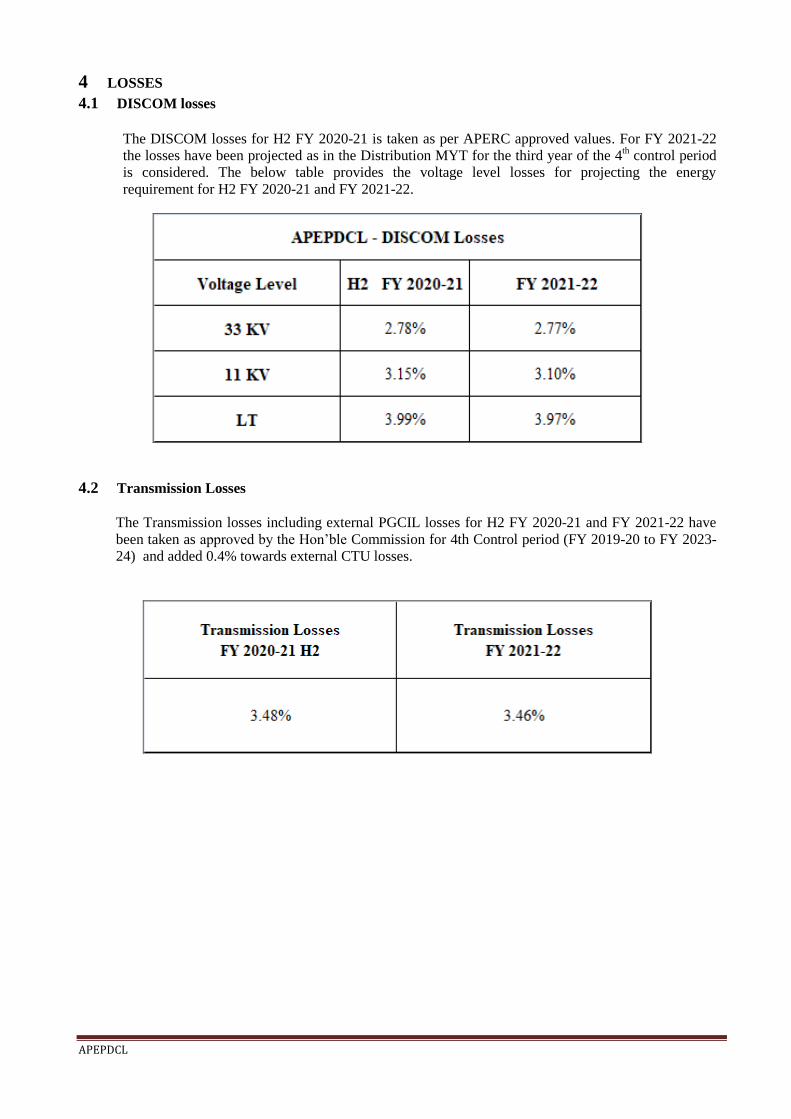
APEPDCL
4 LOSSES
4.1 DISCOM losses
The DISCOM losses for H2 FY 2020-21 is taken as per APERC approved values. For FY 2021-22
the losses have been projected as in the Distribution MYT for the third year of the 4th control period
is considered. The below table provides the voltage level losses for projecting the energy
requirement for H2 FY 2020-21 and FY 2021-22.
4.2 Transmission Losses
The Transmission losses including external PGCIL losses for H2 FY 2020-21 and FY 2021-22 have
been taken as approved by the Hon‟ble Commission for 4th Control period (FY 2019-20 to FY 2023-
24) and added 0.4% towards external CTU losses.
30

APEPDCL
5 Expenditure Projections for APEPDCL
5.1 Power Purchase and Procurement Cost
The Energy dispatch from various generating stations to APEPDCL is estimated to be 22581.25
MUforFY2020-21 and 25016.18 MU for 2021-22 and the cost of this energy would be
Rs.10082.08 Cr. and Rs. 10999.44Crs. respectively.
5.2 AP Transco Transmission Charges
The actual transmission charges for FY 2019-20 isRs.542.77Crs.The licensee has considered the
Transmission cost for FY 2020-21 as approved in the Transmission Tariff Order for the third year of
fourth control period-FY 2019-20 to FY 2023-24.
FY 2020-21
FY 2021-22
The licensee has considered the Transmission cost for FY 2021-22 as approved in the Transmission
Tariff Order for the third year of fourth control period-FY 2019-20 to FY 2023-24.
31

APEPDCL
5.3 SLDC Charges
The actual SLDC charges for 2019-20 are Rs.18.50Crs. and for FYs: 2020-21 and 2021-22 it is
estimated at Rs.11.30 Crs. and Rs.12.62Crs. based on the approved SLDC MYT Order for FYs: 2019-
20 to 2023-24.
FY 2020-21
FY 2021-22
5.4 PGCIL
The PoC rate approved by CERC for the latest quarter i.e. second quarter of FY 2020-21 is Rs.5.44
lakhs/MW/Month which includes PoC slab rate, Reliability support charges rate and HVDC charges
rate.
Based on this value, the PoC charges for FY 2020-21 H2 and FY 2021-22 have been computed in
the following manner.
PoC charges for FY 2020-21 H2
= (5.44) X (number of months in the second half of FY 2020-21) X (interstate capacity in MW
APDISCOMs are expected to avail)/100
= (5.44) X (6) X (2625.34)/100 = Rs.856.7Crs.
Total PoC charges for FY 2021-22
=(5.44) X (number of months in the FY 2021-22) X (interstate capacity in MW APDISCOMs
are expected to avail)/100
= (5.44) X (12) X (2271.65)/100 = Rs.1482.93 Crs.
32

APEPDCL
The above charges include the PoC charges reimbursable to KSK Mahanadi and Sembcorp Energy
plants.
Based on the above computations, the PGCIL Charges of APEPDCL are considered for projections
in FY 2021-22 as given below:
5.5 ULDC Charges
For FY 2020-21 and FY 21-22, ULDC charges are as shown in the table below:
5.6 Distribution Costs
The licensee has adopted the Distribution cost for FY 2020-21& 2021-22 as approved in the Wheeling
Tariff Order (Distribution Business Tariff Order)for 4th MYT control period (FY 2019-20 to 2023-
24).
The distribution costs approved for FY 2020-21 is Rs.2091 Crs. and for FY: 2021-22 is Rs. 2549 Crs.
33

APEPDCL
The details of the Distribution cost considered in present retail supply filing for the current year FY
2020-21 and for the ensuing year 2021-22 are as below:
5.7 Addl. Interest on Pension Bonds – Payable to APGENCO:
i. The pension liability of the following was vested in the APGENCO in terms of the statutory
First Transfer Scheme dated 30.01.2000 notified by the State Government under the AP
Electricity Reform Act, 1998
a) The pensioners / family pensioners of the erstwhile APSEB as on 31.01.1999 and
b) The employees of the erstwhile APSEB as on 31.01.1999 allocated to APGENCO,
APTRANSCO and the DISCOMs as per transfer scheme.
ii. An exclusive master trust was established for handling the pension liability as stated above.
The obligation entrusted to Master Trust is to pay 100% of the pension commitments of
pensioners as on 31.01.1999 and 74% of the pension commitment of employees as on
31.01.1999 and working in unbundled utilities who retired after 01.02.1999. The balance
26% is being funded by the separate P&G Trusts of the APGENCO, APTRANSCO and the
DISCOMs.
iii. In this regard, the APGENCO had issued 2 bonds (i.e. Bond I for Rs 1320.43 Cr. towards i.(a)
and Bond II for Rs 3066.52 Cr. towards i.(b)) in favour of the Master Trust. Hence
APGENCO is required to make the following annual payments as per the bond schedule –
34

APEPDCL
(a) An amount towards repayment of the principal as per the bonds schedule.
(b) Interest on the outstanding liability as per the bonds schedule.
(c) At the end of each financial year, the amount by which the annual cash payment (both
principal and interest) to be made by APGENCO to the Board of Trustees as set out
above falls short of the actuarial value of the Terminal benefits liability as may be
determined from time to time, shall be paid by APGENCO to the board of Trustees.
iv. The additional interest has been recognized and allowed in the tariff of APGENCO by the
Hon‟ble APERC in the PPA order dated 24.03.2003, tariff order for FY 2006-09 dated
04.07.2013 and also in its order dated 26.03.2016 in OP 3 of 2016 for the 3rd control period
(FY2014-15 to FY2018-2019).
v. Subsequent to the AP Reorganization Act,2014, by a transfer scheme notified by the State
Government in G.O.Ms.29 dated 31.05.2014 under the provisions of the A.P. Electricity
Reform Act, 1998, 58.32% of the outstanding pension liability (i.e. bonds issued to the Master
Trust) as on 31.03.2014 was vested in the APGENCO.
vi. The Commission provisionally approved the amounts based on actuals provided by
APGENCO Master trust towards additional interest on pension bonds for the fourth control
period i.e. FY2019-20 to FY2023-24 and approved addl. Interest on pension bonds for the
F.Y 2021-22 is Rs.345.65 Crs to EPDCL in PP Ratio 36.22% (Total approved Rs.954.30 Crs).
vii. As of now additional interest component is treated as fixed cost for the AP Genco stations, the
per unit fixed cost is skewed and misrepresented, when compared to any other plants in
Central sector or IPPs. In view of this APEPDCL has addressed to Hon‟ble Commission in
5/2020 seeking permission to pay the additional commitment of interest on pension bonds,
directly to Master trust in AP Genco without disturbing the structure of Master
Trust/Company wise trust set up as part of Tripartite Agreement for the benefit s of the
pensions/Employees.
viii. As per the Minutes of APPCC Meeting Dt.04.09.2020, it was decided to treat the expenditure
as part of DISCOMs employee cost for 2019-20 & 2020-21 instead of Power Purchase cost.
Hence Additional Interest on Pension Bonds for the F.Y 2021-22 is separated from Power
purchase cost and claimed as separate line item in ARR of FY2021-22.
ix. Additional Interest on Pension Bonds for the F.Y 2021-22 is claimed for Rs.405.10Crs and
for 2nd half of FY2020-21 is Rs204.57Crs based on actual expenditure of the F.Y 2019-20
(Rs.339.11 Crs) and F.Y 2020-21 1st half year expenditure of Rs.184.95 Crs.
5.8 Interest on Consumer Security Deposits
The details showing the interest on Consumer Security Deposit is as below.
35

APEPDCL
Interest on consumer security deposits are 5.32% in FY 2019-20. Based on the past trend, the licensee
has considered the 6.25%rate of interest for estimation of interest on consumer security deposits for
FY 2020-21 and 2021-22.
As per APERC Regulation 6 of 2004 stipulates "Security Deposit amount shall be two months
charges in case of monthly billing and 3 months charges for bi-monthly billing".
.....
"The interest accruing to the credit of the consumer shall be adjusted annually against the
amounts outstanding from the consumer to the Licensee as on 1st May of every year and the amounts
becoming due from the consumer to the Licensee immediately thereafter."
5.9 Supply Margin
Supply margin has been projected as per norms approved by Hon‟ble Commission based on RRB
approved by Hon‟ble APERC in Distribution Business Tariff order for 4th Control Period. The
Licensees has computed the supply margin at @ of 2% on equity portion of approved Regulated Rate
Base (RRB). As per the APERC approved, Regulated Rate Base in the Distribution MYT order dated
15-04-2019 is Rs.4173.07Crs. Accordingly, the licensees has arrived the supply margin at Rs.20.87
Cr.(i.e. 4173.07 x 25% x 2%).
5.10 Other Costs
The licensee has projected the following expenditure under other costs:
1) Amount payable towards AGL solar Pump sets
2) Amount payable towards Energy Efficient Pump sets
3) Difference of Transmission cost as per G.O Ms No. 13, dt:06.04.2020
4) Expenses for Safety Measures
5) Grants to APSEEDCO for promotion of Energy Conservation and Efficiency(Proposal from
Principal Secretary, Energy, Govt. of AP in letter dated 29.12.2018) as per para No.162,
Pg.No.123 of TO No.2020-21.
36
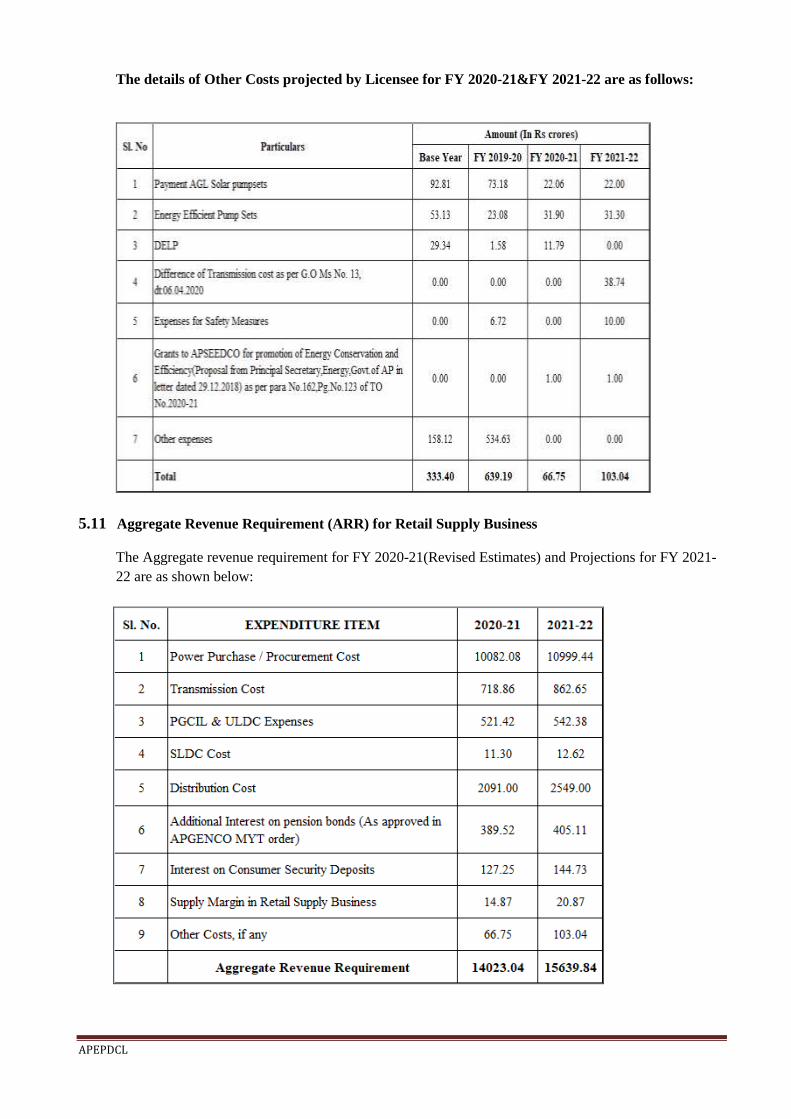
APEPDCL
The details of Other Costs projected by Licensee for FY 2020-21&FY 2021-22 are as follows:
5.11 Aggregate Revenue Requirement (ARR) for Retail Supply Business
The Aggregate revenue requirement for FY 2020-21(Revised Estimates) and Projections for FY 2021-
22 are as shown below:
37
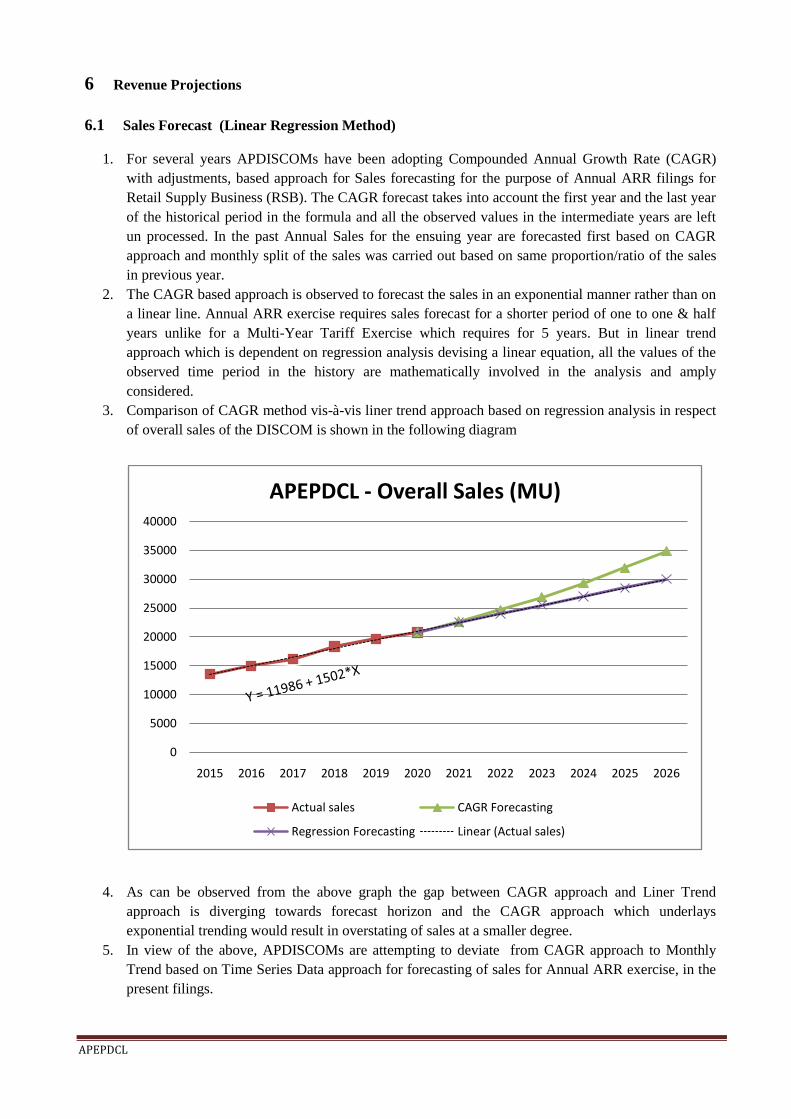
APEPDCL
6 Revenue Projections
6.1 Sales Forecast (Linear Regression Method)
1. For several years APDISCOMs have been adopting Compounded Annual Growth Rate (CAGR)
with adjustments, based approach for Sales forecasting for the purpose of Annual ARR filings for
Retail Supply Business (RSB). The CAGR forecast takes into account the first year and the last year
of the historical period in the formula and all the observed values in the intermediate years are left
un processed. In the past Annual Sales for the ensuing year are forecasted first based on CAGR
approach and monthly split of the sales was carried out based on same proportion/ratio of the sales
in previous year.
2. The CAGR based approach is observed to forecast the sales in an exponential manner rather than on
a linear line. Annual ARR exercise requires sales forecast for a shorter period of one to one & half
years unlike for a Multi-Year Tariff Exercise which requires for 5 years. But in linear trend
approach which is dependent on regression analysis devising a linear equation, all the values of the
observed time period in the history are mathematically involved in the analysis and amply
considered.
3. Comparison of CAGR method vis-à-vis liner trend approach based on regression analysis in respect
of overall sales of the DISCOM is shown in the following diagram
4. As can be observed from the above graph the gap between CAGR approach and Liner Trend
approach is diverging towards forecast horizon and the CAGR approach which underlays
exponential trending would result in overstating of sales at a smaller degree.
5. In view of the above, APDISCOMs are attempting to deviate from CAGR approach to Monthly
Trend based on Time Series Data approach for forecasting of sales for Annual ARR exercise, in the
present filings.
0
5000
10000
15000
20000
25000
30000
35000
40000
2015 2016 2017 2018 2019 2020 2021 2022 2023 2024 2025 2026
APEPDCL - Overall Sales (MU)
Actual sales CAGR Forecasting
Regression Forecasting Linear (Actual sales)
38
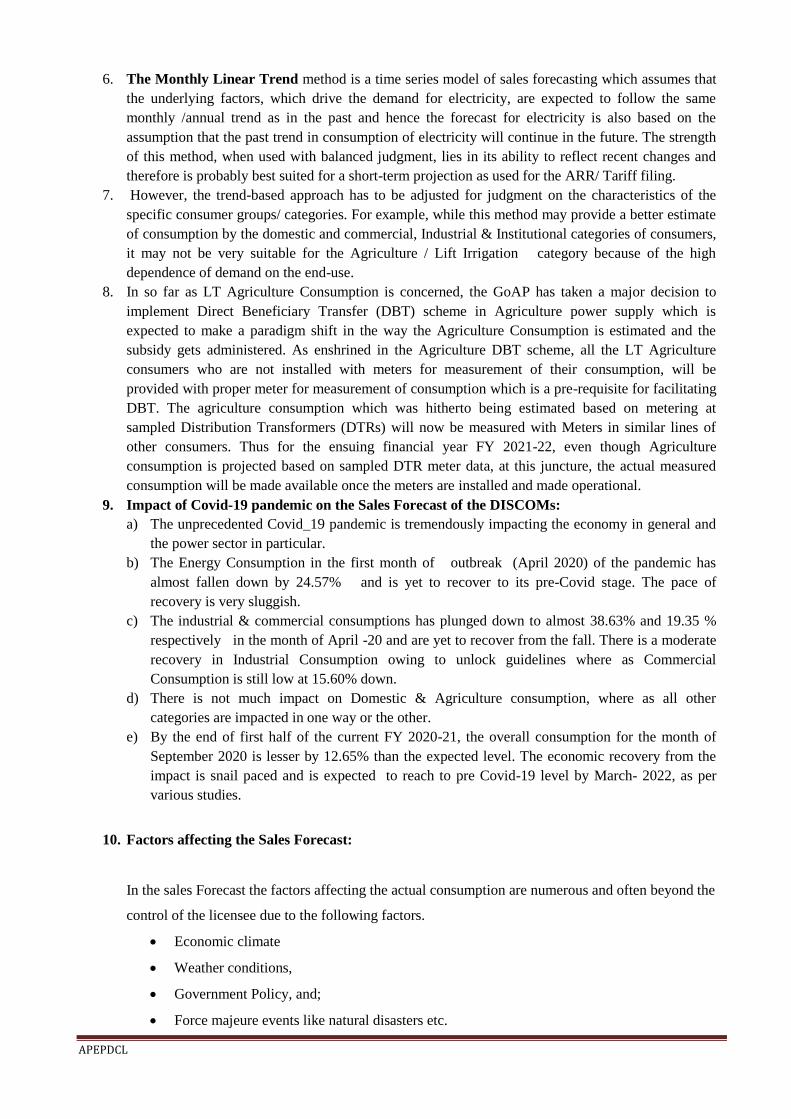
APEPDCL
6. The Monthly Linear Trend method is a time series model of sales forecasting which assumes that
the underlying factors, which drive the demand for electricity, are expected to follow the same
monthly /annual trend as in the past and hence the forecast for electricity is also based on the
assumption that the past trend in consumption of electricity will continue in the future. The strength
of this method, when used with balanced judgment, lies in its ability to reflect recent changes and
therefore is probably best suited for a short-term projection as used for the ARR/ Tariff filing.
7. However, the trend-based approach has to be adjusted for judgment on the characteristics of the
specific consumer groups/ categories. For example, while this method may provide a better estimate
of consumption by the domestic and commercial, Industrial & Institutional categories of consumers,
it may not be very suitable for the Agriculture / Lift Irrigation category because of the high
dependence of demand on the end-use.
8. In so far as LT Agriculture Consumption is concerned, the GoAP has taken a major decision to
implement Direct Beneficiary Transfer (DBT) scheme in Agriculture power supply which is
expected to make a paradigm shift in the way the Agriculture Consumption is estimated and the
subsidy gets administered. As enshrined in the Agriculture DBT scheme, all the LT Agriculture
consumers who are not installed with meters for measurement of their consumption, will be
provided with proper meter for measurement of consumption which is a pre-requisite for facilitating
DBT. The agriculture consumption which was hitherto being estimated based on metering at
sampled Distribution Transformers (DTRs) will now be measured with Meters in similar lines of
other consumers. Thus for the ensuing financial year FY 2021-22, even though Agriculture
consumption is projected based on sampled DTR meter data, at this juncture, the actual measured
consumption will be made available once the meters are installed and made operational.
9. Impact of Covid-19 pandemic on the Sales Forecast of the DISCOMs:
a) The unprecedented Covid_19 pandemic is tremendously impacting the economy in general and
the power sector in particular.
b) The Energy Consumption in the first month of outbreak (April 2020) of the pandemic has
almost fallen down by 24.57% and is yet to recover to its pre-Covid stage. The pace of
recovery is very sluggish.
c) The industrial & commercial consumptions has plunged down to almost 38.63% and 19.35 %
respectively in the month of April -20 and are yet to recover from the fall. There is a moderate
recovery in Industrial Consumption owing to unlock guidelines where as Commercial
Consumption is still low at 15.60% down.
d) There is not much impact on Domestic & Agriculture consumption, where as all other
categories are impacted in one way or the other.
e) By the end of first half of the current FY 2020-21, the overall consumption for the month of
September 2020 is lesser by 12.65% than the expected level. The economic recovery from the
impact is snail paced and is expected to reach to pre Covid-19 level by March- 2022, as per
various studies.
10. Factors affecting the Sales Forecast:
In the sales Forecast the factors affecting the actual consumption are numerous and often beyond the
control of the licensee due to the following factors.
Economic climate
Weather conditions,
Government Policy, and;
Force majeure events like natural disasters etc.
39

APEPDCL
Therefore, an accurate point-estimate of the consumption (sales by licensee) is not possible.
Under such a situation, the monthly trend approach is to look into various factors and estimate
the interrelationships to arrive at a reasonably accurate forecast within a range and use a single
point-estimate within the range for the limited purpose of estimating future costs / revenues.
Sales forecast is carried out based on actuals for the period from FY 2014-15 to FY 2019-20.
The forecast is carried out based on time series data from April‟20 to Mar‟22. Actuals for the
period April‟20 to Sep‟20 are captured for studying Covid-19 impact only. If we add Apr‟20 to
Sep‟20 monthly data in the historical data set for the forecast exercise we will get negative
trends which are not reflective of the actual trends.
Category wise Actual sales and Projected sales are shown in the following diagrams
Blue line Indicates the Historical Sales from April 2014 to March 2019, Red line indicates the
sales during COVID-19 and the dotted lines indicating the sales forecasted in Linear
Regression method
-100.00 200.00 300.00 400.00 500.00 600.00 700.00 800.00 900.00
Ap
r-1
4
Au
g-1
4
Dec
-14
Ap
r-1
5
Au
g-1
5
Dec
-15
Ap
r-1
6
Au
g-1
6
Dec
-16
Ap
r-1
7
Au
g-1
7
Dec
-17
Ap
r-1
8
Au
g-1
8
Dec
-18
Ap
r-1
9
Au
g-1
9
Dec
-19
Ap
r-2
0
Au
g-2
0
Dec
-20
Ap
r-2
1
Au
g-2
1
Dec
-21
Domestic - LT
Actual Sales Covid Effect Forecasted Sales
40
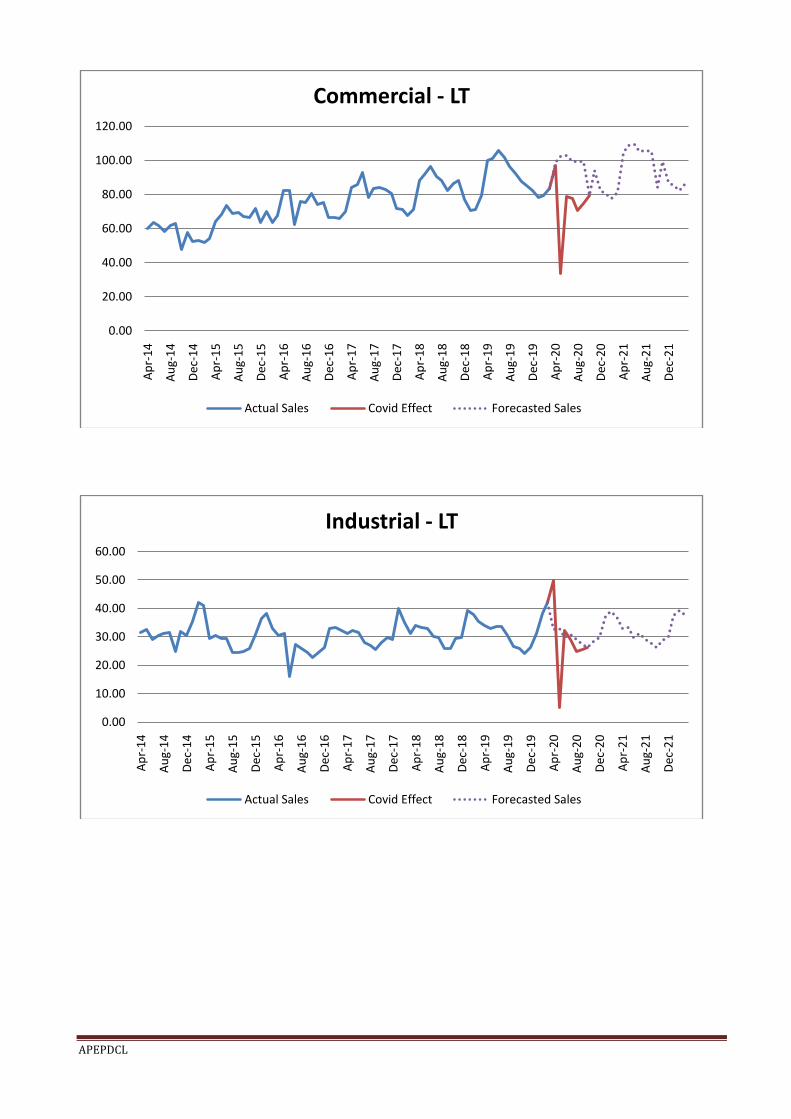
APEPDCL
0.00
20.00
40.00
60.00
80.00
100.00
120.00
Ap
r-1
4
Au
g-1
4
Dec
-14
Ap
r-1
5
Au
g-1
5
Dec
-15
Ap
r-1
6
Au
g-1
6
Dec
-16
Ap
r-1
7
Au
g-1
7
Dec
-17
Ap
r-1
8
Au
g-1
8
Dec
-18
Ap
r-1
9
Au
g-1
9
Dec
-19
Ap
r-2
0
Au
g-2
0
Dec
-20
Ap
r-2
1
Au
g-2
1
Dec
-21
Commercial - LT
Actual Sales Covid Effect Forecasted Sales
0.00
10.00
20.00
30.00
40.00
50.00
60.00
Ap
r-1
4
Au
g-1
4
Dec
-14
Ap
r-1
5
Au
g-1
5
Dec
-15
Ap
r-1
6
Au
g-1
6
Dec
-16
Ap
r-1
7
Au
g-1
7
Dec
-17
Ap
r-1
8
Au
g-1
8
Dec
-18
Ap
r-1
9
Au
g-1
9
Dec
-19
Ap
r-2
0
Au
g-2
0
Dec
-20
Ap
r-2
1
Au
g-2
1
Dec
-21
Industrial - LT
Actual Sales Covid Effect Forecasted Sales
41

APEPDCL
0.00
5.00
10.00
15.00
20.00
25.00
30.00
35.00A
pr-
14
Au
g-1
4
Dec
-14
Ap
r-1
5
Au
g-1
5
Dec
-15
Ap
r-1
6
Au
g-1
6
Dec
-16
Ap
r-1
7
Au
g-1
7
Dec
-17
Ap
r-1
8
Au
g-1
8
Dec
-18
Ap
r-1
9
Au
g-1
9
Dec
-19
Ap
r-2
0
Au
g-2
0
Dec
-20
Ap
r-2
1
Au
g-2
1
Dec
-21
Institutional - LT
Actual Sales Covid Effect Forecasted Sales
0.00
100.00
200.00
300.00
400.00
500.00
600.00
700.00
Ap
r-1
4
Au
g-1
4
Dec
-14
Ap
r-1
5
Au
g-1
5
Dec
-15
Ap
r-1
6
Au
g-1
6
Dec
-16
Ap
r-1
7
Au
g-1
7
Dec
-17
Ap
r-1
8
Au
g-1
8
Dec
-18
Ap
r-1
9
Au
g-1
9
Dec
-19
Ap
r-2
0
Au
g-2
0
Dec
-20
Ap
r-2
1
Au
g-2
1
Dec
-21
Agriculture & Related - LT
Actual Sales Covid Effect Forecasted Sales
42
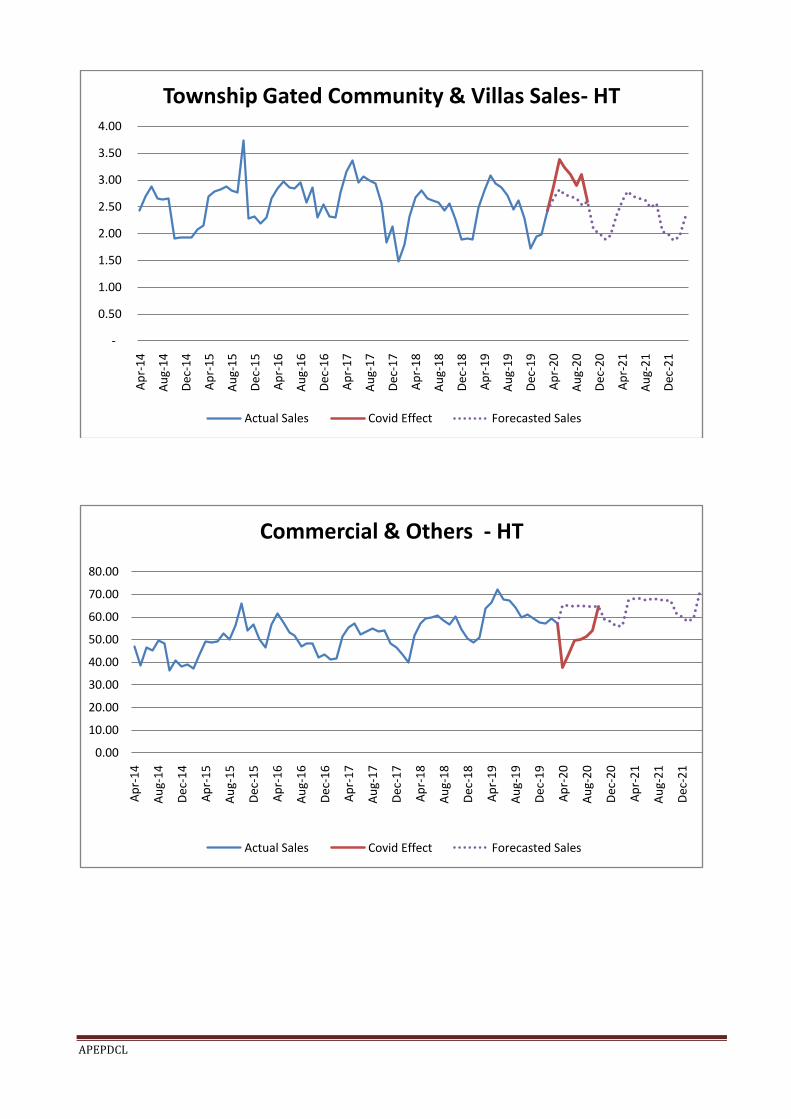
APEPDCL
-
0.50
1.00
1.50
2.00
2.50
3.00
3.50
4.00 A
pr-
14
Au
g-1
4
Dec
-14
Ap
r-1
5
Au
g-1
5
Dec
-15
Ap
r-1
6
Au
g-1
6
Dec
-16
Ap
r-1
7
Au
g-1
7
Dec
-17
Ap
r-1
8
Au
g-1
8
Dec
-18
Ap
r-1
9
Au
g-1
9
Dec
-19
Ap
r-2
0
Au
g-2
0
Dec
-20
Ap
r-2
1
Au
g-2
1
Dec
-21
Township Gated Community & Villas Sales- HT
Actual Sales Covid Effect Forecasted Sales
0.00
10.00
20.00
30.00
40.00
50.00
60.00
70.00
80.00
Ap
r-1
4
Au
g-1
4
Dec
-14
Ap
r-1
5
Au
g-1
5
Dec
-15
Ap
r-1
6
Au
g-1
6
Dec
-16
Ap
r-1
7
Au
g-1
7
Dec
-17
Ap
r-1
8
Au
g-1
8
Dec
-18
Ap
r-1
9
Au
g-1
9
Dec
-19
Ap
r-2
0
Au
g-2
0
Dec
-20
Ap
r-2
1
Au
g-2
1
Dec
-21
Commercial & Others - HT
Actual Sales Covid Effect Forecasted Sales
43

APEPDCL
0.00
100.00
200.00
300.00
400.00
500.00
600.00
700.00
Ap
r-1
4
Au
g-1
4
Dec
-14
Ap
r-1
5
Au
g-1
5
Dec
-15
Ap
r-1
6
Au
g-1
6
Dec
-16
Ap
r-1
7
Au
g-1
7
Dec
-17
Ap
r-1
8
Au
g-1
8
Dec
-18
Ap
r-1
9
Au
g-1
9
Dec
-19
Ap
r-2
0
Au
g-2
0
Dec
-20
Ap
r-2
1
Au
g-2
1
Dec
-21
Industrial Sales - HT
Actual Sales Covid Effect Forecasted Sales
0.00
10.00
20.00
30.00
40.00
50.00
60.00
70.00
80.00
90.00
Ap
r-1
4
Au
g-1
4
Dec
-14
Ap
r-1
5
Au
g-1
5
Dec
-15
Ap
r-1
6
Au
g-1
6
Dec
-16
Ap
r-1
7
Au
g-1
7
Dec
-17
Ap
r-1
8
Au
g-1
8
Dec
-18
Ap
r-1
9
Au
g-1
9
Dec
-19
Ap
r-2
0
Au
g-2
0
Dec
-20
Ap
r-2
1
Au
g-2
1
Dec
-21
Institutional - HT
Actual Sales Covid Effect Forecasted Sales
44
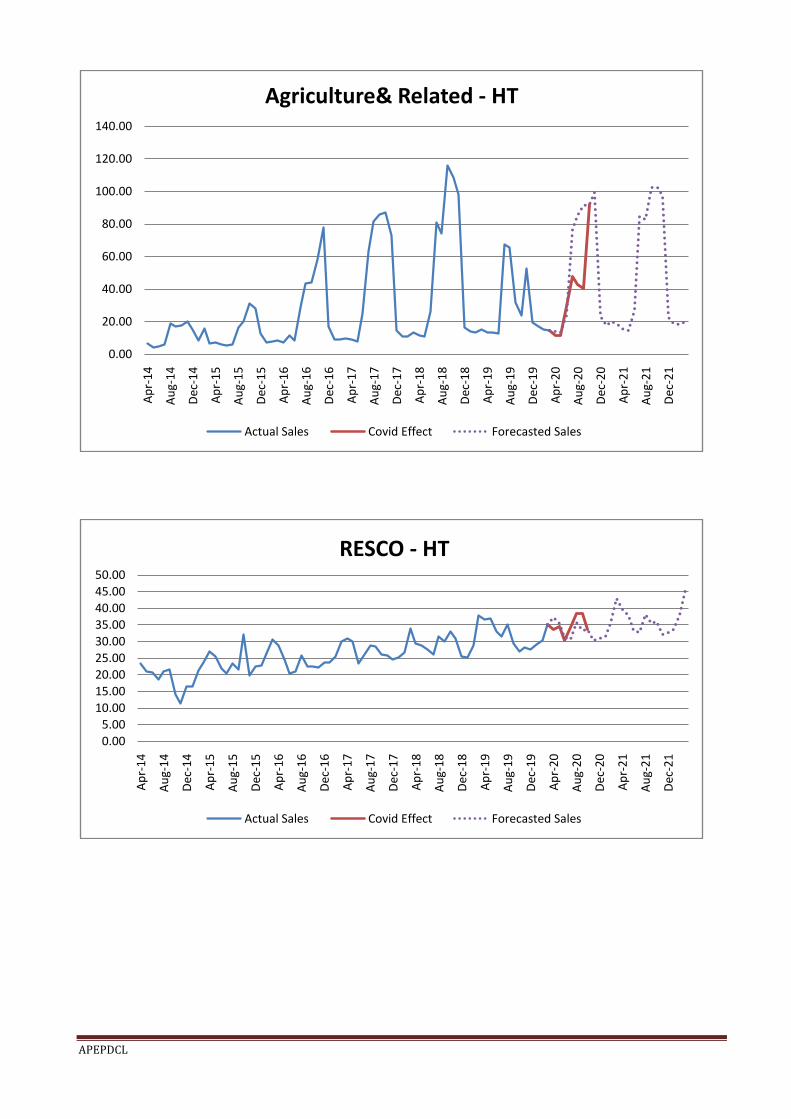
APEPDCL
0.00
20.00
40.00
60.00
80.00
100.00
120.00
140.00
Ap
r-1
4
Au
g-1
4
Dec
-14
Ap
r-1
5
Au
g-1
5
Dec
-15
Ap
r-1
6
Au
g-1
6
Dec
-16
Ap
r-1
7
Au
g-1
7
Dec
-17
Ap
r-1
8
Au
g-1
8
Dec
-18
Ap
r-1
9
Au
g-1
9
Dec
-19
Ap
r-2
0
Au
g-2
0
Dec
-20
Ap
r-2
1
Au
g-2
1
Dec
-21
Agriculture& Related - HT
Actual Sales Covid Effect Forecasted Sales
0.00
5.00
10.00
15.00
20.00
25.00
30.00
35.00
40.00
45.00
50.00
Ap
r-1
4
Au
g-1
4
Dec
-14
Ap
r-1
5
Au
g-1
5
Dec
-15
Ap
r-1
6
Au
g-1
6
Dec
-16
Ap
r-1
7
Au
g-1
7
Dec
-17
Ap
r-1
8
Au
g-1
8
Dec
-18
Ap
r-1
9
Au
g-1
9
Dec
-19
Ap
r-2
0
Au
g-2
0
Dec
-20
Ap
r-2
1
Au
g-2
1
Dec
-21
RESCO - HT
Actual Sales Covid Effect Forecasted Sales
45
APEPDCL
6.1.1 Sales Estimation for the FY 2020-21
The licensee has adopted a modified approach by considering the Linear regression method to
deviate from CAGR approach to Monthly Trend based on Time Series Data approach for
forecasting of sales for Annual ARR exercise, in the present filings including H2 for FY2020-21.
The Agricultural consumption in FY 2019-20is at total growth rate of 11.14%with 9 hours supply as
per G.O .Ms.No.17 dt 15.02.2019. In FY 2020-21 the no of hours of supply is being continued @ 9
hours/day during day time under NAVARATNALU programme of A.P. Govt. Total growth rate of
(-) 0.38% is arrived for FY2020-21 with 1.26% increase in H2 is expected for FY2020-21.
In respect of category V(E): Lift Irrigation Schemes-HT, the growth rate in FY2019-20 is (-)
54.20% . The estimated growth rate for FY 2020-21 is (-) 10.21% . The negative Growth rate is due
to the following major LI Schemes have not been operative during the period.
Pattiseema LI Scheme: The scheme is not fully operated as expected due to flood water availability
in river Krishna.
Purushottapatnam LI Scheme: The scheme was not operated at all due to pending litigation in Green
Tribunal.
46

APEPDCL
The growth rates thus adopted category wise are shown in following table:
47

APEPDCL
SALES ESTIMATES FY 2020-21
6.1.2 Sales Projections for the year FY 2021-22
The licensee has worked out Sales projections for FY2021-22 using linear regression method
which is a Monthly Trend Based on Time Series data approach for forecasting of sales as against
CAGR approach which is observed to be forecast the sales in an exponential manner rather than
on a linear line.
48

APEPDCL
In respect of category V(E): Lift Irrigation Schemes-HT, Sales for existing Major LI Schemes
Operating are only included in the projections on par with FY2018-19actuals without considering
any of the upcoming LI Schemes sales, as they are not yet started.
6.1.3 Forecasting Sales: Category- V(A): Agriculture -LT
In respect of Agriculture about 10,416 new connections are anticipated for release in FY 2021-22
based on the actuals and estimations of 2020-21. This also constitutes to about 5% increase on
present works. Thus a growth rate of 5% is adopted for FY 2021-22.
6.1.4 Process of Estimation:
In compliance to the directive of the Hon‟ble APERC with regard to estimation of Agriculture
consumption in the service area of APEPDCL, the Agriculture consumption in all the 5 circles are
being worked out. Meters were fixed on LV side of sampled DTRs feeding exclusively agricultural
services in each Mandal. In EPDCL, there are about 2,68,655 number of Agricultural services
existing at the end of September‟2020.
There are 3856Meters existing at the LV side of the DTRs to gauge the agricultural consumption as
shown in the following table
Name of the
Circle
No. of Mandals
having agricultural
services
The Mandals having
sampled DTRs as per
TF-2.10
DTRs
Metered
Srikakulam 38 30 180
Vizianagaram 34 30 307
Visakhapatnam 43 25 299
Rajahmundry 59 36 1290
Eluru 46 29 1780
Total 220 150 3856
The monthly meter readings of all the agricultural DTRs are collected from the five circles and the
consumptions are arrived. The consumptions recorded at LV side of the DTRs will be netted off by
a pre specified percentage to take care of LT network losses. The instruction of the Commission in
qualifying a particular type of LT feeder based on Line Length, Loading pattern to a certain
percentage pre specified losses is followed. The specific Agriculture consumption per HP is
estimated for all the DTRs existing in that Mandal and the same is extrapolated to all other
Agriculture Pump sets spread across the Mandal to arrive at Mandal wise estimated consumption.
The unrestricted sales projected for FY 2021-22 for this category is 2534.34MU. The growth rate
for FY 2021-22 over FY 2020-21 is 5%.
49
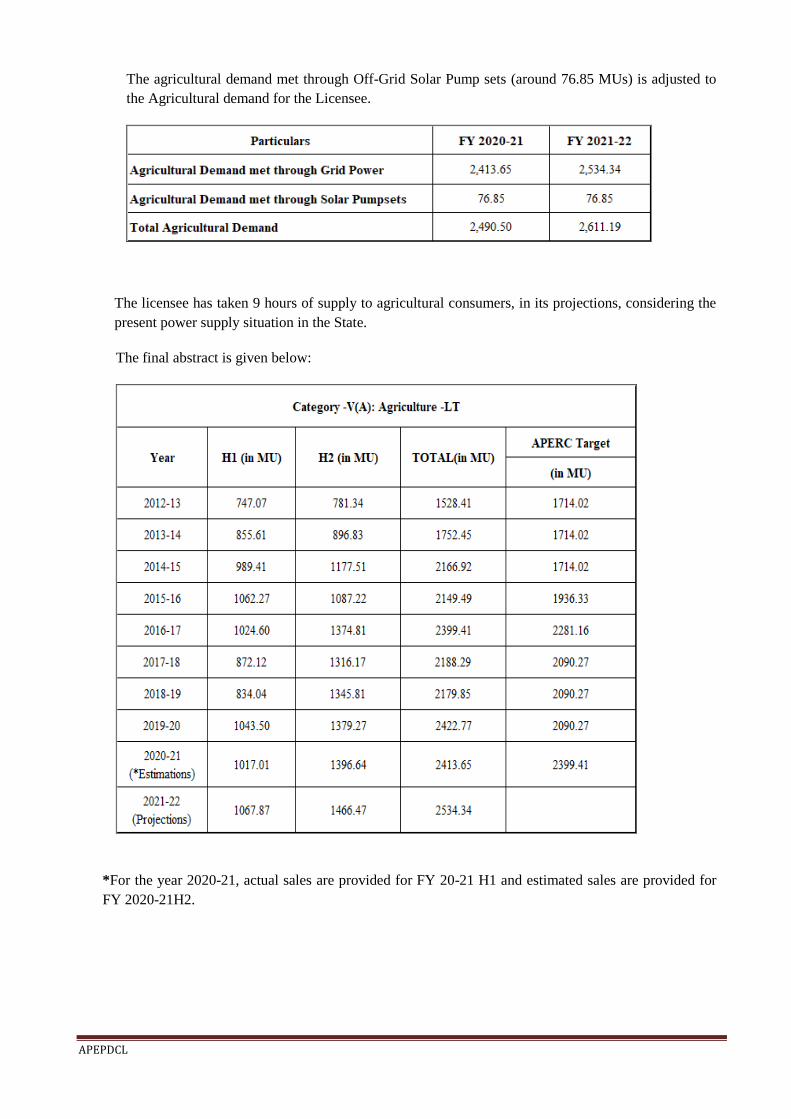
APEPDCL
The agricultural demand met through Off-Grid Solar Pump sets (around 76.85 MUs) is adjusted to
the Agricultural demand for the Licensee.
The licensee has taken 9 hours of supply to agricultural consumers, in its projections, considering the
present power supply situation in the State.
The final abstract is given below:
*For the year 2020-21, actual sales are provided for FY 20-21 H1 and estimated sales are provided for
FY 2020-21H2.
50

APEPDCL
The table below is a summary of the sales forecast for FY 2020-21 and FY 2021-22.The trend of sales
of FY 2014-15 to 2019-20 is also shown below:
Sales(MU)
51
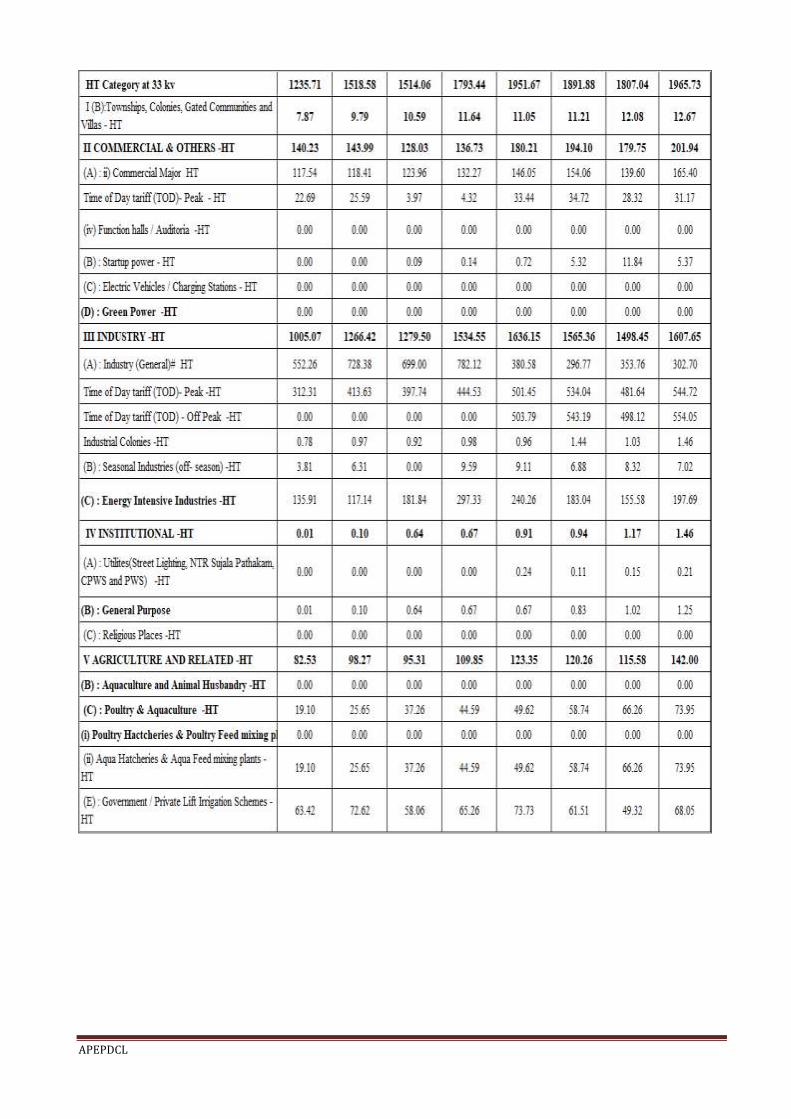
APEPDCL
52

APEPDCL
53
APEPDCL
6.2 Gross Revenue
6.2.1 Revenue from Current Tariffs (Excl. Non-Tariff Income)
The computation of revenue at current tariff for FY 2020-21 and FY 2021-22 for each customer
category is carried out as follows:
Revenue from Tariffs =
Energy Estimate * Approved Energy Charges … ……………………..……….. (a)
+ Demand Estimate * Approved Demand Charges …….……………………..... (b)
+ Incremental Revenue on account of Monthly Minimum Charges („MMC‟) … (c)
+ Customer Charges ………(d)
+ Other Charges …………. (e)
Energy charges:
For customer categories having telescopic energy tariffs, the energy estimates have been
apportioned into the slabs and then have been multiplied with the corresponding slab tariff. The
apportionment has been based on the historical break up of telescopic consumption into the
various slabs as captured in the billing information database. The energy charges are calculated in
KWH parameter for the category and as per the existing tariff rates of that category
Demand/Fixed Charges:
The estimate of demand has been made in “HP/MVA”. Billing demand is estimated as per
previous year‟s Trend and including New loads/additional FY 2021-22.
Monthly Minimum charges (MMC):
In respect of LT categories, it is the difference between the cost of units recorded and monthly
minimum charges notified in the Tariff Order.
Customer Charges:
Customer charges are as approved in tariff Order for each of the category of consumers. As per
the revised regulatory formats income from customer charges is considered as part of revenue
from tariffs.
Other Charges:
These are the charges other than the above charges.
54

APEPDCL
The gross revenue from current tariffs (excl. NTI) estimated for FY 2020-21& FY 2021-22are
tabulated below:
55

APEPDCL
6.2.2 Non-Tariff Income at Current Charges Rs. Crs.
6.2.3 Revenue from Theft of Power or Malpractices
The licensee would like to state that it is not appropriate to include this item in the ARR. This is
because the forecasts are made assuming that there will be no theft or malpractice. The Discom has
been provided a distribution loss target under the MYT and this is the basis of ARR computation.
Any instances of theft or malpractice will have a bearing on the loss target achievement and since
that is not subject to true-up, revenue from theft and malpractice should not be considered.
6.2.4 Interest income from Bank Deposits / investments
Interest income from bank deposits has been estimated at Rs. 2.07 Crs.,Rs.2.16 Crs. for the
Financial Years 2020-21 and 2021-22 respectively. The estimate is made considering a nominal
increase of 4.23%.
6.2.5 Power Purchase Rebates earned
It is estimated that Power Purchase Rebates will be earned to the extent of Rs.11.02 Crs. For FY:
2020-21 and Rs.11.48 Crs. for FY: 2021-22.
56

APEPDCL
6.2.6 Miscellaneous /Other Receipts
Miscellaneous receipts for retail supply business comprise mainly of the following receipts-
a) Capacitor Surcharge
b) Penalties from suppliers
c) Supervision Charges
d) Others
Miscellaneous receipts for FY 2020-21 is estimated as Rs.33.47 Crs based on first half of FY 20-
21and for FY 2021-22as Rs.34.88 Crores considering a nominal increase of 4.23%.
6.2.7 R.C. fees and Application fees
Considering a nominal increase of 4.23%,the R.C. fees and Application fees are projected at
Rs. 33.71 Crs and Rs. 35.13 Crs for FY 2020-21 and FY 2021-22.
6.2.8 Delayed Payment Surcharge (DPS)
Considering a nominal increase of 4.23%, the delayed payment surcharge (DPS) are estimated at
Rs.310.13 Crs for FY2020-21and Rs. 323.24 Crs for FY 2021-22.
6.2.9 Cross Subsidy Surcharge
Revenue expected from Cross Subsidy Surcharge for FY 2021-22 is Rs. 65.55 Crores.
57

APEPDCL
6.2.10 Revenue at Current Tariffs and Charges
The revenue from current tariffs estimated for FY 2021-22is tabulated as under:
58
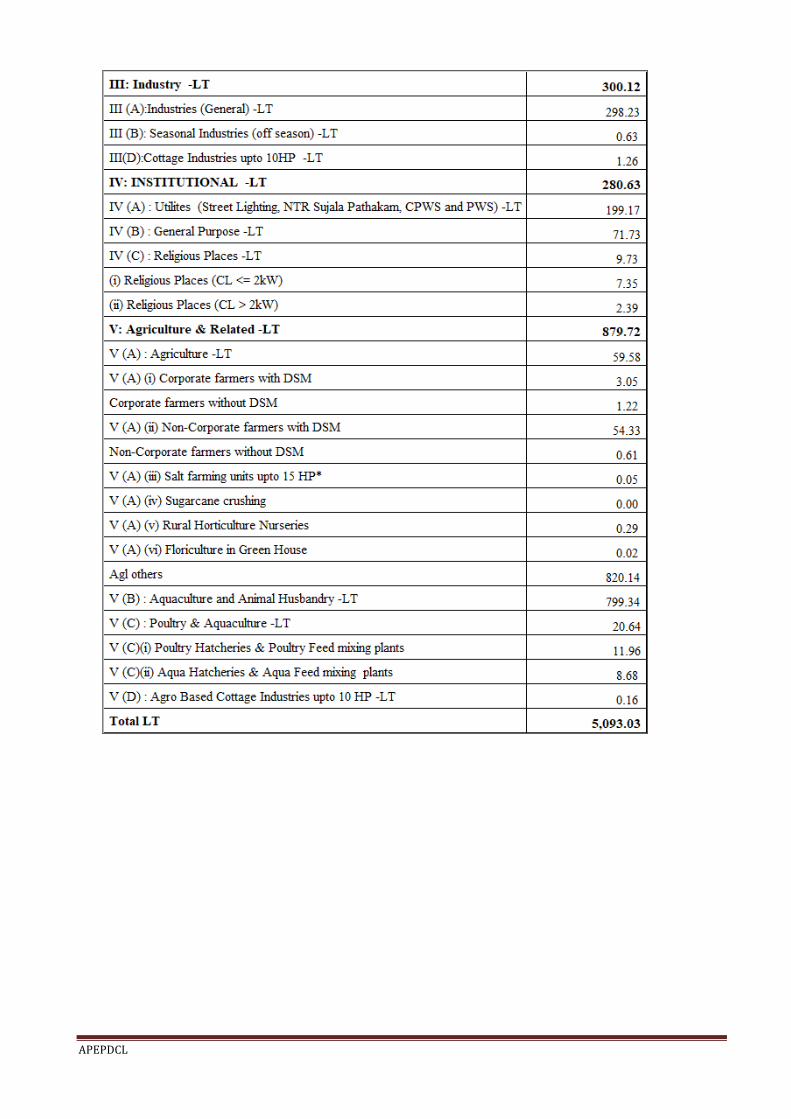
APEPDCL
59

APEPDCL
60
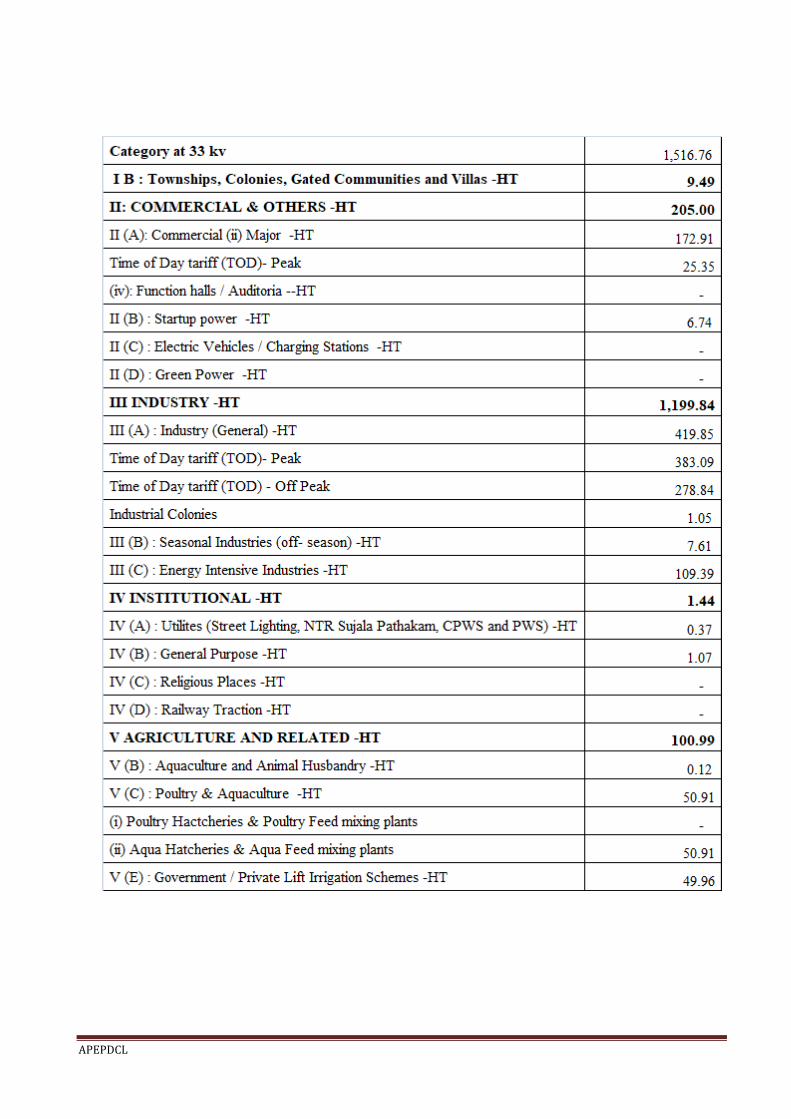
APEPDCL
61

APEPDCL
62

APEPDCL
7 Average Revenue Realized vs Average CoS break up for APEPDCL in FY 2021-22
Average Revenue Realized (ARR) for FY 2021-22through proposed tariffs is Rs.5.48 /kWh
Average Cost of Supply (CoS) for APEPDCL - Rs. 6.92/kWh
Average CoS break-up (per unit of Sales) for APEPDCL is as follows:
The estimated revenue gap for the licensee for FY 2021-22 is as follows:
63

APEPDCL
8 Energy Conservation measures taken up by APEPDCL
8.1 Energy Efficiency Initiatives
APEPDCL comprises 5 districts namely Srikakulam, Vizianagaram, Visakhapatnam, East Godavari
and West Godavari with approximately 62.5 lakhs consumers having an average demand of
2800MW per day.
8.2 Energy Conservation Initiatives taken by APEPDCL
a. Capacity building of DISCOMs:
“Capacity Building of DISCOMS” is a program launched by Bureau of Energy
Efficiency under DSM scheme for providing Man Power consultancy support for the
development and implementation of DSM action plan during 2017-2020.
This scheme is on „Strengthening of State Designated Agencies (SDAs), Discoms on the
efficient use of Energy and its Conservation.
A tripartite MoU was signed among Bureau of Energy Efficiency (BEE), State
Designated Agency (SDA), APSECM and APEPDCL on “Capacity Building of
DISCOMs” programme on 31.08.18.
BEE has appointed Confederation of Indian Industry (CII) as Project Management
Consultant (PMC) for the capacity building programme in APEPDCL. In this context, CII
has organized a 5 day training programme to the circle level officers on DSM measures
for training of master trainers.
A 3 day Circle Level Training programme was conducted in Eluru and
Rajamahendravaram circles on Demand Side Management and Energy Efficiency under
Capacity Building of Discom.
b. Energy Conservation week:
As part of Energy Conservation week APEPDCL is organizing the following activities
every year from 14th December to 20th December to create awareness on Energy
Conservation, Energy Efficiency and Renewable Energy Sources i.e. Solar etc.,
Rallies are being conducted for creating awareness among general public.
Painting Competitions are being conducted for School going children in Sub Junior,
Junior & Senior Categories on the Topic Energy Conservation & Solar Energy.
Technical quiz is being conducted for school going children to create awareness on
Energy Resources and Energy Conservation.
Workshops are being conducted for creating awareness on Energy Conservation for
general public and Engineering College Students.
Workshops are being conducted for creating awareness on Energy Conservation for
farmers.
8.3 Solar Roof Top Project
APEPDCL has taken up many initiative steps to promote Solar Rooftop (SRT). So far
2177 nos services with a capacity of 52,873KWp Solar Rooftop is synchronized to the
Grid.
64

APEPDCL
8.4 IT Initiatives
APEPDCL is exploring various modes to utilise technological developments for improving
operational efficiency and customer care. Some of the highlights of the areas in which the basic
work is completed and Go-Live or expected to Go-Live by the end of this financial year are as
follows:
1) Revamping of APEPDCL website:
The new website is developed internally by the IT-Team of APEPDCL with new features using
the latest technologies. The new website is hosted at APEPDCL Data Centre in Visakhapatnam.
Benefits:
1) The new website is re-designed and is more informative for the consumers
2) The customers can avail all the services available in Meeseva like Online payment of bills,
Online application for new services and customer services etc.
3) Chatbot facility is also made available in the new website.
2) Providing APEPDCL Services through Grama Sachivalayam and Ward Sachivalayam:
As per the instructions of the Govt. of A.P., APEPDCL is providing all its services to its
customers through the GSWS portal https://gramawardsachivalayam.ap.gov.in/GSWS/Home. The
following services are being rendered from the portal:
1) New services
2) Load Changes
3) Category Changes
4) Name Changes
5) Billing-related complaints
6) Meter-related complaints
7) Other services viz Pole shifting, Line shifting, DTR Shifting, 24 hours supply etc
Benefits:
1) Since all these services are available at the grama sachivalayams and ward
sachivalayams, citizens can experience better service standards.
2) The services can be rendered within the service levels specified by the Hon‟ble Andhra
Pradesh Electricity Regulatory Commission (APERC).
3) Real-Time Data Acquisition System (RT-DAS):
RT-DAS is a real-time data acquisition system to measure the reliability of power in the form of
SAIFI and SAIDI, which requires a solution, based on real-time. The system will be equipped to
monitor and help the utility to measure SAIFI/SAIDI.
Scheme proposed for Non-SCADA towns of R-APDRP/IPDS for SAIFI/SAIDI measurement by
erecting the FRTU panels/communication equipment in each 33/11KV sub-station to cover the
11KV urban feeders and by adopting the suitably designed software to analyse the interruptions
(ie) Scheduled/Unscheduled outages as per standard technical specifications communicated by
M/s PFC of India Ltd.
The scheme is sanctioned under IPDS for an amount of Rs.4.80Crores to cover 36Nos. Non-
SCADA towns; the works are awarded and scheduled for completion/commissioning in FY2020-
21.
65
APEPDCL
4) GIS Survey:
APEPDCL has taken up GIS survey of all its Civil assets and Electrical assets in the entire
company using the mobile app developed internally by the I.T. team. This task involved the
survey of
a) 33/11kV Sub-stations
b) 33kV feeders
c) 11kV feeders
d) Distribution Transformers
e) L.T. feeders
Benefits:
1) GIS can be used to improve coordination and operational efficiency in field workforce
activities.
2) Reduce or even replace reliance on paper by ensuring that both field and office workers use
the same data to reduce errors, boost productivity, and save money.
3) In case of emergencies such as Cyclones, DISCOM can use the GIS data for planning the
procurement and deployment of items such as poles, conductor etc. which can be useful in
decreasing the power interruptions.
5) Integrated Power Development Scheme (I.T. Enablement):
A scheme was sanctioned for an amount of Rs. 10.71 Crores for Upgradation of SAP ERP
from ECC 6.0 to Suite On HANA under IPDS (I.T. Enablement). The implementation is
completed in January-2020.
6) View Bill : View Bill' feature has been added in the website which enables the customers to view
the bill and collection details for the last 5 years. Option has also been enabled to download the e-
bill for the selected month and also to download the payment receipt of the selected month.
Also 'Energy Calculator' feature has been enhanced with the following options:
a) View detailed calculation of energy charges of latest bill
b) Assess monthly bill (energy charges) based on present reading
c) Assess monthly bill (energy charges) based on units
d) Assess monthly bill (energy charges) based on the usage of appliances
66
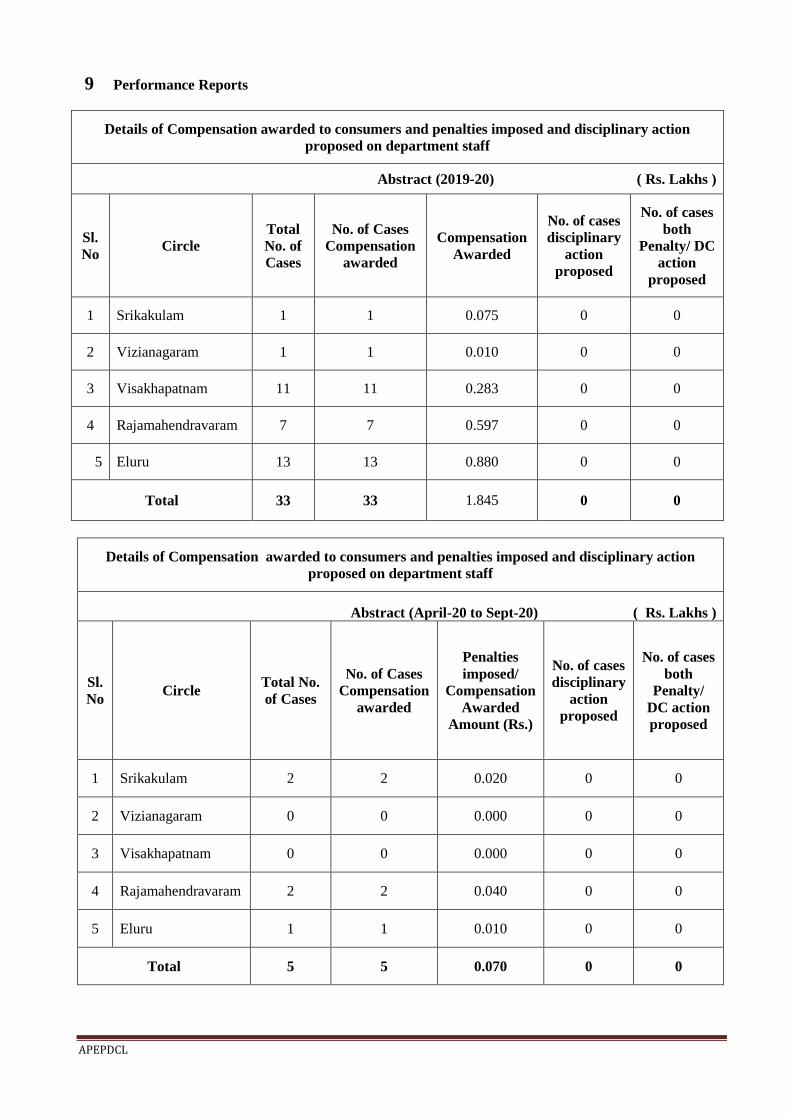
APEPDCL
9 Performance Reports
Details of Compensation awarded to consumers and penalties imposed and disciplinary action
proposed on department staff
Abstract (2019-20) ( Rs. Lakhs )
Sl.
No Circle
Total
No. of
Cases
No. of Cases
Compensation
awarded
Compensation
Awarded
No. of cases
disciplinary
action
proposed
No. of cases
both
Penalty/ DC
action
proposed
1 Srikakulam 1 1 0.075 0 0
2 Vizianagaram 1 1 0.010 0 0
3 Visakhapatnam 11 11 0.283 0 0
4 Rajamahendravaram 7 7 0.597 0 0
5 Eluru 13 13 0.880 0 0
Total 33 33 1.845 0 0
Details of Compensation awarded to consumers and penalties imposed and disciplinary action
proposed on department staff
Abstract (April-20 to Sept-20) ( Rs. Lakhs )
Sl.
No Circle
Total No.
of Cases
No. of Cases
Compensation
awarded
Penalties
imposed/
Compensation
Awarded
Amount (Rs.)
No. of cases
disciplinary
action
proposed
No. of cases
both
Penalty/
DC action
proposed
1 Srikakulam 2 2 0.020 0 0
2 Vizianagaram 0 0 0.000 0 0
3 Visakhapatnam 0 0 0.000 0 0
4 Rajamahendravaram 2 2 0.040 0 0
5 Eluru 1 1 0.010 0 0
Total 5 5 0.070 0 0
67

APEPDCL
Non Departmental Fatal Electrical Accidents (Human) occurred during 2019-20 and amount of
Ex-gratia paid
Sl.
No. District
No. of accidents occurred
No. of cases for
which ex-gratia
paid
Due to Dept. Faults
(Snapping of
conductor, defective
appliances etc.,)
Not due to Dept.
Faults
(unauthorized
work etc.,)
Total
No.
of
cases
Amount
in Rs
Lakhs
1 Srikakulam 6 23 29 13 70
2 Vizianagaram 6 15 21 4 20
3 Visakhapatnam 3 19 22 10 50
4 Rajamahendravaram 4 22 26 11 55
5 Eluru 10 24 34 10 55
EPDCL 29 103 132 48 250
Note: Out of 132 Nos. Accidents, 45 nos proposed for deletion , 48 were sanctioned , remarks called for
16 Nos, 22 Nos proposals were rejected due to no departmental fault..
Non Departmental Fatal Electrical Accidents (Human) occurred during the period from 01-4-2020
to 31-10-2020 and amount of Ex-gratia paid
Sl.
No. District
No. of accidents occurred
No. of cases for
which ex-gratia
paid
Due to Dept.
Faults (Snapping
of conductor,
defective
appliances etc.,)
Not due to Dept.
Faults
(unauthorized
work etc.,)
Total No. of
cases
Amount
in Rs
Lakhs
1 Srikakulam 8 2 10 2 10
2 Vizianagaram 9 8 17 1 5
3 Visakhapatnam 8 16 24 2 10
4 Rajamahendravaram 23 12 35 10 50
5 Eluru 26 6 32 4 20
EPDCL 74 44 118 19 95
Note : Out of 118 Nos. Accidents, proposals received for 43 Nos of which 19 nos. were sanctioned,
remarks called for 8 Nos, 7 Nos proposals were rejected due to no departmental faults and 27 Nos cases
were proposed for deletion and 48 nos proposals to be received.
68

APEPDCL
Departmental Fatal Electrical Accidents occurred during 2019-20
Sl.
No. District Total
No. of cases for which compensation paid
during 2019-20
No. of cases Amount in Rs. Lakhs
1 Srikakulam 0 0 0
2 Vizianagaram 0 0 0
3 Visakhapatnam 1 1 4.84
4 Rajamahendravaram 2 2 15.10
5 Eluru 1 1 12.24
EPDCL TOTAL 4 4 32.18
Departmental Fatal Electrical Accidents occurred during 01-04-2020 TO 31.10.2020
Sl.
No. District Total
No. of cases for which compensation paid
2020-21 (Upto Sep.)
No. of cases Amount in Rs in Lakhs
1 Srikakulam 0 0 0
2 Vizianagaram 0 0 0
3 Visakhapatnam 0 0 0
4 Rajamahendravaram 1 1 11.23
5 Eluru 2 2 13.77
EPDCL TOTAL 3 3 25.00
69

APEPDCL
No. of DTRs failed & erected during 2019-20 and 2020-21 (upto 30.09.20)
Sl.
No.
Name of
the
Circle
No. of
DTRs
existing
as on
31-03-2019
No. of
DTRs
erected
during
2019-20
No. of
DTRs
failed
during
2019-20
No. of
DTRs
existing
as on
31-03-2020
No. of
DTRs
erected
during
2020-21
(upto
30.09.20)
No. of
DTRs
failed
during
2020-21
(upto
30.09.20)
No. of
DTRs
existing
as on 30-
09-20
1 SKLM 17099 2588 1848 19687 1844 525 21531
2 VZM 16682 1944 1519 18626 2034 518 20660
3 VSP 33953 1725 1439 35678 4901 455 40579
4 RJY 49707 12661 2842 62368 5236 1288 67604
5 ELR 82800 13806 5224 96606 8102 2212 104708
EPDCL 200241 32724 12872 232965 22117 4998 255082
DTR complaints received during FY: 2019-20, attended
and balance at call centers as on 31-03-20
S.
No. Circle
No. of DTR
Complaints
to be
attended as
on 01-04-19
No. of DTR
Complaints
Received
during FY:
2019-20
No. of DTR
Complaints
attended
during FY:
2019-20
No. of
Complaints
Rejected
Balance No.
of DTR
complaints
to be
attended as
on 31-03-20
WRT BRT WRT BRT WRT BRT
1 Srikakulam 0 0 1639 1215 416 0 0 8
2 Vizianagaram 0 0 1441 1133 307 0 1 0
3 Visakhapatnam 0 0 2131 1843 287 0 1 0
4 Rajamahendravaram 1 0 3611 2839 632 0 5 136
5 Eluru 1 1 5407 4801 596 0 9 3
Total 2 1 14229 11831 2238 0 16 147
70

APEPDCL
DTR complaints received during FY: 2020-21, attended and balance
at call centers as on 30-09-20
S.No. Circle
No. of DTR
Complaints
to be
attended as
on 1-04-20
No. of DTR
Complaints
Received
during FY;
2020-21
(upto Sep.)
No. of DTR
Complaints
attended
during FY:
2020-21 (up
to Sep.)
No. of
Complaints
Rejected
during FY:
2020-21
(upto Sep.)
Balance No.
of DTR
complaints
to be
attended as
on 30-09-20
WRT BRT WRT BRT WRT BRT
1 Srikakulam 0 8 644 493 157 0 1 1
2 Vizianagaram 1 0 570 411 158 0 1 1
3 Visakhapatnam 1 0 1253 1083 165 0 6 0
4 Rajamahendravaram 5 136 1782 1469 447 0 4 3
5 Eluru 9 3 2495 1890 609 0 6 2
Total 16 147 6744 5346 1536 0 18 7
Fuse of calls received during FY: 2019-20, attended and balance
at call centers as on 31.03.2020
S.
No. Circle
No. of FOC
complaints
to be
attended as
on
01-04-2019
No. of FOC
complaints
received
during
FY 2019-20
No. of FOC
complaints
attended during
FY 2019-20
No. of
Complaints
Rejected
Balance No.
of FOC
complaints
to be
attended as
on
31.03.2020
WRT BRT WRT BRT WRT BRT
1 Srikakulam 52 38 25265 21313 3972 17 42 11
2 Vizianagaram 39 11 13644 12120 1532 9 30 3
3 Visakhapatnam 127 36 134759 119631 15156 58 69 8
4 Rajamahendravaram 101 28 90349 79714 10648 25 71 20
5 Eluru 36 10 37050 33262 3773 20 28 13
Total 355 123 301067 266040 35081 129 240 55
71
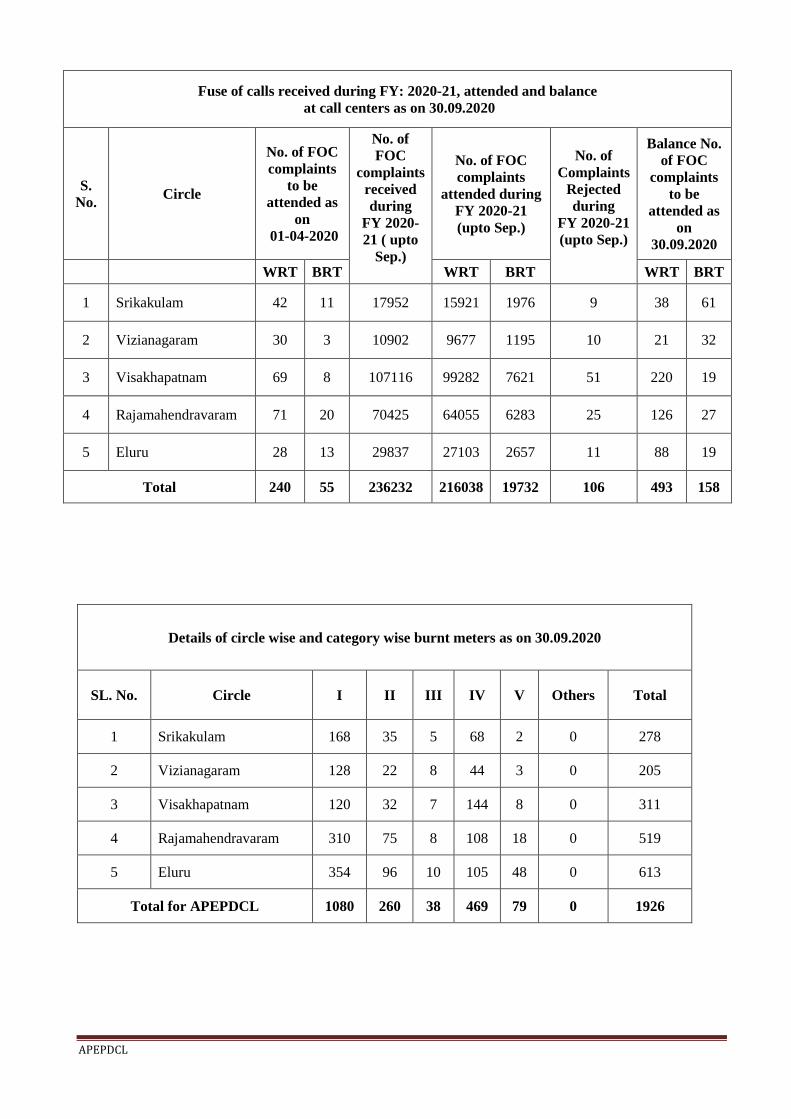
APEPDCL
Fuse of calls received during FY: 2020-21, attended and balance
at call centers as on 30.09.2020
S.
No. Circle
No. of FOC
complaints
to be
attended as
on
01-04-2020
No. of
FOC
complaints
received
during
FY 2020-
21 ( upto
Sep.)
No. of FOC
complaints
attended during
FY 2020-21
(upto Sep.)
No. of
Complaints
Rejected
during
FY 2020-21
(upto Sep.)
Balance No.
of FOC
complaints
to be
attended as
on
30.09.2020
WRT BRT WRT BRT WRT BRT
1 Srikakulam 42 11 17952 15921 1976 9 38 61
2 Vizianagaram 30 3 10902 9677 1195 10 21 32
3 Visakhapatnam 69 8 107116 99282 7621 51 220 19
4 Rajamahendravaram 71 20 70425 64055 6283 25 126 27
5 Eluru 28 13 29837 27103 2657 11 88 19
Total 240 55 236232 216038 19732 106 493 158
Details of circle wise and category wise burnt meters as on 30.09.2020
SL. No. Circle I II III IV V Others Total
1 Srikakulam 168 35 5 68 2 0 278
2 Vizianagaram 128 22 8 44 3 0 205
3 Visakhapatnam 120 32 7 144 8 0 311
4 Rajamahendravaram 310 75 8 108 18 0 519
5 Eluru 354 96 10 105 48 0 613
Total for APEPDCL 1080 260 38 469 79 0 1926
72
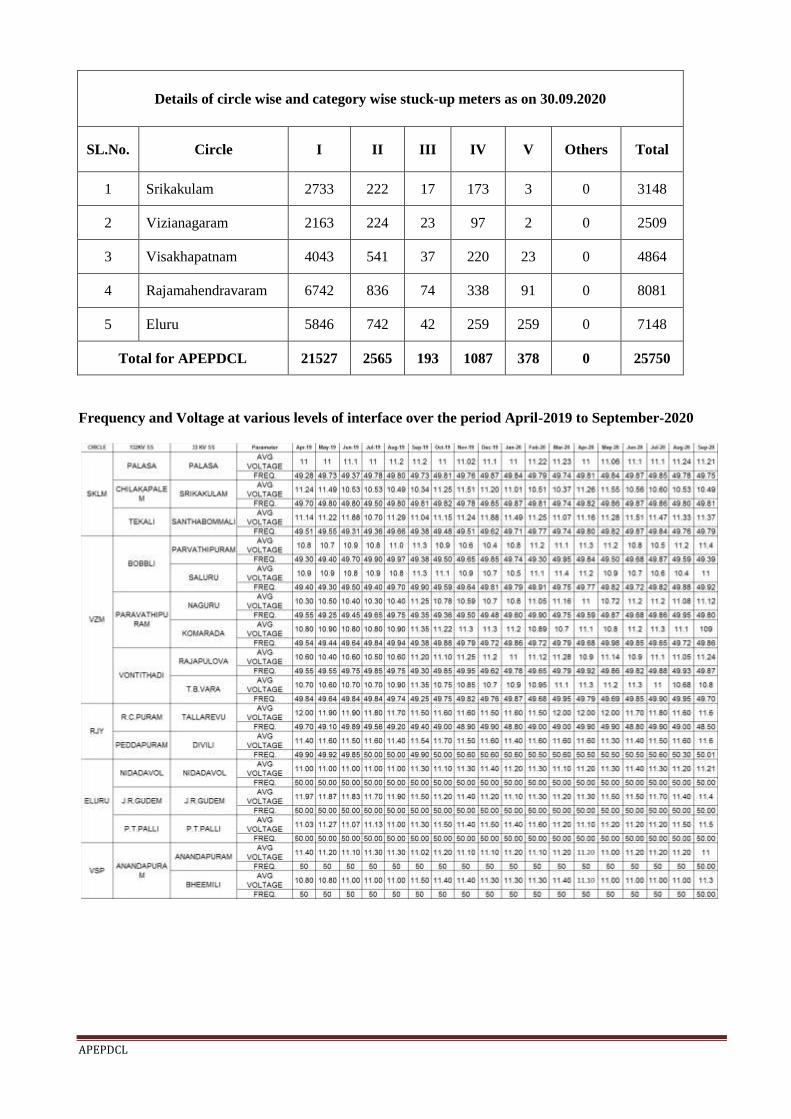
APEPDCL
Details of circle wise and category wise stuck-up meters as on 30.09.2020
SL.No. Circle I II III IV V Others Total
1 Srikakulam 2733 222 17 173 3 0 3148
2 Vizianagaram 2163 224 23 97 2 0 2509
3 Visakhapatnam 4043 541 37 220 23 0 4864
4 Rajamahendravaram 6742 836 74 338 91 0 8081
5 Eluru 5846 742 42 259 259 0 7148
Total for APEPDCL 21527 2565 193 1087 378 0 25750
Frequency and Voltage at various levels of interface over the period April-2019 to September-2020
73
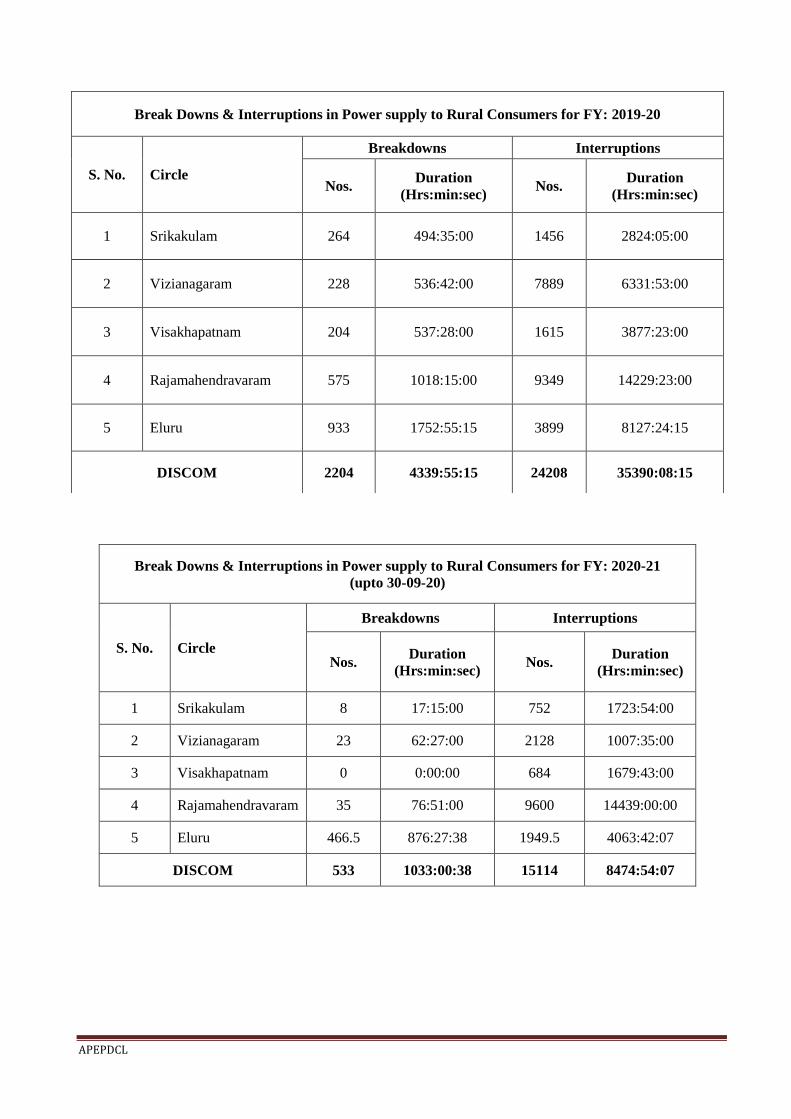
APEPDCL
Break Downs & Interruptions in Power supply to Rural Consumers for FY: 2020-21
(upto 30-09-20)
S. No. Circle
Breakdowns Interruptions
Nos. Duration
(Hrs:min:sec) Nos.
Duration
(Hrs:min:sec)
1 Srikakulam 8 17:15:00 752 1723:54:00
2 Vizianagaram 23 62:27:00 2128 1007:35:00
3 Visakhapatnam 0 0:00:00 684 1679:43:00
4 Rajamahendravaram 35 76:51:00 9600 14439:00:00
5 Eluru 466.5 876:27:38 1949.5 4063:42:07
DISCOM 533 1033:00:38 15114 8474:54:07
Break Downs & Interruptions in Power supply to Rural Consumers for FY: 2019-20
S. No. Circle
Breakdowns Interruptions
Nos. Duration
(Hrs:min:sec) Nos.
Duration
(Hrs:min:sec)
1 Srikakulam 264 494:35:00 1456 2824:05:00
2 Vizianagaram 228 536:42:00 7889 6331:53:00
3 Visakhapatnam 204 537:28:00 1615 3877:23:00
4 Rajamahendravaram 575 1018:15:00 9349 14229:23:00
5 Eluru 933 1752:55:15 3899 8127:24:15
DISCOM 2204 4339:55:15 24208 35390:08:15
74

APEPDCL
Break Downs & Interruptions in Power supply to Urban Consumers for FY:2019-20
S. No. Circle
Breakdowns Interruptions
Nos. Duration
(Hrs:min:sec) Nos.
Duration
(Hrs:min:sec)
1 Srikakulam 25 71:30:00 128 347:50:00
2 Vizianagaram 83 129:15:00 878 930:27:00
3 Visakhapatnam 73 147:21:00 924 2876:09:00
4 Rajamahendravaram 97 143:32:00 1965 4732:38:00
5 Eluru 199 408:22:10 784 2157:22:15
DISCOM 477 900:00:10 4679 11044:26:15
Break Downs & Interruptions in Power supply to Urban Consumers for FY: 2020-21
(upto 30-09-20)
S. No. Circle
Breakdowns Interruptions
No.s Duration
(Hrs:min:sec) No.s
Duration
(Hrs:min:sec)
1 Srikakulam 4 6:10:00 102 421:26:00
2 Vizianagaram 7 16:07:00 218 136:23:00
3 Visakhapatnam 2 6:20:00 347 1142:35:00
4 Rajamahendravaram 7 33:19:00 2595 6410:38:00
5 Eluru 100 204:11:05 392 1078:41:08
DISCOM 120 266:07:05 3654 9189:43:08
75

APEPDCL
Services released from 1-APR-2019 TO 31-MAR-2020 in APEPDCL
Category Name
Cat
Typ
e
Opening
Balance Regist
ered
Released Reje
cted Balance
CB_
WRT
CB_
BRT WRT BRT WRT BRT
Domestic I 14659 2888 157554 121985 28301 3942 20818 18462 2356
Commercial II 8703 1171 49977 36548 7338 3616 12326 10820 1506
Industry III 4494 321 928 110 958 19 4649 4495 154
Institutions IV 110 10 1824 979 190 56 695 362 333
Agricultural V 13252 1799 13118 1031 10112 28 17005 15148 1857
Total
41218 6189 223401 160653 46899 7661 55493 49287 6206
Services released from 1-APR-2020 TO 30-SEP-2020 in APEPDCL
Category Name
Cat
Typ
e
Opening
Balance Regist
ered
Released Reje
cted Balance
CB_
WRT
CB_
BRT WRT BRT WRT BRT
Domestic I 18462 2356 68475 51992 11590 1733 23968 20884 3084
Commercial II 10820 1506 18265 11885 2689 1588 14430 13686 744
Industry III 4495 154 203 18 130 5 4697 4669 28
Institutions IV 362 333 1406 710 166 126 1102 1072 30
Agricultural V 15148 1857 5346 318 3711 16 18339 17663 676
Total
49287 6206 93695 64923 18286 3468 62536 57974 4562
76

APEPDCL
No. of cases filed in respect of pilferage of power by DPE wing
S.No Circle
Amounts Assessed in Rs. Lakhs
2019-20 2020-21 (upto 09/20)
No. of
services
inspected
No. of
pilferage
cases
booked
Amount
realised in
Rs. Lakhs
No. of
services
inspected
No. of
pilferage
cases
booked
Amount
realised in
Rs. Lakhs
1 Srikakulam 13300 5 1.20 3060 0 0.00
2 Vizianagaram 14300 81 12.92 4854 15 1.29
3 Visakhapatnam 15831 82 28.87 5749 10 0.37
4 Rajamahendravaram 15684 122 30.55 4969 8 3.38
5 Eluru 10931 68 35.43 4005 29 12.92
6 HT-DPE 1762 0 1.08 924 0 0.00
TOTAL 71808 358 110.06 23561 62 17.97
Amounts realized through intensive inspections by field staff
Sl.N
o. Circle
2019-20 2020-21 (upto 09/20)
No. of
services
inspected
No. of
cases
booked
Amount
realised in
Rs. Lakhs
No. of
services
inspected
No. of
cases
booked
Amount
realised in
Rs. Lakhs
1 Srikakulam 110215 237 1.25 2651 88 0.85
2 Vizianagaram 448797 23929 382.28 16882 951 16.58
3 Visakhapatnam 208996 52720 1800.61 5024 729 13.88
4 Rajamahendravar
am 149018 41293 1153.31 34976 1479 61.39
5 Eluru 114131 103567 3162.74 36615 12936 385.45
TOTAL 1031157 221746 6500.20 96148 16183 478.14
77

APEPDCL
No. of cases filed in respect of Theft of energy by DPE wing
S.No Circle
Amounts Assessed in Rs. Lakhs
2019-20 2020-21 (upto 09/20)
No. of
services
inspected
No. of
pilferage
cases
booked
Amount
realised in
Rs. Lakhs
No. of
services
inspected
No. of
pilferage
cases
booked
Amount
realised in
Rs. Lakhs
1 Srikakulam 13300 804 3.91 3060 279 2.35
2 Vizianagaram 14300 554 20.24 4854 146 2.03
3 Visakhapatnam 15831 852 44.29 5749 199 2.14
4 Rajamahendravaram 15684 1300 60.13 4969 91 6.06
5 Eluru 10931 1571 60.95 4005 269 16.83
6 HT-DPE 1762 1 1.08 924 0 0.00
TOTAL 71808 5082 190.60 23561 984 29.40
No. of cases filed in respect of Theft of energy by field staff
S.No Circle
Amounts Assessed in Rs. Lakhs
2019-20 2020-21 (upto 09/20)
No. of
services
inspected
No. of
pilferage
cases
booked
Amount
realised in
Rs. Lakhs
No. of
services
inspected
No. of
pilferage
cases
booked
Amount
realised in
Rs. Lakhs
1 Srikakulam 440862 948 4.61 10603 345 2.98
2 Vizianagaram 448797 26 3.74 16882 3 0.23
3 Visakhapatnam 208996 501 16.43 5024 129 1.47
4 Rajamahendravaram 149018 560 28.47 34976 25 2.13
5 Eluru 114131 450 104.44 36615 24 20.59
TOTAL 1361804 2485 157.69 104100 526 27.39
78
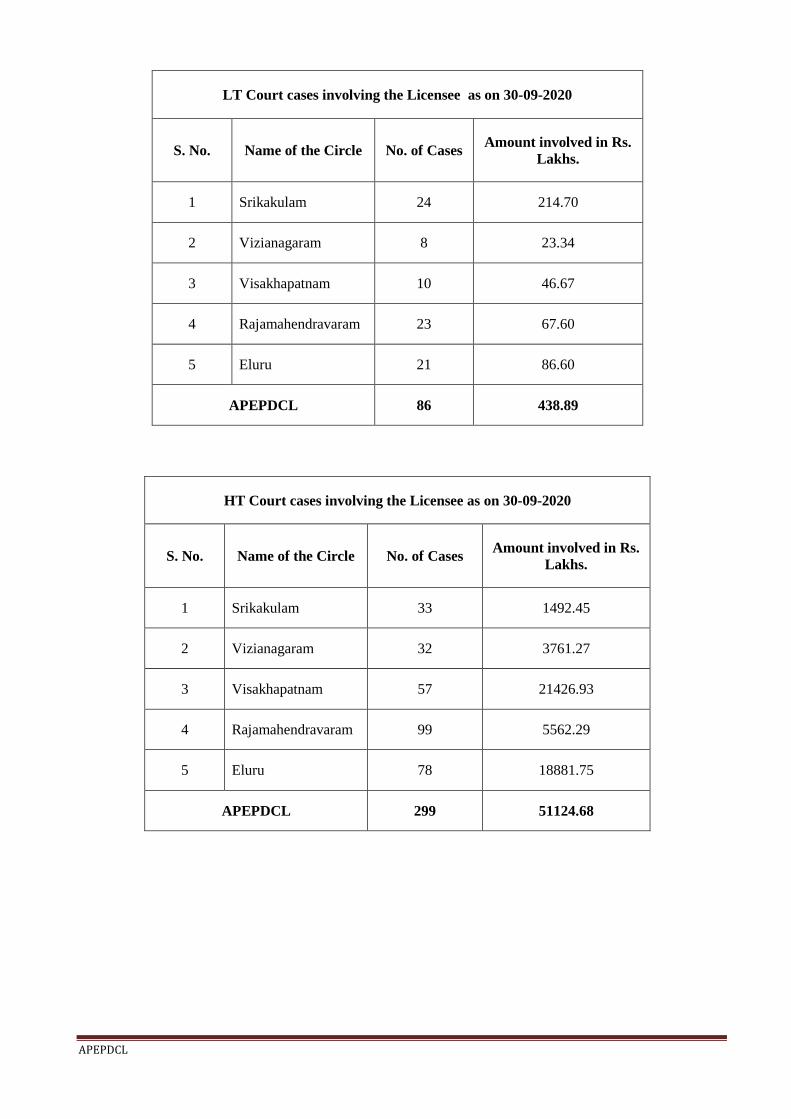
APEPDCL
LT Court cases involving the Licensee as on 30-09-2020
S. No. Name of the Circle No. of Cases Amount involved in Rs.
Lakhs.
1 Srikakulam 24 214.70
2 Vizianagaram 8 23.34
3 Visakhapatnam 10 46.67
4 Rajamahendravaram 23 67.60
5 Eluru 21 86.60
APEPDCL 86 438.89
HT Court cases involving the Licensee as on 30-09-2020
S. No. Name of the Circle No. of Cases Amount involved in Rs.
Lakhs.
1 Srikakulam 33 1492.45
2 Vizianagaram 32 3761.27
3 Visakhapatnam 57 21426.93
4 Rajamahendravaram 99 5562.29
5 Eluru 78 18881.75
APEPDCL 299 51124.68
79

APEPDCL
80
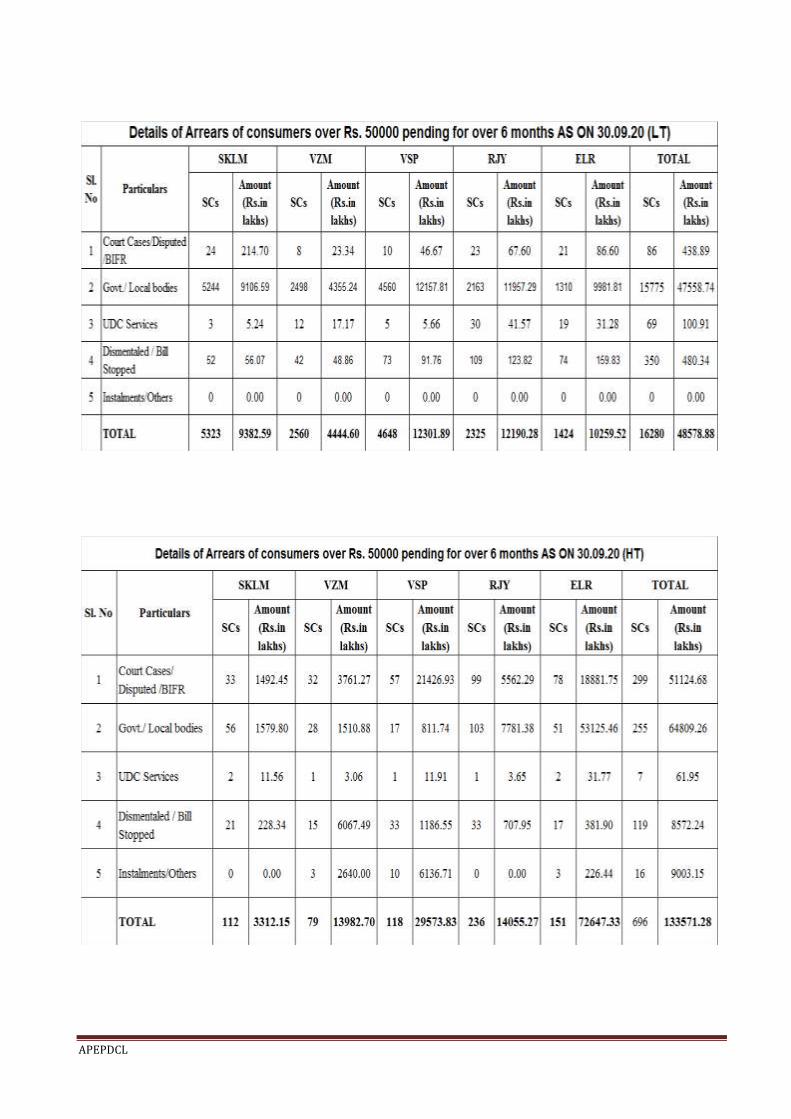
APEPDCL
81

APEPDCL
CIRCLE WISE SAIDI FOR THE FY 2019-20:
CIRCLE WISE SAIDI FOR 2020-21:
CIRCLE APR'19 MAY'19 JUN'19 JUL'19 AUG'19 SEP'19 OCT'19 NOV'19 DEC'19 JAN'20 FEB'20 MAR'20Average
2019-20
SRIKAKULAM 8.7 22.39 12.74 14.13 14.42 13.95 9.65 3.84 4.15 3.8 7.22 7.22 10.18
VIZIANAGARAM 13.34 17.2 16.3 15.39 16.59 14.98 11.38 3.07 2.44 2.49 7.86 7.69 10.73
VISAKHAPATNAM 6.52 5.42 5.97 3.36 4.02 3.53 3.12 0.97 0.75 0.97 2.26 2.3 3.27
RAJAHMUNDRY 13.07 11.25 17.52 12.79 11.26 10.69 9.2 4.14 3.34 4.06 8.86 4.16 9.20
ELURU 10.11 11.84 16.23 14.08 16.45 11.05 8.96 4.04 3.68 4.07 10.74 5.22 9.71
APEPDCL 10.29 12.23 13.74 11.36 11.79 10.02 8.03 3.22 2.82 3.13 7.42 4.78 8.24
CIRCLE APR'20 MAY'20 JUN'20 JUL'20 AUG'20 SEP'20Average
2020-21
SRIKAKULAM 8.93 6.25 8.71 5.65 5.58 5.65 6.80
VIZIANAGARAM 8.84 7.25 13.68 5.78 4.69 6.38 7.77
VISAKHAPATNAM 3.16 3.02 4.65 2.68 2.9 2.9 3.22
RAJAHMUNDRY 10.58 8.97 10.17 7.32 6.99 7.02 8.51
ELURU 10.65 10.37 12.85 13.19 9.19 9.68 10.99
APEPDCL 8.45 7.35 9.7 7.2 6.1 6.41 7.54
82
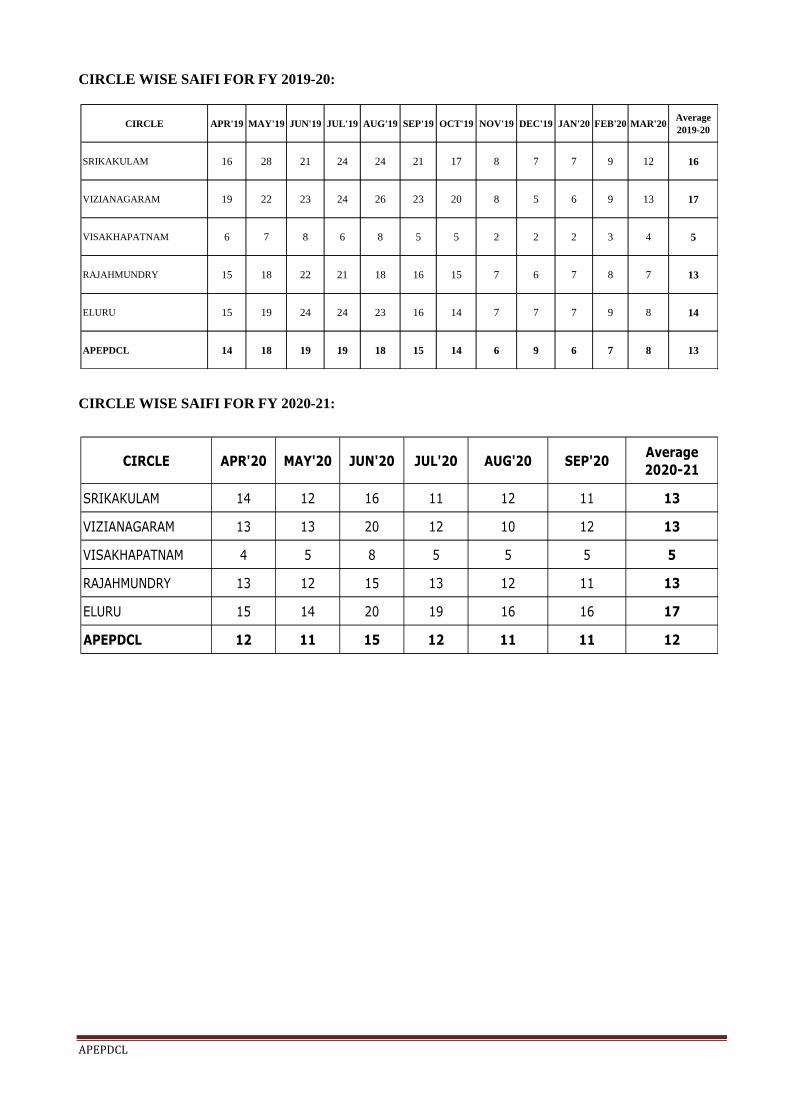
APEPDCL
CIRCLE WISE SAIFI FOR FY 2019-20:
CIRCLE WISE SAIFI FOR FY 2020-21:
CIRCLE APR'19 MAY'19 JUN'19 JUL'19 AUG'19 SEP'19 OCT'19 NOV'19 DEC'19 JAN'20 FEB'20 MAR'20Average
2019-20
SRIKAKULAM 16 28 21 24 24 21 17 8 7 7 9 12 16
VIZIANAGARAM 19 22 23 24 26 23 20 8 5 6 9 13 17
VISAKHAPATNAM 6 7 8 6 8 5 5 2 2 2 3 4 5
RAJAHMUNDRY 15 18 22 21 18 16 15 7 6 7 8 7 13
ELURU 15 19 24 24 23 16 14 7 7 7 9 8 14
APEPDCL 14 18 19 19 18 15 14 6 9 6 7 8 13
CIRCLE APR'20 MAY'20 JUN'20 JUL'20 AUG'20 SEP'20Average
2020-21
SRIKAKULAM 14 12 16 11 12 11 13
VIZIANAGARAM 13 13 20 12 10 12 13
VISAKHAPATNAM 4 5 8 5 5 5 5
RAJAHMUNDRY 13 12 15 13 12 11 13
ELURU 15 14 20 19 16 16 17
APEPDCL 12 11 15 12 11 11 12
83

APEPDCL
10 Cost of Service Methodology for 2021-22
The Licensee has been filing Cost of Service (CoS) in embedded cost methodology. As per the
directions, the study of various CoS methods was done and report submitted to Hon‟ble commission.
In Tariff Order FY 2019-20, the Hon‟ble commission having examined the report on various methods
of CoS, finally decided to adopt the same Voltage Wise CoS methodology as in FY2018-19 for
arriving at the Cost of Service for FY2019-20 also, considering the under lying complex exercise
involved in data collection etc., in arriving CoS though the Embedded cost methodology is robust.
Thus, considering the inferences drawn by Commission, the Licensee is adopting Hon‟ble
Commission‟s approach in arriving Voltage Wise CoS for FY 2021-22.
The Licensee estimated gross energy sales (MU) at different voltage levels as shown the
Table below:
The Licensee has, thereafter, grossed up the energy sales (MU) at the specific voltage levels
with AT & C losses (%) as estimated in this filings for FY2021-22 for arriving at the power
purchase requirement (MU). The summary of the voltage wise losses considered are shown
in the Table below:
84

APEPDCL
Applying the above losses, the power purchase requirement / energy input (MU) for
the respective voltage levels is arrived as shown in the Table below:
The ARR estimated for the year has been apportioned in proportion to the energy input
at different voltage levels. The ARR cost allocated at different voltage levels is as
shown in the Table below:
Based on the energy sales and the apportioned ARR at the respective voltage levels,
the Licensee has calculated Cost of Service per unit for different voltage levels for
FY2021-22 as shown in the Table below:
85
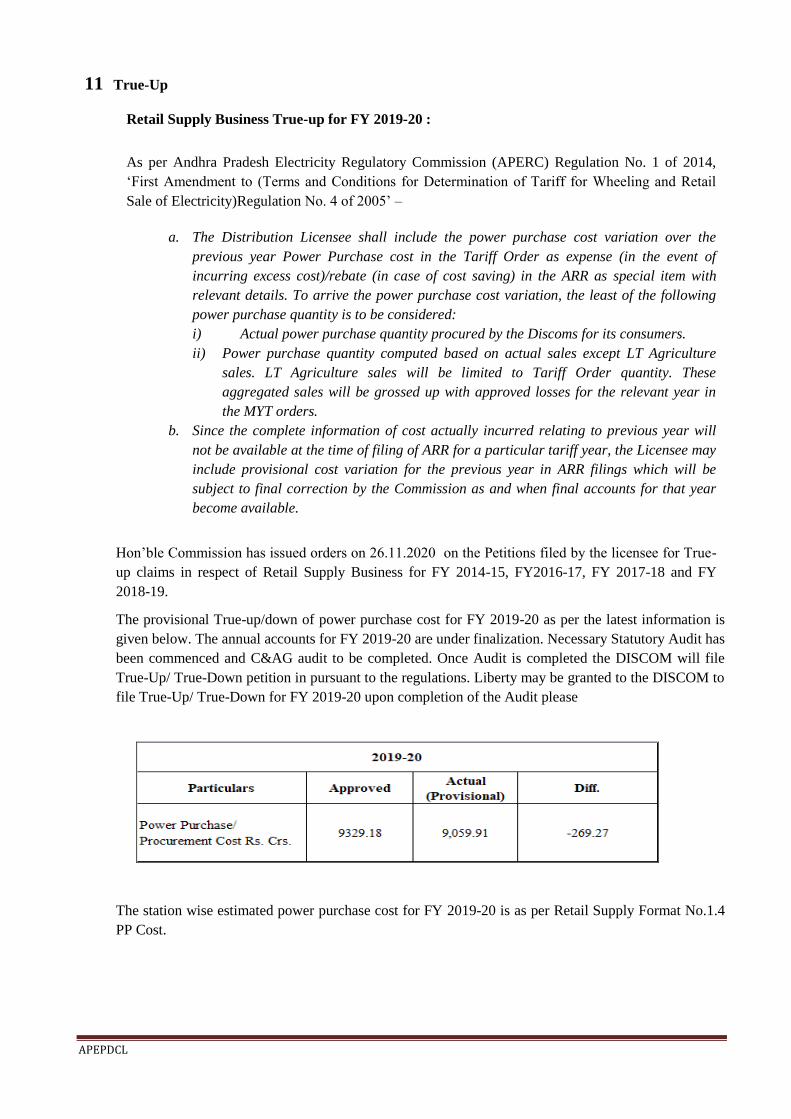
APEPDCL
11 True-Up
Retail Supply Business True-up for FY 2019-20 :
As per Andhra Pradesh Electricity Regulatory Commission (APERC) Regulation No. 1 of 2014,
„First Amendment to (Terms and Conditions for Determination of Tariff for Wheeling and Retail
Sale of Electricity)Regulation No. 4 of 2005‟ –
a. The Distribution Licensee shall include the power purchase cost variation over the
previous year Power Purchase cost in the Tariff Order as expense (in the event of
incurring excess cost)/rebate (in case of cost saving) in the ARR as special item with
relevant details. To arrive the power purchase cost variation, the least of the following
power purchase quantity is to be considered:
i) Actual power purchase quantity procured by the Discoms for its consumers.
ii) Power purchase quantity computed based on actual sales except LT Agriculture
sales. LT Agriculture sales will be limited to Tariff Order quantity. These
aggregated sales will be grossed up with approved losses for the relevant year in
the MYT orders.
b. Since the complete information of cost actually incurred relating to previous year will
not be available at the time of filing of ARR for a particular tariff year, the Licensee may
include provisional cost variation for the previous year in ARR filings which will be
subject to final correction by the Commission as and when final accounts for that year
become available.
Hon‟ble Commission has issued orders on 26.11.2020 on the Petitions filed by the licensee for True-
up claims in respect of Retail Supply Business for FY 2014-15, FY2016-17, FY 2017-18 and FY
2018-19.
The provisional True-up/down of power purchase cost for FY 2019-20 as per the latest information is
given below. The annual accounts for FY 2019-20 are under finalization. Necessary Statutory Audit has
been commenced and C&AG audit to be completed. Once Audit is completed the DISCOM will file
True-Up/ True-Down petition in pursuant to the regulations. Liberty may be granted to the DISCOM to
file True-Up/ True-Down for FY 2019-20 upon completion of the Audit please
The station wise estimated power purchase cost for FY 2019-20 is as per Retail Supply Format No.1.4
PP Cost.
86
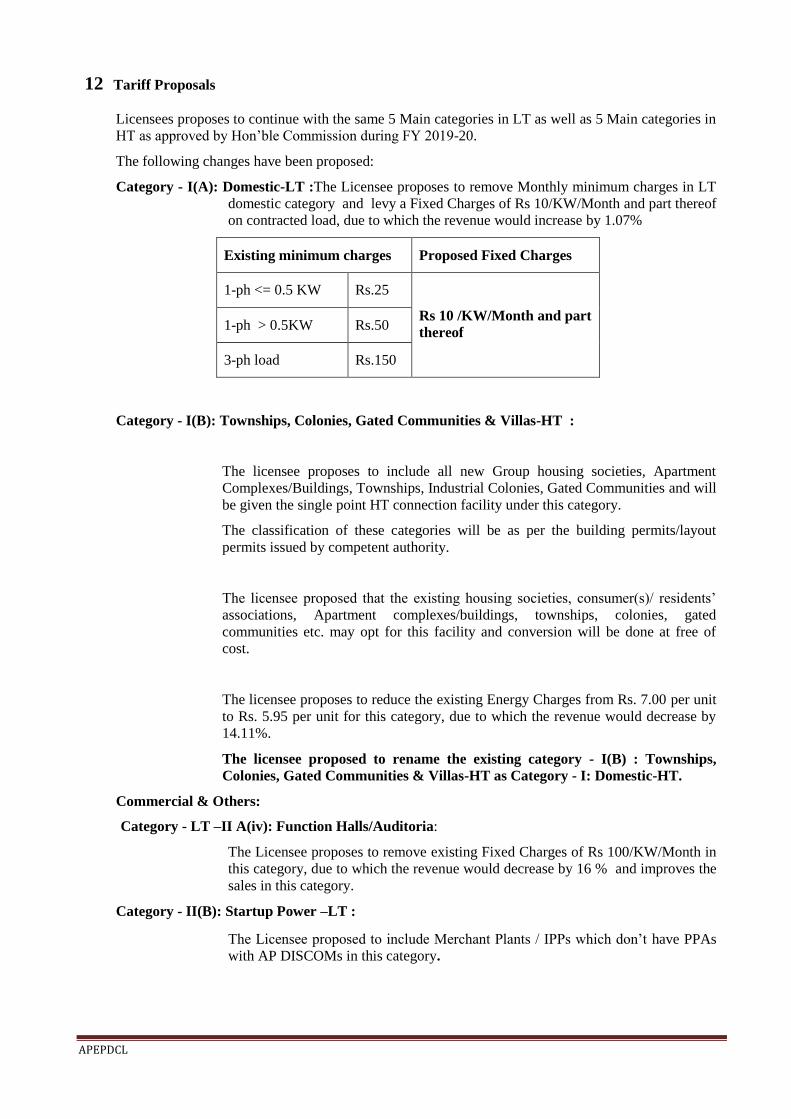
APEPDCL
12 Tariff Proposals
Licensees proposes to continue with the same 5 Main categories in LT as well as 5 Main categories in
HT as approved by Hon‟ble Commission during FY 2019-20.
The following changes have been proposed:
Category - I(A): Domestic-LT :The Licensee proposes to remove Monthly minimum charges in LT
domestic category and levy a Fixed Charges of Rs 10/KW/Month and part thereof
on contracted load, due to which the revenue would increase by 1.07%
Existing minimum charges Proposed Fixed Charges
1-ph <= 0.5 KW Rs.25
Rs 10 /KW/Month and part
thereof
1-ph > 0.5KW Rs.50
3-ph load Rs.150
Category - I(B): Townships, Colonies, Gated Communities & Villas-HT :
The licensee proposes to include all new Group housing societies, Apartment
Complexes/Buildings, Townships, Industrial Colonies, Gated Communities and will
be given the single point HT connection facility under this category.
The classification of these categories will be as per the building permits/layout
permits issued by competent authority.
The licensee proposed that the existing housing societies, consumer(s)/ residents‟
associations, Apartment complexes/buildings, townships, colonies, gated
communities etc. may opt for this facility and conversion will be done at free of
cost.
The licensee proposes to reduce the existing Energy Charges from Rs. 7.00 per unit
to Rs. 5.95 per unit for this category, due to which the revenue would decrease by
14.11%.
The licensee proposed to rename the existing category - I(B) : Townships,
Colonies, Gated Communities & Villas-HT as Category - I: Domestic-HT.
Commercial & Others:
Category - LT –II A(iv): Function Halls/Auditoria:
The Licensee proposes to remove existing Fixed Charges of Rs 100/KW/Month in
this category, due to which the revenue would decrease by 16 % and improves the
sales in this category.
Category - II(B): Startup Power –LT :
The Licensee proposed to include Merchant Plants / IPPs which don‟t have PPAs
with AP DISCOMs in this category.
87
APEPDCL
Category - II(B): Startup Power –HT :
The Licensee proposed to include Merchant Plants / IPPs which don‟t have PPAs
with AP DISCOMs in this category.
Category – III: Industry- HT :
i)Licensee proposes to modify the Morning Peak ToD Timings from 6:00AM-
10:00AM to 4:00AM- 8:00AM in line with the incidence of Agriculture Load.
Accordingly new ToD Off Peak Timings are 10:00 PM to 4:00 AM.
ii) The licensee proposes to with draw the existing Load Factor incentive.
Category-V: Agriculture and related-LT:
V (C) :Poultry & Aquaculture –LT : The licensee proposes to merge the existing
categories V C (i) Poultry Hatcheries and Poultry Feed mixing plants V C (ii)
Aqua Hatcheries and Aqua Feed mixing plants into Category III- A Industrial
General-LT due to which the revenue increases by 36.11 %.
Category-V: Agriculture and related -HT
V (C) : Poultry & Aquaculture –HT : The licensee proposes to merge the
existing categories V C (i) Poultry Hatcheries and Poultry Feed mixing plants V C
(ii) Aqua Hatcheries and Aqua Feed mixing plants into Category III- A Industrial
General-HT respective voltage levels Due to which the revenue increases by 5.12
%.
RESCO:
The RESCOs draw power from Licensee and the activities of RESCOs are similar
to that of the Licensee in implementing similar tariffs in their respective areas as
approved by the Hon‟ble commission. The licensee proposes to increase both
RESCOs Tariff at a rate of Rs 7.15 per unit each which equal to the CoS of
Licensee.
Other Proposal:
Proposed para in the ARR writeup to impose restriction on Time of Use / Intra Day
procurement by the Bulk Consumers
1. It is observed that certain bulk consumers who are eligible for Inter State Open Access are
obtaining the necessary permissions from SLDC for short term OA and are procuring power
during day time & off peak hours (Time of the day basis as per their convenience) from the
power exchanges (IEX & PXL).
2. Short term OA transactions allows the consumers to opportunistically switch between the
DISCOM supply and market procurement even during a day. The Bulk consumers are
availing STOA for a very shorter periods, depending daily and intraday variation of power
availability and market prices. The DISCOMs cannot requisition power as & when needed to
cater to the variable/switchable demand of Short Term OA consumers, and the deviations
accrue on account of this are burdening other consumers of the DISCOM.
3. This, further causes hindrance to the DISCOM with regard to the preparation of hourly day
ahead drawal requirement that needs to be furnished to the SLDC and state level drawal
forecast for SRLDC. The Consumers who are permitted to access Power Exchanges are not
furnishing any information with regard to their planned procurement on day-ahead basis from
exchanges/other sources and in the absence of such information, the DISCOM is taking their
entire contracted requirement into consideration. This increases uncertainty in power
procurement planning in DISCOMs.
88
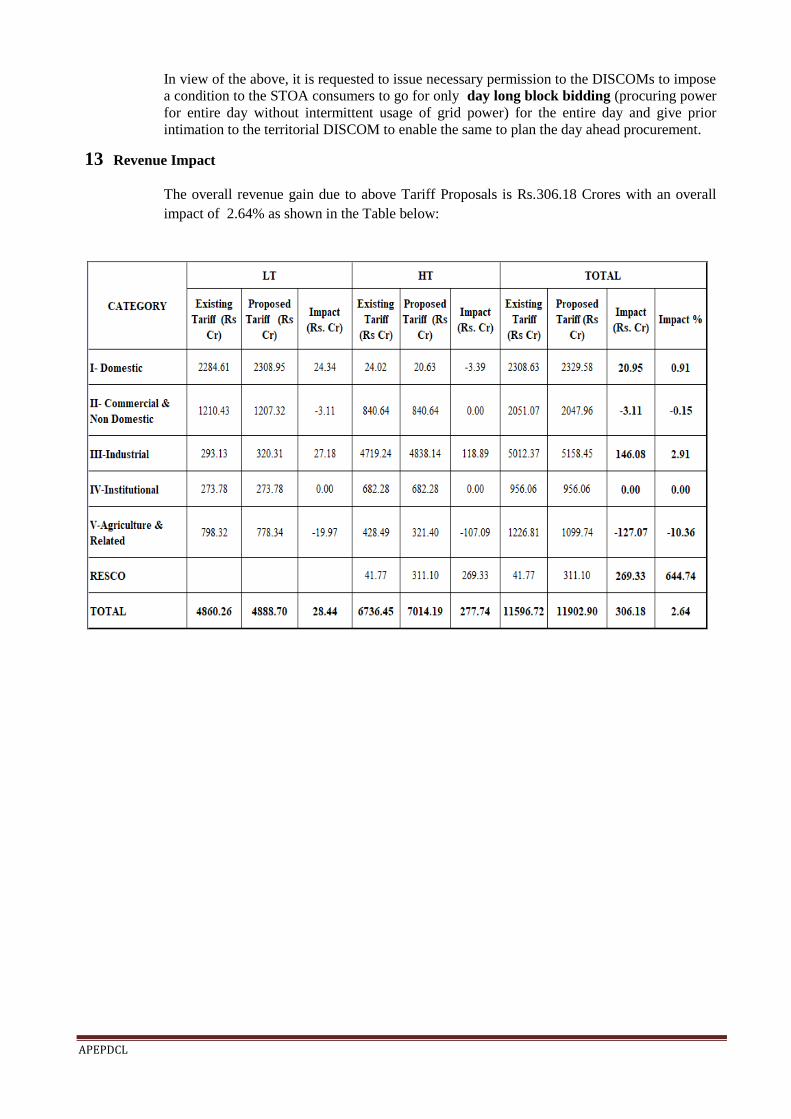
APEPDCL
In view of the above, it is requested to issue necessary permission to the DISCOMs to impose
a condition to the STOA consumers to go for only day long block bidding (procuring power
for entire day without intermittent usage of grid power) for the entire day and give prior
intimation to the territorial DISCOM to enable the same to plan the day ahead procurement.
13 Revenue Impact
The overall revenue gain due to above Tariff Proposals is Rs.306.18 Crores with an overall
impact of 2.64% as shown in the Table below:
89
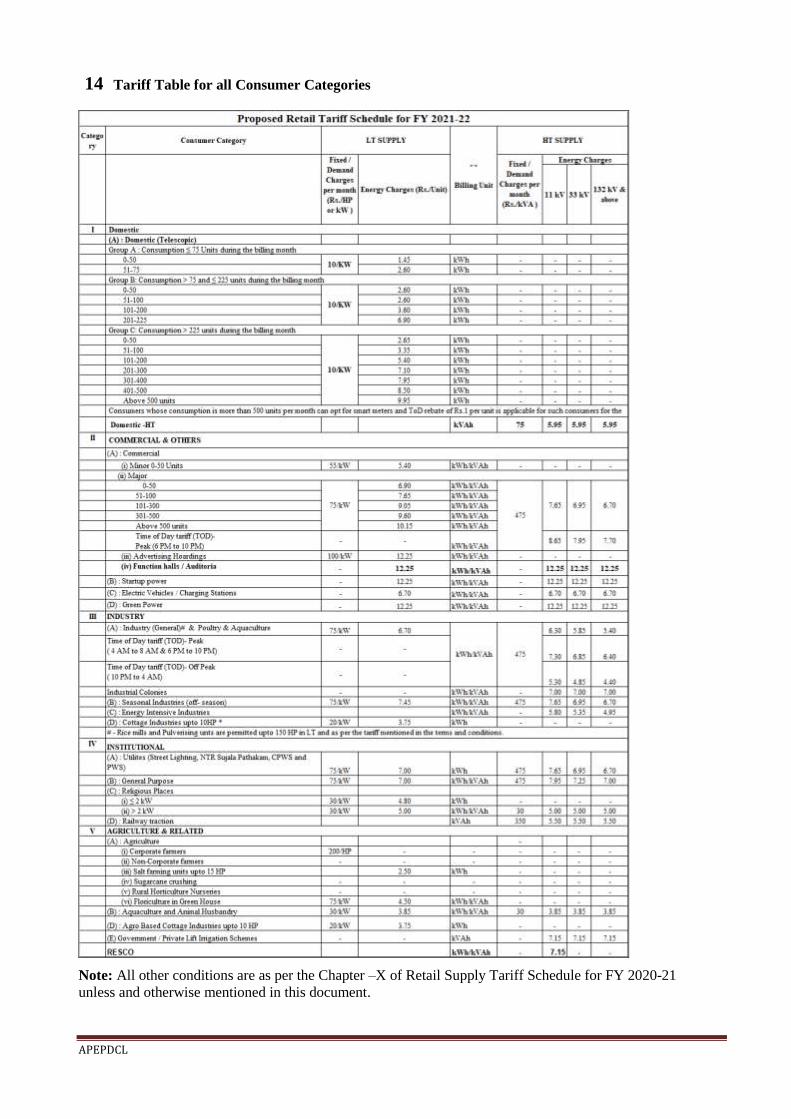
APEPDCL
14 Tariff Table for all Consumer Categories
Note: All other conditions are as per the Chapter –X of Retail Supply Tariff Schedule for FY 2020-21
unless and otherwise mentioned in this document.
90
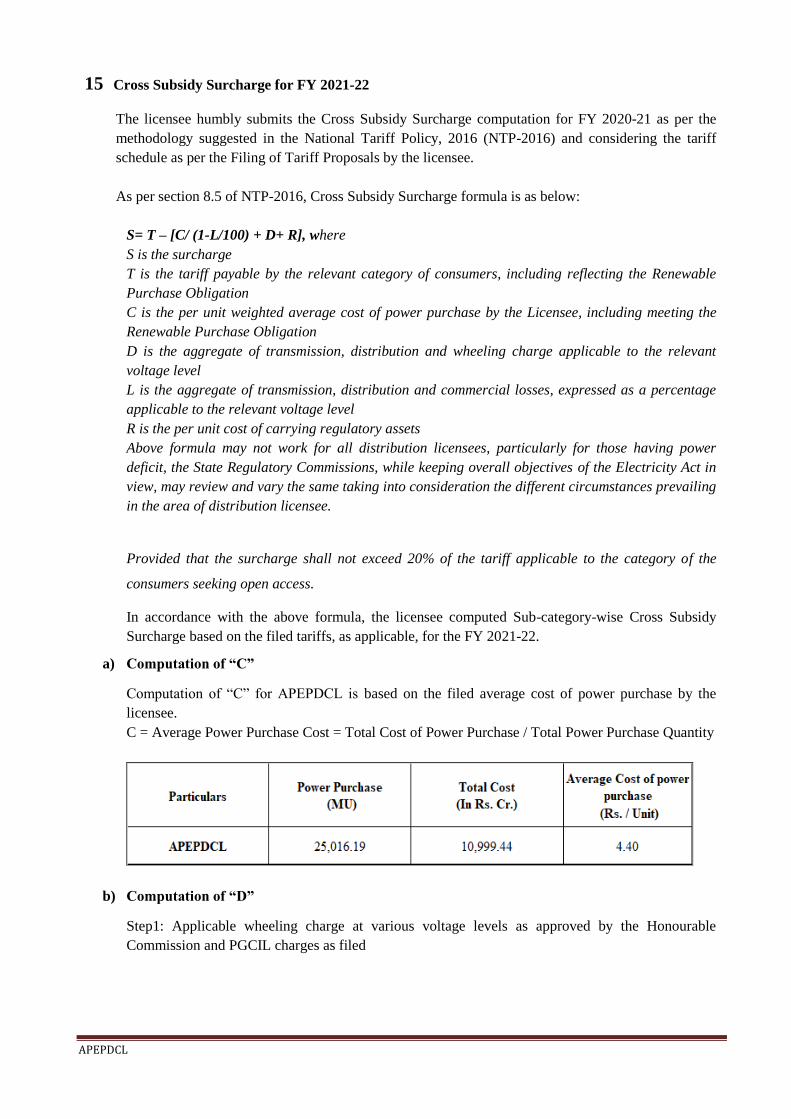
APEPDCL
15 Cross Subsidy Surcharge for FY 2021-22
The licensee humbly submits the Cross Subsidy Surcharge computation for FY 2020-21 as per the
methodology suggested in the National Tariff Policy, 2016 (NTP-2016) and considering the tariff
schedule as per the Filing of Tariff Proposals by the licensee.
As per section 8.5 of NTP-2016, Cross Subsidy Surcharge formula is as below:
S= T – [C/ (1-L/100) + D+ R], where
S is the surcharge
T is the tariff payable by the relevant category of consumers, including reflecting the Renewable
Purchase Obligation
C is the per unit weighted average cost of power purchase by the Licensee, including meeting the
Renewable Purchase Obligation
D is the aggregate of transmission, distribution and wheeling charge applicable to the relevant
voltage level
L is the aggregate of transmission, distribution and commercial losses, expressed as a percentage
applicable to the relevant voltage level
R is the per unit cost of carrying regulatory assets
Above formula may not work for all distribution licensees, particularly for those having power
deficit, the State Regulatory Commissions, while keeping overall objectives of the Electricity Act in
view, may review and vary the same taking into consideration the different circumstances prevailing
in the area of distribution licensee.
Provided that the surcharge shall not exceed 20% of the tariff applicable to the category of the
consumers seeking open access.
In accordance with the above formula, the licensee computed Sub-category-wise Cross Subsidy
Surcharge based on the filed tariffs, as applicable, for the FY 2021-22.
a) Computation of “C”
Computation of “C” for APEPDCL is based on the filed average cost of power purchase by the
licensee.
C = Average Power Purchase Cost = Total Cost of Power Purchase / Total Power Purchase Quantity
b) Computation of “D”
Step1: Applicable wheeling charge at various voltage levels as approved by the Honourable
Commission and PGCIL charges as filed
91

APEPDCL
Step 2: Conversion of wheeling charges and transmission charges to Rs/unit values considering
a load factor of 100% using the formula: (Wheeling Charge/ (24*30*100%) for wheeling
charges and (PGCIL Charges*10/Total Sales) for PGCIL charges
Step 3: Computation of wheeling charges and transmission charges at relevant voltage level
based on the above values is
c) Computation of “L”
Step 1: Applicable loss at various voltage levels as filed
Step2: Computation of system losses at relevant voltage level based on the above values is
d) Computation of “R”
The cost of carrying regulatory asset is considered to be zero
92

APEPDCL
e) Computation of “T”
As per NTP 2016, “T is the tariff payable by the relevant category of consumers, including
reflecting the Renewable Purchase Obligation”
Tariff payable for each of the relevant category is a combination of Demand Charge and Energy
Charge. Other charges like Customer Charge, Minimum Charge, and NTI have been excluded
from the calculation of Average Realization.
The category-wise CSS computation for FY 2021-22of APEPDCL is as follows.
16 Additional Surcharges
As per the directions given by the Hon‟ble Commission in Tariff Order FY 2020-21, the Licensee shall file
the Additional Surcharge in supplementary filings.
.
93

APEPDCL
17 Directives for FY2020-21
S.
No. Directions given by Commission in FY2020-21 Action Taken in brief
1 Agricultural Sales volume
To be vigilant on sales volume to this consumer category (covering only genuine
consumers and preventing any unauthorized and unaccounted pilferage or theft of
energy in any manner) and invoke appropriate remedial measures, under intimation
to the Commission, to meet the excess cost in case the actual sales are likely to
exceed the approved sales volume during the year with authenticated data in line
with Commission‟s directives.
(Chapter-III, Para 82, Page No.33)
Field inspections done to prevent any unauthorized and
unaccounted pilferage or theft of energy in any manner
during FY 2020-21as remedial measures. Total 220nos.
Direct Tapping/Pilferage Cases booked to an amount of
Rs7.74lakh,59 nos. Malpractice cases to an amount of 9.15
lakhs, 16 nos. BB cases for an amount 20.63 lakhs, 530 nos.
Addl loads for an amount of 27.45 lakhs Total 825 cases
booked to an amount of Rs 64.97 lakhs.
It is planned to provide meters to all agricultural services
under YSR Uchitha Vyavasaya Vidyuth Padhakam.
2 Transfer of ownership of GGPP to APGENCO
The Commission takes notice of the fact that the process of ownership transfer of
GGPP from APDISCOMs to APGENCO is hanging fire for a substantially long
time, and feels that any further delay in this regard is not desirable.
The APDISCOMs are therefore directed to complete the transfer process as
expeditiously as possible and not later than six (6) months.
(Chapter-IV, Para 101(s), Page No.73)
Since M/s.GVK is not coming forward to execute sale
deed and transfer the project to APDISCOMs, APEPDCL
has filed criminal case and is in the process of filing of
civil suit on behalf of APDISCOMS.
3 Power from HNPCL and Simhapuri plants
In case of shortage of power, the DISCOMs may consider procurement of power to
the extent of their requirement from M/s HNPCL strictly based on merit order at the
interim tariff @ Rs.3.82 per unit as directed by the Hon‟ble APTEL.
(Chapter-IV, Para 101(v), Page No.76)
APDISCOMS are considering allowing HNPCL in case
of shortage of power based on merit order as per
prevailing directions.
94

APEPDCL
S.
No. Directions given by Commission in FY2020-21 Action Taken in brief
4 Power from Gas based IPPs (GVK extension, GMR Vemagiri, Gautami and
Konaseema)
“If Vemagiri, Konaseema, GVK extension and Gouthami gas based power projects
can supply power of a quantity of 4835.52 MU with a PLF of 80% provided natural
gas is available and if there is availability / augmentation of natural gas supplies to
them during FY2020-21, the distribution licensees shall take appropriate permissible
steps immediately for procuring cheaper power as per merit order despatch for the
benefit of the consumers by reduction of power purchase cost.”
(Chapter-IV, Para 101(w), Page No.77)
As on date Natural Gas is not available for these projects
and whenever it is available, APDISCOMs will take all
necessary steps to get cheaper power from these IPPs.
5 Energy availability & procurement from sources not approved
The licensees are directed to note that in respect of power from the Generating
stations included in the approved sources of supply which either have no Power
Purchase Agreements or have no approval from the Commission for their Power
Purchase Agreements and / or have to still have their tariff determined by the
Commission, except in the cases where there is an adhoc tariff already being paid, if
any, as per the Orders of the Commission, the licensees shall not receive such
supplies without prior intimation to and approval of the Commission.
(Chapter-IV, Para 108, Page No.83)
APDSICOM‟s will procure Energy from the Power
Developers only with prior intimation and approval of the
Commission.
6 Unexpected Slippage in Generation
During some months, part or full availability of energy estimated from some of the
generating stations/sources may not materialize due to factors like break-down of
power plants, non-availability of fuel etc. leading to a gap between demand and
supply. In that case, the licensees shall approach the Commission for remedial
measures to meet the shortfall in energy from alternative sources. If any shortfall is
observed in any time block for various reasons, in all such cases the licensees may
procure the shortfall energy through Power Exchanges, Intra-day mechanisms but
with a price not exceeding the average power purchase cost determined in this Order
under simultaneous intimation to the Commission. All such details of purchases shall
be furnished to the Commission fortnightly in the form of a statement for periodical
ratification.
Further, the licensees shall not procure energy from Stations / Sources other than
those approved in this order without the prior approval of the Commission. Further,
As per the direction of the Hon‟ble APERC, the day wise
particulars of energy bought/sold through Power exchanges
and Intra-day mechanisms were submitted to the Hon‟ble
APERC daily through E-mail. The fortnightly and monthly
statements of energy bought/sold through power exchanges
were simultaneously intimated and furnished to the Hon‟ble
APERC in FY 2019-20 for periodical ratification.
95

APEPDCL
S.
No. Directions given by Commission in FY2020-21 Action Taken in brief
the Licensees are also directed not to procure energy over and above the quantum
indicated against each Station / Source unless and otherwise approved by the
Commission or ratified by it in case of unavoidable emergencies (The licensees
should be able to satisfy the Commission about the nature of the emergency).
However, the licensees are at liberty to purchase energy from thermal stations listed
in the merit order dispatch which have least variable cost and are placed top in the
merit order, over and above the approved quantities, which helps further reduction of
the power purchase cost approved in this order. While operating intraday merit order
dispatch, the least cost source shall be dispatched to the full extent in order to
achieve lower power purchase cost at the end.
Violation of the above directions of the Commission will be viewed very seriously
and appropriate action will be initiated against the officers/persons responsible for
violation under the provisions of the Electricity Act, 2003, AP Electricity Reform
Act, 1998, and Rules and Regulations made there under in accordance with the
prescribed procedure.
(Chapter-IV, Para 114, 115&116, Page Nos.85 & 86)
7 Sale of Surplus Energy
The Commission has determined the surplus energy at 9504.27 MU as against the
deficit of 3955.83 MU assessed by the licensees. The Commission observes here that
out of the surplus energy of 2739.98 MU determined by it for FY2019-20, the
licensees have miserably failed to sell the surplus energy even though they were
directed “to sell any surplus power that may be available with them upto the last unit
at an economically beneficial price to the maximum extent possible by all possible
means as described” at para no. 302 (pages 201 & 202) of the Retail Supply Tariff
Order for FY2019-20.
Therefore, the Commission directs the Licensees to sell the surplus energy available
with them up to the last unit at an economically beneficial price to the maximum
extent possible. The details of efforts made by the licensees to sell the surplus energy
in all possible ways and the details of sale of surplus energy in a month shall be
intimated to the Commission by 15th of succeeding month during FY2020-21.
(Chapter-IV, Para 117&118, Page Nos. 86)
For FY2019- 20, the APDISCOMS has sold surplus
energy of 26.660 MU through power exchanges and
submitted through monthly reports for periodical
ratification by Hon‟ble APERC.
96

APEPDCL
S.
No. Directions given by Commission in FY2020-21 Action Taken in brief
8 Power purchase cost from APGPCL needs to be scrutinized
The DISCOMs shall obtain the audited reports for FY2019-20 after completion of
financial year for the expenditure claimed by M/s APGPCL and shall submit to the
Commission with scrutiny and comments by the audit wing of DISCOMs. The fixed
cost of APGPCL for FY2020-21 is restricted to the estimated cost for H2 of FY2019-
20 proposed by the licensees. However, if and when a true-up application is filed, the
Commission will determine the fixed cost based on the actual expenditure incurred
byAPGPCL.
(Chapter-IV, Para 125(kk), Page No.92)
It is to submit that the Audited reports for FY 2019-20 will
be obtained from M/s APGPCL after completion of audit
and review report for the expenditure claimed by M/s
APGPCL will be submitted.
9 Fixed and Other Costs
In respect of Central Generating Stations (CGS) other than Nuclear Power Plants, the
licensees stated that they have proposed the fixed costs based on relevant orders of
CERC. But, as per the information obtained subsequently, it is observed that the
relevant orders of CERC pertain to the period upto FY2018-19 and the orders for the
tariffs for the subsequent years are yet to be issued by the CERC. Therefore, the
fixed costs of CGS as proposed by the licensees are tentatively applied by the
Commission subject however to the final determination of the tariffs by the CERC.
In respect of other IPPs, the Commission applies the fixed costs as proposed by the
licensees as the same are stated to be as per the respective agreements, subject to
final verification at the time of true-up.
(Chapter-IV, Paras 130 & 131, Page No.96)
The Hon‟ble CERC orders for FY2020-21on Tariff block
of 2019-24 in respect of CGS Stations will be brought to
the notice of the Hon‟ble Commission for final
determination.
10 Variable Costs
In respect of Wind and Solar Plants, the tariffs as approved by the Commission in the
Retail Supply Order for FY2019-20 are applied for estimation of Power Purchase
Cost in this Order as the licensees have not proposed the cost of power from these
sources. Application of these tariff rates cannot however be understood as a mandate
to the licensees to pay the Wind and Solar developers at that rate as the payments for
the present are governed by the judgment of the Hon‟ble High Court of Andhra
Pradesh.
It is however made clear that the liability of the licensees in this regard shall be
subject to the outcome of the pending litigation.
(Chapter-IV, Para 134, Page No.96)
The payment of Energy bills will be as per High court
order dated 24.09.2019 subject to the outcome of
pending litigation.
97
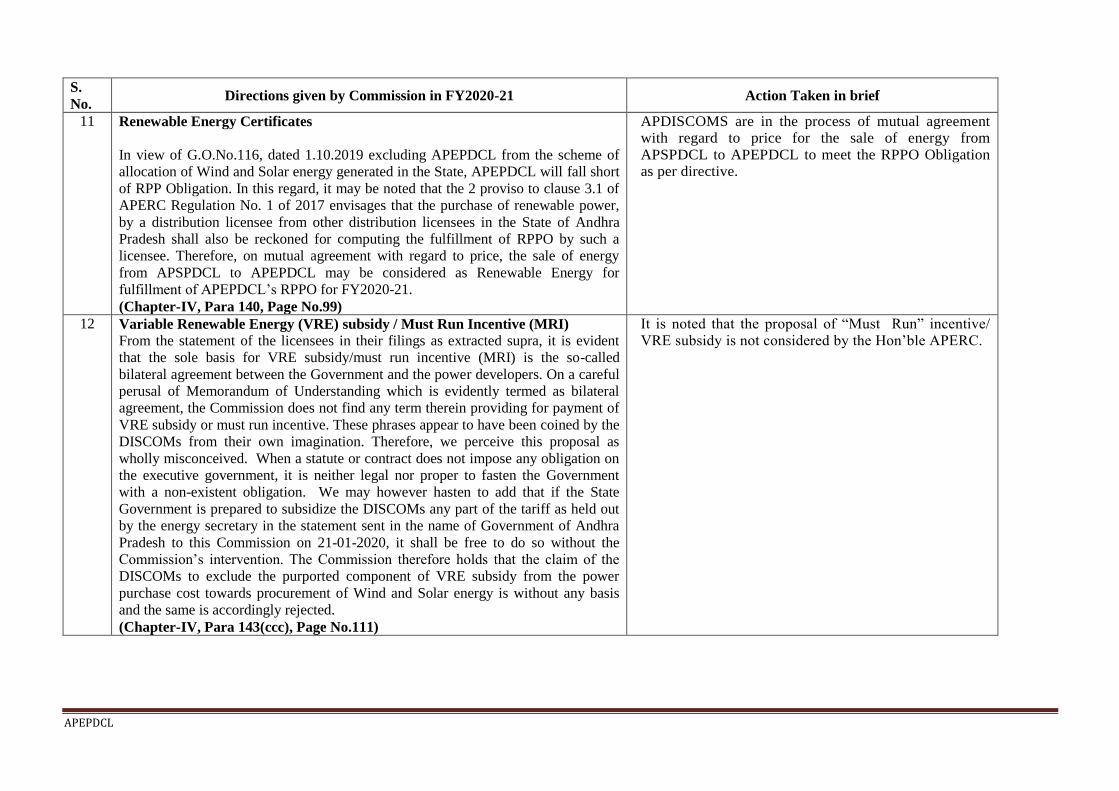
APEPDCL
S.
No. Directions given by Commission in FY2020-21 Action Taken in brief
11 Renewable Energy Certificates
In view of G.O.No.116, dated 1.10.2019 excluding APEPDCL from the scheme of
allocation of Wind and Solar energy generated in the State, APEPDCL will fall short
of RPP Obligation. In this regard, it may be noted that the 2 proviso to clause 3.1 of
APERC Regulation No. 1 of 2017 envisages that the purchase of renewable power,
by a distribution licensee from other distribution licensees in the State of Andhra
Pradesh shall also be reckoned for computing the fulfillment of RPPO by such a
licensee. Therefore, on mutual agreement with regard to price, the sale of energy
from APSPDCL to APEPDCL may be considered as Renewable Energy for
fulfillment of APEPDCL‟s RPPO for FY2020-21.
(Chapter-IV, Para 140, Page No.99)
APDISCOMS are in the process of mutual agreement with regard to price for the sale of energy from
APSPDCL to APEPDCL to meet the RPPO Obligation as per directive.
12 Variable Renewable Energy (VRE) subsidy / Must Run Incentive (MRI)
From the statement of the licensees in their filings as extracted supra, it is evident
that the sole basis for VRE subsidy/must run incentive (MRI) is the so-called
bilateral agreement between the Government and the power developers. On a careful
perusal of Memorandum of Understanding which is evidently termed as bilateral
agreement, the Commission does not find any term therein providing for payment of
VRE subsidy or must run incentive. These phrases appear to have been coined by the
DISCOMs from their own imagination. Therefore, we perceive this proposal as
wholly misconceived. When a statute or contract does not impose any obligation on
the executive government, it is neither legal nor proper to fasten the Government
with a non-existent obligation. We may however hasten to add that if the State
Government is prepared to subsidize the DISCOMs any part of the tariff as held out
by the energy secretary in the statement sent in the name of Government of Andhra
Pradesh to this Commission on 21-01-2020, it shall be free to do so without the
Commission‟s intervention. The Commission therefore holds that the claim of the
DISCOMs to exclude the purported component of VRE subsidy from the power
purchase cost towards procurement of Wind and Solar energy is without any basis
and the same is accordingly rejected.
(Chapter-IV, Para 143(ccc), Page No.111)
It is noted that the proposal of “Must Run” incentive/
VRE subsidy is not considered by the Hon‟ble APERC.
98

APEPDCL
S.
No. Directions given by Commission in FY2020-21 Action Taken in brief
13 SLDC Cost
The Commission has verified the computations made by licensees and found that the
SLDC cost filed by the licensees is less than that approved for FY2020-21 in the
order on SLDC Annual Fees and Operating Charges for the 4th Control Period. The
licensees have claimed SLDC Cost based on the demand considered for transmission
capacity but not on the installed capacities on which SLDC charges are determined
by the Commission. Therefore, if the licensees pay the SLDC Costs over and above
the filings, the same may be claimed in the ARR for FY2021-22. However, the
Commission approves the SLDC Costs as filed by the licensees in this order.
(Chapter-V, Para 148, Page No.113)
SLDC Costs over and above the filings if any incurred
will be claimed in True ups.
14 Periodical Reports on progress of Energy efficiency and conservation initiatives
The licensees shall place on their respective websites the details of projects and the
savings accrued on account of implementation of Energy Efficiency and Energy
Conservation projects.
(Chapter-V, Para 160(b), Page No.121)
The details of energy Efficiency & Energy Conservation
Projects is placed in APEPDCL Website.
15 Measures for prevention of electrical accidents
Needless to observe, the licensees shall take all possible steps to prevent electrical
accidents by adhering to all safety standards in accordance with the CEA Safety
Regulations. The Commission proposes to monitor the performance of the
DISCOMs on implementation of safety measures for reducing the number of
electrical accidents and issue instructions in this regard from time to time in future.
(Chapter-V, Para 160(d), Page No.122)
It is to submit that instructions are issued to Field Officers
on safety measures from time to time as below
(1). Memo. No. CGM/O&CS/VSP/APEPDCL/LMC/D.No.
2365/19, Dt. 27.12.2019. (2). Memo. No.
CGM/O&CS/VSP/APEPDCL/LMC/D.No. 237/20, Dt.
12.02.2020. (3).Circular instructions.No.
CGM/O&CS/VSP/APEPDCL/LMC/D.No. 409/20, Dt.
06.03.2020.(4) Cir instr.No.
CGM/O&CS/VSP/APEPDCL/LMC/D.No. 528/20,
Dt.01.04.2020.(5) Cir. Instr. No. CGM/ O&CS/
EPDCL/VSP/ GM/Opn/DE/LMC/AE/LMC/ D.No.1363 / 20
Dt.27.08.2020
2. As part of above measures 6000 Nos Personal Safety tool
kits have been procured and issued to field towards Safety
Equipment.
99

APEPDCL
S.
No. Directions given by Commission in FY2020-21 Action Taken in brief
16 Payment of ex-gratia to Victims of electrical accidents
The licensees shall strictly comply with Regulation 2 of 2017 in paying
compensation to the victims of electrical accidents. The Commission has been
considering the grievances of the victims / their families received through
correspondence and issuing instructions to the licensees for settling compensation
claims without any loss of time and shall continue this exercise in future also.
(Chapter-V, Para 160(e), Page No.123)
i) Electrical Accidents occurred to Humans and Animals
during FY 2019-20 are 255 Nos. Compensation paid for 126
Nos accidents and Compensation proposals for 15 Nos. are
under process, 74 Nos. accidents proposed for deletion by
SEs/O/APEPDCL.
ii) Electrical Accidents occurred for FY 2020-21 are 247
Nos. Compensation paid for 50 Nos and Compensation
proposals for 102 Nos are under process and 66 Nos.
accidents proposed for deletion by SEs/O/APEPDCL .
17 The Commission’s decision on other costs
In conformity with the Commission‟s view stated supra, it has decided to continue
the provision of grant of Rs.3 Cr. (Rs.2 Cr. – SPDCL, Rs.1 Cr. – EPDCL) to
APSEEDCO. Further, in the State Advisory Committee meeting held on 13.01.2020
at Tirupati, the Managing Director, APSEEDCO has brought to the notice of this
Commission that the grants approved by the Commission for FY2019-20 to
APSEEDCO were not released by the licensees. In this regard, the licensees are
directed to comply with the directions of this Commission and release the grants as
provided to APSEEDCO and report compliance within one month from the date of
notification of this order.
(Chapter-V, Para 162, Page No.123)
We are obliging the directions of Hon‟ble Commission and
arranging the funds to APSEEDCO on receipt of detailed
request with action plan to carry out the energy efficiency
projects from them in this regard.
100
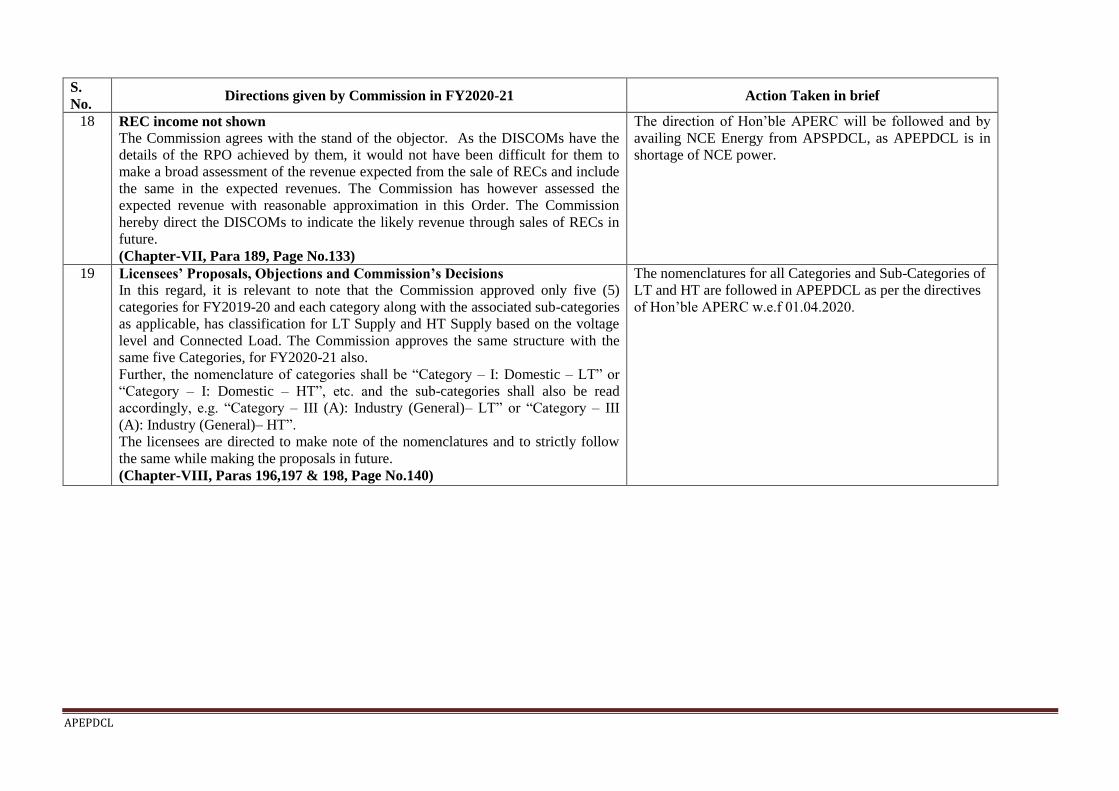
APEPDCL
S.
No. Directions given by Commission in FY2020-21 Action Taken in brief
18 REC income not shown
The Commission agrees with the stand of the objector. As the DISCOMs have the
details of the RPO achieved by them, it would not have been difficult for them to
make a broad assessment of the revenue expected from the sale of RECs and include
the same in the expected revenues. The Commission has however assessed the
expected revenue with reasonable approximation in this Order. The Commission
hereby direct the DISCOMs to indicate the likely revenue through sales of RECs in
future.
(Chapter-VII, Para 189, Page No.133)
The direction of Hon‟ble APERC will be followed and by
availing NCE Energy from APSPDCL, as APEPDCL is in
shortage of NCE power.
19 Licensees’ Proposals, Objections and Commission’s Decisions
In this regard, it is relevant to note that the Commission approved only five (5)
categories for FY2019-20 and each category along with the associated sub-categories
as applicable, has classification for LT Supply and HT Supply based on the voltage
level and Connected Load. The Commission approves the same structure with the
same five Categories, for FY2020-21 also.
Further, the nomenclature of categories shall be “Category – I: Domestic – LT” or
“Category – I: Domestic – HT”, etc. and the sub-categories shall also be read
accordingly, e.g. “Category – III (A): Industry (General)– LT” or “Category – III
(A): Industry (General)– HT”.
The licensees are directed to make note of the nomenclatures and to strictly follow
the same while making the proposals in future.
(Chapter-VIII, Paras 196,197 & 198, Page No.140)
The nomenclatures for all Categories and Sub-Categories of
LT and HT are followed in APEPDCL as per the directives
of Hon‟ble APERC w.e.f 01.04.2020.
101

APEPDCL
S.
No. Directions given by Commission in FY2020-21 Action Taken in brief
20 Enhancement of load limit to Rice Millers and Pulverisers under LT Supply
The requests of the Pulverisers and Rice Millers are examined and the probable
financial impact on the licensees if the requests are positively considered has been
analysed based on the information subsequently obtained from the licensees.
Accordingly, in consideration of these requests, the Commission decided to permit
the above class of consumers upto a connected load of 150 HP under “Category III:
Industry (General) – LT” with the following tariffs in order to strike a balance
between the interests of these consumers and that of the licensees.
Connected Load Fixed charges Energy Charge
(Rs./kW/Month) (Rs./kWh or kVAh)
Upto 100 HP 75.00 6.70
101 HP to 150 HP 275.00 6.70
Monthly minimum charges – NIL
Options were called for from consumers of Rice
Mills/Pulverising Units. Existing 75 Nos HT consumers
availing supply under HT Category are Opted to LT under
this category and 114 nos existing consumers applied for
Addl Load. Out of which 82 Nos paid the sanctioned
amount and availed.
Note:
(i) The existing consumers whose connected load is more than 100 HP and upto 150
HP and are already availing supply under Category III (A) – HT Industry (General)
shall be given option, either to continue to be billed in the same category or to be
billed at the tariff as mentioned above, without disturbing the existing metering. The
existing consumers shall give such option on or before 30.06.2020 failing which they
shall continue to be billed as per Category III (A) – HT Industry (General).
(ii) The new consumers with the contracted load between 100 HP and 150 HP may
also opt to be billed as per the above tariff failing which they will be billed as per
Category III (A) – HT Industry (General).
(Chapter-VIII, Para 204(x), Page No.159)
21 Penal charges for exceeding CMD
The Commission sees justification in the grievance of the objectors and has
accordingly decided to prescribe the modified tariff conditions
(Chapter-VIII, Para 204(ll), Page No.165)
The billing software has been modified as per clause 6.6 of
Tariff Order FY 2020-21 and the bills have been issuing
accordingly.
102

APEPDCL
S.
No. Directions given by Commission in FY2020-21 Action Taken in brief
22 Additional Charges for Maximum Demand in excess of the Contracted
Demand:
If in any month the Recorded Maximum Demand (RMD) of the consumer exceeds
his Contracted Maximum Demand (CMD) with Licensee, the consumer will pay the
following charges on excess demand and on energy calculated in proportion to the
excess demand:
[Chapter-X, Para 225 (6.6), Page No.229]
The billing software has been modified as per clause 6.6 of
Tariff Order FY 2020-21 and the bills have been issuing
accordingly.
23 Full Cost Recovery Tariff Schedule (FCRTS) for FY2020-21
In the absence of any external subsidization u/s 65 of the Electricity Act, 2003 for the
total revenue gap of Rs.10,060.63 Cr. (Rs.7247.18 Cr. for APSPDCL and Rs.2813.44
Cr. for APEPDCL) as determined by the Commission in this order, the licensees will
have to charge the rates contained in the above Full Cost Recovery Tariff Schedule
during FY2020-21 for retail sale of electricity to generate the revenue to meet the
approved ARR for FY2020-21.
(Chapter-IX, Para 220, Page No.184)
As on 27-11-2020, Rs.538.27 Crs received from the Govt. of
Andhra Pradesh towards Tariff Subsidy for FY 2020-21 as
against Rs.2813.44 Crs approved by Hon‟ble APERC in
Tariff Order of FY2020-21.
24 GoAP orders on subsidies / concessions
The Commission has not factored the decisions of the Government in the G.O.s
mentioned infra, while arriving the subsidy requirement. G.O.Rt.No.70
dated2.07.2019 - tariff concession to the Aquaculture farmers (Annexure-11), (ii)
G.O.Ms.No.91 dated 24.07.2019 - free power under Jagjeevan Jyothi Scheme to the
eligible Scheduled Caste households(Annexure-12), (iii) G.O.Rt.No.24 dated
15.02.2019- free power to laundries run by BPL Rajaka community and to shops of
As per GoAP orders on subsidies/concessions. The
Subsidies are Calculated and claimed to the respective
Government departments.
103

APEPDCL
S.
No. Directions given by Commission in FY2020-21 Action Taken in brief
Gold Smiths and most backward class households below poverty line (Annexure-
13),(iv) G.O.Rt.No.128, dt. 29.11.2019 - tariff concession to rolled gold covering
industry in Machilipatnam (Annexure-14), (v) G.O.Rt.No.15 dated 06.02.2019 - free
power supply upto 150 units per month to hair cutting saloons (Annexure-15), and
(vi) G.O. Rt.No.291dated 25.09.2018 - free power upto 100 units per month to
handloom weavers(Annexure-16) as such a proposal has not been made by the
licensees.
(Chapter-X, Para 224, Page No.185)
25 CATEGORY-IV (B): GENERAL PURPOSE – LT
Note:
(ii) The change of applicability shall be effected within three months from the
date of issue of this order to the existing consumers who fit in the above definition.
If the change of applicability is not effected within three months for any valid reason
for all such consumers, change of classification shall be effected prospectively from
the actual date of re-classification.
(Chapter-X, Para 225 (1.4.2), Page No.199)
The change of applicability to the existing consumers who
fit in the definition of Category-IV (B): General Purpose –
LT are effected as per the directions of Hon‟ble
Commission.
26 Objection of Sri Anjaneya Sharma, Kurnool
As the Regulation is specific with regard to the monetary limit for receiving cash
payments, it is not possible for the Commission to direct the DISCOMs to receive
cash payment in excess of the limit specified by the Regulation. The DISCOMs are
directed to follow the above Regulation in its letter and spirit. If not, the objector
may move the Commission for appropriate action.
[Chapter-XII, Para 244(g), Page No.248]
The APEPDCL has been following the APERC (Electricity
Supply Code) Regulation, 5 of 2004 clause 4.3.5 and
Regulation 7 of 2013 (amendment to 5 of 2004) without any
deviation.
27 Objections of Bharatiya Kisan Sangh and others – HVDS
The DISCOMs‟ response does not indicate that they have been taking approvals
from the Commission for undertaking the conversion works. As per the
Commission‟s Guidelines for Investment Approval (February 2016), every licensee
has to take the Commission‟s approval for all the works whose value is above `5 Cr.
The licensees are therefore directed to scruplously follow these guidelines in future.
[Chapter-XII, Para 244(h(iii)), Page No.250]
It is to submit that as per the Commission guide lines, all
investment proposals above Rs 5 crs are being submitted to
the APERC for Approval.
104

APEPDCL
S.
No. Directions given by Commission in FY2020-21 Action Taken in brief
28 Provide booklets and create awareness on tariffs
The Commission is of the view that awareness on the tariffs needs to be created not
only in the staff of the licensees but also in the consumers. Therefore, small booklets
containing tariff schedules and other relevant aspects useful for the consumers must
be printed in vernacular language in adequate quantities and be made available in all
the offices of the licensees for sale to the consumers on collecting reasonable cost.
Such availability shall be properly publicized for the consumers to be aware of the
same. This exercise shall be completed by both the DISCOMs within two months of
publication of tariff order and submit compliance report to the Commission.
[Chapter-XII, Para 244(i(vii)), Page No.254]
10,000 Nos pocket book lets in Telugu language are printed
and distributed to the Consumers and also made available in
the all the offices of the licensee for creating awareness on
the Tariffs.
29 Extend 24 hrs. three phase supply in villages
So far, the DISCOMs have not approached the Commission for approval of
investment schemes for segregation of agriculture feeders. Prima facie such
approvals are necessary. The Commission will examine this aspect and issue
appropriate directions to the DISCOMs in this regard.
[Chapter-XII, Para 244(j(ii)), Page No.255]
To segregate the agricultural services from the rural feeders.
District wise DPR giving out feeder wise details of
agriculture consumers arrived in APEPDCL for an amount
of Rs.1311.11 Crs submitted to REC Ltd,.
30 Educate farmers on selling power
The response of APEPDCL is inappropriate. Wherever the Solar pumpsets are
connected to the grid, the licensee must create awareness in the farmers about their
entitlement to sale surplus power. Action taken report in this regard shall be
submitted by the licensee to the Commission within three months.
[Chapter-XII, Para 244(j(v)), Page No.256]
APEPDCL creating awareness in the farmers about the
entitlement of sale surplus power. 160 Nos. consumers are
paid @ Rs.1.50/- per KWH towards energy exported to
Grid.
31 Implementation of DSM measures is not taken seriously
Implementation of DSM measures is not being taken seriously by DISCOMs and
providing of new pump sets in place of old pump sets was also ignored.
[Chapter-XII, Para 244(j(vi)), Page No.256]
So far 59,178 nos., agricultural services were inspected and
awareness on DSM Measures was created to the farmers.
105

APEPDCL
S.
No. Directions given by Commission in FY2020-21 Action Taken in brief
32 Indication of subsidy in CC bill & advertisements on back of CC bill
Though the objector has not projected the correct facts regarding the tariff applicable
to the consumers of below 500 units of power, his suggestion however to print the
details of subsidy etc. is worth considering as this is in consonance with the second
part of clause 4.2 s) of the Andhra Pradesh Electricity Regulatory Commission
(Electricity Supply Code) Regulation, 2004, which reads as under:
“s) Address / details of concerned local collection centers and electricity revenue
offices of licensee with working hours where payment of electricity bill shall be
made.
Details of cost to serve for the category, Cross Subsidy & Government Subsidy per
unit, slab wise, and information ---- may be printed on the reverse of the bill”.
Both the DISCOMs are therefore directed to follow the above mentioned clause and
submit compliance report to the Commission within three (3) months.
[Chapter-XII, Para 244(r), Page No.259]
Category wise tariff details for the FY 2020-21, Collection
centers, Government Subsidy and other relevant details as
per the directions of Hon‟ble APERC have been printed on
back side of the CC bills and the same is being issued to
consumers w.e.f. May-2020
33 Supply to Rural Industries
The Commission will examine and follow the due procedure to process it, if any
such proposal is received from the DISCOMs.
[Chapter-XII, Para 244(s), Page No.260]
To segregate the agricultural services from the rural feeders.
District wise DPR giving out feeder wise details of
agriculture consumers arrived in APEPDCL for an amount
of Rs.1311.11 Crs submitted to REC Ltd,.
106
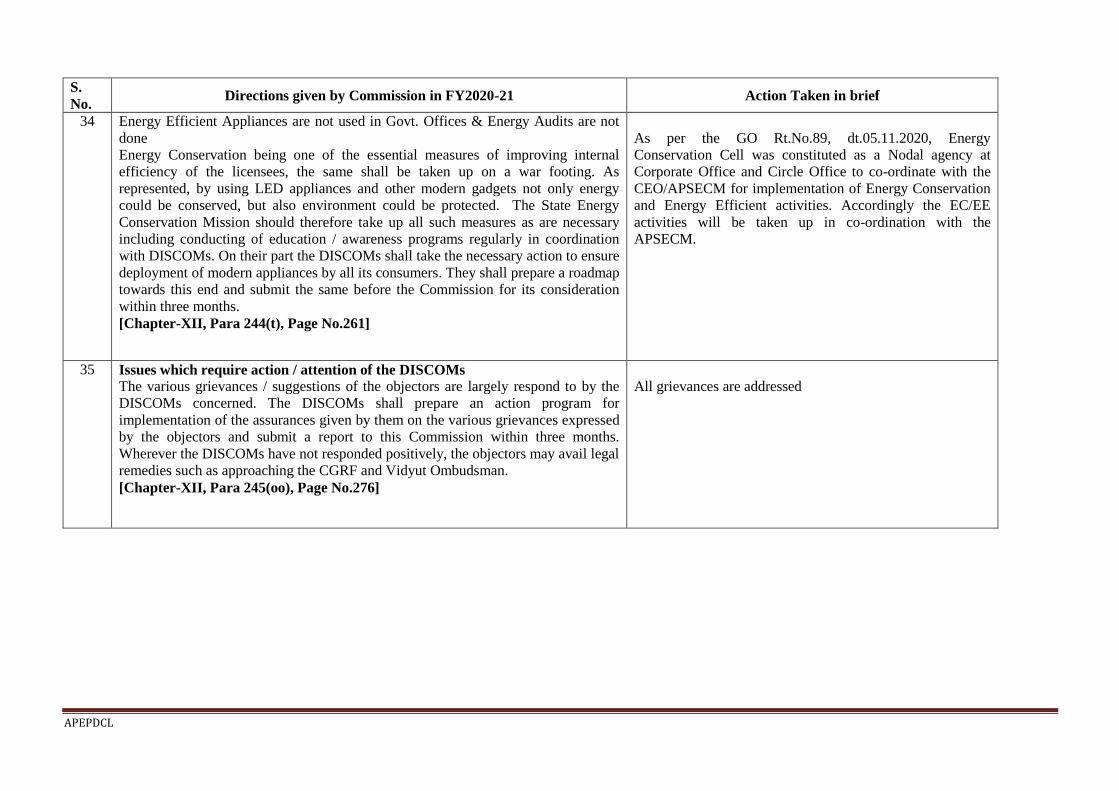
APEPDCL
S.
No. Directions given by Commission in FY2020-21 Action Taken in brief
34 Energy Efficient Appliances are not used in Govt. Offices & Energy Audits are not
done
Energy Conservation being one of the essential measures of improving internal
efficiency of the licensees, the same shall be taken up on a war footing. As
represented, by using LED appliances and other modern gadgets not only energy
could be conserved, but also environment could be protected. The State Energy
Conservation Mission should therefore take up all such measures as are necessary
including conducting of education / awareness programs regularly in coordination
with DISCOMs. On their part the DISCOMs shall take the necessary action to ensure
deployment of modern appliances by all its consumers. They shall prepare a roadmap
towards this end and submit the same before the Commission for its consideration
within three months.
[Chapter-XII, Para 244(t), Page No.261]
As per the GO Rt.No.89, dt.05.11.2020, Energy
Conservation Cell was constituted as a Nodal agency at
Corporate Office and Circle Office to co-ordinate with the
CEO/APSECM for implementation of Energy Conservation
and Energy Efficient activities. Accordingly the EC/EE
activities will be taken up in co-ordination with the
APSECM.
35 Issues which require action / attention of the DISCOMs
The various grievances / suggestions of the objectors are largely respond to by the
DISCOMs concerned. The DISCOMs shall prepare an action program for
implementation of the assurances given by them on the various grievances expressed
by the objectors and submit a report to this Commission within three months.
Wherever the DISCOMs have not responded positively, the objectors may avail legal
remedies such as approaching the CGRF and Vidyut Ombudsman.
[Chapter-XII, Para 245(oo), Page No.276]
All grievances are addressed
107
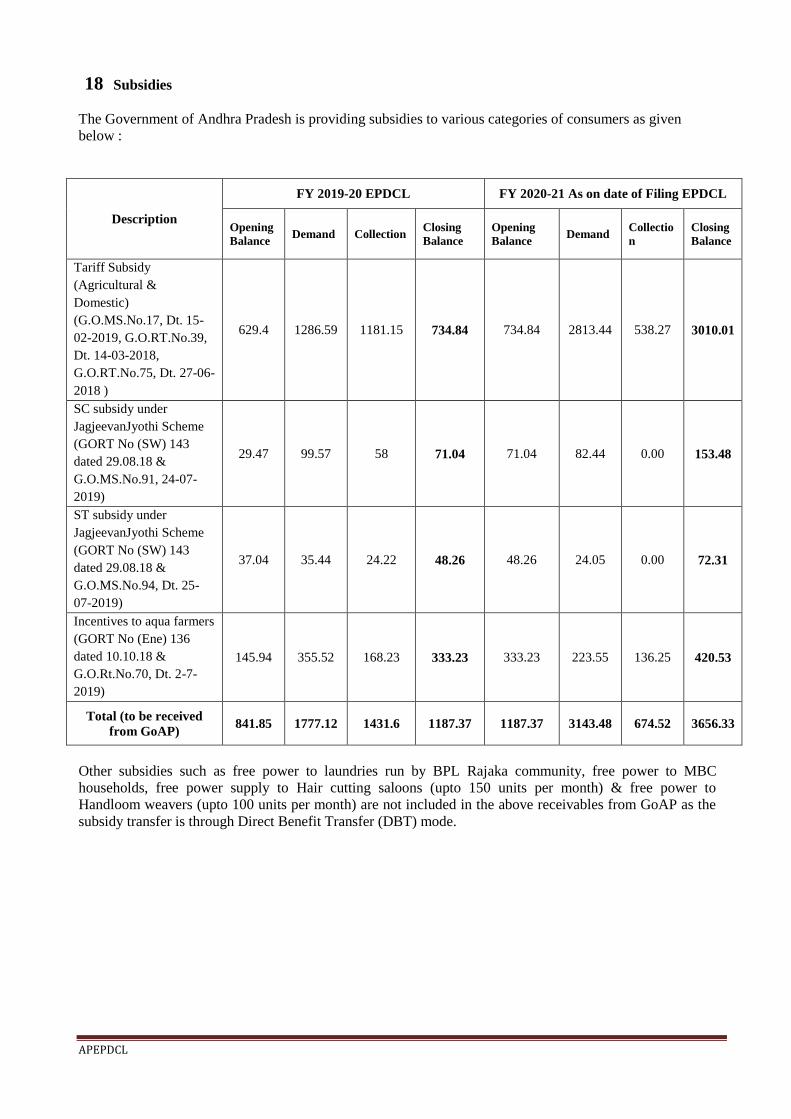
APEPDCL
18 Subsidies
The Government of Andhra Pradesh is providing subsidies to various categories of consumers as given
below :
Description
FY 2019-20 EPDCL FY 2020-21 As on date of Filing EPDCL
Opening
Balance Demand Collection
Closing
Balance
Opening
Balance Demand
Collectio
n
Closing
Balance
Tariff Subsidy
(Agricultural &
Domestic)
(G.O.MS.No.17, Dt. 15-
02-2019, G.O.RT.No.39,
Dt. 14-03-2018,
G.O.RT.No.75, Dt. 27-06-
2018 )
629.4 1286.59 1181.15 734.84 734.84 2813.44 538.27 3010.01
SC subsidy under
JagjeevanJyothi Scheme
(GORT No (SW) 143
dated 29.08.18 &
G.O.MS.No.91, 24-07-
2019)
29.47 99.57 58 71.04 71.04 82.44 0.00 153.48
ST subsidy under
JagjeevanJyothi Scheme
(GORT No (SW) 143
dated 29.08.18 &
G.O.MS.No.94, Dt. 25-
07-2019)
37.04 35.44 24.22 48.26 48.26 24.05 0.00 72.31
Incentives to aqua farmers
(GORT No (Ene) 136
dated 10.10.18 &
G.O.Rt.No.70, Dt. 2-7-
2019)
145.94 355.52 168.23 333.23 333.23 223.55 136.25 420.53
Total (to be received
from GoAP) 841.85 1777.12 1431.6 1187.37 1187.37 3143.48 674.52 3656.33
Other subsidies such as free power to laundries run by BPL Rajaka community, free power to MBC
households, free power supply to Hair cutting saloons (upto 150 units per month) & free power to
Handloom weavers (upto 100 units per month) are not included in the above receivables from GoAP as the
subsidy transfer is through Direct Benefit Transfer (DBT) mode.
108

APEPDCL
19 Prayer
Based on the information available, the Applicant has made sincere efforts to comply with the
Regulation of the Honourable Commission and discharge its obligations to the best of its abilities.
However, should any further material information become available in the near future, the Applicant
shall file such additional information and consequently amend/ revise the application.
In the aforesaid facts and circumstances, the Applicant requests that this Honourable Commission may
be pleased to:
a. Take the above ARR, Tariff Proposal along with Cross Subsidy Surcharge Applications of
APEPDCL on record and treat it as complete;
b. Grant suitable opportunity to APEPDCL within a reasonable time frame to file additional material
information that may be subsequently available;
c. Consider and approve APEPDCL‟s ARR and Tariff application including all requested regulatory
treatments in the filing;
d. Pass such order as the Honourable Commission may deem fit and proper in the facts and
circumstances of the case.
109
RSF FORMATS
110

Company Name APEPDCL
Filing Date (dd/mm/yy) 29/11/2020
Multi Year Tariff Period FY2020-24
Year FY2021-22
Commission' s Regulations Reg-4/2005
Business type Retail Supply of Electricity
1 Aggregate Revenue Requirement for Retail Supply Business Form 1
2 Transmission Cost Form 1.1
3 SLDC Charges Form 1.2
4 Distribution Cost Form 1.3
5 Power Purchase and Procurement Cost (For Regulated Business) Form 1.4
6 NCE Generation (Base Year) Form 1.4 (i)
7 NCE Generation (Year 1) Form 1.4(ii)
8 NCE Generation (Year 2) Form 1.4(iii)
9 NCE Generation (Year 3) Form 1.4(iv)
10 NCE Generation (Year 4) Form 1.4(v)
11 NCE Generation (Year 5) Form 1.4(vi)
12 Power Purchase and Procurement Cost (For Non-regulated Business) Form 1.4a
13 Sales to Licensees Form 1.4b
14 Discom-Discom Purchases Form 1.4c
15 Interest on Consumer Security Deposits Form 1.5
16 Supply Margin Form 1.6
17 Other Costs Form 1.7
18 New consumer categories Form A
19 Cost of Service: Embedded Cost Method Form 2
20 Sales Forecast Form 3
21 Power Purchase Requirement Form 4
22 Energy Losses (Distribution System) Form 4a
23 Transmission Losses Form 4b
24 Energy Availability Form 4.1
25 Energy Dispatch Form 4.2
26 Revenue from Current Tariffs Form 5
27 Incentives at current Tariffs Form 5a
28 Consumers switching to competition Form 5b
29 Consumers served under Open Access as per Section 42 and Section 49 of E Act Form 5c
30 Non-tariff Income at current charges Form 6
31 Total Revenue at Current tariff and Charges Form 7
32 Revenue Deficit/Surplus at current tariff and charges Form 8
33 Revenue Deficit/Surplus and Proposed Adjustments Form 9
34 Revenue from Proposed Tariffs Form 10
35 Incentives at Proposed Tariffs Form 10a
36 Non-tariff Income at proposed charges Form 11
37 Total Revenue at Proposed Tariff and Charges Form 12
38 Cost and Revenue Form 13
S. No. Title Form No.
111

Notes:
1)Base Year
Base Year for the 4th control period FY20-24 is FY2018-19
1) FY 2019-20 Year 1 is the First Year of the control Period, FY2019-20
FY 2020-21 Year 2 is the Second Year of the control Period, FY2020-21
FY 2021-22 Year 3 is the Third Year of the control Period, FY2021-22
FY 2022-23 Year 4 is the Fourth Year of the control Period, FY2022-23
FY 2023-24 Year 5 is the Fifth year of the control Period, FY2023 -24
2) Filings 2021-22, Licensees shall provide
Full projections for FY2021-22
Estimates for FY2020-21
Actuals for FY2019-20
3)
4)
5) New Categories
The Licensees shall add the proposed categories in Form A, the new categories would be then updated automatically in other forms
The new categories are segregated voltage-wise in Form A
6)
7) Phasing of Open Access as per Regulation 2 of 2005 of APERC
Eligibility Criteria for Open Access
Phase Eligibility criteria Commencement date
1 Consumers availing of power from NCE developers irrespective of the
quantum of contracted capacity
September, 2005
2 Contracted capcity being greater than 5 MW September, 2005
3 Contracted capacity being greater than 2 MW September, 2006
4 Contracted capacity being greater than 1 MW April, 2008
8) Terminology for Open Access Status
1 Load not eligible for Open Access
2 Load Eligible for Open Access
3 Availed (within area of supply)
4 Availed ( Outside Area of supply)
Load within the area of supply of the licensees and satisfying the eligibility criteria to avail open
access as per Commission's Regulation during the period under consideration whether availing
power through Open Access or not.
Load outside the area of supply of the Licensee but availing power through Open Access from the
Licensee under consideration.
Load within the area of supply of the Licensee and availing power through Open Access whether
from the same Licensee or any other supplier.
Regulated Business: The retail supply of electricity to (i) consumers within the area of supply of the licensee and not eligible to avail Open
Access as per Commission’s Regulations (ii) consumers within the area of supply of the licensee and eligible to avail Open Access but not
exercising their option of availing open access.
Non-regulated Business: The retail supply of electricity to consumers availing supply under open access from the licensee either forming the
part of area of supply of the licensee or outside the area of supply of the licensee.
Direct Non-Tariff Income: Non-Tariff income which is directly identifiable with a consumer category.
Apportioned Non-Tariff Income: Non-Tariff income which is not directly identifiable with a consumer category. It shall be appropriately
apportioned across various consumer categories.
Modification/addition of Slabs/sub categories for LT consumers should be carried out in Form 7 for Current Tariff and Form 12 for Proposed
Tariff.See notes in the relevant form for details
Load within the area of supply of the licensees not satisfying the eligibility criteria to avail open
access as per Commission's Regulation during the time period under consideration.
112
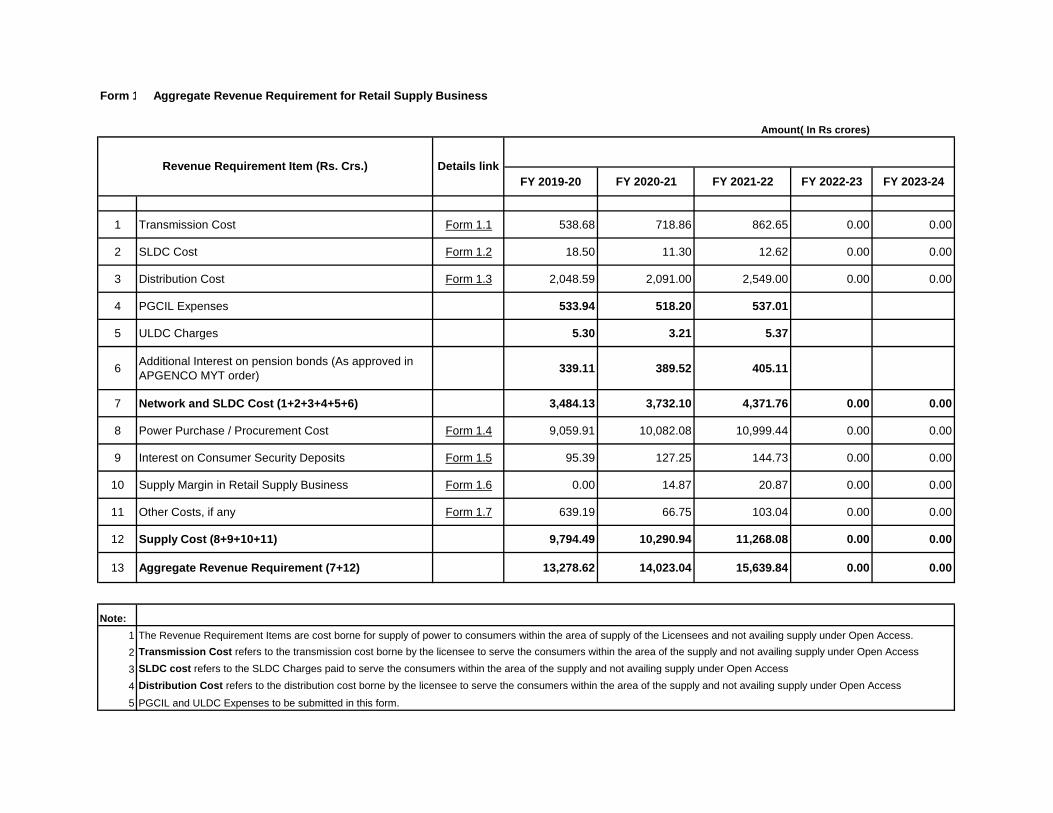
Form 1
Amount( In Rs crores)
FY 2019-20 FY 2020-21 FY 2021-22 FY 2022-23 FY 2023-24
1 Transmission Cost Form 1.1 538.68 718.86 862.65 0.00 0.00
2 SLDC Cost Form 1.2 18.50 11.30 12.62 0.00 0.00
3 Distribution Cost Form 1.3 2,048.59 2,091.00 2,549.00 0.00 0.00
4 PGCIL Expenses 533.94 518.20 537.01
5 ULDC Charges 5.30 3.21 5.37
6Additional Interest on pension bonds (As approved in
APGENCO MYT order)339.11 389.52 405.11
7 Network and SLDC Cost (1+2+3+4+5+6) 3,484.13 3,732.10 4,371.76 0.00 0.00
8 Power Purchase / Procurement Cost Form 1.4 9,059.91 10,082.08 10,999.44 0.00 0.00
9 Interest on Consumer Security Deposits Form 1.5 95.39 127.25 144.73 0.00 0.00
10 Supply Margin in Retail Supply Business Form 1.6 0.00 14.87 20.87 0.00 0.00
11 Other Costs, if any Form 1.7 639.19 66.75 103.04 0.00 0.00
12 Supply Cost (8+9+10+11) 9,794.49 10,290.94 11,268.08 0.00 0.00
13 Aggregate Revenue Requirement (7+12) 13,278.62 14,023.04 15,639.84 0.00 0.00
Note:
1 The Revenue Requirement Items are cost borne for supply of power to consumers within the area of supply of the Licensees and not availing supply under Open Access.
2 Transmission Cost refers to the transmission cost borne by the licensee to serve the consumers within the area of the supply and not availing supply under Open Access
3 SLDC cost refers to the SLDC Charges paid to serve the consumers within the area of the supply and not availing supply under Open Access
4 Distribution Cost refers to the distribution cost borne by the licensee to serve the consumers within the area of the supply and not availing supply under Open Access
5 PGCIL and ULDC Expenses to be submitted in this form.
Aggregate Revenue Requirement for Retail Supply Business
Revenue Requirement Item (Rs. Crs.) Details link
113
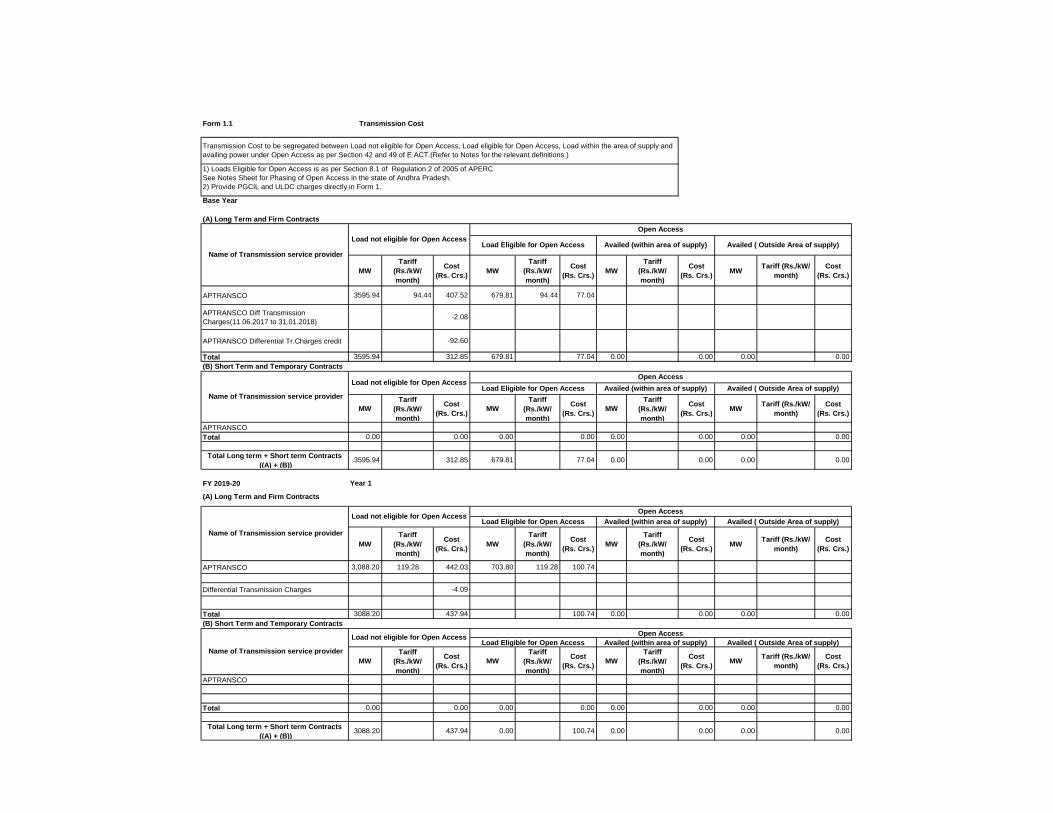
Form 1.1
Base Year
MW
Tariff
(Rs./kW/
month)
Cost
(Rs. Crs.)MW
Tariff
(Rs./kW/
month)
Cost
(Rs. Crs.)MW
Tariff
(Rs./kW/
month)
Cost
(Rs. Crs.)MW
Tariff (Rs./kW/
month)
Cost
(Rs. Crs.)
APTRANSCO 3595.94 94.44 407.52 679.81 94.44 77.04
APTRANSCO Diff Transmission
Charges(11.06.2017 to 31.01.2018) -2.08
APTRANSCO Differential Tr.Charges credit -92.60
Total 3595.94 312.85 679.81 77.04 0.00 0.00 0.00 0.00
MW
Tariff
(Rs./kW/
month)
Cost
(Rs. Crs.)MW
Tariff
(Rs./kW/
month)
Cost
(Rs. Crs.)MW
Tariff
(Rs./kW/
month)
Cost
(Rs. Crs.)MW
Tariff (Rs./kW/
month)
Cost
(Rs. Crs.)
APTRANSCO
Total 0.00 0.00 0.00 0.00 0.00 0.00 0.00 0.00
Total Long term + Short term Contracts
((A) + (B))3595.94 312.85 679.81 77.04 0.00 0.00 0.00 0.00
FY 2019-20 Year 1
MW
Tariff
(Rs./kW/
month)
Cost
(Rs. Crs.)MW
Tariff
(Rs./kW/
month)
Cost
(Rs. Crs.)MW
Tariff
(Rs./kW/
month)
Cost
(Rs. Crs.)MW
Tariff (Rs./kW/
month)
Cost
(Rs. Crs.)
APTRANSCO 3,088.20 119.28 442.03 703.80 119.28 100.74
Differential Transmission Charges -4.09
Total 3088.20 437.94 100.74 0.00 0.00 0.00 0.00
MW
Tariff
(Rs./kW/
month)
Cost
(Rs. Crs.)MW
Tariff
(Rs./kW/
month)
Cost
(Rs. Crs.)MW
Tariff
(Rs./kW/
month)
Cost
(Rs. Crs.)MW
Tariff (Rs./kW/
month)
Cost
(Rs. Crs.)
APTRANSCO
Total 0.00 0.00 0.00 0.00 0.00 0.00 0.00 0.00
Total Long term + Short term Contracts
((A) + (B))3088.20 437.94 0.00 100.74 0.00 0.00 0.00 0.00
Load Eligible for Open Access Availed (within area of supply) Availed ( Outside Area of supply)
(B) Short Term and Temporary Contracts
Name of Transmission service provider
Load not eligible for Open AccessOpen Access
Load Eligible for Open Access Availed (within area of supply) Availed ( Outside Area of supply)
(B) Short Term and Temporary Contracts
Load Eligible for Open AccessLoad not eligible for Open Access
Name of Transmission service provider
Open Access
(A) Long Term and Firm Contracts
Name of Transmission service provider
Load not eligible for Open AccessOpen Access
Transmission Cost
Transmission Cost to be segregated between Load not eligible for Open Access, Load eligible for Open Access, Load within the area of supply and
availing power under Open Access as per Section 42 and 49 of E ACT.(Refer to Notes for the relevant definitions.)
Name of Transmission service provider
1) Loads Eligible for Open Access is as per Section 8.1 of Regulation 2 of 2005 of APERC
See Notes Sheet for Phasing of Open Access in the state of Andhra Pradesh.
2) Provide PGCIL and ULDC charges directly in Form 1.
(A) Long Term and Firm Contracts
Load not eligible for Open Access
Open Access
Load Eligible for Open Access Availed (within area of supply)
Availed ( Outside Area of supply)
Availed ( Outside Area of supply)
Availed (within area of supply)
114
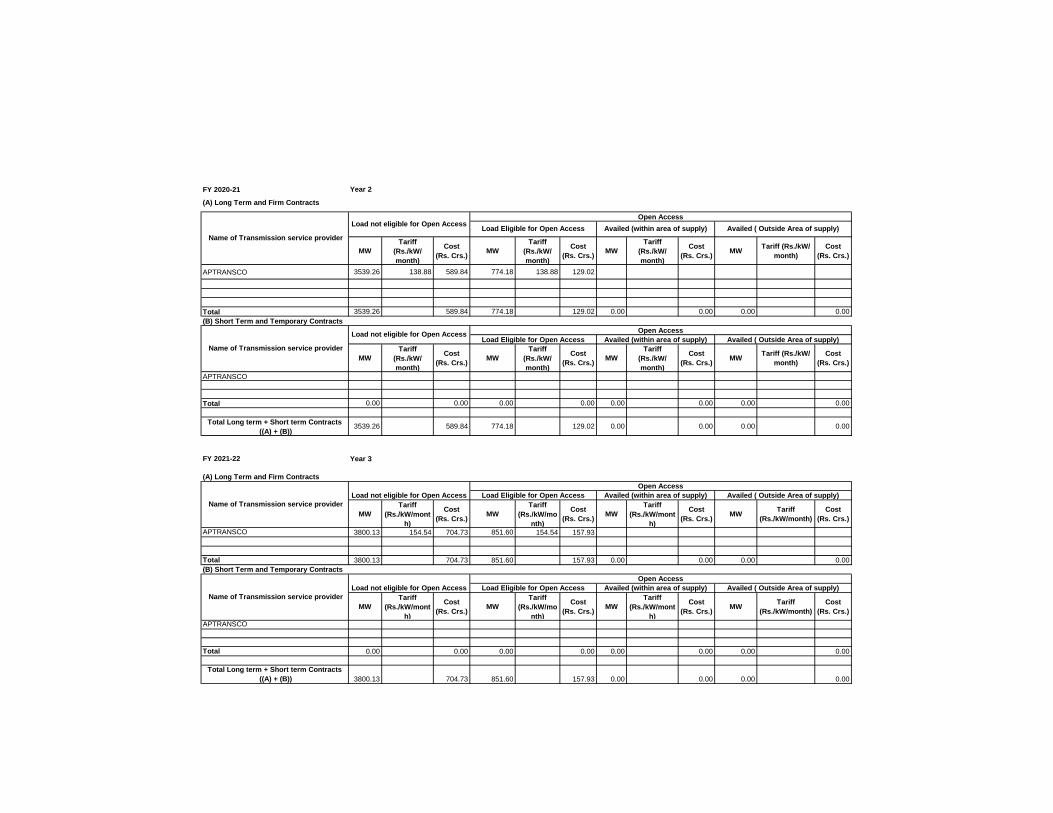
FY 2020-21 Year 2
MW
Tariff
(Rs./kW/
month)
Cost
(Rs. Crs.)MW
Tariff
(Rs./kW/
month)
Cost
(Rs. Crs.)MW
Tariff
(Rs./kW/
month)
Cost
(Rs. Crs.)MW
Tariff (Rs./kW/
month)
Cost
(Rs. Crs.)
APTRANSCO 3539.26 138.88 589.84 774.18 138.88 129.02
Total 3539.26 589.84 774.18 129.02 0.00 0.00 0.00 0.00
MW
Tariff
(Rs./kW/
month)
Cost
(Rs. Crs.)MW
Tariff
(Rs./kW/
month)
Cost
(Rs. Crs.)MW
Tariff
(Rs./kW/
month)
Cost
(Rs. Crs.)MW
Tariff (Rs./kW/
month)
Cost
(Rs. Crs.)
APTRANSCO
Total 0.00 0.00 0.00 0.00 0.00 0.00 0.00 0.00
Total Long term + Short term Contracts
((A) + (B))3539.26 589.84 774.18 129.02 0.00 0.00 0.00 0.00
FY 2021-22 Year 3
MW
Tariff
(Rs./kW/mont
h)
Cost
(Rs. Crs.)MW
Tariff
(Rs./kW/mo
nth)
Cost
(Rs. Crs.)MW
Tariff
(Rs./kW/mont
h)
Cost
(Rs. Crs.)MW
Tariff
(Rs./kW/month)
Cost
(Rs. Crs.)
APTRANSCO 3800.13 154.54 704.73 851.60 154.54 157.93
Total 3800.13 704.73 851.60 157.93 0.00 0.00 0.00 0.00
MW
Tariff
(Rs./kW/mont
h)
Cost
(Rs. Crs.)MW
Tariff
(Rs./kW/mo
nth)
Cost
(Rs. Crs.)MW
Tariff
(Rs./kW/mont
h)
Cost
(Rs. Crs.)MW
Tariff
(Rs./kW/month)
Cost
(Rs. Crs.)
APTRANSCO
Total 0.00 0.00 0.00 0.00 0.00 0.00 0.00 0.00
Total Long term + Short term Contracts
((A) + (B)) 3800.13 704.73 851.60 157.93 0.00 0.00 0.00 0.00
(A) Long Term and Firm Contracts
Load Eligible for Open Access
Load Eligible for Open Access
Name of Transmission service provider
Load Eligible for Open Access
Name of Transmission service provider
Open AccessLoad not eligible for Open Access
Availed (within area of supply)
Open Access
Load not eligible for Open Access
(B) Short Term and Temporary Contracts
Name of Transmission service provider
Load not eligible for Open Access
Availed ( Outside Area of supply)
Availed (within area of supply)
(A) Long Term and Firm Contracts
(B) Short Term and Temporary Contracts
Name of Transmission service provider
Availed (within area of supply) Availed ( Outside Area of supply)
Availed (within area of supply) Availed ( Outside Area of supply)Load not eligible for Open Access
Open Access
Open Access
Availed ( Outside Area of supply)Load Eligible for Open Access
115

Form 1.2 SLDC Charges
Base Year
MWTariff
(Rs./MW/year)
Cost
(Rs. Crs.)MW
Tariff
(Rs./MW/ month)
Cost
(Rs. Crs.)
Load not eligible for Open Access 3595.94 4214.27 1.515 3595.94 2342.73 10.11 11.6246
Open Access
Load Eligible for Open Access 679.81 4214.27 0.286 679.81 2342.73 1.91 2.1976
Availed (within area of supply) 0.00 0.00 0.00
Availed ( Outside Area of supply) 0.00 0.00
AP Transco SLDC Diff.Claim 17-18 11.09
FY 2019-20
MWTariff
(Rs./MW/year)
Cost
(Rs. Crs.)MW
Tariff
(Rs./MW/ month)
Cost
(Rs. Crs.)
Load not eligible for Open Access 5980.33 1917.48 1.15 5980.33 2146.34 15.40 16.55
Open Access
Load Eligible for Open Access 703.80 1917.48 0.13 703.80 2146.34 1.81 1.95
Availed (within area of supply) 0.00 0.00 0.00
Availed ( Outside Area of supply) 0.00 0.00 0.00
FY 2020-21
MWTariff
(Rs./MW/year)
Cost
(Rs. Crs.)MW
Tariff
(Rs./MW/ month)
Cost
(Rs. Crs.)
Load not eligible for Open Access 3327.82 2838.01 0.94 3327.82 2058.18 8.22 9.16
Open Access
Load Eligible for Open Access 774.18 2838.01 0.22 774.18 2058.18 1.91 2.13
Availed (within area of supply) 0.00 0.00
Availed ( Outside Area of supply) 0.00 0.00 0.00
FY 2021-22
MWTariff
(Rs./MW/year)
Cost
(Rs. Crs.)MW
Tariff
(Rs./MW/ month)
Cost
(Rs. Crs.)
Load not eligible for Open Access 3526.40 3792.02 1.34 3526.40 2086.32 8.83 10.17
Open Access
Load Eligible for Open Access 851.60 3792.02 0.32 851.60 2086.32 2.13 2.45
Availed (within area of supply) 0.00 0.00 0.00
Availed ( Outside Area of supply) 0.00 0.00 0.00
Total Cost
(Rs. Crs.)
Charges
Annual Fee
Annual Fee
Remarks
SLDC Charges to be segregated between Load not eligible for Open Access, Load eligible for Open Access, Load within the area of supply and availing power under Open Access as per
Section 42 and 49 of E ACT.(Refer to Notes for the relevant definitions.)
Remarks
Annual Fee
Annual Fee Charges
Total Cost
(Rs. Crs.)
Loads Eligible for Open Access is as per Section 8.1 of Regulation 2 of 2005 of APERC
See Notes Sheet for Phasing of Open Access in the state of Andhra Pradesh.
Charges
Total Cost
(Rs. Crs.)
Remarks
Charges
RemarksTotal Cost
(Rs. Crs.)
116

Form 1.3
Base Year
MW
Tariff
(Rs./kW/m
onth)
Cost
(Rs. Crs.)MW
Tariff
(Rs./kW/mont
h)
Cost
(Rs. Crs.)MW
Tariff
(Rs./kW/mo
nth)
Cost
(Rs. Crs.)MW
Tariff
(Rs./kW/m
onth)
Cost
(Rs. Crs.)
EPDCL ( 33 KV) 568.26 12.22 8.33 0.00
EPDCL ( 11 KV) 111.55 279.50 37.41 0.00
EPDCL LT 0.00
Total ( Non Eligible OA Cost) 3595.94 1726.50
Total 3595.94 1726.50 679.81 45.75 0.00 0.00 0.00 0.00
MW
Tariff
(Rs./kW/m
onth)
Cost
(Rs. Crs.)MW
Tariff
(Rs./kW/mont
h)
Cost
(Rs. Crs.)MW
Tariff
(Rs./kW/mo
nth)
Cost
(Rs. Crs.)MW
Tariff
(Rs./kW/m
onth)
Cost
(Rs. Crs.)
Total 0.00 0.00 0.00 0.00 0.00 0.00 0.00 0.00
Total Long term + Short term
Contracts
((A) + (B))
3595.94 1726.50 679.81 45.75 0.00 0.00 0.00 0.00
(B) Short Term and Temporary Contracts
Name of Distribution service
provider
Load not eligible for Open
Access
Open Access
Remarks
Load Eligible for Open Access Availed (within area of supply)Availed ( Outside Area of
supply)
(A) Long Term and Firm Contracts
Name of Distribution service
provider
Load not eligible for Open
Access
Open Access
Remarks
Load Eligible for Open Access Availed (within area of supply)Availed ( Outside Area of
supply)
Distribution Cost
Distribution Cost to be segregated between Load not eligible for Open Access, Load eligible for Open Access, Load within the area of supply
and availing power under Open Access as per Section 42 and 49 of E ACT.(Refer to Notes for the relevant definitions.)
Loads Eligible for Open Access is as per Section 8.1 of Regulation 2 of 2005 of APERC
See Notes Sheet for Phasing of Open Access in the state of Andhra Pradesh.
117

FY 2019-20
MW
Tariff
(Rs./kW/m
onth)
Cost
(Rs. Crs.)MW
Tariff
(Rs./kW/mont
h)
Cost
(Rs. Crs.)MW
Tariff
(Rs./kW/mo
nth)
Cost
(Rs. Crs.)MW
Tariff
(Rs./kW/m
onth)
Cost
(Rs. Crs.)
EPDCL ( 33 KV) 85.32 591.68 45.24 32.12
EPDCL ( 11 KV) 824.88 112.12 349.71 47.05
EPDCL LT 1952.00
Total ( Non Eligible OA Cost) 2862.20 1735.83
Additional expedniture 233.59
Total 2862.20 1969.42 703.80 79.17 0.00 0.00 0.00 0.00
MW
Tariff
(Rs./kW/m
onth)
Cost
(Rs. Crs.)MW
Tariff
(Rs./kW/mont
h)
Cost
(Rs. Crs.)MW
Tariff
(Rs./kW/mo
nth)
Cost
(Rs. Crs.)MW
Tariff
(Rs./kW/m
onth)
Cost
(Rs. Crs.)
Total 0.00 0.00 0.00 0.00 0.00 0.00 0.00 0.00
Total Long term + Short term
Contracts
((A) + (B))
2862.20 1969.42 703.80 79.17 0.00 0.00 0.00 0.00
Availed (within area of supply)Availed ( Outside Area of
supply)
Load Eligible for Open Access
(A) Long Term and Firm Contracts
Availed ( Outside Area of
supply)
Remarks
Load not eligible for Open
Access
(B) Short Term and Temporary Contracts
Name of Distribution service
provider
Availed (within area of supply)
Name of Distribution service
provider
Load not eligible for Open
Access
Open Access
Load Eligible for Open Access
Remarks
Open Access
118

FY 2020-21
MW
Tariff
(Rs./kW/
month)
Cost
(Rs. Crs.)MW
Tariff (Rs./kW/
month)
Cost
(Rs. Crs.)MW
Tariff
(Rs./kW/
month)
Cost
(Rs. Crs.)MW
Tariff
(Rs./kW/m
onth)
Cost
(Rs. Crs.)
EPDCL ( 33 KV) 100.15 650.85 48.38 37.79
EPDCL ( 11 KV) 894.67 123.33 375.94 55.64
EPDCL LT 2076.00
Total ( Non Eligible OA Cost) 3070.82 1997.58
Total 3070.82 1997.58 774.18 93.42 0.00 0.00 0.00 0.00
MW
Tariff
(Rs./kW/m
onth)
Cost
(Rs. Crs.)MW
Tariff
(Rs./kW/mont
h)
Cost
(Rs. Crs.)MW
Tariff
(Rs./kW/mo
nth)
Cost
(Rs. Crs.)MW
Tariff
(Rs./kW/m
onth)
Cost
(Rs. Crs.)
Total 0.00 0.00 0.00 0.00 0.00 0.00 0.00 0.00
Total Long term + Short term
Contracts
((A) + (B))
3070.82 1997.58 774.18 93.42 0.00 0.00 0.00 0.00
Load not eligible for Open
Access
Open Access
(B) Short Term and Temporary Contracts
Open Access
Remarks
(A) Long Term and Firm Contracts
Remarks
Load Eligible for Open Access Availed (within area of supply)
Load not eligible for Open
Access Availed ( Outside Area of Name of Distribution service
provider
Availed ( Outside Area of Name of Distribution service
provider
Availed (within area of supply)Load Eligible for Open Access
119

FY 2021-22
MW
Tariff
(Rs./kW/m
onth)
Cost
(Rs. Crs.)MW
Tariff
(Rs./kW/mont
h)
Cost
(Rs. Crs.)MW
Tariff
(Rs./kW/mo
nth)
Cost
(Rs. Crs.)MW
Tariff
(Rs./kW/m
onth)
Cost
(Rs. Crs.)
EPDCL ( 33 KV) 117.07 715.93 54.73 47.02
EPDCL ( 11 KV) 971.34 135.66 427.50 69.60
EPDCL LT 2208.00
Total ( Non Eligible OA Cost) 3296.40 2432.38
Total 3296.40 2432.38 851.60 116.62 0.00 0.00 0.00 0.00
MW
Tariff
(Rs./kW/m
onth)
Cost
(Rs. Crs.)MW
Tariff
(Rs./kW/mont
h)
Cost
(Rs. Crs.)MW
Tariff
(Rs./kW/mo
nth)
Cost
(Rs. Crs.)MW
Tariff
(Rs./kW/m
onth)
Cost
(Rs. Crs.)
Total 0.00 0.00 0.00 0.00 0.00 0.00 0.00 2549.00
Total Long term + Short term
Contracts
((A) + (B)) 3296.40 2432.38 851.60 116.62 0.00 0.00 0.00 2549.00
Availed ( Outside Area of
(A) Long Term and Firm Contracts
Availed (within area of supply) Availed ( Outside Area of
Open Access
Availed (within area of supply)
Remarks
(B) Short Term and Temporary Contracts
Open Access
Remarks
Load Eligible for Open Access Name of Distribution service
provider
Name of Distribution service
provider
Load not eligible for Open
Access Load Eligible for Open Access
Load not eligible for Open
Access
120

Form 1.4 (FY 2019-20) Power Purchase and Procurement Cost (For Regulated Business#)
Generating Station D Link
Plant Type
Must Run = 1
Others = 2
Plant CapacityDISCOM'
s share
DISCOM's
share
(MW) (%) (MW)Net
AvailabilityDispatch Fixed Variable Incentive Income Tax Others Total Fixed Incentives
Income
TaxOthers Variable Total
VTPS I 803.70 803.70 75.77 267.06 342.83 0.94 0.00 0.00 0.00 3.32 4.27
VTPS II 803.70 803.70 75.77 267.06 342.83 0.94 0.00 0.00 0.00 3.32 4.27
VTPS III 803.70 803.70 75.77 267.06 342.83 0.94 0.00 0.00 0.00 3.32 4.27
VTPS IV 1024.17 1024.17 112.70 319.32 432.02 1.10 0.00 0.00 0.00 3.12 4.22
RTPP I 417.51 417.51 87.36 158.89 246.25 2.09 0.00 0.00 0.00 3.81 5.90
RTPP Stage-II 623.85 623.85 84.81 238.08 322.89 1.36 0.00 0.00 0.00 3.82 5.18
RTPP Stage-III 192.05 192.05 86.73 73.07 159.80 4.52 0.00 0.00 0.00 3.80 8.32
Damodaram Sanjeevaiah Thermal power plant - I 1139.17 1139.17 165.47 349.21 514.68 1.45 0.00 0.00 0.00 3.07 4.52
Damodaram Sanjeevaiah Thermal power plant - II 1139.17 1139.17 165.47 349.21 514.68 1.45 0.00 0.00 0.00 3.07 4.52
RTPP IV 754.36 754.36 25.72 289.43 315.15 0.34 0.00 0.00 0.00 3.84 4.18
Interest on pension bonds (Over and above schedule) 0.00 0.00 0.00 0.00 0.00 0.00 0.00 0.00 0.00 0.00 0.00
GENCO RTPP Stage-IV Suppl FC for 2019-20 0.00 0.00 88.68 0.00 88.68 0.00 0.00 0.00 0.00 0.00 0.00
GENCO RTPP Stage-IV Suppl FC AND VC for 2018-19 0.00 0.00 69.87 30.87 100.73 0.00 0.00 0.00 0.00 0.00 0.00
less: APPDCL Differential FC and VC Claims from 2018-19 0.00 0.00 (720.68) (85.61) (806.28) 0.00 0.00 0.00 0.00 0.00 0.00
TOTAL THERMAL 7701.38 7701.38 393.46 2523.63 0 0 0 2917.09 0.51 0.00 0.00 0.00 3.28 3.79
AP GENCO Hydel 0.00 0.00 0.00 0.00 0.00 0.00
MACHKUND PH AP Share 116.58 116.58 14.31 0.00 14.31 1.23 0.00 0.00 0.00 0.00 1.23
TUNGBHADRA PH AP Share 54.15 54.15 9.57 0.00 9.57 1.77 0.00 0.00 0.00 0.00 1.77
Upper Sileru Power House (AP) 214.30 214.30 25.55 0.00 25.55 1.19 0.00 0.00 0.00 0.00 1.19
Lower Sileru Power House (AP) 286.73 286.73 48.97 0.00 48.97 1.71 0.00 0.00 0.00 0.00 1.71
DONKARAYI (AP) 24.03 24.03 2.66 0.00 2.66 1.11 0.00 0.00 0.00 0.00 1.11
Srisailam Right Bank Power House (AP) 448.32 448.32 74.19 0.00 74.19 1.65 0.00 0.00 0.00 0.00 1.65
Ramagiri Wind Mills (AP) 0.00 0.00 0.00 0.00 0.00 0.00 0.00 0.00 0.00 0.00 0.00
Nagarjunasagar Right Bank Power House (AP) 34.68 34.68 8.50 0.00 8.50 2.45 0.00 0.00 0.00 0.00 2.45
Penna Ahobilam (AP) 0.32 0.32 4.41 0.00 4.41 137.79 0.00 0.00 0.00 0.00 137.79
MINI HYDEL(Chettipeta)-AP 0.75 0.75 0.57 0.00 0.57 7.52 0.00 0.00 0.00 0.00 7.52
Nagarjunasagar Tail Pond Dam Power House 25.86 25.86 17.86 0.00 17.86 6.91 0.00 0.00 0.00 0.00 6.91
TOTAL HYDRO 1205.72 1205.72 206.60 0.00 0.00 0 0 206.60 1.71 0.00 0.00 0.00 0.00 1.71
TOTAL GENCO 8907.10 8907.10 600.06 2523.63 0.00 0 0 3123.69 0.67 0.00 0.00 0.00 2.83 3.51
0.00 0.00 0.00 0.00 0.00 0.00 0.00
Central Generating Stations 0.00 0.00 0.00 0.00 0.00 0.00 0.00
NTPC 0.00 0.00 0.00 0.00 0.00 0.00 0.00
NTPC (SR) 0.00 0.00 0.00 0.00 0.00 0.00 0.00
NTPC (SR)-Ramagundam Stage1&2 654.51 654.51 47.30 170.57 217.86 0.72 0.00 0.00 0.00 2.61 3.33
NTPC (SR)-Ramagundam Stage 3 172.86 172.86 13.38 44.47 57.85 0.77 0.00 0.00 0.00 2.57 3.35
Total NTPC(SR) 827.38 827.38 60.68 215.04 0.00 0 0 275.71 0.73 0.00 0.00 0.00 2.60 3.33
275.71 0.00 0.00 0.00 0.00 0.00 0.00
NTPC (ER) 0.00 0.00 0.00 0.00 0.00 0.00 0.00
Farakka 0.00 0.00 0.00 0.00 0.00 0.00 0.00
Kahalgaon 0.00 0.00 0.00 0.00 0.00 0.00 0.00
Talcher - Stage 1 0.00 0.00 0.00 0.00 0.00 0.00 0.00 0.00 0.00 0.00 0.00
Talcher Stage 2 387.70 387.70 31.48 78.01 109.49 0.81 0.00 0.00 0.00 2.01 2.82
Others 0.00 0.00 0.00 0.00 0.00 0.00 0.00 0.00
Total NTPC(ER) 387.70 387.70 31.48 78.01 0 0 0 109.49 0.81 0.00 0.00 0.00 2.01 2.82
NTPC (WR)
NTPC WR 109.30 109.30 24.09 41.01 65.10 2.20 0.00 0.00 0.00 3.75 5.96
Total NTPC(WR) 109.30 109.30 24.09 41.01 0 0 0 65.10 2.20 0.00 0.00 0.00 3.75 5.96
0.00 0.00 0.00 0.00 0.00 0.00 0.00
Total NTPC 1324.37 1324.37 116.25 334.06 0 0 0 450.31 0.88 0.00 0.00 0.00 2.52 3.40
0.00 0.00 0.00 0.00 0.00 0.00 0.00
NLC TS-II 0.00 0.00 0.00 0.00 0.00 0.00 0.00
Stage-I 112.97 112.97 8.56 30.61 39.17 0.76 0.00 0.00 0.00 2.71 3.47
Stage-II 195.40 195.40 16.79 53.01 39.17 0.86 0.00 0.00 0.00 2.71 2.00
Total NLC 308.38 308.38 25.35 83.62 0 0 0 108.97 0.82 0.00 0.00 0.00 2.71 3.53
Cost (Rs. Crs.)Availability and
Dispatch (MU)
Unit Cost
(Rs. / kWh)
121

Generating Station D Link
Plant Type
Must Run = 1
Others = 2
Plant CapacityDISCOM'
s share
DISCOM's
share
(MW) (%) (MW)Net
AvailabilityDispatch Fixed Variable Incentive Income Tax Others Total Fixed Incentives
Income
TaxOthers Variable Total
Cost (Rs. Crs.)Availability and
Dispatch (MU)
Unit Cost
(Rs. / kWh)
0 0.00 0.00 0.00 0.00 0.00 0.00
NPC 0.00 0.00 0.00 0.00 0.00 0.00 0.00
NPC-MAPS 20.56 20.56 0.00 (0.24) (0.24) 0.00 0.00 0.00 0.00 (0.12) (0.12)
NPC-Kaiga unit I&ii 297.09 297.09 0.00 81.26 81.26 0.00 0.00 0.00 0.00 2.74 2.74
NPC-Kaiga unit III&IV 0.00 0.00 0.00 0.00 0.00 0.00 0.00 0.00 0.00
Total NPC 317.65 317.65 0.00 81.02 0 0 0 81.02 0.00 0.00 0.00 0.00 2.55 2.55
0.00 0.00 0.00 0.00 0.00 0.00 0.00
NTPC - Simhadri 0.00 0.00 0.00 0.00 0.00 0.00 0.00
NTPC Simhadri Stage I 998.83 998.83 141.98 344.11 486.09 1.42 0.00 0.00 0.00 3.45 4.87
NTPC Simhadri Stage II 398.27 398.27 73.74 133.75 207.48 1.85 0.00 0.00 0.00 3.36 5.21
Total NTPC- Simhadri 1397.10 1397.10 215.72 477.85 0 0 0 693.57 1.54 0.00 0.00 0.00 3.42 4.96
CGS - New
Vallur Thermal Power Plant 128.89 128.89 58.12 49.57
Kudigi 251.25 251.25 110.80 94.58 205.38 4.41 0.00 0.00 0.00 3.76 8.17
NLC Tamilnadu Power Ltd Stage.1 222.08 222.08 46.49 65.75 112.24 2.09 0.00 0.00 0.00 2.96 5.05
NLC NNTPS 9.51 9.51 1.71 2.18 3.90 1.80 0.00 0.00 0.00 2.30 4.10
TOTAL CGS 3959.23 3959.23 574.44 1188.63 0.00 0.00 0.00 1763.07 1.45 0.00 0.00 0.00 3.00 4.45
APGPCL 0.00 0.00 0.00 0.00 0.00 0.00 0.00
APGPCL I - Allocated capacity 9.39 9.39 0.98 3.19 4.16 1.04 0.00 0.00 0.00 3.40 4.43
APGPCL II - Allocated capacity 42.18 42.18 3.37 14.61 17.98 0.80 0.00 0.00 0.00 3.46 4.26
Total APGPCL 51.57 51.57 4.35 17.79 0.00 0.00 0.00 22.14 0.84 0.00 0.00 0.00 3.45 4.29
IPPS 0.00 0.00 0.00 0.00 0.00 0.00 0.00
Godavari Gas Power Plant 215.08 215.08 8.89 63.46 72.36 0.41 0.00 0.00 0.00 2.95 3.36
Spectrum 185.61 185.61 17.08 49.20 66.28 0.92 0.00 0.00 0.00 2.65 3.57
Kondapalli (Gas) 259.87 259.87 14.12 73.62 87.74 0.54 0.00 0.00 0.00 2.83 3.38
BSES 0.00 0.00 0.00 0.00 0.00 0.00 0.00
GVK Extension 0.00 0.00 0.00 0.00 0.00 0.00 0.00
Vemagiri 0.00 0.00 0.00 0.00 0.00 0.00 0.00
Gautami 0.00 0.00 0.00 0.00 0.00 0.00 0.00
Konaseema 0.00 0.00 0.00 0.00 0.00 0.00 0.00
GMR Rajahmundry Energy ltd.(768 MW) 0.00 0.00 0.00 0.00 0.00 0.00 0.00
TOTAL IPPS 660.56 660.56 40.09 186.28 0.00 0.00 0.00 226.37 0.61 0.00 0.00 0.00 2.82 3.43
NCE 0.00 0.00 0.00 0.00 0.00 0.00
NCE - Bio Mass 6.07 6.07 0.00 3.73 3.73 0.00 0.00 0.00 0.00 6.14 6.14
NCE - Bagasse 29.10 29.10 0.00 11.06 11.06 0.00 0.00 0.00 0.00 3.80 3.80
NCE - Industrial Waste 15.14 15.14 0.00 9.38 9.38 0.00 0.00 0.00 0.00 6.19 6.19
NCE - Wind Power 0.00 0.00 0.00 0.00 0.00 0.00 0.00 0.00 0.00 0.00 0.00
NCE - Mini Hydel 29.95 29.95 0.00 7.04 7.04 0.00 0.00 0.00 0.00 2.35 2.35
NCE - SOLAR Power (Without Bundled) 593.69 593.69 0.00 236.51 236.51 0.00 0.00 0.00 0.00 3.98 3.98
NTPC NVVNL Bundled Power (Only SOLAR) 15.86 15.86 0.00 19.87 19.87 0.00 0.00 0.00 0.00 12.52 12.52
NTPC NVVNL Bundled Power (Only COAL) 61.80 61.80 0.00 29.67 29.67 0.00 0.00 0.00 0.00 4.80 4.80
NTPC NSM Phase-II, Bundled Power (SOLAR) 0.00 0.00 0.00 0.00 0.00 0.00 0.00 0.00 0.00 0.00 0.00
NTPC NSM Phase-II, Bundled Power (COAL) 1013.20 1013.20 0.00 438.38 438.38 0.00 0.00 0.00 0.00 4.33 4.33
NTPC NPKunta Ultra Mega Solar Project 250MW 128.12 128.12 0.00 75.48 75.48 0.00 0.00 0.00 0.00 5.89 5.89
NTPC NPKunta Ultra Mega Solar Project 250MW 42.07 42.07 0.00 9.81 9.81 0.00 0.00 0.00 0.00 2.33 2.33
NTPC Ramagundam Solar Power 0.00 0.00 0.00 0.00 0.00 0.00 0.00 0.00 0.00
0.00 0.00 0.00 0.00 0.00 0.00
TOTAL NCE 1935.00 1935.00 0.00 840.93 0.00 0.00 0.00 840.93 0.00 0.00 0.00 0.00 4.35 4.35
0.00 0.00 0.00 0.00 0.00 0.00
IPPS-Others 0.00 0.00 0.00 0.00 0.00 0.00
Srivathsa (Exclusive EPDCL) 9.87 9.87 0.47 2.89 3.36 0.48 0.00 0.00 0.00 2.93 3.41
KSK Mahanadi (MT) 731.95 731.95 112.65 201.31 313.96 1.54 0.00 0.00 0.00 2.75 4.29
Hinduja 942.03 942.03 0.00 359.85 359.85 0.00 0.00 0.00 0.00 3.82 3.82
Thermal Power Tech 635.09 635.09 101.08 147.57 248.66 1.59 0.00 0.00 0.00 2.32 3.92
RVK Energy Pvt Ltd (IPP upto 30.9.15) 0.00 0.00 0.00 0.00 0.00 0.00
1000MW DBFO 0.00 0.00 0.00 0.00 0.00 0.00
TOTAL OTHERS 2318.93 2318.93 214.21 711.63 0.00 0.00 0.00 925.84 0.92 0.00 0.00 0.00 3.07 3.99
122

Generating Station D Link
Plant Type
Must Run = 1
Others = 2
Plant CapacityDISCOM'
s share
DISCOM's
share
(MW) (%) (MW)Net
AvailabilityDispatch Fixed Variable Incentive Income Tax Others Total Fixed Incentives
Income
TaxOthers Variable Total
Cost (Rs. Crs.)Availability and
Dispatch (MU)
Unit Cost
(Rs. / kWh)
0.00 0.00 0.00 0.00 0.00 0.00
MARKET 0.00 0.00 0.00 0.00 0.00 0.00
Indian Energy Exchange Ltd (Short Term Purchases (Trading/IEX/PXIL) 812.51 812.51 0.00 275.98 275.98 0.00 0.00 0.00 0.00 3.40 3.40
Indian Energy Exchange Ltd-STOA chargess 0.00 0.00 0.00 44.86 44.86 0.00 0.00 0.00 0.00 0.00 0.00
Short Term Purchases (Only Swapping) 0.00 0.00 0.00 0.00 0.00 0.00 0.00 0.00 0.00 0.00 0.00
Mittal Processors Pvt.Ltd
(Swapping)-Trading Margin40.30 40.30 0.00 0.12 0.12 0.00 0.00 0.00 0.00 0.03 0.03
Mittal Processors Pvt.Ltd
(Swapping)-STOA Charges0.00 0.00 0.00 7.28 7.28 0.00 0.00 0.00 0.00 0.00 0.00
GMR Energy Trading
(SWAAPING)-Trading Margin24.67 24.67 0.00 0.07 0.07 0.00 0.00 0.00 0.00 0.03 0.03
GMR Energy Trading
(SWAAPING) -STOA charges0.00 0.00 0.00 12.40 12.40 0.00 0.00 0.00 0.00 0.00 0.00
Arunachal Pradesh Power Corporation (Swaping)-Trading Margin 53.64 53.64 0.00 0.15 0.15 0.00 0.00 0.00 0.00 0.03 0.03
Arunachal Pradesh Power Corporation (Swaping) STOA Charges 0.00 0.00 0.00 8.92 8.92 0.00 0.00 0.00 0.00 0.00 0.00
Manikaran Power Trading
(SWAAPING)-Trading Margin6.17 6.17 0.00 0.18 0.18 0.00 0.00 0.00 0.00 0.29 0.29
Manikaran Power Trading
(SWAAPING) -STOA charges0.00 0.00 0.00 8.28 8.28 0.00 0.00 0.00 0.00 0.00 0.00
NVVNL-STOA charges on Sale of Power 0.00 0.00 0.00 0.00 0.00 0.00 0.00 0.00 0.00
PTC India Ltd (STOA on sale of power) 0.00 0.00 0.00 0.00 0.00 0.00 0.00 0.00 0.00
PTC India Ltd (Swaping)-Trading Margin 0.00 0.00 0.00 0.00 0.00 0.00 0.00 0.00 0.00
PTC POC bills( Revision of MTOA Charges) 0.00 0.00 0.00 0.00 0.00 0.00 0.00 0.00 0.00
Sarda Metals 0.00 0.00 0.00 0.00 0.00 0.00 0.00 0.00 0.00
Power Exchange India-PXIL(Energy Charges) 243.67 243.67 0.00 89.71 89.71 0.00 0.00 0.00 0.00 3.68 3.68
Power Exchange India-PXIL(STOA Charges) 0.00 0.00 0.00 13.70 13.70 0.00 0.00 0.00 0.00 0.00 0.00
shri Girija 26MW trading 0.00 0.00 0.00 0.00 0.00 0.00 0.00 0.00 0.00
PTC India trading Ltd trading 0.00 0.00 0.00 0.00 0.00 0.00 0.00 0.00 0.00
Sembcorp Gayatri Power Limited(STOA Charges) 0.00 0.00 0.00 0.00 0.00 0.00 0.00 0.00 0.00
Sembcorp Gayatri Power Limited Trading Energy 0.00 0.00 0.00 0.00 0.00 0.00 0.00 0.00 0.00
Discom to Discom IBSS/FBSS settlements 0.00 0.00 0.00 0.00 0.00 0.00 0.00 0.00 0.00
NHPC LIMITED (Trading) 106.70 106.70 0.00 43.22 43.22 0.00 0.00 0.00 0.00 4.05 4.05
swapping Return -1129.29 -1129.29 0.00 (422.47) (422.47) 0.00 0.00 0.00 0.00 3.74 3.74
EPDCL IBSS Adjustment for 2019-20(Purchase from SPDCL) 4854.88 4854.88 0.00 2,058.47 2,058.47 0.00 0.00 0.00 0.00 4.24 4.24
POSOCO-Deviation Charges (CGS UI charges) 8.63 8.63 0.00 13.27 13.27 0.00 0.00 0.00 0.00 15.38 15.38
POSOCO Reactive charges 0.00 0.00 0.00 3.71 3.71 0.00 0.00 0.00 0.00 0.00 0.00
TOTAL MARKET 5021.88 5021.88 0.00 2157.87 0.00 0.00 0.00 2157.87 0.00 0.00 0.00 0.00 4.30 4.30
0.00 0.00 0.00 0.00 0.00 0.00 0.00
TOTAL (From All Sources) 22854.272 22854.27 1433.14 7626.77 0 0 0 9059.91 0.63 0.00 0.00 0.00 3.34 3.96
Note:
1) Details of NCE Plant wise to be filled in Form 1.4 [i,ii,iii,iv,v,vi]
2) Hydro cost break up details to be provided based on appropriate methodology. In case it is not possible to segregate the cost
Station wise, provide the total details in the empty rows in the APGenco Hydro stations section saying ALL APGenco Hydro (Combined)
123

Generating Station D Link
Plant Type
Must Run = 1
Others = 2
Plant CapacityDISCOM'
s share
DISCOM's
share
(MW) (%) (MW)Net
AvailabilityDispatch Fixed Variable Incentive Income Tax Others Total Fixed Incentives
Income
TaxOthers Variable Total
Cost (Rs. Crs.)Availability and
Dispatch (MU)
Unit Cost
(Rs. / kWh)
FY 2020-21
Generating Station D Link
Plant Type
Must Run = 1
Others = 2
Plant CapacityDISCOM'
s share
DISCOM's
share
(MW) (%) (MW)Net
AvailabilityDispatch Fixed Variable Incentive Income Tax Others Total Fixed IncentivesIncome TaxOthers Variable Total
Apgenco-Thermal
Dr. NTTPS 1260 36.22% 456.37 3354.44 1814.47 246.09 606.03 0.00 0.00 0.00 852.12 1.36 0.00 0.00 0.00 3.34 4.70
Dr. NTTPS-IV 500 36.22% 181.10 1267.06 972.92 102.49 306.47 0.00 0.00 0.00 408.96 1.05 0.00 0.00 0.00 3.15 4.20
RTPP Stage-I 420 36.22% 152.12 1113.01 180.63 93.96 69.72 0.00 0.00 0.00 163.68 5.20 0.00 0.00 0.00 3.86 9.06
RTPP Stage-II 420 36.22% 152.12 1152.48 525.67 91.55 202.91 0.00 0.00 0.00 294.46 1.74 0.00 0.00 0.00 3.86 5.60
RTPP Stage-III 210 36.22% 76.06 566.95 232.32 67.72 89.67 0.00 0.00 0.00 157.40 2.92 0.00 0.00 0.00 3.86 6.78
RTPP Stage-IV 600 36.22% 217.32 1629.40 706.45 399.05 258.56 0.00 0.00 0.00 657.61 5.65 0.00 0.00 0.00 3.66 9.31
Genco-Thermal Total 3410 36.22% 1235.10 9083.34 4432.47 1000.86 1533.37 0.00 0.00 0.00 2534.24 2.26 0.00 0.00 0.00 3.46 5.72
Srisailam RCPH 770 36.22% 278.89 346.64 346.64 79.60 0.00 0.00 0.00 0.00 79.60 2.30 0.00 0.00 0.00 0.00 2.30
NSRCPH 90 36.22% 32.60 27.17 27.17 9.12 0.00 0.00 0.00 0.00 9.12 3.36 0.00 0.00 0.00 0.00 3.36
NSTPDC PH 50 36.22% 18.11 25.23 25.23 18.63 0.00 0.00 0.00 0.00 18.63 7.38 0.00 0.00 0.00 0.00 7.38
Upper Sileru 240 36.22% 86.93 123.89 123.89 27.73 0.00 0.00 0.00 0.00 27.73 2.24 0.00 0.00 0.00 0.00 2.24
Lower Sileru 460 36.22% 166.61 341.77 341.76 53.14 0.00 0.00 0.00 0.00 53.14 1.55 0.00 0.00 0.00 0.00 1.55
Donkarayi 25 36.22% 9.06 107.61 107.61 2.88 0.00 0.00 0.00 0.00 2.88 0.27 0.00 0.00 0.00 0.00 0.27
PABM 20 36.22% 7.24 9.89 9.89 4.73 0.00 0.00 0.00 0.00 4.73 4.79 0.00 0.00 0.00 0.00 4.79
Minihydel(Chettipet) 1 36.22% 0.36 0.83 0.83 0.62 0.00 0.00 0.00 0.00 0.62 7.45 0.00 0.00 0.00 0.00 7.45
Machkund AP Share 84 36.22% 30.42 121.39 121.39 12.68 0.00 0.00 0.00 0.00 12.68 1.04 0.00 0.00 0.00 0.00 1.04
TB Dam AP Share 57.6 36.22% 20.86 41.14 41.14 8.69 0.00 0.00 0.00 0.00 8.69 2.11 0.00 0.00 0.00 0.00 2.11
Genco Hydel Total 1798 36.22% 651.09 1145.56 1145.56 217.83 0.00 0.00 0.00 0.00 217.83 1.90 0.00 0.00 0.00 0.00 1.90
APGENCO-TOTAL 5207.60 36.22% 1886.19 10228.90 5578.03 1218.69 1533.37 0.00 0.00 0.00 2752.07 2.18 0.00 0.00 0.00 2.75 4.93
APGPCL Stage-I 100 36.22% 5.80 20.72 20.72 1.27 6.61 0.00 0.00 0.00 7.88 0.61 0.00 0.00 0.00 3.19 3.80
APGPCL Stage-II 172 36.22% 15.51 47.27 47.27 2.79 13.33 0.00 0.00 0.00 16.12 0.59 0.00 0.00 0.00 2.82 3.41
APPDCL Stage-I 1600 36.22% 521.57 3844.50 3260.68 636.16 1023.85 0.00 0.00 0.00 1660.01 1.95 0.00 0.00 0.00 3.14 5.09
Godavari Gas Power Plant 216 36.22% 78.24 265.63 265.63 6.87 61.51 0.00 0.00 0.00 68.38 0.26 0.00 0.00 0.00 2.32 2.57
Joint Sector-TOTAL 2088.00 36.22% 621.10 4178.11 3594.29 647.09 1105.30 0.00 0.00 0.00 1752.39 1.80 0.00 0.00 0.00 3.08 4.88
NTPC(SR) Ramagundam I & II 2100 36.22% 150.15 674.32 621.69 50.01 151.69 0.00 0.00 0.00 201.70 0.80 0.00 0.00 0.00 2.44 3.24
NTPC(SR) Simhadri Stage-I 1000 36.22% 167.01 1272.12 991.01 137.10 311.67 0.00 0.00 0.00 448.78 1.38 0.00 0.00 0.00 3.15 4.53
NTPC(SR) Simhadri Stage-II 1000 36.22% 93.70 511.46 438.11 75.72 135.38 0.00 0.00 0.00 211.10 1.73 0.00 0.00 0.00 3.09 4.82
NTPC(SR) Talcher Stage-II 2000 36.22% 81.71 470.52 454.55 33.65 90.14 0.00 0.00 0.00 123.79 0.74 0.00 0.00 0.00 1.98 2.72
NTPC(SR) Ramagundam III 500 36.22% 37.37 157.34 145.64 11.85 34.95 0.00 0.00 0.00 46.81 0.81 0.00 0.00 0.00 2.40 3.21
NTPC Kudgi Stage-I 2400 36.22% 139.33 608.20 296.22 92.11 103.23 0.00 0.00 0.00 195.34 3.11 0.00 0.00 0.00 3.49 6.59
NTECL Valluru 1500 36.22% 31.85 223.59 122.93 44.25 41.99 0.00 0.00 0.00 86.25 3.60 0.00 0.00 0.00 3.42 7.02
NLC Stage-I 630 36.22% 17.26 96.45 95.57 14.63 27.48 0.00 0.00 0.00 42.12 1.53 0.00 0.00 0.00 2.88 4.41
NLC Stage-II 840 36.22% 31.48 132.57 128.05 11.21 35.48 0.00 0.00 0.00 46.69 0.88 0.00 0.00 0.00 2.77 3.65
NPC(MAPS) 440 36.22% 6.66 18.20 18.20 0.00 4.76 0.00 0.00 0.00 4.76 0.00 0.00 0.00 0.00 2.61 2.61
NPC(KAIGA unit I,II,III,IV) 880 36.22% 42.10 287.22 287.22 0.00 99.81 0.00 0.00 0.00 99.81 0.00 0.00 0.00 0.00 3.48 3.48
NTPL(NLC TamilNadu) 1000 36.22% 44.63 334.18 281.67 53.84 81.66 0.00 0.00 0.00 135.50 1.91 0.00 0.00 0.00 2.90 4.81
NLC NNTPS 1000 36.22% 19.12 93.02 92.14 11.14 21.56 0.00 0.00 0.00 32.70 1.21 0.00 0.00 0.00 2.34 3.55
JNNSM Ph-1 Thermal *39MW clubbed into NTPC plants 36.22% 0.00 78.35 78.36 13.24 28.04 0.00 0.00 0.00 41.28 1.69 0.00 0.00 0.00 3.58 5.27
JNNSM Ph-2 Thermal *500MW clubbed into NTPC plants 36.22% 0.00 1115.32 1086.83 188.49 304.97 0.00 0.00 0.00 493.45 1.73 0.00 0.00 0.00 2.81 4.54
CGS TOTAL 15290 36.22% 862.38 6072.85 5138.19 737.26 1472.81 0.00 0.00 0.00 2210.07 1.43 0.00 0.00 0.00 2.87 4.30
KSK Mahanadi 1800 36.22% 144.87 293.53 282.82 46.47 83.57 0.00 0.00 0.00 130.04 1.64 0.00 0.00 0.00 2.96 4.60
Thermal Powertech Corporation 1240 36.22% 83.49 647.62 616.51 96.73 143.89 0.00 0.00 0.00 240.63 1.57 0.00 0.00 0.00 2.33 3.90
Hinduja National Powercorp 1040 36.22% 3917.56 385.45 385.45 0.00 147.24 0.00 0.00 0.00 147.24 0.00 0.00 0.00 0.00 3.82 3.82
IPP TOTAL 4080.00 36.22% 4145.91 665.82 1284.78 143.20 374.71 0.00 0.00 0.00 517.91 1.11 0.00 0.00 0.00 2.92 4.03
NCE- Others 83.34 100.00% 83.34 95.13 95.13 0.00 48.90 0.00 0.00 0.00 48.90 0.00 0.00 0.00 0.00 5.14 5.14
NCE Wind 0 100.00% 0.00 0.00 0.00 0.00 0.00 0.00 0.00 0.00 0.00 0.00 0.00 0.00 0.00 0.00 0.00
NCE Solar 12.43 100.00% 12.43 37.10 37.10 0.00 16.58 0.00 0.00 0.00 16.58 0.00 0.00 0.00 0.00 4.47 4.47
JNNSM Ph-1 Solar 0 100.00% 0.00 0.00 0.00 0.00 0.00 0.00 0.00 0.00 0.00 0.00 0.00 0.00 0.00 0.00 0.00
JNNSM Ph-2 Solar 0 100.00% 0.00 0.00 0.00 0.00 0.00 0.00 0.00 0.00 0.00 0.00 0.00 0.00 0.00 0.00 0.00
NCE TOTAL 95.77 0.00% 95.77 132.23 132.23 0.00 65.48 0.00 0.00 0.00 65.48 0.00 0.00 0.00 0.00 4.95 4.95
INTERSTATE TRADERS (SHORTTERM) 0 0.00% 0.00 0.00 1571.97 0.00 528.18 0.00 0.00 0.00 528.18 0.00 0.00 0.00 0.00 3.36 3.36
Spectrum Power 208 0.00% 0.00 209.30 209.30 0.00 53.99 0.00 0.00 0.00 53.99 0.00 0.00 0.00 0.00 2.58 2.58
LANCO Kondapalli 361.92 0.00% 0.00 350.87 350.87 0.00 88.36 0.00 0.00 0.00 88.36 0.00 0.00 0.00 0.00 2.52 2.52
SHORTTERM TOTAL 569.92 0.00% 0.00 560.17 2132.14 0.00 670.53 0.00 0.00 0.00 670.53 0.00 0.00 0.00 0.00 3.14 3.14
TOTAL 27331.29 0.00% 7611.36 22498.86 17859.66 2746.24 5222.21 0.00 0.00 0.00 7968.45 1.54 0.00 0.00 0.00 2.92 4.46
D<>D Transaction 0.00% 0.00 0.00 4721.59 0.00 2113.63 0.00 0.00 0.00 2113.63 0.00 0.00 0.00 0.00 4.48 4.48
Grand Total 27331.29 0.00% 7611.36 22498.86 22581.25 2746.24 7335.83 0.00 0.00 0.00 10082.08 1.22 0.00 0.00 0.00 3.25 4.46
Availability and
Dispatch (MU) Cost (Rs. Crs.)
Unit Cost
(Rs. / kWh)
124

Generating Station D Link
Plant Type
Must Run = 1
Others = 2
Plant CapacityDISCOM'
s share
DISCOM's
share
(MW) (%) (MW)Net
AvailabilityDispatch Fixed Variable Incentive Income Tax Others Total Fixed Incentives
Income
TaxOthers Variable Total
Cost (Rs. Crs.)Availability and
Dispatch (MU)
Unit Cost
(Rs. / kWh)
FY 2021-22
Generating Station D Link
Plant Type
Must Run = 1
Others = 2
Plant CapacityDISCOM'
s share
DISCOM's
share
(MW) (%) (MW)Net
AvailabilityDispatch Fixed Variable Incentive Income Tax Others Total Fixed IncentivesIncome TaxOthers Variable Total
Apgenco-Thermal
Dr. NTTPS 1260 36.22% 456.37 2927.25 2927.25 252.18 977.70 0.00 0.00 0.00 1229.88 0.86 0.00 0.00 0.00 3.34 4.20
Dr. NTTPS-IV 500 36.22% 181.10 1336.79 1336.79 103.12 421.09 0.00 0.00 0.00 524.21 0.77 0.00 0.00 0.00 3.15 3.92
RTPP Stage-I 420 36.22% 152.12 988.74 765.66 95.68 295.55 0.00 0.00 0.00 391.23 1.25 0.00 0.00 0.00 3.86 5.11
RTPP Stage-II 420 36.22% 152.12 1049.06 488.66 93.52 188.62 0.00 0.00 0.00 282.14 1.91 0.00 0.00 0.00 3.86 5.77
RTPP Stage-III 210 36.22% 76.06 485.24 133.76 61.28 51.63 0.00 0.00 0.00 112.91 4.58 0.00 0.00 0.00 3.86 8.44
RTPP Stage-IV 600 36.22% 217.32 1408.69 1318.94 385.95 482.73 0.00 0.00 0.00 868.68 2.93 0.00 0.00 0.00 3.66 6.59
Genco-Thermal Total 3410.00 36.22% 1235.10 8195.78 6971.07 991.73 2417.33 0.00 0.00 0.00 3409.05 1.42 0.00 0.00 0.00 3.47 4.89
Srisailam RCPH 770 36.22% 278.89 336.32 336.32 80.90 0.00 0.00 0.00 0.00 80.90 2.41 0.00 0.00 0.00 0.00 2.41
NSRCPH 90 36.22% 32.60 40.85 40.85 9.28 0.00 0.00 0.00 0.00 9.28 2.27 0.00 0.00 0.00 0.00 2.27
NSTPDC PH 50 36.22% 18.11 32.27 32.27 18.39 0.00 0.00 0.00 0.00 18.39 5.70 0.00 0.00 0.00 0.00 5.70
Upper Sileru 240 36.22% 86.93 169.39 169.39 28.49 0.00 0.00 0.00 0.00 28.49 1.68 0.00 0.00 0.00 0.00 1.68
Lower Sileru 460 36.22% 166.61 394.62 394.62 54.61 0.00 0.00 0.00 0.00 54.61 1.38 0.00 0.00 0.00 0.00 1.38
Donkarayi 25 36.22% 9.06 36.63 36.63 2.97 0.00 0.00 0.00 0.00 2.97 0.81 0.00 0.00 0.00 0.00 0.81
PABM 20 36.22% 7.24 2.00 2.00 4.81 0.00 0.00 0.00 0.00 4.81 24.00 0.00 0.00 0.00 0.00 24.00
Minihydel(Chettipet) 1 36.22% 0.36 0.95 0.95 0.64 0.00 0.00 0.00 0.00 0.64 6.71 0.00 0.00 0.00 0.00 6.71
Machkund AP share 84 36.22% 30.42 106.72 106.72 13.29 0.00 0.00 0.00 0.00 13.29 1.24 0.00 0.00 0.00 0.00 1.24
TB Dam AP Share 58 36.22% 20.86 43.88 43.88 9.11 0.00 0.00 0.00 0.00 9.11 2.08 0.00 0.00 0.00 0.00 2.08
Genco Hydel Total 1797.60 36.22% 651.09 1163.63 1163.63 222.48 0.00 0.00 0.00 0.00 222.48 1.91 0.00 0.00 0.00 0.00 1.91
APGENCO-TOTAL 5207.60 36.22% 1886.19 9359.41 8134.70 1214.21 2417.33 0.00 0.00 0.00 3631.54 1.49 0.00 0.00 0.00 2.97 4.46
APGPCL Stage-I 100 36.22% 5.80 0.00 0.00 0.00 0.00 0.00 0.00 0.00 0.00 0.00 0.00 0.00 0.00 0.00 0.00
APGPCL Stage-II 172 36.22% 0.00 0.00 0.00 0.00 0.00 0.00 0.00 0.00 0.00 0.00 0.00 0.00 0.00 0.00 0.00
APPDCL Stage-I 1600 36.22% 521.57 4035.27 4035.27 645.15 1267.08 0.00 0.00 0.00 1912.22 1.60 0.00 0.00 0.00 3.14 4.74
Godavari Gas Power Plant 216 36.22% 78.24 369.19 369.19 10.08 77.53 0.00 0.00 0.00 87.61 0.27 0.00 0.00 0.00 2.10 2.37
Joint Sector-TOTAL 2088.00 36.22% 605.60 4404.46 4404.46 655.23 1344.61 0.00 0.00 0.00 1999.83 1.49 0.00 0.00 0.00 3.05 4.54
NTPC(SR) Ramagundam I & II 2100 36.22% 150.15 660.55 660.55 48.99 169.23 0.00 0.00 0.00 218.22 0.74 0.00 0.00 0.00 2.56 3.30
NTPC(SR) Simhadri Stage-I 1000 36.22% 167.01 1301.85 1301.85 140.31 429.90 0.00 0.00 0.00 570.21 1.08 0.00 0.00 0.00 3.30 4.38
NTPC(SR) Simhadri Stage-II 1000 36.22% 93.70 524.74 524.74 77.69 170.25 0.00 0.00 0.00 247.94 1.48 0.00 0.00 0.00 3.24 4.73
NTPC(SR) Talcher Stage-II 2000 36.22% 81.71 467.21 467.21 33.41 97.28 0.00 0.00 0.00 130.69 0.72 0.00 0.00 0.00 2.08 2.80
NTPC(SR) Ramagundam III 500 36.22% 37.37 165.07 165.07 12.44 41.60 0.00 0.00 0.00 54.03 0.75 0.00 0.00 0.00 2.52 3.27
NTPC Kudgi Stage-I 2400 36.22% 139.33 544.24 544.24 82.42 199.15 0.00 0.00 0.00 281.57 1.51 0.00 0.00 0.00 3.66 5.17
NTECL Valluru 1500 36.22% 31.85 169.80 169.80 33.61 60.90 0.00 0.00 0.00 94.51 1.98 0.00 0.00 0.00 3.59 5.57
NLC Stage-I 630 36.22% 17.26 101.63 101.63 15.42 30.69 0.00 0.00 0.00 46.11 1.52 0.00 0.00 0.00 3.02 4.54
NLC Stage-II 840 36.22% 31.48 188.61 188.61 15.94 54.88 0.00 0.00 0.00 70.82 0.85 0.00 0.00 0.00 2.91 3.75
NPC(MAPS) 440 36.22% 6.66 18.77 18.77 0.00 5.15 0.00 0.00 0.00 5.15 0.00 0.00 0.00 0.00 2.74 2.74
NPC(KAIGA unit I,II,III,IV) 880 36.22% 42.10 295.49 295.49 0.00 107.82 0.00 0.00 0.00 107.82 0.00 0.00 0.00 0.00 3.65 3.65
NTPL(NLC TamilNadu) 1000 36.22% 44.63 316.93 316.93 51.06 96.47 0.00 0.00 0.00 147.53 1.61 0.00 0.00 0.00 3.04 4.66
NLC NNTPS 1000 36.22% 19.12 133.35 133.35 15.97 32.76 0.00 0.00 0.00 48.73 1.20 0.00 0.00 0.00 2.46 3.65
JNNSM Ph-1 Thermal*39MW clubbed into NTPC plants 36.22% 99.54 90.83
16.82 34.12 0.00 0.00 0.0050.95 1.85 0.00 0.00 0.00 3.76 5.61
JNNSM Ph-2 Thermal*500MW clubbed into NTPC plants 36.22% 1265.73 1265.73
184.93 372.92 0.00 0.00 0.00557.85 1.46 0.00 0.00 0.00 2.95 4.41
CGS TOTAL 15290 36.22% 862.38 6253.46 6244.75 729.01 1903.12 0.00 0.00 0.00 2632.14 1.17 0.00 0.00 0.00 3.05 4.21
KSK Mahanadi 1800 36.22% 0.00 0.00 0.00 0.00 0.00 0.00 0.00 0.00 0.00 0.00 0.00 0.00 0.00 0.00 0.00
Thermal Powertech Corporation 1240 36.22% 83.49 611.21 611.21 103.64 149.32 0.00 0.00 0.00 252.96 1.70 0.00 0.00 0.00 2.44 4.14
Hinduja National Powercorp 1040 36.22% 0.00 0.00 0.00 0.00 0.00 0.00 0.00 0.00 0.00 0.00 0.00 0.00 0.00 0.00 0.00
IPP TOTAL 4080.00 36.22% 83.49 611.21 611.21 103.64 149.32 0.00 0.00 0.00 252.96 1.70 0.00 0.00 0.00 2.44 4.14
NCE- Others 96.84 100.00% 96.84 132.09 132.09 0.00 67.89 0.00 0.00 0.00 67.89 0.00 0.00 0.00 0.00 5.14 5.14
NCE Wind 0.00 0.00 0.00 0.00 0.00 0.00 0.00 0.00 0.00 0.00 0.00 0.00 0.00 0.00 0.00 0.00
NCE Solar 12.43 100.00% 12.43 47.94 47.94 0.00 21.43 0.00 0.00 0.00 21.43 0.00 0.00 0.00 0.00 4.47 4.47
JNNSM Ph-1 Solar 0.00 0.00 0.00 0.00 0.00 0.00 0.00 0.00 0.00 0.00 0.00 0.00 0.00 0.00 0.00 0.00
JNNSM Ph-2 Solar 0.00 0.00 0.00 0.00 0.00 0.00 0.00 0.00 0.00 0.00 0.00 0.00 0.00 0.00 0.00 0.00
NCE TOTAL 109.27 109.27 180.03 180.03 0.00 89.32 0.00 0.00 0.00 89.32 0.00 0.00 0.00 0.00 4.96 4.96
INTERSTATE TRADERS (SHORTTERM) 0.00 36.22% 0.00 0.00 142.27 0.00 52.58 0.00 0.00 0.00 52.58 0.00 0.00 0.00 0.00 3.70 3.70
Spectrum Power 208.00 36.22% 0.00 0.00 0.00 0.00 0.00 0.00 0.00 0.00 0.00 0.00 0.00 0.00 0.00 0.00 0.00
LANCO Kondapalli 361.92 36.22% 0.00 0.00 0.00 0.00 0.00 0.00 0.00 0.00 0.00 0.00 0.00 0.00 0.00 0.00 0.00
SHORTTERM TOTAL 569.92 0.00 0.00 142.27 0.00 52.58 0.00 0.00 0.00 52.58 0.00 0.00 0.00 0.00 3.70 3.70
TOTAL 27344.79 3546.93 20808.57 19717.42 2702.09 5956.28 0.00 0.00 0.00 8658.37 1.37 0.00 0.00 0.00 3.02 4.39
D<>D Transaction0.00 5298.76
0.00 2341.07 0.00 0.00 0.002341.07 0.00 0.00 0.00 0.00 4.42 4.42
Grand Total 27344.79 3546.93 20808.57 25016.18 2702.09 8297.35 0.00 0.00 0.00 10999.44 1.08 0.00 0.00 0.00 3.32 4.40
Availability and
Dispatch (MU) Cost (Rs. Crs.)
Unit Cost
(Rs. / kWh)
125
Form 1.4a (FY 2019-20) Power Purchase and Procurement Cost (For Non-regulated Business#)
Generating Station D Link
Plant Type
Must Run = 1
Others = 2
Plant
Capacity
DISCOM's
share
DISCOM's
share
(MW) (%) (MW)Net
AvailabilityDispatch Fixed Variable Incentive Income Tax Others Total Fixed Incentives Income Tax Others Variable Total
AP GENCO Thermal
VTPS I
VTPS II 0.00 0.00 0.00 0.00 0.00 0.00 0.00
VTPS III 0.00 0.00 0.00 0.00 0.00 0.00 0.00
VTPS IV 0.00 0.00 0.00 0.00 0.00 0.00 0.00
RTPP I 0.00 0.00 0.00 0.00 0.00 0.00 0.00
RTPP Stage-II 0.00 0.00 0.00 0.00 0.00 0.00 0.00
RTPP Stage-III 0.00 0.00 0.00 0.00 0.00 0.00 0.00
Damodaram Sanjeevaiah Thermal power plant - I 0.00 0.00 0.00 0.00 0.00 0.00 0.00
Damodaram Sanjeevaiah Thermal power plant - II
RTPP IV
Interest on pension bonds (Over and above schedule)
GENCO RTPP Stage-IV Suppl FC for 2019-20
GENCO RTPP Stage-IV Suppl FC AND VC for 2018-19
less: APPDCL Differential FC and VC Claims from 2018-19
TOTAL THERMAL 0.00 0.00 0.00 0.00 0.00 0.00 0.00
AP GENCO Hydel 0.00 0.00 0.00 0.00 0.00 0.00 0.00
MACHKUND PH AP Share 0.00 0.00 0.00 0.00 0.00 0.00 0.00
TUNGBHADRA PH AP Share 0.00 0.00 0.00 0.00 0.00 0.00 0.00
Upper Sileru Power House (AP) 0.00 0.00 0.00 0.00 0.00 0.00 0.00
Lower Sileru Power House (AP) 0.00 0.00 0.00 0.00 0.00 0.00 0.00
DONKARAYI (AP) 0.00 0.00 0.00 0.00 0.00 0.00 0.00
Srisailam Right Bank Power House (AP) 0.00 0.00 0.00 0.00 0.00 0.00 0.00
Ramagiri Wind Mills (AP) 0.00 0.00 0.00 0.00 0.00 0.00 0.00
Nagarjunasagar Right Bank Power House (AP) 0.00 0.00 0.00 0.00 0.00 0.00
Penna Ahobilam (AP) 0.00 0.00 0.00 0.00 0.00 0.00
MINI HYDEL(Chettipeta)-AP 0.00 0.00 0.00 0.00 0.00 0.00
Nagarjunasagar Tail Pond Dam Power House 0.00 0.00 0.00 0.00 0.00 0.00 0.00
TOTAL HYDRO 0 0 0.00 0.00 0.00 0.00 0.00 0.00 0.00 0.00 0.00 0.00 0.00 0.00 0.00
TOTAL GENCO 0.00 0.00 0.00 0.00 0.00 0.00 0.00
0.00 0.00 0.00 0.00 0.00 0.00 0.00
Central Generating Stations 0.00 0.00 0.00 0.00 0.00 0.00 0.00
NTPC 0.00 0.00 0.00 0.00 0.00 0.00 0.00
NTPC (SR) 0.00 0.00 0.00 0.00 0.00 0.00 0.00
NTPC (SR)-Ramagundam Stage1&2 0.00 0.00 0.00 0.00 0.00 0.00 0.00
NTPC (SR)-Ramagundam Stage 3 0.00 0.00 0.00 0.00 0.00 0.00 0.00
Total NTPC(SR) 0.00 0.00 0.00 0.00 0.00 0.00 0.00
0.00 0.00 0.00 0.00 0.00 0.00 0.00
NTPC (ER) 0.00 0.00 0.00 0.00 0.00 0.00 0.00
Farakka 0.00 0.00 0.00 0.00 0.00 0.00 0.00
Kahalgaon 0.00 0.00 0.00 0.00 0.00 0.00 0.00
Talcher - Stage 1 0.00 0.00 0.00 0.00 0.00 0.00 0.00
Talcher Stage 2 0.00 0.00 0.00 0.00 0.00 0.00 0.00
Others 0.00 0.00 0.00 0.00 0.00 0.00 0.00
Total NTPC(ER) 0.00 0.00 0.00 0.00 0.00 0.00 0.00
NTPC (WR) 0.00 0.00 0.00 0.00 0.00 0.00 0.00
NTPC WR 0.00 0.00 0.00 0.00 0.00 0.00 0.00
Total NTPC(WR) 0.00 0.00 0.00 0.00 0.00 0.00
0.00 0.00 0.00 0.00 0.00 0.00
Cost (Rs. Crs.)Availability and Dispatch
(MU)
Unit Cost
(Rs. / kWh)
126

Generating Station D Link
Plant Type
Must Run = 1
Others = 2
Plant
Capacity
DISCOM's
share
DISCOM's
share
(MW) (%) (MW)Net
AvailabilityDispatch Fixed Variable Incentive Income Tax Others Total Fixed Incentives Income Tax Others Variable Total
Cost (Rs. Crs.)Availability and Dispatch
(MU)
Unit Cost
(Rs. / kWh)
Total NTPC 0.00 0.00 0.00 0.00 0.00 0.00
0.00 0.00 0.00 0.00 0.00 0.00
NLC TS-II 0.00 0.00 0.00 0.00 0.00 0.00
Stage-I 0.00 0.00 0.00 0.00 0.00 0.00
Stage-II 0.00 0.00 0.00 0.00 0.00 0.00
Total NLC 0.00 0.00 0.00 0.00 0.00 0.00
0.00 0.00 0.00 0.00 0.00 0.00
NPC 0 0 0.00 0.00 0.00 0.00 0.00 0.00 0.00 0.00 0.00 0.00 0.00 0.00 0.00
NPC-MAPS 0 0.00 0.00 0.00 0.00 0.00 0.00 0.00 0.00 0.00 0.00 0.00 0.00 0.00
NPC-Kaiga unit I&ii 0.00 0.00 0.00 0.00 0.00 0.00
NPC-Kaiga unit III&IV 0.00 0.00 0.00 0.00 0.00 0.00
Total NPC 0.00 0.00 0.00 0.00 0.00 0.00
0.00 0.00 0.00 0.00 0.00 0.00
NTPC - Simhadri 0.00 0.00 0.00 0.00 0.00 0.00 0.00
NTPC Simhadri Stage I 0.00 0.00 0.00 0.00 0.00 0.00 0.00
NTPC Simhadri Stage II 0 0.00 0.00 0.00 0.00 0.00 0.00 0.00 0.00 0.00 0.00 0.00 0.00 0.00
Total NTPC- Simhadri 0.00 0.00 0.00 0.00 0.00 0.00
0.00 0.00 0.00 0.00 0.00 0.00
CGS - New 0.00 0.00 0.00 0.00 0.00 0.00 0.00
Vallur Thermal Power Plant 0.00 0.00 0.00 0.00 0.00 0.00 0.00
Kudigi 0.00 0.00 0.00 0.00 0.00 0.00 0.00
NLC Tamilnadu Power Ltd Stage.1 0.00 0.00 0.00 0.00 0.00 0.00 0.00
NLC NNTPS 0.00 0.00 0.00 0.00 0.00 0.00 0.00
TOTAL CGS 0 0 0.00 0.00 0.00 0.00 0.00 0.00 0.00 0.00 0.00 0.00 0.00 0.00 0.00
0.00 0.00 0.00 0.00 0.00 0.00
APGPCL 0 0 0.00 0.00 0.00 0.00 0.00 0.00 0.00 0.00 0.00 0.00 0.00 0.00 0.00
APGPCL I - Allocated capacity 0.00 0.00 0.00 0.00 0.00 0.00
APGPCL II - Allocated capacity 0.00 0.00 0.00 0.00 0.00 0.00
Total APGPCL 0.00 0.00 0.00 0.00 0.00 0.00 0.00
0.00 0.00 0.00 0.00 0.00 0.00 0.00
IPPS 0 0 0.00 0.00 0.00 0.00 0.00 0.00 0.00 0.00 0.00 0.00 0.00 0.00 0.00
Godavari Gas Power Plant 0.00 0.00 0.00 0.00 0.00 0.00
Spectrum 0.00 0.00 0.00 0.00 0.00 0.00
Kondapalli (Gas) 0.00 0.00 0.00 0.00 0.00 0.00 0.00
BSES 0.00 0.00 0.00 0.00 0.00 0.00 0.00
GVK Extension 0.00 0.00 0.00 0.00 0.00 0.00 0.00
Vemagiri 0.00 0.00 0.00 0.00 0.00 0.00 0.00 0.00 0.00 0.00 0.00 0.00 0.00
Gautami 0.00 0.00 0.00 0.00 0.00 0.00
Konaseema 0.00 0.00 0.00 0.00 0.00 0.00
GMR Rajahmundry Energy ltd.(768 MW) 0.00 0.00 0.00 0.00 0.00 0.00 0.00
0.00 0.00 0.00 0.00 0.00 0.00
TOTAL IPPS 0.00 0.00 0.00 0.00 0.00 0.00
0.00 0.00 0.00 0.00 0.00 0.00
NCE
NCE - Bio Mass
NCE - Bagasse
NCE - Industrial Waste
NCE - Wind Power
NCE - Mini Hydel
NCE - SOLAR Power (Without Bundled)
NTPC NVVNL Bundled Power (Only SOLAR)
NTPC NVVNL Bundled Power (Only COAL)
NTPC NSM Phase-II, Bundled Power (SOLAR)
NTPC NSM Phase-II, Bundled Power (COAL)
NTPC NPKunta Ultra Mega Solar Project 250MW
NTPC NPKunta Ultra Mega Solar Project 250MW
NTPC Ramagundam Solar Power
TOTAL NCE
127

Generating Station D Link
Plant Type
Must Run = 1
Others = 2
Plant
Capacity
DISCOM's
share
DISCOM's
share
(MW) (%) (MW)Net
AvailabilityDispatch Fixed Variable Incentive Income Tax Others Total Fixed Incentives Income Tax Others Variable Total
Cost (Rs. Crs.)Availability and Dispatch
(MU)
Unit Cost
(Rs. / kWh)
IPPS-Others
Srivathsa (Exclusive EPDCL)
KSK Mahanadi (MT)
Hinduja
Thermal Power Tech
RVK Energy Pvt Ltd (IPP upto 30.9.15)
1000MW DBFO
TOTAL OTHERS
MARKET
Indian Energy Exchange Ltd (Short Term Purchases (Trading/IEX/PXIL)
Indian Energy Exchange Ltd-STOA chargess
Short Term Purchases (Only Swapping)
Mittal Processors Pvt.Ltd
(Swapping)-Trading MarginMittal Processors Pvt.Ltd
(Swapping)-STOA ChargesGMR Energy Trading
(SWAAPING)-Trading MarginGMR Energy Trading
(SWAAPING) -STOA chargesArunachal Pradesh Power Corporation (Swaping)-Trading Margin
Arunachal Pradesh Power Corporation (Swaping) STOA Charges
Manikaran Power Trading
(SWAAPING)-Trading MarginManikaran Power Trading
(SWAAPING) -STOA chargesNVVNL-STOA charges on Sale of Power
PTC India Ltd (STOA on sale of power)
PTC India Ltd (Swaping)-Trading Margin
PTC POC bills( Revision of MTOA Charges)
Sarda Metals
Power Exchange India-PXIL(Energy Charges)
Power Exchange India-PXIL(STOA Charges)
shri Girija 26MW trading
PTC India trading Ltd trading
Sembcorp Gayatri Power Limited(STOA Charges)
Sembcorp Gayatri Power Limited Trading Energy
Discom to Discom IBSS/FBSS settlements
NHPC LIMITED (Trading)
swapping Return
EPDCL IBSS Adjustment for 2019-20(Purchase from SPDCL)
POSOCO-Deviation Charges (CGS UI charges)
POSOCO Reactive charges
TOTAL MARKET 0.00 0.00 0.00 0.00 0.00 0.00 0.00
0.00 0.00 0.00 0.00 0.00 0.00
TOTAL (From All Sources) 0.00 0.00 0.00 0.00 0.00 0.00
Note: Hydro cost break up details need to be provided based on appropriate methodology. In case it is not possible to segregate the cost
station wise, provide the total details in the empty rows in the APGenco Hydro stations section saying ALL APGenco Hydro (Combined)
128
Generating Station D Link
Plant Type
Must Run = 1
Others = 2
Plant
Capacity
DISCOM's
share
DISCOM's
share
(MW) (%) (MW)Net
AvailabilityDispatch Fixed Variable Incentive Income Tax Others Total Fixed Incentives Income Tax Others Variable Total
Cost (Rs. Crs.)Availability and Dispatch
(MU)
Unit Cost
(Rs. / kWh)
FY 2020-21
Generating Station D Link
Plant Type
Must Run = 1
Others = 2
Plant
Capacity
DISCOM's
share
DISCOM's
share
(MW) (%) (MW) Net Availability Dispatch Fixed Variable Incentive Income Tax Others Total Fixed Incentives Income Tax Others Variable Total
Apgenco-Thermal
Dr. NTTPS 0.00 0.00 0.00 0.00 0.00 0.00 0.00
Dr. NTTPS-IV 0.00 0.00 0.00 0.00 0.00 0.00 0.00
RTPP Stage-I 0.00 0.00 0.00 0.00 0.00 0.00 0.00
RTPP Stage-II 0.00 0.00 0.00 0.00 0.00 0.00 0.00
RTPP Stage-III 0.00 0.00 0.00 0.00 0.00 0.00 0.00
RTPP Stage-IV 0.00 0.00 0.00 0.00 0.00 0.00 0.00
Genco-Thermal Total 0.00 0.00 0.00 0.00 0.00 0.00 0.00
Srisailam RCPH 0.00 0.00 0.00 0.00 0.00 0.00 0.00
NSRCPH 0.00 0.00 0.00 0.00 0.00 0.00 0.00
NSTPDC PH 0.00 0.00 0.00 0.00 0.00 0.00 0.00
Upper Sileru 0.00 0.00 0.00 0.00 0.00 0.00 0.00
Lower Sileru 0.00 0.00 0.00 0.00 0.00 0.00 0.00
Donkarayi 0 0 0 0 0 0 0
PABM 0.00 0.00 0.00 0.00 0.00 0.00 0.00
Minihydel(Chettipet) 0.00 0.00 0.00 0.00 0.00 0.00 0.00
Machkund AP Share 0.00 0.00 0.00 0.00 0.00 0.00 0.00
TB Dam AP Share 0.00 0.00 0.00 0.00 0.00 0.00 0.00
Genco Hydel Total 0.00 0.00 0.00 0.00 0.00 0.00 0.00
APGENCO-TOTAL 0.00 0.00 0.00 0.00 0.00 0.00 0.00
APGPCL Stage-I 0.00 0.00 0.00 0.00 0.00 0.00 0.00
APGPCL Stage-II 0.00 0.00 0.00 0.00 0.00 0.00 0.00
APPDCL Stage-I 0.00 0.00 0.00 0.00 0.00 0.00 0.00
Godavari Gas Power Plant 0.00 0.00 0.00 0.00 0.00 0.00 0.00
Joint Sector-TOTAL 0.00 0.00 0.00 0.00 0.00 0.00 0.00 0.00 0.00 0.00 0.00 0.00 0.00 0.00 0.00
NTPC(SR) Ramagundam I & II 0 0 0 0 0 0 0
NTPC(SR) Simhadri Stage-I 0 0 0 0 0 0 0
NTPC(SR) Simhadri Stage-II 0.00 0.00 0.00 0.00 0.00 0.00 0.00
NTPC(SR) Talcher Stage-II 0.00 0.00 0.00 0.00 0.00 0.00 0.00
NTPC(SR) Ramagundam III 0.00 0.00 0.00 0.00 0.00 0.00 0.00
NTPC Kudgi Stage-I 0.00 0.00 0.00 0.00 0.00 0.00 0.00
NTECL Valluru 0 0 0 0 0 0 0
NLC Stage-I 0.00 0.00 0.00 0.00 0.00 0.00 0.00
NLC Stage-II 0.00 0.00 0.00 0.00 0.00 0.00 0.00
NPC(MAPS) 0.00 0.00 0.00 0.00 0.00 0.00 0.00
NPC(KAIGA unit I,II,III,IV) 0 0 0 0 0 0 0
NTPL(NLC TamilNadu) 0.00 0.00 0.00 0.00 0.00 0.00 0.00
NLC NNTPS 0.00 0.00 0.00 0.00 0.00 0.00 0.00
JNNSM Ph-1 Thermal 0.00 0.00 0.00 0.00 0.00 0.00 0.00
JNNSM Ph-2 Thermal 0 0 0 0 0 0 0
CGS TOTAL 0.00 0.00 0.00 0.00 0.00 0.00 0.00
KSK Mahanadi 0.00 0.00 0.00 0.00 0.00 0.00 0.00
Thermal Powertech Corporation 0.00 0.00 0.00 0.00 0.00 0.00 0.00
Hinduja National Powercorp 0 0 0 0 0 0
Availability and Dispatch
(MU) Cost (Rs. Crs.)
Unit Cost
(Rs. / kWh)
129

Generating Station D Link
Plant Type
Must Run = 1
Others = 2
Plant
Capacity
DISCOM's
share
DISCOM's
share
(MW) (%) (MW)Net
AvailabilityDispatch Fixed Variable Incentive Income Tax Others Total Fixed Incentives Income Tax Others Variable Total
Cost (Rs. Crs.)Availability and Dispatch
(MU)
Unit Cost
(Rs. / kWh)
IPP TOTAL 0.00 0.00 0.00 0.00 0.00 0.00 0.00
NCE- Others 0.00 0.00 0.00 0.00 0.00 0.00 0.00
NCE Wind 0.00 0.00 0.00 0.00 0.00 0.00 0.00
NCE Solar 0.00 0.00 0.00 0.00 0.00 0.00 0.00
JNNSM Ph-1 Solar 0 0 0 0 0 0
JNNSM Ph-2 Solar 0.00 0.00 0.00 0.00 0.00 0.00 0.00
NCE TOTAL 0.00 0.00 0.00 0.00 0.00 0.00 0.00
INTERSTATE TRADERS (SHORTTERM) 0.00 0.00 0.00 0.00 0.00 0.00 0.00
Spectrum Power 0 0 0 0 0 0 0 0 0.00 0.00 0.00 0.00 0.00 0.00 0.00
LANCO Kondapalli 0 0 0 0 0 0 0 0 0.00 0.00 0.00 0.00 0.00 0.00 0.00
SHORTTERM TOTAL 0.00 0.00 0.00 0.00 0.00 0.00 0.00
TOTAL 0.00 0.00 0.00 0.00 0.00 0.00 0.00
D<>D Transaction 0 0 0 0 0 0
Grand Total 0.00 0.00 0.00 0.00 0.00 0.00
Note: Hydro cost break up details need to be provided based on appropriate methodology. In case it is not possible to segregate the cost
station wise, provide the total details in the empty rows in the APGenco Hydro stations section saying ALL APGenco Hydro (Combined)
130
Generating Station D Link
Plant Type
Must Run = 1
Others = 2
Plant
Capacity
DISCOM's
share
DISCOM's
share
(MW) (%) (MW)Net
AvailabilityDispatch Fixed Variable Incentive Income Tax Others Total Fixed Incentives Income Tax Others Variable Total
Cost (Rs. Crs.)Availability and Dispatch
(MU)
Unit Cost
(Rs. / kWh)
FY 2021-22
Generating Station D Link
Plant Type
Must Run = 1
Others = 2
Plant
Capacity
DISCOM's
share
DISCOM's
share
(MW) (%) (MW) Net Availability Dispatch Fixed Variable Incentive Income Tax Others Total Fixed Incentives Income Tax Others Variable Total
Apgenco-ThermalDr. NTTPS 0.00 0.00 0.00 0.00 0.00 0.00 0.00
Dr. NTTPS-IV 0.00 0.00 0.00 0.00 0.00 0.00 0.00
RTPP Stage-I 0.00 0.00 0.00 0.00 0.00 0.00 0.00
RTPP Stage-II 0.00 0.00 0.00 0.00 0.00 0.00 0.00
RTPP Stage-III 0.00 0.00 0.00 0.00 0.00 0.00 0.00
RTPP Stage-IV 0.00 0.00 0.00 0.00 0.00 0.00 0.00
Genco-Thermal Total 0.00 0.00 0.00 0.00 0.00 0.00 0.00Srisailam RCPH 0.00 0.00 0.00 0.00 0.00 0.00 0.00
NSRCPH 0.00 0.00 0.00 0.00 0.00 0.00 0.00
NSTPDC PH 0.00 0.00 0.00 0.00 0.00 0.00 0.00
Upper Sileru 0.00 0.00 0.00 0.00 0.00 0.00 0.00
Lower Sileru 0.00 0.00 0.00 0.00 0.00 0.00 0.00
Donkarayi 0 0.00 0.00 0.00 0.00 0.00 0.00
PABM 0.00 0.00 0.00 0.00 0.00 0.00 0.00
Minihydel(Chettipet) 0.00 0.00 0.00 0.00 0.00 0.00 0.00
Machkund AP share 0.00 0.00 0.00 0.00 0.00 0.00 0.00
TB Dam AP Share 0.00 0.00 0.00 0.00 0.00 0.00 0.00
Genco Hydel Total 0.00 0.00 0.00 0.00 0.00 0.00 0.00
APGENCO-TOTAL 0.00 0.00 0.00 0.00 0.00 0.00 0.00APGPCL Stage-I 0.00 0.00 0.00 0.00 0.00 0.00 0.00
APGPCL Stage-II 0.00 0.00 0.00 0.00 0.00 0.00 0.00
APPDCL Stage-I 0.00 0.00 0.00 0.00 0.00 0.00 0.00
Godavari Gas Power Plant 0.00 0.00 0.00 0.00 0.00 0.00 0.00
Joint Sector-TOTAL 0.00 0.00 0.00 0.00 0.00 0.00 0.00 0.00 0.00 0.00 0.00 0.00 0.00 0.00 0.00NTPC(SR) Ramagundam I & II 0 0.00 0.00 0.00 0.00 0.00 0.00
NTPC(SR) Simhadri Stage-I 0 0.00 0.00 0.00 0.00 0.00 0.00
NTPC(SR) Simhadri Stage-II 0.00 0.00 0.00 0.00 0.00 0.00 0.00
NTPC(SR) Talcher Stage-II 0.00 0.00 0.00 0.00 0.00 0.00 0.00
NTPC(SR) Ramagundam III 0.00 0.00 0.00 0.00 0.00 0.00 0.00
NTPC Kudgi Stage-I 0.00 0.00 0.00 0.00 0.00 0.00 0.00
NTECL Valluru 0 0.00 0.00 0.00 0.00 0.00 0.00
NLC Stage-I 0.00 0.00 0.00 0.00 0.00 0.00 0.00
NLC Stage-II 0.00 0.00 0.00 0.00 0.00 0.00 0.00
NPC(MAPS) 0.00 0.00 0.00 0.00 0.00 0.00 0.00
NPC(KAIGA unit I,II,III,IV) 0 0.00 0.00 0.00 0.00 0.00 0.00
NTPL(NLC TamilNadu) 0.00 0.00 0.00 0.00 0.00 0.00 0.00
NLC NNTPS 0.00 0.00 0.00 0.00 0.00 0.00 0.00
JNNSM Ph-1 Thermal 0.00 0.00 0.00 0.00 0.00 0.00 0.00
JNNSM Ph-2 Thermal 0 0.00 0.00 0.00 0.00 0.00 0.00
CGS TOTAL 0.00 0.00 0.00 0.00 0.00 0.00 0.00KSK Mahanadi 0.00 0.00 0.00 0.00 0.00 0.00 0.00
Thermal Powertech Corporation 0.00 0.00 0.00 0.00 0.00 0.00 0.00
Hinduja National Powercorp 0.00 0.00 0.00 0.00 0.00 0.00
IPP TOTAL 0.00 0.00 0.00 0.00 0.00 0.00 0.00NCE- Others 0.00 0.00 0.00 0.00 0.00 0.00 0.00
NCE Wind 0.00 0.00 0.00 0.00 0.00 0.00 0.00
NCE Solar 0.00 0.00 0.00 0.00 0.00 0.00 0.00
JNNSM Ph-1 Solar 0.00 0.00 0.00 0.00 0.00 0.00
JNNSM Ph-2 Solar 0.00 0.00 0.00 0.00 0.00 0.00 0.00
NCE TOTAL 0.00 0.00 0.00 0.00 0.00 0.00 0.00INTERSTATE TRADERS (SHORTTERM) 0.00 0.00 0.00 0.00 0.00 0.00 0.00
Spectrum Power 0 0 0 0 0 0 0 0 0.00 0.00 0.00 0.00 0.00 0.00 0.00
LANCO Kondapalli 0 0 0 0 0 0 0 0 0.00 0.00 0.00 0.00 0.00 0.00 0.00
SHORTTERM TOTAL 0.00 0.00 0.00 0.00 0.00 0.00 0.00
TOTAL 0.00 0.00 0.00 0.00 0.00 0.00 0.00
D<>D Transaction 0.00 0.00 0.00 0.00 0.00 0.00
Grand Total 0.00 0.00 0.00 0.00 0.00 0.00
Availability and Dispatch
(MU) Cost (Rs. Crs.)
Unit Cost
(Rs. / kWh)
Note: Hydro cost break up details need to be provided based on appropriate methodology. In case it is not possible to segregate the cost
station wise, provide the total details in the empty rows in the APGenco Hydro stations section saying ALL APGenco Hydro (Combined)
131
Form 1.4(ii) NCE Generation (Year 1)
Plant CapacityDISCOM's
share
DISCOM's
share
(MW) (%) (MW) Net Availability Dispatch Fixed Variable IncentiveIncome
TaxOthers Total Fixed Incentives
Income
TaxOthers Variable Total
Bio-Mass 0.00 0.00 0.00 0.00 0.00 0.00 0.00
Bio-Mass 0.00 0.00 0.00 0.00 0.00 0.00 0.00
Bio-Mass 0.00 0.00 0.00 0.00 0.00 0.00 0.00
Bio-Mass 0.00 0.00 0.00 0.00 0.00 0.00 0.00
TOTAL Bio-mass 0.00 0.00 0.00 0.00 0.00 0.00 0.00 0.00 0.00 0.00 0.00 0.00 0.00 0.00 0.00 0.00
Bagasse 0.00 0.00 0.00 0.00 0.00 0.00 0.00
Bagasse 0.00 0.00 0.00 0.00 0.00 0.00 0.00
TOTAL Bagasse 0.00 0.00 0.00 0.00 0.00 0.00 0.00 0.00 0.00 0.00 0.00 0.00 0.00 0.00 0.00 0.00
Municipal Waste to Energy 0.00 0.00 0.00 0.00 0.00 0.00 0.00
Municipal Waste to Energy 0.00 0.00 0.00 0.00 0.00 0.00 0.00
TOTAL Municipal Waste to Energy 0.00 0.00 0.00 0.00 0.00 0.00 0.00 0.00 0.00 0.00 0.00 0.00 0.00 0.00 0.00 0.00
Industrial Waste based power project 0.00 0.00 0.00 0.00 0.00 0.00 0.00
Industrial Waste based power project 0.00 0.00 0.00 0.00 0.00 0.00 0.00
TOTAL Industrial Waste 0.00 0.00 0.00 0.00 0.00 0.00 0.00 0.00 0.00 0.00 0.00 0.00 0.00 0.00 0.00 0.00
Wind Power 0.00 0.00 0.00 0.00 0.00 0.00 0.00
Wind Power 0.00 0.00 0.00 0.00 0.00 0.00 0.00
TOTAL Wind Power 0.00 0.00 0.00 0.00 0.00 0.00 0.00 0.00 0.00 0.00 0.00 0.00 0.00 0.00 0.00 0.00
Mini Hydel 0.00 0.00 0.00 0.00 0.00 0.00 0.00
Mini Hydel 0.00 0.00 0.00 0.00 0.00 0.00 0.00
TOTAL Mini Hydel 0.00 0.00 0.00 0.00 0.00 0.00 0.00 0.00 0.00 0.00 0.00 0.00 0.00 0.00 0.00 0.00
NCL Energy Ltd 0.00 0.00 0.00 0.00 0.00 0.00 0.00
NCL Energy Ltd 0.00 0.00 0.00 0.00 0.00 0.00 0.00
TOTAL- NCL Energy Ltd 0.00 0.00 0.00 0.00 0.00 0.00 0.00 0.00 0.00 0.00 0.00 0.00 0.00 0.00 0.00 0.00
NCE-Others 0.00 0.00 0.00 0.00 0.00 0.00 0.00
NCE-Others 0.00 0.00 0.00 0.00 0.00 0.00 0.00
TOTAL NCE - Others 0.00 0.00 0.00 0.00 0.00 0.00 0.00 0.00 0.00 0.00 0.00 0.00 0.00 0.00 0.00 0.00
Total NCE 0.00 0.00 0.00 0.00 0.00 0.00 0.00 0.00 0.00 0.00 0.00 0.00 0.00 0.00 0.00 0.00
Plant wise NCE Generation and Cost Details for Year1. The total should be consistent with values provided in Form 1.4 under NCE.
Cost (Rs. Crs.)Unit Cost
(Rs. / kWh)TYPE Name Location
Availability and Dispatch
(MU)
132
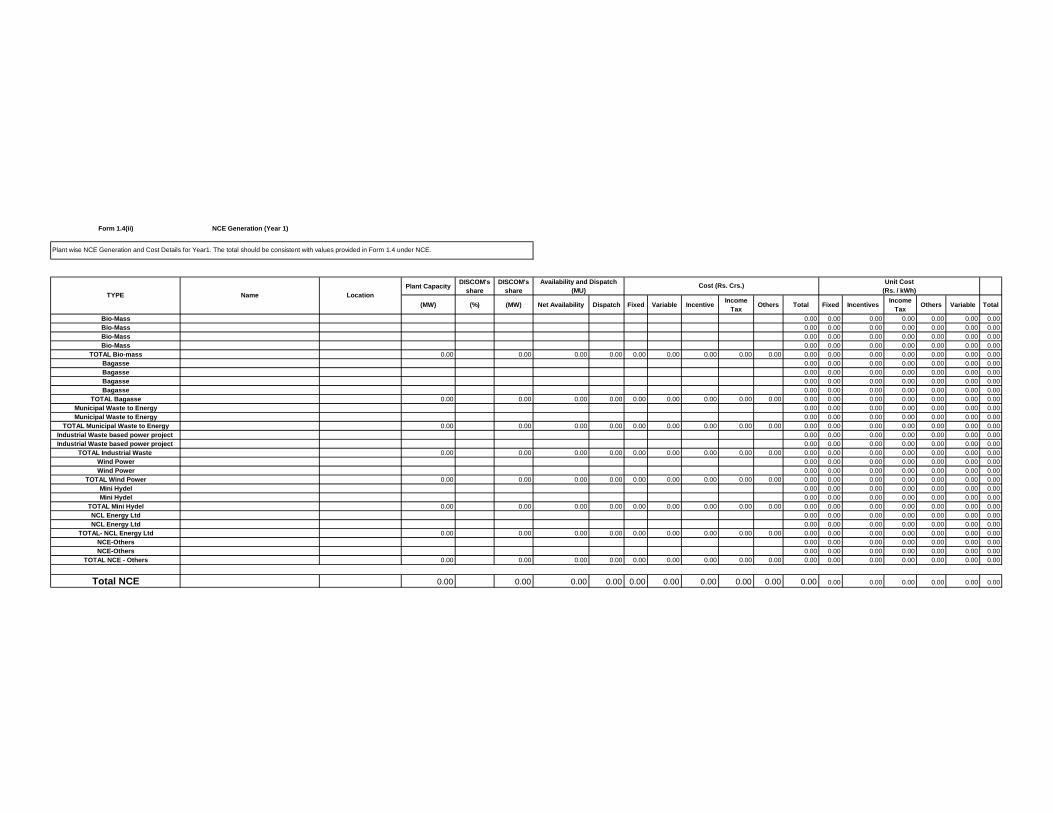
Form 1.4(ii) NCE Generation (Year 1)
Plant CapacityDISCOM's
share
DISCOM's
share
(MW) (%) (MW) Net Availability Dispatch Fixed Variable IncentiveIncome
TaxOthers Total Fixed Incentives
Income
TaxOthers Variable Total
Bio-Mass 0.00 0.00 0.00 0.00 0.00 0.00 0.00
Bio-Mass 0.00 0.00 0.00 0.00 0.00 0.00 0.00
Bio-Mass 0.00 0.00 0.00 0.00 0.00 0.00 0.00
Bio-Mass 0.00 0.00 0.00 0.00 0.00 0.00 0.00
TOTAL Bio-mass 0.00 0.00 0.00 0.00 0.00 0.00 0.00 0.00 0.00 0.00 0.00 0.00 0.00 0.00 0.00 0.00
Bagasse 0.00 0.00 0.00 0.00 0.00 0.00 0.00
Bagasse 0.00 0.00 0.00 0.00 0.00 0.00 0.00
Bagasse 0.00 0.00 0.00 0.00 0.00 0.00 0.00
Bagasse 0.00 0.00 0.00 0.00 0.00 0.00 0.00
TOTAL Bagasse 0.00 0.00 0.00 0.00 0.00 0.00 0.00 0.00 0.00 0.00 0.00 0.00 0.00 0.00 0.00 0.00
Municipal Waste to Energy 0.00 0.00 0.00 0.00 0.00 0.00 0.00
Municipal Waste to Energy 0.00 0.00 0.00 0.00 0.00 0.00 0.00
TOTAL Municipal Waste to Energy 0.00 0.00 0.00 0.00 0.00 0.00 0.00 0.00 0.00 0.00 0.00 0.00 0.00 0.00 0.00 0.00
Industrial Waste based power project 0.00 0.00 0.00 0.00 0.00 0.00 0.00
Industrial Waste based power project 0.00 0.00 0.00 0.00 0.00 0.00 0.00
TOTAL Industrial Waste 0.00 0.00 0.00 0.00 0.00 0.00 0.00 0.00 0.00 0.00 0.00 0.00 0.00 0.00 0.00 0.00
Wind Power 0.00 0.00 0.00 0.00 0.00 0.00 0.00
Wind Power 0.00 0.00 0.00 0.00 0.00 0.00 0.00
TOTAL Wind Power 0.00 0.00 0.00 0.00 0.00 0.00 0.00 0.00 0.00 0.00 0.00 0.00 0.00 0.00 0.00 0.00
Mini Hydel 0.00 0.00 0.00 0.00 0.00 0.00 0.00
Mini Hydel 0.00 0.00 0.00 0.00 0.00 0.00 0.00
TOTAL Mini Hydel 0.00 0.00 0.00 0.00 0.00 0.00 0.00 0.00 0.00 0.00 0.00 0.00 0.00 0.00 0.00 0.00
NCL Energy Ltd 0.00 0.00 0.00 0.00 0.00 0.00 0.00
NCL Energy Ltd 0.00 0.00 0.00 0.00 0.00 0.00 0.00
TOTAL- NCL Energy Ltd 0.00 0.00 0.00 0.00 0.00 0.00 0.00 0.00 0.00 0.00 0.00 0.00 0.00 0.00 0.00 0.00
NCE-Others 0.00 0.00 0.00 0.00 0.00 0.00 0.00
NCE-Others 0.00 0.00 0.00 0.00 0.00 0.00 0.00
TOTAL NCE - Others 0.00 0.00 0.00 0.00 0.00 0.00 0.00 0.00 0.00 0.00 0.00 0.00 0.00 0.00 0.00 0.00
Total NCE 0.00 0.00 0.00 0.00 0.00 0.00 0.00 0.00 0.00 0.00 0.00 0.00 0.00 0.00 0.00 0.00
Unit Cost
(Rs. / kWh)
Plant wise NCE Generation and Cost Details for Year1. The total should be consistent with values provided in Form 1.4 under NCE.
TYPE Name Location
Availability and Dispatch
(MU) Cost (Rs. Crs.)
133
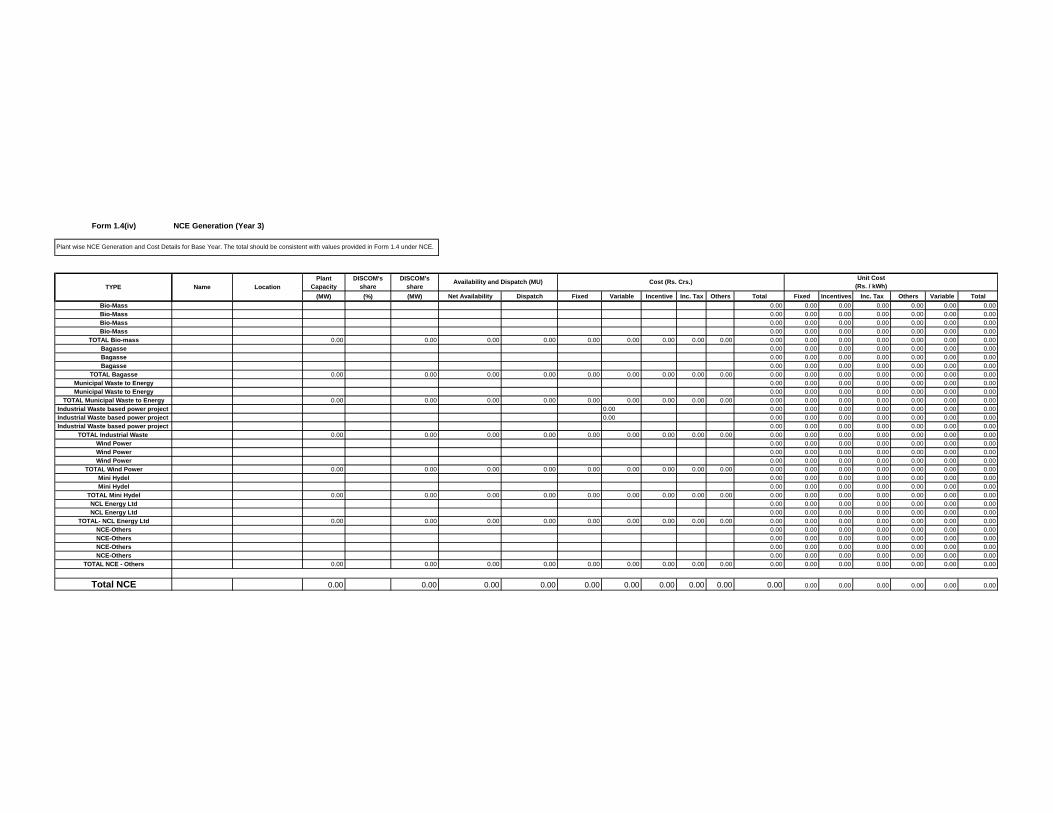
Form 1.4(iv) NCE Generation (Year 3)
Plant
Capacity
DISCOM's
share
DISCOM's
share
(MW) (%) (MW) Net Availability Dispatch Fixed Variable Incentive Inc. Tax Others Total Fixed Incentives Inc. Tax Others Variable Total
Bio-Mass 0.00 0.00 0.00 0.00 0.00 0.00 0.00
Bio-Mass 0.00 0.00 0.00 0.00 0.00 0.00 0.00
Bio-Mass 0.00 0.00 0.00 0.00 0.00 0.00 0.00
Bio-Mass 0.00 0.00 0.00 0.00 0.00 0.00 0.00
TOTAL Bio-mass 0.00 0.00 0.00 0.00 0.00 0.00 0.00 0.00 0.00 0.00 0.00 0.00 0.00 0.00 0.00 0.00
Bagasse 0.00 0.00 0.00 0.00 0.00 0.00 0.00
Bagasse 0.00 0.00 0.00 0.00 0.00 0.00 0.00
Bagasse 0.00 0.00 0.00 0.00 0.00 0.00 0.00
TOTAL Bagasse 0.00 0.00 0.00 0.00 0.00 0.00 0.00 0.00 0.00 0.00 0.00 0.00 0.00 0.00 0.00 0.00
Municipal Waste to Energy 0.00 0.00 0.00 0.00 0.00 0.00 0.00
Municipal Waste to Energy 0.00 0.00 0.00 0.00 0.00 0.00 0.00
TOTAL Municipal Waste to Energy 0.00 0.00 0.00 0.00 0.00 0.00 0.00 0.00 0.00 0.00 0.00 0.00 0.00 0.00 0.00 0.00
Industrial Waste based power project 0.00 0.00 0.00 0.00 0.00 0.00 0.00 0.00
Industrial Waste based power project 0.00 0.00 0.00 0.00 0.00 0.00 0.00 0.00
Industrial Waste based power project 0.00 0.00 0.00 0.00 0.00 0.00 0.00
TOTAL Industrial Waste 0.00 0.00 0.00 0.00 0.00 0.00 0.00 0.00 0.00 0.00 0.00 0.00 0.00 0.00 0.00 0.00
Wind Power 0.00 0.00 0.00 0.00 0.00 0.00 0.00
Wind Power 0.00 0.00 0.00 0.00 0.00 0.00 0.00
Wind Power 0.00 0.00 0.00 0.00 0.00 0.00 0.00
TOTAL Wind Power 0.00 0.00 0.00 0.00 0.00 0.00 0.00 0.00 0.00 0.00 0.00 0.00 0.00 0.00 0.00 0.00
Mini Hydel 0.00 0.00 0.00 0.00 0.00 0.00 0.00
Mini Hydel 0.00 0.00 0.00 0.00 0.00 0.00 0.00
TOTAL Mini Hydel 0.00 0.00 0.00 0.00 0.00 0.00 0.00 0.00 0.00 0.00 0.00 0.00 0.00 0.00 0.00 0.00
NCL Energy Ltd 0.00 0.00 0.00 0.00 0.00 0.00 0.00
NCL Energy Ltd 0.00 0.00 0.00 0.00 0.00 0.00 0.00
TOTAL- NCL Energy Ltd 0.00 0.00 0.00 0.00 0.00 0.00 0.00 0.00 0.00 0.00 0.00 0.00 0.00 0.00 0.00 0.00
NCE-Others 0.00 0.00 0.00 0.00 0.00 0.00 0.00
NCE-Others 0.00 0.00 0.00 0.00 0.00 0.00 0.00
NCE-Others 0.00 0.00 0.00 0.00 0.00 0.00 0.00
NCE-Others 0.00 0.00 0.00 0.00 0.00 0.00 0.00
TOTAL NCE - Others 0.00 0.00 0.00 0.00 0.00 0.00 0.00 0.00 0.00 0.00 0.00 0.00 0.00 0.00 0.00 0.00
Total NCE 0.00 0.00 0.00 0.00 0.00 0.00 0.00 0.00 0.00 0.00 0.00 0.00 0.00 0.00 0.00 0.00
Plant wise NCE Generation and Cost Details for Base Year. The total should be consistent with values provided in Form 1.4 under NCE.
Cost (Rs. Crs.)Unit Cost
(Rs. / kWh)TYPE Name LocationAvailability and Dispatch (MU)
134

Form 1.4b Sales to Licensees
Base Year
S. No. Discom Name Details link Quantity (MU) Cost (Rs Crores)
Rate at which
power is sold
(Rs/kWh)
Amt received
through sales
(Rs crores)
Remarks
1 State Discoms 0.00 0.00 0.00 0.00
A CPDCL
B EPDCL
C NPDCL
D SPDCL
2
Other State
licensees/Consumers 0.00 0.00 0.00 0.00
A Bi-lateral Sales( PTC etc.)
B UI Sales
C Pool Transaction ( Sales)
Total 0.00 0.00 0.00
FY 2019-20
S. No. Discom Name Details link Quantity (MU) Cost (Rs Crores)
Rate at which
power is sold
(Rs/kWh)
Amt received
through sales
(Rs crores)
Remarks
1 State Discoms 0.00 0.00 0.00 0.00
A CPDCL
B EPDCL
C NPDCL
D SPDCL
2
Other State
licensees/Consumers 0.00 0.00 0.00 0.00
A Bi-lateral Sales( PTC etc.)
B UI Sales
C Pool Transaction ( Sales)
D
E
Total 0.00 0.00 0.00
Refers to the sales to other licensees/consumers within or outside the state, out of the approved quantum of power for regulated business
135
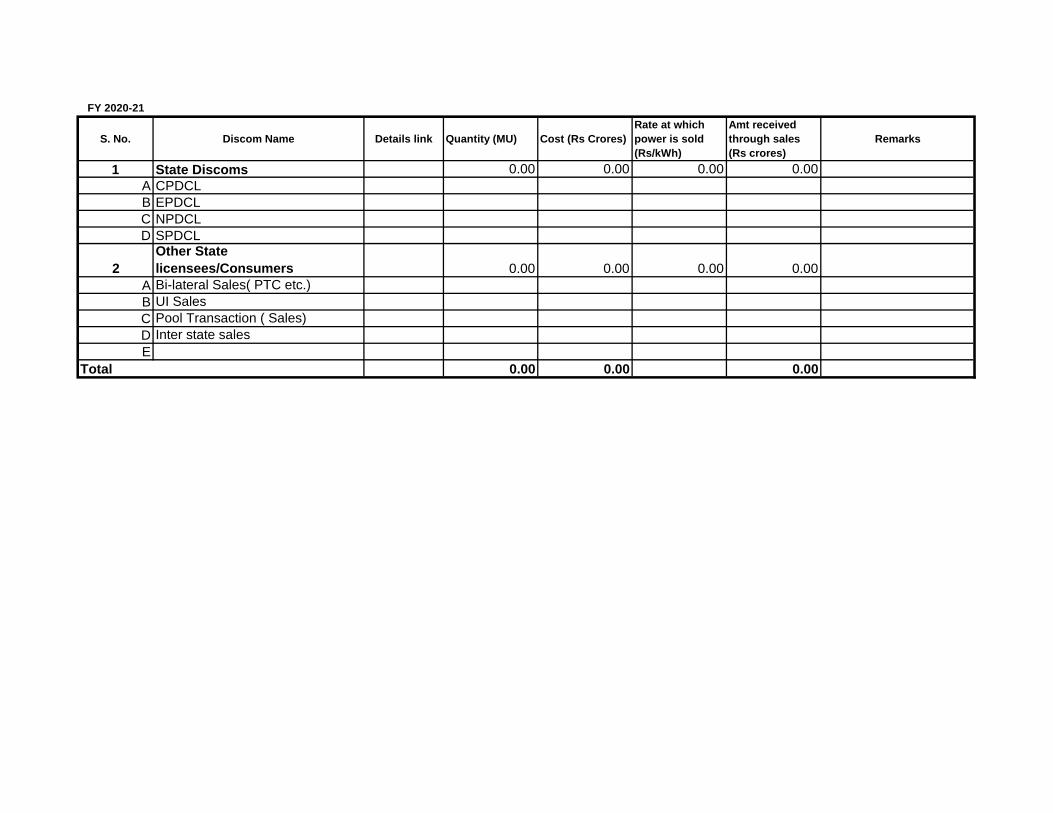
FY 2020-21
S. No. Discom Name Details link Quantity (MU) Cost (Rs Crores)
Rate at which
power is sold
(Rs/kWh)
Amt received
through sales
(Rs crores)
Remarks
1 State Discoms 0.00 0.00 0.00 0.00
A CPDCL
B EPDCL
C NPDCL
D SPDCL
2
Other State
licensees/Consumers 0.00 0.00 0.00 0.00
A Bi-lateral Sales( PTC etc.)
B UI Sales
C Pool Transaction ( Sales)
D Inter state sales
E
Total 0.00 0.00 0.00
136

FY 2021-22
S. No. Discom Name Details link Quantity (MU) Cost (Rs Crores)
Rate at which
power is sold
(Rs/kWh)
Amt received
through sales
(Rs crores)
Remarks
1 State Discoms 0.00 0.00 0.00 0.00
A CPDCL
B EPDCL
C NPDCL
D SPDCL
2 Other State licensees/Consumers 0.00 0.00 0.00 0.00
A Bi-lateral Sales( PTC etc.)
B UI Sales
C Pool Transaction ( Sales)
D Inter state sales
E
Total 0.00 0.00 0.00
137
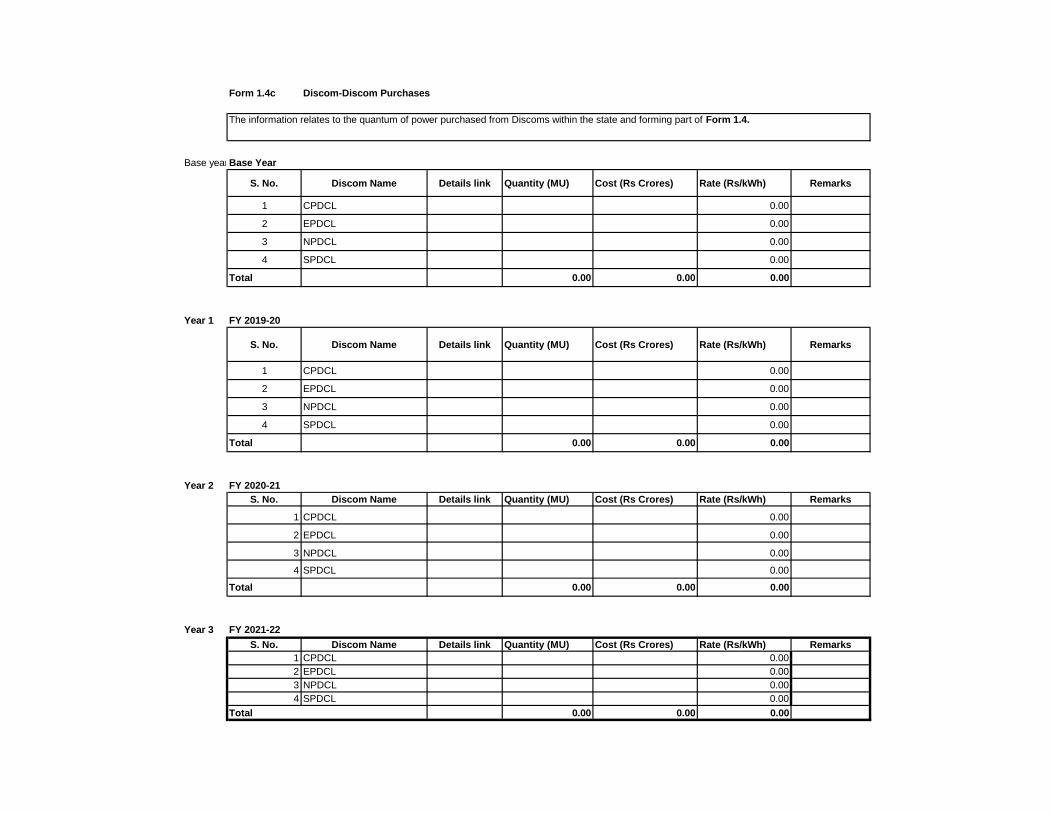
Form 1.4c Discom-Discom Purchases
The information relates to the quantum of power purchased from Discoms within the state and forming part of Form 1.4.
Base yearBase Year
S. No. Discom Name Details link Quantity (MU) Cost (Rs Crores) Rate (Rs/kWh) Remarks
1 CPDCL 0.00
2 EPDCL 0.00
3 NPDCL 0.00
4 SPDCL 0.00
Total 0.00 0.00 0.00
Year 1 FY 2019-20
S. No. Discom Name Details link Quantity (MU) Cost (Rs Crores) Rate (Rs/kWh) Remarks
1 CPDCL 0.00
2 EPDCL 0.00
3 NPDCL 0.00
4 SPDCL 0.00
Total 0.00 0.00 0.00
Year 2 FY 2020-21
S. No. Discom Name Details link Quantity (MU) Cost (Rs Crores) Rate (Rs/kWh) Remarks
1 CPDCL 0.00
2 EPDCL 0.00
3 NPDCL 0.00
4 SPDCL 0.00
Total 0.00 0.00 0.00
Year 3 FY 2021-22
S. No. Discom Name Details link Quantity (MU) Cost (Rs Crores) Rate (Rs/kWh) Remarks
1 CPDCL 0.00
2 EPDCL 0.00
3 NPDCL 0.00
4 SPDCL 0.00
Total 0.00 0.00 0.00
138

Form 1.5
Base Year FY 2019-20 FY 2020-21 FY 2021-22
A Opening Balance 1472.58 1682.56 1902.74 2169.16
B Additions during the Year 281.35 287.95 348.41 383.25
C Deductions during the Year 71.37 67.77 81.99 90.19
D Closing Balance 1682.56 1902.74 2169.16 2462.22
E Average Balance ((A+D)/2) 1577.57 1792.65 2035.95 2315.69
F Interest @ % p.a. # 6.24 5.32 6.25 6.25
G Interest Cost (E*F) 98.49 95.39 127.25 144.73
Note:
Details of Actuals incurred (based on audited Annual Acounts)
I Interest @ % p.a. # 6.24 5.32 6.25 6.25
J Interest Cost (E*F) 98.49 95.39 127.25 144.73
Interest Rate to be entered as a number, e.g. interest rate of 4.56% should be typed as "4.56" in the
cells.
Interest on Consumer Security Deposits
Revenue Requirement Item (Rs. Crs.) Details link
139

Form 1.6 Supply Margin
Amount (In Rs crores)
Base Year FY 2019-20 FY 2020-21 FY 2021-22
A Supply Margin Amount 0.00 0.00 14.87 20.87
Particulars Details link
140

Form 1.7
Amount (In Rs crores)
Base Year FY 2019-20 FY 2020-21 FY 2021-22 FY 2022-23 FY 2023-24
1 Payment AGL Solar pumpsets 92.81 73.183 22.063 22.000
2 Energy Efficient Pump Sets 53.13 23.080 31.900 31.300
3 DELP 29.34 1.580 11.790 0.000
4Difference of Transmission cost as per G.O Ms No. 13,
dt:06.04.2020 38.741
5 Expenses for Safety Measures 6.72 10.00
6
Grants to APSEEDCO for promotion of Energy
Conservation and Efficiency(Proposal from Principal
Secretary,Energy,Govt.of AP in letter dated 29.12.2018)
as per para No.162,Pg.No.123 of TO No.2020-21
1.00 1.00
7 Other expenses 158.12 534.63
Total 333.40 639.19 66.75 103.04 0.00 0.00
Other Costs
Details
linkS.No. Particulars
141

Form 2
Voltage wise Cost of Service
Total Cost
Allocation
(Rs.Crs)
Sales (MU) CoS (Rs/unit)
Low Tension
FOR LT LEVEL 9114.50 12733.86 7.16
High Tension
FOR 11KV LEVEL 1765.17
2568.07 6.87
FOR 33KV LEVEL 1309.26
1965.73 6.66
FOR 132KV LEVEL AND ABOVE 3450.91
5328.80 6.48
LT+HT Total 15639.84 22596.46 6.92
Consumer Categories
2021-22
142
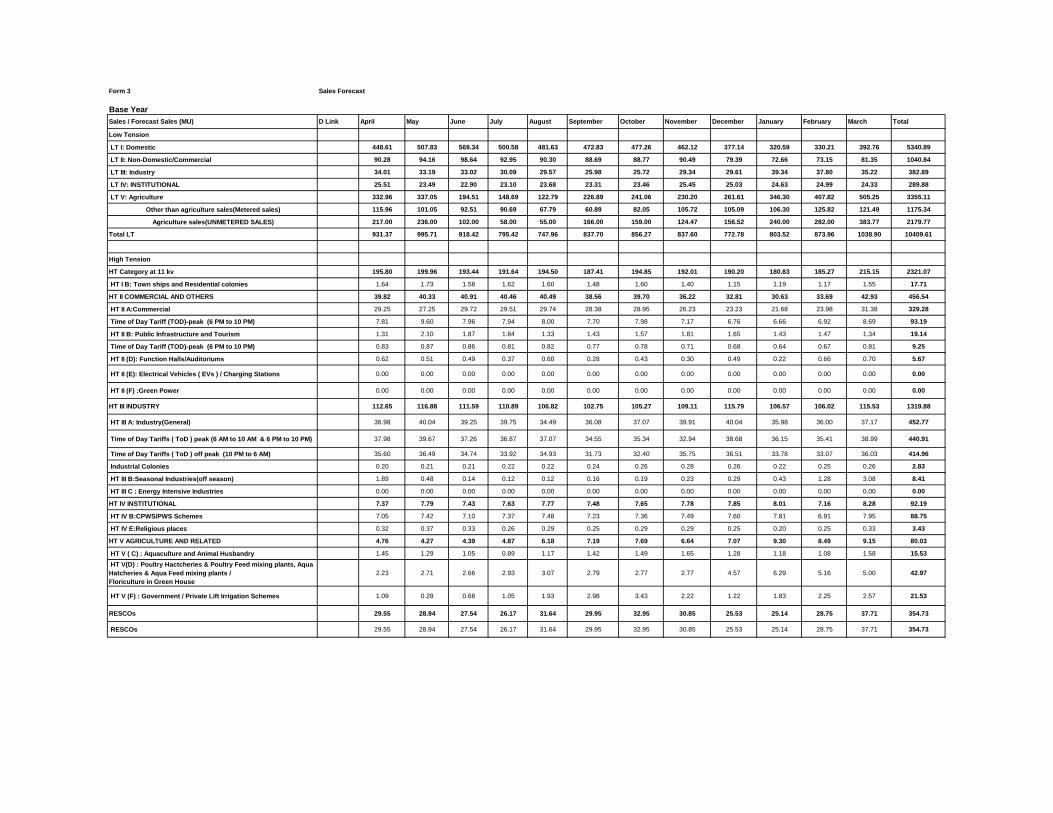
Form 3 Sales Forecast
Base Year
Sales / Forecast Sales (MU) D Link April May June July August September October November December January February March Total
Low Tension
LT I: Domestic 448.61 507.83 569.34 500.58 481.63 472.83 477.26 462.12 377.14 320.59 330.21 392.76 5340.89
LT II: Non-Domestic/Commercial 90.28 94.16 98.64 92.95 90.30 88.69 88.77 90.49 79.39 72.66 73.15 81.35 1040.84
LT III: Industry 34.01 33.19 33.02 30.09 29.57 25.98 25.72 29.34 29.61 39.34 37.80 35.22 382.89
LT IV: INSTITUTIONAL 25.51 23.49 22.90 23.10 23.68 23.31 23.46 25.45 25.03 24.63 24.99 24.33 289.88
LT V: Agriculture 332.96 337.05 194.51 148.69 122.79 226.89 241.06 230.20 261.61 346.30 407.82 505.25 3355.11
Other than agriculture sales(Metered sales) 115.96 101.05 92.51 90.69 67.79 60.89 82.05 105.72 105.09 106.30 125.82 121.49 1175.34
Agriculture sales(UNMETERED SALES) 217.00 236.00 102.00 58.00 55.00 166.00 159.00 124.47 156.52 240.00 282.00 383.77 2179.77
Total LT 931.37 995.71 918.42 795.42 747.96 837.70 856.27 837.60 772.78 803.52 873.96 1038.90 10409.61
High Tension
HT Category at 11 kv 195.80 199.96 193.44 191.64 194.50 187.41 194.85 192.01 190.20 180.83 185.27 215.15 2321.07
HT I B: Town ships and Residential colonies 1.64 1.73 1.58 1.62 1.60 1.48 1.60 1.40 1.15 1.19 1.17 1.55 17.71
HT II COMMERCIAL AND OTHERS 39.82 40.33 40.91 40.46 40.49 38.56 39.70 36.22 32.81 30.63 33.69 42.93 456.54
HT II A:Commercial 29.25 27.25 29.72 29.51 29.74 28.38 28.95 26.23 23.23 21.68 23.98 31.38 329.28
Time of Day Tariff (TOD)-peak (6 PM to 10 PM) 7.81 9.60 7.96 7.94 8.00 7.70 7.98 7.17 6.76 6.66 6.92 8.69 93.19
HT II B: Public Infrastructure and Tourism 1.31 2.10 1.87 1.84 1.33 1.43 1.57 1.81 1.65 1.43 1.47 1.34 19.14
Time of Day Tariff (TOD)-peak (6 PM to 10 PM) 0.83 0.87 0.86 0.81 0.82 0.77 0.78 0.71 0.68 0.64 0.67 0.81 9.25
HT II (D): Function Halls/Auditoriums 0.62 0.51 0.49 0.37 0.60 0.28 0.43 0.30 0.49 0.22 0.66 0.70 5.67
HT II (E): Electrical Vehicles ( EVs ) / Charging Stations 0.00 0.00 0.00 0.00 0.00 0.00 0.00 0.00 0.00 0.00 0.00 0.00 0.00
HT II (F) :Green Power 0.00 0.00 0.00 0.00 0.00 0.00 0.00 0.00 0.00 0.00 0.00 0.00 0.00
HT III INDUSTRY 112.65 116.88 111.59 110.89 106.82 102.75 105.27 109.11 115.79 106.57 106.02 115.53 1319.88
HT III A: Industry(General) 36.98 40.04 39.25 39.75 34.49 36.08 37.07 39.91 40.04 35.98 36.00 37.17 452.77
Time of Day Tariffs ( ToD ) peak (6 AM to 10 AM & 6 PM to 10 PM) 37.98 39.67 37.26 36.87 37.07 34.55 35.34 32.94 38.68 36.15 35.41 38.99 440.91
Time of Day Tariffs ( ToD ) off peak (10 PM to 6 AM) 35.60 36.49 34.74 33.92 34.93 31.73 32.40 35.75 36.51 33.78 33.07 36.03 414.96
Industrial Colonies 0.20 0.21 0.21 0.22 0.22 0.24 0.26 0.28 0.26 0.22 0.25 0.26 2.83
HT III B:Seasonal Industries(off season) 1.89 0.48 0.14 0.12 0.12 0.16 0.19 0.23 0.29 0.43 1.28 3.08 8.41
HT III C : Energy Intensive Industries 0.00 0.00 0.00 0.00 0.00 0.00 0.00 0.00 0.00 0.00 0.00 0.00 0.00
HT IV INSTITUTIONAL 7.37 7.79 7.43 7.63 7.77 7.48 7.65 7.78 7.85 8.01 7.16 8.28 92.19
HT IV B:CPWS/PWS Schemes 7.05 7.42 7.10 7.37 7.48 7.23 7.36 7.49 7.60 7.81 6.91 7.95 88.75
HT IV E:Religious places 0.32 0.37 0.33 0.26 0.29 0.25 0.29 0.29 0.25 0.20 0.25 0.33 3.43
HT V AGRICULTURE AND RELATED 4.76 4.27 4.39 4.87 6.18 7.19 7.69 6.64 7.07 9.30 8.49 9.15 80.03
HT V ( C) : Aquaculture and Animal Husbandry 1.45 1.29 1.05 0.89 1.17 1.42 1.49 1.65 1.28 1.18 1.08 1.58 15.53
HT V(D) : Poultry Hactcheries & Poultry Feed mixing plants, Aqua
Hatcheries & Aqua Feed mixing plants /
Floriculture in Green House
2.23 2.71 2.66 2.93 3.07 2.79 2.77 2.77 4.57 6.29 5.16 5.00 42.97
HT V (F) : Government / Private Lift Irrigation Schemes 1.09 0.28 0.68 1.05 1.93 2.98 3.43 2.22 1.22 1.83 2.25 2.57 21.53
RESCOs 29.55 28.94 27.54 26.17 31.64 29.95 32.95 30.85 25.53 25.14 28.75 37.71 354.73
RESCOs 29.55 28.94 27.54 26.17 31.64 29.95 32.95 30.85 25.53 25.14 28.75 37.71 354.73
143
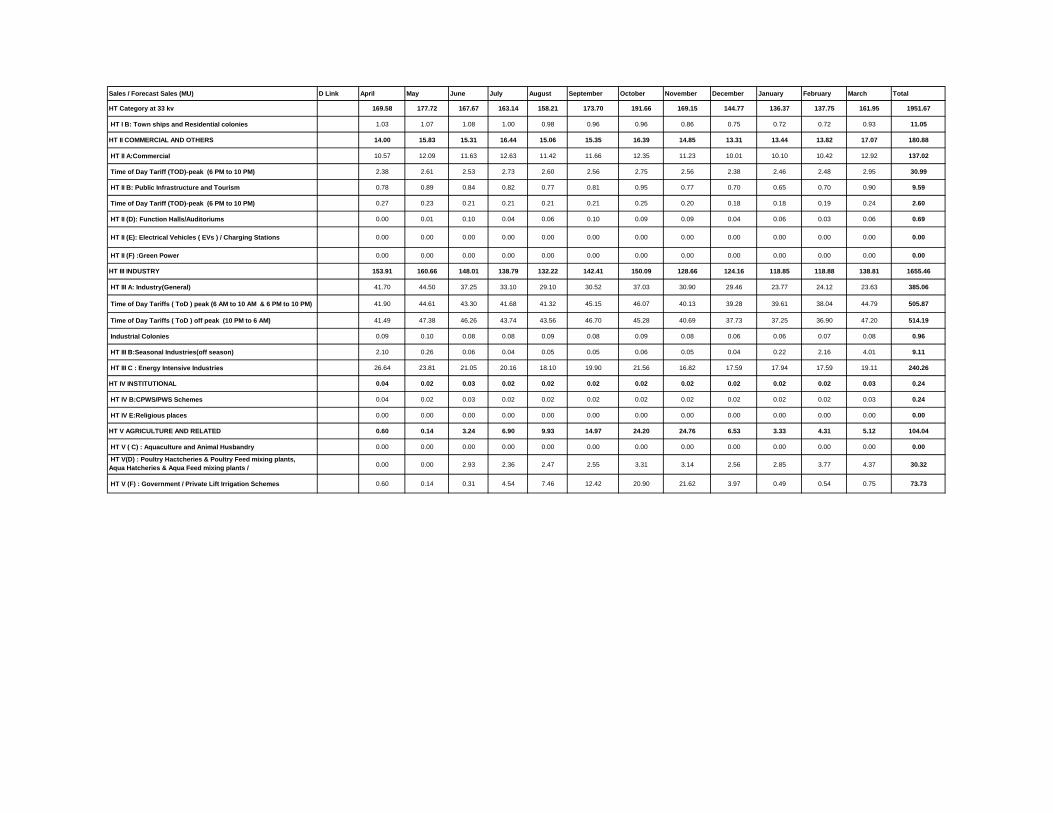
Sales / Forecast Sales (MU) D Link April May June July August September October November December January February March Total
HT Category at 33 kv 169.58 177.72 167.67 163.14 158.21 173.70 191.66 169.15 144.77 136.37 137.75 161.95 1951.67
HT I B: Town ships and Residential colonies 1.03 1.07 1.08 1.00 0.98 0.96 0.96 0.86 0.75 0.72 0.72 0.93 11.05
HT II COMMERCIAL AND OTHERS 14.00 15.83 15.31 16.44 15.06 15.35 16.39 14.85 13.31 13.44 13.82 17.07 180.88
HT II A:Commercial 10.57 12.09 11.63 12.63 11.42 11.66 12.35 11.23 10.01 10.10 10.42 12.92 137.02
Time of Day Tariff (TOD)-peak (6 PM to 10 PM) 2.38 2.61 2.53 2.73 2.60 2.56 2.75 2.56 2.38 2.46 2.48 2.95 30.99
HT II B: Public Infrastructure and Tourism 0.78 0.89 0.84 0.82 0.77 0.81 0.95 0.77 0.70 0.65 0.70 0.90 9.59
Time of Day Tariff (TOD)-peak (6 PM to 10 PM) 0.27 0.23 0.21 0.21 0.21 0.21 0.25 0.20 0.18 0.18 0.19 0.24 2.60
HT II (D): Function Halls/Auditoriums 0.00 0.01 0.10 0.04 0.06 0.10 0.09 0.09 0.04 0.06 0.03 0.06 0.69
HT II (E): Electrical Vehicles ( EVs ) / Charging Stations 0.00 0.00 0.00 0.00 0.00 0.00 0.00 0.00 0.00 0.00 0.00 0.00 0.00
HT II (F) :Green Power 0.00 0.00 0.00 0.00 0.00 0.00 0.00 0.00 0.00 0.00 0.00 0.00 0.00
HT III INDUSTRY 153.91 160.66 148.01 138.79 132.22 142.41 150.09 128.66 124.16 118.85 118.88 138.81 1655.46
HT III A: Industry(General) 41.70 44.50 37.25 33.10 29.10 30.52 37.03 30.90 29.46 23.77 24.12 23.63 385.06
Time of Day Tariffs ( ToD ) peak (6 AM to 10 AM & 6 PM to 10 PM) 41.90 44.61 43.30 41.68 41.32 45.15 46.07 40.13 39.28 39.61 38.04 44.79 505.87
Time of Day Tariffs ( ToD ) off peak (10 PM to 6 AM) 41.49 47.38 46.26 43.74 43.56 46.70 45.28 40.69 37.73 37.25 36.90 47.20 514.19
Industrial Colonies 0.09 0.10 0.08 0.08 0.09 0.08 0.09 0.08 0.06 0.06 0.07 0.08 0.96
HT III B:Seasonal Industries(off season) 2.10 0.26 0.06 0.04 0.05 0.05 0.06 0.05 0.04 0.22 2.16 4.01 9.11
HT III C : Energy Intensive Industries 26.64 23.81 21.05 20.16 18.10 19.90 21.56 16.82 17.59 17.94 17.59 19.11 240.26
HT IV INSTITUTIONAL 0.04 0.02 0.03 0.02 0.02 0.02 0.02 0.02 0.02 0.02 0.02 0.03 0.24
HT IV B:CPWS/PWS Schemes 0.04 0.02 0.03 0.02 0.02 0.02 0.02 0.02 0.02 0.02 0.02 0.03 0.24
HT IV E:Religious places 0.00 0.00 0.00 0.00 0.00 0.00 0.00 0.00 0.00 0.00 0.00 0.00 0.00
HT V AGRICULTURE AND RELATED 0.60 0.14 3.24 6.90 9.93 14.97 24.20 24.76 6.53 3.33 4.31 5.12 104.04
HT V ( C) : Aquaculture and Animal Husbandry 0.00 0.00 0.00 0.00 0.00 0.00 0.00 0.00 0.00 0.00 0.00 0.00 0.00
HT V(D) : Poultry Hactcheries & Poultry Feed mixing plants,
Aqua Hatcheries & Aqua Feed mixing plants /
Floriculture in Green House
0.00 0.00 2.93 2.36 2.47 2.55 3.31 3.14 2.56 2.85 3.77 4.37 30.32
HT V (F) : Government / Private Lift Irrigation Schemes 0.60 0.14 0.31 4.54 7.46 12.42 20.90 21.62 3.97 0.49 0.54 0.75 73.73
144
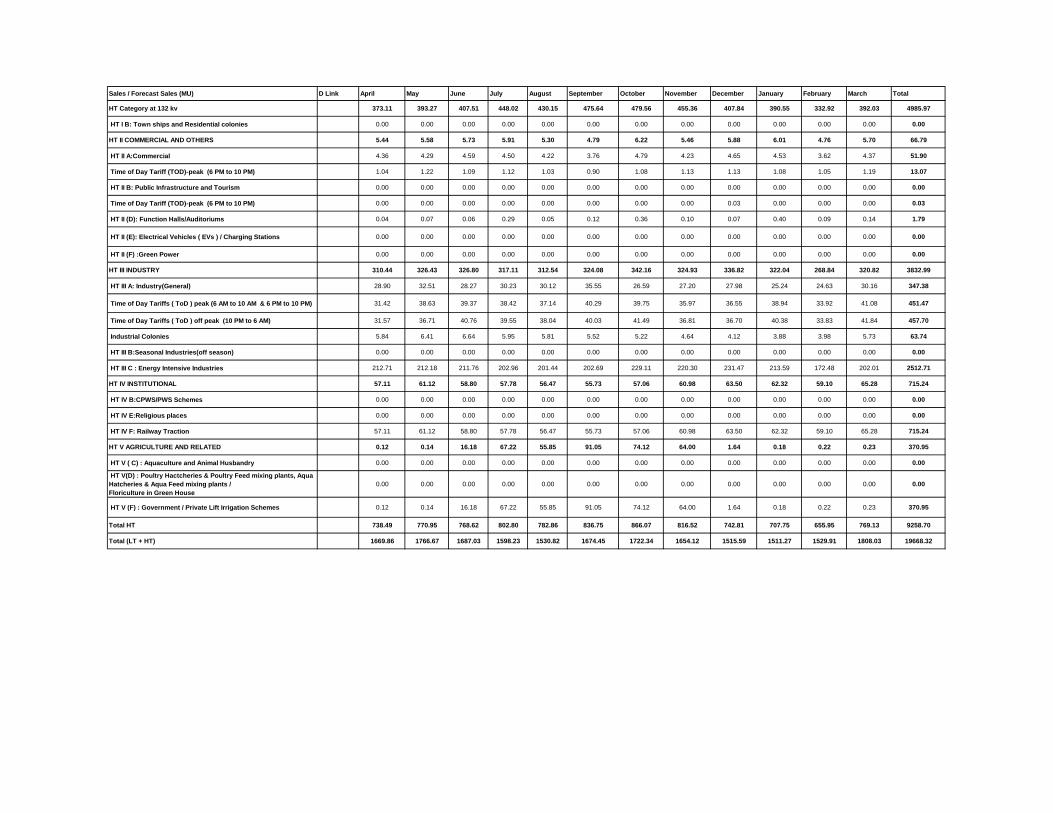
Sales / Forecast Sales (MU) D Link April May June July August September October November December January February March Total
HT Category at 132 kv 373.11 393.27 407.51 448.02 430.15 475.64 479.56 455.36 407.84 390.55 332.92 392.03 4985.97
HT I B: Town ships and Residential colonies 0.00 0.00 0.00 0.00 0.00 0.00 0.00 0.00 0.00 0.00 0.00 0.00 0.00
HT II COMMERCIAL AND OTHERS 5.44 5.58 5.73 5.91 5.30 4.79 6.22 5.46 5.88 6.01 4.76 5.70 66.79
HT II A:Commercial 4.36 4.29 4.59 4.50 4.22 3.76 4.79 4.23 4.65 4.53 3.62 4.37 51.90
Time of Day Tariff (TOD)-peak (6 PM to 10 PM) 1.04 1.22 1.09 1.12 1.03 0.90 1.08 1.13 1.13 1.08 1.05 1.19 13.07
HT II B: Public Infrastructure and Tourism 0.00 0.00 0.00 0.00 0.00 0.00 0.00 0.00 0.00 0.00 0.00 0.00 0.00
Time of Day Tariff (TOD)-peak (6 PM to 10 PM) 0.00 0.00 0.00 0.00 0.00 0.00 0.00 0.00 0.03 0.00 0.00 0.00 0.03
HT II (D): Function Halls/Auditoriums 0.04 0.07 0.06 0.29 0.05 0.12 0.36 0.10 0.07 0.40 0.09 0.14 1.79
HT II (E): Electrical Vehicles ( EVs ) / Charging Stations 0.00 0.00 0.00 0.00 0.00 0.00 0.00 0.00 0.00 0.00 0.00 0.00 0.00
HT II (F) :Green Power 0.00 0.00 0.00 0.00 0.00 0.00 0.00 0.00 0.00 0.00 0.00 0.00 0.00
HT III INDUSTRY 310.44 326.43 326.80 317.11 312.54 324.08 342.16 324.93 336.82 322.04 268.84 320.82 3832.99
HT III A: Industry(General) 28.90 32.51 28.27 30.23 30.12 35.55 26.59 27.20 27.98 25.24 24.63 30.16 347.38
Time of Day Tariffs ( ToD ) peak (6 AM to 10 AM & 6 PM to 10 PM) 31.42 38.63 39.37 38.42 37.14 40.29 39.75 35.97 36.55 38.94 33.92 41.08 451.47
Time of Day Tariffs ( ToD ) off peak (10 PM to 6 AM) 31.57 36.71 40.76 39.55 38.04 40.03 41.49 36.81 36.70 40.38 33.83 41.84 457.70
Industrial Colonies 5.84 6.41 6.64 5.95 5.81 5.52 5.22 4.64 4.12 3.88 3.98 5.73 63.74
HT III B:Seasonal Industries(off season) 0.00 0.00 0.00 0.00 0.00 0.00 0.00 0.00 0.00 0.00 0.00 0.00 0.00
HT III C : Energy Intensive Industries 212.71 212.18 211.76 202.96 201.44 202.69 229.11 220.30 231.47 213.59 172.48 202.01 2512.71
HT IV INSTITUTIONAL 57.11 61.12 58.80 57.78 56.47 55.73 57.06 60.98 63.50 62.32 59.10 65.28 715.24
HT IV B:CPWS/PWS Schemes 0.00 0.00 0.00 0.00 0.00 0.00 0.00 0.00 0.00 0.00 0.00 0.00 0.00
HT IV E:Religious places 0.00 0.00 0.00 0.00 0.00 0.00 0.00 0.00 0.00 0.00 0.00 0.00 0.00
HT IV F: Railway Traction 57.11 61.12 58.80 57.78 56.47 55.73 57.06 60.98 63.50 62.32 59.10 65.28 715.24
HT V AGRICULTURE AND RELATED 0.12 0.14 16.18 67.22 55.85 91.05 74.12 64.00 1.64 0.18 0.22 0.23 370.95
HT V ( C) : Aquaculture and Animal Husbandry 0.00 0.00 0.00 0.00 0.00 0.00 0.00 0.00 0.00 0.00 0.00 0.00 0.00
HT V(D) : Poultry Hactcheries & Poultry Feed mixing plants, Aqua
Hatcheries & Aqua Feed mixing plants /
Floriculture in Green House
0.00 0.00 0.00 0.00 0.00 0.00 0.00 0.00 0.00 0.00 0.00 0.00 0.00
HT V (F) : Government / Private Lift Irrigation Schemes 0.12 0.14 16.18 67.22 55.85 91.05 74.12 64.00 1.64 0.18 0.22 0.23 370.95
Total HT 738.49 770.95 768.62 802.80 782.86 836.75 866.07 816.52 742.81 707.75 655.95 769.13 9258.70
Total (LT + HT) 1669.86 1766.67 1687.03 1598.23 1530.82 1674.45 1722.34 1654.12 1515.59 1511.27 1529.91 1808.03 19668.32
145
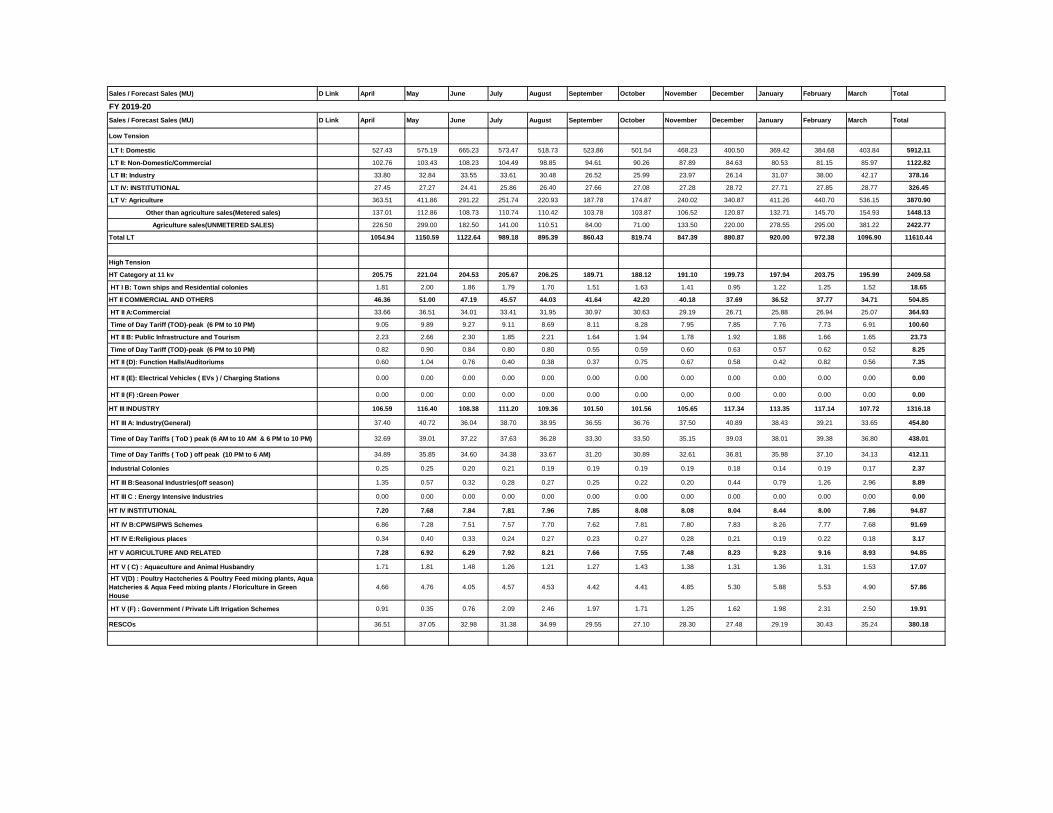
Sales / Forecast Sales (MU) D Link April May June July August September October November December January February March Total
FY 2019-20
Sales / Forecast Sales (MU) D Link April May June July August September October November December January February March Total
Low Tension
LT I: Domestic 527.43 575.19 665.23 573.47 518.73 523.86 501.54 468.23 400.50 369.42 384.68 403.84 5912.11
LT II: Non-Domestic/Commercial 102.76 103.43 108.23 104.49 98.85 94.61 90.26 87.89 84.63 80.53 81.15 85.97 1122.82
LT III: Industry 33.80 32.84 33.55 33.61 30.48 26.52 25.99 23.97 26.14 31.07 38.00 42.17 378.16
LT IV: INSTITUTIONAL 27.45 27.27 24.41 25.86 26.40 27.66 27.08 27.28 28.72 27.71 27.85 28.77 326.45
LT V: Agriculture 363.51 411.86 291.22 251.74 220.93 187.78 174.87 240.02 340.87 411.26 440.70 536.15 3870.90
Other than agriculture sales(Metered sales) 137.01 112.86 108.73 110.74 110.42 103.78 103.87 106.52 120.87 132.71 145.70 154.93 1448.13
Agriculture sales(UNMETERED SALES) 226.50 299.00 182.50 141.00 110.51 84.00 71.00 133.50 220.00 278.55 295.00 381.22 2422.77
Total LT 1054.94 1150.59 1122.64 989.18 895.39 860.43 819.74 847.39 880.87 920.00 972.38 1096.90 11610.44
High Tension
HT Category at 11 kv 205.75 221.04 204.53 205.67 206.25 189.71 188.12 191.10 199.73 197.94 203.75 195.99 2409.58
HT I B: Town ships and Residential colonies 1.81 2.00 1.86 1.79 1.70 1.51 1.63 1.41 0.95 1.22 1.25 1.52 18.65
HT II COMMERCIAL AND OTHERS 46.36 51.00 47.19 45.57 44.03 41.64 42.20 40.18 37.69 36.52 37.77 34.71 504.85
HT II A:Commercial 33.66 36.51 34.01 33.41 31.95 30.97 30.63 29.19 26.71 25.88 26.94 25.07 364.93
Time of Day Tariff (TOD)-peak (6 PM to 10 PM) 9.05 9.89 9.27 9.11 8.69 8.11 8.28 7.95 7.85 7.76 7.73 6.91 100.60
HT II B: Public Infrastructure and Tourism 2.23 2.66 2.30 1.85 2.21 1.64 1.94 1.78 1.92 1.88 1.66 1.65 23.73
Time of Day Tariff (TOD)-peak (6 PM to 10 PM) 0.82 0.90 0.84 0.80 0.80 0.55 0.59 0.60 0.63 0.57 0.62 0.52 8.25
HT II (D): Function Halls/Auditoriums 0.60 1.04 0.76 0.40 0.38 0.37 0.75 0.67 0.58 0.42 0.82 0.56 7.35
HT II (E): Electrical Vehicles ( EVs ) / Charging Stations 0.00 0.00 0.00 0.00 0.00 0.00 0.00 0.00 0.00 0.00 0.00 0.00 0.00
HT II (F) :Green Power 0.00 0.00 0.00 0.00 0.00 0.00 0.00 0.00 0.00 0.00 0.00 0.00 0.00
HT III INDUSTRY 106.59 116.40 108.38 111.20 109.36 101.50 101.56 105.65 117.34 113.35 117.14 107.72 1316.18
HT III A: Industry(General) 37.40 40.72 36.04 38.70 38.95 36.55 36.76 37.50 40.89 38.43 39.21 33.65 454.80
Time of Day Tariffs ( ToD ) peak (6 AM to 10 AM & 6 PM to 10 PM) 32.69 39.01 37.22 37.63 36.28 33.30 33.50 35.15 39.03 38.01 39.38 36.80 438.01
Time of Day Tariffs ( ToD ) off peak (10 PM to 6 AM) 34.89 35.85 34.60 34.38 33.67 31.20 30.89 32.61 36.81 35.98 37.10 34.13 412.11
Industrial Colonies 0.25 0.25 0.20 0.21 0.19 0.19 0.19 0.19 0.18 0.14 0.19 0.17 2.37
HT III B:Seasonal Industries(off season) 1.35 0.57 0.32 0.28 0.27 0.25 0.22 0.20 0.44 0.79 1.26 2.96 8.89
HT III C : Energy Intensive Industries 0.00 0.00 0.00 0.00 0.00 0.00 0.00 0.00 0.00 0.00 0.00 0.00 0.00
HT IV INSTITUTIONAL 7.20 7.68 7.84 7.81 7.96 7.85 8.08 8.08 8.04 8.44 8.00 7.86 94.87
HT IV B:CPWS/PWS Schemes 6.86 7.28 7.51 7.57 7.70 7.62 7.81 7.80 7.83 8.26 7.77 7.68 91.69
HT IV E:Religious places 0.34 0.40 0.33 0.24 0.27 0.23 0.27 0.28 0.21 0.19 0.22 0.18 3.17
HT V AGRICULTURE AND RELATED 7.28 6.92 6.29 7.92 8.21 7.66 7.55 7.48 8.23 9.23 9.16 8.93 94.85
HT V ( C) : Aquaculture and Animal Husbandry 1.71 1.81 1.48 1.26 1.21 1.27 1.43 1.38 1.31 1.36 1.31 1.53 17.07
HT V(D) : Poultry Hactcheries & Poultry Feed mixing plants, Aqua
Hatcheries & Aqua Feed mixing plants / Floriculture in Green
House
4.66 4.76 4.05 4.57 4.53 4.42 4.41 4.85 5.30 5.88 5.53 4.90 57.86
HT V (F) : Government / Private Lift Irrigation Schemes 0.91 0.35 0.76 2.09 2.46 1.97 1.71 1.25 1.62 1.98 2.31 2.50 19.91
RESCOs 36.51 37.05 32.98 31.38 34.99 29.55 27.10 28.30 27.48 29.19 30.43 35.24 380.18
146
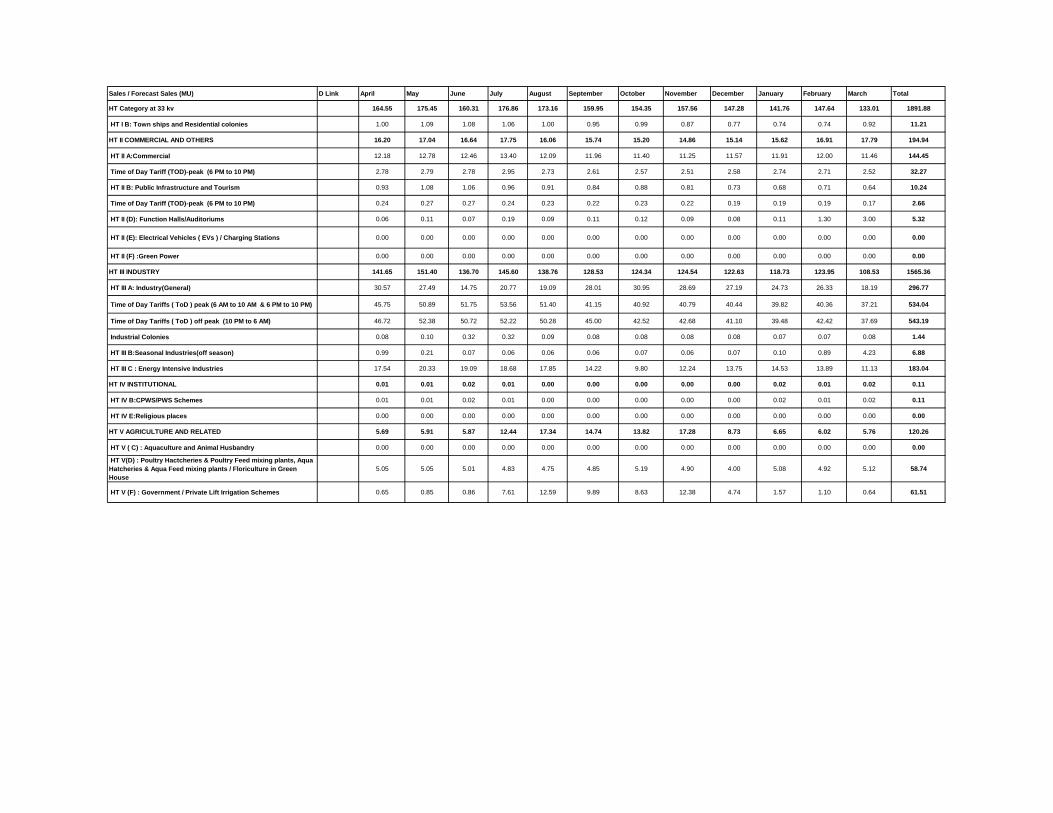
Sales / Forecast Sales (MU) D Link April May June July August September October November December January February March Total
HT Category at 33 kv 164.55 175.45 160.31 176.86 173.16 159.95 154.35 157.56 147.28 141.76 147.64 133.01 1891.88
HT I B: Town ships and Residential colonies 1.00 1.09 1.08 1.06 1.00 0.95 0.99 0.87 0.77 0.74 0.74 0.92 11.21
HT II COMMERCIAL AND OTHERS 16.20 17.04 16.64 17.75 16.06 15.74 15.20 14.86 15.14 15.62 16.91 17.79 194.94
HT II A:Commercial 12.18 12.78 12.46 13.40 12.09 11.96 11.40 11.25 11.57 11.91 12.00 11.46 144.45
Time of Day Tariff (TOD)-peak (6 PM to 10 PM) 2.78 2.79 2.78 2.95 2.73 2.61 2.57 2.51 2.58 2.74 2.71 2.52 32.27
HT II B: Public Infrastructure and Tourism 0.93 1.08 1.06 0.96 0.91 0.84 0.88 0.81 0.73 0.68 0.71 0.64 10.24
Time of Day Tariff (TOD)-peak (6 PM to 10 PM) 0.24 0.27 0.27 0.24 0.23 0.22 0.23 0.22 0.19 0.19 0.19 0.17 2.66
HT II (D): Function Halls/Auditoriums 0.06 0.11 0.07 0.19 0.09 0.11 0.12 0.09 0.08 0.11 1.30 3.00 5.32
HT II (E): Electrical Vehicles ( EVs ) / Charging Stations 0.00 0.00 0.00 0.00 0.00 0.00 0.00 0.00 0.00 0.00 0.00 0.00 0.00
HT II (F) :Green Power 0.00 0.00 0.00 0.00 0.00 0.00 0.00 0.00 0.00 0.00 0.00 0.00 0.00
HT III INDUSTRY 141.65 151.40 136.70 145.60 138.76 128.53 124.34 124.54 122.63 118.73 123.95 108.53 1565.36
HT III A: Industry(General) 30.57 27.49 14.75 20.77 19.09 28.01 30.95 28.69 27.19 24.73 26.33 18.19 296.77
Time of Day Tariffs ( ToD ) peak (6 AM to 10 AM & 6 PM to 10 PM) 45.75 50.89 51.75 53.56 51.40 41.15 40.92 40.79 40.44 39.82 40.36 37.21 534.04
Time of Day Tariffs ( ToD ) off peak (10 PM to 6 AM) 46.72 52.38 50.72 52.22 50.28 45.00 42.52 42.68 41.10 39.48 42.42 37.69 543.19
Industrial Colonies 0.08 0.10 0.32 0.32 0.09 0.08 0.08 0.08 0.08 0.07 0.07 0.08 1.44
HT III B:Seasonal Industries(off season) 0.99 0.21 0.07 0.06 0.06 0.06 0.07 0.06 0.07 0.10 0.89 4.23 6.88
HT III C : Energy Intensive Industries 17.54 20.33 19.09 18.68 17.85 14.22 9.80 12.24 13.75 14.53 13.89 11.13 183.04
HT IV INSTITUTIONAL 0.01 0.01 0.02 0.01 0.00 0.00 0.00 0.00 0.00 0.02 0.01 0.02 0.11
HT IV B:CPWS/PWS Schemes 0.01 0.01 0.02 0.01 0.00 0.00 0.00 0.00 0.00 0.02 0.01 0.02 0.11
HT IV E:Religious places 0.00 0.00 0.00 0.00 0.00 0.00 0.00 0.00 0.00 0.00 0.00 0.00 0.00
HT V AGRICULTURE AND RELATED 5.69 5.91 5.87 12.44 17.34 14.74 13.82 17.28 8.73 6.65 6.02 5.76 120.26
HT V ( C) : Aquaculture and Animal Husbandry 0.00 0.00 0.00 0.00 0.00 0.00 0.00 0.00 0.00 0.00 0.00 0.00 0.00
HT V(D) : Poultry Hactcheries & Poultry Feed mixing plants, Aqua
Hatcheries & Aqua Feed mixing plants / Floriculture in Green
House
5.05 5.05 5.01 4.83 4.75 4.85 5.19 4.90 4.00 5.08 4.92 5.12 58.74
HT V (F) : Government / Private Lift Irrigation Schemes 0.65 0.85 0.86 7.61 12.59 9.89 8.63 12.38 4.74 1.57 1.10 0.64 61.51
147

Sales / Forecast Sales (MU) D Link April May June July August September October November December January February March Total
HT Category at 132 kv 423.03 412.34 409.93 449.43 438.12 416.12 413.41 427.90 389.72 390.56 379.27 315.09 4864.91
HT I B: Town ships and Residential colonies 0.00 0.00 0.00 0.00 0.00 0.00 0.00 0.00 0.00 0.00 0.00 0.00 0.00
HT II COMMERCIAL AND OTHERS 5.91 6.29 6.35 6.35 6.02 4.44 5.66 6.27 6.65 6.82 6.35 6.73 73.83
HT II A:Commercial 4.64 4.67 4.90 4.96 4.71 2.97 4.43 4.93 5.22 5.22 4.85 5.17 56.67
Time of Day Tariff (TOD)-peak (6 PM to 10 PM) 1.22 1.28 1.23 1.33 1.11 0.96 1.00 1.12 1.18 1.21 1.13 1.18 13.95
HT II B: Public Infrastructure and Tourism 0.00 0.00 0.00 0.00 0.00 0.00 0.00 0.00 0.00 0.00 0.00 0.00 0.00
Time of Day Tariff (TOD)-peak (6 PM to 10 PM) 0.00 0.00 0.00 0.00 0.00 0.00 0.00 0.00 0.00 0.00 0.00 0.00 0.00
HT II (D): Function Halls/Auditoriums 0.06 0.34 0.21 0.06 0.19 0.51 0.24 0.22 0.25 0.39 0.37 0.37 3.22
HT II (E): Electrical Vehicles ( EVs ) / Charging Stations 0.00 0.00 0.00 0.00 0.00 0.00 0.00 0.00 0.00 0.00 0.00 0.00 0.00
HT II (F) :Green Power 0.00 0.00 0.00 0.00 0.00 0.00 0.00 0.00 0.00 0.00 0.00 0.00 0.00
HT III INDUSTRY 351.47 341.75 336.04 328.36 329.26 342.93 344.16 331.22 314.64 316.92 304.63 247.54 3888.89
HT III A: Industry(General) 28.37 21.28 17.64 21.31 20.80 33.91 36.81 28.81 23.34 23.09 21.97 19.97 297.29
Time of Day Tariffs ( ToD ) peak (6 AM to 10 AM & 6 PM to 10 PM) 44.65 43.73 43.53 40.65 37.05 33.42 39.37 35.04 32.81 32.96 32.62 30.85 446.67
Time of Day Tariffs ( ToD ) off peak (10 PM to 6 AM) 44.75 43.04 42.99 39.72 36.40 36.11 41.99 36.80 33.44 34.33 33.75 32.76 456.11
Industrial Colonies 6.03 6.63 6.62 5.81 5.55 5.28 5.34 4.75 4.41 4.23 4.39 5.11 64.14
HT III B:Seasonal Industries(off season) 0.00 0.00 0.00 0.00 0.00 0.00 0.00 0.00 0.00 0.00 0.00 0.00 0.00
HT III C : Energy Intensive Industries 227.66 227.07 225.26 220.86 229.46 234.21 220.65 225.82 220.64 222.30 211.91 158.85 2624.68
HT IV INSTITUTIONAL 65.40 64.05 66.80 67.63 62.55 59.27 61.41 62.50 65.85 65.86 68.09 60.66 770.07
HT IV B:CPWS/PWS Schemes 0.00 0.00 0.00 0.00 0.00 0.00 0.00 0.00 0.00 0.00 0.00 0.00 0.00
HT IV E:Religious places 0.00 0.00 0.00 0.00 0.00 0.00 0.00 0.00 0.00 0.00 0.00 0.00 0.00
HT IV F: Railway Traction 65.40 64.05 66.80 67.63 62.55 59.27 61.41 62.50 65.85 65.86 68.09 60.66 770.07
HT V AGRICULTURE AND RELATED 0.25 0.25 0.74 47.08 40.31 9.49 2.18 27.90 2.58 0.96 0.20 0.17 132.12
HT V ( C) : Aquaculture and Animal Husbandry 0.00 0.00 0.00 0.00 0.00 0.00 0.00 0.00 0.00 0.00 0.00 0.00 0.00
HT V(D) : Poultry Hactcheries & Poultry Feed mixing plants, Aqua
Hatcheries & Aqua Feed mixing plants / Floriculture in Green
House
0.00 0.00 0.00 0.00 0.00 0.00 0.00 0.00 0.00 0.00 0.00 0.00 0.00
HT V (F) : Government / Private Lift Irrigation Schemes 0.25 0.25 0.74 47.08 40.31 9.49 2.18 27.90 2.58 0.96 0.20 0.17 132.12
Total HT 793.33 808.83 774.77 831.96 817.53 765.78 755.88 776.55 736.73 730.27 730.65 644.09 9166.37
Total (LT + HT) (Restricted sales) 1848.27 1959.42 1897.41 1821.14 1712.92 1626.21 1575.61 1623.95 1617.59 1650.26 1703.03 1741.00 20776.81
148
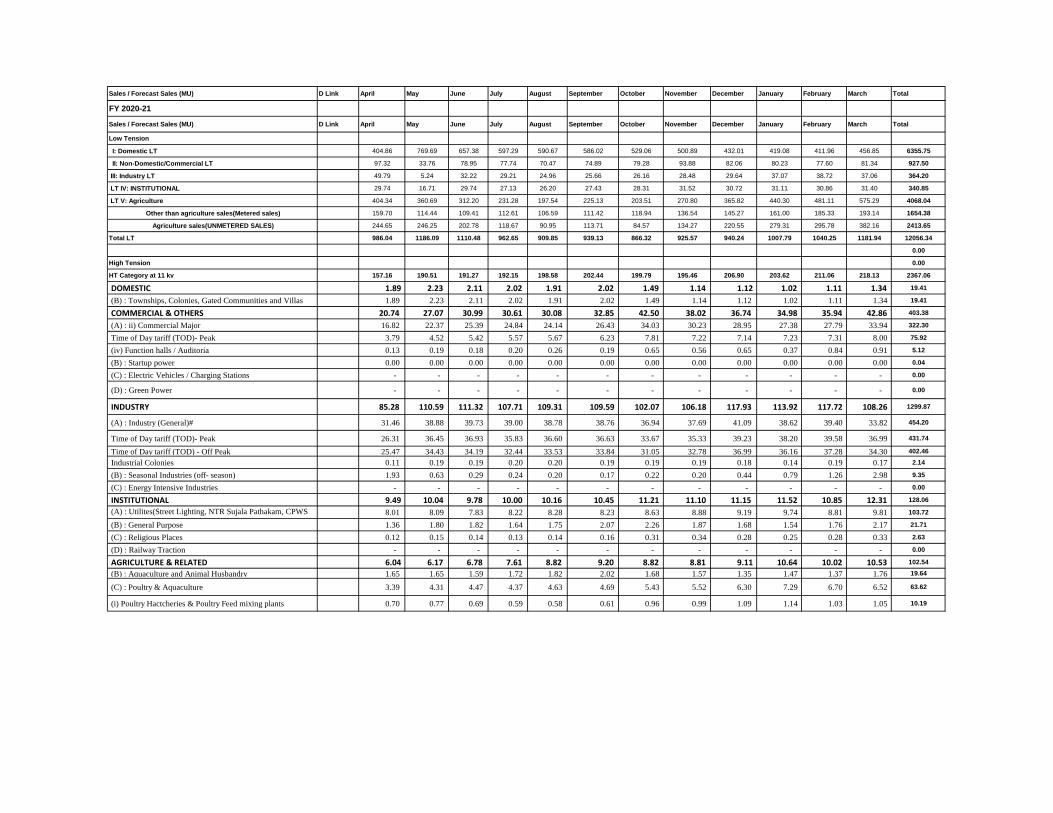
Sales / Forecast Sales (MU) D Link April May June July August September October November December January February March Total
FY 2020-21
Sales / Forecast Sales (MU) D Link April May June July August September October November December January February March Total
Low Tension
I: Domestic LT 404.86 769.69 657.38 597.29 590.67 586.02 529.06 500.89 432.01 419.08 411.96 456.85 6355.75
II: Non-Domestic/Commercial LT 97.32 33.76 78.95 77.74 70.47 74.89 79.28 93.88 82.06 80.23 77.60 81.34 927.50
III: Industry LT 49.79 5.24 32.22 29.21 24.96 25.66 26.16 28.48 29.64 37.07 38.72 37.06 364.20
LT IV: INSTITUTIONAL 29.74 16.71 29.74 27.13 26.20 27.43 28.31 31.52 30.72 31.11 30.86 31.40 340.85
LT V: Agriculture 404.34 360.69 312.20 231.28 197.54 225.13 203.51 270.80 365.82 440.30 481.11 575.29 4068.04
Other than agriculture sales(Metered sales) 159.70 114.44 109.41 112.61 106.59 111.42 118.94 136.54 145.27 161.00 185.33 193.14 1654.38
Agriculture sales(UNMETERED SALES) 244.65 246.25 202.78 118.67 90.95 113.71 84.57 134.27 220.55 279.31 295.78 382.16 2413.65
Total LT 986.04 1186.09 1110.48 962.65 909.85 939.13 866.32 925.57 940.24 1007.79 1040.25 1181.94 12056.34
0.00
High Tension 0.00
HT Category at 11 kv 157.16 190.51 191.27 192.15 198.58 202.44 199.79 195.46 206.90 203.62 211.06 218.13 2367.06
DOMESTIC 1.89 2.23 2.11 2.02 1.91 2.02 1.49 1.14 1.12 1.02 1.11 1.34 19.41
(B) : Townships, Colonies, Gated Communities and Villas 1.89 2.23 2.11 2.02 1.91 2.02 1.49 1.14 1.12 1.02 1.11 1.34 19.41
COMMERCIAL & OTHERS 20.74 27.07 30.99 30.61 30.08 32.85 42.50 38.02 36.74 34.98 35.94 42.86 403.38
(A) : ii) Commercial Major 16.82 22.37 25.39 24.84 24.14 26.43 34.03 30.23 28.95 27.38 27.79 33.94 322.30
Time of Day tariff (TOD)- Peak 3.79 4.52 5.42 5.57 5.67 6.23 7.81 7.22 7.14 7.23 7.31 8.00 75.92
(iv) Function halls / Auditoria 0.13 0.19 0.18 0.20 0.26 0.19 0.65 0.56 0.65 0.37 0.84 0.91 5.12
(B) : Startup power 0.00 0.00 0.00 0.00 0.00 0.00 0.00 0.00 0.00 0.00 0.00 0.00 0.04
(C) : Electric Vehicles / Charging Stations - - - - - - - - - - - - 0.00
(D) : Green Power - - - - - - - - - - - - 0.00
INDUSTRY 85.28 110.59 111.32 107.71 109.31 109.59 102.07 106.18 117.93 113.92 117.72 108.26 1299.87
(A) : Industry (General)# 31.46 38.88 39.73 39.00 38.78 38.76 36.94 37.69 41.09 38.62 39.40 33.82 454.20
Time of Day tariff (TOD)- Peak 26.31 36.45 36.93 35.83 36.60 36.63 33.67 35.33 39.23 38.20 39.58 36.99 431.74
Time of Day tariff (TOD) - Off Peak 25.47 34.43 34.19 32.44 33.53 33.84 31.05 32.78 36.99 36.16 37.28 34.30 402.46
Industrial Colonies 0.11 0.19 0.19 0.20 0.20 0.19 0.19 0.19 0.18 0.14 0.19 0.17 2.14
(B) : Seasonal Industries (off- season) 1.93 0.63 0.29 0.24 0.20 0.17 0.22 0.20 0.44 0.79 1.26 2.98 9.35
(C) : Energy Intensive Industries - - - - - - - - - - - - 0.00
INSTITUTIONAL 9.49 10.04 9.78 10.00 10.16 10.45 11.21 11.10 11.15 11.52 10.85 12.31 128.06
(A) : Utilites(Street Lighting, NTR Sujala Pathakam, CPWS
and PWS)
8.01 8.09 7.83 8.22 8.28 8.23 8.63 8.88 9.19 9.74 8.81 9.81 103.72
(B) : General Purpose 1.36 1.80 1.82 1.64 1.75 2.07 2.26 1.87 1.68 1.54 1.76 2.17 21.71
(C) : Religious Places 0.12 0.15 0.14 0.13 0.14 0.16 0.31 0.34 0.28 0.25 0.28 0.33 2.63
(D) : Railway Traction - - - - - - - - - - - - 0.00
AGRICULTURE & RELATED 6.04 6.17 6.78 7.61 8.82 9.20 8.82 8.81 9.11 10.64 10.02 10.53 102.54
(B) : Aquaculture and Animal Husbandry 1.65 1.65 1.59 1.72 1.82 2.02 1.68 1.57 1.35 1.47 1.37 1.76 19.64
(C) : Poultry & Aquaculture 3.39 4.31 4.47 4.37 4.63 4.69 5.43 5.52 6.30 7.29 6.70 6.52 63.62
(i) Poultry Hactcheries & Poultry Feed mixing plants 0.70 0.77 0.69 0.59 0.58 0.61 0.96 0.99 1.09 1.14 1.03 1.05 10.19
149
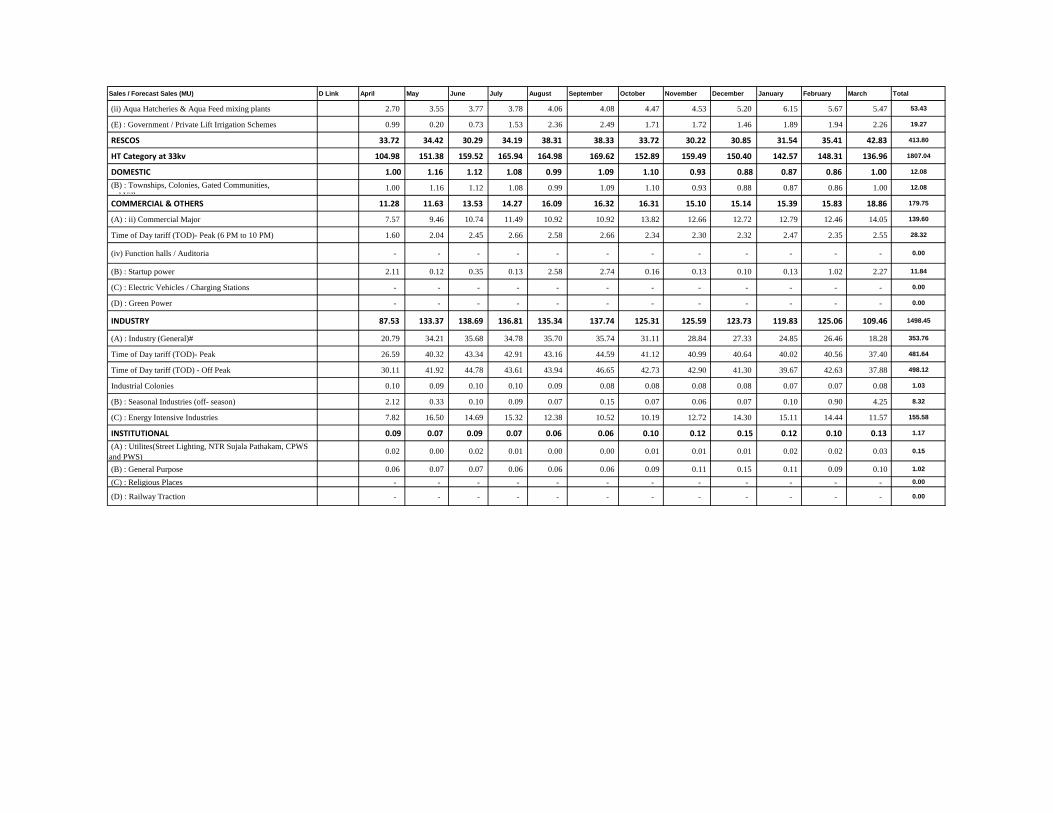
Sales / Forecast Sales (MU) D Link April May June July August September October November December January February March Total
(ii) Aqua Hatcheries & Aqua Feed mixing plants 2.70 3.55 3.77 3.78 4.06 4.08 4.47 4.53 5.20 6.15 5.67 5.47 53.43
(E) : Government / Private Lift Irrigation Schemes 0.99 0.20 0.73 1.53 2.36 2.49 1.71 1.72 1.46 1.89 1.94 2.26 19.27
RESCOS 33.72 34.42 30.29 34.19 38.31 38.33 33.72 30.22 30.85 31.54 35.41 42.83 413.80
HT Category at 33kv 104.98 151.38 159.52 165.94 164.98 169.62 152.89 159.49 150.40 142.57 148.31 136.96 1807.04
DOMESTIC 1.00 1.16 1.12 1.08 0.99 1.09 1.10 0.93 0.88 0.87 0.86 1.00 12.08
(B) : Townships, Colonies, Gated Communities,
and Villas 1.00 1.16 1.12 1.08 0.99 1.09 1.10 0.93 0.88 0.87 0.86 1.00 12.08
COMMERCIAL & OTHERS 11.28 11.63 13.53 14.27 16.09 16.32 16.31 15.10 15.14 15.39 15.83 18.86 179.75
(A) : ii) Commercial Major 7.57 9.46 10.74 11.49 10.92 10.92 13.82 12.66 12.72 12.79 12.46 14.05 139.60
Time of Day tariff (TOD)- Peak (6 PM to 10 PM) 1.60 2.04 2.45 2.66 2.58 2.66 2.34 2.30 2.32 2.47 2.35 2.55 28.32
(iv) Function halls / Auditoria - - - - - - - - - - - - 0.00
(B) : Startup power 2.11 0.12 0.35 0.13 2.58 2.74 0.16 0.13 0.10 0.13 1.02 2.27 11.84
(C) : Electric Vehicles / Charging Stations - - - - - - - - - - - - 0.00
(D) : Green Power - - - - - - - - - - - - 0.00
INDUSTRY 87.53 133.37 138.69 136.81 135.34 137.74 125.31 125.59 123.73 119.83 125.06 109.46 1498.45
(A) : Industry (General)# 20.79 34.21 35.68 34.78 35.70 35.74 31.11 28.84 27.33 24.85 26.46 18.28 353.76
Time of Day tariff (TOD)- Peak 26.59 40.32 43.34 42.91 43.16 44.59 41.12 40.99 40.64 40.02 40.56 37.40 481.64
Time of Day tariff (TOD) - Off Peak 30.11 41.92 44.78 43.61 43.94 46.65 42.73 42.90 41.30 39.67 42.63 37.88 498.12
Industrial Colonies 0.10 0.09 0.10 0.10 0.09 0.08 0.08 0.08 0.08 0.07 0.07 0.08 1.03
(B) : Seasonal Industries (off- season) 2.12 0.33 0.10 0.09 0.07 0.15 0.07 0.06 0.07 0.10 0.90 4.25 8.32
(C) : Energy Intensive Industries 7.82 16.50 14.69 15.32 12.38 10.52 10.19 12.72 14.30 15.11 14.44 11.57 155.58
INSTITUTIONAL 0.09 0.07 0.09 0.07 0.06 0.06 0.10 0.12 0.15 0.12 0.10 0.13 1.17
(A) : Utilites(Street Lighting, NTR Sujala Pathakam, CPWS
and PWS) 0.02 0.00 0.02 0.01 0.00 0.00 0.01 0.01 0.01 0.02 0.02 0.03 0.15
(B) : General Purpose 0.06 0.07 0.07 0.06 0.06 0.06 0.09 0.11 0.15 0.11 0.09 0.10 1.02
(C) : Religious Places - - - - - - - - - - - - 0.00
(D) : Railway Traction - - - - - - - - - - - - 0.00
150
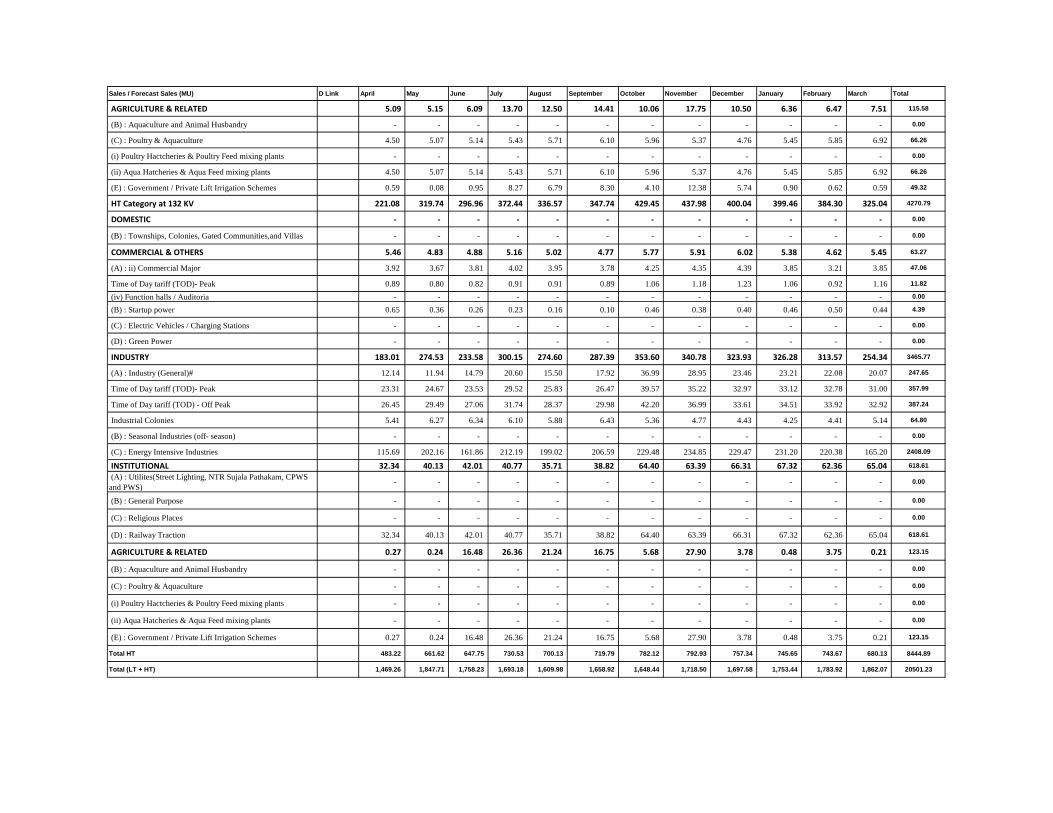
Sales / Forecast Sales (MU) D Link April May June July August September October November December January February March Total
AGRICULTURE & RELATED 5.09 5.15 6.09 13.70 12.50 14.41 10.06 17.75 10.50 6.36 6.47 7.51 115.58
(B) : Aquaculture and Animal Husbandry - - - - - - - - - - - - 0.00
(C) : Poultry & Aquaculture 4.50 5.07 5.14 5.43 5.71 6.10 5.96 5.37 4.76 5.45 5.85 6.92 66.26
(i) Poultry Hactcheries & Poultry Feed mixing plants - - - - - - - - - - - - 0.00
(ii) Aqua Hatcheries & Aqua Feed mixing plants 4.50 5.07 5.14 5.43 5.71 6.10 5.96 5.37 4.76 5.45 5.85 6.92 66.26
(E) : Government / Private Lift Irrigation Schemes 0.59 0.08 0.95 8.27 6.79 8.30 4.10 12.38 5.74 0.90 0.62 0.59 49.32
HT Category at 132 KV 221.08 319.74 296.96 372.44 336.57 347.74 429.45 437.98 400.04 399.46 384.30 325.04 4270.79
DOMESTIC - - - - - - - - - - - - 0.00
(B) : Townships, Colonies, Gated Communities,and Villas - - - - - - - - - - - - 0.00
COMMERCIAL & OTHERS 5.46 4.83 4.88 5.16 5.02 4.77 5.77 5.91 6.02 5.38 4.62 5.45 63.27
(A) : ii) Commercial Major 3.92 3.67 3.81 4.02 3.95 3.78 4.25 4.35 4.39 3.85 3.21 3.85 47.06
Time of Day tariff (TOD)- Peak 0.89 0.80 0.82 0.91 0.91 0.89 1.06 1.18 1.23 1.06 0.92 1.16 11.82
(iv) Function halls / Auditoria - - - - - - - - - - - - 0.00
(B) : Startup power 0.65 0.36 0.26 0.23 0.16 0.10 0.46 0.38 0.40 0.46 0.50 0.44 4.39
(C) : Electric Vehicles / Charging Stations - - - - - - - - - - - - 0.00
(D) : Green Power - - - - - - - - - - - - 0.00
INDUSTRY 183.01 274.53 233.58 300.15 274.60 287.39 353.60 340.78 323.93 326.28 313.57 254.34 3465.77
(A) : Industry (General)# 12.14 11.94 14.79 20.60 15.50 17.92 36.99 28.95 23.46 23.21 22.08 20.07 247.65
Time of Day tariff (TOD)- Peak 23.31 24.67 23.53 29.52 25.83 26.47 39.57 35.22 32.97 33.12 32.78 31.00 357.99
Time of Day tariff (TOD) - Off Peak 26.45 29.49 27.06 31.74 28.37 29.98 42.20 36.99 33.61 34.51 33.92 32.92 387.24
Industrial Colonies 5.41 6.27 6.34 6.10 5.88 6.43 5.36 4.77 4.43 4.25 4.41 5.14 64.80
(B) : Seasonal Industries (off- season) - - - - - - - - - - - - 0.00
(C) : Energy Intensive Industries 115.69 202.16 161.86 212.19 199.02 206.59 229.48 234.85 229.47 231.20 220.38 165.20 2408.09
INSTITUTIONAL 32.34 40.13 42.01 40.77 35.71 38.82 64.40 63.39 66.31 67.32 62.36 65.04 618.61
(A) : Utilites(Street Lighting, NTR Sujala Pathakam, CPWS
and PWS) - - - - - - - - - - - - 0.00
(B) : General Purpose - - - - - - - - - - - - 0.00
(C) : Religious Places - - - - - - - - - - - - 0.00
(D) : Railway Traction 32.34 40.13 42.01 40.77 35.71 38.82 64.40 63.39 66.31 67.32 62.36 65.04 618.61
AGRICULTURE & RELATED 0.27 0.24 16.48 26.36 21.24 16.75 5.68 27.90 3.78 0.48 3.75 0.21 123.15
(B) : Aquaculture and Animal Husbandry - - - - - - - - - - - - 0.00
(C) : Poultry & Aquaculture - - - - - - - - - - - - 0.00
(i) Poultry Hactcheries & Poultry Feed mixing plants - - - - - - - - - - - - 0.00
(ii) Aqua Hatcheries & Aqua Feed mixing plants - - - - - - - - - - - - 0.00
(E) : Government / Private Lift Irrigation Schemes 0.27 0.24 16.48 26.36 21.24 16.75 5.68 27.90 3.78 0.48 3.75 0.21 123.15
Total HT 483.22 661.62 647.75 730.53 700.13 719.79 782.12 792.93 757.34 745.65 743.67 680.13 8444.89
Total (LT + HT) 1,469.26 1,847.71 1,758.23 1,693.18 1,609.98 1,658.92 1,648.44 1,718.50 1,697.58 1,753.44 1,783.92 1,862.07 20501.23
151
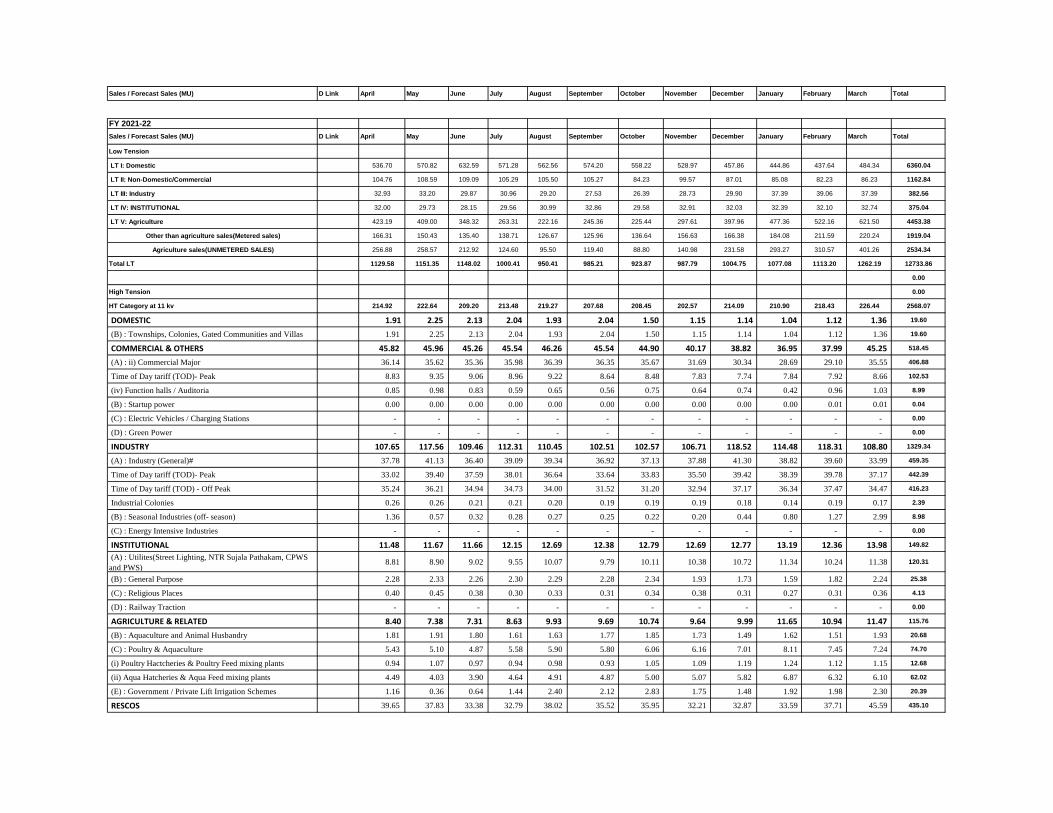
Sales / Forecast Sales (MU) D Link April May June July August September October November December January February March Total
FY 2021-22
Sales / Forecast Sales (MU) D Link April May June July August September October November December January February March Total
Low Tension
LT I: Domestic 536.70 570.82 632.59 571.28 562.56 574.20 558.22 528.97 457.86 444.86 437.64 484.34 6360.04
LT II: Non-Domestic/Commercial 104.76 108.59 109.09 105.29 105.50 105.27 84.23 99.57 87.01 85.08 82.23 86.23 1162.84
LT III: Industry 32.93 33.20 29.87 30.96 29.20 27.53 26.39 28.73 29.90 37.39 39.06 37.39 382.56
LT IV: INSTITUTIONAL 32.00 29.73 28.15 29.56 30.99 32.86 29.58 32.91 32.03 32.39 32.10 32.74 375.04
LT V: Agriculture 423.19 409.00 348.32 263.31 222.16 245.36 225.44 297.61 397.96 477.36 522.16 621.50 4453.38
Other than agriculture sales(Metered sales) 166.31 150.43 135.40 138.71 126.67 125.96 136.64 156.63 166.38 184.08 211.59 220.24 1919.04
Agriculture sales(UNMETERED SALES) 256.88 258.57 212.92 124.60 95.50 119.40 88.80 140.98 231.58 293.27 310.57 401.26 2534.34
Total LT 1129.58 1151.35 1148.02 1000.41 950.41 985.21 923.87 987.79 1004.75 1077.08 1113.20 1262.19 12733.86
0.00
High Tension 0.00
HT Category at 11 kv 214.92 222.64 209.20 213.48 219.27 207.68 208.45 202.57 214.09 210.90 218.43 226.44 2568.07
DOMESTIC 1.91 2.25 2.13 2.04 1.93 2.04 1.50 1.15 1.14 1.04 1.12 1.36 19.60
(B) : Townships, Colonies, Gated Communities and Villas 1.91 2.25 2.13 2.04 1.93 2.04 1.50 1.15 1.14 1.04 1.12 1.36 19.60
COMMERCIAL & OTHERS 45.82 45.96 45.26 45.54 46.26 45.54 44.90 40.17 38.82 36.95 37.99 45.25 518.45
(A) : ii) Commercial Major 36.14 35.62 35.36 35.98 36.39 36.35 35.67 31.69 30.34 28.69 29.10 35.55 406.88
Time of Day tariff (TOD)- Peak 8.83 9.35 9.06 8.96 9.22 8.64 8.48 7.83 7.74 7.84 7.92 8.66 102.53
(iv) Function halls / Auditoria 0.85 0.98 0.83 0.59 0.65 0.56 0.75 0.64 0.74 0.42 0.96 1.03 8.99
(B) : Startup power 0.00 0.00 0.00 0.00 0.00 0.00 0.00 0.00 0.00 0.00 0.01 0.01 0.04
(C) : Electric Vehicles / Charging Stations - - - - - - - - - - - - 0.00
(D) : Green Power - - - - - - - - - - - - 0.00
INDUSTRY 107.65 117.56 109.46 112.31 110.45 102.51 102.57 106.71 118.52 114.48 118.31 108.80 1329.34
(A) : Industry (General)# 37.78 41.13 36.40 39.09 39.34 36.92 37.13 37.88 41.30 38.82 39.60 33.99 459.35
Time of Day tariff (TOD)- Peak 33.02 39.40 37.59 38.01 36.64 33.64 33.83 35.50 39.42 38.39 39.78 37.17 442.39
Time of Day tariff (TOD) - Off Peak 35.24 36.21 34.94 34.73 34.00 31.52 31.20 32.94 37.17 36.34 37.47 34.47 416.23
Industrial Colonies 0.26 0.26 0.21 0.21 0.20 0.19 0.19 0.19 0.18 0.14 0.19 0.17 2.39
(B) : Seasonal Industries (off- season) 1.36 0.57 0.32 0.28 0.27 0.25 0.22 0.20 0.44 0.80 1.27 2.99 8.98
(C) : Energy Intensive Industries - - - - - - - - - - - - 0.00
INSTITUTIONAL 11.48 11.67 11.66 12.15 12.69 12.38 12.79 12.69 12.77 13.19 12.36 13.98 149.82
(A) : Utilites(Street Lighting, NTR Sujala Pathakam, CPWS
and PWS) 8.81 8.90 9.02 9.55 10.07 9.79 10.11 10.38 10.72 11.34 10.24 11.38 120.31
(B) : General Purpose 2.28 2.33 2.26 2.30 2.29 2.28 2.34 1.93 1.73 1.59 1.82 2.24 25.38
(C) : Religious Places 0.40 0.45 0.38 0.30 0.33 0.31 0.34 0.38 0.31 0.27 0.31 0.36 4.13
(D) : Railway Traction - - - - - - - - - - - - 0.00
AGRICULTURE & RELATED 8.40 7.38 7.31 8.63 9.93 9.69 10.74 9.64 9.99 11.65 10.94 11.47 115.76
(B) : Aquaculture and Animal Husbandry 1.81 1.91 1.80 1.61 1.63 1.77 1.85 1.73 1.49 1.62 1.51 1.93 20.68
(C) : Poultry & Aquaculture 5.43 5.10 4.87 5.58 5.90 5.80 6.06 6.16 7.01 8.11 7.45 7.24 74.70
(i) Poultry Hactcheries & Poultry Feed mixing plants 0.94 1.07 0.97 0.94 0.98 0.93 1.05 1.09 1.19 1.24 1.12 1.15 12.68
(ii) Aqua Hatcheries & Aqua Feed mixing plants 4.49 4.03 3.90 4.64 4.91 4.87 5.00 5.07 5.82 6.87 6.32 6.10 62.02
(E) : Government / Private Lift Irrigation Schemes 1.16 0.36 0.64 1.44 2.40 2.12 2.83 1.75 1.48 1.92 1.98 2.30 20.39
RESCOS 39.65 37.83 33.38 32.79 38.02 35.52 35.95 32.21 32.87 33.59 37.71 45.59 435.10
152
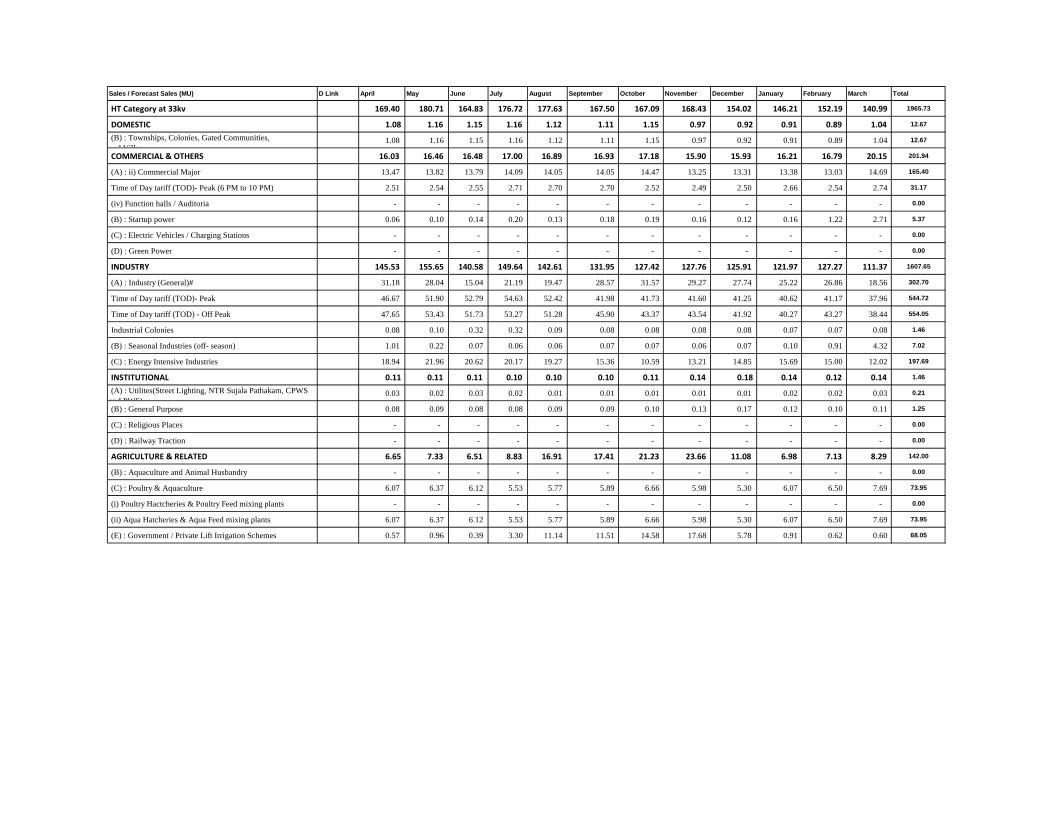
Sales / Forecast Sales (MU) D Link April May June July August September October November December January February March Total
HT Category at 33kv 169.40 180.71 164.83 176.72 177.63 167.50 167.09 168.43 154.02 146.21 152.19 140.99 1965.73
DOMESTIC 1.08 1.16 1.15 1.16 1.12 1.11 1.15 0.97 0.92 0.91 0.89 1.04 12.67
(B) : Townships, Colonies, Gated Communities,
and Villas 1.08 1.16 1.15 1.16 1.12 1.11 1.15 0.97 0.92 0.91 0.89 1.04 12.67
COMMERCIAL & OTHERS 16.03 16.46 16.48 17.00 16.89 16.93 17.18 15.90 15.93 16.21 16.79 20.15 201.94
(A) : ii) Commercial Major 13.47 13.82 13.79 14.09 14.05 14.05 14.47 13.25 13.31 13.38 13.03 14.69 165.40
Time of Day tariff (TOD)- Peak (6 PM to 10 PM) 2.51 2.54 2.55 2.71 2.70 2.70 2.52 2.49 2.50 2.66 2.54 2.74 31.17
(iv) Function halls / Auditoria - - - - - - - - - - - - 0.00
(B) : Startup power 0.06 0.10 0.14 0.20 0.13 0.18 0.19 0.16 0.12 0.16 1.22 2.71 5.37
(C) : Electric Vehicles / Charging Stations - - - - - - - - - - - - 0.00
(D) : Green Power - - - - - - - - - - - - 0.00
INDUSTRY 145.53 155.65 140.58 149.64 142.61 131.95 127.42 127.76 125.91 121.97 127.27 111.37 1607.65
(A) : Industry (General)# 31.18 28.04 15.04 21.19 19.47 28.57 31.57 29.27 27.74 25.22 26.86 18.56 302.70
Time of Day tariff (TOD)- Peak 46.67 51.90 52.79 54.63 52.42 41.98 41.73 41.60 41.25 40.62 41.17 37.96 544.72
Time of Day tariff (TOD) - Off Peak 47.65 53.43 51.73 53.27 51.28 45.90 43.37 43.54 41.92 40.27 43.27 38.44 554.05
Industrial Colonies 0.08 0.10 0.32 0.32 0.09 0.08 0.08 0.08 0.08 0.07 0.07 0.08 1.46
(B) : Seasonal Industries (off- season) 1.01 0.22 0.07 0.06 0.06 0.07 0.07 0.06 0.07 0.10 0.91 4.32 7.02
(C) : Energy Intensive Industries 18.94 21.96 20.62 20.17 19.27 15.36 10.59 13.21 14.85 15.69 15.00 12.02 197.69
INSTITUTIONAL 0.11 0.11 0.11 0.10 0.10 0.10 0.11 0.14 0.18 0.14 0.12 0.14 1.46
(A) : Utilites(Street Lighting, NTR Sujala Pathakam, CPWS
and PWS) 0.03 0.02 0.03 0.02 0.01 0.01 0.01 0.01 0.01 0.02 0.02 0.03 0.21
(B) : General Purpose 0.08 0.09 0.08 0.08 0.09 0.09 0.10 0.13 0.17 0.12 0.10 0.11 1.25
(C) : Religious Places - - - - - - - - - - - - 0.00
(D) : Railway Traction - - - - - - - - - - - - 0.00
AGRICULTURE & RELATED 6.65 7.33 6.51 8.83 16.91 17.41 21.23 23.66 11.08 6.98 7.13 8.29 142.00
(B) : Aquaculture and Animal Husbandry - - - - - - - - - - - - 0.00
(C) : Poultry & Aquaculture 6.07 6.37 6.12 5.53 5.77 5.89 6.66 5.98 5.30 6.07 6.50 7.69 73.95
(i) Poultry Hactcheries & Poultry Feed mixing plants - - - - - - - - - - - - 0.00
(ii) Aqua Hatcheries & Aqua Feed mixing plants 6.07 6.37 6.12 5.53 5.77 5.89 6.66 5.98 5.30 6.07 6.50 7.69 73.95
(E) : Government / Private Lift Irrigation Schemes 0.57 0.96 0.39 3.30 11.14 11.51 14.58 17.68 5.78 0.91 0.62 0.60 68.05
153

Sales / Forecast Sales (MU) D Link April May June July August September October November December January February March Total
HT Category at 132 KV 443.24 433.62 440.64 487.12 475.47 507.55 506.89 486.32 409.86 411.29 392.35 334.46 5328.80
DOMESTIC 0.00
(B) : Townships, Colonies, Gated Communities,and Villas - - - - - - - - - - - - 0.00
COMMERCIAL & OTHERS 5.72 5.26 5.22 5.45 5.48 5.16 5.77 5.90 6.01 5.38 4.63 5.44 65.43
(A) : ii) Commercial Major 4.30 3.78 3.81 4.02 3.95 3.78 4.25 4.35 4.39 3.85 3.21 3.85 47.55
Time of Day tariff (TOD)- Peak 1.16 1.03 1.00 0.98 0.91 0.87 1.01 1.13 1.18 1.02 0.88 1.10 12.26
(iv) Function halls / Auditoria - - - - - - - - - - - - 0.00
(B) : Startup power 0.26 0.44 0.42 0.46 0.61 0.51 0.51 0.42 0.45 0.52 0.55 0.48 5.61
(C) : Electric Vehicles / Charging Stations - - - - - - - - - - - - 0.00
(D) : Green Power - - - - - - - - - - - - 0.00
INDUSTRY 372.16 362.20 356.16 347.84 348.40 363.01 363.81 350.91 333.67 336.15 323.07 261.57 4118.96
(A) : Industry (General)# 28.94 21.70 17.99 21.74 21.22 34.59 37.55 29.38 23.81 23.55 22.41 20.37 303.24
Time of Day tariff (TOD)- Peak 45.55 44.60 44.29 41.13 36.59 33.26 39.69 35.25 32.97 33.18 32.90 31.02 450.41
Time of Day tariff (TOD) - Off Peak 45.65 43.90 43.85 40.52 37.13 36.84 42.83 37.54 34.11 35.02 34.43 33.41 465.23
Industrial Colonies 6.15 6.77 6.75 5.92 5.66 5.39 5.44 4.85 4.50 4.31 4.47 5.21 65.43
(B) : Seasonal Industries (off- season) - - - - - - - - - - - - 0.00
(C) : Energy Intensive Industries 245.87 245.23 243.28 238.53 247.81 252.95 238.30 243.89 238.29 240.09 228.86 171.56 2834.66
INSTITUTIONAL 65.20 65.97 66.42 66.60 65.74 63.92 66.56 65.51 68.53 69.57 64.43 67.20 795.66
(A) : Utilites(Street Lighting, NTR Sujala Pathakam, CPWS
and PWS) - - - - - - - - - - - - 0.00
(B) : General Purpose - - - - - - - - - - - - 0.00
(C) : Religious Places - - - - - - - - - - - - 0.00
(D) : Railway Traction 65.20 65.97 66.42 66.60 65.74 63.92 66.56 65.51 68.53 69.57 64.43 67.20 795.66
AGRICULTURE & RELATED 0.16 0.19 12.84 67.22 55.85 75.46 70.75 64.00 1.64 0.18 0.22 0.24 348.76
(B) : Aquaculture and Animal Husbandry - - - - - - - - - - - - 0.00
(C) : Poultry & Aquaculture - - - - - - - - - - - - 0.00
(i) Poultry Hactcheries & Poultry Feed mixing plants - - - - - - - - - - - - 0.00
(ii) Aqua Hatcheries & Aqua Feed mixing plants - - - - - - - - - - - - 0.00
(E) : Government / Private Lift Irrigation Schemes 0.16 0.19 12.84 67.22 55.85 75.46 70.75 64.00 1.64 0.18 0.22 0.24 348.76
Total HT 827.56 836.97 814.67 877.32 872.38 882.73 882.44 857.32 777.97 768.39 762.97 701.89 9862.60
Total (LT + HT) 1,957.13 1,988.32 1,962.69 1,877.72 1,822.79 1,867.94 1,806.31 1,845.11 1,782.72 1,845.47 1,876.16 1,964.08 22596.46
154
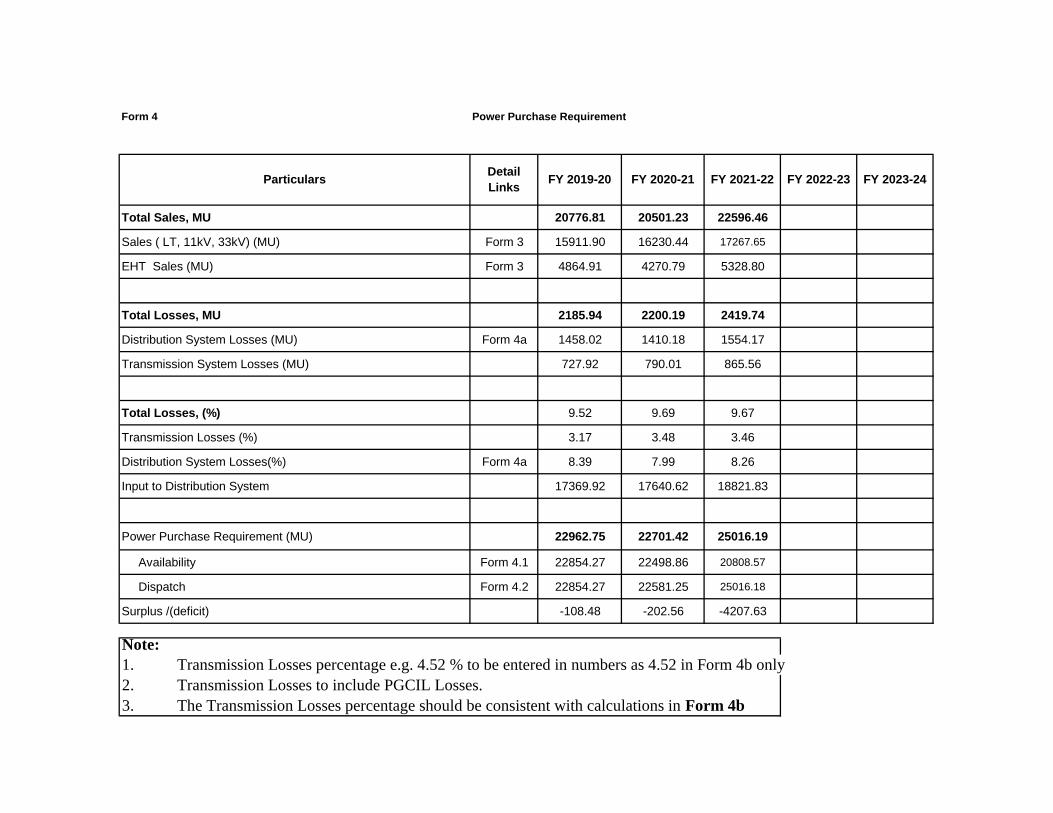
Form 4
Total Sales, MU 20776.81 20501.23 22596.46
Sales ( LT, 11kV, 33kV) (MU) Form 3 15911.90 16230.44 17267.65
EHT Sales (MU) Form 3 4864.91 4270.79 5328.80
Total Losses, MU 2185.94 2200.19 2419.74
Distribution System Losses (MU) Form 4a 1458.02 1410.18 1554.17
Transmission System Losses (MU) 727.92 790.01 865.56
Total Losses, (%) 9.52 9.69 9.67
Transmission Losses (%) 3.17 3.48 3.46
Distribution System Losses(%) Form 4a 8.39 7.99 8.26
Input to Distribution System 17369.92 17640.62 18821.83
Power Purchase Requirement (MU) 22962.75 22701.42 25016.19
Availability Form 4.1 22854.27 22498.86 20808.57
Dispatch Form 4.2 22854.27 22581.25 25016.18
Surplus /(deficit) -108.48 -202.56 -4207.63
Note:
1. Transmission Losses percentage e.g. 4.52 % to be entered in numbers as 4.52 in Form 4b only
2. Transmission Losses to include PGCIL Losses.
3. The Transmission Losses percentage should be consistent with calculations in Form 4b
FY 2022-23 FY 2023-24
Power Purchase Requirement
ParticularsDetail
LinksFY 2019-20 FY 2020-21 FY 2021-22
155

Form A New Consumer Categories
Notes:
1 Add any proposed category here, in the tables provided under corresponding voltage levels.
2 Select the category which is being modified/replaced in the EXISTING CATEGORY Field.
3 Provide the name of the proposed category in the PROPOSED CATEGORY Field
4
For LT Category For HT Category - 11kV
Modification of Existing Category II(A)I: Industry- LT In this category V (C) : Poultry &
Aquaculture -LT are added Modification of Existing Category
I( B) Townships, Colonies, Gated
Communities and Villas - HT I : DOMESTIC -HT
Modification of Existing Category III(A): Industry- HT In this category V (C) : Poultry & Aquaculture -LT are added
For HT Category - 33kV For HT Category - 132kV
Modification of Existing Category
Modification of Existing Category I( B) Townships, Colonies, Gated Communities and Villas -
HT I : DOMESTIC -HT Modification of Existing Category
I( B) Townships, Colonies, Gated
Communities and Villas - HT I : DOMESTIC -HT
Modification of Existing Category III(A): Industry- HT In this category V (C) : Poultry &
Aquaculture -LT are added Modification of Existing Category III(A): Industry- HT In this category V (C) : Poultry & Aquaculture -LT are added
Modification of Existing Category Modification of Existing Category
Proposed Category Remarks
Modification/Replacement of
existing CategoryExisting Category Proposed Category Remarks
Modification/Replacement of
existing CategoryExisting Category
Remarks
Modification/Replacement of existing Category Existing Category Proposed Category Remarks
Modification/Replacement of existing Category Existing Category
Modifications of Slabs/SubCategories should be done in the Form 7/ Form 12. See the notes in the corresponding Forms for detailed instructions
Proposed Category
156

Form 4a Energy Losses (Distribution System)
D - Link Base Year FY 2019-20 FY 2020-21 FY 2021-22
I. Losses in 33 KV System and Connected Equipment
(i) Total Energy delivered into 33 KV Distribution System from EHT SSs A 16070.88 17369.92 17640.62 18821.83
(ii) Energy delivered by all other Generating Stations at 33kV B
(iii) Energy consumed by HT consumers at 33KV (Sales + Third Party) X 1951.67 1891.88 1807.04 1965.73
(iv) Energy Delivered into 11 KV and LT System from 33/11 KV SSs C 13579.23 14894.10 15264.91 16334.73
Losses (33 kV System) (A + B) - (C + X) 539.98 583.94 568.67 521.36
% Losses (33 kV System) 100 x [(A+B)-(C+X)] / (A+B) 3.36 3.36 3.22 2.77
II. Losses in 11 KV System and Connected Equipment
(i) Energy delivered into 11 KV system from 33/11kV SSs C 13579.23 14894.10 15264.91 16334.73
(ii) Energy delivered into 11 KV Distribution System from EHT SSs D
(iii) Energy delivered at 11kV from all other Generating Stations E
(iv) Total Energy delivered into 11 KV and LT Distribution System C+D+E 13579.23 14894.10 15264.91 16334.73
(v) Energy consumed by HT consumers at 11KV (Sales + Third Party) Y 2321.07 2409.58 2367.06 2568.07
(vi) Total Output from 11kV to LT F 10769.31 11999.39 12476.89 13260.29
Losses (11kV System) (C + D + E) - (Y + F) 488.85 485.13 420.96 506.38
% Losses (11kV System)[(C+D+E)-(Y+F)] x 100 / (C+D+E) 3.60 3.26 2.76 3.10
III. Losses in LT system and connected equipment
(i) Energy delivered to LT system from 11/400 V DTRs F 10769.31 11999.39 12476.89 13260.29
(ii) Energy sold to metered categories Z 8229.84 9187.67 9642.69 10199.52
(iii) Energy sold to un-metered categories N 2179.77 2422.77 2413.65 2534.34
Losses (LT System) F-(Z+N) 359.69 388.94 420.55 526.43
% Losses (LT System) [F-(Z+N)] x 100 / (F) 3.34 3.24 3.37 3.97
IV. Total losses in the Distribution System
(i) Total Input to the distribution system A + B + D + E 16070.88 17369.92 17640.62 18821.83
(ii) Total Output from the Distribution Sytem X + Y + Z + N 14682.35 15911.90 16230.44 17267.65
(iii) EHT Sales G 4985.97 4864.91 4270.79 5328.80
Distribution System Losses (A + B + D + E)-(X + Y + Z + N) 1388.53 1458.02 1410.18 1554.17
% Distribution System Losses ( Excluding EHT Sales)[(A+B+D+E)-(X+Y+Z+N)] x 100 /
(A+B+D+E) 8.64 8.39 7.99 8.26
% Distribution System Losses ( Including EHT Sales)[(A+B+D+E)-(X+Y+Z+N)] x 100 /
(A+B+D+E +G) 6.59 6.56 6.44 6.44
Particulars
157

Form 4b
Total Transmission Losses (Inclusive of PGCIL) (%) 3.93
Input to APTransco Network (MU)
APTransco Losses (%) 3.10 3.17 3.48 3.46
APTransco Losses (MU)
Input to PGCIL (For CGS) (MU)
PGCIL Losses (%) (For CGS) 3.01 3.17 3.48 3.46
PGCIL Losses (MU) (For CGS)
Transmission Losses
Particulars Detail Links Base Year FY 2020-21 FY 2021-22 FY 2022-23
Relates to detailed calculation of the Transmission Losses percentage entered in Form 4. The working of the losses (MU & percentages) to be entered under working
notes Form 4b.
FY 2019-20 FY 2023-24
158

Form 4.1 (FY2019-20)
April May June July AugustSeptemb
erOctober November December January February March Total
APGENCO-THERMAL
VTPS I 72.01 76.52 71.74 68.42 65.79 55.87 57.69 58.91 59.99 73.59 71.20 71.97 803.70 803.70
VTPS II 72.01 76.52 71.74 68.42 65.79 55.87 57.69 58.91 59.99 73.59 71.20 71.97 803.70 803.70
VTPS III 72.01 76.52 71.74 68.42 65.79 55.87 57.69 58.91 59.99 73.59 71.20 71.97 803.70 803.70
VTPS IV 103.08 88.85 97.54 91.61 93.16 79.23 69.80 71.02 82.88 90.52 87.93 68.54 1024.17 1024.17
RTPP I 66.55 69.99 58.90 53.49 28.44 33.28 30.24 15.73 0.94 0.00 55.48 4.48 417.51 417.51
RTPP Stage-II 64.83 72.04 72.19 72.71 65.86 72.85 59.06 30.32 3.36 38.17 35.11 37.34 623.85 623.85
RTPP Stage-III 24.45 36.61 33.29 25.41 31.76 2.17 15.27 2.51 -0.34 0.00 21.09 -0.18 192.05 192.05
Damodaram Sanjeevaiah Thermal power plant - I 110.62 126.28 110.39 106.34 118.10 101.32 62.68 69.36 76.01 117.00 78.13 62.95 1139.17 1139.17
Damodaram Sanjeevaiah Thermal power plant - II 110.62 126.28 110.39 106.34 118.10 101.32 62.68 69.36 76.01 117.00 78.13 62.95 1139.17 1139.17
RTPP IV 57.04 93.63 55.70 84.30 49.45 69.24 1.34 60.69 87.70 90.20 61.95 43.13 754.36 754.36
0.00 0.00
TOTAL THERMAL 753.21 843.24 753.61 745.47 702.24 627.01 474.15 495.71 506.54 673.66 631.41 495.13 7701.38 0.00 7701.38
APGENCO-HYDEL
MACHKUND PH AP Share 8.93 11.08 10.53 10.74 9.37 9.11 8.95 9.34 10.34 9.41 8.71 10.07 116.58 116.58
TUNGBHADRA PH AP Share 0.44 -0.05 -0.10 -0.05 5.99 8.88 9.90 8.14 3.98 6.47 5.42 5.15 54.15 54.15
Upper Sileru Power House (AP) 20.22 17.35 16.31 12.41 11.45 9.51 19.18 27.14 14.69 16.75 21.73 27.57 214.30 214.30
Lower Sileru Power House (AP) 27.28 30.38 29.97 31.49 18.90 6.38 13.09 10.93 27.65 29.40 29.08 32.17 286.73 286.73
DONKARAYI (AP) 1.87 2.09 2.81 3.63 1.64 0.00 1.10 0.07 1.98 3.09 2.84 2.92 24.03 24.03
Srisailam Right Bank Power House (AP) 9.34 -0.17 -0.17 -0.14 92.90 110.58 105.25 54.51 4.92 9.01 45.70 16.60 448.32 448.32
Ramagiri Wind Mills (AP) 0.00 0.00 0.00 0.00 0.00 0.00 0.00 0.00 0.00 0.00 0.00 0.00 0.00 0.00
Nagarjunasagar Right Bank Power House (AP) -0.01 -0.02 -0.01 -0.01 7.03 10.86 7.70 6.64 2.56 -0.01 0.00 -0.02 34.68 34.68
Penna Ahobilam (AP) 0.00 -0.01 -0.01 -0.01 -0.01 -0.01 0.00 0.12 0.05 -0.01 -0.01 0.22 0.32 0.32
MINI HYDEL(Chettipeta)-AP 0.06 0.00 0.06 0.06 0.06 0.06 0.06 0.04 0.08 0.09 0.09 0.10 0.75 0.75
Nagarjunasagar Tail Pond Dam Power House -0.04 0.97 -0.04 -0.04 2.72 7.99 8.60 5.12 0.45 0.12 0.02 -0.01 25.86 25.86
TOTAL HYDRO 68.07 61.62 59.34 58.07 150.05 163.35 173.81 122.04 66.71 74.31 113.58 94.77 1205.72 0.00 1205.72
TOTAL APGENCO 821.28 904.86 812.95 803.54 852.29 790.36 647.96 617.75 573.24 747.98 744.99 589.90 8907.10 0.00 8907.10
CGS
NTPC
NTPC (SR)
NTPC (SR)-Ramagundam Stage1&2 54.23 55.17 46.95 58.46 51.14 65.57 43.66 53.87 51.37 59.67 56.12 58.29 654.51 654.51
NTPC (SR)-Ramagundam Stage 3 15.31 14.06 13.54 16.68 14.05 18.45 13.09 16.28 17.34 16.38 15.49 2.20 172.86 172.86
Total NTPC(SR) 69.54 69.23 60.49 75.14 65.19 84.02 56.75 70.15 68.71 76.05 71.61 60.49 827.38 0.00 827.38
NTPC (ER)
Talcher - Stage 1 0.00 0.00 0.00 0.00 0.00 0.00 0.00 0.00 0.00 0.00 0.00 0.00 0.00 0.00
Talcher Stage 2 37.20 34.89 29.31 30.05 16.54 19.90 25.26 34.22 40.75 40.42 38.47 40.69 387.70 387.70
Total NTPC (ER) 37.20 34.89 29.31 30.05 16.54 19.90 25.26 34.22 40.75 40.42 38.47 40.69 387.70 0.00 387.70
Gross Energy Availability (MU)
Generating StationPLF
(%)
D
Link
Net Energy
Availability
(MU)
Energy Availability
Variable
Cost (Rs. /
kWh)
Yearly
Auxiliary
Consumptio
n (MU)
159

April May June July AugustSeptemb
erOctober November December January February March Total
Gross Energy Availability (MU)
Generating StationPLF
(%)
D
Link
Net Energy
Availability
(MU)
Variable
Cost (Rs. /
kWh)
Yearly
Auxiliary
Consumptio
n (MU)
NTPC (WR) 0.00
NTPC WR 0.00 0.00 0.00 0.00 0.00 109.30 0.00 0.00 0.00 0.00 0.00 0.00 109.30 109.30
NTPC (WR) 0.00 0.00 0.00 0.00 0.00 109.30 0.00 0.00 0.00 0.00 0.00 0.00 109.30 0.00 109.30
Total NTPC 106.74 104.12 89.80 105.19 81.73 213.23 82.01 104.37 109.46 116.47 110.08 101.18 1324.37 0.00 1324.37
NLC TS-II 0.00 0.00
Stage-I 10.08 9.29 9.20 10.56 7.21 8.47 8.77 9.94 8.75 10.06 9.96 10.69 112.97 112.97
Stage-II 18.85 14.56 10.61 15.89 15.21 13.79 14.13 18.30 18.53 19.26 17.84 18.43 195.40 195.40
Total NLC 28.92 23.86 19.81 26.45 22.42 22.26 22.90 28.24 27.28 29.32 27.80 29.12 308.38 0.00 308.38
NPC 0.00 0.00
NPC-MAPS 1.07 1.71 1.81 1.87 1.95 1.66 1.76 1.74 1.74 1.50 1.86 1.88 20.56 20.56
NPC-Kaiga unit I&ii 26.17 27.73 23.49 24.63 20.01 25.44 27.11 21.80 27.94 24.66 21.45 26.65 297.09 297.09
NPC-Kaiga unit III&IV 0.00 0.00
Total NPC 27.24 29.44 25.30 26.50 21.96 27.10 28.88 23.54 29.69 26.16 23.31 28.53 317.65 0.00 317.65
NTPC - Simhadri
NTPC Simhadri Stage I 89.84 62.32 36.95 70.98 38.29 111.28 120.22 117.11 90.68 94.74 82.06 84.37 998.83 998.83
NTPC Simhadri Stage II 27.51 32.54 25.75 41.18 27.13 41.36 7.04 29.12 45.72 43.60 36.98 40.34 398.27 398.27
Total NTPC- Simhadri 117.35 94.86 62.70 112.15 65.42 152.63 127.25 146.23 136.40 138.34 119.05 124.71 1397.10 1397.10
CGS - New
Vallur Thermal Power Plant 8.45 10.84 11.13 12.85 7.54 11.53 6.49 13.17 11.25 14.33 11.46 9.86 128.89 128.89
Kudigi 9.15 16.78 4.17 30.94 52.50 46.71 15.38 0.03 8.51 13.69 25.80 27.61 251.25 251.25
NLC Tamilnadu Power Ltd Stage.1 11.40 9.08 7.85 14.02 20.33 21.71 11.17 19.81 28.03 27.53 25.76 25.40 222.08 222.08
NLC NNTPS 0.00 0.00 0.00 0.00 0.00 0.00 0.00 0.00 0.07 2.65 4.02 2.78 9.51 9.51
0.00 0.00
0.00 0.00
TOTAL CGS 309.24 288.98 220.76 328.10 271.89 495.17 294.09 335.38 350.68 368.48 347.27 349.19 3959.23 0.00 3959.23
APGPCL
APGPCL I - Allocated capacity 0.60 0.57 0.60 1.00 1.18 0.73 0.62 0.62 0.65 0.65 1.03 1.14 9.39 9.39
APGPCL II - Allocated capacity 1.90 1.81 1.89 3.62 4.19 2.43 2.03 1.98 2.08 4.72 7.59 7.94 42.18 42.18
Total APGPCL 2.50 2.38 2.49 4.62 5.37 3.16 2.65 2.60 2.73 5.37 8.62 9.09 51.57 0.00 51.57
IPPS
Godavari Gas Power Plant 14.27 13.05 13.91 25.63 29.94 26.89 16.66 14.84 15.06 15.31 14.48 15.04 215.08 215.08
Spectrum 18.52 11.86 17.14 12.79 14.99 25.36 15.05 10.81 15.08 14.79 14.27 14.94 185.61 185.61
Kondapalli (Gas) 39.84 30.01 24.91 4.09 0.00 0.00 25.86 18.19 28.41 30.44 26.11 32.02 259.87 259.87
0.00 0.00
TOTAL IPPS 72.63 54.92 55.96 42.51 44.94 52.25 57.56 43.84 58.56 60.54 54.86 62.00 660.56 0.00 660.56
NCE - Bio Mass 0.58 0.17 0.07 0.34 0.00 0.99 0.00 0.00 0.00 0.51 2.05 1.36 6.07 6.07
NCE - Bagasse 3.66 1.42 1.33 0.50 0.00 0.00 0.00 0.00 3.63 7.03 6.24 5.29 29.10 29.10
NCE - Industrial Waste 1.31 0.78 0.78 1.70 1.49 1.57 1.27 1.47 0.11 1.79 1.92 0.95 15.14 15.14
NCE - Wind Power 0.00 0.00 0.00 0.00 0.00 0.00 0.00 0.00 0.00 0.00 0.00 0.00 0.00 0.00
160
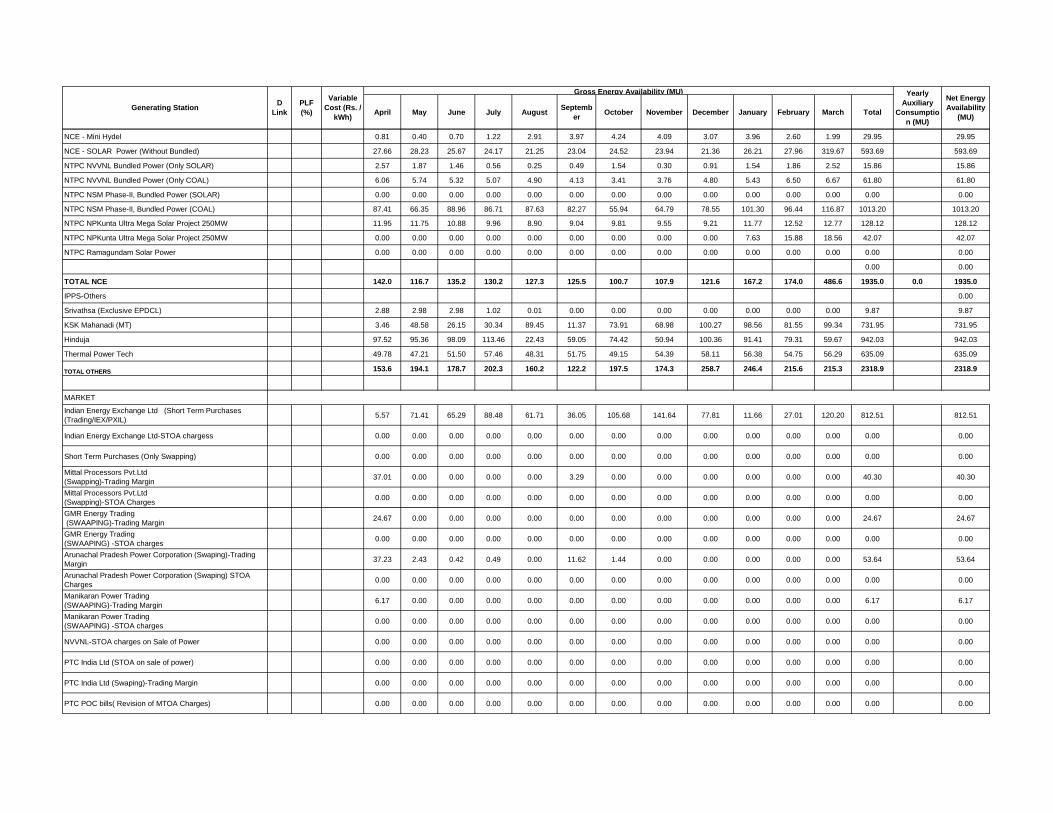
April May June July AugustSeptemb
erOctober November December January February March Total
Gross Energy Availability (MU)
Generating StationPLF
(%)
D
Link
Net Energy
Availability
(MU)
Variable
Cost (Rs. /
kWh)
Yearly
Auxiliary
Consumptio
n (MU)
NCE - Mini Hydel 0.81 0.40 0.70 1.22 2.91 3.97 4.24 4.09 3.07 3.96 2.60 1.99 29.95 29.95
NCE - SOLAR Power (Without Bundled) 27.66 28.23 25.67 24.17 21.25 23.04 24.52 23.94 21.36 26.21 27.96 319.67 593.69 593.69
NTPC NVVNL Bundled Power (Only SOLAR) 2.57 1.87 1.46 0.56 0.25 0.49 1.54 0.30 0.91 1.54 1.86 2.52 15.86 15.86
NTPC NVVNL Bundled Power (Only COAL) 6.06 5.74 5.32 5.07 4.90 4.13 3.41 3.76 4.80 5.43 6.50 6.67 61.80 61.80
NTPC NSM Phase-II, Bundled Power (SOLAR) 0.00 0.00 0.00 0.00 0.00 0.00 0.00 0.00 0.00 0.00 0.00 0.00 0.00 0.00
NTPC NSM Phase-II, Bundled Power (COAL) 87.41 66.35 88.96 86.71 87.63 82.27 55.94 64.79 78.55 101.30 96.44 116.87 1013.20 1013.20
NTPC NPKunta Ultra Mega Solar Project 250MW 11.95 11.75 10.88 9.96 8.90 9.04 9.81 9.55 9.21 11.77 12.52 12.77 128.12 128.12
NTPC NPKunta Ultra Mega Solar Project 250MW 0.00 0.00 0.00 0.00 0.00 0.00 0.00 0.00 0.00 7.63 15.88 18.56 42.07 42.07
NTPC Ramagundam Solar Power 0.00 0.00 0.00 0.00 0.00 0.00 0.00 0.00 0.00 0.00 0.00 0.00 0.00 0.00
0.00 0.00
TOTAL NCE 142.0 116.7 135.2 130.2 127.3 125.5 100.7 107.9 121.6 167.2 174.0 486.6 1935.0 0.0 1935.0
IPPS-Others 0.00
Srivathsa (Exclusive EPDCL) 2.88 2.98 2.98 1.02 0.01 0.00 0.00 0.00 0.00 0.00 0.00 0.00 9.87 9.87
KSK Mahanadi (MT) 3.46 48.58 26.15 30.34 89.45 11.37 73.91 68.98 100.27 98.56 81.55 99.34 731.95 731.95
Hinduja 97.52 95.36 98.09 113.46 22.43 59.05 74.42 50.94 100.36 91.41 79.31 59.67 942.03 942.03
Thermal Power Tech 49.78 47.21 51.50 57.46 48.31 51.75 49.15 54.39 58.11 56.38 54.75 56.29 635.09 635.09
TOTAL OTHERS 153.6 194.1 178.7 202.3 160.2 122.2 197.5 174.3 258.7 246.4 215.6 215.3 2318.9 2318.9
MARKET
Indian Energy Exchange Ltd (Short Term Purchases
(Trading/IEX/PXIL)5.57 71.41 65.29 88.48 61.71 36.05 105.68 141.64 77.81 11.66 27.01 120.20 812.51 812.51
Indian Energy Exchange Ltd-STOA chargess 0.00 0.00 0.00 0.00 0.00 0.00 0.00 0.00 0.00 0.00 0.00 0.00 0.00 0.00
Short Term Purchases (Only Swapping) 0.00 0.00 0.00 0.00 0.00 0.00 0.00 0.00 0.00 0.00 0.00 0.00 0.00 0.00
Mittal Processors Pvt.Ltd
(Swapping)-Trading Margin37.01 0.00 0.00 0.00 0.00 3.29 0.00 0.00 0.00 0.00 0.00 0.00 40.30 40.30
Mittal Processors Pvt.Ltd
(Swapping)-STOA Charges0.00 0.00 0.00 0.00 0.00 0.00 0.00 0.00 0.00 0.00 0.00 0.00 0.00 0.00
GMR Energy Trading
(SWAAPING)-Trading Margin24.67 0.00 0.00 0.00 0.00 0.00 0.00 0.00 0.00 0.00 0.00 0.00 24.67 24.67
GMR Energy Trading
(SWAAPING) -STOA charges0.00 0.00 0.00 0.00 0.00 0.00 0.00 0.00 0.00 0.00 0.00 0.00 0.00 0.00
Arunachal Pradesh Power Corporation (Swaping)-Trading
Margin37.23 2.43 0.42 0.49 0.00 11.62 1.44 0.00 0.00 0.00 0.00 0.00 53.64 53.64
Arunachal Pradesh Power Corporation (Swaping) STOA
Charges0.00 0.00 0.00 0.00 0.00 0.00 0.00 0.00 0.00 0.00 0.00 0.00 0.00 0.00
Manikaran Power Trading
(SWAAPING)-Trading Margin6.17 0.00 0.00 0.00 0.00 0.00 0.00 0.00 0.00 0.00 0.00 0.00 6.17 6.17
Manikaran Power Trading
(SWAAPING) -STOA charges0.00 0.00 0.00 0.00 0.00 0.00 0.00 0.00 0.00 0.00 0.00 0.00 0.00 0.00
NVVNL-STOA charges on Sale of Power 0.00 0.00 0.00 0.00 0.00 0.00 0.00 0.00 0.00 0.00 0.00 0.00 0.00 0.00
PTC India Ltd (STOA on sale of power) 0.00 0.00 0.00 0.00 0.00 0.00 0.00 0.00 0.00 0.00 0.00 0.00 0.00 0.00
PTC India Ltd (Swaping)-Trading Margin 0.00 0.00 0.00 0.00 0.00 0.00 0.00 0.00 0.00 0.00 0.00 0.00 0.00 0.00
PTC POC bills( Revision of MTOA Charges) 0.00 0.00 0.00 0.00 0.00 0.00 0.00 0.00 0.00 0.00 0.00 0.00 0.00 0.00
161
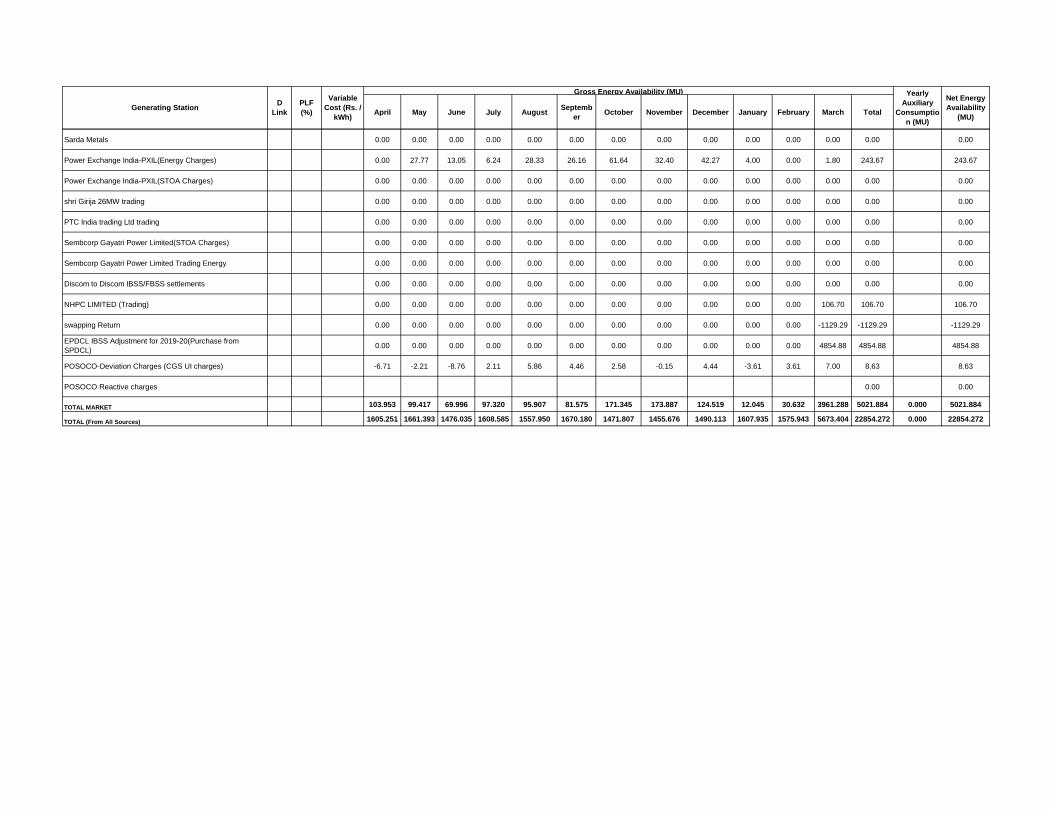
April May June July AugustSeptemb
erOctober November December January February March Total
Gross Energy Availability (MU)
Generating StationPLF
(%)
D
Link
Net Energy
Availability
(MU)
Variable
Cost (Rs. /
kWh)
Yearly
Auxiliary
Consumptio
n (MU)
Sarda Metals 0.00 0.00 0.00 0.00 0.00 0.00 0.00 0.00 0.00 0.00 0.00 0.00 0.00 0.00
Power Exchange India-PXIL(Energy Charges) 0.00 27.77 13.05 6.24 28.33 26.16 61.64 32.40 42.27 4.00 0.00 1.80 243.67 243.67
Power Exchange India-PXIL(STOA Charges) 0.00 0.00 0.00 0.00 0.00 0.00 0.00 0.00 0.00 0.00 0.00 0.00 0.00 0.00
shri Girija 26MW trading 0.00 0.00 0.00 0.00 0.00 0.00 0.00 0.00 0.00 0.00 0.00 0.00 0.00 0.00
PTC India trading Ltd trading 0.00 0.00 0.00 0.00 0.00 0.00 0.00 0.00 0.00 0.00 0.00 0.00 0.00 0.00
Sembcorp Gayatri Power Limited(STOA Charges) 0.00 0.00 0.00 0.00 0.00 0.00 0.00 0.00 0.00 0.00 0.00 0.00 0.00 0.00
Sembcorp Gayatri Power Limited Trading Energy 0.00 0.00 0.00 0.00 0.00 0.00 0.00 0.00 0.00 0.00 0.00 0.00 0.00 0.00
Discom to Discom IBSS/FBSS settlements 0.00 0.00 0.00 0.00 0.00 0.00 0.00 0.00 0.00 0.00 0.00 0.00 0.00 0.00
NHPC LIMITED (Trading) 0.00 0.00 0.00 0.00 0.00 0.00 0.00 0.00 0.00 0.00 0.00 106.70 106.70 106.70
swapping Return 0.00 0.00 0.00 0.00 0.00 0.00 0.00 0.00 0.00 0.00 0.00 -1129.29 -1129.29 -1129.29
EPDCL IBSS Adjustment for 2019-20(Purchase from
SPDCL)0.00 0.00 0.00 0.00 0.00 0.00 0.00 0.00 0.00 0.00 0.00 4854.88 4854.88 4854.88
POSOCO-Deviation Charges (CGS UI charges) -6.71 -2.21 -8.76 2.11 5.86 4.46 2.58 -0.15 4.44 -3.61 3.61 7.00 8.63 8.63
POSOCO Reactive charges 0.00 0.00
TOTAL MARKET 103.953 99.417 69.996 97.320 95.907 81.575 171.345 173.887 124.519 12.045 30.632 3961.288 5021.884 0.000 5021.884
TOTAL (From All Sources) 1605.251 1661.393 1476.035 1608.585 1557.950 1670.180 1471.807 1455.676 1490.113 1607.935 1575.943 5673.404 22854.272 0.000 22854.272
162
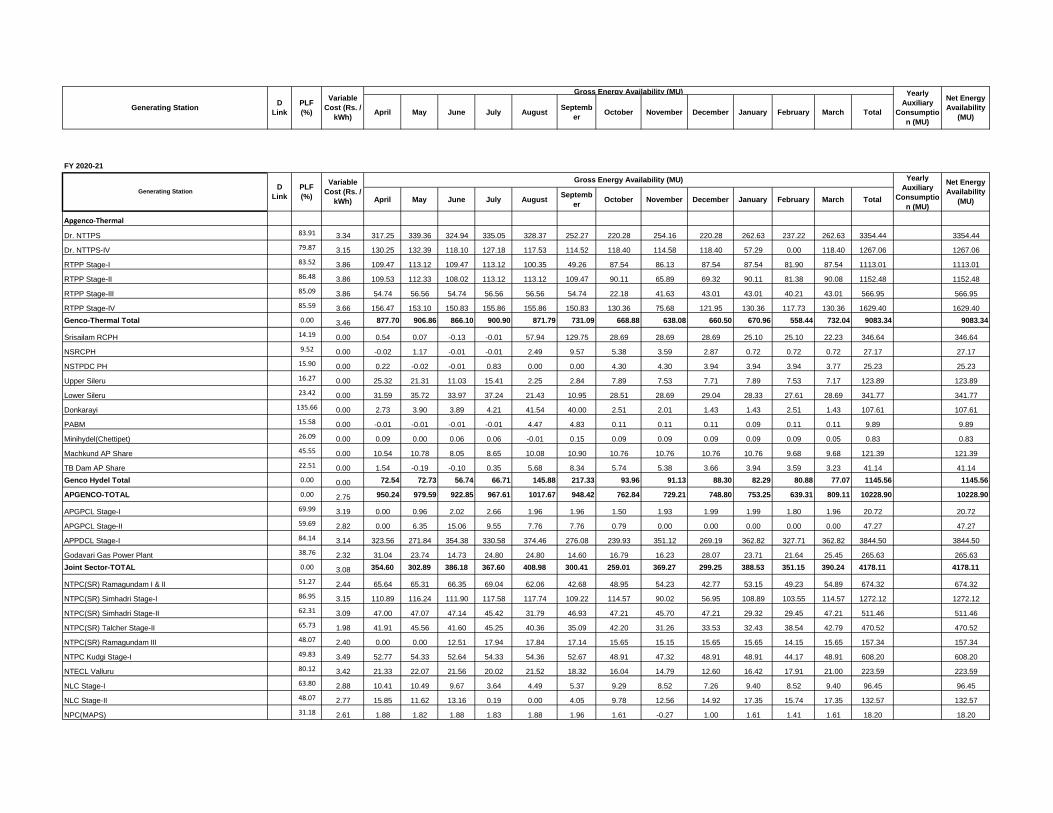
April May June July AugustSeptemb
erOctober November December January February March Total
Gross Energy Availability (MU)
Generating StationPLF
(%)
D
Link
Net Energy
Availability
(MU)
Variable
Cost (Rs. /
kWh)
Yearly
Auxiliary
Consumptio
n (MU)
FY 2020-21
April May June July AugustSeptemb
erOctober November December January February March Total
Apgenco-Thermal
Dr. NTTPS 83.91 3.34 317.25 339.36 324.94 335.05 328.37 252.27 220.28 254.16 220.28 262.63 237.22 262.63 3354.44 3354.44
Dr. NTTPS-IV 79.87 3.15 130.25 132.39 118.10 127.18 117.53 114.52 118.40 114.58 118.40 57.29 0.00 118.40 1267.06 1267.06
RTPP Stage-I 83.52 3.86 109.47 113.12 109.47 113.12 100.35 49.26 87.54 86.13 87.54 87.54 81.90 87.54 1113.01 1113.01
RTPP Stage-II 86.48 3.86 109.53 112.33 108.02 113.12 113.12 109.47 90.11 65.89 69.32 90.11 81.38 90.08 1152.48 1152.48
RTPP Stage-III 85.09 3.86 54.74 56.56 54.74 56.56 56.56 54.74 22.18 41.63 43.01 43.01 40.21 43.01 566.95 566.95
RTPP Stage-IV 85.59 3.66 156.47 153.10 150.83 155.86 155.86 150.83 130.36 75.68 121.95 130.36 117.73 130.36 1629.40 1629.40
Genco-Thermal Total 0.00 3.46 877.70 906.86 866.10 900.90 871.79 731.09 668.88 638.08 660.50 670.96 558.44 732.04 9083.34 9083.34
Srisailam RCPH 14.19 0.00 0.54 0.07 -0.13 -0.01 57.94 129.75 28.69 28.69 28.69 25.10 25.10 22.23 346.64 346.64
NSRCPH 9.52 0.00 -0.02 1.17 -0.01 -0.01 2.49 9.57 5.38 3.59 2.87 0.72 0.72 0.72 27.17 27.17
NSTPDC PH 15.90 0.00 0.22 -0.02 -0.01 0.83 0.00 0.00 4.30 4.30 3.94 3.94 3.94 3.77 25.23 25.23
Upper Sileru 16.27 0.00 25.32 21.31 11.03 15.41 2.25 2.84 7.89 7.53 7.71 7.89 7.53 7.17 123.89 123.89
Lower Sileru 23.42 0.00 31.59 35.72 33.97 37.24 21.43 10.95 28.51 28.69 29.04 28.33 27.61 28.69 341.77 341.77
Donkarayi 135.66 0.00 2.73 3.90 3.89 4.21 41.54 40.00 2.51 2.01 1.43 1.43 2.51 1.43 107.61 107.61
PABM 15.58 0.00 -0.01 -0.01 -0.01 -0.01 4.47 4.83 0.11 0.11 0.11 0.09 0.11 0.11 9.89 9.89
Minihydel(Chettipet) 26.09 0.00 0.09 0.00 0.06 0.06 -0.01 0.15 0.09 0.09 0.09 0.09 0.09 0.05 0.83 0.83
Machkund AP Share 45.55 0.00 10.54 10.78 8.05 8.65 10.08 10.90 10.76 10.76 10.76 10.76 9.68 9.68 121.39 121.39
TB Dam AP Share 22.51 0.00 1.54 -0.19 -0.10 0.35 5.68 8.34 5.74 5.38 3.66 3.94 3.59 3.23 41.14 41.14
Genco Hydel Total 0.00 0.00 72.54 72.73 56.74 66.71 145.88 217.33 93.96 91.13 88.30 82.29 80.88 77.07 1145.56 1145.56
APGENCO-TOTAL 0.00 2.75 950.24 979.59 922.85 967.61 1017.67 948.42 762.84 729.21 748.80 753.25 639.31 809.11 10228.90 10228.90
APGPCL Stage-I 69.99 3.19 0.00 0.96 2.02 2.66 1.96 1.96 1.50 1.93 1.99 1.99 1.80 1.96 20.72 20.72
APGPCL Stage-II 59.69 2.82 0.00 6.35 15.06 9.55 7.76 7.76 0.79 0.00 0.00 0.00 0.00 0.00 47.27 47.27
APPDCL Stage-I 84.14 3.14 323.56 271.84 354.38 330.58 374.46 276.08 239.93 351.12 269.19 362.82 327.71 362.82 3844.50 3844.50
Godavari Gas Power Plant 38.76 2.32 31.04 23.74 14.73 24.80 24.80 14.60 16.79 16.23 28.07 23.71 21.64 25.45 265.63 265.63
Joint Sector-TOTAL 0.00 3.08 354.60 302.89 386.18 367.60 408.98 300.41 259.01 369.27 299.25 388.53 351.15 390.24 4178.11 4178.11
NTPC(SR) Ramagundam I & II 51.27 2.44 65.64 65.31 66.35 69.04 62.06 42.68 48.95 54.23 42.77 53.15 49.23 54.89 674.32 674.32
NTPC(SR) Simhadri Stage-I 86.95 3.15 110.89 116.24 111.90 117.58 117.74 109.22 114.57 90.02 56.95 108.89 103.55 114.57 1272.12 1272.12
NTPC(SR) Simhadri Stage-II 62.31 3.09 47.00 47.07 47.14 45.42 31.79 46.93 47.21 45.70 47.21 29.32 29.45 47.21 511.46 511.46
NTPC(SR) Talcher Stage-II 65.73 1.98 41.91 45.56 41.60 45.25 40.36 35.09 42.20 31.26 33.53 32.43 38.54 42.79 470.52 470.52
NTPC(SR) Ramagundam III 48.07 2.40 0.00 0.00 12.51 17.94 17.84 17.14 15.65 15.15 15.65 15.65 14.15 15.65 157.34 157.34
NTPC Kudgi Stage-I 49.83 3.49 52.77 54.33 52.64 54.33 54.36 52.67 48.91 47.32 48.91 48.91 44.17 48.91 608.20 608.20
NTECL Valluru 80.12 3.42 21.33 22.07 21.56 20.02 21.52 18.32 16.04 14.79 12.60 16.42 17.91 21.00 223.59 223.59
NLC Stage-I 63.80 2.88 10.41 10.49 9.67 3.64 4.49 5.37 9.29 8.52 7.26 9.40 8.52 9.40 96.45 96.45
NLC Stage-II 48.07 2.77 15.85 11.62 13.16 0.19 0.00 4.05 9.78 12.56 14.92 17.35 15.74 17.35 132.57 132.57
NPC(MAPS) 31.18 2.61 1.88 1.82 1.88 1.83 1.88 1.96 1.61 -0.27 1.00 1.61 1.41 1.61 18.20 18.20
Yearly
Auxiliary
Consumptio
n (MU)
Net Energy
Availability
(MU)
Generating StationD
Link
PLF
(%)
Variable
Cost (Rs. /
kWh)
Gross Energy Availability (MU)
163

April May June July AugustSeptemb
erOctober November December January February March Total
Gross Energy Availability (MU)
Generating StationPLF
(%)
D
Link
Net Energy
Availability
(MU)
Variable
Cost (Rs. /
kWh)
Yearly
Auxiliary
Consumptio
n (MU)
NPC(KAIGA unit I,II,III,IV) 77.89 3.48 19.74 23.42 28.32 28.90 29.56 28.45 26.79 24.26 16.43 19.88 17.29 24.19 287.22 287.22
NTPL(NLC TamilNadu) 85.47 2.90 30.17 30.48 30.62 28.30 26.20 30.48 29.70 28.98 21.01 21.73 26.80 29.70 334.18 334.18
NLC NNTPS 111.05 2.34 4.59 5.53 4.15 5.51 2.03 4.72 11.33 10.96 11.33 11.33 10.23 11.33 93.02 93.02
JNNSM Ph-1 Thermal 0.00 3.58 4.76 4.38 6.39 5.97 4.10 3.58 8.53 8.33 8.05 7.93 7.53 8.80 78.35 78.35
JNNSM Ph-2 Thermal 0.00 2.81 73.98 79.25 77.09 90.55 81.38 87.17 108.39 105.60 103.18 101.35 96.02 111.35 1115.32 1115.32
CGS TOTAL 0.00 2.87 500.94 517.57 524.97 534.44 495.32 487.85 538.93 497.39 440.79 495.35 480.56 558.74 6072.85 6072.85
KSK Mahanadi 0.00 2.96 77.39 87.26 98.06 30.82 0.00 0.00 0.00 0.00 0.00 0.00 0.00 0.00 293.53 293.53
Thermal Powertech Corporation 0.00 2.33 60.12 62.12 39.79 15.39 45.52 59.92 62.13 60.13 62.13 62.13 56.12 62.13 647.62 647.62
Hinduja National Powercorp 0.00 3.82 54.34 99.24 133.44 98.42 0.00 0.00 0.00 0.00 0.00 0.00 0.00 0.00 385.45 385.45
IPP TOTAL 0.00 2.92 191.86 248.62 271.29 144.63 45.52 59.92 62.13 60.13 62.13 62.13 56.12 62.13 1326.59 0.00 665.82
NCE- Others 0.00 5.14 5.56 3.19 2.82 4.63 4.63 5.94 7.83 10.28 13.04 13.98 12.94 10.28 95.13 95.13
NCE Wind 0.00 0.00 0.00 0.00 0.00 0.00 0.00 0.00 0.00 0.00 0.00 0.00 0.00 0.00 0.00
NCE Solar 0.00 4.47 3.73 3.72 2.99 2.94 2.87 2.75 2.62 2.84 2.43 3.09 3.42 3.70 37.10 37.10
JNNSM Ph-1 Solar 0.00 0.00 0.00 0.00 0.00 0.00 0.00 0.00 0.00 0.00 0.00 0.00 0.00 0.00 0.00
JNNSM Ph-2 Solar 0.00 0.00 0.00 0.00 0.00 0.00 0.00 0.00 0.00 0.00 0.00 0.00 0.00 0.00 0.00
NCE TOTAL 0.00 4.95 9.29 6.91 5.81 7.58 7.50 8.69 10.45 13.12 15.47 17.08 16.35 13.98 132.23 132.23
INTERSTATE TRADERS (SHORTTERM) 0.00 3.36 0.00 0.00 0.00 0.00 0.00 0.00 0.00 0.00 0.00 0.00 0.00 0.00 0.00 0.00
Spectrum Power 0.00 2.58 30.71 19.47 13.92 28.78 22.69 13.39 13.39 13.39 13.39 13.39 13.39 13.39 209.30 209.30
LANCO Kondapalli 0.00 2.52 55.49 42.61 29.86 14.60 1.50 29.55 29.55 29.55 29.55 29.55 29.55 29.55 350.87 350.87
SHORTTERM TOTAL 0.00 3.14 86.20 62.08 43.78 43.37 24.19 42.94 42.94 42.94 42.94 42.94 42.94 42.94 560.17 560.17
GRAND TOTAL 0.00 3.25 2093.14 2117.66 2154.88 2065.22 1999.17 1848.23 1676.29 1712.06 1609.38 1759.27 1586.43 1877.13 22498.86 22498.86
164

April May June July AugustSeptemb
erOctober November December January February March Total
Gross Energy Availability (MU)
Generating StationPLF
(%)
D
Link
Net Energy
Availability
(MU)
Variable
Cost (Rs. /
kWh)
Yearly
Auxiliary
Consumptio
n (MU)
FY 2021-22
April May June July August September October November December January February March Total
Apgenco-Thermal
Dr. NTTPS 73.22 3.34 251.17 259.55 251.17 259.55 256.46 208.81 217.93 251.17 217.93 259.55 234.43 259.55 2927.25 2927.25
Dr. NTTPS-IV 84.26 3.15 114.58 118.40 114.58 118.40 118.40 114.58 118.40 114.58 118.40 61.11 106.94 118.40 1336.79 1336.79
RTPP Stage-I 74.20 3.86 84.72 87.54 84.72 87.54 63.71 62.29 87.54 86.13 87.54 87.54 81.90 87.54 988.74 988.74
RTPP Stage-II 78.72 3.86 89.70 92.64 89.70 92.64 92.64 89.70 92.64 68.41 71.84 92.64 83.90 92.60 1049.06 1049.06
RTPP Stage-III 72.83 3.86 39.88 43.01 41.63 43.01 43.01 41.63 22.18 41.63 43.01 43.01 40.21 43.01 485.24 485.24
RTPP Stage-IV 74.00 3.66 126.14 130.36 126.14 130.36 130.36 126.14 130.36 0.00 130.36 130.36 117.73 130.36 1408.69 1408.69
Genco-Thermal Total 0.00 3.47 706.20 731.50 707.95 731.50 704.58 643.16 669.06 561.93 669.09 674.21 665.11 731.47 8195.78 8195.78
Srisailam RCPH 13.77 0.00 15.43 4.75 2.55 5.21 81.60 79.25 52.60 20.34 7.80 15.85 25.40 25.55 336.32 336.32
NSRCPH 14.31 0.00 0.66 0.14 0.00 0.03 3.59 9.00 8.04 7.71 5.02 3.83 1.67 1.17 40.85 40.85
NSTPDC PH 20.34 0.00 0.36 0.36 0.36 1.43 2.87 4.66 4.66 5.74 5.74 3.23 1.43 1.43 32.27 32.27
Upper Sileru 22.24 0.00 15.88 12.48 9.65 11.80 10.93 11.25 13.53 12.32 11.14 18.37 18.47 23.58 169.39 0.00 169.39
Lower Sileru 27.04 0.00 33.82 26.68 22.88 32.24 34.13 33.15 31.55 27.51 31.58 38.54 39.19 43.36 394.62 394.62
Donkarayi 46.17 0.00 2.74 2.59 1.81 2.76 2.69 3.23 3.51 2.66 3.17 3.77 3.75 3.94 36.63 36.63
PABM 3.16 0.00 0.00 0.00 0.00 0.03 0.34 0.31 0.44 0.28 0.26 0.12 0.11 0.11 2.00 2.00
Minihydel(Chettipet) 29.94 0.00 0.05 0.00 0.02 0.14 0.11 0.12 0.03 0.02 0.10 0.14 0.10 0.13 0.95 0.95
Machkund AP Share 40.04 0.00 9.14 9.55 7.92 9.03 9.62 8.84 8.67 8.32 8.49 8.96 8.67 9.50 106.72 106.72
TB Dam AP Share 24.01 0.00 1.05 0.17 0.01 1.33 6.26 7.25 6.90 5.98 3.85 4.63 3.28 3.16 43.88 43.88
Genco Hydel Total 0.00 0.00 79.13 56.73 45.20 63.99 152.13 157.06 129.92 90.89 77.14 97.42 102.09 111.92 1163.63 1163.63
APGENCO-TOTAL 0.00 2.97 785.33 788.23 753.15 795.49 856.71 800.22 798.98 652.82 746.23 771.64 767.20 843.39 9359.41 9359.41
APGPCL Stage-I 0.00 0.00 0.00 0.00 0.00 0.00 0.00 0.00 0.00 0.00 0.00 0.00 0.00 0.00 0.00
APGPCL Stage-II 0.00 0.00 0.00 0.00 0.00 0.00 0.00 0.00 0.00 0.00 0.00 0.00 0.00 0.00 0.00
APPDCL Stage-I 88.32 3.14 347.22 358.79 347.22 358.79 358.79 347.22 266.20 347.22 266.20 358.79 324.07 354.76 4035.27 4035.27
Godavari Gas Power Plant 53.87 2.10 34.12 35.29 -0.36 23.67 35.29 34.12 35.29 34.12 35.29 35.29 31.77 35.29 369.19 369.19
Joint Sector-TOTAL 0.00 3.05 381.34 394.08 346.86 382.46 394.08 381.34 301.49 381.34 301.49 394.08 355.84 390.05 4404.46 4404.46
NTPC(SR) Ramagundam I & II 50.22 2.56 59.75 58.52 50.98 52.68 53.38 53.38 55.13 53.95 52.72 52.53 55.79 61.73 660.55 660.55
NTPC(SR) Simhadri Stage-I 88.98 3.30 110.89 114.57 63.63 114.57 114.57 110.89 114.57 110.89 114.57 114.57 103.55 114.57 1301.85 1301.85
NTPC(SR) Simhadri Stage-II 63.93 3.24 34.00 27.73 45.70 47.21 47.21 45.70 47.21 45.70 47.21 47.21 42.67 47.21 524.74 524.74
NTPC(SR) Talcher Stage-II 65.27 2.08 40.83 41.72 29.44 36.27 41.72 31.98 39.31 40.77 42.29 42.29 38.17 42.39 467.21 467.21
NTPC(SR) Ramagundam III 50.43 2.52 11.56 0.00 15.15 15.65 15.65 15.15 15.65 15.15 15.65 15.65 14.15 15.65 165.07 165.07
NTPC Kudgi Stage-I 44.59 3.66 47.32 48.91 31.54 33.13 48.91 47.32 48.91 47.32 48.91 48.91 44.17 48.91 544.24 0.00 544.24
NTECL Valluru 60.85 3.59 17.88 18.48 12.52 6.74 8.83 7.07 14.02 16.96 16.51 17.53 15.83 17.43 169.80 169.80
NLC Stage-I 67.22 3.02 9.48 9.64 9.31 7.72 6.22 9.20 6.79 8.60 6.82 9.59 8.63 9.62 101.63 101.63
NLC Stage-II 68.38 2.91 17.17 13.34 13.94 15.55 17.20 13.46 16.60 13.27 16.60 17.73 15.97 17.77 188.61 188.61
NPC(MAPS) 32.15 2.74 1.53 1.61 1.53 1.61 1.61 1.53 1.61 1.53 1.61 1.61 1.41 1.61 18.77 18.77
NPC(KAIGA unit I,II,III,IV) 80.13 3.65 25.64 26.60 25.64 26.60 26.60 25.64 20.16 23.79 19.74 24.58 23.92 26.60 295.49 295.49
Net Energy
Availability Generating Station
D
Link
PLF
(%)
Variable
Cost (Rs. /
Gross Energy Availability (MU) Yearly
Auxiliary
165

April May June July AugustSeptemb
erOctober November December January February March Total
Gross Energy Availability (MU)
Generating StationPLF
(%)
D
Link
Net Energy
Availability
(MU)
Variable
Cost (Rs. /
kWh)
Yearly
Auxiliary
Consumptio
n (MU)
NTPL(NLC TamilNadu) 81.06 3.04 27.53 28.61 18.11 22.09 28.61 27.53 25.35 27.53 28.61 28.61 25.72 28.61 316.93 316.93
NLC NNTPS 159.19 2.46 10.96 11.33 10.96 11.33 11.33 10.96 11.33 10.96 11.33 11.33 10.23 11.33 133.35 133.35
JNNSM Ph-1 Thermal 0.00 3.76 8.29 7.68 7.08 7.50 8.71 8.31 8.73 8.54 8.70 8.69 8.21 9.09 99.54 99.54
JNNSM Ph-2 Thermal 0.00 2.95 105.22 99.18 92.20 97.19 110.36 105.39 110.54 107.98 110.20 109.59 103.39 114.48 1265.73 1265.73
CGS TOTAL 0.00 3.05 528.05 507.93 427.74 495.83 540.91 513.51 535.92 532.94 541.46 550.41 511.81 566.98 6253.46 6253.46
KSK Mahanadi 0.00 0.00 0.00 0.00 0.00 0.00 0.00 0.00 0.00 0.00 0.00 0.00 0.00 0.00 0.00
Thermal Powertech Corporation 0.00 2.44 51.11 52.81 51.11 52.81 52.81 51.11 52.81 40.52 52.81 52.81 47.70 52.81 611.21 611.21
Hinduja National Powercorp 0.00 0.00 0.00 0.00 0.00 0.00 0.00 0.00 0.00 0.00 0.00 0.00 0.00 0.00 0.00
IPP TOTAL 0.00 2.44 51.11 52.81 51.11 52.81 52.81 51.11 52.81 40.52 52.81 52.81 47.70 52.81 611.21 611.21
NCE- Others 19.57 5.14 8.12 6.60 5.85 7.66 7.66 8.35 10.12 13.25 17.57 17.33 16.41 13.16 132.09 132.09
NCE Wind 18.41 0.00 0.00 0.00 0.00 0.00 0.00 0.00 0.00 0.00 0.00 0.00 0.00 0.00 0.00
NCE Solar 22.19 4.47 4.85 4.83 3.86 3.76 3.67 3.57 3.48 3.65 3.16 4.01 4.38 4.72 47.94 47.94
JNNSM Ph-1 Solar 12.07 0.00 0.00 0.00 0.00 0.00 0.00 0.00 0.00 0.00 0.00 0.00 0.00 0.00 0.00
JNNSM Ph-2 Solar 27.86 5.14 0.00 0.00 0.00 0.00 0.00 0.00 0.00 0.00 0.00 0.00 0.00 0.00 0.00 0.00
NCE TOTAL 0.00 12.98 11.44 9.71 11.42 11.33 11.92 13.60 16.89 20.73 21.34 20.79 17.88 180.03 180.03
INTERSTATE TRADERS (SHORTTERM) 0.00 4.47 0.00 0.00 0.00 0.00 0.00 0.00 0.00 0.00 0.00 0.00 0.00 0.00 0.00 0.00
Spectrum Power 0.00 0.00 0.00 0.00 0.00 0.00 0.00 0.00 0.00 0.00 0.00 0.00 0.00 0.00 0.00
LANCO Kondapalli 0.00 0.00 0.00 0.00 0.00 0.00 0.00 0.00 0.00 0.00 0.00 0.00 0.00 0.00 0.00
SHORTTERM TOTAL 0.00 4.96 0.00 0.00 0.00 0.00 0.00 0.00 0.00 0.00 0.00 0.00 0.00 0.00 0.00 0.00
GRAND TOTAL 0.00 0.00 1758.80 1754.49 1588.56 1738.01 1855.84 1758.09 1702.80 1624.51 1662.72 1790.28 1703.34 1871.12 20808.57 20808.57
166

Form 4.2 Energy Dispatch
FY 2019-20
April May June July August September October November December January February March Total
APGENCO-THERMAL
VTPS I 72.01 76.52 71.74 68.42 65.79 55.87 57.69 58.91 59.99 73.59 71.20 71.97 803.70
VTPS II 72.01 76.52 71.74 68.42 65.79 55.87 57.69 58.91 59.99 73.59 71.20 71.97 803.70
VTPS III 72.01 76.52 71.74 68.42 65.79 55.87 57.69 58.91 59.99 73.59 71.20 71.97 803.70
VTPS IV 103.08 88.85 97.54 91.61 93.16 79.23 69.80 71.02 82.88 90.52 87.93 68.54 1024.17
RTPP I 66.55 69.99 58.90 53.49 28.44 33.28 30.24 15.73 0.94 0.00 55.48 4.48 417.51
RTPP Stage-II 64.83 72.04 72.19 72.71 65.86 72.85 59.06 30.32 3.36 38.17 35.11 37.34 623.85
RTPP Stage-III 24.45 36.61 33.29 25.41 31.76 2.17 15.27 2.51 -0.34 0.00 21.09 -0.18 192.05
Damodaram Sanjeevaiah Thermal power
plant - I110.62 126.28 110.39 106.34 118.10 101.32 62.68 69.36 76.01 117.00 78.13 62.95 1139.17
Damodaram Sanjeevaiah Thermal power
plant - II110.62 126.28 110.39 106.34 118.10 101.32 62.68 69.36 76.01 117.00 78.13 62.95 1139.17
RTPP IV 57.04 93.63 55.70 84.30 49.45 69.24 1.34 60.69 87.70 90.20 61.95 43.13 754.36
0.00
0.00
TOTAL THERMAL 753.21 843.24 753.61 745.47 702.24 627.01 474.15 495.71 506.54 673.66 631.41 495.13 7701.38
APGENCO-HYDEL
MACHKUND PH AP Share 8.93 11.08 10.53 10.74 9.37 9.11 8.95 9.34 10.34 9.41 8.71 10.07 116.58
TUNGBHADRA PH AP Share 0.44 -0.05 -0.10 -0.05 5.99 8.88 9.90 8.14 3.98 6.47 5.42 5.15 54.15
Upper Sileru Power House (AP) 20.22 17.35 16.31 12.41 11.45 9.51 19.18 27.14 14.69 16.75 21.73 27.57 214.30
Lower Sileru Power House (AP) 27.28 30.38 29.97 31.49 18.90 6.38 13.09 10.93 27.65 29.40 29.08 32.17 286.73
DONKARAYI (AP) 1.87 2.09 2.81 3.63 1.64 0.00 1.10 0.07 1.98 3.09 2.84 2.92 24.03
Srisailam Right Bank Power House (AP) 9.34 -0.17 -0.17 -0.14 92.90 110.58 105.25 54.51 4.92 9.01 45.70 16.60 448.32
Ramagiri Wind Mills (AP) 0.00 0.00 0.00 0.00 0.00 0.00 0.00 0.00 0.00 0.00 0.00 0.00 0.00
Nagarjunasagar Right Bank Power House
(AP)-0.01 -0.02 -0.01 -0.01 7.03 10.86 7.70 6.64 2.56 -0.01 0.00 -0.02 34.68
Penna Ahobilam (AP) 0.00 -0.01 -0.01 -0.01 -0.01 -0.01 0.00 0.12 0.05 -0.01 -0.01 0.22 0.32
MINI HYDEL(Chettipeta)-AP 0.06 0.00 0.06 0.06 0.06 0.06 0.06 0.04 0.08 0.09 0.09 0.10 0.75
Nagarjunasagar Tail Pond Dam Power
House-0.04 0.97 -0.04 -0.04 2.72 7.99 8.60 5.12 0.45 0.12 0.02 -0.01 25.86
1205.72
TOTAL HYDRO 68.07 61.62 59.34 58.07 150.05 163.35 173.81 122.04 66.71 74.31 113.58 94.77 8907.10
TOTAL APGENCO 821.28 904.86 812.95 803.54 852.29 790.36 647.96 617.75 573.24 747.98 744.99 589.90 8907.10
Generating Station D Link
Variable
Cost (Rs. /
kWh)
Energy Dispatch (MU)
167
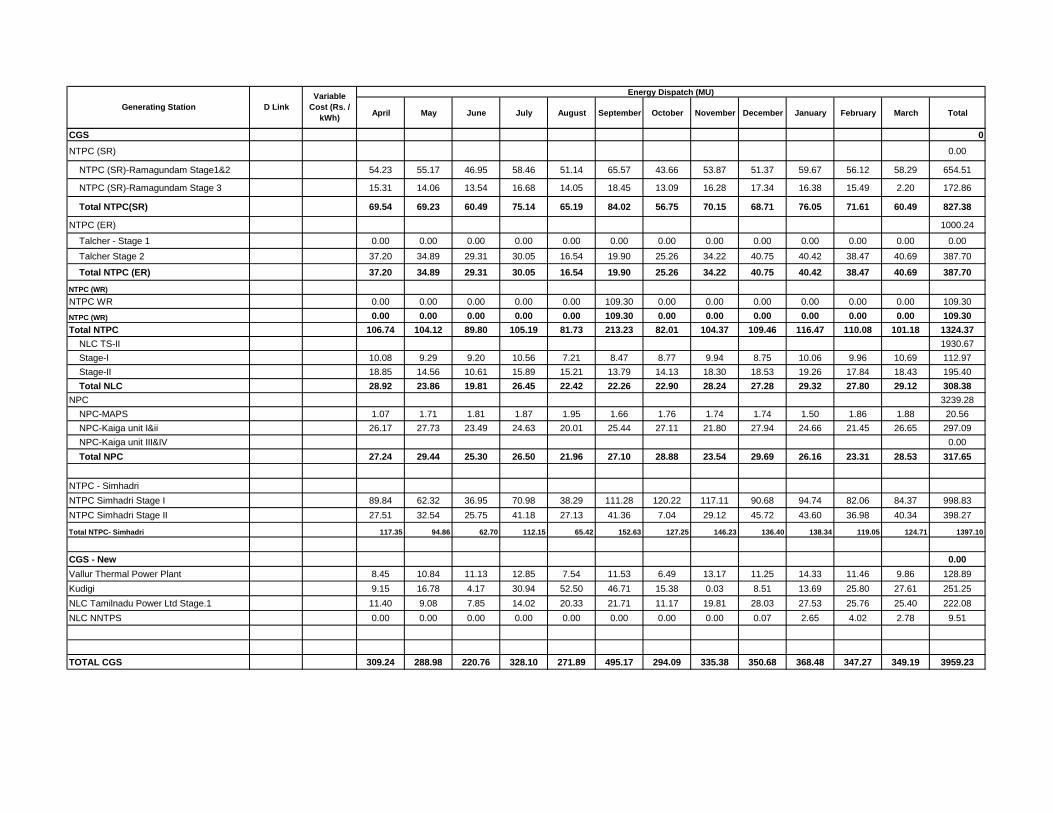
April May June July August September October November December January February March TotalGenerating Station D Link
Variable
Cost (Rs. /
kWh)
Energy Dispatch (MU)
CGS 0
NTPC (SR) 0.00
NTPC (SR)-Ramagundam Stage1&2 54.23 55.17 46.95 58.46 51.14 65.57 43.66 53.87 51.37 59.67 56.12 58.29 654.51
NTPC (SR)-Ramagundam Stage 3 15.31 14.06 13.54 16.68 14.05 18.45 13.09 16.28 17.34 16.38 15.49 2.20 172.86
Total NTPC(SR) 69.54 69.23 60.49 75.14 65.19 84.02 56.75 70.15 68.71 76.05 71.61 60.49 827.38
NTPC (ER) 1000.24
Talcher - Stage 1 0.00 0.00 0.00 0.00 0.00 0.00 0.00 0.00 0.00 0.00 0.00 0.00 0.00
Talcher Stage 2 37.20 34.89 29.31 30.05 16.54 19.90 25.26 34.22 40.75 40.42 38.47 40.69 387.70
Total NTPC (ER) 37.20 34.89 29.31 30.05 16.54 19.90 25.26 34.22 40.75 40.42 38.47 40.69 387.70
NTPC (WR)
NTPC WR 0.00 0.00 0.00 0.00 0.00 109.30 0.00 0.00 0.00 0.00 0.00 0.00 109.30
NTPC (WR) 0.00 0.00 0.00 0.00 0.00 109.30 0.00 0.00 0.00 0.00 0.00 0.00 109.30
Total NTPC 106.74 104.12 89.80 105.19 81.73 213.23 82.01 104.37 109.46 116.47 110.08 101.18 1324.37
NLC TS-II 1930.67
Stage-I 10.08 9.29 9.20 10.56 7.21 8.47 8.77 9.94 8.75 10.06 9.96 10.69 112.97
Stage-II 18.85 14.56 10.61 15.89 15.21 13.79 14.13 18.30 18.53 19.26 17.84 18.43 195.40
Total NLC 28.92 23.86 19.81 26.45 22.42 22.26 22.90 28.24 27.28 29.32 27.80 29.12 308.38
NPC 3239.28
NPC-MAPS 1.07 1.71 1.81 1.87 1.95 1.66 1.76 1.74 1.74 1.50 1.86 1.88 20.56
NPC-Kaiga unit I&ii 26.17 27.73 23.49 24.63 20.01 25.44 27.11 21.80 27.94 24.66 21.45 26.65 297.09
NPC-Kaiga unit III&IV 0.00
Total NPC 27.24 29.44 25.30 26.50 21.96 27.10 28.88 23.54 29.69 26.16 23.31 28.53 317.65
NTPC - Simhadri
NTPC Simhadri Stage I 89.84 62.32 36.95 70.98 38.29 111.28 120.22 117.11 90.68 94.74 82.06 84.37 998.83
NTPC Simhadri Stage II 27.51 32.54 25.75 41.18 27.13 41.36 7.04 29.12 45.72 43.60 36.98 40.34 398.27
Total NTPC- Simhadri 117.35 94.86 62.70 112.15 65.42 152.63 127.25 146.23 136.40 138.34 119.05 124.71 1397.10
CGS - New 0.00
Vallur Thermal Power Plant 8.45 10.84 11.13 12.85 7.54 11.53 6.49 13.17 11.25 14.33 11.46 9.86 128.89
Kudigi 9.15 16.78 4.17 30.94 52.50 46.71 15.38 0.03 8.51 13.69 25.80 27.61 251.25
NLC Tamilnadu Power Ltd Stage.1 11.40 9.08 7.85 14.02 20.33 21.71 11.17 19.81 28.03 27.53 25.76 25.40 222.08
NLC NNTPS 0.00 0.00 0.00 0.00 0.00 0.00 0.00 0.00 0.07 2.65 4.02 2.78 9.51
TOTAL CGS 309.24 288.98 220.76 328.10 271.89 495.17 294.09 335.38 350.68 368.48 347.27 349.19 3959.23
168
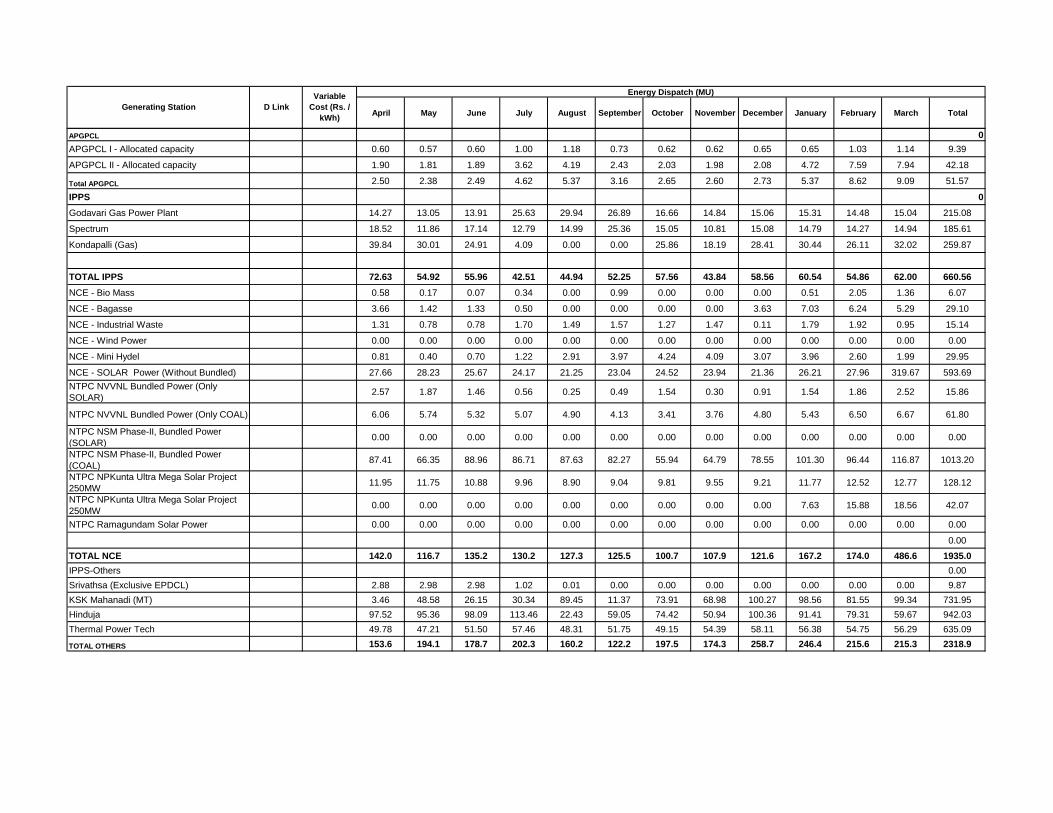
April May June July August September October November December January February March TotalGenerating Station D Link
Variable
Cost (Rs. /
kWh)
Energy Dispatch (MU)
APGPCL 0
APGPCL I - Allocated capacity 0.60 0.57 0.60 1.00 1.18 0.73 0.62 0.62 0.65 0.65 1.03 1.14 9.39
APGPCL II - Allocated capacity 1.90 1.81 1.89 3.62 4.19 2.43 2.03 1.98 2.08 4.72 7.59 7.94 42.18
Total APGPCL 2.50 2.38 2.49 4.62 5.37 3.16 2.65 2.60 2.73 5.37 8.62 9.09 51.57
IPPS 0
Godavari Gas Power Plant 14.27 13.05 13.91 25.63 29.94 26.89 16.66 14.84 15.06 15.31 14.48 15.04 215.08
Spectrum 18.52 11.86 17.14 12.79 14.99 25.36 15.05 10.81 15.08 14.79 14.27 14.94 185.61
Kondapalli (Gas) 39.84 30.01 24.91 4.09 0.00 0.00 25.86 18.19 28.41 30.44 26.11 32.02 259.87
TOTAL IPPS 72.63 54.92 55.96 42.51 44.94 52.25 57.56 43.84 58.56 60.54 54.86 62.00 660.56
NCE - Bio Mass 0.58 0.17 0.07 0.34 0.00 0.99 0.00 0.00 0.00 0.51 2.05 1.36 6.07
NCE - Bagasse 3.66 1.42 1.33 0.50 0.00 0.00 0.00 0.00 3.63 7.03 6.24 5.29 29.10
NCE - Industrial Waste 1.31 0.78 0.78 1.70 1.49 1.57 1.27 1.47 0.11 1.79 1.92 0.95 15.14
NCE - Wind Power 0.00 0.00 0.00 0.00 0.00 0.00 0.00 0.00 0.00 0.00 0.00 0.00 0.00
NCE - Mini Hydel 0.81 0.40 0.70 1.22 2.91 3.97 4.24 4.09 3.07 3.96 2.60 1.99 29.95
NCE - SOLAR Power (Without Bundled) 27.66 28.23 25.67 24.17 21.25 23.04 24.52 23.94 21.36 26.21 27.96 319.67 593.69
NTPC NVVNL Bundled Power (Only
SOLAR)2.57 1.87 1.46 0.56 0.25 0.49 1.54 0.30 0.91 1.54 1.86 2.52 15.86
NTPC NVVNL Bundled Power (Only COAL) 6.06 5.74 5.32 5.07 4.90 4.13 3.41 3.76 4.80 5.43 6.50 6.67 61.80
NTPC NSM Phase-II, Bundled Power
(SOLAR)0.00 0.00 0.00 0.00 0.00 0.00 0.00 0.00 0.00 0.00 0.00 0.00 0.00
NTPC NSM Phase-II, Bundled Power
(COAL)87.41 66.35 88.96 86.71 87.63 82.27 55.94 64.79 78.55 101.30 96.44 116.87 1013.20
NTPC NPKunta Ultra Mega Solar Project
250MW11.95 11.75 10.88 9.96 8.90 9.04 9.81 9.55 9.21 11.77 12.52 12.77 128.12
NTPC NPKunta Ultra Mega Solar Project
250MW0.00 0.00 0.00 0.00 0.00 0.00 0.00 0.00 0.00 7.63 15.88 18.56 42.07
NTPC Ramagundam Solar Power 0.00 0.00 0.00 0.00 0.00 0.00 0.00 0.00 0.00 0.00 0.00 0.00 0.00
0.00
TOTAL NCE 142.0 116.7 135.2 130.2 127.3 125.5 100.7 107.9 121.6 167.2 174.0 486.6 1935.0
IPPS-Others 0.00
Srivathsa (Exclusive EPDCL) 2.88 2.98 2.98 1.02 0.01 0.00 0.00 0.00 0.00 0.00 0.00 0.00 9.87
KSK Mahanadi (MT) 3.46 48.58 26.15 30.34 89.45 11.37 73.91 68.98 100.27 98.56 81.55 99.34 731.95
Hinduja 97.52 95.36 98.09 113.46 22.43 59.05 74.42 50.94 100.36 91.41 79.31 59.67 942.03
Thermal Power Tech 49.78 47.21 51.50 57.46 48.31 51.75 49.15 54.39 58.11 56.38 54.75 56.29 635.09
TOTAL OTHERS 153.6 194.1 178.7 202.3 160.2 122.2 197.5 174.3 258.7 246.4 215.6 215.3 2318.9
169

April May June July August September October November December January February March TotalGenerating Station D Link
Variable
Cost (Rs. /
kWh)
Energy Dispatch (MU)
MARKET
Indian Energy Exchange Ltd (Short Term
Purchases (Trading/IEX/PXIL)5.57 71.41 65.29 88.48 61.71 36.05 105.68 141.64 77.81 11.66 27.01 120.20 812.51
Indian Energy Exchange Ltd-STOA
chargess0.00 0.00 0.00 0.00 0.00 0.00 0.00 0.00 0.00 0.00 0.00 0.00 0.00
Short Term Purchases (Only Swapping) 0.00 0.00 0.00 0.00 0.00 0.00 0.00 0.00 0.00 0.00 0.00 0.00 0.00
Mittal Processors Pvt.Ltd
(Swapping)-Trading Margin37.01 0.00 0.00 0.00 0.00 3.29 0.00 0.00 0.00 0.00 0.00 0.00 40.30
Mittal Processors Pvt.Ltd
(Swapping)-STOA Charges0.00 0.00 0.00 0.00 0.00 0.00 0.00 0.00 0.00 0.00 0.00 0.00 0.00
GMR Energy Trading
(SWAAPING)-Trading Margin24.67 0.00 0.00 0.00 0.00 0.00 0.00 0.00 0.00 0.00 0.00 0.00 24.67
GMR Energy Trading
(SWAAPING) -STOA charges0.00 0.00 0.00 0.00 0.00 0.00 0.00 0.00 0.00 0.00 0.00 0.00 0.00
Arunachal Pradesh Power Corporation
(Swaping)-Trading Margin37.23 2.43 0.42 0.49 0.00 11.62 1.44 0.00 0.00 0.00 0.00 0.00 53.64
Arunachal Pradesh Power Corporation
(Swaping) STOA Charges0.00 0.00 0.00 0.00 0.00 0.00 0.00 0.00 0.00 0.00 0.00 0.00 0.00
Manikaran Power Trading
(SWAAPING)-Trading Margin6.17 0.00 0.00 0.00 0.00 0.00 0.00 0.00 0.00 0.00 0.00 0.00 6.17
Manikaran Power Trading
(SWAAPING) -STOA charges0.00 0.00 0.00 0.00 0.00 0.00 0.00 0.00 0.00 0.00 0.00 0.00 0.00
NVVNL-STOA charges on Sale of Power 0.00 0.00 0.00 0.00 0.00 0.00 0.00 0.00 0.00 0.00 0.00 0.00 0.00
PTC India Ltd (STOA on sale of power) 0.00 0.00 0.00 0.00 0.00 0.00 0.00 0.00 0.00 0.00 0.00 0.00 0.00
PTC India Ltd (Swaping)-Trading Margin 0.00 0.00 0.00 0.00 0.00 0.00 0.00 0.00 0.00 0.00 0.00 0.00 0.00
PTC POC bills( Revision of MTOA
Charges)0.00 0.00 0.00 0.00 0.00 0.00 0.00 0.00 0.00 0.00 0.00 0.00 0.00
Sarda Metals 0.00 0.00 0.00 0.00 0.00 0.00 0.00 0.00 0.00 0.00 0.00 0.00 0.00
Power Exchange India-PXIL(Energy
Charges)0.00 27.77 13.05 6.24 28.33 26.16 61.64 32.40 42.27 4.00 0.00 1.80 243.67
Power Exchange India-PXIL(STOA
Charges)0.00 0.00 0.00 0.00 0.00 0.00 0.00 0.00 0.00 0.00 0.00 0.00 0.00
shri Girija 26MW trading 0.00 0.00 0.00 0.00 0.00 0.00 0.00 0.00 0.00 0.00 0.00 0.00 0.00
PTC India trading Ltd trading 0.00 0.00 0.00 0.00 0.00 0.00 0.00 0.00 0.00 0.00 0.00 0.00 0.00
Sembcorp Gayatri Power Limited(STOA
Charges)0.00 0.00 0.00 0.00 0.00 0.00 0.00 0.00 0.00 0.00 0.00 0.00 0.00
Sembcorp Gayatri Power Limited Trading
Energy0.00 0.00 0.00 0.00 0.00 0.00 0.00 0.00 0.00 0.00 0.00 0.00 0.00
Discom to Discom IBSS/FBSS settlements 0.00 0.00 0.00 0.00 0.00 0.00 0.00 0.00 0.00 0.00 0.00 0.00 0.00
NHPC LIMITED (Trading) 0.00 0.00 0.00 0.00 0.00 0.00 0.00 0.00 0.00 0.00 0.00 106.70 106.70
swapping Return 0.00 0.00 0.00 0.00 0.00 0.00 0.00 0.00 0.00 0.00 0.00 -1129.29 -1129.29
EPDCL IBSS Adjustment for 2019-
20(Purchase from SPDCL)0.00 0.00 0.00 0.00 0.00 0.00 0.00 0.00 0.00 0.00 0.00 4854.88 4854.88
POSOCO-Deviation Charges (CGS UI
charges)-6.71 -2.21 -8.76 2.11 5.86 4.46 2.58 -0.15 4.44 -3.61 3.61 7.00 8.63
POSOCO Reactive charges
TOTAL MARKET 103.95 99.42 70.00 97.32 95.91 81.58 171.34 173.89 124.52 12.05 30.63 3961.29 5021.88
TOTAL (From All Sources) 1605.25 1661.39 1476.03 1608.58 1557.95 1670.18 1471.81 1455.68 1490.11 1607.94 1575.94 5673.40 22854.27
170

April May June July August September October November December January February March TotalGenerating Station D Link
Variable
Cost (Rs. /
kWh)
Energy Dispatch (MU)
FY 2020-21
April May June July August September October November December January February March Total
Apgenco-Thermal
Dr. NTTPS 3.34 80.13 -1.75 55.33 38.76 77.22 107.58 220.28 254.16 220.28 262.63 237.22 262.63 1814.47
Dr. NTTPS-IV 3.15 -1.78 56.21 96.20 106.46 92.08 96.69 118.40 114.58 118.40 57.29 0.00 118.40 972.92
RTPP Stage-I 3.86 -1.18 -1.27 -0.99 -0.88 -0.84 -0.85 47.97 4.03 50.21 19.75 64.69 0.00 180.63
RTPP Stage-II 3.86 40.36 43.16 9.85 -0.19 -0.17 -0.17 90.11 65.89 69.32 90.11 81.38 36.01 525.67
RTPP Stage-III 3.86 -0.13 -0.14 -0.12 -0.11 -0.11 -0.13 22.18 41.63 43.01 43.01 40.21 43.01 232.32
RTPP Stage-IV 3.66 0.00 0.00 0.00 0.00 0.00 0.00 130.36 75.68 121.95 130.36 117.73 130.36 706.45
Genco-Thermal Total 3.46 117.39 96.22 160.27 144.03 168.17 203.11 629.31 555.97 623.17 603.17 541.23 590.43 4432.47
Srisailam RCPH 0.00 0.54 0.07 -0.13 -0.01 57.94 129.75 28.69 28.69 28.69 25.10 25.10 22.23 346.64
NSRCPH 0.00 -0.02 1.17 -0.01 -0.01 2.49 9.57 5.38 3.59 2.87 0.72 0.72 0.72 27.17
NSTPDC PH 0.00 0.22 -0.02 -0.01 0.83 0.00 0.00 4.30 4.30 3.94 3.94 3.94 3.77 25.23
Upper Sileru 0.00 25.32 21.31 11.03 15.41 2.25 2.84 7.89 7.53 7.71 7.89 7.53 7.17 123.89
Lower Sileru 0.00 31.59 35.72 33.97 37.24 21.43 10.95 28.51 28.69 29.04 28.33 27.61 28.69 341.76
Donkarayi 0.00 2.73 3.90 3.89 4.21 41.54 40.00 2.51 2.01 1.43 1.43 2.51 1.43 107.61
PABM 0.00 -0.01 -0.01 -0.01 -0.01 4.47 4.83 0.11 0.11 0.11 0.09 0.11 0.11 9.89
Minihydel(Chettipet) 0.00 0.09 0.00 0.06 0.06 -0.01 0.15 0.09 0.09 0.09 0.09 0.09 0.05 0.83
Machkund AP Share 0.00 10.54 10.78 8.05 8.65 10.08 10.91 10.76 10.76 10.76 10.76 9.68 9.68 121.39
TB Dam AP Share 0.00 1.54 -0.19 -0.10 0.35 5.68 8.34 5.74 5.38 3.66 3.94 3.59 3.23 41.14
Genco Hydel Total 0.00 72.54 72.73 56.74 66.71 145.88 217.33 93.96 91.13 88.30 82.29 80.88 77.07 1145.56
APGENCO-TOTAL 2.75 189.93 168.95 217.02 210.74 314.05 420.44 723.27 647.10 711.47 685.46 622.11 667.50 5578.03
APGPCL Stage-I 3.19 0.00 0.96 2.02 2.66 1.96 1.96 1.50 1.93 1.99 1.99 1.80 1.96 20.72
APGPCL Stage-II 2.82 0.00 6.35 15.06 9.55 7.76 7.76 0.79 0.00 0.00 0.00 0.00 0.00 47.27
APPDCL Stage-I 3.14 101.31 147.23 292.03 236.44 316.83 253.24 239.93 351.12 269.19 362.82 327.71 362.82 3260.68
Godavari Gas Power Plant 2.32 31.04 23.74 14.73 24.80 24.80 14.60 16.79 16.23 28.07 23.71 21.64 25.45 265.63
Joint Sector-TOTAL 3.08 132.36 178.28 323.83 273.46 351.35 277.56 259.01 369.27 299.25 388.53 351.15 390.24 3594.29
NTPC(SR) Ramagundam I & II 2.44 59.39 59.76 46.26 62.86 49.90 40.30 48.95 54.23 42.77 53.15 49.23 54.89 621.69
NTPC(SR) Simhadri Stage-I 3.15 78.47 47.95 37.57 74.19 78.39 85.90 114.57 90.02 56.95 108.89 103.55 114.57 991.01
NTPC(SR) Simhadri Stage-II 3.09 37.00 39.03 29.78 37.70 24.45 24.06 47.21 45.70 47.21 29.32 29.45 47.21 438.11
NTPC(SR) Talcher Stage-II 1.98 41.70 45.70 33.93 41.01 35.01 36.45 42.20 31.26 33.53 32.43 38.54 42.79 454.55
NTPC(SR) Ramagundam III 2.40 0.00 0.00 8.15 15.55 14.20 15.83 15.65 15.15 15.65 15.65 14.15 15.65 145.64
NTPC Kudgi Stage-I 3.49 2.62 0.00 0.00 0.28 0.72 5.48 48.91 47.32 48.91 48.91 44.17 48.91 296.22
Generating Station
Energy Dispatch (MU)
D Link
Variable
Cost (Rs. /
kWh)
171

April May June July August September October November December January February March TotalGenerating Station D Link
Variable
Cost (Rs. /
kWh)
Energy Dispatch (MU)
NTECL Valluru 3.42 2.87 5.04 2.69 4.64 6.70 2.23 16.04 14.79 12.60 16.42 17.91 21.00 122.93
NLC Stage-I 2.88 9.93 10.57 8.36 3.91 4.53 5.89 9.29 8.52 7.26 9.40 8.52 9.40 95.57
NLC Stage-II 2.77 14.54 10.57 10.92 0.17 0.00 4.14 9.78 12.56 14.92 17.35 15.74 17.35 128.05
NPC(MAPS) 2.61 1.88 1.82 1.88 1.83 1.88 1.96 1.61 -0.27 1.00 1.61 1.41 1.61 18.20
NPC(KAIGA unit I,II,III,IV) 3.48 19.74 23.42 28.32 28.90 29.56 28.45 26.79 24.26 16.43 19.88 17.29 24.19 287.22
NTPL(NLC TamilNadu) 2.90 23.36 14.39 18.59 23.76 20.40 23.26 29.70 28.98 21.01 21.73 26.80 29.70 281.67
NLC NNTPS 2.34 4.54 5.65 3.64 5.46 1.84 4.53 11.33 10.96 11.33 11.33 10.23 11.33 92.14
JNNSM Ph-1 Thermal 3.58 4.76 4.38 6.39 5.97 4.10 3.58 8.53 8.33 8.05 7.93 7.53 8.80 78.36
JNNSM Ph-2 Thermal 2.81 73.98 53.59 74.25 89.87 82.06 87.17 108.39 105.60 103.18 101.35 96.02 111.35 1086.83
CGS TOTAL 2.87 374.76 321.87 310.73 396.09 353.75 369.24 538.93 497.39 440.79 495.35 480.56 558.74 5138.19
KSK Mahanadi 2.96 77.39 87.28 87.28 30.87 0.00 0.00 0.00 0.00 0.00 0.00 0.00 0.00 282.82
Thermal Powertech Corporation 2.33 54.96 57.96 32.29 15.12 39.33 52.10 62.13 60.13 62.13 62.13 56.12 62.13 616.51
Hinduja National Powercorp 3.82 54.34 99.24 133.44 98.42 0.00 0.00 0.00 0.00 0.00 0.00 0.00 0.00 385.45
IPP TOTAL 2.92 186.69 244.48 253.01 144.41 39.33 52.10 62.13 60.13 62.13 62.13 56.12 62.13 1284.78
NCE- Others 5.14 5.56 3.19 2.82 4.63 4.63 5.94 7.83 10.28 13.04 13.98 12.94 10.28 95.13
NCE Wind 0.00 0.00 0.00 0.00 0.00 0.00 0.00 0.00 0.00 0.00 0.00 0.00 0.00
NCE Solar 4.47 3.73 3.72 2.99 2.94 2.87 2.75 2.62 2.84 2.43 3.09 3.42 3.70 37.10
JNNSM Ph-1 Solar 0.00 0.00 0.00 0.00 0.00 0.00 0.00 0.00 0.00 0.00 0.00 0.00 0.00
JNNSM Ph-2 Solar 0.00 0.00 0.00 0.00 0.00 0.00 0.00 0.00 0.00 0.00 0.00 0.00 0.00
NCE TOTAL 4.95 9.29 6.91 5.81 7.58 7.50 8.69 10.45 13.12 15.47 17.08 16.35 13.98 132.23
INTERSTATE TRADERS (SHORTTERM) 3.36 387.62 527.46 169.22 142.77 89.67 216.01 0.00 0.00 0.00 0.00 39.23 0.00 1571.97
Spectrum Power 2.58 30.71 19.47 13.92 28.78 22.69 13.39 13.39 13.39 13.39 13.39 13.39 13.39 209.30
LANCO Kondapalli 2.52 55.49 42.61 29.86 14.60 1.50 29.55 29.55 29.55 29.55 29.55 29.55 29.55 350.87
SHORTTERM TOTAL 3.14 473.82 589.54 213.00 186.14 113.86 258.94 42.94 42.94 42.94 42.94 82.17 42.94 2132.14
GRAND TOTAL 2.92 1366.85 1510.02 1323.40 1218.41 1179.84 1386.97 1636.72 1629.95 1572.05 1691.47 1608.46 1735.52 17859.66
D<>D-Transaction 0.00 450.16 331.01 584.80 612.72 459.74 554.40 183.83 269.63 307.93 253.37 372.18 341.80 4721.59
Grand Total 0.00 1817.01 1841.04 1908.19 1831.13 1639.58 1941.38 1820.55 1899.58 1879.98 1944.85 1980.64 2077.32 22581.25
172
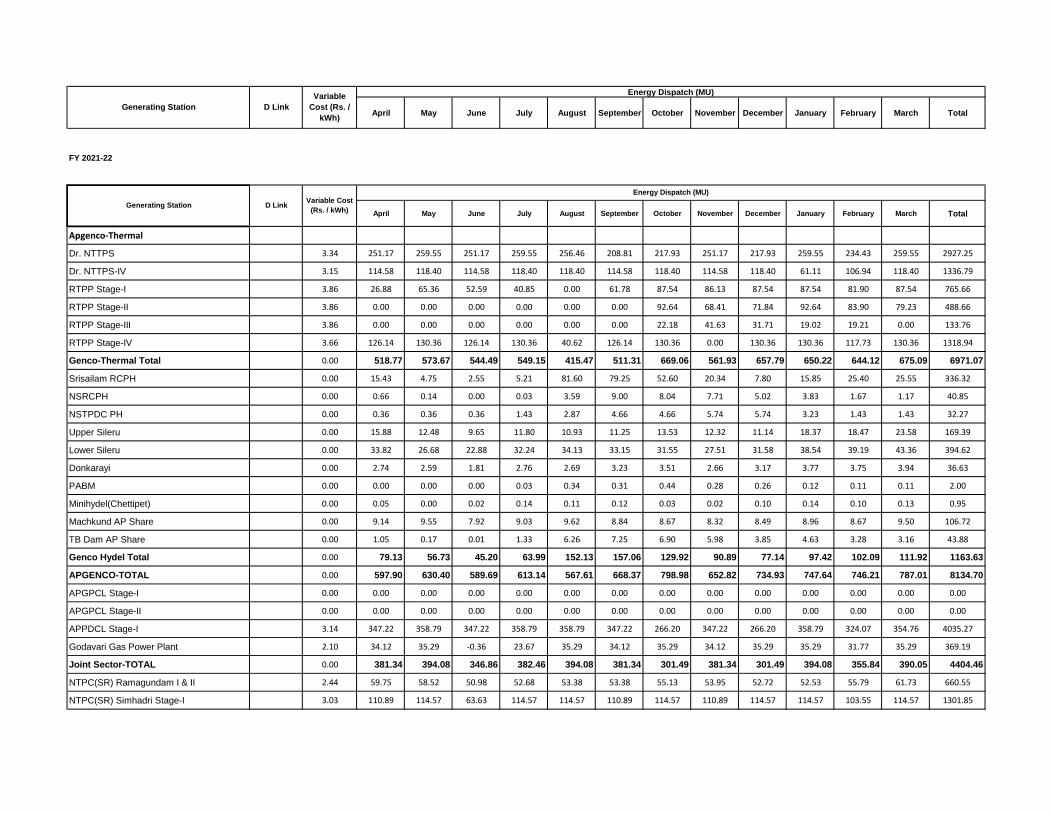
April May June July August September October November December January February March TotalGenerating Station D Link
Variable
Cost (Rs. /
kWh)
Energy Dispatch (MU)
FY 2021-22
April May June July August September October November December January February March Total
Apgenco-Thermal
Dr. NTTPS 3.34 251.17 259.55 251.17 259.55 256.46 208.81 217.93 251.17 217.93 259.55 234.43 259.55 2927.25
Dr. NTTPS-IV 3.15 114.58 118.40 114.58 118.40 118.40 114.58 118.40 114.58 118.40 61.11 106.94 118.40 1336.79
RTPP Stage-I 3.86 26.88 65.36 52.59 40.85 0.00 61.78 87.54 86.13 87.54 87.54 81.90 87.54 765.66
RTPP Stage-II 3.86 0.00 0.00 0.00 0.00 0.00 0.00 92.64 68.41 71.84 92.64 83.90 79.23 488.66
RTPP Stage-III 3.86 0.00 0.00 0.00 0.00 0.00 0.00 22.18 41.63 31.71 19.02 19.21 0.00 133.76
RTPP Stage-IV 3.66 126.14 130.36 126.14 130.36 40.62 126.14 130.36 0.00 130.36 130.36 117.73 130.36 1318.94
Genco-Thermal Total 0.00 518.77 573.67 544.49 549.15 415.47 511.31 669.06 561.93 657.79 650.22 644.12 675.09 6971.07
Srisailam RCPH 0.00 15.43 4.75 2.55 5.21 81.60 79.25 52.60 20.34 7.80 15.85 25.40 25.55 336.32
NSRCPH 0.00 0.66 0.14 0.00 0.03 3.59 9.00 8.04 7.71 5.02 3.83 1.67 1.17 40.85
NSTPDC PH 0.00 0.36 0.36 0.36 1.43 2.87 4.66 4.66 5.74 5.74 3.23 1.43 1.43 32.27
Upper Sileru 0.00 15.88 12.48 9.65 11.80 10.93 11.25 13.53 12.32 11.14 18.37 18.47 23.58 169.39
Lower Sileru 0.00 33.82 26.68 22.88 32.24 34.13 33.15 31.55 27.51 31.58 38.54 39.19 43.36 394.62
Donkarayi 0.00 2.74 2.59 1.81 2.76 2.69 3.23 3.51 2.66 3.17 3.77 3.75 3.94 36.63
PABM 0.00 0.00 0.00 0.00 0.03 0.34 0.31 0.44 0.28 0.26 0.12 0.11 0.11 2.00
Minihydel(Chettipet) 0.00 0.05 0.00 0.02 0.14 0.11 0.12 0.03 0.02 0.10 0.14 0.10 0.13 0.95
Machkund AP Share 0.00 9.14 9.55 7.92 9.03 9.62 8.84 8.67 8.32 8.49 8.96 8.67 9.50 106.72
TB Dam AP Share 0.00 1.05 0.17 0.01 1.33 6.26 7.25 6.90 5.98 3.85 4.63 3.28 3.16 43.88
Genco Hydel Total 0.00 79.13 56.73 45.20 63.99 152.13 157.06 129.92 90.89 77.14 97.42 102.09 111.92 1163.63
APGENCO-TOTAL 0.00 597.90 630.40 589.69 613.14 567.61 668.37 798.98 652.82 734.93 747.64 746.21 787.01 8134.70
APGPCL Stage-I 0.00 0.00 0.00 0.00 0.00 0.00 0.00 0.00 0.00 0.00 0.00 0.00 0.00 0.00
APGPCL Stage-II 0.00 0.00 0.00 0.00 0.00 0.00 0.00 0.00 0.00 0.00 0.00 0.00 0.00 0.00
APPDCL Stage-I 3.14 347.22 358.79 347.22 358.79 358.79 347.22 266.20 347.22 266.20 358.79 324.07 354.76 4035.27
Godavari Gas Power Plant 2.10 34.12 35.29 -0.36 23.67 35.29 34.12 35.29 34.12 35.29 35.29 31.77 35.29 369.19
Joint Sector-TOTAL 0.00 381.34 394.08 346.86 382.46 394.08 381.34 301.49 381.34 301.49 394.08 355.84 390.05 4404.46
NTPC(SR) Ramagundam I & II 2.44 59.75 58.52 50.98 52.68 53.38 53.38 55.13 53.95 52.72 52.53 55.79 61.73 660.55
NTPC(SR) Simhadri Stage-I 3.03 110.89 114.57 63.63 114.57 114.57 110.89 114.57 110.89 114.57 114.57 103.55 114.57 1301.85
Generating Station D LinkVariable Cost
(Rs. / kWh)
Energy Dispatch (MU)
173

April May June July August September October November December January February March TotalGenerating Station D Link
Variable
Cost (Rs. /
kWh)
Energy Dispatch (MU)
NTPC(SR) Simhadri Stage-II 3.00 34.00 27.73 45.70 47.21 47.21 45.70 47.21 45.70 47.21 47.21 42.67 47.21 524.74
NTPC(SR) Talcher Stage-II 2.00 40.83 41.72 29.44 36.27 41.72 31.98 39.31 40.77 42.29 42.29 38.17 42.39 467.21
NTPC(SR) Ramagundam III 2.45 11.56 0.00 15.15 15.65 15.65 15.15 15.65 15.15 15.65 15.65 14.15 15.65 165.07
NTPC Kudgi Stage-I 3.37 47.32 48.91 31.54 33.13 48.91 47.32 48.91 47.32 48.91 48.91 44.17 48.91 544.24
NTECL Valluru 3.39 17.88 18.48 12.52 6.74 8.83 7.07 14.02 16.96 16.51 17.53 15.83 17.43 169.80
NLC Stage-I 2.77 9.48 9.64 9.31 7.72 6.22 9.20 6.79 8.60 6.82 9.59 8.63 9.62 101.63
NLC Stage-II 2.77 17.17 13.34 13.94 15.55 17.20 13.46 16.60 13.27 16.60 17.73 15.97 17.77 188.61
NPC(MAPS) 2.60 1.53 1.61 1.53 1.61 1.61 1.53 1.61 1.53 1.61 1.61 1.41 1.61 18.77
NPC(KAIGA unit I,II,III,IV) 3.42 25.64 26.60 25.64 26.60 26.60 25.64 20.16 23.79 19.74 24.58 23.92 26.60 295.49
NTPL(NLC TamilNadu) 2.78 27.53 28.61 18.11 22.09 28.61 27.53 25.35 27.53 28.61 28.61 25.72 28.61 316.93
NLC NNTPS 2.34 10.96 11.33 10.96 11.33 11.33 10.96 11.33 10.96 11.33 11.33 10.23 11.33 133.35
JNNSM Ph-1 Thermal 3.58 8.29 7.68 7.08 7.50 0.00 8.31 8.73 8.54 8.70 8.69 8.21 9.09 90.83
JNNSM Ph-2 Thermal 3.50 105.22 99.18 92.20 97.19 110.36 105.39 110.54 107.98 110.20 109.59 103.39 114.48 1265.73
CGS TOTAL 0.00 528.05 507.93 427.74 495.83 532.19 513.51 535.92 532.94 541.46 550.41 511.81 566.98 6244.75
KSK Mahanadi 0.00 0 0 0 0 0 0 0 0 0 0 0 0 0
Thermal Powertech Corporation 2.44 51.11 52.81 51.11 52.81 52.81 51.11 52.81 40.52 52.81 52.81 47.70 52.81 611.205075
Hinduja National Powercorp 0.00 0 0 0 0 0 0 0 0 0 0 0 0 0
IPP TOTAL 0.00 51.11 52.81 51.11 52.81 52.81 51.11 52.81 40.52 52.81 52.81 47.70 52.81 611.21
NCE- Others 4.21 8.12 6.60 5.85 7.66 7.66 8.35 10.12 13.25 17.57 17.33 16.41 13.16 132.09
NCE Wind 4.73 0.00 0.00 0.00 0.00 0.00 0.00 0.00 0.00 0.00 0.00 0.00 0.00 0.00
NCE Solar 4.05 4.85 4.83 3.86 3.76 3.67 3.57 3.48 3.65 3.16 4.01 4.38 4.72 47.94
JNNSM Ph-1 Solar 5.84 0.00 0.00 0.00 0.00 0.00 0.00 0.00 0.00 0.00 0.00 0.00 0.00 0.00
JNNSM Ph-2 Solar 4.08 0.00 0.00 0.00 0.00 0.00 0.00 0.00 0.00 0.00 0.00 0.00 0.00 0.00
NCE TOTAL 0.00 12.98 11.44 9.71 11.42 11.33 11.92 13.60 16.89 20.73 21.34 20.79 17.88 180.03
INTERSTATE TRADERS (SHORTTERM) 0.00 0.00 0.00 0.00 0.00 0.00 0.00 40.77 101.51 0.00 0.00 0.00 0.00 142.27
Spectrum Power 0.00 0.00 0.00 0.00 0.00 0.00 0.00 0.00 0.00 0.00 0.00 0.00 0.00 0.00
LANCO Kondapalli 0.00 0.00 0.00 0.00 0.00 0.00 0.00 0.00 0.00 0.00 0.00 0.00 0.00 0.00
SHORTTERM TOTAL 0.00 0.00 0.00 0.00 0.00 0.00 0.00 40.77 101.51 0.00 0.00 0.00 0.00 142.27
TOTAL 0.00 1571.37 1596.65 1425.10 1555.66 1558.02 1626.25 1743.57 1726.02 1651.42 1766.29 1682.34 1814.73 19717.42
D<>D-Transaction 0.00 597.75 607.96 751.29 517.24 452.92 434.22 246.41 310.78 322.91 280.50 400.83 375.93 5298.76
Grand Total 0.00 2169.11 2204.62 2176.39 2072.90 2010.94 2060.47 1989.98 2036.80 1974.34 2046.79 2083.18 2190.67 25016.18
174

Form 5 Revenue from Current Tariffs
Gross
RevenueIncentives Net Revenue Surcharge
Additional
surcharge
Gross
RevenueIncentives Net Revenue Surcharge
Additional
surcharge
Gross
RevenueIncentives Net Revenue Surcharge
Additional
surcharge
Low Tension 4411.31 0.00 4411.31 0.00 0.00 0.00 4411.31 4729.04 0.00 4729.04 0.00 0.00 0.00 4729.04 4860.26 0.00 4860.26 0.00 0.00 0.00 4860.26
I(A): Domestic- LT Form-7 2172.58 2172.58 2172.58 2527.73 2527.73 2527.73 2284.61 2284.61 2284.61
II: Commercial and others- LT Form-5a 1148.57 1148.57 1148.57 977.09 977.09 977.09 1210.43 1210.43 1210.43
III: Industry- LT 288.90 288.90 288.90 280.53 280.53 280.53 293.13 293.13 293.13
IV: Institutional- LT 204.98 204.98 204.98 252.10 252.10 252.10 273.78 273.78 273.78
V: Agriculture & Related- LT 596.29 596.29 596.29 691.59 691.59 691.59 798.32 798.32 798.32
High Tension 6038.87 5.72 6033.15 0.00 0.00 0.00 6033.15 5890.76 6.00 5884.76 0.00 0.00 0.00 5884.76 6742.77 6.32 6736.45 0.00 0.00 0.00 6736.45
HT Category at 11 kv 1841.56 1.17 1840.39 0.00 0.00 0.00 1840.39 1858.23 1.23 1857.01 0.00 0.00 0.00 1857.01 1999.20 1.32 1997.88 0.00 0.00 0.00 1997.88
I (B):Townships, Colonies, Gated
Communities and Villas - HT 12.81 12.81 12.81 14.64 14.64 14.64 14.77 14.77 14.77
II COMMERCIAL AND OTHERS - HT 558.95 - 558.95 - - - 558.95 480.29 - 480.29 - - - 480.29 572.64 - 572.64 - - - 572.64
(A) : ii) Commercial Major 432.00 432.00 432.00 408.07 408.07 408.07 472.64 472.64 472.64
Time of Day tariff (TOD)- Peak 87.02 87.02 87.02 65.67 65.67 65.67 88.69 88.69 88.69
(iv) Function halls / Auditoria 24.24 24.24 24.24 6.50 6.50 6.50 11.25 11.25 11.25
(B) : Startup power 6.85 6.85 6.85 0.05 0.05 0.05 0.06 0.06 0.06
(C) : Electric Vehicles / Charging Stations 8.84 8.84 8.84 0.00 0.00 0.00 0.00 0.00 0.00
(D) : Green Power 0.00 0.00 0.00 0.00 0.00 0.00 0.00 0.00 0.00
III INDUSTRY - HT 1,127.05 1.17 1,125.88 - - - 1,125.88 1,125.97 1.23 1,124.74 - - - 1,124.74 1,147.54 1.32 1,146.22 - - - 1,146.22
(A) : Industry (General)# 577.13 1.17 575.96 575.96 581.36 1.23 580.13 580.13 587.44 1.32 586.12 586.12
Time of Day tariff (TOD)- Peak 319.75 319.75 319.75 315.17 315.17 315.17 322.95 322.95 322.95
Time of Day tariff (TOD) - Off Peak 218.42 218.42 218.42 213.30 213.30 213.30 220.60 220.60 220.60
Industrial Colonies 1.49 1.49 1.49 1.50 1.50 1.50 1.67 1.67 1.67
(B) : Seasonal Industries (off- season) 10.26 10.26 10.26 14.64 14.64 14.64 14.88 14.88 14.88
(C) : Energy Intensive Industries 0.00 0.00 0.00 0.00 0.00 0.00 0.00 0.00 0.00
IV INSTITUTIONAL - HT 46.31 - 46.31 - - - 46.31 125.18 - 125.18 - - - 125.18 141.76 - 141.76 - - - 141.76
(A) : Utilites (Street Lighting, NTR Sujala Pathakam,
CPWS and PWS) 44.63 44.63 44.63 98.96 98.96 98.96 111.84 111.84 111.84
(B) : General Purpose 0.00 0.00 24.78 24.78 24.78 27.73 27.73 27.73
(C) : Religious Places 1.68 1.68 1.68 1.44 1.44 1.44 2.19 2.19 2.19
(D) : Railway Traction 0.00 0.00 0.00 0.00 0.00 0.00 0.00 0.00
V AGRICULTURE AND RELATED - HT 59.94 - 59.94 - - - 59.94 72.41 - 72.41 - - - 72.41 80.72 - 80.72 - - - 80.72
(B) : Aquaculture and Animal Husbandry 6.87 6.87 6.87 7.94 7.94 7.94 8.41 8.41 8.41
(C) : Poultry & Aquaculture 41.33 41.33 41.33 50.50 50.50 50.50 57.53 57.53 57.53
(i) Poultry Hactcheries & Poultry Feed mixing plants 0.00 0.00 7.10 7.10 7.10 9.64 9.64 9.64
(ii) Aqua Hatcheries & Aqua Feed mixing plants 0.00 0.00 43.41 43.41 43.41 47.90 47.90 47.90
(E) : Government / Private Lift Irrigation Schemes 11.74 11.74 11.74 13.97 13.97 13.97 14.77 14.77 14.77
RESCOs 36.50 36.50 36.50 39.73 39.73 39.73 41.77 41.77 41.77
HT Category at 33 kv 1404.03 2.83 1401.21 0.00 0.00 0.00 1401.21 1386.15 2.96 1383.18 0.00 0.00 0.00 1383.18 1484.23 3.40 1480.83 0.00 0.00 0.00 1480.83
I (B):Townships, Colonies, Gated
Communities and Villas - HT 7.44 7.44 7.44 8.83 8.83 8.83 9.25 9.25 9.25
II COMMERCIAL AND OTHERS - HT 190.41 - 190.41 - - - 190.41 186.77 - 186.77 - - - 186.77 201.31 - 201.31 - - - 201.31
(A) : ii) Commercial Major 147.91 147.91 147.91 149.70 149.70 149.70 169.89 169.89 169.89
Time of Day tariff (TOD)- Peak 25.66 25.66 25.66 22.51 22.51 22.51 24.78 24.78 24.78
(iv) Function halls / Auditoria 8.52 8.52 8.52 0.00 0.00 0.00 0.00 0.00 0.00
(B) : Startup power 2.03 2.03 2.03 14.56 14.56 14.56 6.64 6.64 6.64
(C) : Electric Vehicles / Charging Stations 6.29 6.29 6.29 0.00 0.00 0.00 0.00 0.00 0.00
(D) : Green Power 0.00 0.00 0.00 0.00 0.00 0.00 0.00 0.00 0.00
III INDUSTRY - HT 1,135.61 2.83 1,132.79 - - - 1,132.79 1,109.33 2.96 1,106.37 - - - 1,106.37 1,173.86 3.40 1,170.45 - - - 1,170.45
FY 2021-22
Retail Supply (Regulated Business)Surcharges (Open
Access)Grid
Support
Charges
Total
Revenue
Total
Revenue
Grid
Support
Charges
Grid
Support
Charges
Detail
Links
FY 2020-21
Surcharges (Open Access)Revenue from Current Tariffs (Rs. Crs.)
FY 2019-20
Retail Supply (Regulated Business)Total
Revenue
Surcharges (Open Access) Retail Supply (Regulated Business)
175

Gross
RevenueIncentives Net Revenue Surcharge
Additional
surcharge
Gross
RevenueIncentives Net Revenue Surcharge
Additional
surcharge
Gross
RevenueIncentives Net Revenue Surcharge
Additional
surcharge
FY 2021-22
Retail Supply (Regulated Business)Surcharges (Open
Access)Grid
Support
Charges
Total
Revenue
Total
Revenue
Grid
Support
Charges
Grid
Support
Charges
Detail
Links
FY 2020-21
Surcharges (Open Access)Revenue from Current Tariffs (Rs. Crs.)
FY 2019-20
Retail Supply (Regulated Business)Total
Revenue
Surcharges (Open Access) Retail Supply (Regulated Business)
(A) : Industry (General)# 399.85 2.83 397.02 397.02 445.20 2.96 442.24 442.24 417.72 3.40 414.32 414.32
Time of Day tariff (TOD)- Peak 365.82 365.82 365.82 329.93 329.93 329.93 373.14 373.14 373.14
Time of Day tariff (TOD) - Off Peak 263.45 263.45 263.45 241.59 241.59 241.59 268.72 268.72 268.72
Industrial Colonies 0.90 0.90 0.90 0.72 0.72 0.72 1.02 1.02 1.02
(B) : Seasonal Industries (off- season) 7.64 7.64 7.64 8.64 8.64 8.64 7.48 7.48 7.48
(C) : Energy Intensive Industries 97.95 97.95 97.95 83.25 83.25 83.25 105.78 105.78 105.78
IV INSTITUTIONAL - HT 0.06 - 0.06 - - - 0.06 0.85 - 0.85 - - - 0.85 1.42 - 1.42 - - - 1.42
(A) : Utilites(Street Lighting, NTR Sujala Pathakam,
CPWS and PWS) 0.06 0.06 0.06 0.11 0.11 0.11 0.37 0.37 0.37
(B) : General Purpose 0.00 0.00 0.75 0.75 0.75 1.05 1.05 1.05
(C) : Religious Places 0.00 0.00 0.00 0.00 0.00 0.00 0.00 0.00 0.00
(D) : Railway Traction 0.00 0.00 0.00 0.00 0.00 0.00 0.00 0.00
V AGRICULTURE AND RELATED - HT 70.52 - 70.52 - - - 70.52 80.37 - 80.37 - - - 80.37 98.40 - 98.40 - - - 98.40
(B) : Aquaculture and Animal Husbandry 0.00 0.00 0.00 0.08 0.08 0.08 0.12 0.12 0.12
(C) : Poultry & Aquaculture 34.78 34.78 34.78 44.96 0.00 44.96 0.00 0.00 0.00 44.96 49.56 0.00 49.56 0.00 0.00 0.00 49.56
(i) Poultry Hactcheries & Poultry Feed mixing plants 0.00 0.00 0.00 0.00 0.00 0.00 0.00 0.00
(ii) Aqua Hatcheries & Aqua Feed mixing plants 0.00 0.00 44.96 44.96 44.96 49.56 49.56 49.56
(E) : Government / Private Lift Irrigation Schemes 35.74 35.74 35.74 35.33 35.33 35.33 48.72 48.72 48.72
Category at 132 kv 2793.28 1.72 2791.56 0.00 0.00 0.00 2791.56 2646.38 1.81 2644.57 0.00 0.00 0.00 2644.57 3259.33 1.59 3257.74 0.00 0.00 0.00 3257.74
I (B):Townships, Colonies, Gated
Communities and Villas - HT 0.00 0.00 0.00 0.00 0.00 0.00 0.00 0.00 0.00
II COMMERCIAL AND OTHERS - HT 67.35 - 67.35 - - - 67.35 63.73 - 63.73 - - - 63.73 66.69 - 66.69 - - - 66.69
(A) : ii) Commercial Major 52.81 52.81 52.81 49.23 49.23 49.23 50.36 50.36 50.36
Time of Day tariff (TOD)- Peak 10.74 10.74 10.74 9.10 9.10 9.10 9.44 9.44 9.44
(iv) Function halls / Auditoria 0.00 0.00 0.00 0.01 0.01 0.01 0.00 0.00 0.00
(B) : Startup power 0.00 0.00 0.00 5.39 5.39 5.39 6.90 6.90 6.90
(C) : Electric Vehicles / Charging Stations 3.80 3.80 3.80 0.00 0.00 0.00 0.00 0.00 0.00
(D) : Green Power 0.00 0.00 0.00 0.00 0.00 0.00 0.00 0.00 0.00
0.00 0.00 0.00
III INDUSTRY - HT 2,255.88 1.72 2,254.15 - - - 2,254.15 2,048.88 1.81 2,047.07 - - - 2,047.07 2,404.17 1.59 2,402.57 - - - 2,402.57
(A) : Industry (General)# 429.66 1.72 427.93 427.93 411.98 1.81 410.17 410.17 462.21 1.59 460.62 460.62
Time of Day tariff (TOD)- Peak 285.87 285.87 285.87 229.12 229.12 229.12 288.26 288.26 288.26
Time of Day tariff (TOD) - Off Peak 200.69 200.69 200.69 170.39 170.39 170.39 204.70 204.70 204.70
Industrial Colonies 40.41 40.41 40.41 45.36 45.36 45.36 45.80 45.80 45.80
(B) : Seasonal Industries (off- season) 0.00 0.00 0.00 0.00 0.00 0.00 0.00 0.00 0.00
(C) : Energy Intensive Industries 1299.25 1299.25 1299.25 1192.04 1192.04 1192.04 1403.20 1403.20 1403.20
HT IV INSTITUTIONAL - HT 393.42 - 393.42 - - - 393.42 445.71 - 445.71 - - - 445.71 539.10 - 539.10 - - - 539.10
(A) : Utilites(Street Lighting, NTR Sujala Pathakam,
CPWS and PWS) 0.00 0.00 0.00 0.00 0.00 0.00 0.00 0.00 0.00
(B) : General Purpose 0.00 0.00 0.00 0.00 0.00 0.00 0.00 0.00
(C) : Religious Places 0.00 0.00 0.00 0.00 0.00 0.00 0.00 0.00 0.00
(D) : Railway Traction 393.42 393.42 393.42 445.71 445.71 445.71 539.10 539.10 539.10
V AGRICULTURE AND RELATED - HT 76.64 - 76.64 - - - 76.64 88.06 - 88.06 - - - 88.06 249.37 - 249.37 - - - 249.37
(B) : Aquaculture and Animal Husbandry 0.00 0.00 0.00 0.00 0.00 0.00 0.00 0.00 0.00
(C) : Poultry & Aquaculture 0.00 0.00 0.00 0.00 0.00 0.00 0.00 0.00 0.00
(i) Poultry Hactcheries & Poultry Feed mixing plants 0.00 0.00 0.00 0.00 0.00 0.00 0.00 0.00
(ii) Aqua Hatcheries & Aqua Feed mixing plants 0.00 0.00 0.00 0.00 0.00 0.00 0.00 0.00
(E) : Government / Private Lift Irrigation Schemes 76.64 76.64 76.64 88.06 88.06 88.06 249.37 249.37 249.37
Total (LT + HT) 10450.18 5.72 10444.46 0.00 0.00 0.00 10444.46 10619.80 6.00 10613.80 0.00 0.00 0.00 10613.80 11603.03 6.32 11596.72 0.00 0.00 0.00 11596.72
176

Form 5 a
Incentives at current Tariffs
FY 2021-22
Data LinkNo. of
consumers
Incentive
Amount
Low Tension Form-7
LT I: Domestic
LT II: Non-Domestic/Commercial
LT III: Industry
LT IV: INSTITUTIONAL
LT V: Agriculture
Total LT
High Tension
HT Category at 11 kv
I B Domestic: Townships, Colonies, Gated Communities
and Villas
COMMERCIAL & OTHERS
(A) : ii) Commercial Major
Time of Day tariff (TOD)- Peak
(iv) Function halls / Auditoria
(B) : Startup power
(C) : Electric Vehicles / Charging Stations
(D) : Green Power
INDUSTRY
(A) : Industry (General)# 1,682.00 1.32
Time of Day tariff (TOD)- Peak
Time of Day tariff (TOD) - Off Peak
Industrial Colonies
(B) : Seasonal Industries (off- season)
(C) : Energy Intensive Industries
HT IV INSTITUTIONAL
(A) : Utilites (Street Lighting, NTR Sujala Pathakam, CPWS and
PWS)
(B) : General Purpose
(C) : Religious Places
(D) : Railway Traction
HT V AGRICULTURE AND RELATED
(B) : Aquaculture and Animal Husbandry
(C) : Poultry & Aquaculture
(i) Poultry Hactcheries & Poultry Feed mixing plants
(ii) Aqua Hatcheries & Aqua Feed mixing plants
(E) : Government / Private Lift Irrigation Schemes
RESCO
HT Category at 33 kv
I B Domestic: Townships, Colonies, Gated Communities
and Villas
COMMERCIAL & OTHERS
(A) : ii) Commercial Major
Time of Day tariff (TOD)- Peak
(iv) Function halls / Auditoria
(B) : Startup power
(C) : Electric Vehicles / Charging Stations
(D) : Green Power
HT III INDUSTRY
Consumer Category RemarksTotal
177
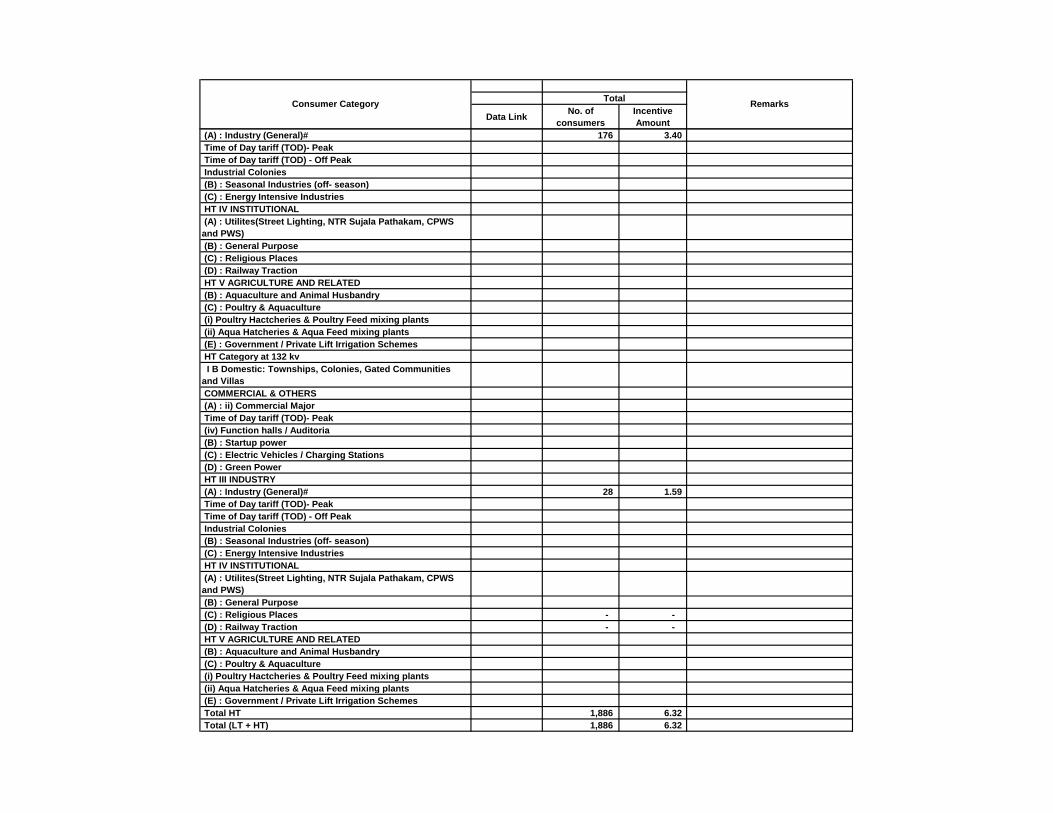
Data LinkNo. of
consumers
Incentive
Amount
Consumer Category RemarksTotal
(A) : Industry (General)# 176 3.40
Time of Day tariff (TOD)- Peak
Time of Day tariff (TOD) - Off Peak
Industrial Colonies
(B) : Seasonal Industries (off- season)
(C) : Energy Intensive Industries
HT IV INSTITUTIONAL
(A) : Utilites(Street Lighting, NTR Sujala Pathakam, CPWS
and PWS)
(B) : General Purpose
(C) : Religious Places
(D) : Railway Traction
HT V AGRICULTURE AND RELATED
(B) : Aquaculture and Animal Husbandry
(C) : Poultry & Aquaculture
(i) Poultry Hactcheries & Poultry Feed mixing plants
(ii) Aqua Hatcheries & Aqua Feed mixing plants
(E) : Government / Private Lift Irrigation Schemes
HT Category at 132 kv
I B Domestic: Townships, Colonies, Gated Communities
and Villas
COMMERCIAL & OTHERS
(A) : ii) Commercial Major
Time of Day tariff (TOD)- Peak
(iv) Function halls / Auditoria
(B) : Startup power
(C) : Electric Vehicles / Charging Stations
(D) : Green Power
HT III INDUSTRY
(A) : Industry (General)# 28 1.59
Time of Day tariff (TOD)- Peak
Time of Day tariff (TOD) - Off Peak
Industrial Colonies
(B) : Seasonal Industries (off- season)
(C) : Energy Intensive Industries
HT IV INSTITUTIONAL
(A) : Utilites(Street Lighting, NTR Sujala Pathakam, CPWS
and PWS)
(B) : General Purpose
(C) : Religious Places - -
(D) : Railway Traction - -
HT V AGRICULTURE AND RELATED
(B) : Aquaculture and Animal Husbandry
(C) : Poultry & Aquaculture
(i) Poultry Hactcheries & Poultry Feed mixing plants
(ii) Aqua Hatcheries & Aqua Feed mixing plants
(E) : Government / Private Lift Irrigation Schemes
Total HT 1,886 6.32
Total (LT + HT) 1,886 6.32
178

Form 5c Consumers served under Open Access as per Section 42 and Section 49 of E Act
The form refers to revenue from Open Access consumers served within
or outside area of supply of the licensee
FY 2021-22
Name of Area : Name of Area : Name of Area :
Revenue from Current Tariffs (Rs. Crs.) Detail LinksNumber of
consumers
Sales
(MU)
Average Supply
Rate
( Rs/kWh)
Amount
( In Rs crores)
Number of
consumers
Sales
(MU)
Average
Supply Rate
( Rs/kWh)
Amount
( In Rs
crores)
Number of
consumers
Sales
(MU)
Average Supply
Rate
( Rs/kWh)
Amount
( In Rs crores)
Low Tension - - - - - - - - -
LT I: Domestic
LT II: Non-Domestic/Commercial
LT III: Industry
LT IV: INSTITUTIONAL
LT V: Agriculture
Total LT
High Tension
HT Category at 11 kv
I B Domestic: Townships, Colonies, Gated Communities and Villas
COMMERCIAL & OTHERS
(A) : ii) Commercial Major
Time of Day tariff (TOD)- Peak
(iv) Function halls / Auditoria
(B) : Startup power
(C) : Electric Vehicles / Charging Stations
(D) : Green Power
INDUSTRY
(A) : Industry (General)# - - - - - - - - -
Time of Day tariff (TOD)- Peak
Time of Day tariff (TOD) - Off Peak
Industrial Colonies
(B) : Seasonal Industries (off- season)
(C) : Energy Intensive Industries
HT IV INSTITUTIONAL
(A) : Utilites (Street Lighting, NTR Sujala Pathakam, CPWS and PWS)
(B) : General Purpose
(C) : Religious Places
(D) : Railway Traction
HT V AGRICULTURE AND RELATED
(B) : Aquaculture and Animal Husbandry
(C) : Poultry & Aquaculture
(i) Poultry Hactcheries & Poultry Feed mixing plants
(ii) Aqua Hatcheries & Aqua Feed mixing plants
Consumers to be classified as per their geographical area. Details for each area to be entered in the header in the field Name of Area (yellow cells in headers). Areas may be classified
as districts, regions or states or other licensee’s area of supply or any other suitable combination.
Area 1 Area 2 Area 3
179

Name of Area : Name of Area : Name of Area :
Revenue from Current Tariffs (Rs. Crs.) Detail LinksNumber of
consumers
Sales
(MU)
Average Supply
Rate
( Rs/kWh)
Amount
( In Rs crores)
Number of
consumers
Sales
(MU)
Average
Supply Rate
( Rs/kWh)
Amount
( In Rs
crores)
Number of
consumers
Sales
(MU)
Average Supply
Rate
( Rs/kWh)
Amount
( In Rs crores)
Area 1 Area 2 Area 3
(E) : Government / Private Lift Irrigation Schemes
RESCO
HT Category at 33 kv
I B Domestic: Townships, Colonies, Gated Communities and Villas
COMMERCIAL & OTHERS
(A) : ii) Commercial Major
Time of Day tariff (TOD)- Peak
(iv) Function halls / Auditoria
(B) : Startup power
(C) : Electric Vehicles / Charging Stations
(D) : Green Power
HT III INDUSTRY
(A) : Industry (General)#
Time of Day tariff (TOD)- Peak
Time of Day tariff (TOD) - Off Peak
Industrial Colonies
(B) : Seasonal Industries (off- season)
(C) : Energy Intensive Industries
HT IV INSTITUTIONAL
(A) : Utilites(Street Lighting, NTR Sujala Pathakam, CPWS and PWS)
(B) : General Purpose
(C) : Religious Places
(D) : Railway Traction
HT V AGRICULTURE AND RELATED
(B) : Aquaculture and Animal Husbandry
(C) : Poultry & Aquaculture
(i) Poultry Hactcheries & Poultry Feed mixing plants
(ii) Aqua Hatcheries & Aqua Feed mixing plants
(E) : Government / Private Lift Irrigation Schemes
HT Category at 132 kv
I B Domestic: Townships, Colonies, Gated Communities and Villas
COMMERCIAL & OTHERS
(A) : ii) Commercial Major
Time of Day tariff (TOD)- Peak
(iv) Function halls / Auditoria
(B) : Startup power
(C) : Electric Vehicles / Charging Stations
(D) : Green Power
180

Name of Area : Name of Area : Name of Area :
Revenue from Current Tariffs (Rs. Crs.) Detail LinksNumber of
consumers
Sales
(MU)
Average Supply
Rate
( Rs/kWh)
Amount
( In Rs crores)
Number of
consumers
Sales
(MU)
Average
Supply Rate
( Rs/kWh)
Amount
( In Rs
crores)
Number of
consumers
Sales
(MU)
Average Supply
Rate
( Rs/kWh)
Amount
( In Rs crores)
Area 1 Area 2 Area 3
HT III INDUSTRY
(A) : Industry (General)#
Time of Day tariff (TOD)- Peak
Time of Day tariff (TOD) - Off Peak
Industrial Colonies
(B) : Seasonal Industries (off- season)
(C) : Energy Intensive Industries
HT IV INSTITUTIONAL
(A) : Utilites(Street Lighting, NTR Sujala Pathakam, CPWS and PWS)
(B) : General Purpose
(C) : Religious Places
(D) : Railway Traction
HT V AGRICULTURE AND RELATED
(B) : Aquaculture and Animal Husbandry
(C) : Poultry & Aquaculture
(i) Poultry Hactcheries & Poultry Feed mixing plants
(ii) Aqua Hatcheries & Aqua Feed mixing plants
(E) : Government / Private Lift Irrigation Schemes
Total HT
Total (LT + HT)
181
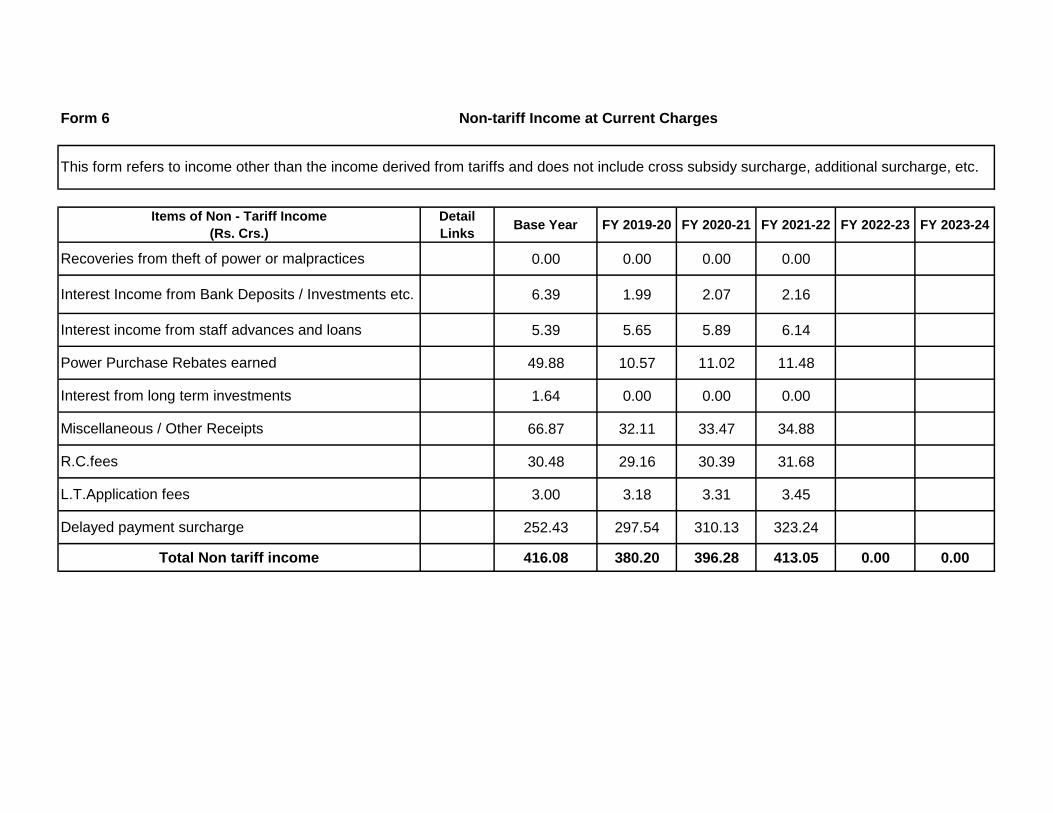
Form 6
Items of Non - Tariff Income
(Rs. Crs.)
Detail
LinksBase Year FY 2019-20 FY 2020-21 FY 2021-22 FY 2022-23 FY 2023-24
Recoveries from theft of power or malpractices 0.00 0.00 0.00 0.00
Interest Income from Bank Deposits / Investments etc. 6.39 1.99 2.07 2.16
Interest income from staff advances and loans 5.39 5.65 5.89 6.14
Power Purchase Rebates earned 49.88 10.57 11.02 11.48
Interest from long term investments 1.64 0.00 0.00 0.00
Miscellaneous / Other Receipts 66.87 32.11 33.47 34.88
R.C.fees 30.48 29.16 30.39 31.68
L.T.Application fees 3.00 3.18 3.31 3.45
Delayed payment surcharge 252.43 297.54 310.13 323.24
Total Non tariff income 416.08 380.20 396.28 413.05 0.00 0.00
Non-tariff Income at Current Charges
This form refers to income other than the income derived from tariffs and does not include cross subsidy surcharge, additional surcharge, etc.
182

Form 7 Total Revenue at Current Tariff and Charges
Please Note:
A) The user need not enter anything in the yellow spaces in column C for Consumer Categories. For addition of new category, data first needs to be provided in Form A,
which will be automatically reflected in these yellow spaces.
For spaces in orange color, it is to furnish data for the following
1) Segregation or Aggregation of existing slabs
2) Addition of new slab
3) Addition of new sub-category
For LT Category, totals should be manually entered for new categories and slabs in the row for 'New L T Categories (Total).'
B) For Non Tariff Income, provide direct and apportioned Non Tariff Income (column V and W) for each consumer category
C) Include Revenue from Power Factor Surcharge in OTHERS (column O)
FY 2019-20
Energy
Charges
(Rs/kWh) or
(Rs.kVAh)
Demand
charges
(Rs/kVA/Yr)
Demand
charges
(Rs/HP/Yr)
Customer
charges
Energy Sales
(MU)
Energy
sales
(MVAh)
Connected Load/
Contract Demand
(MW)
Connected Load/
Contract
Demand
(HP)
Low Tension
LT I: Domestic 5,137,815.00 5,912.11 - 4,579.00 -
Group A: All consumers with annual consumption < = 900
Units during FY 2018-19 2,736,980.00 1,643.36 - 1,552.00 -
0-50 1,690,976 1.45 - - 25.00 1,123 829 0
51-100 846,849 2.60 - - 30.00 376 495 0
101-200 179,817 3.60 - - 35.00 109 187 0
Above 200 19,338 6.90 - - 40.00 36 41 0
Group B: All consumers with consumption ( < =2700 and >
900 units) during FY 2018-19 2,138,247.00 3,300.37 - 2,264.00 -
0-50 308,746 2.60 - - 35.00 1,232 301 0
51-100 853,311 2.60 - - 40.00 1,019 751 0
101-200 881,603 3.60 - - 45.00 817 1,047 0
201-300 82,717 6.90 - - 50.00 165 139 0
Above 300 11,870 7.75 - - 55.00 67 26 0
Group C: All consumers with annual consumption >2700
units during FY 2018-19 262,588.00 968.37 - 763.00 -
0-50 21,629 2.65 - - 35.00 150 77 0
51-100 18,004 3.35 - - 40.00 148 44 0
101-200 96,586 5.40 - - 45.00 260 237 0
201-300 81,206 7.10 - - 50.00 175 223 0
301-400 26,458 7.95 - - 55.00 98 89 0
401-500 9,212 8.50 - - 55.00 54 37 0
Above 500 units 9,493 9.05 - - 55.00 84 56 0
Smart Meters ( Optional for above 500 units / month 0 9.05 0 0 0
Time of Day tariff ( ToD ) 10 AM to 12 Noon 0 8.05 0 0 0
LT II: Non-Domestic/Commercial 536,638.00 1,122.82 - 1,120.00 -
LT II (A): Upto 50 Units/Month 305,649.00 60.84 - 171.00 -
0-50 305,649 5.40 660.00 - 30.00 61 171 0
LT II (B): Above 50 Units/Month 228,836.00 1,051.91 - 926.00 -
0-50 0 6.90 900.00 - 30.00 146 187 0
51-100 94,334 7.65 900.00 - 40.00 114 120 0
Consumer Categories No of consumers
Components of tariff Relevant sales related data
183

Form 7
Please Note:
A) The user need not enter anything in the yellow spaces in column C for Consumer Categories. For addition of new category, data first needs to be provided in Form A,
which will be automatically reflected in these yellow spaces.
For spaces in orange color, it is to furnish data for the following
1) Segregation or Aggregation of existing slabs
2) Addition of new slab
3) Addition of new sub-category
For LT Category, totals should be manually entered for new categories and slabs in the row for 'New L T Categories (Total).'
B) For Non Tariff Income, provide direct and apportioned Non Tariff Income (column V and W) for each consumer category
C) Include Revenue from Power Factor Surcharge in OTHERS (column O)
FY 2019-20
Low Tension
LT I: Domestic
Group A: All consumers with annual consumption < = 900
Units during FY 2018-19
0-50
51-100
101-200
Above 200
Group B: All consumers with consumption ( < =2700 and >
900 units) during FY 2018-19
0-50
51-100
101-200
201-300
Above 300
Group C: All consumers with annual consumption >2700
units during FY 2018-19
0-50
51-100
101-200
201-300
301-400
401-500
Above 500 units
Smart Meters ( Optional for above 500 units / month
Time of Day tariff ( ToD ) 10 AM to 12 Noon
LT II: Non-Domestic/Commercial
LT II (A): Upto 50 Units/Month
0-50
LT II (B): Above 50 Units/Month
0-50
51-100
Consumer Categories
Please Note:
A) The user need not enter anything in the yellow spaces in column C for Consumer Categories. For addition of new category, data first needs to be provided in Form A,
which will be automatically reflected in these yellow spaces.
For spaces in orange color, it is to furnish data for the following
1) Segregation or Aggregation of existing slabs
2) Addition of new slab
3) Addition of new sub-category
For LT Category, totals should be manually entered for new categories and slabs in the row for 'New L T Categories (Total).'
B) For Non Tariff Income, provide direct and apportioned Non Tariff Income (column V and W) for each consumer category
C) Include Revenue from Power Factor Surcharge in OTHERS (column O)
Energy
Charges
(Rs Crores)
Demand /Fixed
charges
(Rs Crores)
Minimum
Charges
(Rs Crores)
Customer
Charges
(Rs crores)
Others
(Rs Crores)
Gross Tariff
Revenue
(Rs Crores)
Surchar
ge
(Rs.Crs)
Addition
al
Surchar
ge
(Rs.Crs)
Direct Apportioned
1,923.25 - 37.50 211.82 - 2,172.58 - 2,172.58 - - - - 108.19 2,280.76
324.31 - 25.19 89.70 - 439.20 - 439.20 - - - - 30.07 469.27
162.80 - 25 50.73 238.72 238.72 20.55 259.27
97.87 - 30.49 128.36 128.36 6.89 135.25
39.11 - 7.55 46.66 46.66 1.99 48.65
24.53 - 0.93 25.46 25.46 0.65 26.11
1,045.52 - 9.88 107.28 - 1,162.68 - 1,162.68 - - - - 60.39 1,223.07
320.36 - 10 12.97 343.21 343.21 22.55 365.76
264.88 - 40.96 305.84 305.84 18.64 324.49
294.08 - 47.61 341.69 341.69 14.95 356.64
113.91 - 4.96 118.88 118.88 3.02 121.90
52.28 - 0.78 53.06 53.06 1.23 54.30
553.43 - 2.42 14.84 - 570.70 - 570.70 - - - - 17.72 588.42
39.63 - 2 0.91 42.96 42.96 2.74 45.70
49.66 - 0.86 50.52 50.52 2.71 53.23
140.42 - 5.22 145.63 145.63 4.76 150.39
124.15 - 4.87 129.02 129.02 3.20 132.22
78.01 - 1.75 79.75 79.75 1.80 81.55
45.56 - 0.61 46.17 46.17 0.98 47.15
76.01 - 0.63 76.63 76.63 1.54 78.17
- - 0.00 -
- - 0.00 -
1,007.88 94.81 22.96 22.92 - 1,148.57 - 1,148.57 - - - - 20.55 1,169.11
32.85 11.29 - 11.00 - 55.14 - 55.14 - - - - 1.11 56.26
32.85 11.29 11.00 55.14 55.14 1.11 56.26
963.15 83.34 22.85 11.79 - 1,081.13 - 1,081.13 - - - - 19.25 1,100.38
100.62 16.83 22.85 - 140.29 140.29 2.67 142.96
87.24 10.80 0.00 4.53 102.57 102.57 2.09 104.66
Full year revenue excluding external subsidy
Incentive
s
(Rs. Crs)
Surcharges
(Open Access)Net Revenue
from Tariff
(Rs. Crores)
Non - tariff Income
(Rs crores)Total Revenue
( Net of
incentives)
Grid
Suppor
t
Charge
s
(Rs.
Crores)
184

Form 7 Total Revenue at Current Tariff and Charges
Please Note:
A) The user need not enter anything in the yellow spaces in column C for Consumer Categories. For addition of new category, data first needs to be provided in Form A,
which will be automatically reflected in these yellow spaces.
For spaces in orange color, it is to furnish data for the following
1) Segregation or Aggregation of existing slabs
2) Addition of new slab
3) Addition of new sub-category
For LT Category, totals should be manually entered for new categories and slabs in the row for 'New L T Categories (Total).'
B) For Non Tariff Income, provide direct and apportioned Non Tariff Income (column V and W) for each consumer category
C) Include Revenue from Power Factor Surcharge in OTHERS (column O)
101-300 85,028 9.05 900.00 - 45.00 208 173 0
301-500 18,614 9.60 900.00 - 45.00 104 72 0
Above 500 30,860 10.15 900.00 - 45.00 480 374 0
LT II (C): Advertisement Hoardings 811 12.25 900.00 - 50.00 1 2 0
LT II (D) : Function Halls / Auditoriums/Start up power for
Captive generating plants or Renewable Energy Generating
Plants 1,338
11.75 - - 50.00
9 21 0
LT II (E) : Electric Vehicles ( Evs ) / Charging Stations 4 5.00 250.00 0 0 0
LT III: Industry 19,098.00 378.16 - 389.00 -
(A):Industries (General) 17,597 6.70 900.00 63.00 376 385 0
(B): Seasonal Industries (off season) 15 7.45 900.00 63.00 0 1 0
(D):Cottage Industries upto 10HP * 1,486 3.75 240.00 63.00 2 3 0
LT IV: INSTITUTIONAL 83,532.00 326.45 - 119.00 74,884.00
LT IV (A): Street Lighting 18,838.00 95.87 - 81.00 -
(i) Panchayats 13,753 5.95 900.00 - 35.00 61 42 0
(ii) Municipalities 1,419 6.50 900.00 - 35.00 9 28 0
(iii) Municipal Corporations 3,666 7.05 900.00 - 35.00 26 11 0
LT IV (B): CPWS/PWS Schemes 13,185.00 165.87 - - 73,786.00
(i) Panchayats 12,233 4.85 900.00 35.00 152 0 65,277
(ii) Municipalities 407 5.95 900.00 35.00 8 0 3,605
(iii) Municipal Corporations 545 6.50 900.00 35.00 6 0 4,904
LT-IV (C): NTR Sujala Padhakam 275.00 4.00 120.00 30.00 1.31 - 1,098.00
LT IV (D): General Purpose 34,647.00 7.25 360.00 45.00 49.52 24.00 -
LT IV (E): Religious Places 16,587.00 13.88 - 14.00 -
(i) Religious Places (CL > 2kW) 434 5.00 360.00 30.00 3 3 0
(ii) Religious Places (CL <= 2kW) 16,153 4.80 360.00 30.00 11 11 0
LT V: Agriculture 257,546.00 3,870.90 - 636.00 1,890,540.00
(A): Corporate Farmers & IT Assesses WITH DSM/Salt farming
units upto 15 HP 1,5802.50 - - 30.00
5 0 10,836
(A): Corporate Farmers & IT Assesses without DSM 222,373
3.50 30.00 1 0 3,505
(B): Non corporate farmers with DSM/Sugar cane crushing
/Rural Horticulture Nurseries 603- - - 30.00
2,405 0 916,460
(B): Non corporate farmers without DSM 7,493
2.50 - 30.00 12 0 957,785
(C)Aquaculture and Animal Husbandry 78
3.85 360.00 63.00 1,417 613 0
185

Form 7
Please Note:
A) The user need not enter anything in the yellow spaces in column C for Consumer Categories. For addition of new category, data first needs to be provided in Form A,
which will be automatically reflected in these yellow spaces.
For spaces in orange color, it is to furnish data for the following
1) Segregation or Aggregation of existing slabs
2) Addition of new slab
3) Addition of new sub-category
For LT Category, totals should be manually entered for new categories and slabs in the row for 'New L T Categories (Total).'
B) For Non Tariff Income, provide direct and apportioned Non Tariff Income (column V and W) for each consumer category
C) Include Revenue from Power Factor Surcharge in OTHERS (column O)
101-300
301-500
Above 500
LT II (C): Advertisement Hoardings
LT II (D) : Function Halls / Auditoriums/Start up power for
Captive generating plants or Renewable Energy Generating
Plants
LT II (E) : Electric Vehicles ( Evs ) / Charging Stations
LT III: Industry
(A):Industries (General)
(B): Seasonal Industries (off season)
(D):Cottage Industries upto 10HP *
LT IV: INSTITUTIONAL
LT IV (A): Street Lighting
(i) Panchayats
(ii) Municipalities
(iii) Municipal Corporations
LT IV (B): CPWS/PWS Schemes
(i) Panchayats
(ii) Municipalities
(iii) Municipal Corporations
LT-IV (C): NTR Sujala Padhakam
LT IV (D): General Purpose
LT IV (E): Religious Places
(i) Religious Places (CL > 2kW)
(ii) Religious Places (CL <= 2kW)
LT V: Agriculture
(A): Corporate Farmers & IT Assesses WITH DSM/Salt farming
units upto 15 HP
(A): Corporate Farmers & IT Assesses without DSM
(B): Non corporate farmers with DSM/Sugar cane crushing
/Rural Horticulture Nurseries
(B): Non corporate farmers without DSM
(C)Aquaculture and Animal Husbandry
Please Note:
A) The user need not enter anything in the yellow spaces in column C for Consumer Categories. For addition of new category, data first needs to be provided in Form A,
which will be automatically reflected in these yellow spaces.
For spaces in orange color, it is to furnish data for the following
1) Segregation or Aggregation of existing slabs
2) Addition of new slab
3) Addition of new sub-category
For LT Category, totals should be manually entered for new categories and slabs in the row for 'New L T Categories (Total).'
B) For Non Tariff Income, provide direct and apportioned Non Tariff Income (column V and W) for each consumer category
C) Include Revenue from Power Factor Surcharge in OTHERS (column O)
188.52 15.57 0.00 4.59 208.68 208.68 3.81 212.49
99.71 6.48 0.00 1.01 107.20 107.20 1.90 109.10
487.06 33.66 0.00 1.67 522.39 522.39 8.78 531.17
1.09 0.18 0.09 0.05 1.41 1.41 0.02 1.42
10.77 -
0.02
0.08 10.87 10.87 0.17 11.04
0.01 - 0.00 0.00 0.01 0.01 0.00 0.01
252.64 34.81 - 1.44 - 288.90 - 288.90 - - - - 6.92 295.82
251.61 34.65 1.33 287.59 287.59 6.87 294.46
0.09 0.09 0.00 0.19 0.19 0.00 0.19
0.94 0.07 0.11 1.12 1.12 0.05 1.17
185.85 15.31 - 3.82 - 204.98 - 204.98 - - - - 5.97 210.95
60.39 7.29 - 0.79 - 68.47 - 68.47 - - - - 1.75 70.23
36.37 3.78 0.58 40.73 40.73 1.12 41.85
5.57 2.52 0.06 8.15 8.15 0.16 8.30
18.45 0.99 0.15 19.59 19.59 0.48 20.07
82.30 6.64 - 0.55 - 89.49 - 89.49 - - - - 3.04 92.53
73.70 5.87 0.51 80.08 80.08 2.78 82.86
4.80 0.32 0.02 5.14 5.14 0.15 5.29
3.81 0.44 0.02 4.27 4.27 0.11 4.38
0.52 0.01 0.01 0.55 0.55 0.02 0.57
35.91 0.86 1.87 38.64 38.64 0.91 39.55
6.73 0.50 - 0.60 - 7.83 - 7.83 - - - - 0.25 8.08
1.61 0.11 0.02 1.73 1.73 0.06 1.79
5.12 0.40 0.58 6.09 6.09 0.20 6.29
561.88 24.14 - 10.27 - 596.29 - 596.29 - - - - 70.83 667.13
1.13 - 0.06 1.19 1.19 0.08 1.27
0.31 - 8.01 8.31 8.31 0.02 8.33
- - 0.02 0.02 0.02 44.01 44.03
2.91 - 0.27 3.18 3.18 0.21 3.39
545.57 22.07 0.01 567.65 567.65 25.93 593.58
186

Form 7 Total Revenue at Current Tariff and Charges
Please Note:
A) The user need not enter anything in the yellow spaces in column C for Consumer Categories. For addition of new category, data first needs to be provided in Form A,
which will be automatically reflected in these yellow spaces.
For spaces in orange color, it is to furnish data for the following
1) Segregation or Aggregation of existing slabs
2) Addition of new slab
3) Addition of new sub-category
For LT Category, totals should be manually entered for new categories and slabs in the row for 'New L T Categories (Total).'
B) For Non Tariff Income, provide direct and apportioned Non Tariff Income (column V and W) for each consumer category
C) Include Revenue from Power Factor Surcharge in OTHERS (column O)
(D) Poultry Hactcheries & Poultry Feed mixing plants, Aqua
Hatcheries and Aqua feed mixing plants/Floriculture in Green
House 24,626
3.85 900.00 63.00 31 23 0
(E):Agro Based Activities upto 10 HP 629 3.75 240.00 63.00 0 0 0
(F):Government / Private Lift Irrigation Schemes 164 - 30.00 1 0 1,954
Total LT 6,034,629.00 11,610.44 - 6,843.00 1,965,424.00
High Tension
HT Category at 11 kv 3,603.00 2,409.58 - 923.45 -
HT I B: Town ships and Residential colonies 40 6.30 900.00 1,406.00 19 11 0
HT II COMMERCIAL AND OTHERS 1,564.00 504.85 - 307.00 -
HT II A:Commercial 1,393 7.65 5,700.00 - 1,406.00 365 264 0
Time of Day Tariff (TOD)-peak (6 PM to 10 PM) 0 8.65 - 101 0 0
HT II B: Public Infrastructure and Tourism 48 7.30 5,700.00 - 1,406.00 24 12 0
Time of Day Tariff (TOD)-peak (6 PM to 10 PM) 0 8.30 8 0 0
HT II (D): Function Halls / Auditoriums/Start up power for Captive
generating plants or Renewable Energy Generating Plants 123
11.75 - 1,406.00
7 31 0
HT II (E): Electrical Vehicles ( EVs ) / Charging Stations 0 5.00 - 900.00 0 0 0
HT II (F) :Green Power 0 11.30 - 900.00 0 0 0
HT III INDUSTRY 1,658.00 1,316.18 - 511.00 -
HT III A: Industry(General) 1,636 6.30 5,700.00 1,406.00 455 505 0
Time of Day Tariffs ( ToD ) peak (6 AM to 10 AM & 6 PM to 10
PM) 07.30 -
438 0 0
Time of Day Tariffs ( ToD ) off peak (10 PM to 6 AM) 0 5.30 - - 412 0 0
Industrial Colonies 0 6.30 - 2 0 0
HT III B:Seasonal Industries(off season) 22 7.65 5,700.00 - 1,406.00 9 6 0
HT III C : Energy Intensive Industries 0 5.80 - 0 0 0
HT IV INSTITUTIONAL 105.00 94.87 - 24.00 -
HT IV B:CPWS/PWS Schemes 94 4.85 1,406.00 92 22 0
HT IV E:Religious places 11 5.00 360.00 1,406.00 3 2 0
HT V AGRICULTURE AND RELATED 234.00 94.85 - 66.00 -
HT V ( C) : Aquaculture and Animal Husbandry 26 3.85 360.00 1,406.00 17 7 0
HT V(D) : Poultry Hactcheries & Poultry Feed mixing plants,
Aqua Hatcheries & Aqua Feed mixing plants /
Floriculture in Green House 94
4.85 5,700.00 1,406.00
58 23 0
HT V (F) : Government / Private Lift Irrigation Schemes 114 5.80 1,406.00 20 36 0
RESCOs 2.00 0.96 1,406.00 380.18 - 4 0
RESCOs
187

Form 7
Please Note:
A) The user need not enter anything in the yellow spaces in column C for Consumer Categories. For addition of new category, data first needs to be provided in Form A,
which will be automatically reflected in these yellow spaces.
For spaces in orange color, it is to furnish data for the following
1) Segregation or Aggregation of existing slabs
2) Addition of new slab
3) Addition of new sub-category
For LT Category, totals should be manually entered for new categories and slabs in the row for 'New L T Categories (Total).'
B) For Non Tariff Income, provide direct and apportioned Non Tariff Income (column V and W) for each consumer category
C) Include Revenue from Power Factor Surcharge in OTHERS (column O)
(D) Poultry Hactcheries & Poultry Feed mixing plants, Aqua
Hatcheries and Aqua feed mixing plants/Floriculture in Green
House (E):Agro Based Activities upto 10 HP
(F):Government / Private Lift Irrigation Schemes
Total LT
High Tension
HT Category at 11 kv
HT I B: Town ships and Residential colonies
HT II COMMERCIAL AND OTHERS
HT II A:Commercial
Time of Day Tariff (TOD)-peak (6 PM to 10 PM)
HT II B: Public Infrastructure and Tourism
Time of Day Tariff (TOD)-peak (6 PM to 10 PM)
HT II (D): Function Halls / Auditoriums/Start up power for Captive
generating plants or Renewable Energy Generating Plants
HT II (E): Electrical Vehicles ( EVs ) / Charging Stations
HT II (F) :Green Power
HT III INDUSTRY
HT III A: Industry(General)
Time of Day Tariffs ( ToD ) peak (6 AM to 10 AM & 6 PM to 10
PM)
Time of Day Tariffs ( ToD ) off peak (10 PM to 6 AM)
Industrial Colonies
HT III B:Seasonal Industries(off season)
HT III C : Energy Intensive Industries
HT IV INSTITUTIONAL
HT IV B:CPWS/PWS Schemes
HT IV E:Religious places
HT V AGRICULTURE AND RELATED
HT V ( C) : Aquaculture and Animal Husbandry
HT V(D) : Poultry Hactcheries & Poultry Feed mixing plants,
Aqua Hatcheries & Aqua Feed mixing plants /
Floriculture in Green House
HT V (F) : Government / Private Lift Irrigation Schemes
RESCOs
RESCOs
Please Note:
A) The user need not enter anything in the yellow spaces in column C for Consumer Categories. For addition of new category, data first needs to be provided in Form A,
which will be automatically reflected in these yellow spaces.
For spaces in orange color, it is to furnish data for the following
1) Segregation or Aggregation of existing slabs
2) Addition of new slab
3) Addition of new sub-category
For LT Category, totals should be manually entered for new categories and slabs in the row for 'New L T Categories (Total).'
B) For Non Tariff Income, provide direct and apportioned Non Tariff Income (column V and W) for each consumer category
C) Include Revenue from Power Factor Surcharge in OTHERS (column O)
11.84 2.07 1.86 15.77 15.77 0.56 16.33
0.12 - 0.05 0.17 0.17 0.01 0.17
- - 0.01 0.01 0.01 0.01 0.02
3,931.50 169.07 60.46 250.28 - 4,411.31 - 4,411.31 - - - - 212.46 4,623.77
1,372.47 463.01 - 6.08 - 1,841.56 1.17 1,840.39 - - - - 44.09 1,884.48
11.75 0.99 0.07 12.81 12.81 0.34 13.15
398.99 157.32 - 2.64 - 558.95 - 558.95 - - - - 9.24 568.19
279.17 150.48 2.35 432.00 432.00 6.68 438.68
87.02 - - 87.02 87.02 1.84 88.86
17.32 6.84 0.08 24.24 24.24 0.43 24.67
6.85 - - 6.85 6.85 0.15 7.00
8.64 - 0.21 8.84 8.84 0.13 8.98
- - - - - 0.00 -
- - - - - 0.00 -
832.98 291.27 - 2.80 - 1,127.05 1.17 1,125.88 - - - - 24.09 1,149.97
286.52 287.85 2.76 577.13 1.17 575.96 8.32 584.29
319.75 - - 319.75 319.75 8.02 327.76
218.42 - - 218.42 218.42 7.54 225.96
1.49 - - 1.49 1.49 0.04 1.53
6.80 3.42 0.04 10.26 10.26 0.16 10.42
- - - - - 0.00 -
46.06 0.07 - 0.18 - 46.31 - 46.31 - - - - 1.74 48.04
44.47 - 0.16 44.63 44.63 1.68 46.31
1.59 0.07 0.02 1.68 1.68 0.06 1.73
46.19 13.36 - 0.39 - 59.94 - 59.94 - - - - 1.74 61.68
6.57 0.25 0.04 6.87 6.87 0.31 7.18
28.06 13.11 0.16 41.33 41.33 1.06 42.39
11.55 - 0.19 11.74 11.74 0.36 12.11
36.50 - 0.00 36.50 36.50 6.96 43.46
- - - - - 0.00 -
188

Form 7 Total Revenue at Current Tariff and Charges
Please Note:
A) The user need not enter anything in the yellow spaces in column C for Consumer Categories. For addition of new category, data first needs to be provided in Form A,
which will be automatically reflected in these yellow spaces.
For spaces in orange color, it is to furnish data for the following
1) Segregation or Aggregation of existing slabs
2) Addition of new slab
3) Addition of new sub-category
For LT Category, totals should be manually entered for new categories and slabs in the row for 'New L T Categories (Total).'
B) For Non Tariff Income, provide direct and apportioned Non Tariff Income (column V and W) for each consumer category
C) Include Revenue from Power Factor Surcharge in OTHERS (column O)
HT Category at 33 kv 264.00 1,891.88 - 638.00 -
HT I B: Town ships and Residential colonies 3 6.30 900.00 2,813.00 11 4 0
HT II COMMERCIAL AND OTHERS 73.00 194.94 - 91.00 -
HT II A:Commercial 60 6.95 5,700.00 2,813.00 144 83 0
Time of Day Tariff (TOD)-peak (6 PM to 10 PM) 0 7.95 32 0 0
HT II B: Public Infrastructure and Tourism 2 6.65 5,700.00 2,813.00 10 3 0
Time of Day Tariff (TOD)-peak (6 PM to 10 PM) 0 7.65 3 0 0
HT II (D): Function Halls / Auditoriums/Start up power for Captive
generating plants or Renewable Energy Generating Plants 11
11.75 2,813.00
5 5 0
HT II (E): Electrical Vehicles ( EVs ) / Charging Stations 0 5.00 0 0 0
HT II (F) :Green Power 0 11.30 0 0 0
HT III INDUSTRY 163.00 1,565.36 - 435.00 -
HT III A: Industry(General) 154 5.85 5,700.00 2,813.00 297 396 0
Time of Day Tariffs ( ToD ) peak (6 AM to 10 AM & 6 PM to 10
PM) 06.85
534 0 0
Time of Day Tariffs ( ToD ) off peak (10 PM to 6 AM) 0 4.85 543 0 0
Industrial Colonies 0 6.30 1 0 0
HT III B:Seasonal Industries(off season) 2 6.95 5,700.00 2,813.00 7 5 0
HT III C : Energy Intensive Industries 7 5.35 2,813.00 183 34 0
HT IV INSTITUTIONAL 1.00 0.11 - - -
HT IV B:CPWS/PWS Schemes 1 4.85 2,813.00 0 0 0
HT IV E:Religious places 0 5.00 360.00 - 0 0 0
HT V AGRICULTURE AND RELATED 24.00 120.26 - 108.00 -
HT V ( C) : Aquaculture and Animal Husbandry 0 3.85 360.00 0 0 0
HT V(D) : Poultry Hactcheries & Poultry Feed mixing plants,
Aqua Hatcheries & Aqua Feed mixing plants /
Floriculture in Green House 6
4.85 5,700.00 2,813.00
59 11 0
HT V (F) : Government / Private Lift Irrigation Schemes 18 5.80 2,813.00 62 97 0
HT Category at 132 kv 69.00 4,864.91 - 1,416.00 -
HT I B: Town ships and Residential colonies 0 6.30 900.00 - 2,813.00 0 0 0
HT II COMMERCIAL AND OTHERS 14.00 73.83 - 41.00 -
HT II A:Commercial 7 6.70 5,700.00 2,813.00 57 26 0
Time of Day Tariff (TOD)-peak (6 PM to 10 PM) 0 7.70 14 0 0
HT II B: Public Infrastructure and Tourism 0 6.35 5,700.00 0 0 0
Time of Day Tariff (TOD)-peak (6 PM to 10 PM) 0 7.35 0 0 0
HT II (D): Function Halls / Auditoriums/Start up power for Captive
generating plants or Renewable Energy Generating Plants 7
11.75 2,813.00
3 15 0
189

Form 7
Please Note:
A) The user need not enter anything in the yellow spaces in column C for Consumer Categories. For addition of new category, data first needs to be provided in Form A,
which will be automatically reflected in these yellow spaces.
For spaces in orange color, it is to furnish data for the following
1) Segregation or Aggregation of existing slabs
2) Addition of new slab
3) Addition of new sub-category
For LT Category, totals should be manually entered for new categories and slabs in the row for 'New L T Categories (Total).'
B) For Non Tariff Income, provide direct and apportioned Non Tariff Income (column V and W) for each consumer category
C) Include Revenue from Power Factor Surcharge in OTHERS (column O)
HT Category at 33 kv
HT I B: Town ships and Residential colonies
HT II COMMERCIAL AND OTHERS
HT II A:Commercial
Time of Day Tariff (TOD)-peak (6 PM to 10 PM)
HT II B: Public Infrastructure and Tourism
Time of Day Tariff (TOD)-peak (6 PM to 10 PM)
HT II (D): Function Halls / Auditoriums/Start up power for Captive
generating plants or Renewable Energy Generating Plants
HT II (E): Electrical Vehicles ( EVs ) / Charging Stations
HT II (F) :Green Power
HT III INDUSTRY
HT III A: Industry(General)
Time of Day Tariffs ( ToD ) peak (6 AM to 10 AM & 6 PM to 10
PM)
Time of Day Tariffs ( ToD ) off peak (10 PM to 6 AM)
Industrial Colonies
HT III B:Seasonal Industries(off season)
HT III C : Energy Intensive Industries
HT IV INSTITUTIONAL
HT IV B:CPWS/PWS Schemes
HT IV E:Religious places
HT V AGRICULTURE AND RELATED
HT V ( C) : Aquaculture and Animal Husbandry
HT V(D) : Poultry Hactcheries & Poultry Feed mixing plants,
Aqua Hatcheries & Aqua Feed mixing plants /
Floriculture in Green House
HT V (F) : Government / Private Lift Irrigation Schemes
HT Category at 132 kv
HT I B: Town ships and Residential colonies
HT II COMMERCIAL AND OTHERS
HT II A:Commercial
Time of Day Tariff (TOD)-peak (6 PM to 10 PM)
HT II B: Public Infrastructure and Tourism
Time of Day Tariff (TOD)-peak (6 PM to 10 PM)
HT II (D): Function Halls / Auditoriums/Start up power for Captive
generating plants or Renewable Energy Generating Plants
Please Note:
A) The user need not enter anything in the yellow spaces in column C for Consumer Categories. For addition of new category, data first needs to be provided in Form A,
which will be automatically reflected in these yellow spaces.
For spaces in orange color, it is to furnish data for the following
1) Segregation or Aggregation of existing slabs
2) Addition of new slab
3) Addition of new sub-category
For LT Category, totals should be manually entered for new categories and slabs in the row for 'New L T Categories (Total).'
B) For Non Tariff Income, provide direct and apportioned Non Tariff Income (column V and W) for each consumer category
C) Include Revenue from Power Factor Surcharge in OTHERS (column O)
1,118.92 284.22 - 0.89 - 1,404.03 2.83 1,401.21 - - - - 34.62 1,435.83
7.06 0.36 0.01 7.44 7.44 0.21 7.64
141.14 49.02 - 0.25 - 190.41 - 190.41 - - - - 3.57 193.98
100.39 47.31 0.20 147.91 147.91 2.64 150.55
25.66 - - 25.66 25.66 0.59 26.25
6.81 1.71 0.01 8.52 8.52 0.19 8.71
2.03 - - 2.03 2.03 0.05 2.08
6.25 - 0.04 6.29 6.29 0.10 6.39
- - - - - 0.00 -
- - - - - 0.00 -
906.49 228.57 - 0.55 - 1,135.61 2.83 1,132.79 - - - - 28.64 1,161.43
173.61 225.72 0.52 399.85 3 397.02 5.43 402.46
365.82 - - 365.82 365.82 9.77 375.59
263.45 - - 263.45 263.45 9.94 273.39
0.90 - - 0.90 0.90 0.03 0.93
4.78 2.85 0.01 7.64 7.64 0.13 7.77
97.93 - 0.02 97.95 97.95 3.35 101.30
0.05 - - 0.00 - 0.06 - 0.06 - - - - 0.00 0.06
0.05 - 0.00 0.06 0.06 0.00 0.06
- - - - - 0.00 -
64.17 6.27 - 0.08 - 70.52 - 70.52 - - - - 2.20 72.72
- - - - - 0.00 -
28.49 6.27 0.02 34.78 34.78 1.07 35.86
35.68 - 0.06 35.74 35.74 1.13 36.86
2,404.61 388.44 0.23 - 2,793.28 1.72 2,791.56 - - - - 89.02 2,880.58
- - - - - 0.00 -
52.48 14.82 0.05 - 67.35 - 67.35 - - - - 1.35 68.70
37.97 14.82 0.02 52.81 52.81 1.04 53.85
10.74 - - 10.74 10.74 0.26 10.99
- - - - - 0.00 -
- - - - - 0.00 -
3.78 - 0.02 3.80 3.80 0.06 3.86
190

Form 7 Total Revenue at Current Tariff and Charges
Please Note:
A) The user need not enter anything in the yellow spaces in column C for Consumer Categories. For addition of new category, data first needs to be provided in Form A,
which will be automatically reflected in these yellow spaces.
For spaces in orange color, it is to furnish data for the following
1) Segregation or Aggregation of existing slabs
2) Addition of new slab
3) Addition of new sub-category
For LT Category, totals should be manually entered for new categories and slabs in the row for 'New L T Categories (Total).'
B) For Non Tariff Income, provide direct and apportioned Non Tariff Income (column V and W) for each consumer category
C) Include Revenue from Power Factor Surcharge in OTHERS (column O)
HT II (E): Electrical Vehicles ( EVs ) / Charging Stations 0 5.00 0 0 0
HT II (F) :Green Power 0 11.30 0 0 0
HT III INDUSTRY 34.00 3,888.89 - 881.00 -
HT III A: Industry(General) 23 5.40 5,700.00 2,813.00 297 472 0
Time of Day Tariffs ( ToD ) peak (6 AM to 10 AM & 6 PM to 10
PM) 0 6.40 447 0 0
Time of Day Tariffs ( ToD ) off peak (10 PM to 6 AM) 0 4.40 456 0 0
Industrial Colonies 0 6.30 64 0 0
HT III B:Seasonal Industries(off season) 0 6.70 5,700.00 0 0 0
HT III C : Energy Intensive Industries 11 4.95 2,813.00 2,625 409 0
HT IV INSTITUTIONAL 18.00 770.07 - 249.00 -
HT IV B:CPWS/PWS Schemes 0 4.85 0 0 0
HT IV E:Religious places 0 5.00 360.00 0 0 0
HT IV F: Railway Traction 18 3.75 4,200.00 2,813.00 770 249 0
HT V AGRICULTURE AND RELATED 3.00 132.12 - 245.00 -
HT V ( C) : Aquaculture and Animal Husbandry 0 3.85 360.00 0 0 0
HT V(D) : Poultry Hactcheries & Poultry Feed mixing plants,
Aqua Hatcheries & Aqua Feed mixing plants /
Floriculture in Green House 0
4.85 5,700.00
0 0 0
HT V (F) : Government / Private Lift Irrigation Schemes 3 5.80 2,813.00 132 245 0
Total HT 3,936.00 9,166.37 - 2,977.45 -
Total (LT + HT) 6,038,565.00 20,776.81 - 9,820.45 1,965,424.00
191
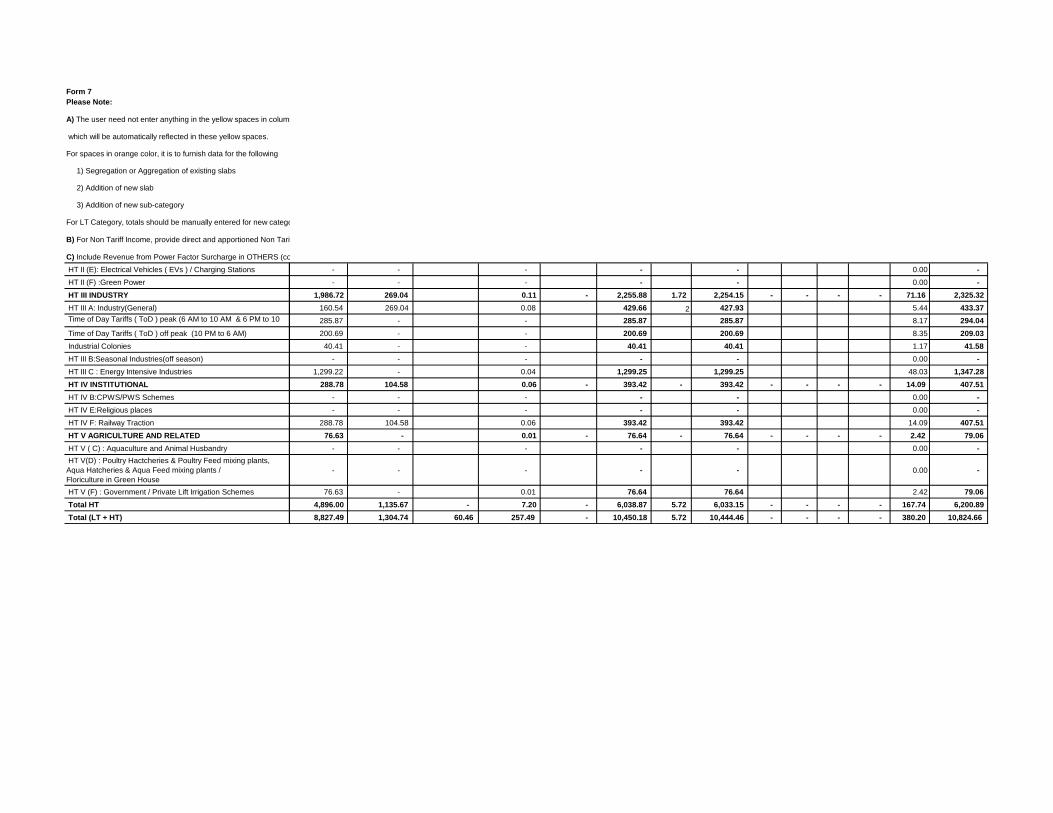
Form 7
Please Note:
A) The user need not enter anything in the yellow spaces in column C for Consumer Categories. For addition of new category, data first needs to be provided in Form A,
which will be automatically reflected in these yellow spaces.
For spaces in orange color, it is to furnish data for the following
1) Segregation or Aggregation of existing slabs
2) Addition of new slab
3) Addition of new sub-category
For LT Category, totals should be manually entered for new categories and slabs in the row for 'New L T Categories (Total).'
B) For Non Tariff Income, provide direct and apportioned Non Tariff Income (column V and W) for each consumer category
C) Include Revenue from Power Factor Surcharge in OTHERS (column O)
HT II (E): Electrical Vehicles ( EVs ) / Charging Stations
HT II (F) :Green Power
HT III INDUSTRY
HT III A: Industry(General)
Time of Day Tariffs ( ToD ) peak (6 AM to 10 AM & 6 PM to 10
PM) Time of Day Tariffs ( ToD ) off peak (10 PM to 6 AM)
Industrial Colonies
HT III B:Seasonal Industries(off season)
HT III C : Energy Intensive Industries
HT IV INSTITUTIONAL
HT IV B:CPWS/PWS Schemes
HT IV E:Religious places
HT IV F: Railway Traction
HT V AGRICULTURE AND RELATED
HT V ( C) : Aquaculture and Animal Husbandry
HT V(D) : Poultry Hactcheries & Poultry Feed mixing plants,
Aqua Hatcheries & Aqua Feed mixing plants /
Floriculture in Green House
HT V (F) : Government / Private Lift Irrigation Schemes
Total HT
Total (LT + HT)
Please Note:
A) The user need not enter anything in the yellow spaces in column C for Consumer Categories. For addition of new category, data first needs to be provided in Form A,
which will be automatically reflected in these yellow spaces.
For spaces in orange color, it is to furnish data for the following
1) Segregation or Aggregation of existing slabs
2) Addition of new slab
3) Addition of new sub-category
For LT Category, totals should be manually entered for new categories and slabs in the row for 'New L T Categories (Total).'
B) For Non Tariff Income, provide direct and apportioned Non Tariff Income (column V and W) for each consumer category
C) Include Revenue from Power Factor Surcharge in OTHERS (column O)
- - - - - 0.00 -
- - - - - 0.00 -
1,986.72 269.04 0.11 - 2,255.88 1.72 2,254.15 - - - - 71.16 2,325.32
160.54 269.04 0.08 429.66 2 427.93 5.44 433.37
285.87 - - 285.87 285.87 8.17 294.04
200.69 - - 200.69 200.69 8.35 209.03
40.41 - - 40.41 40.41 1.17 41.58
- - - - - 0.00 -
1,299.22 - 0.04 1,299.25 1,299.25 48.03 1,347.28
288.78 104.58 0.06 - 393.42 - 393.42 - - - - 14.09 407.51
- - - - - 0.00 -
- - - - - 0.00 -
288.78 104.58 0.06 393.42 393.42 14.09 407.51
76.63 - 0.01 - 76.64 - 76.64 - - - - 2.42 79.06
- - - - - 0.00 -
- - - - - 0.00 -
76.63 - 0.01 76.64 76.64 2.42 79.06
4,896.00 1,135.67 - 7.20 - 6,038.87 5.72 6,033.15 - - - - 167.74 6,200.89
8,827.49 1,304.74 60.46 257.49 - 10,450.18 5.72 10,444.46 - - - - 380.20 10,824.66
192

Form 7 Total Revenue at Current Tariff and Charges
Please Note:
A) The user need not enter anything in the yellow spaces in column C for Consumer Categories. For addition of new category, data first needs to be provided in Form A,
which will be automatically reflected in these yellow spaces.
For spaces in orange color, it is to furnish data for the following
1) Segregation or Aggregation of existing slabs
2) Addition of new slab
3) Addition of new sub-category
For LT Category, totals should be manually entered for new categories and slabs in the row for 'New L T Categories (Total).'
B) For Non Tariff Income, provide direct and apportioned Non Tariff Income (column V and W) for each consumer category
C) Include Revenue from Power Factor Surcharge in OTHERS (column O)
FY 2020-21
Energy
Charges
(Rs/kWh) or
(Rs.kVAh)
Demand
charges
(Rs/kVA/Yr)
Demand
charges
(Rs/HP/Yr)
Customer
charges
Energy Sales
(MU)
Energy
sales
(MVAh)
Connected Load/
Contract Demand
(MW)
Connected Load/
Contract
Demand
(HP)
Low Tension
I(A): Domestic -LT 5,286,562.00 6,355.75 - 5,040.00 -
Group A : Consumption ≤ 75 Units during the billing month 3,029,294.00 1,281.95 - 2,011.00 -
0-50 2,049,637 1 - - 25 1,069 1,303 -
51-75 979,657 3 - - 30 213 708 -
Group B: Consumption > 75 and ≤ 225 units during the
billing month 2,097,033 3,433 - 2,546 -
0-50 - 3 - - 35 1,250 - -
51-100 794,795 3 - - 40 1,147 722 -
101-200 1,224,316 4 - - 45 857 1,658 -
201-225 77,922 7 - - 50 179 166 -
Group C: Consumption > 225 units during the billing month 160,235 1,641 - 483 -
0-50 - 3 - - 35 212 - -
51-100 - 3 - - 40 211 - -
101-200 - 5 - - 45 416 - -
201-300 101,101 7 - - 50 325 256 -
301-400 36,544 8 - - 55 170 119 -
401-500 11,389 9 - - 55 107 46 -
Above 500 units 11,201 10 - - 55 199 62 -
Smart Meters ( Optional for above 500 units / month - - - - - - - -
Time of Day tariff ( ToD ) 10 AM to 12 Noon - - - - - - - -
II(A): Commercial -LT 564,186.00 927.50 - 1,231.00 -
II (A) (i): Commercial(Minor) -LT 321,219 68 - 390 -
0-50 321,219 5 660 - 30 68 390 -
II (A) (ii): Commercial(Major) -LT 242,967.00 859.43 - 841.00 -
0-50 - 7 900 - 30 118 - -
51-100 98,998 8 900 - 40 91 131 -
Consumer Categories No of consumers
Components of tariff Relevant sales related data
193
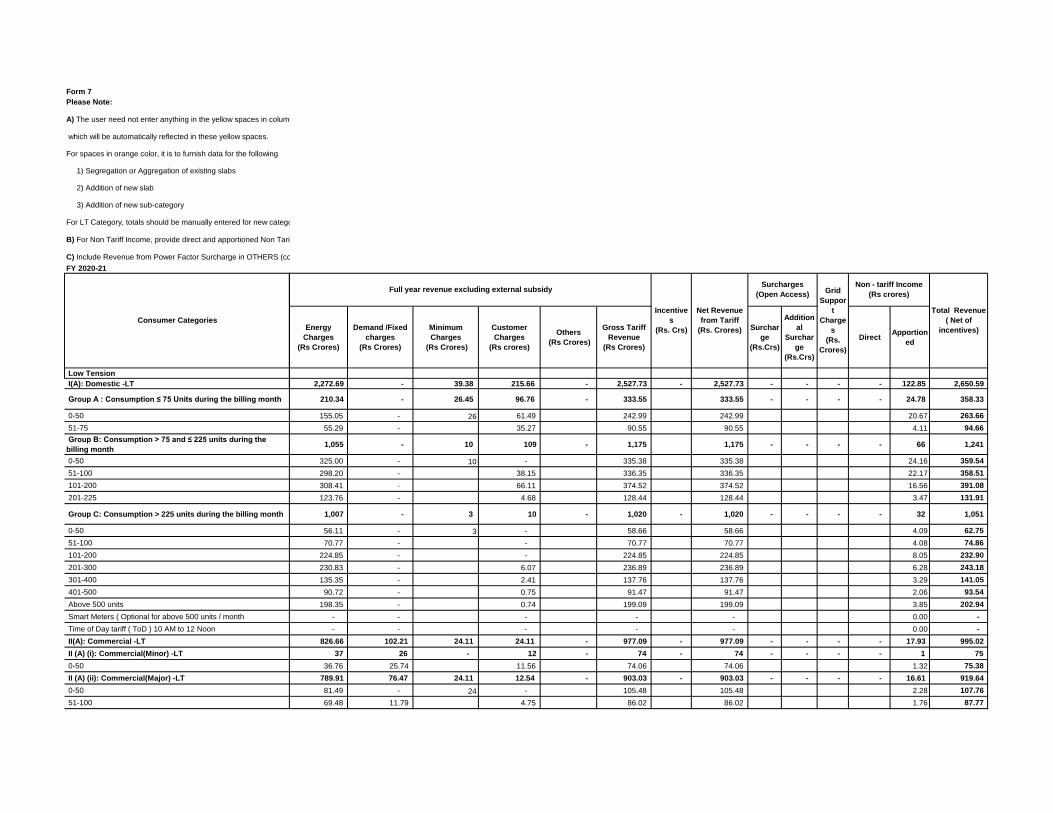
Form 7
Please Note:
A) The user need not enter anything in the yellow spaces in column C for Consumer Categories. For addition of new category, data first needs to be provided in Form A,
which will be automatically reflected in these yellow spaces.
For spaces in orange color, it is to furnish data for the following
1) Segregation or Aggregation of existing slabs
2) Addition of new slab
3) Addition of new sub-category
For LT Category, totals should be manually entered for new categories and slabs in the row for 'New L T Categories (Total).'
B) For Non Tariff Income, provide direct and apportioned Non Tariff Income (column V and W) for each consumer category
C) Include Revenue from Power Factor Surcharge in OTHERS (column O)
FY 2020-21
Low Tension
I(A): Domestic -LT
Group A : Consumption ≤ 75 Units during the billing month
0-50
51-75
Group B: Consumption > 75 and ≤ 225 units during the
billing month
0-50
51-100
101-200
201-225
Group C: Consumption > 225 units during the billing month
0-50
51-100
101-200
201-300
301-400
401-500
Above 500 units
Smart Meters ( Optional for above 500 units / month
Time of Day tariff ( ToD ) 10 AM to 12 Noon
II(A): Commercial -LT
II (A) (i): Commercial(Minor) -LT
0-50
II (A) (ii): Commercial(Major) -LT
0-50
51-100
Consumer Categories
Please Note:
A) The user need not enter anything in the yellow spaces in column C for Consumer Categories. For addition of new category, data first needs to be provided in Form A,
which will be automatically reflected in these yellow spaces.
For spaces in orange color, it is to furnish data for the following
1) Segregation or Aggregation of existing slabs
2) Addition of new slab
3) Addition of new sub-category
For LT Category, totals should be manually entered for new categories and slabs in the row for 'New L T Categories (Total).'
B) For Non Tariff Income, provide direct and apportioned Non Tariff Income (column V and W) for each consumer category
C) Include Revenue from Power Factor Surcharge in OTHERS (column O)
Energy
Charges
(Rs Crores)
Demand /Fixed
charges
(Rs Crores)
Minimum
Charges
(Rs Crores)
Customer
Charges
(Rs crores)
Others
(Rs Crores)
Gross Tariff
Revenue
(Rs Crores)
Surchar
ge
(Rs.Crs)
Addition
al
Surchar
ge
(Rs.Crs)
DirectApportion
ed
2,272.69 - 39.38 215.66 - 2,527.73 - 2,527.73 - - - - 122.85 2,650.59
210.34 - 26.45 96.76 - 333.55 333.55 - - - - 24.78 358.33
155.05 - 26 61.49 242.99 242.99 20.67 263.66
55.29 - 35.27 90.55 90.55 4.11 94.66
1,055 - 10 109 - 1,175 1,175 - - - - 66 1,241
325.00 - 10 - 335.38 335.38 24.16 359.54
298.20 - 38.15 336.35 336.35 22.17 358.51
308.41 - 66.11 374.52 374.52 16.56 391.08
123.76 - 4.68 128.44 128.44 3.47 131.91
1,007 - 3 10 - 1,020 - 1,020 - - - - 32 1,051
56.11 - 3 - 58.66 58.66 4.09 62.75
70.77 - - 70.77 70.77 4.08 74.86
224.85 - - 224.85 224.85 8.05 232.90
230.83 - 6.07 236.89 236.89 6.28 243.18
135.35 - 2.41 137.76 137.76 3.29 141.05
90.72 - 0.75 91.47 91.47 2.06 93.54
198.35 - 0.74 199.09 199.09 3.85 202.94
- - - - - 0.00 -
- - - - - 0.00 -
826.66 102.21 24.11 24.11 - 977.09 - 977.09 - - - - 17.93 995.02
37 26 - 12 - 74 - 74 - - - - 1 75
36.76 25.74 11.56 74.06 74.06 1.32 75.38
789.91 76.47 24.11 12.54 - 903.03 - 903.03 - - - - 16.61 919.64
81.49 - 24 - 105.48 105.48 2.28 107.76
69.48 11.79 4.75 86.02 86.02 1.76 87.77
Net Revenue
from Tariff
(Rs. Crores)
Grid
Suppor
t
Charge
s
(Rs.
Crores)
Non - tariff Income
(Rs crores)
Total Revenue
( Net of
incentives)
Full year revenue excluding external subsidySurcharges
(Open Access)
Incentive
s
(Rs. Crs)
194
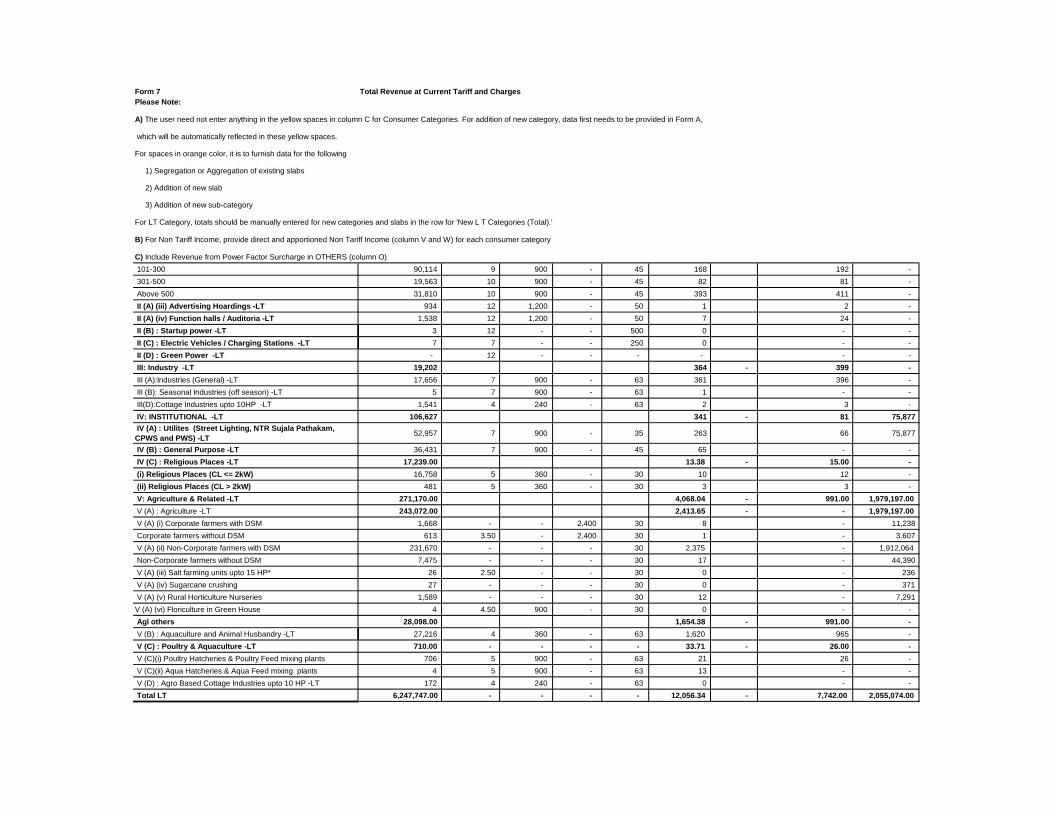
Form 7 Total Revenue at Current Tariff and Charges
Please Note:
A) The user need not enter anything in the yellow spaces in column C for Consumer Categories. For addition of new category, data first needs to be provided in Form A,
which will be automatically reflected in these yellow spaces.
For spaces in orange color, it is to furnish data for the following
1) Segregation or Aggregation of existing slabs
2) Addition of new slab
3) Addition of new sub-category
For LT Category, totals should be manually entered for new categories and slabs in the row for 'New L T Categories (Total).'
B) For Non Tariff Income, provide direct and apportioned Non Tariff Income (column V and W) for each consumer category
C) Include Revenue from Power Factor Surcharge in OTHERS (column O)
101-300 90,114 9 900 - 45 168 192 -
301-500 19,563 10 900 - 45 82 81 -
Above 500 31,810 10 900 - 45 393 411 -
II (A) (iii) Advertising Hoardings -LT 934 12 1,200 - 50 1 2 -
II (A) (iv) Function halls / Auditoria -LT 1,538 12 1,200 - 50 7 24 -
II (B) : Startup power -LT 3 12 - - 500 0 - -
II (C) : Electric Vehicles / Charging Stations -LT 7 7 - - 250 0 - -
II (D) : Green Power -LT - 12 - - - - - -
III: Industry -LT 19,202 364 - 399 -
III (A):Industries (General) -LT 17,656 7 900 - 63 361 396 -
III (B): Seasonal Industries (off season) -LT 5 7 900 - 63 1 - -
III(D):Cottage Industries upto 10HP -LT 1,541 4 240 - 63 2 3 -
IV: INSTITUTIONAL -LT 106,627 341 - 81 75,877
IV (A) : Utilites (Street Lighting, NTR Sujala Pathakam,
CPWS and PWS) -LT 52,957 7 900 - 35 263 66 75,877
IV (B) : General Purpose -LT 36,431 7 900 - 45 65 - -
IV (C) : Religious Places -LT 17,239.00 13.38 - 15.00 -
(i) Religious Places (CL <= 2kW) 16,758 5 360 - 30 10 12 -
(ii) Religious Places (CL > 2kW) 481 5 360 - 30 3 3 -
V: Agriculture & Related -LT 271,170.00 4,068.04 - 991.00 1,979,197.00
V (A) : Agriculture -LT 243,072.00 2,413.65 - - 1,979,197.00
V (A) (i) Corporate farmers with DSM 1,668 - - 2,400 30 8 - 11,238
Corporate farmers without DSM 613 3.50 - 2,400 30 1 - 3,607
V (A) (ii) Non-Corporate farmers with DSM 231,670 - - - 30 2,375 - 1,912,064
Non-Corporate farmers without DSM 7,475 - - - 30 17 - 44,390
V (A) (iii) Salt farming units upto 15 HP* 26 2.50 - - 30 0 - 236
V (A) (iv) Sugarcane crushing 27 - - - 30 0 - 371
V (A) (v) Rural Horticulture Nurseries 1,589 - - - 30 12 - 7,291
V (A) (vi) Floriculture in Green House 4 4.50 900 - 30 0 - -
Agl others 28,098.00 1,654.38 - 991.00 -
V (B) : Aquaculture and Animal Husbandry -LT 27,216 4 360 - 63 1,620 965 -
V (C) : Poultry & Aquaculture -LT 710.00 - - - - 33.71 - 26.00 -
V (C)(i) Poultry Hatcheries & Poultry Feed mixing plants 706 5 900 - 63 21 26 -
V (C)(ii) Aqua Hatcheries & Aqua Feed mixing plants 4 5 900 - 63 13 - -
V (D) : Agro Based Cottage Industries upto 10 HP -LT 172 4 240 - 63 0 - -
Total LT 6,247,747.00 - - - - 12,056.34 - 7,742.00 2,055,074.00
195

Form 7
Please Note:
A) The user need not enter anything in the yellow spaces in column C for Consumer Categories. For addition of new category, data first needs to be provided in Form A,
which will be automatically reflected in these yellow spaces.
For spaces in orange color, it is to furnish data for the following
1) Segregation or Aggregation of existing slabs
2) Addition of new slab
3) Addition of new sub-category
For LT Category, totals should be manually entered for new categories and slabs in the row for 'New L T Categories (Total).'
B) For Non Tariff Income, provide direct and apportioned Non Tariff Income (column V and W) for each consumer category
C) Include Revenue from Power Factor Surcharge in OTHERS (column O)
101-300
301-500
Above 500
II (A) (iii) Advertising Hoardings -LT
II (A) (iv) Function halls / Auditoria -LT
II (B) : Startup power -LT
II (C) : Electric Vehicles / Charging Stations -LT
II (D) : Green Power -LT
III: Industry -LT
III (A):Industries (General) -LT
III (B): Seasonal Industries (off season) -LT
III(D):Cottage Industries upto 10HP -LT
IV: INSTITUTIONAL -LT
IV (A) : Utilites (Street Lighting, NTR Sujala Pathakam,
CPWS and PWS) -LT
IV (B) : General Purpose -LT
IV (C) : Religious Places -LT
(i) Religious Places (CL <= 2kW)
(ii) Religious Places (CL > 2kW)
V: Agriculture & Related -LT
V (A) : Agriculture -LT
V (A) (i) Corporate farmers with DSM
Corporate farmers without DSM
V (A) (ii) Non-Corporate farmers with DSM
Non-Corporate farmers without DSM
V (A) (iii) Salt farming units upto 15 HP*
V (A) (iv) Sugarcane crushing
V (A) (v) Rural Horticulture Nurseries
V (A) (vi) Floriculture in Green House
Agl others
V (B) : Aquaculture and Animal Husbandry -LT
V (C) : Poultry & Aquaculture -LT
V (C)(i) Poultry Hatcheries & Poultry Feed mixing plants
V (C)(ii) Aqua Hatcheries & Aqua Feed mixing plants
V (D) : Agro Based Cottage Industries upto 10 HP -LT
Total LT
Please Note:
A) The user need not enter anything in the yellow spaces in column C for Consumer Categories. For addition of new category, data first needs to be provided in Form A,
which will be automatically reflected in these yellow spaces.
For spaces in orange color, it is to furnish data for the following
1) Segregation or Aggregation of existing slabs
2) Addition of new slab
3) Addition of new sub-category
For LT Category, totals should be manually entered for new categories and slabs in the row for 'New L T Categories (Total).'
B) For Non Tariff Income, provide direct and apportioned Non Tariff Income (column V and W) for each consumer category
C) Include Revenue from Power Factor Surcharge in OTHERS (column O)
151.88 17.28 4.87 174.02 174.02 3.24 177.27
78.56 7.29 1.06 86.90 86.90 1.58 88.48
398.97 36.99 1.72 437.67 437.67 7.60 445.27
1.03 0.24 0 0.06 1.42 1.42 0.02 1.44
8.48 2.88 0 0.09 11.47 11.47 0.13 11.61
0.02 - 0 0.00 0.02 0.02 0.00 0.02
0.01 - 0 0.00 0.01 0.01 0.00 0.01
- - - - - 0.00 -
243 36 - 1 - 281 - 281 - - - - 7 288
242.10 35.64 1.33 279.07 279.07 6.98 286.06
0.39 - 0.00 0.39 0.39 0.01 0.40
0.87 0.07 0.12 1.06 1.06 0.05 1.11
236 12 0 5 - 252 - 252 - - - - 7 259
184.00 11.03 2.22 197.26 197.26 5.08 202.34
45.23 - 0 1.97 47.20 47.20 1.25 48.44
6.48 0.54 - 0.62 7.64 7.64 0.26 7.90
4.99 0.43 0.60 6.03 6.03 0.20 6.23
1.49 0.11 0.02 1.62 1.62 0.06 1.67
640.07 40.64 - 10.87 - 691.59 - 691.59 - - - - 78.63 770.22
0.32 3.56 - 8.75 - 12.63 - 12.63 - - - - 46.66 59.29
- 2.70 0.06 2.76 2.76 0.16 2.92
0.27 0.87 0.02 1.15 1.15 0.01 1.17
- - 8.34 8.34 8.34 45.91 54.25
- - 0.27 0.27 0.27 0.34 0.61
0.04 - 0.00 0.04 0.04 0.00 0.04
- - 0.00 0.00 0.00 0.00 0.00
- - 0.06 0.06 0.06 0.23 0.29
0.02 - 0.00 0.02 0.02 0.00 0.02
639.75 37.08 - 2.12 - 678.96 - 678.96 - - - - 31.98 710.93
623.84 34.74 2.06 660.64 660.64 31.32 691.96
15.80 2.34 - 0.05 - 18.19 - 18.19 - - - - 0.65 18.84
9.53 2.34 0.05 11.93 11.93 0.41 12.34
6.26 - 0.00 6.26 6.26 0.24 6.50
0.11 - 0.01 0.13 0.13 0.01 0.13
4,218.50 190.14 63.49 256.91 - 4,729.04 - 4,729.04 233.05 4,962.08
196

Form 7 Total Revenue at Current Tariff and Charges
Please Note:
A) The user need not enter anything in the yellow spaces in column C for Consumer Categories. For addition of new category, data first needs to be provided in Form A,
which will be automatically reflected in these yellow spaces.
For spaces in orange color, it is to furnish data for the following
1) Segregation or Aggregation of existing slabs
2) Addition of new slab
3) Addition of new sub-category
For LT Category, totals should be manually entered for new categories and slabs in the row for 'New L T Categories (Total).'
B) For Non Tariff Income, provide direct and apportioned Non Tariff Income (column V and W) for each consumer category
C) Include Revenue from Power Factor Surcharge in OTHERS (column O)
High Tension
Category at 11 kv -HT 3,831.00 2,367.06 - 969.00 -
I B : Townships, Colonies, Gated Communities and Villas -
HT 40 7 900 1,406 19 11 -
II: COMMERCIAL & OTHERS -HT 1,607 403 - 306 -
II (A): Commercial (ii) Major -HT 1,471 8 5,700 - 1,406 322 279 -
Time of Day tariff (TOD)- Peak - 9 5,700 - - 76 - -
(iv): Function halls / Auditoria --HT 133 12 - - 1,406 5 27 -
II (B) : Startup power -HT 3 12 - - 1,406 0 - -
II (C) : Electric Vehicles / Charging Stations -HT - 7 - - 1,406 - - -
II (D) : Green Power -HT - 12 - - 1,406 - - -
III INDUSTRY -HT 1,713 1,300 - 526 -
III (A) : Industry (General) -HT 1,663 6 5,700 - 1,406 454 513 -
Time of Day tariff (TOD)- Peak - 7 5,700 - - 432 - -
Time of Day tariff (TOD) - Off Peak - 5 5,700 - - 402 - -
Industrial Colonies - 7 - - - 2 - -
III (B) : Seasonal Industries (off- season) -HT 50 8 5,700 - 1,406 9 13 -
III (C) : Energy Intensive Industries -HT - 6 - - - - - -
IV INSTITUTIONAL -HT 217 128 - 50 -
IV (A) : Utilites (Street Lighting, NTR Sujala Pathakam, CPWS
and PWS) -HT 138 8 5,700 - 1,406 104 34 -
IV (B) : General Purpose -HT 67 8 5,700 - 1,406 22 13 -
IV (C) : Religious Places -HT 12 5 360 - 1,406 3 3 -
IV (D) : Railway Traction -HT - 6 4,200 - 1,406 - - -
V AGRICULTURE AND RELATED -HT 252 103 - 71 -
V (B) : Aquaculture and Animal Husbandry -HT 32 4 360 - 1,406 20 9 -
V (C) : Poultry & Aquaculture -HT 106 - - - - 64 - 25 -
(i) Poultry Hactcheries & Poultry Feed mixing plants 22 5 5,700 - 1,406 10 3 -
(ii) Aqua Hatcheries & Aqua Feed mixing plants 84 6 5,700 - 1,406 53 22 -
V (E) : Government / Private Lift Irrigation Schemes -HT 114 7 - - 1,406 19 37 -
RESCO 2 0.96 - - 1,406 413.80 5
197

Form 7
Please Note:
A) The user need not enter anything in the yellow spaces in column C for Consumer Categories. For addition of new category, data first needs to be provided in Form A,
which will be automatically reflected in these yellow spaces.
For spaces in orange color, it is to furnish data for the following
1) Segregation or Aggregation of existing slabs
2) Addition of new slab
3) Addition of new sub-category
For LT Category, totals should be manually entered for new categories and slabs in the row for 'New L T Categories (Total).'
B) For Non Tariff Income, provide direct and apportioned Non Tariff Income (column V and W) for each consumer category
C) Include Revenue from Power Factor Surcharge in OTHERS (column O)
High Tension
Category at 11 kv -HT
I B : Townships, Colonies, Gated Communities and Villas -
HT
II: COMMERCIAL & OTHERS -HT
II (A): Commercial (ii) Major -HT
Time of Day tariff (TOD)- Peak
(iv): Function halls / Auditoria --HT
II (B) : Startup power -HT
II (C) : Electric Vehicles / Charging Stations -HT
II (D) : Green Power -HT
III INDUSTRY -HT
III (A) : Industry (General) -HT
Time of Day tariff (TOD)- Peak
Time of Day tariff (TOD) - Off Peak
Industrial Colonies
III (B) : Seasonal Industries (off- season) -HT
III (C) : Energy Intensive Industries -HT
IV INSTITUTIONAL -HT
IV (A) : Utilites (Street Lighting, NTR Sujala Pathakam, CPWS
and PWS) -HT
IV (B) : General Purpose -HT
IV (C) : Religious Places -HT
IV (D) : Railway Traction -HT
V AGRICULTURE AND RELATED -HT
V (B) : Aquaculture and Animal Husbandry -HT
V (C) : Poultry & Aquaculture -HT
(i) Poultry Hactcheries & Poultry Feed mixing plants
(ii) Aqua Hatcheries & Aqua Feed mixing plants
V (E) : Government / Private Lift Irrigation Schemes -HT
RESCO
Please Note:
A) The user need not enter anything in the yellow spaces in column C for Consumer Categories. For addition of new category, data first needs to be provided in Form A,
which will be automatically reflected in these yellow spaces.
For spaces in orange color, it is to furnish data for the following
1) Segregation or Aggregation of existing slabs
2) Addition of new slab
3) Addition of new sub-category
For LT Category, totals should be manually entered for new categories and slabs in the row for 'New L T Categories (Total).'
B) For Non Tariff Income, provide direct and apportioned Non Tariff Income (column V and W) for each consumer category
C) Include Revenue from Power Factor Surcharge in OTHERS (column O)
-
1,350.46 501.31 - 6.46 - 1,858.23 1.23 1,857.01 - - - - 45.75 1,902.76
13.58 0.99 0 15 15 0 15
319 159 - 3 - 480 - 480 - - - - 8 488
246.56 159.03 2.48 408.07 408.07 6.23 414.30
65.67 - - 65.67 65.67 1.47 67.14
6.28 - 0.22 6.50 6.50 0.10 6.60
0.05 - 0.01 0.05 0.05 0.00 0.05
- - - - - 0.00 -
- - - - - 0.00 -
823 300 - 3 - 1,126 1 1,125 - - - - 25 1,150
286.14 292.41 2.81 581.36 1.23 580.13 8.78 588.91
315.17 - - 315.17 315.17 8.35 323.51
213.30 - - 213.30 213.30 7.78 221.08
1.50 - - 1.50 1.50 0.04 1.54
7.15 7.41 0.08 14.64 14.64 0.18 14.83
- - - - - 0.00 -
98 27 - 0 - 125 - 125 - - - - 2 128
79.35 19.38 0.23 98.96 98.96 2.00 100.96
17.26 7.41 0.11 24.78 24.78 0.42 25.20
1.31 0.11 0.02 1.44 1.44 0.05 1.49
- - - - - 0.00 -
57 15 - 0 - 72 - 72 - - - - 2 74
7.56 0.32 0.05 7.94 7.94 0.38 8.32
36 14 - 0 - 51 - 50.50 - - - - 1 52
5.35 1.71 0.04 7.10 7.10 0.20 7.29
30.73 12.54 0.14 43.41 43.41 1.03 44.44
13.78 - 0.19 13.97 13.97 0.37 14.35
39.73 - 0.00 39.73 39.73 8.00 47.73
198

Form 7 Total Revenue at Current Tariff and Charges
Please Note:
A) The user need not enter anything in the yellow spaces in column C for Consumer Categories. For addition of new category, data first needs to be provided in Form A,
which will be automatically reflected in these yellow spaces.
For spaces in orange color, it is to furnish data for the following
1) Segregation or Aggregation of existing slabs
2) Addition of new slab
3) Addition of new sub-category
For LT Category, totals should be manually entered for new categories and slabs in the row for 'New L T Categories (Total).'
B) For Non Tariff Income, provide direct and apportioned Non Tariff Income (column V and W) for each consumer category
C) Include Revenue from Power Factor Surcharge in OTHERS (column O)
Category at 33 kv 295 1,807 - 661 - I B : Townships, Colonies, Gated Communities and Villas -
HT 3 7 900 - 2,813 12 4 -
II: COMMERCIAL & OTHERS -HT 89 180 - 92 -
II (A): Commercial (ii) Major -HT 70 7 5,700 - 2,813 140 92 -
Time of Day tariff (TOD)- Peak - 8 5,700 - - 28 - -
(iv): Function halls / Auditoria --HT - 12 - - 2,813 - - -
II (B) : Startup power -HT 19 12 - - 2,813 12 - -
II (C) : Electric Vehicles / Charging Stations -HT - 7 - - 2,813 - - -
II (D) : Green Power -HT - 12 - - 2,813 - - -
III INDUSTRY -HT 175 1,498 - 451 -
III (A) : Industry (General) -HT 167 6 5,700 - 2,813 354 417 -
Time of Day tariff (TOD)- Peak - 7 5,700 - - 482 - -
Time of Day tariff (TOD) - Off Peak - 5 5,700 - - 498 - -
Industrial Colonies - 7 - - - 1 - -
III (B) : Seasonal Industries (off- season) -HT 2 7 5,700 - 2,813 8 5 -
III (C) : Energy Intensive Industries -HT 6 5 - - 2,813 156 29 -
IV INSTITUTIONAL -HT 2 1 - - -
IV (A) : Utilites (Street Lighting, NTR Sujala Pathakam,
CPWS and PWS) -HT 1 7 5,700 - 2,813 0 - -
IV (B) : General Purpose -HT 1 7 5,700 - 2,813 1 - -
IV (C) : Religious Places -HT - 5 360 - 2,813 - - -
IV (D) : Railway Traction -HT - 6 4,200 - 2,813 - - -
V AGRICULTURE AND RELATED -HT 26 116 - 114 - V (B) : Aquaculture and Animal Husbandry -HT 1 4 360 - 2,813 - 2 -
V (C) : Poultry & Aquaculture -HT 6 66 - 12 -
(i) Poultry Hactcheries & Poultry Feed mixing plants - 5 5,700 - 2,813 - - -
(ii) Aqua Hatcheries & Aqua Feed mixing plants 6 6 5,700 - 2,813 66 12 -
V (E) : Government / Private Lift Irrigation Schemes -HT 19 7 - - 2,813 49 100 -
199
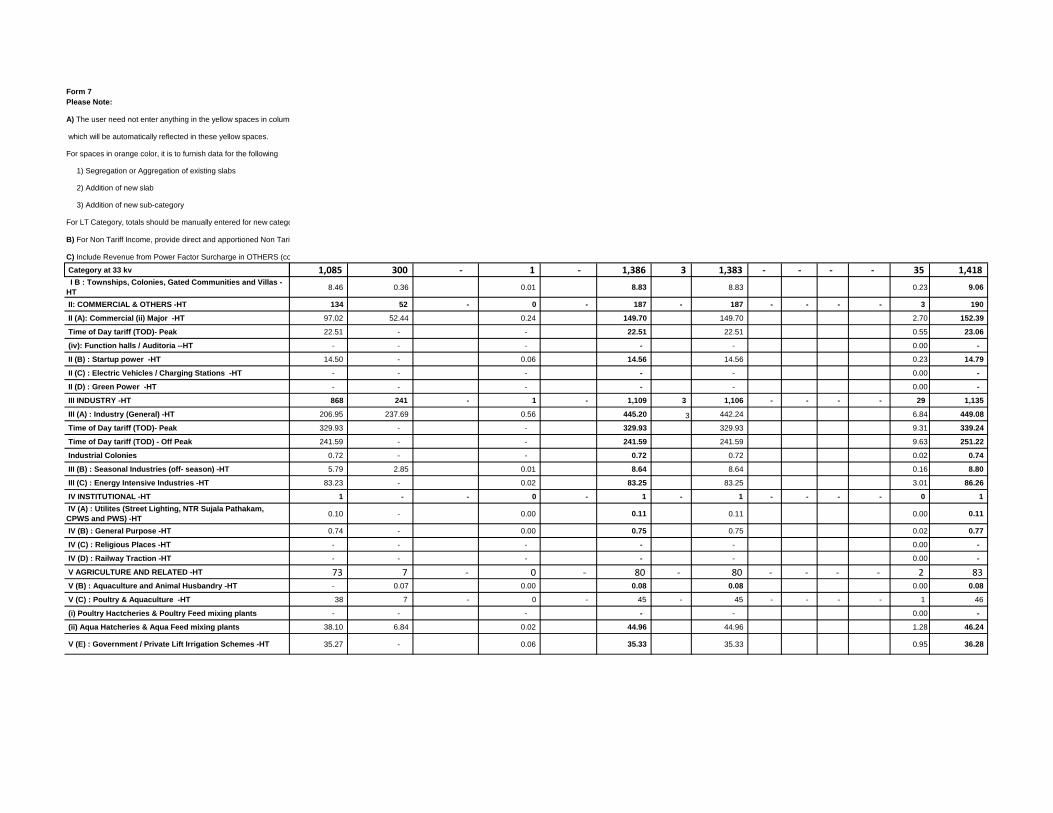
Form 7
Please Note:
A) The user need not enter anything in the yellow spaces in column C for Consumer Categories. For addition of new category, data first needs to be provided in Form A,
which will be automatically reflected in these yellow spaces.
For spaces in orange color, it is to furnish data for the following
1) Segregation or Aggregation of existing slabs
2) Addition of new slab
3) Addition of new sub-category
For LT Category, totals should be manually entered for new categories and slabs in the row for 'New L T Categories (Total).'
B) For Non Tariff Income, provide direct and apportioned Non Tariff Income (column V and W) for each consumer category
C) Include Revenue from Power Factor Surcharge in OTHERS (column O)
Category at 33 kv
I B : Townships, Colonies, Gated Communities and Villas -
HT
II: COMMERCIAL & OTHERS -HT
II (A): Commercial (ii) Major -HT
Time of Day tariff (TOD)- Peak
(iv): Function halls / Auditoria --HT
II (B) : Startup power -HT
II (C) : Electric Vehicles / Charging Stations -HT
II (D) : Green Power -HT
III INDUSTRY -HT
III (A) : Industry (General) -HT
Time of Day tariff (TOD)- Peak
Time of Day tariff (TOD) - Off Peak
Industrial Colonies
III (B) : Seasonal Industries (off- season) -HT
III (C) : Energy Intensive Industries -HT
IV INSTITUTIONAL -HT
IV (A) : Utilites (Street Lighting, NTR Sujala Pathakam,
CPWS and PWS) -HT
IV (B) : General Purpose -HT
IV (C) : Religious Places -HT
IV (D) : Railway Traction -HT
V AGRICULTURE AND RELATED -HT
V (B) : Aquaculture and Animal Husbandry -HT
V (C) : Poultry & Aquaculture -HT
(i) Poultry Hactcheries & Poultry Feed mixing plants
(ii) Aqua Hatcheries & Aqua Feed mixing plants
V (E) : Government / Private Lift Irrigation Schemes -HT
Please Note:
A) The user need not enter anything in the yellow spaces in column C for Consumer Categories. For addition of new category, data first needs to be provided in Form A,
which will be automatically reflected in these yellow spaces.
For spaces in orange color, it is to furnish data for the following
1) Segregation or Aggregation of existing slabs
2) Addition of new slab
3) Addition of new sub-category
For LT Category, totals should be manually entered for new categories and slabs in the row for 'New L T Categories (Total).'
B) For Non Tariff Income, provide direct and apportioned Non Tariff Income (column V and W) for each consumer category
C) Include Revenue from Power Factor Surcharge in OTHERS (column O)
1,085 300 - 1 - 1,386 3 1,383 - - - - 35 1,418
8.46 0.36 0.01 8.83 8.83 0.23 9.06
134 52 - 0 - 187 - 187 - - - - 3 190
97.02 52.44 0.24 149.70 149.70 2.70 152.39
22.51 - - 22.51 22.51 0.55 23.06
- - - - - 0.00 -
14.50 - 0.06 14.56 14.56 0.23 14.79
- - - - - 0.00 -
- - - - - 0.00 -
868 241 - 1 - 1,109 3 1,106 - - - - 29 1,135
206.95 237.69 0.56 445.20 3 442.24 6.84 449.08
329.93 - - 329.93 329.93 9.31 339.24
241.59 - - 241.59 241.59 9.63 251.22
0.72 - - 0.72 0.72 0.02 0.74
5.79 2.85 0.01 8.64 8.64 0.16 8.80
83.23 - 0.02 83.25 83.25 3.01 86.26
1 - - 0 - 1 - 1 - - - - 0 1
0.10 - 0.00 0.11 0.11 0.00 0.11
0.74 - 0.00 0.75 0.75 0.02 0.77
- - - - - 0.00 -
- - - - - 0.00 -
73 7 - 0 - 80 - 80 - - - - 2 83 - 0.07 0.00 0.08 0.08 0.00 0.08
38 7 - 0 - 45 - 45 - - - - 1 46
- - - - - 0.00 -
38.10 6.84 0.02 44.96 44.96 1.28 46.24
35.27 - 0.06 35.33 35.33 0.95 36.28
200

Form 7 Total Revenue at Current Tariff and Charges
Please Note:
A) The user need not enter anything in the yellow spaces in column C for Consumer Categories. For addition of new category, data first needs to be provided in Form A,
which will be automatically reflected in these yellow spaces.
For spaces in orange color, it is to furnish data for the following
1) Segregation or Aggregation of existing slabs
2) Addition of new slab
3) Addition of new sub-category
For LT Category, totals should be manually entered for new categories and slabs in the row for 'New L T Categories (Total).'
B) For Non Tariff Income, provide direct and apportioned Non Tariff Income (column V and W) for each consumer category
C) Include Revenue from Power Factor Surcharge in OTHERS (column O)
HT Category at 132 kv 72.00 4,270.79 - 1,413.00 -
I B : Townships, Colonies, Gated Communities and Villas -
HT - 7 900 - 2,813 - - - -
II: COMMERCIAL & OTHERS -HT 15 63 - 46 - II (A): Commercial (ii) Major -HT 8 7 5,700 - 2,813 47 31 -
Time of Day tariff (TOD)- Peak - 8 5,700 - - 12 - -
(iv): Function halls / Auditoria --HT 2 12 - - 2,813 - 3 -
II (B) : Startup power -HT 5 12 - - 2,813 4 12 -
II (C) : Electric Vehicles / Charging Stations -HT - 7 - - 2,813 - - -
II (D) : Green Power -HT - 12 - - 2,813 - - -
III INDUSTRY -HT 36 3,466 - 871 - III (A) : Industry (General) -HT 25 5 5,700 - 2,813 248 488 -
Time of Day tariff (TOD)- Peak - 6 5,700 - - 358 - -
Time of Day tariff (TOD) - Off Peak - 4 5,700 - - 387 - -
Industrial Colonies - 7 - - - 65 - -
III (B) : Seasonal Industries (off- season) -HT - 7 5,700 - 2,813 - - -
III (C) : Energy Intensive Industries -HT 11 5 - - 2,813 2,408 383 -
IV INSTITUTIONAL -HT 18 619 - 251 - IV (A) : Utilites (Street Lighting, NTR Sujala Pathakam,
CPWS and PWS) -HT - 7 5,700 - 2,813 - - -
IV (B) : General Purpose -HT - 7 5,700 - 2,813 - - -
IV (C) : Religious Places -HT - 5 360 - 2,813 - - -
IV (D) : Railway Traction -HT 18 6 4,200 - 2,813 619 251 -
V AGRICULTURE AND RELATED -HT 3 123 - 245 - V (B) : Aquaculture and Animal Husbandry -HT - 4 360 - 2,813 - - -
V (C) : Poultry & Aquaculture -HT - - - - - - - -
(i) Poultry Hactcheries & Poultry Feed mixing plants - 5 5,700 - 2,813 - - -
(ii) Aqua Hatcheries & Aqua Feed mixing plants - 6 5,700 - 2,813 - - -
V (E) : Government / Private Lift Irrigation Schemes -HT 3 7 - - 2,813 123 245 -
Total HT 4,198 - - - - 8,445 - 3,043 -
Total (LT + HT) 6,251,945 - - - - 20,501.23 - 10,785.00 2,055,074.00
201
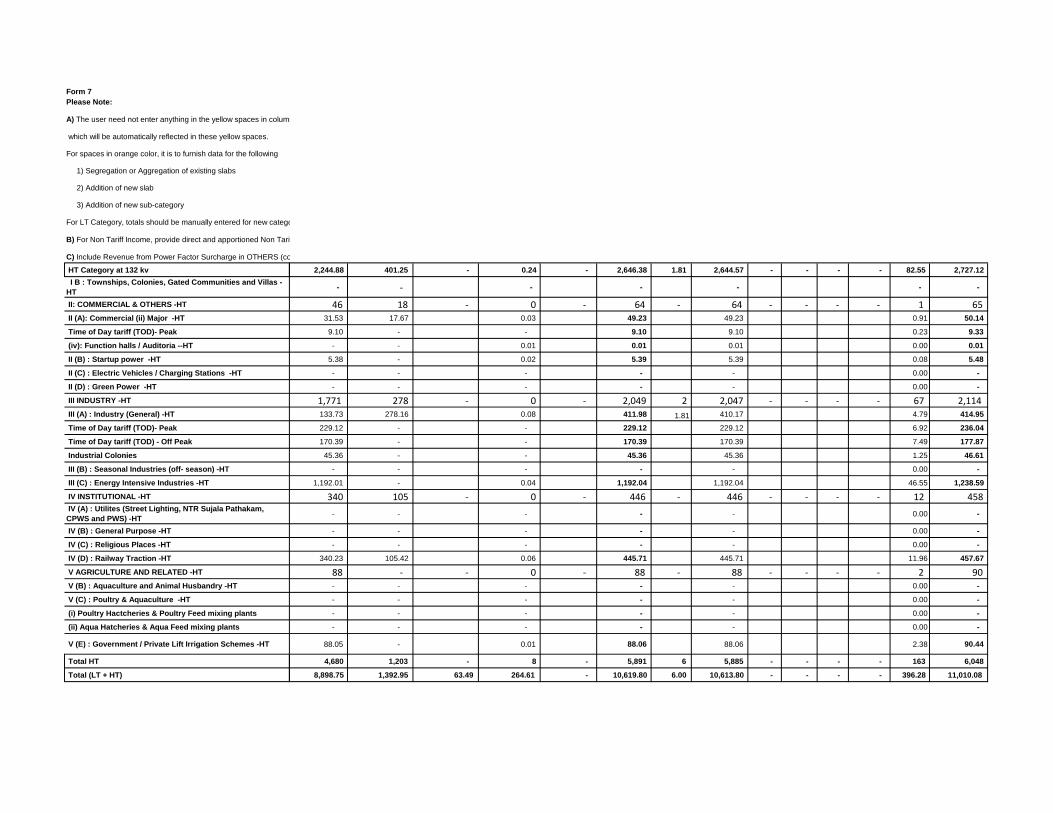
Form 7
Please Note:
A) The user need not enter anything in the yellow spaces in column C for Consumer Categories. For addition of new category, data first needs to be provided in Form A,
which will be automatically reflected in these yellow spaces.
For spaces in orange color, it is to furnish data for the following
1) Segregation or Aggregation of existing slabs
2) Addition of new slab
3) Addition of new sub-category
For LT Category, totals should be manually entered for new categories and slabs in the row for 'New L T Categories (Total).'
B) For Non Tariff Income, provide direct and apportioned Non Tariff Income (column V and W) for each consumer category
C) Include Revenue from Power Factor Surcharge in OTHERS (column O)
HT Category at 132 kv
I B : Townships, Colonies, Gated Communities and Villas -
HT
II: COMMERCIAL & OTHERS -HT
II (A): Commercial (ii) Major -HT
Time of Day tariff (TOD)- Peak
(iv): Function halls / Auditoria --HT
II (B) : Startup power -HT
II (C) : Electric Vehicles / Charging Stations -HT
II (D) : Green Power -HT
III INDUSTRY -HT
III (A) : Industry (General) -HT
Time of Day tariff (TOD)- Peak
Time of Day tariff (TOD) - Off Peak
Industrial Colonies
III (B) : Seasonal Industries (off- season) -HT
III (C) : Energy Intensive Industries -HT
IV INSTITUTIONAL -HT
IV (A) : Utilites (Street Lighting, NTR Sujala Pathakam,
CPWS and PWS) -HT
IV (B) : General Purpose -HT
IV (C) : Religious Places -HT
IV (D) : Railway Traction -HT
V AGRICULTURE AND RELATED -HT
V (B) : Aquaculture and Animal Husbandry -HT
V (C) : Poultry & Aquaculture -HT
(i) Poultry Hactcheries & Poultry Feed mixing plants
(ii) Aqua Hatcheries & Aqua Feed mixing plants
V (E) : Government / Private Lift Irrigation Schemes -HT
Total HT
Total (LT + HT)
Please Note:
A) The user need not enter anything in the yellow spaces in column C for Consumer Categories. For addition of new category, data first needs to be provided in Form A,
which will be automatically reflected in these yellow spaces.
For spaces in orange color, it is to furnish data for the following
1) Segregation or Aggregation of existing slabs
2) Addition of new slab
3) Addition of new sub-category
For LT Category, totals should be manually entered for new categories and slabs in the row for 'New L T Categories (Total).'
B) For Non Tariff Income, provide direct and apportioned Non Tariff Income (column V and W) for each consumer category
C) Include Revenue from Power Factor Surcharge in OTHERS (column O)
2,244.88 401.25 - 0.24 - 2,646.38 1.81 2,644.57 - - - - 82.55 2,727.12
- - - - - - -
46 18 - 0 - 64 - 64 - - - - 1 65 31.53 17.67 0.03 49.23 49.23 0.91 50.14
9.10 - - 9.10 9.10 0.23 9.33
- - 0.01 0.01 0.01 0.00 0.01
5.38 - 0.02 5.39 5.39 0.08 5.48
- - - - - 0.00 -
- - - - - 0.00 -
1,771 278 - 0 - 2,049 2 2,047 - - - - 67 2,114 133.73 278.16 0.08 411.98 1.81 410.17 4.79 414.95
229.12 - - 229.12 229.12 6.92 236.04
170.39 - - 170.39 170.39 7.49 177.87
45.36 - - 45.36 45.36 1.25 46.61
- - - - - 0.00 -
1,192.01 - 0.04 1,192.04 1,192.04 46.55 1,238.59
340 105 - 0 - 446 - 446 - - - - 12 458
- - - - - 0.00 -
- - - - - 0.00 -
- - - - - 0.00 -
340.23 105.42 0.06 445.71 445.71 11.96 457.67
88 - - 0 - 88 - 88 - - - - 2 90 - - - - - 0.00 -
- - - - - 0.00 -
- - - - - 0.00 -
- - - - - 0.00 -
88.05 - 0.01 88.06 88.06 2.38 90.44
4,680 1,203 - 8 - 5,891 6 5,885 - - - - 163 6,048
8,898.75 1,392.95 63.49 264.61 - 10,619.80 6.00 10,613.80 - - - - 396.28 11,010.08
202

Form 7 Total Revenue at Current Tariff and Charges
Please Note:
A) The user need not enter anything in the yellow spaces in column C for Consumer Categories. For addition of new category, data first needs to be provided in Form A,
which will be automatically reflected in these yellow spaces.
For spaces in orange color, it is to furnish data for the following
1) Segregation or Aggregation of existing slabs
2) Addition of new slab
3) Addition of new sub-category
For LT Category, totals should be manually entered for new categories and slabs in the row for 'New L T Categories (Total).'
B) For Non Tariff Income, provide direct and apportioned Non Tariff Income (column V and W) for each consumer category
C) Include Revenue from Power Factor Surcharge in OTHERS (column O)
FY 2021-22
Energy
Charges
(Rs/kWh) or
(Rs.kVAh)
Demand
charges
(Rs/kVA/Yr)
Demand
charges
(Rs/HP/Yr)
Customer
charges
Energy Sales
(MU)
Energy
sales
(MVAh)
Connected Load/
Contract Demand
(MW)
Connected Load/
Contract
Demand
(HP)
Low Tension
I(A): Domestic -LT 5,442,813 6,360.04 - 5,474.13 -
Group A : Consumption ≤ 75 Units during the billing month 3,118,830.00 1,515.31 - 2,183.24 -
0-50 2,110,218 1.45 - - 25 1,351 1,415 -
51-75 1,008,612 2.60 - - 30 165 769 -
Group B: Consumption > 75 and ≤ 225 units during the
billing month 2,159,013.00 3,459.46 - 2,765.96 -
0-50 - 2.60 - - 35 1,413 - -
51-100 818,286 2.60 - - 40 1,284 785 -
101-200 1,260,502 3.60 - - 45 745 1,801 -
201-225 80,225 6.90 - - 50 17 180 -
Group C: Consumption > 225 units during the billing month 164,970.00 1,385.27 - 524.93 -
0-50 - 2.65 - - 35 197 - -
51-100 - 3.35 - - 40 197 - -
101-200 - 5.40 - - 45 395 - -
201-300 104,089 7.10 - - 50 308 279 -
301-400 37,624 7.95 - - 55 132 129 -
401-500 11,725 8.50 - - 55 63 50 -
Above 500 units 11,532 9.95 - - 55 94 68 -
Smart Meters ( Optional for above 500 units / month - - - - - - - -
Time of Day tariff ( ToD ) 10 AM to 12 Noon - - - - - - - -
II(A): Commercial -LT 591,709 1,163 - 1,336 -
II (A) (i): Commercial(Minor) -LT 336,888.00 58.71 - 423.51 -
0-50 336,888 5.40 660 - 30 59 424 -
II (A) (ii): Commercial(Major) -LT 254,810 1,104 - 913 -
0-50 - 6.90 900 - 30 150 - -
51-100 103,827 7.65 900 - 40 115 142 -
Consumer Categories No of consumers
Components of tariff Relevant sales related data
203

Form 7
Please Note:
A) The user need not enter anything in the yellow spaces in column C for Consumer Categories. For addition of new category, data first needs to be provided in Form A,
which will be automatically reflected in these yellow spaces.
For spaces in orange color, it is to furnish data for the following
1) Segregation or Aggregation of existing slabs
2) Addition of new slab
3) Addition of new sub-category
For LT Category, totals should be manually entered for new categories and slabs in the row for 'New L T Categories (Total).'
B) For Non Tariff Income, provide direct and apportioned Non Tariff Income (column V and W) for each consumer category
C) Include Revenue from Power Factor Surcharge in OTHERS (column O)
FY 2021-22
Low Tension
I(A): Domestic -LT
Group A : Consumption ≤ 75 Units during the billing month
0-50
51-75
Group B: Consumption > 75 and ≤ 225 units during the
billing month
0-50
51-100
101-200
201-225
Group C: Consumption > 225 units during the billing month
0-50
51-100
101-200
201-300
301-400
401-500
Above 500 units
Smart Meters ( Optional for above 500 units / month
Time of Day tariff ( ToD ) 10 AM to 12 Noon
II(A): Commercial -LT
II (A) (i): Commercial(Minor) -LT
0-50
II (A) (ii): Commercial(Major) -LT
0-50
51-100
Consumer Categories
Please Note:
A) The user need not enter anything in the yellow spaces in column C for Consumer Categories. For addition of new category, data first needs to be provided in Form A,
which will be automatically reflected in these yellow spaces.
For spaces in orange color, it is to furnish data for the following
1) Segregation or Aggregation of existing slabs
2) Addition of new slab
3) Addition of new sub-category
For LT Category, totals should be manually entered for new categories and slabs in the row for 'New L T Categories (Total).'
B) For Non Tariff Income, provide direct and apportioned Non Tariff Income (column V and W) for each consumer category
C) Include Revenue from Power Factor Surcharge in OTHERS (column O)
Energy
Charges
(Rs Crores)
Demand /Fixed
charges
(Rs Crores)
Minimum
Charges
(Rs Crores)
Customer
Charges
(Rs crores)
Others
(Rs Crores)
Gross Tariff
Revenue
(Rs Crores)
Surchar
ge
(Rs.Crs)
Addition
al
Surchar
ge
(Rs.Crs)
DirectApportion
ed
2,021.22 - 41.35 222.04 - 2,284.61 - 2,284.61 - - - - 116.26 2,400.86
238.65 - 27.78 99.62 - 366.04 - 366.04 - - - - 27.70 393.74
195.85 - 28 63.31 286.93 286.93 24.69 311.62
42.80 - 36.31 79.11 79.11 3.01 82.12
981.11 - 10.90 112.16 - 1,104.16 - 1,104.16 - - - - 63.24 1,167.40
367.45 - 11 - 378.35 378.35 25.83 404.18
333.97 - 39.28 373.25 373.25 23.48 396.73
268.23 - 68.07 336.30 336.30 13.62 349.92
11.46 - 4.81 16.27 16.27 0.30 16.58
801.46 - 2.67 10.26 - 814.40 - 814.40 - - - - 25.32 839.72
52.28 - 3 - 54.95 54.95 3.61 58.56
66.09 - - 66.09 66.09 3.61 69.69
213.06 - - 213.06 213.06 7.21 220.27
218.38 - 6.25 224.62 224.62 5.62 230.25
104.99 - 2.48 107.48 107.48 2.41 109.89
53.20 - 0.77 53.97 53.97 1.14 55.11
93.47 - 0.76 94.23 94.23 1.72 95.95
- - - - - 0.00 -
- - - - - 0.00 -
1,049 111 25 25 - 1,210 - 1,210 - - - - 21 1,232
31.70 27.95 - 12.13 - 71.78 - 71.78 - - - - 1.07 72.85
31.70 27.95 12.13 71.78 71.78 1.07 72.85
1,017 83 25 13 - 1,139 - 1,139 - - - - 20 1,159
103.35 - 25 - 128.54 128.54 2.74 131.28
87.99 12.82 4.98 105.80 105.80 2.10 107.90
Incentive
s
(Rs. Crs)
Net Revenue
from Tariff
(Rs. Crores)
Surcharges
(Open Access)
Grid
Suppor
t
Charge
s
(Rs.
Crores)
Non - tariff Income
(Rs crores)
Total Revenue
( Net of
incentives)
Full year revenue excluding external subsidy
204

Form 7 Total Revenue at Current Tariff and Charges
Please Note:
A) The user need not enter anything in the yellow spaces in column C for Consumer Categories. For addition of new category, data first needs to be provided in Form A,
which will be automatically reflected in these yellow spaces.
For spaces in orange color, it is to furnish data for the following
1) Segregation or Aggregation of existing slabs
2) Addition of new slab
3) Addition of new sub-category
For LT Category, totals should be manually entered for new categories and slabs in the row for 'New L T Categories (Total).'
B) For Non Tariff Income, provide direct and apportioned Non Tariff Income (column V and W) for each consumer category
C) Include Revenue from Power Factor Surcharge in OTHERS (column O)
101-300 94,510 9.05 900 - 45 211 208 -
301-500 20,518 9.60 900 - 45 106 88 -
Above 500 33,362 10.15 900 - 45 508 446 -
II (A) (iii) Advertising Hoardings -LT 980 12.25 1,200 - 50 1 2 -
II (A) (iv) Function halls / Auditoria -LT 1,613 12.25 1,200 - 50 13 26 -
II (B) : Startup power -LT 3 12.25 - - 500 0 0 -
II (C) : Electric Vehicles / Charging Stations -LT 8 6.70 - - 250 0 0 -
II (D) : Green Power -LT - 12.25 - - - - - -
III: Industry -LT 19,393 383 - 403 -
III (A):Industries (General) -LT 17,832 6.70 900 - 63 379 400 -
III (B): Seasonal Industries (off season) -LT 5 7.45 900 - 63 1 0 -
III(D):Cottage Industries upto 10HP -LT 1,556 3.75 240 - 63 3 3 -
IV: INSTITUTIONAL -LT 111,827 375 - 119 -
IV (A) : Utilites (Street Lighting, NTR Sujala Pathakam,
CPWS and PWS) -LT 55,540 7.00 900 - 35 261 103 -
IV (B) : General Purpose -LT 38,208 7.00 900 - 45 97 - -
IV (C) : Religious Places -LT 18,079.00 16.90 - 15.95 -
(i) Religious Places (CL <= 2kW) 17,575 4.80 360 - 30 13 12 -
(ii) Religious Places (CL > 2kW) 504 5.00 360 - 30 4 4 -
V: Agriculture & Related -LT 285,657.00 4,453.38 - 1,086.99 2,075,744.61
V (A) : Agriculture -LT 254,883.00 2,534.34 - 0.04 2,075,744.61
V (A) (i) Corporate farmers with DSM 1,760 - - 2,400 30 9 - 11,786
Corporate farmers without DSM 638 3.50 - 2,400 30 1 - 3,783
V (A) (ii) Non-Corporate farmers with DSM 242,954 - - - 30 2,494 - 2,005,336
Non-Corporate farmers without DSM 7,735 - - - 30 18 - 46,556
V (A) (iii) Salt farming units upto 15 HP* 30 2.50 - - 30 0 - 248
V (A) (iv) Sugarcane crushing 26 - - - 30 0 - 389
V (A) (v) Rural Horticulture Nurseries 1,736 - - - 30 13 - 7,646
V (A) (vi) Floriculture in Green House 4 4.50 900 - 30 0 0.04 -
Agl others 30,774.00 1,919.04 - 1,086.95 -
V (B) : Aquaculture and Animal Husbandry -LT 29,808 3.85 360 - 63 1,882 1,057 -
V (C) : Poultry & Aquaculture -LT 777.00 - - - - 36.58 - 29.04 -
V (C)(i) Poultry Hatcheries & Poultry Feed mixing plants 773 4.50 900 - 63 20 29 -
V (C)(ii) Aqua Hatcheries & Aqua Feed mixing plants 5 5.00 900 - 63 17 0 -
V (D) : Agro Based Cottage Industries upto 10 HP -LT 189 3.75 240 - 63 0 0 -
Total LT 6,451,399.00 - - - - 12,733.86 - 8,419.32 2,075,744.61
205

Form 7
Please Note:
A) The user need not enter anything in the yellow spaces in column C for Consumer Categories. For addition of new category, data first needs to be provided in Form A,
which will be automatically reflected in these yellow spaces.
For spaces in orange color, it is to furnish data for the following
1) Segregation or Aggregation of existing slabs
2) Addition of new slab
3) Addition of new sub-category
For LT Category, totals should be manually entered for new categories and slabs in the row for 'New L T Categories (Total).'
B) For Non Tariff Income, provide direct and apportioned Non Tariff Income (column V and W) for each consumer category
C) Include Revenue from Power Factor Surcharge in OTHERS (column O)
101-300
301-500
Above 500
II (A) (iii) Advertising Hoardings -LT
II (A) (iv) Function halls / Auditoria -LT
II (B) : Startup power -LT
II (C) : Electric Vehicles / Charging Stations -LT
II (D) : Green Power -LT
III: Industry -LT
III (A):Industries (General) -LT
III (B): Seasonal Industries (off season) -LT
III(D):Cottage Industries upto 10HP -LT
IV: INSTITUTIONAL -LT
IV (A) : Utilites (Street Lighting, NTR Sujala Pathakam,
CPWS and PWS) -LT
IV (B) : General Purpose -LT
IV (C) : Religious Places -LT
(i) Religious Places (CL <= 2kW)
(ii) Religious Places (CL > 2kW)
V: Agriculture & Related -LT
V (A) : Agriculture -LT
V (A) (i) Corporate farmers with DSM
Corporate farmers without DSM
V (A) (ii) Non-Corporate farmers with DSM
Non-Corporate farmers without DSM
V (A) (iii) Salt farming units upto 15 HP*
V (A) (iv) Sugarcane crushing
V (A) (v) Rural Horticulture Nurseries
V (A) (vi) Floriculture in Green House
Agl others
V (B) : Aquaculture and Animal Husbandry -LT
V (C) : Poultry & Aquaculture -LT
V (C)(i) Poultry Hatcheries & Poultry Feed mixing plants
V (C)(ii) Aqua Hatcheries & Aqua Feed mixing plants
V (D) : Agro Based Cottage Industries upto 10 HP -LT
Total LT
Please Note:
A) The user need not enter anything in the yellow spaces in column C for Consumer Categories. For addition of new category, data first needs to be provided in Form A,
which will be automatically reflected in these yellow spaces.
For spaces in orange color, it is to furnish data for the following
1) Segregation or Aggregation of existing slabs
2) Addition of new slab
3) Addition of new sub-category
For LT Category, totals should be manually entered for new categories and slabs in the row for 'New L T Categories (Total).'
B) For Non Tariff Income, provide direct and apportioned Non Tariff Income (column V and W) for each consumer category
C) Include Revenue from Power Factor Surcharge in OTHERS (column O)
191.31 18.75 5.10 215.16 215.16 3.86 219.02
101.56 7.90 1.11 110.57 110.57 1.93 112.50
515.30 40.15 1.80 557.25 557.25 9.28 566.53
1.46 0.25 0 0.06 1.87 1.87 0.02 1.89
16.20 3.11 0 0.10 19.43 19.43 0.24 19.67
0.02 - 0 0.00 0.02 0.02 0.00 0.02
0.01 - 0 0.00 0.01 0.01 0.00 0.01
- - - - - 0.00 -
256 36 - 1 - 293 - 293 - - - - 7 300
253.95 36.01 1.35 291.30 291.30 6.93 298.23
0.59 0.02 0.00 0.61 0.61 0.01 0.63
1.03 0.07 0.12 1.21 1.21 0.05 1.26
259 10 0 5 - 274 - 274 - - - - 7 281
182.80 9.26 2.33 194.39 194.39 4.77 199.17
67.90 - 0 2.06 69.96 69.96 1.77 71.73
8.20 0.57 - 0.65 - 9.43 - 9.43 - - - - 0.31 9.73
6.04 0.44 0.63 7.12 7.12 0.23 7.35
2.16 0.13 0.02 2.31 2.31 0.08 2.39
742.38 44.43 - 11.50 - 798.32 - 798.32 - - - - 81.40 879.72
0.34 3.74 - 9.18 - 13.25 - 13.25 - - - - 46.33 59.58
- 2.83 0.06 2.89 2.89 0.16 3.05
0.28 0.91 0.02 1.21 1.21 0.01 1.22
- - 8.75 8.75 8.75 45.58 54.33
- - 0.28 0.28 0.28 0.33 0.61
0.04 - 0.00 0.04 0.04 0.00 0.05
- - 0.00 0.00 0.00 0.00 0.00
- - 0.06 0.06 0.06 0.23 0.29
0.02 0.00 0.00 0.02 0.02 0.00 0.02
742.04 40.69 - 2.33 - 785.06 - 785.06 - - - - 35.08 820.14
724.61 38.07 2.25 764.93 764.93 34.40 799.34
17.30 2.61 - 0.06 - 19.97 - 19.97 - - - - 0.67 20.64
8.94 2.60 0.06 11.60 11.60 0.36 11.96
8.36 0.01 0.00 8.37 8.37 0.31 8.68
0.13 0.01 0.01 0.16 0.16 0.01 0.16
4,326.98 201.29 66.66 265.34 - 4,860.26 - 4,860.26 - - - - 232.76 5,093.03
206

Form 7 Total Revenue at Current Tariff and Charges
Please Note:
A) The user need not enter anything in the yellow spaces in column C for Consumer Categories. For addition of new category, data first needs to be provided in Form A,
which will be automatically reflected in these yellow spaces.
For spaces in orange color, it is to furnish data for the following
1) Segregation or Aggregation of existing slabs
2) Addition of new slab
3) Addition of new sub-category
For LT Category, totals should be manually entered for new categories and slabs in the row for 'New L T Categories (Total).'
B) For Non Tariff Income, provide direct and apportioned Non Tariff Income (column V and W) for each consumer category
C) Include Revenue from Power Factor Surcharge in OTHERS (column O)
High Tension
Category at 11 kv -HT 3,891.00 2,568.07 - 978.96 -
I B : Townships, Colonies, Gated Communities and Villas -
HT 40 7.00 900 1,406 20 11 -
II: COMMERCIAL & OTHERS -HT 1,628.00 518.45 - 305.70 -
II (A): Commercial (ii) Major -HT 1,488 7.65 5,700 - 1,406 407 279 -
Time of Day tariff (TOD)- Peak - 8.65 5,700 - - 103 - -
(iv): Function halls / Auditoria --HT 136 12.25 - - 1,406 9 27 -
II (B) : Startup power -HT 4 12.25 - - 1,406 0 - -
II (C) : Electric Vehicles / Charging Stations -HT - 6.70 - - 1,406 - - -
II (D) : Green Power -HT - 12.25 - - 1,406 - - -
III INDUSTRY -HT 1,737.00 1,329.34 - 531.80 -
III (A) : Industry (General) -HT 1,682 6.30 5,700 - 1,406 459 518 -
Time of Day tariff (TOD)- Peak - 7.30 5,700 - - 442 - -
Time of Day tariff (TOD) - Off Peak - 5.30 5,700 - - 416 - -
Industrial Colonies - 7.00 - - - 2 - -
III (B) : Seasonal Industries (off- season) -HT 55 7.65 5,700 - 1,406 9 14 -
III (C) : Energy Intensive Industries -HT - 5.80 - - - - - -
IV INSTITUTIONAL -HT 216.00 149.82 - 50.26 -
IV (A) : Utilites (Street Lighting, NTR Sujala Pathakam, CPWS
and PWS) -HT 138 7.65 5,700 - 1,406 120 34 -
IV (B) : General Purpose -HT 66 7.95 5,700 - 1,406 25 13 -
IV (C) : Religious Places -HT 12 5.00 360 - 1,406 4 3 -
IV (D) : Railway Traction -HT - 5.50 4,200 - 1,406 - - -
V AGRICULTURE AND RELATED -HT 268.00 115.76 - 75.32 -
V (B) : Aquaculture and Animal Husbandry -HT 40 3.85 360 - 1,406 21 11 -
V (C) : Poultry & Aquaculture -HT 111 - - - - 75 - 26 -
(i) Poultry Hactcheries & Poultry Feed mixing plants 32 5.25 5,700 - 1,406 13 5 -
(ii) Aqua Hatcheries & Aqua Feed mixing plants 79 5.75 5,700 - 1,406 62 21 -
V (E) : Government / Private Lift Irrigation Schemes -HT 117 7.15 - - 1,406 20 38 -
RESCO 2 0.96 - - 1,406 435 5 -
207
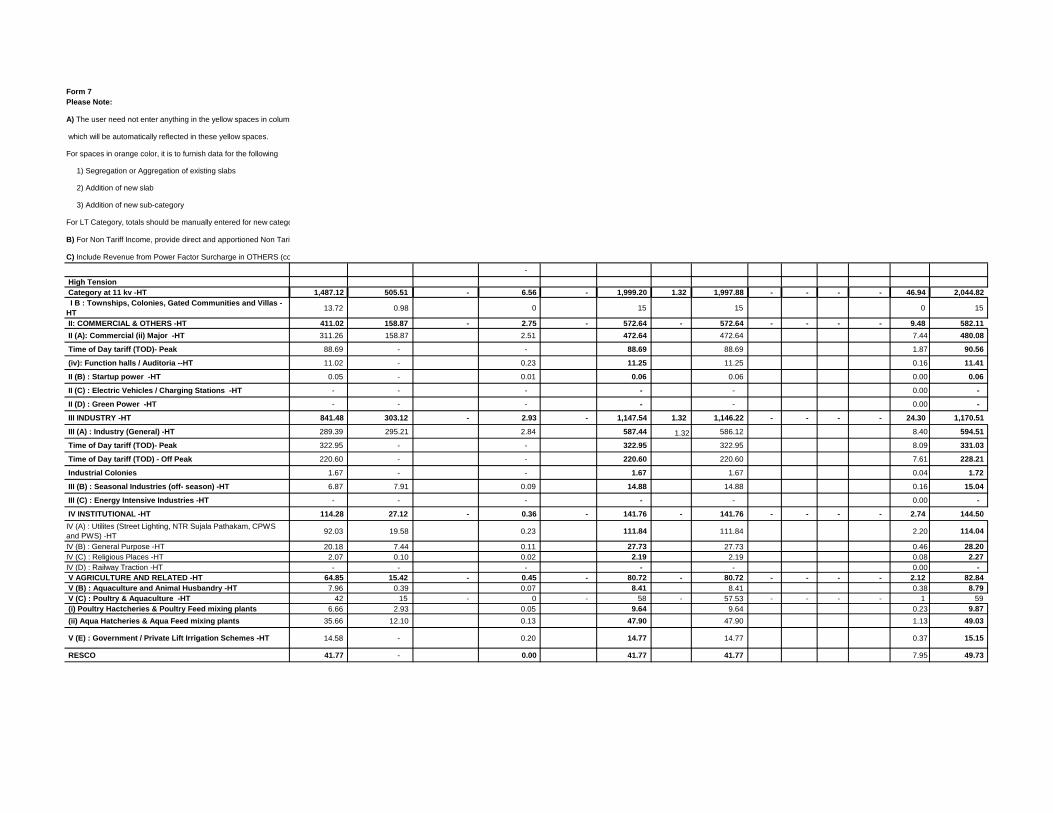
Form 7
Please Note:
A) The user need not enter anything in the yellow spaces in column C for Consumer Categories. For addition of new category, data first needs to be provided in Form A,
which will be automatically reflected in these yellow spaces.
For spaces in orange color, it is to furnish data for the following
1) Segregation or Aggregation of existing slabs
2) Addition of new slab
3) Addition of new sub-category
For LT Category, totals should be manually entered for new categories and slabs in the row for 'New L T Categories (Total).'
B) For Non Tariff Income, provide direct and apportioned Non Tariff Income (column V and W) for each consumer category
C) Include Revenue from Power Factor Surcharge in OTHERS (column O)
High Tension
Category at 11 kv -HT
I B : Townships, Colonies, Gated Communities and Villas -
HT
II: COMMERCIAL & OTHERS -HT
II (A): Commercial (ii) Major -HT
Time of Day tariff (TOD)- Peak
(iv): Function halls / Auditoria --HT
II (B) : Startup power -HT
II (C) : Electric Vehicles / Charging Stations -HT
II (D) : Green Power -HT
III INDUSTRY -HT
III (A) : Industry (General) -HT
Time of Day tariff (TOD)- Peak
Time of Day tariff (TOD) - Off Peak
Industrial Colonies
III (B) : Seasonal Industries (off- season) -HT
III (C) : Energy Intensive Industries -HT
IV INSTITUTIONAL -HT
IV (A) : Utilites (Street Lighting, NTR Sujala Pathakam, CPWS
and PWS) -HT
IV (B) : General Purpose -HT
IV (C) : Religious Places -HT
IV (D) : Railway Traction -HT
V AGRICULTURE AND RELATED -HT
V (B) : Aquaculture and Animal Husbandry -HT
V (C) : Poultry & Aquaculture -HT
(i) Poultry Hactcheries & Poultry Feed mixing plants
(ii) Aqua Hatcheries & Aqua Feed mixing plants
V (E) : Government / Private Lift Irrigation Schemes -HT
RESCO
Please Note:
A) The user need not enter anything in the yellow spaces in column C for Consumer Categories. For addition of new category, data first needs to be provided in Form A,
which will be automatically reflected in these yellow spaces.
For spaces in orange color, it is to furnish data for the following
1) Segregation or Aggregation of existing slabs
2) Addition of new slab
3) Addition of new sub-category
For LT Category, totals should be manually entered for new categories and slabs in the row for 'New L T Categories (Total).'
B) For Non Tariff Income, provide direct and apportioned Non Tariff Income (column V and W) for each consumer category
C) Include Revenue from Power Factor Surcharge in OTHERS (column O)
-
1,487.12 505.51 - 6.56 - 1,999.20 1.32 1,997.88 - - - - 46.94 2,044.82
13.72 0.98 0 15 15 0 15
411.02 158.87 - 2.75 - 572.64 - 572.64 - - - - 9.48 582.11
311.26 158.87 2.51 472.64 472.64 7.44 480.08
88.69 - - 88.69 88.69 1.87 90.56
11.02 - 0.23 11.25 11.25 0.16 11.41
0.05 - 0.01 0.06 0.06 0.00 0.06
- - - - - 0.00 -
- - - - - 0.00 -
841.48 303.12 - 2.93 - 1,147.54 1.32 1,146.22 - - - - 24.30 1,170.51
289.39 295.21 2.84 587.44 1.32 586.12 8.40 594.51
322.95 - - 322.95 322.95 8.09 331.03
220.60 - - 220.60 220.60 7.61 228.21
1.67 - - 1.67 1.67 0.04 1.72
6.87 7.91 0.09 14.88 14.88 0.16 15.04
- - - - - 0.00 -
114.28 27.12 - 0.36 - 141.76 - 141.76 - - - - 2.74 144.50
92.03 19.58 0.23 111.84 111.84 2.20 114.04
20.18 7.44 0.11 27.73 27.73 0.46 28.20
2.07 0.10 0.02 2.19 2.19 0.08 2.27
- - - - - 0.00 -
64.85 15.42 - 0.45 - 80.72 - 80.72 - - - - 2.12 82.84
7.96 0.39 0.07 8.41 8.41 0.38 8.79
42 15 - 0 - 58 - 57.53 - - - - 1 59
6.66 2.93 0.05 9.64 9.64 0.23 9.87
35.66 12.10 0.13 47.90 47.90 1.13 49.03
14.58 - 0.20 14.77 14.77 0.37 15.15
41.77 - 0.00 41.77 41.77 7.95 49.73
208

Form 7 Total Revenue at Current Tariff and Charges
Please Note:
A) The user need not enter anything in the yellow spaces in column C for Consumer Categories. For addition of new category, data first needs to be provided in Form A,
which will be automatically reflected in these yellow spaces.
For spaces in orange color, it is to furnish data for the following
1) Segregation or Aggregation of existing slabs
2) Addition of new slab
3) Addition of new sub-category
For LT Category, totals should be manually entered for new categories and slabs in the row for 'New L T Categories (Total).'
B) For Non Tariff Income, provide direct and apportioned Non Tariff Income (column V and W) for each consumer category
C) Include Revenue from Power Factor Surcharge in OTHERS (column O)
Category at 33 kv 308.00 1,965.73 - 675.84 -
I B : Townships, Colonies, Gated Communities and Villas -
HT 3 7.00 900 - 2,813 13 4 -
II: COMMERCIAL & OTHERS -HT 93.00 201.94 - 95.94 -
II (A): Commercial (ii) Major -HT 74 6.95 5,700 - 2,813 165 96 -
Time of Day tariff (TOD)- Peak - 7.95 5,700 - - 31 - -
(iv): Function halls / Auditoria --HT - 12.25 - - 2,813 - - -
II (B) : Startup power -HT 19 12.25 - - 2,813 5 - -
II (C) : Electric Vehicles / Charging Stations -HT - 6.70 - - 2,813 - - -
II (D) : Green Power -HT - 12.25 - - 2,813 - - -
III INDUSTRY -HT 183.00 1,607.65 - 455.13 -
III (A) : Industry (General) -HT 176 5.85 5,700 - 2,813 303 421 -
Time of Day tariff (TOD)- Peak - 6.85 5,700 - - 545 - -
Time of Day tariff (TOD) - Off Peak - 4.85 5,700 - - 554 - -
Industrial Colonies - 7.00 - - - 1 - -
III (B) : Seasonal Industries (off- season) -HT 2 6.95 5,700 - 2,813 7 5 -
III (C) : Energy Intensive Industries -HT 5 5.35 - - 2,813 198 29 -
IV INSTITUTIONAL -HT 2.00 1.46 0.63 -
IV (A) : Utilites (Street Lighting, NTR Sujala Pathakam,
CPWS and PWS) -HT 1 6.95 5,700 - 2,813 0 0 -
IV (B) : General Purpose -HT 1 7.25 5,700 - 2,813 1 0 -
IV (C) : Religious Places -HT - 5.00 360 - 2,813 - - -
IV (D) : Railway Traction -HT - 5.50 4,200 - 2,813 - - -
V AGRICULTURE AND RELATED -HT 27.00 142.00 120.00 -
V (B) : Aquaculture and Animal Husbandry -HT 2 3.85 360 - 2,813 - 3 -
V (C) : Poultry & Aquaculture -HT 6 - - - - 74 - 12 -
(i) Poultry Hactcheries & Poultry Feed mixing plants - 5.25 5,700 - 2,813 - - -
(ii) Aqua Hatcheries & Aqua Feed mixing plants 6 5.75 5,700 - 2,813 74 12 -
V (E) : Government / Private Lift Irrigation Schemes -HT 19 7.15 - - 2,813 68 105 -
209

Form 7
Please Note:
A) The user need not enter anything in the yellow spaces in column C for Consumer Categories. For addition of new category, data first needs to be provided in Form A,
which will be automatically reflected in these yellow spaces.
For spaces in orange color, it is to furnish data for the following
1) Segregation or Aggregation of existing slabs
2) Addition of new slab
3) Addition of new sub-category
For LT Category, totals should be manually entered for new categories and slabs in the row for 'New L T Categories (Total).'
B) For Non Tariff Income, provide direct and apportioned Non Tariff Income (column V and W) for each consumer category
C) Include Revenue from Power Factor Surcharge in OTHERS (column O)
Category at 33 kv
I B : Townships, Colonies, Gated Communities and Villas -
HT
II: COMMERCIAL & OTHERS -HT
II (A): Commercial (ii) Major -HT
Time of Day tariff (TOD)- Peak
(iv): Function halls / Auditoria --HT
II (B) : Startup power -HT
II (C) : Electric Vehicles / Charging Stations -HT
II (D) : Green Power -HT
III INDUSTRY -HT
III (A) : Industry (General) -HT
Time of Day tariff (TOD)- Peak
Time of Day tariff (TOD) - Off Peak
Industrial Colonies
III (B) : Seasonal Industries (off- season) -HT
III (C) : Energy Intensive Industries -HT
IV INSTITUTIONAL -HT
IV (A) : Utilites (Street Lighting, NTR Sujala Pathakam,
CPWS and PWS) -HT
IV (B) : General Purpose -HT
IV (C) : Religious Places -HT
IV (D) : Railway Traction -HT
V AGRICULTURE AND RELATED -HT
V (B) : Aquaculture and Animal Husbandry -HT
V (C) : Poultry & Aquaculture -HT
(i) Poultry Hactcheries & Poultry Feed mixing plants
(ii) Aqua Hatcheries & Aqua Feed mixing plants
V (E) : Government / Private Lift Irrigation Schemes -HT
Please Note:
A) The user need not enter anything in the yellow spaces in column C for Consumer Categories. For addition of new category, data first needs to be provided in Form A,
which will be automatically reflected in these yellow spaces.
For spaces in orange color, it is to furnish data for the following
1) Segregation or Aggregation of existing slabs
2) Addition of new slab
3) Addition of new sub-category
For LT Category, totals should be manually entered for new categories and slabs in the row for 'New L T Categories (Total).'
B) For Non Tariff Income, provide direct and apportioned Non Tariff Income (column V and W) for each consumer category
C) Include Revenue from Power Factor Surcharge in OTHERS (column O)
1,178.01 305.18 - 1.04 - 1,484.23 3.40 1,480.83 - - - - 35.93 1,516.76
8.87 0.37 0.01 9.25 9.25 0.23 9.49
146.31 54.69 - 0.31 - 201.31 - 201.31 - - - - 3.69 205.00
114.95 54.69 0.25 169.89 169.89 3.02 172.91
24.78 - - 24.78 24.78 0.57 25.35
- - - - - 0.00 -
6.58 - 0.06 6.64 6.64 0.10 6.74
- - - - - 0.00 -
- - - - - 0.00 -
930.60 242.64 - 0.62 - 1,173.86 3.40 1,170.45 - - - - 29.39 1,199.84
177.08 240.04 0.59 417.72 3.40 414.32 5.53 419.85
373.14 - - 373.14 373.14 9.96 383.09
268.72 - - 268.72 268.72 10.13 278.84
1.02 - - 1.02 1.02 0.03 1.05
4.88 2.59 0.01 7.48 7.48 0.13 7.61
105.76 - 0.02 105.78 105.78 3.61 109.39
1 0 - 0 - 1 - 1 - - - - 0 1
0.15 0.21 0.00 0.37 0.37 0.00 0.37
0.91 0.14 0.00 1.05 1.05 0.02 1.07
- - - - - 0.00 -
- - - - - 0.00 -
91 7 - 0 - 98 - 98 - - - - 3 101 - 0.11 0.01 0.12 0.12 0.00 0.12
43 7 - 0 - 50 - 49.56 - - - - 1 51
- - - - - 0.00 -
42.52 7.02 0.02 49.56 49.56 1.35 50.91
48.66 - 0.06 48.72 48.72 1.24 49.96
210
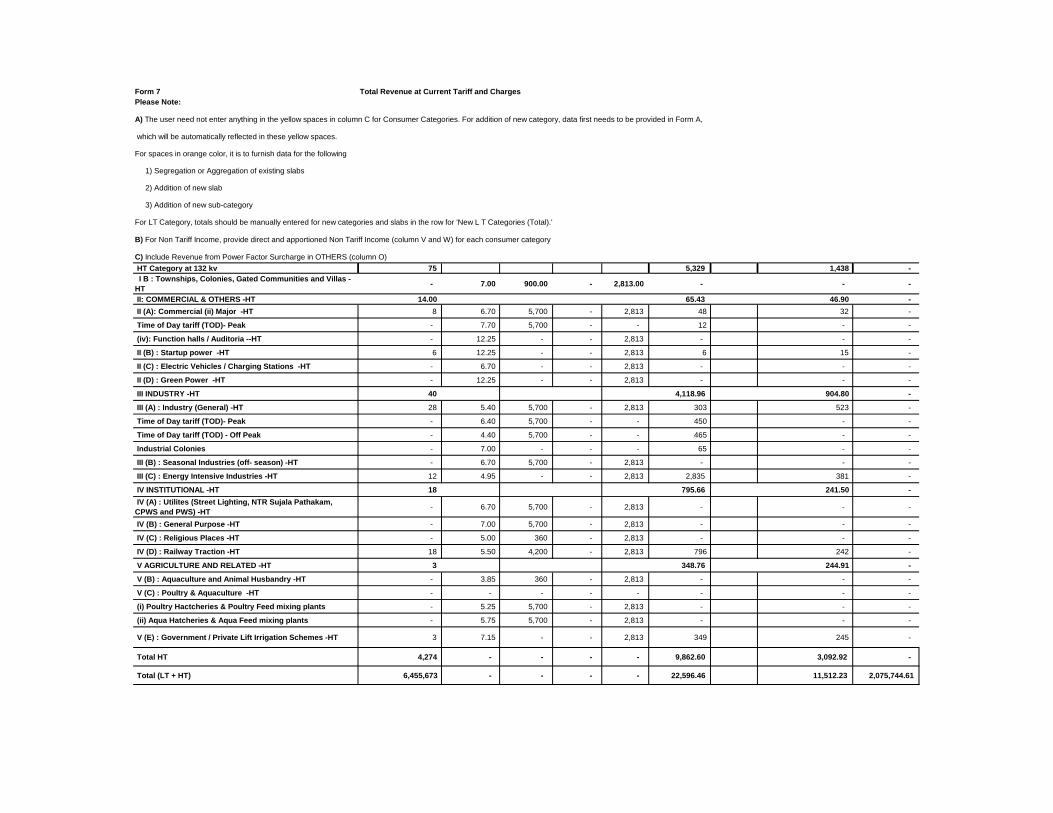
Form 7 Total Revenue at Current Tariff and Charges
Please Note:
A) The user need not enter anything in the yellow spaces in column C for Consumer Categories. For addition of new category, data first needs to be provided in Form A,
which will be automatically reflected in these yellow spaces.
For spaces in orange color, it is to furnish data for the following
1) Segregation or Aggregation of existing slabs
2) Addition of new slab
3) Addition of new sub-category
For LT Category, totals should be manually entered for new categories and slabs in the row for 'New L T Categories (Total).'
B) For Non Tariff Income, provide direct and apportioned Non Tariff Income (column V and W) for each consumer category
C) Include Revenue from Power Factor Surcharge in OTHERS (column O)
HT Category at 132 kv 75 5,329 1,438 -
I B : Townships, Colonies, Gated Communities and Villas -
HT - 7.00 900.00 - 2,813.00 - - -
II: COMMERCIAL & OTHERS -HT 14.00 65.43 46.90 -
II (A): Commercial (ii) Major -HT 8 6.70 5,700 - 2,813 48 32 -
Time of Day tariff (TOD)- Peak - 7.70 5,700 - - 12 - -
(iv): Function halls / Auditoria --HT - 12.25 - - 2,813 - - -
II (B) : Startup power -HT 6 12.25 - - 2,813 6 15 -
II (C) : Electric Vehicles / Charging Stations -HT - 6.70 - - 2,813 - - -
II (D) : Green Power -HT - 12.25 - - 2,813 - - -
III INDUSTRY -HT 40 4,118.96 904.80 -
III (A) : Industry (General) -HT 28 5.40 5,700 - 2,813 303 523 -
Time of Day tariff (TOD)- Peak - 6.40 5,700 - - 450 - -
Time of Day tariff (TOD) - Off Peak - 4.40 5,700 - - 465 - -
Industrial Colonies - 7.00 - - - 65 - -
III (B) : Seasonal Industries (off- season) -HT - 6.70 5,700 - 2,813 - - -
III (C) : Energy Intensive Industries -HT 12 4.95 - - 2,813 2,835 381 -
IV INSTITUTIONAL -HT 18 795.66 241.50 -
IV (A) : Utilites (Street Lighting, NTR Sujala Pathakam,
CPWS and PWS) -HT - 6.70 5,700 - 2,813 - - -
IV (B) : General Purpose -HT - 7.00 5,700 - 2,813 - - -
IV (C) : Religious Places -HT - 5.00 360 - 2,813 - - -
IV (D) : Railway Traction -HT 18 5.50 4,200 - 2,813 796 242 -
V AGRICULTURE AND RELATED -HT 3 348.76 244.91 -
V (B) : Aquaculture and Animal Husbandry -HT - 3.85 360 - 2,813 - - -
V (C) : Poultry & Aquaculture -HT - - - - - - - -
(i) Poultry Hactcheries & Poultry Feed mixing plants - 5.25 5,700 - 2,813 - - -
(ii) Aqua Hatcheries & Aqua Feed mixing plants - 5.75 5,700 - 2,813 - - -
V (E) : Government / Private Lift Irrigation Schemes -HT 3 7.15 - - 2,813 349 245 -
Total HT 4,274 - - - - 9,862.60 3,092.92 -
Total (LT + HT) 6,455,673 - - - - 22,596.46 11,512.23 2,075,744.61
211

Form 7
Please Note:
A) The user need not enter anything in the yellow spaces in column C for Consumer Categories. For addition of new category, data first needs to be provided in Form A,
which will be automatically reflected in these yellow spaces.
For spaces in orange color, it is to furnish data for the following
1) Segregation or Aggregation of existing slabs
2) Addition of new slab
3) Addition of new sub-category
For LT Category, totals should be manually entered for new categories and slabs in the row for 'New L T Categories (Total).'
B) For Non Tariff Income, provide direct and apportioned Non Tariff Income (column V and W) for each consumer category
C) Include Revenue from Power Factor Surcharge in OTHERS (column O)
HT Category at 132 kv
I B : Townships, Colonies, Gated Communities and Villas -
HT
II: COMMERCIAL & OTHERS -HT
II (A): Commercial (ii) Major -HT
Time of Day tariff (TOD)- Peak
(iv): Function halls / Auditoria --HT
II (B) : Startup power -HT
II (C) : Electric Vehicles / Charging Stations -HT
II (D) : Green Power -HT
III INDUSTRY -HT
III (A) : Industry (General) -HT
Time of Day tariff (TOD)- Peak
Time of Day tariff (TOD) - Off Peak
Industrial Colonies
III (B) : Seasonal Industries (off- season) -HT
III (C) : Energy Intensive Industries -HT
IV INSTITUTIONAL -HT
IV (A) : Utilites (Street Lighting, NTR Sujala Pathakam,
CPWS and PWS) -HT
IV (B) : General Purpose -HT
IV (C) : Religious Places -HT
IV (D) : Railway Traction -HT
V AGRICULTURE AND RELATED -HT
V (B) : Aquaculture and Animal Husbandry -HT
V (C) : Poultry & Aquaculture -HT
(i) Poultry Hactcheries & Poultry Feed mixing plants
(ii) Aqua Hatcheries & Aqua Feed mixing plants
V (E) : Government / Private Lift Irrigation Schemes -HT
Total HT
Total (LT + HT)
Please Note:
A) The user need not enter anything in the yellow spaces in column C for Consumer Categories. For addition of new category, data first needs to be provided in Form A,
which will be automatically reflected in these yellow spaces.
For spaces in orange color, it is to furnish data for the following
1) Segregation or Aggregation of existing slabs
2) Addition of new slab
3) Addition of new sub-category
For LT Category, totals should be manually entered for new categories and slabs in the row for 'New L T Categories (Total).'
B) For Non Tariff Income, provide direct and apportioned Non Tariff Income (column V and W) for each consumer category
C) Include Revenue from Power Factor Surcharge in OTHERS (column O)
2,840.82 418.26 - 0.25 - 3,259.33 1.59 3,257.74 - - - - 97.41 3,355.15
- - - - - - -
48.18 18.47 - 0.05 - 66.69 - 66.69 - - - - 1.20 67.89
31.86 18.47 0.03 50.36 50.36 0.87 51.23
9.44 - - 9.44 9.44 0.22 9.66
- - - - - 0.00 -
6.88 - 0.02 6.90 6.90 0.10 7.00
- - - - - 0.00 -
- - - - - 0.00 -
2,105.67 298 - 0 - 2,404 1.59 2,403 - - - - 75.29 2,478
163.75 298.37 0.09 462.21 2 460.62 5.54 466.16
288.26 - - 288.26 288.26 8.23 296.50
204.70 - - 204.70 204.70 8.50 213.21
45.80 - - 45.80 45.80 1.20 46.99
- - - - - 0.00 -
1,403.15 - 0.04 1,403.20 1,403.20 51.82 1,455.01
437.61 101 - 0 - 539 - 539 - - - - 14.54 554
- - - - - 0.00 -
- - - - - 0.00 -
- - - - - 0.00 -
437.61 101.43 0.06 539.10 539.10 14.54 553.65
249.36 - - 0 - 249 - 249 - - - - 6.38 256
- - - - - 0.00 -
- - - - - 0.00 -
- - - - - 0.00 -
- - - - - 0.00 -
249.36 - 0.01 249.37 249.37 6.38 255.75
5,505.95 1,229 - 8 - 6,743 6 6,736 - - - - 180 6,917
9,832.93 1,430.25 66.66 273.20 - 11,603.03 6.32 11,596.72 - - - - 413.05 12,009.76
212
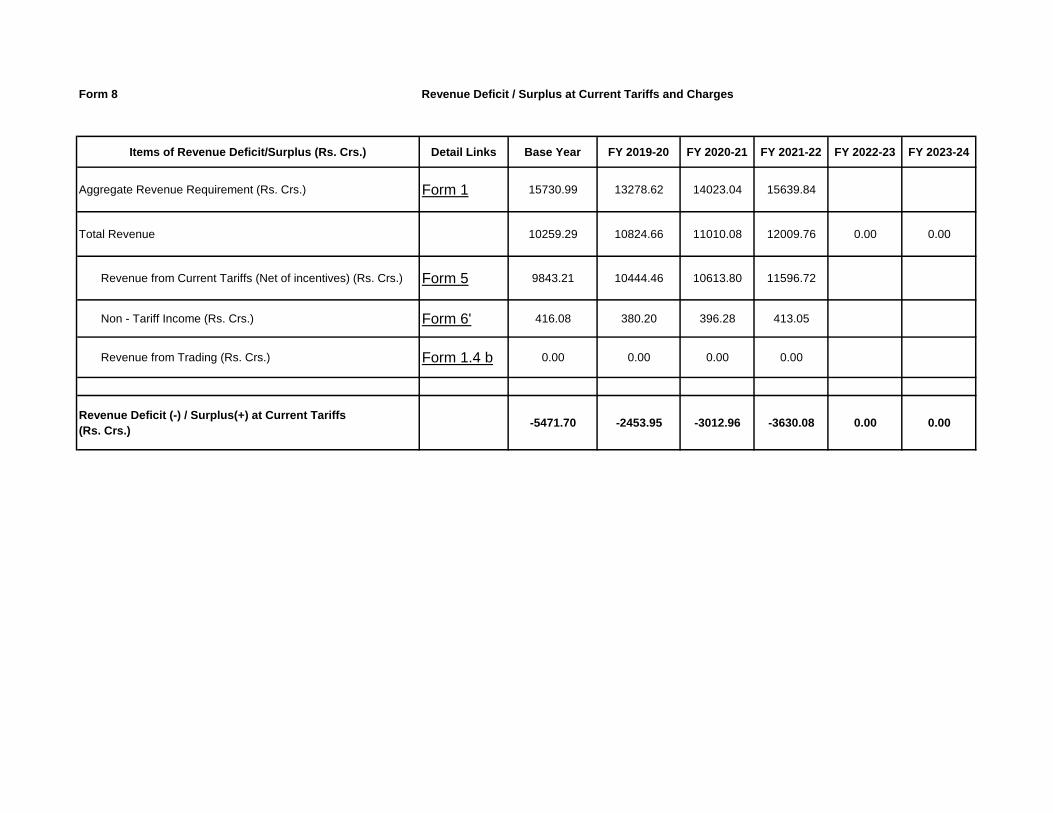
Form 8 Revenue Deficit / Surplus at Current Tariffs and Charges
Items of Revenue Deficit/Surplus (Rs. Crs.) Detail Links Base Year FY 2019-20 FY 2020-21 FY 2021-22 FY 2022-23 FY 2023-24
Aggregate Revenue Requirement (Rs. Crs.) Form 1 15730.99 13278.62 14023.04 15639.84
Total Revenue 10259.29 10824.66 11010.08 12009.76 0.00 0.00
Revenue from Current Tariffs (Net of incentives) (Rs. Crs.) Form 5 9843.21 10444.46 10613.80 11596.72
Non - Tariff Income (Rs. Crs.) Form 6' 416.08 380.20 396.28 413.05
Revenue from Trading (Rs. Crs.) Form 1.4 b 0.00 0.00 0.00 0.00
Revenue Deficit (-) / Surplus(+) at Current Tariffs
(Rs. Crs.)-5471.70 -2453.95 -3012.96 -3630.08 0.00 0.00
213

Form 9 Revenue Deficit / Surplus and Proposed Adjustments
Items of Revenue Deficit/ Surplus (Rs. Crs.) Detail Links Base Year FY 2019-20 FY 2020-21 FY 2021-22 FY 2022-23 FY 2023-24
A Aggregate Revenue Requirement Form 1 15730.99 13278.62 14023.04 15639.84 0.00 0.00
B Revenue from Current Tariffs (Net of incentives) (Rs. Crs.) Form 5 9843.21 10444.46 10613.80 11596.72 0.00 0.00
C Non - Tariff Income (Rs. Crs.) Form 6' 416.08 380.20 396.28 413.05 0.00 0.00
D Revenue from Trading Form 1.4 b 0.00 0.00 0.00 0.00 0.00 0.00
E Revenue Deficit(-) / Surplus(+) at Current Tariff -5471.70 -2453.95 -3012.96 -3630.08 0.00 0.00
F Revenue changed through proposed tariff 306.18
G External subsidy available / contracted 1,115.24 -137.09
H Any other means of adjustments
I Revenue from cross subsidy surcharge 54.34 62.43 65.55
Net Deficit / Surplus -4356.46 -2399.61 -3087.63 -3258.35 0.00 0.00
214
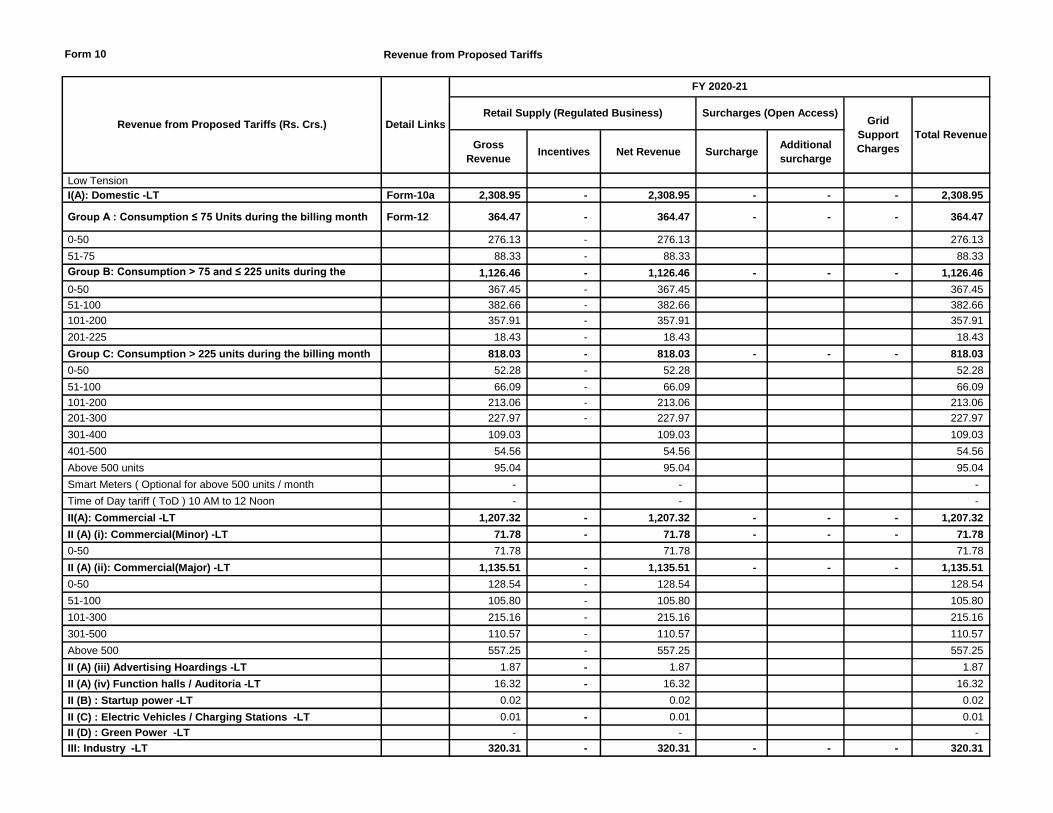
Form 10 Revenue from Proposed Tariffs
Gross
RevenueIncentives Net Revenue Surcharge
Additional
surcharge
Low Tension
I(A): Domestic -LT Form-10a 2,308.95 - 2,308.95 - - - 2,308.95
Group A : Consumption ≤ 75 Units during the billing month Form-12 364.47 - 364.47 - - - 364.47
0-50 276.13 - 276.13 276.13
51-75 88.33 - 88.33 88.33
Group B: Consumption > 75 and ≤ 225 units during the
billing month
1,126.46 - 1,126.46 - - - 1,126.46
0-50 367.45 - 367.45 367.45
51-100 382.66 - 382.66 382.66
101-200 357.91 - 357.91 357.91
201-225 18.43 - 18.43 18.43
Group C: Consumption > 225 units during the billing month 818.03 - 818.03 - - - 818.03
0-50 52.28 - 52.28 52.28
51-100 66.09 - 66.09 66.09
101-200 213.06 - 213.06 213.06
201-300 227.97 - 227.97 227.97
301-400 109.03 109.03 109.03
401-500 54.56 54.56 54.56
Above 500 units 95.04 95.04 95.04
Smart Meters ( Optional for above 500 units / month - - -
Time of Day tariff ( ToD ) 10 AM to 12 Noon - - -
II(A): Commercial -LT 1,207.32 - 1,207.32 - - - 1,207.32
II (A) (i): Commercial(Minor) -LT 71.78 - 71.78 - - - 71.78
0-50 71.78 71.78 71.78
II (A) (ii): Commercial(Major) -LT 1,135.51 - 1,135.51 - - - 1,135.51
0-50 128.54 - 128.54 128.54
51-100 105.80 - 105.80 105.80
101-300 215.16 - 215.16 215.16
301-500 110.57 - 110.57 110.57
Above 500 557.25 - 557.25 557.25
II (A) (iii) Advertising Hoardings -LT 1.87 - 1.87 1.87
II (A) (iv) Function halls / Auditoria -LT 16.32 - 16.32 16.32
II (B) : Startup power -LT 0.02 0.02 0.02
II (C) : Electric Vehicles / Charging Stations -LT 0.01 - 0.01 0.01
II (D) : Green Power -LT - - -
III: Industry -LT 320.31 - 320.31 - - - 320.31
Revenue from Proposed Tariffs (Rs. Crs.) Detail Links
FY 2020-21
Retail Supply (Regulated Business) Surcharges (Open Access)Grid
Support
Charges
Total Revenue
215

Gross
RevenueIncentives Net Revenue Surcharge
Additional
surcharge
Revenue from Proposed Tariffs (Rs. Crs.) Detail Links
FY 2020-21
Retail Supply (Regulated Business) Surcharges (Open Access)Grid
Support
Charges
Total Revenue
III (A):Industries (General) -LT 318.49 - 318.49 318.49
III (B): Seasonal Industries (off season) -LT 0.61 0.61 0.61
III(D):Cottage Industries upto 10HP -LT 1.21 1.21 1.21
IV: INSTITUTIONAL -LT 273.78 - 273.78 - - - 273.78
IV (A) : Utilites (Street Lighting, NTR Sujala Pathakam,
CPWS and PWS) -LT
194.39 - 194.39 194.39
IV (B) : General Purpose -LT 69.96 69.96 69.96
IV (C) : Religious Places -LT 9.43 - 9.43 - - - 9.43
(i) Religious Places (CL <= 2kW) 7.12 - 7.12 7.12
(ii) Religious Places (CL > 2kW) 2.31 2.31 2.31
V: Agriculture & Related -LT 778.34 778.34 778.34
V (A) : Agriculture -LT 13.25 - 13.25 - - - 13.25
V (A) (i) Corporate farmers with DSM 2.89 2.89 2.89
Corporate farmers without DSM 1.21 - 1.21 1.21
V (A) (ii) Non-Corporate farmers with DSM 8.75 - 8.75 8.75
Non-Corporate farmers without DSM 0.28 0.28 0.28
V (A) (iii) Salt farming units upto 15 HP* 0.04 0.04 0.04
V (A) (iv) Sugarcane crushing 0.00 - 0.00 0.00
V (A) (v) Rural Horticulture Nurseries 0.06 0.06 0.06
V (A) (vi) Floriculture in Green House 0.02 0.02 0.02
Agl others 765.09 - 765.09 - - - 765.09
V (B) : Aquaculture and Animal Husbandry -LT 764.93 764.93 764.93
V (D) : Agro Based Cottage Industries upto 10 HP -LT 0.16 0.16 0.16
Total LT 4,888.70 - 4,888.70 - - - 4,888.70
- - - High Tension - - - - - -
Category at 11 kv -HT 2,271.21 - 2,271.21 - - - 2,271.21
I: Domestic -HT 12.71 12.71 - - - 12.71
II: COMMERCIAL & OTHERS -HT 572.64 - 572.64 - - - 572.64
II (A): Commercial (ii) Major -HT 472.64 - 472.64 472.64
Time of Day tariff (TOD)- Peak 88.69 - 88.69 88.69
(iv): Function halls / Auditoria --HT 11.25 11.25 11.25
II (B) : Startup power -HT 0.06 0.06 0.06
II (C) : Electric Vehicles / Charging Stations -HT - - -
II (D) : Green Power -HT - - -
III INDUSTRY -HT 1,209.81 - 1,209.81 - - - 1,209.81
III (A) : Industry (General) -HT 649.71 649.71 649.71
Time of Day tariff (TOD)- Peak 322.95 - 322.95 322.95
216

Gross
RevenueIncentives Net Revenue Surcharge
Additional
surcharge
Revenue from Proposed Tariffs (Rs. Crs.) Detail Links
FY 2020-21
Retail Supply (Regulated Business) Surcharges (Open Access)Grid
Support
Charges
Total Revenue
Time of Day tariff (TOD) - Off Peak 220.60 220.60 220.60
Industrial Colonies 1.67 1.67 1.67
III (B) : Seasonal Industries (off- season) -HT 14.88 - 14.88 14.88
III (C) : Energy Intensive Industries -HT - - -
IV INSTITUTIONAL -HT 141.76 - 141.76 - - - 141.76
IV (A) : Utilites (Street Lighting, NTR Sujala Pathakam, CPWS
and PWS) -HT 111.84 111.84 111.84
IV (B) : General Purpose -HT 27.73 - 27.73 27.73
IV (C) : Religious Places -HT 2.19 2.19 2.19
IV (D) : Railway Traction -HT - - - -
V AGRICULTURE AND RELATED -HT 23.19 - 23.19 - - - 23.19
V (B) : Aquaculture and Animal Husbandry -HT 8.41 8.41 8.41
V (E) : Government / Private Lift Irrigation Schemes -HT 14.77 14.77 14.77
RESCO 311.10 - 311.10 - - - 311.10
Category at 33 kv 1,483.64 - 1,483.64 - - - 1,483.64
I : Domestic -HT 7.92 - 7.92 - - - 7.92
II: COMMERCIAL & OTHERS -HT 201.31 - 201.31 - - - 201.31
II (A): Commercial (ii) Major -HT 169.89 169.89 169.89
Time of Day tariff (TOD)- Peak 24.78 24.78 24.78
(iv): Function halls / Auditoria --HT - - -
II (B) : Startup power -HT 6.64 6.64 6.64
II (C) : Electric Vehicles / Charging Stations -HT - - -
II (D) : Green Power -HT - - - -
III INDUSTRY -HT 1,224.16 - 1,224.16 - - - 1,224.16
III (A) : Industry (General) -HT 468.02 468.02 468.02
Time of Day tariff (TOD)- Peak 373.14 - 373.14 373.14
Time of Day tariff (TOD) - Off Peak 268.72 268.72 268.72
Industrial Colonies 1.02 1.02 1.02
III (B) : Seasonal Industries (off- season) -HT 7.48 7.48 7.48
III (C) : Energy Intensive Industries -HT 105.78 105.78 105.78
IV INSTITUTIONAL -HT 1.42 - 1.42 - - - 1.42
IV (A) : Utilites (Street Lighting, NTR Sujala Pathakam, CPWS
and PWS) -HT
0.37 0.37 0.37
IV (B) : General Purpose -HT 1.05 - 1.05 1.05
IV (C) : Religious Places -HT - - - -
IV (D) : Railway Traction -HT - - -
V AGRICULTURE AND RELATED -HT 48.84 48.84 - - - 48.84
V (B) : Aquaculture and Animal Husbandry -HT 0.12 - 0.12 0.12
217

Gross
RevenueIncentives Net Revenue Surcharge
Additional
surcharge
Revenue from Proposed Tariffs (Rs. Crs.) Detail Links
FY 2020-21
Retail Supply (Regulated Business) Surcharges (Open Access)Grid
Support
Charges
Total Revenue
V (E) : Government / Private Lift Irrigation Schemes -HT 48.72 48.72 48.72
HT Category at 132 kv 3,259.33 - 3,259.33 - - - 3,259.33
I : Domestic -HT - - - - - -
II: COMMERCIAL & OTHERS -HT 66.69 66.69 - - - 66.69
II (A): Commercial (ii) Major -HT 50.36 50.36 50.36
Time of Day tariff (TOD)- Peak 9.44 9.44 9.44
(iv): Function halls / Auditoria --HT - - - -
II (B) : Startup power -HT 6.90 6.90 6.90
II (C) : Electric Vehicles / Charging Stations -HT - - -
II (D) : Green Power -HT - - -
III INDUSTRY -HT 2,404.17 - 2,404.17 - - - 2,404.17
III (A) : Industry (General) -HT 462.21 462.21 462.21
Time of Day tariff (TOD)- Peak 288.26 288.26 288.26
Time of Day tariff (TOD) - Off Peak 204.70 204.70 204.70
Industrial Colonies 45.80 45.80 45.80
III (B) : Seasonal Industries (off- season) -HT - - -
III (C) : Energy Intensive Industries -HT 1,403.20 1,403.20 1,403.20
IV INSTITUTIONAL -HT 539.10 - 539.10 - - - 539.10
IV (A) : Utilites (Street Lighting, NTR Sujala Pathakam, CPWS
and PWS) -HT - - -
IV (B) : General Purpose -HT - - -
IV (C) : Religious Places -HT - - -
IV (D) : Railway Traction -HT 539.10 539.10 539.10
V AGRICULTURE AND RELATED -HT 249.37 - 249.37 - - - 249.37
V (B) : Aquaculture and Animal Husbandry -HT - - -
V (E) : Government / Private Lift Irrigation Schemes -HT 249.37 249.37 249.37
Total HT 7,014.19 - 7,014.19 - - - 7,014.19
Total (LT + HT) 11,902.90 - 11,902.90 - - - 11,902.90
218
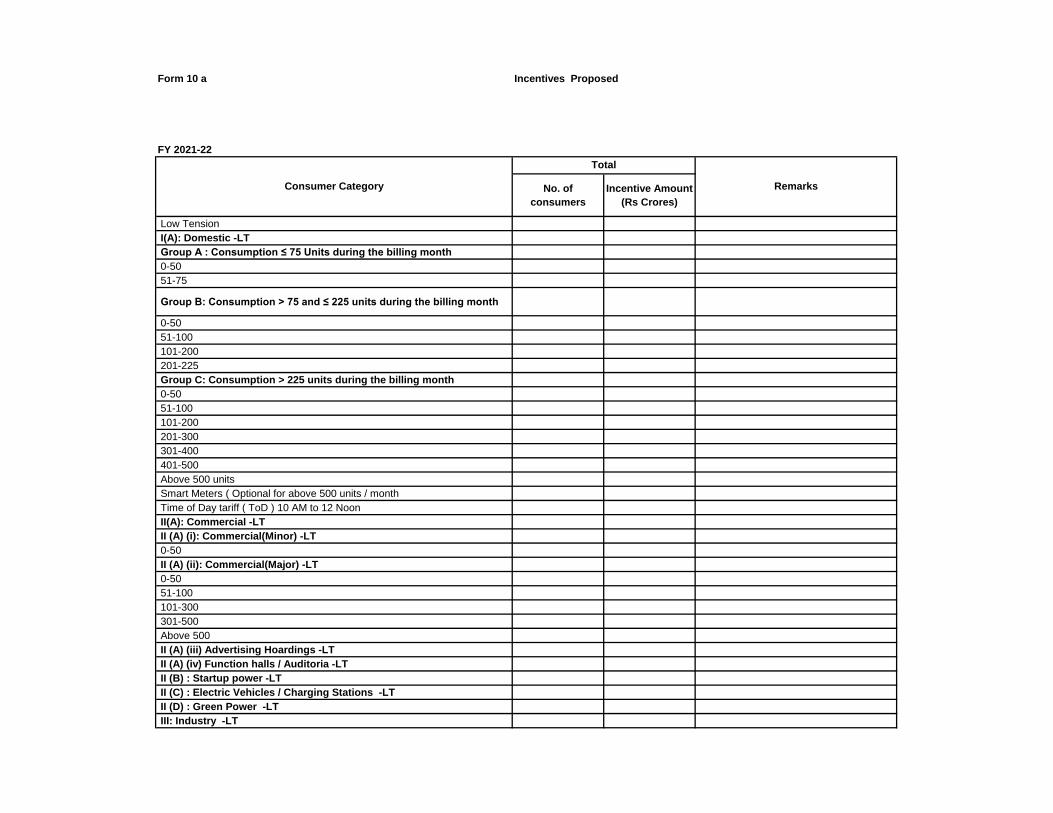
Form 10 a Incentives Proposed
FY 2021-22
No. of
consumers
Incentive Amount
(Rs Crores)
Low Tension
I(A): Domestic -LT
Group A : Consumption ≤ 75 Units during the billing month
0-50
51-75
Group B: Consumption > 75 and ≤ 225 units during the billing month
0-50
51-100
101-200
201-225
Group C: Consumption > 225 units during the billing month
0-50
51-100
101-200
201-300
301-400
401-500
Above 500 units
Smart Meters ( Optional for above 500 units / month
Time of Day tariff ( ToD ) 10 AM to 12 Noon
II(A): Commercial -LT
II (A) (i): Commercial(Minor) -LT
0-50
II (A) (ii): Commercial(Major) -LT
0-50
51-100
101-300
301-500
Above 500
II (A) (iii) Advertising Hoardings -LT
II (A) (iv) Function halls / Auditoria -LT
II (B) : Startup power -LT
II (C) : Electric Vehicles / Charging Stations -LT
II (D) : Green Power -LT
III: Industry -LT
Total
Consumer Category Remarks
219

No. of
consumers
Incentive Amount
(Rs Crores)
Total
Consumer Category Remarks
III (A):Industries (General) -LT
III (B): Seasonal Industries (off season) -LT
III(D):Cottage Industries upto 10HP -LT
IV: INSTITUTIONAL -LT
IV (A) : Utilites (Street Lighting, NTR Sujala Pathakam, CPWS and
PWS) -LT
IV (B) : General Purpose -LT
IV (C) : Religious Places -LT
(i) Religious Places (CL <= 2kW)
(ii) Religious Places (CL > 2kW)
V: Agriculture & Related -LT
V (A) : Agriculture -LT
V (A) (i) Corporate farmers with DSM
Corporate farmers without DSM
V (A) (ii) Non-Corporate farmers with DSM
Non-Corporate farmers without DSM
V (A) (iii) Salt farming units upto 15 HP*
V (A) (iv) Sugarcane crushing
V (A) (v) Rural Horticulture Nurseries
V (A) (vi) Floriculture in Green House
Agl others
V (B) : Aquaculture and Animal Husbandry -LT
V (C) : Poultry & Aquaculture -LT
V (C)(i) Poultry Hatcheries & Poultry Feed mixing plants
V (C)(ii) Aqua Hatcheries & Aqua Feed mixing plants
V (D) : Agro Based Cottage Industries upto 10 HP -LT
Total LT
High Tension
Category at 11 kv -HT
I B : Townships, Colonies, Gated Communities and Villas -HT
II: COMMERCIAL & OTHERS -HT
II (A): Commercial (ii) Major -HT
Time of Day tariff (TOD)- Peak
(iv): Function halls / Auditoria --HT
II (B) : Startup power -HT
II (C) : Electric Vehicles / Charging Stations -HT
II (D) : Green Power -HT
III INDUSTRY -HT
220
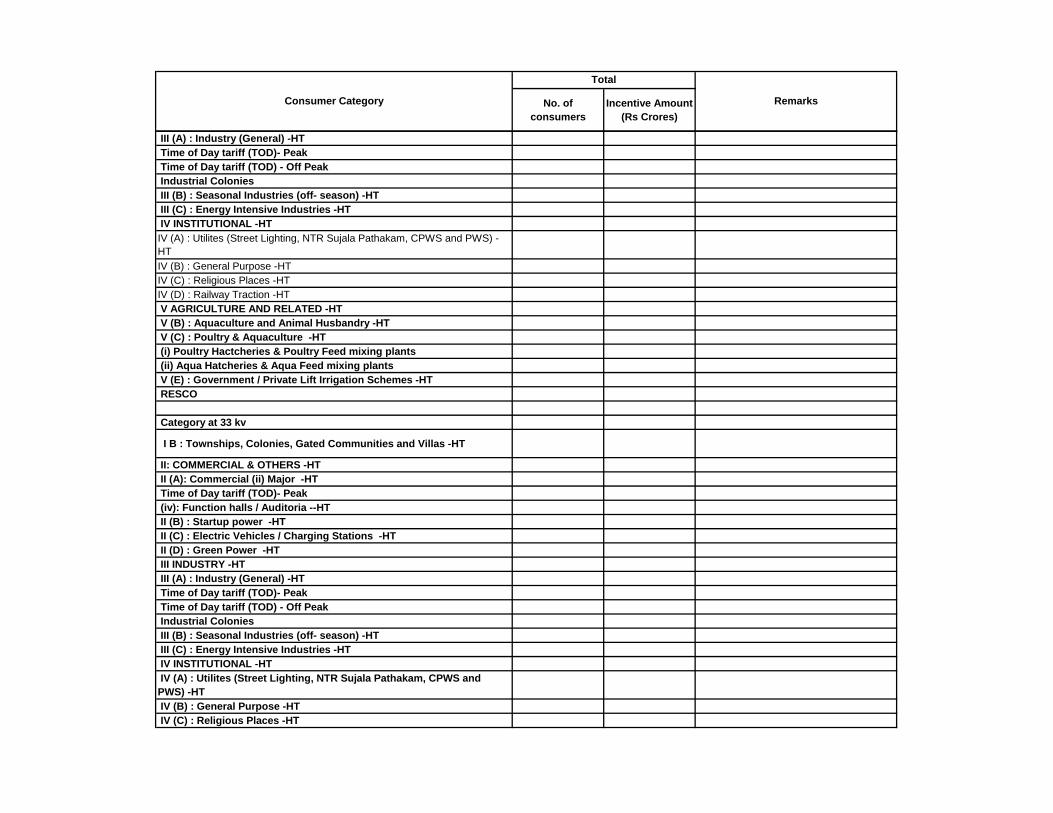
No. of
consumers
Incentive Amount
(Rs Crores)
Total
Consumer Category Remarks
III (A) : Industry (General) -HT
Time of Day tariff (TOD)- Peak
Time of Day tariff (TOD) - Off Peak
Industrial Colonies
III (B) : Seasonal Industries (off- season) -HT
III (C) : Energy Intensive Industries -HT
IV INSTITUTIONAL -HT
IV (A) : Utilites (Street Lighting, NTR Sujala Pathakam, CPWS and PWS) -
HT
IV (B) : General Purpose -HT
IV (C) : Religious Places -HT
IV (D) : Railway Traction -HT
V AGRICULTURE AND RELATED -HT
V (B) : Aquaculture and Animal Husbandry -HT
V (C) : Poultry & Aquaculture -HT
(i) Poultry Hactcheries & Poultry Feed mixing plants
(ii) Aqua Hatcheries & Aqua Feed mixing plants
V (E) : Government / Private Lift Irrigation Schemes -HT
RESCO
Category at 33 kv
I B : Townships, Colonies, Gated Communities and Villas -HT
II: COMMERCIAL & OTHERS -HT
II (A): Commercial (ii) Major -HT
Time of Day tariff (TOD)- Peak
(iv): Function halls / Auditoria --HT
II (B) : Startup power -HT
II (C) : Electric Vehicles / Charging Stations -HT
II (D) : Green Power -HT
III INDUSTRY -HT
III (A) : Industry (General) -HT
Time of Day tariff (TOD)- Peak
Time of Day tariff (TOD) - Off Peak
Industrial Colonies
III (B) : Seasonal Industries (off- season) -HT
III (C) : Energy Intensive Industries -HT
IV INSTITUTIONAL -HT
IV (A) : Utilites (Street Lighting, NTR Sujala Pathakam, CPWS and
PWS) -HT
IV (B) : General Purpose -HT
IV (C) : Religious Places -HT
221
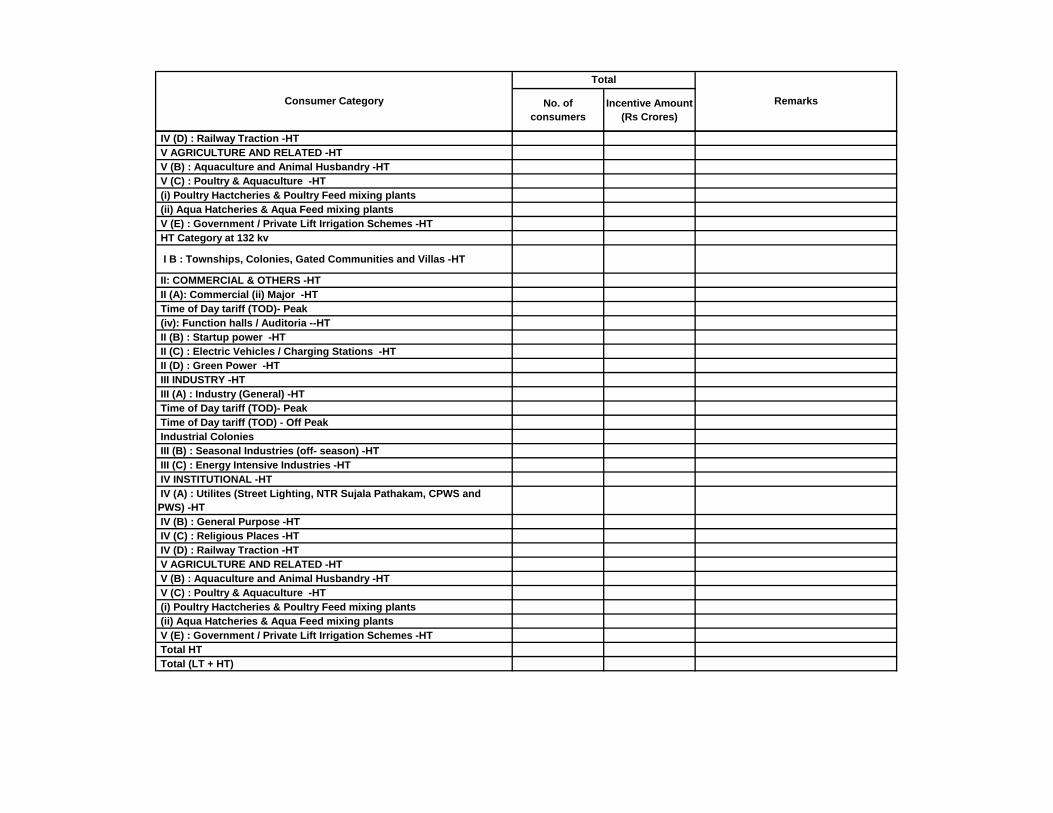
No. of
consumers
Incentive Amount
(Rs Crores)
Total
Consumer Category Remarks
IV (D) : Railway Traction -HT
V AGRICULTURE AND RELATED -HT
V (B) : Aquaculture and Animal Husbandry -HT
V (C) : Poultry & Aquaculture -HT
(i) Poultry Hactcheries & Poultry Feed mixing plants
(ii) Aqua Hatcheries & Aqua Feed mixing plants
V (E) : Government / Private Lift Irrigation Schemes -HT
HT Category at 132 kv
I B : Townships, Colonies, Gated Communities and Villas -HT
II: COMMERCIAL & OTHERS -HT
II (A): Commercial (ii) Major -HT
Time of Day tariff (TOD)- Peak
(iv): Function halls / Auditoria --HT
II (B) : Startup power -HT
II (C) : Electric Vehicles / Charging Stations -HT
II (D) : Green Power -HT
III INDUSTRY -HT
III (A) : Industry (General) -HT
Time of Day tariff (TOD)- Peak
Time of Day tariff (TOD) - Off Peak
Industrial Colonies
III (B) : Seasonal Industries (off- season) -HT
III (C) : Energy Intensive Industries -HT
IV INSTITUTIONAL -HT
IV (A) : Utilites (Street Lighting, NTR Sujala Pathakam, CPWS and
PWS) -HT
IV (B) : General Purpose -HT
IV (C) : Religious Places -HT
IV (D) : Railway Traction -HT
V AGRICULTURE AND RELATED -HT
V (B) : Aquaculture and Animal Husbandry -HT
V (C) : Poultry & Aquaculture -HT
(i) Poultry Hactcheries & Poultry Feed mixing plants
(ii) Aqua Hatcheries & Aqua Feed mixing plants
V (E) : Government / Private Lift Irrigation Schemes -HT
Total HT
Total (LT + HT)
222
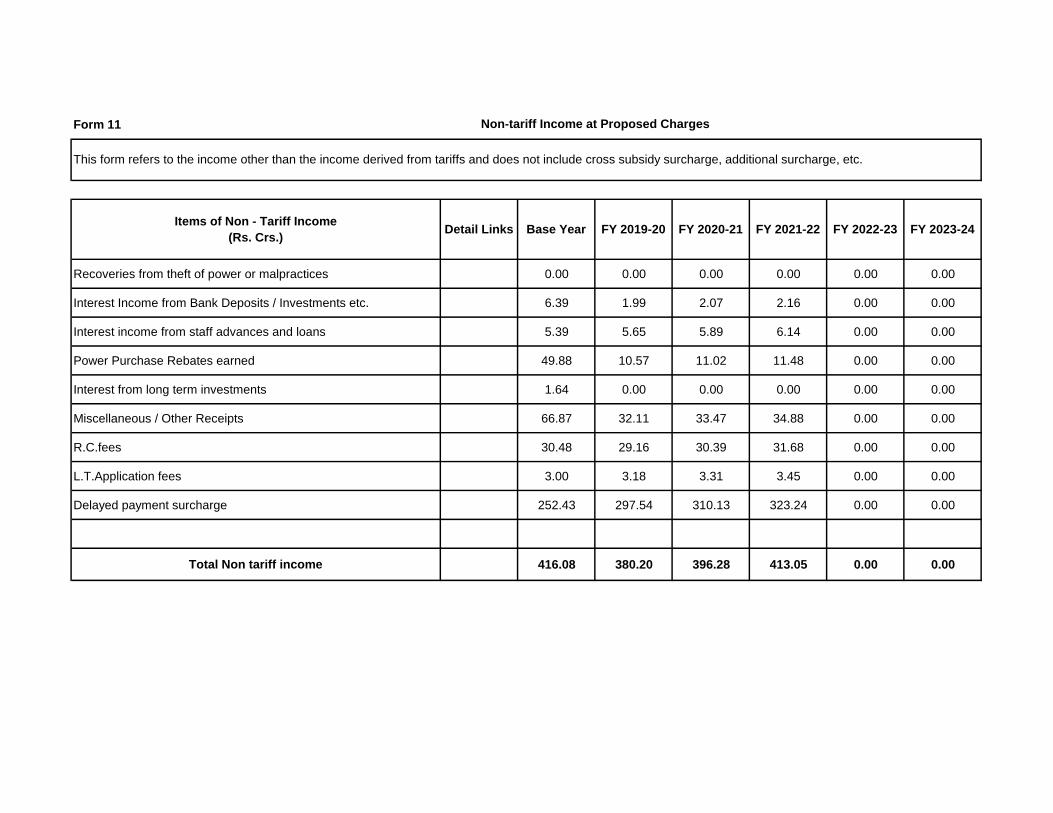
Form 11
Items of Non - Tariff Income
(Rs. Crs.)Detail Links Base Year FY 2019-20 FY 2020-21 FY 2021-22 FY 2022-23 FY 2023-24
Recoveries from theft of power or malpractices 0.00 0.00 0.00 0.00 0.00 0.00
Interest Income from Bank Deposits / Investments etc. 6.39 1.99 2.07 2.16 0.00 0.00
Interest income from staff advances and loans 5.39 5.65 5.89 6.14 0.00 0.00
Power Purchase Rebates earned 49.88 10.57 11.02 11.48 0.00 0.00
Interest from long term investments 1.64 0.00 0.00 0.00 0.00 0.00
Miscellaneous / Other Receipts 66.87 32.11 33.47 34.88 0.00 0.00
R.C.fees 30.48 29.16 30.39 31.68 0.00 0.00
L.T.Application fees 3.00 3.18 3.31 3.45 0.00 0.00
Delayed payment surcharge 252.43 297.54 310.13 323.24 0.00 0.00
Total Non tariff income 416.08 380.20 396.28 413.05 0.00 0.00
Non-tariff Income at Proposed Charges
This form refers to the income other than the income derived from tariffs and does not include cross subsidy surcharge, additional surcharge, etc.
223

Form 12 Total Revenue at Proposed Tariff and Charges
FY 2021-22
Consumer Categories No of consumers
Energy
Charges
(Rs/kWh) or
(Rs.kVAh)
Demand
charges
(Rs/kVA/Yr)
Demand
charges
(Rs/HP/Yr)
Customer
charges
Energy Sales
(MU)
Energy sales
(MVAh)
Connected Load/
Contract Demand
(MW)
Connected Load/
Contract
Demand
(HP)
Energy Charges
(Rs Crores)
Demand
/Fixed
charges
(Rs Crores)
Low Tension
I(A): Domestic -LT 5,442,813.00 6,360.04 - 5,474.13 - 2,021.22 65.69
Group A : Consumption ≤ 75 Units during the billing month 3,118,830.00 1,515.31 - 2,183.24 - 238.65 26.20
0-50 2,110,218 1.45 120 - 25 1,351 1,415 - 195.85 16.98
51-75 1,008,612 2.60 120 - 30 165 769 - 42.80 9.22
Group B: Consumption > 75 and ≤ 225 units during the billing
month 2,159,013.00 3,459.46 - 2,765.96 - 981.11 33.19
0-50 - 2.60 120 - 35 1,413 - - 367.45 -
51-100 818,286 2.60 120 - 40 1,284 785 - 333.97 9.41
101-200 1,260,502 3.60 120 - 45 745 1,801 - 268.23 21.61
201-225 80,225 6.90 120 - 50 17 180 - 11.46 2.16
Group C: Consumption > 225 units during the billing month 164,970.00 1,385.27 - 524.93 - 801.46 6.30
0-50 - 2.65 120 - 35 197 - - 52.28 -
51-100 - 3.35 120 - 40 197 - - 66.09 -
101-200 - 5.40 120 - 45 395 - - 213.06 -
201-300 104,089 7.10 120 - 50 308 279 - 218.38 3.34
301-400 37,624 7.95 120 - 55 132 129 - 104.99 1.55
401-500 11,725 8.50 120 - 55 63 50 - 53.20 0.59
Above 500 units 11,532 9.95 120 - 55 94 68 - 93.47 0.81
Smart Meters ( Optional for above 500 units / month - - - - - - - - -
Time of Day tariff ( ToD ) 10 AM to 12 Noon - - - - - - - - -
II(A): Commercial -LT 591,709 1,163 - 1,336 - 1,049 108
II (A) (i): Commercial(Minor) -LT 336,888.00 58.71 - 423.51 - 31.70 27.95
0-50 336,888 5.40 660 - 30 59 424 - 31.70 27.95
II (A) (ii): Commercial(Major) -LT 254,810 1,104 - 913 - 1,017 80
0-50 - 6.90 900 - 30 150 - - 103.35 -
51-100 103,827 7.65 900 - 40 115 142 - 87.99 12.82
101-300 94,510 9.05 900 - 45 211 208 - 191.31 18.75
301-500 20,518 9.60 900 - 45 106 88 - 101.56 7.90
Above 500 33,362 10.15 900 - 45 508 446 - 515.30 40.15
II (A) (iii) Advertising Hoardings -LT 980 12.25 1,200 - 50 1 2 - 1.46 0.25
II (A) (iv) Function halls / Auditoria -LT 1,613 12.25 - 50 13 26 - 16.20 -
II (B) : Startup power -LT 3 12.25 - - 500 0 0 - 0.02 -
II (C) : Electric Vehicles / Charging Stations -LT 8 6.70 - - 250 0 0 - 0.01 -
II (D) : Green Power -LT - 12.25 - - - - - - - -
III: Industry -LT 20,170 419 - 432 - 280 39
III (A):Industries (General) -LT 18,609 6.70 900 - 63 416 429 - 278.46 38.62
III (B): Seasonal Industries (off season) -LT 5 7.45 900 - 63 1 0 - 0.59 0.02
III(D):Cottage Industries upto 10HP -LT 1,556 3.75 240 - 63 3 3 - 1.03 0.07
IV: INSTITUTIONAL -LT 111,827 375 - 119 - 259 10
IV (A) : Utilites (Street Lighting, NTR Sujala Pathakam, CPWS
and PWS) -LT 55,540 7.00 900 - 35 261 103 - 182.80 9.26
IV (B) : General Purpose -LT 38,208 7.00 900 - 45 97 - - 67.90 -
IV (C) : Religious Places -LT 18,079.00 16.90 - 15.95 - 8.20 0.57
(i) Religious Places (CL <= 2kW) 17,575 4.80 360 - 30 13 12 - 6.04 0.44
(ii) Religious Places (CL > 2kW) 504 5.00 360 - 30 4 4 - 2.16 0.13
V: Agriculture & Related -LT 284,880.00 4,416.80 - 1,057.95 2,075,744.61 724.74 41.82
V (A) : Agriculture -LT 254,883 2,534 0 2,075,745 - 4
V (A) (i) Corporate farmers with DSM 1,760 - - 2,400 30 9 - 11,786 - 2.83
Corporate farmers without DSM 638 3.50 - 2,400 30 1 - 3,783 0.28 0.91
V (A) (ii) Non-Corporate farmers with DSM 242,954 - - - 30 2,494 - 2,005,336 - -
Non-Corporate farmers without DSM 7,735 - - - 30 18 - 46,556 - -
V (A) (iii) Salt farming units upto 15 HP* 30 2.50 - - 30 0 - 248 0.04 -
V (A) (iv) Sugarcane crushing 26 - - - 30 0 - 389 - -
V (A) (v) Rural Horticulture Nurseries 1,736 - - - 30 13 - 7,646 - -
Please Note:
A) The user need not enter anything in the yellow spaces in column C for Consumer Categories. For addition of new category, data first needs to be provided in Form A, which will be automatically reflected in these yellow spaces.
For spaces in orange color, it is to furnish data for the following
1) Segregation or Aggregation of existing slabs
2) Addition of new slab
3) Addition of new sub-category
For LT Category, totals should be manually entered for new categories and slabs in the row for 'New L T Categories (Total).'
B) For Non Tariff Income, provide direct and apportioned Non Tariff Income (column V and W) for each consumer category
C) Include Revenue from Power Factor Surcharge in OTHERS (column O)
224

Form 12
FY 2021-22
Consumer Categories
Low Tension
I(A): Domestic -LT
Group A : Consumption ≤ 75 Units during the billing month
0-50
51-75
Group B: Consumption > 75 and ≤ 225 units during the billing
month
0-50
51-100
101-200
201-225
Group C: Consumption > 225 units during the billing month
0-50
51-100
101-200
201-300
301-400
401-500
Above 500 units
Smart Meters ( Optional for above 500 units / month
Time of Day tariff ( ToD ) 10 AM to 12 Noon
II(A): Commercial -LT
II (A) (i): Commercial(Minor) -LT
0-50
II (A) (ii): Commercial(Major) -LT
0-50
51-100
101-300
301-500
Above 500
II (A) (iii) Advertising Hoardings -LT
II (A) (iv) Function halls / Auditoria -LT
II (B) : Startup power -LT
II (C) : Electric Vehicles / Charging Stations -LT
II (D) : Green Power -LT
III: Industry -LT
III (A):Industries (General) -LT
III (B): Seasonal Industries (off season) -LT
III(D):Cottage Industries upto 10HP -LT
IV: INSTITUTIONAL -LT
IV (A) : Utilites (Street Lighting, NTR Sujala Pathakam, CPWS
and PWS) -LT
IV (B) : General Purpose -LT
IV (C) : Religious Places -LT
(i) Religious Places (CL <= 2kW)
(ii) Religious Places (CL > 2kW)
V: Agriculture & Related -LT
V (A) : Agriculture -LT
V (A) (i) Corporate farmers with DSM
Corporate farmers without DSM
V (A) (ii) Non-Corporate farmers with DSM
Non-Corporate farmers without DSM
V (A) (iii) Salt farming units upto 15 HP*
V (A) (iv) Sugarcane crushing
V (A) (v) Rural Horticulture Nurseries
Please Note:
A) The user need not enter anything in the yellow spaces in column C for Consumer Categories. For addition of new category, data first needs to be provided in Form A, which will be automatically reflected in these yellow spaces.
For spaces in orange color, it is to furnish data for the following
1) Segregation or Aggregation of existing slabs
2) Addition of new slab
3) Addition of new sub-category
For LT Category, totals should be manually entered for new categories and slabs in the row for 'New L T Categories (Total).'
B) For Non Tariff Income, provide direct and apportioned Non Tariff Income (column V and W) for each consumer category
C) Include Revenue from Power Factor Surcharge in OTHERS (column O)
1
Minimum
Charges
(Rs Crores)
Customer
Charges
(Rs crores)
Others
(Rs Crores)
Gross Tariff
Revenue
(Rs Crores)
Incentives
(Rs. Crs)
Net Revenue
from Tariff
(Rs. Crores)
Surcharge
(Rs.Crs)
Additional
Surcharge
(Rs.Crs)
Grid Support
Charges
(Rs. Crs)
Direct Apportioned
Total Revenue
(Net of
incentives)
(Rs.Crs)
222.04 - 2,308.95 - 2,308.95 - - - - 116.26 2,425.21
99.62 - 364.47 - 364.47 - - - - 27.70 392.16
63.31 276.13 276.13 24.69 300.82
36.31 88.33 88.33 3.01 91.34
112.16 - 1,126.46 - 1,126.46 - - - - 63.24 1,189.69
- 367.45 367.45 25.83 393.28
39.28 382.66 382.66 23.48 406.14
68.07 357.91 357.91 13.62 371.53
4.81 18.43 18.43 0.30 18.74
10.26 - 818.03 - 818.03 - - - - 25.32 843.35
- 52.28 52.28 3.61 55.88
- 66.09 66.09 3.61 69.69
- 213.06 213.06 7.21 220.27
6.25 227.97 227.97 5.62 233.59
2.48 109.03 109.03 2.41 111.44
0.77 54.56 54.56 1.14 55.71
0.76 95.04 95.04 1.72 96.76
- - - 0.00 -
- - - 0.00 -
25 25 - 1,207 - 1,207 - - - - 21 1,229
- 12.13 - 71.78 - 71.78 - - - - 1.07 72.85
12.13 71.78 71.78 1.07 72.85
25 13 - 1,136 - 1,136 - - - - 20 1,156
25 - 128.54 128.54 2.74 131.28
4.98 105.80 105.80 2.10 107.90
5.10 215.16 215.16 3.86 219.02
1.11 110.57 110.57 1.93 112.50
1.80 557.25 557.25 9.28 566.53
0 0.06 1.87 1.87 0.02 1.89
0 0.10 16.32 16.32 0.24 16.56
0 0.00 0.02 0.02 0.00 0.02
0 0.00 0.01 0.01 0.00 0.01
- - - 0.00 -
- 2 - 320 - 320 - - - - 8 328
1.41 318.49 318.49 7.60 326.08
0.00 0.61 0.61 0.01 0.63
0.12 1.21 1.21 0.05 1.26
0 5 - 274 - 274 - - - - 7 281
2.33 194.39 194.39 4.77 199.17
0 2.06 69.96 69.96 1.77 71.73
- 0.65 - 9.43 - 9.43 - - - - 0.31 9.73
0.63 7.12 7.12 0.23 7.35
0.02 2.31 2.31 0.08 2.39
- 11.44 - 778.34 - 778.34 - - - - 80.74 859.08
- 9 - 13 - 13 - - - - 46 60
0.06 2.89 2.89 0.16 3.05
0.02 1.21 1.21 0.01 1.22
8.75 8.75 8.75 45.58 54.33
0.28 0.28 0.28 0.33 0.61
0.00 0.04 0.04 0.00 0.05
0.00 0.00 0.00 0.00 0.00
0.06 0.06 0.06 0.23 0.29
Please Note:
A) The user need not enter anything in the yellow spaces in column C for Consumer Categories. For addition of new category, data first needs to be provided in Form A, which will be automatically reflected in these yellow spaces.
For spaces in orange color, it is to furnish data for the following
1) Segregation or Aggregation of existing slabs
2) Addition of new slab
3) Addition of new sub-category
For LT Category, totals should be manually entered for new categories and slabs in the row for 'New L T Categories (Total).'
B) For Non Tariff Income, provide direct and apportioned Non Tariff Income (column V and W) for each consumer category
C) Include Revenue from Power Factor Surcharge in OTHERS (column O)
Non - tariff Income (Rs
crores)
225

Consumer Categories No of consumers
Energy
Charges
(Rs/kWh) or
(Rs.kVAh)
Demand
charges
(Rs/kVA/Yr)
Demand
charges
(Rs/HP/Yr)
Customer
charges
Energy Sales
(MU)
Energy sales
(MVAh)
Connected Load/
Contract Demand
(MW)
Connected Load/
Contract
Demand
(HP)
Energy Charges
(Rs Crores)
Demand
/Fixed
charges
(Rs Crores)
V (A) (vi) Floriculture in Green House 4 4.50 900 - 30 0 0 - 0.02 0.00
Agl others 29,997.00 1,882.46 - 1,057.90 - 724.74 38.08
V (B) : Aquaculture and Animal Husbandry -LT 29,808 3.85 360 - 63 1,882 1,057 - 724.61 38.07
V (D) : Agro Based Cottage Industries upto 10 HP -LT 189 3.75 240 - 63 0.350 0 - 0.13 0.01
Total LT 6,451,399.00 - - - - 12,733.86 - 8,419.32 2,075,744.61 4,333.85 263.87
High Tension
Category at 11 kv -HT 3,891.00 2,568.07 - 978.96 - 1,759.14 505.51
I : Domestic -HT 40 5.95 900 1,406 20 11 - 11.66 0.98
II: COMMERCIAL & OTHERS -HT 1,628.00 518.45 - 305.70 - 411.02 158.87
II (A): Commercial (ii) Major -HT 1,488 7.65 5,700 - 1,406 407 279 - 311.26 158.87
Time of Day tariff (TOD)- Peak - 8.65 5,700 - - 103 - - 88.69 -
(iv): Function halls / Auditoria --HT 136 12.25 - - 1,406 9 27 - 11.02 -
II (B) : Startup power -HT 4 12.25 - - 1,406 0 - - 0.05 -
II (C) : Electric Vehicles / Charging Stations -HT - 6.70 - - 1,406 - - - - -
II (D) : Green Power -HT - 12.25 - - 1,406 - - - - -
III INDUSTRY -HT 1,848.00 1,404.04 - 558.17 - 888.54 318.15
III (A) : Industry (General) -HT 1,793 6.30 5,700 - 1,406 534 544 - 336.45 310.24
Time of Day tariff (TOD)- Peak - 7.30 5,700 - - 442 - - 322.95 -
Time of Day tariff (TOD) - Off Peak - 5.30 5,700 - - 416 - - 220.60 -
Industrial Colonies - 7.00 - - - 2 - - 1.67 -
III (B) : Seasonal Industries (off- season) -HT 55 7.65 5,700 - 1,406 9 14 - 6.87 7.91
III (C) : Energy Intensive Industries -HT - 5.80 - - - - - - - -
IV INSTITUTIONAL -HT 216 150 - 50 - 114.28 27.12
IV (A) : Utilites (Street Lighting, NTR Sujala Pathakam, CPWS and
PWS) -HT 138 7.65 5,700 - 1,406 120 34 - 92.03 19.58
IV (B) : General Purpose -HT 66 7.95 5,700 - 1,406 25 13 - 20.18 7.44
IV (C) : Religious Places -HT 12 5.00 360 - 1,406 4 3 - 2.07 0.10
IV (D) : Railway Traction -HT - 5.50 4,200 - 1,406 - - - - -
V AGRICULTURE AND RELATED -HT 157 41 - 49 - 22.54 0.39
V (B) : Aquaculture and Animal Husbandry -HT 40 3.85 360 - 1,406 21 11 - 7.96 0.39
V (E) : Government / Private Lift Irrigation Schemes -HT 117 7.15 - - 1,406 20 38 - 14.58 -
RESCO 2 7.15 - - 1,406 435 5 - 311.10 -
Category at 33 kv 308.00 1,965.73 - 675.84 - 1,177.42 305.18
I : Domestic -HT 3 5.95 900 - 2,813 13 4 - 7.54 0.37
II: COMMERCIAL & OTHERS -HT 93 202 - 96 - 146.31 54.69
II (A): Commercial (ii) Major -HT 74 6.95 5,700 - 2,813 165 96 - 114.95 54.69
Time of Day tariff (TOD)- Peak - 7.95 5,700 - - 31 - - 24.78 -
(iv): Function halls / Auditoria --HT - 12.25 - - 2,813 - - - - -
II (B) : Startup power -HT 19 12.25 - - 2,813 5 - - 6.58 -
II (C) : Electric Vehicles / Charging Stations -HT - 6.70 - - 2,813 - - - - -
II (D) : Green Power -HT - 12.25 - - 2,813 - - - - -
III INDUSTRY -HT 189.00 1,681.61 - 467.44 - 973.86 249.65
III (A) : Industry (General) -HT 182 5.85 5,700 - 2,813 377 433 - 220.34 247.06
Time of Day tariff (TOD)- Peak - 6.85 5,700 - - 545 - - 373.14 -
Time of Day tariff (TOD) - Off Peak - 4.85 5,700 - - 554 - - 268.72 -
Industrial Colonies - 7.00 - - - 1 - - 1.02 -
III (B) : Seasonal Industries (off- season) -HT 2 6.95 5,700 - 2,813 7 5 - 4.88 2.59
III (C) : Energy Intensive Industries -HT 5 5.35 - - 2,813 198 29 - 105.76 -
IV INSTITUTIONAL -HT 2.00 1.46 0.63 - 1 0
IV (A) : Utilites (Street Lighting, NTR Sujala Pathakam, CPWS
and PWS) -HT 1 6.95 5,700 - 2,813 0 0 - 0.15 0.21
IV (B) : General Purpose -HT 1 7.25 5,700 - 2,813 1 0 - 0.91 0.14
IV (C) : Religious Places -HT - 5.00 360 - 2,813 - - - - -
IV (D) : Railway Traction -HT - 5.50 4,200 - 2,813 - - - - -
V AGRICULTURE AND RELATED -HT 21.00 68.05 107.69 - 49 0
V (B) : Aquaculture and Animal Husbandry -HT 2 3.85 360 - 2,813 - 3 - - 0.11
V (E) : Government / Private Lift Irrigation Schemes -HT 19 7.15 - - 2,813 68 105 - 48.66 -
HT Category at 132 kv 75 5,329 1,438 - 2,840.82 418.26
I : Domestic -HT - 5.95 900 - 2,813 - - - - -
II: COMMERCIAL & OTHERS -HT 14 65 47 - 48 18
II (A): Commercial (ii) Major -HT 8 6.70 5,700 - 2,813 48 32 - 31.86 18.47
Time of Day tariff (TOD)- Peak - 7.70 5,700 - - 12 - - 9.44 -
(iv): Function halls / Auditoria --HT - 12.25 - - 2,813 - - - - -
II (B) : Startup power -HT 6 12.25 - - 2,813 6 15 - 6.88 -
II (C) : Electric Vehicles / Charging Stations -HT - 6.70 - - 2,813 - - - - -
II (D) : Green Power -HT - 12.25 - - 2,813 - - - - -
226
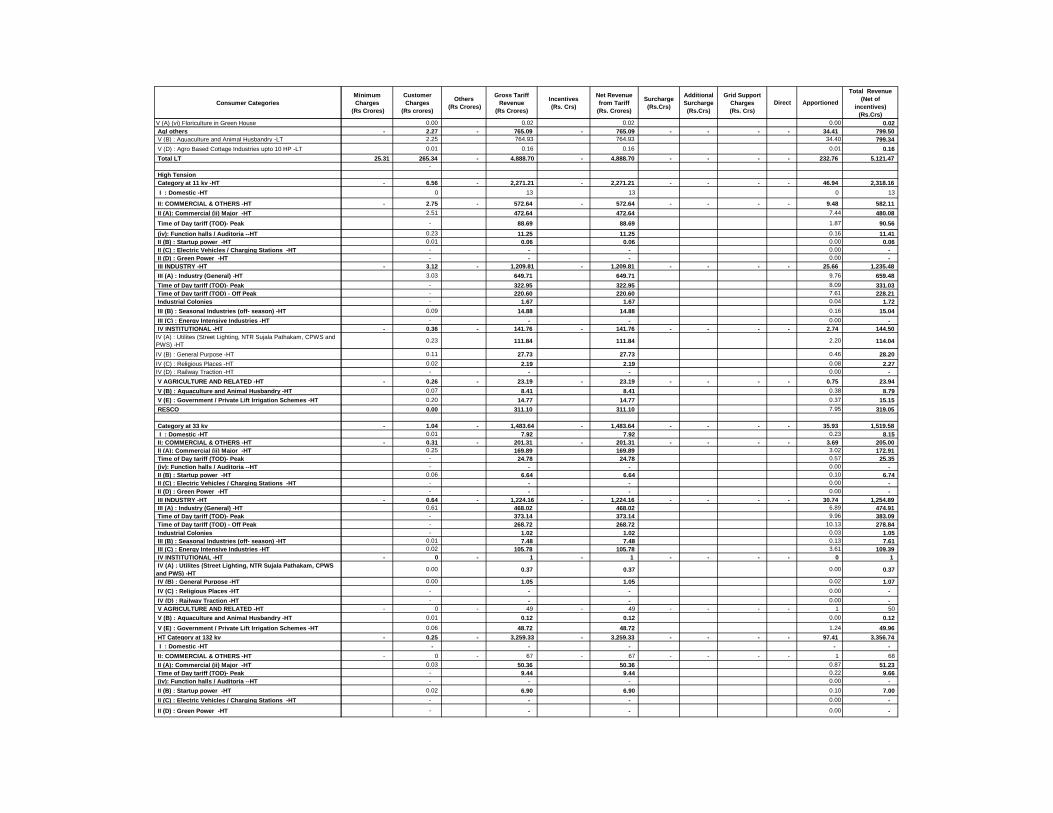
Consumer Categories
V (A) (vi) Floriculture in Green House
Agl others
V (B) : Aquaculture and Animal Husbandry -LT
V (D) : Agro Based Cottage Industries upto 10 HP -LT
Total LT
High Tension
Category at 11 kv -HT
I : Domestic -HT
II: COMMERCIAL & OTHERS -HT
II (A): Commercial (ii) Major -HT
Time of Day tariff (TOD)- Peak
(iv): Function halls / Auditoria --HT
II (B) : Startup power -HT
II (C) : Electric Vehicles / Charging Stations -HT
II (D) : Green Power -HT
III INDUSTRY -HT
III (A) : Industry (General) -HT
Time of Day tariff (TOD)- Peak
Time of Day tariff (TOD) - Off Peak
Industrial Colonies
III (B) : Seasonal Industries (off- season) -HT
III (C) : Energy Intensive Industries -HT
IV INSTITUTIONAL -HT
IV (A) : Utilites (Street Lighting, NTR Sujala Pathakam, CPWS and
PWS) -HT
IV (B) : General Purpose -HT
IV (C) : Religious Places -HT
IV (D) : Railway Traction -HT
V AGRICULTURE AND RELATED -HT
V (B) : Aquaculture and Animal Husbandry -HT
V (E) : Government / Private Lift Irrigation Schemes -HT
RESCO
Category at 33 kv
I : Domestic -HT
II: COMMERCIAL & OTHERS -HT
II (A): Commercial (ii) Major -HT
Time of Day tariff (TOD)- Peak
(iv): Function halls / Auditoria --HT
II (B) : Startup power -HT
II (C) : Electric Vehicles / Charging Stations -HT
II (D) : Green Power -HT
III INDUSTRY -HT
III (A) : Industry (General) -HT
Time of Day tariff (TOD)- Peak
Time of Day tariff (TOD) - Off Peak
Industrial Colonies
III (B) : Seasonal Industries (off- season) -HT
III (C) : Energy Intensive Industries -HT
IV INSTITUTIONAL -HT
IV (A) : Utilites (Street Lighting, NTR Sujala Pathakam, CPWS
and PWS) -HT
IV (B) : General Purpose -HT
IV (C) : Religious Places -HT
IV (D) : Railway Traction -HT
V AGRICULTURE AND RELATED -HT
V (B) : Aquaculture and Animal Husbandry -HT
V (E) : Government / Private Lift Irrigation Schemes -HT
HT Category at 132 kv
I : Domestic -HT
II: COMMERCIAL & OTHERS -HT
II (A): Commercial (ii) Major -HT
Time of Day tariff (TOD)- Peak
(iv): Function halls / Auditoria --HT
II (B) : Startup power -HT
II (C) : Electric Vehicles / Charging Stations -HT
II (D) : Green Power -HT
Minimum
Charges
(Rs Crores)
Customer
Charges
(Rs crores)
Others
(Rs Crores)
Gross Tariff
Revenue
(Rs Crores)
Incentives
(Rs. Crs)
Net Revenue
from Tariff
(Rs. Crores)
Surcharge
(Rs.Crs)
Additional
Surcharge
(Rs.Crs)
Grid Support
Charges
(Rs. Crs)
Direct Apportioned
Total Revenue
(Net of
incentives)
(Rs.Crs)
0.00 0.02 0.02 0.00 0.02
- 2.27 - 765.09 - 765.09 - - - - 34.41 799.50
2.25 764.93 764.93 34.40 799.34
0.01 0.16 0.16 0.01 0.16
25.31 265.34 - 4,888.70 - 4,888.70 - - - - 232.76 5,121.47
-
- 6.56 - 2,271.21 - 2,271.21 - - - - 46.94 2,318.16
0 13 13 0 13
- 2.75 - 572.64 - 572.64 - - - - 9.48 582.11
2.51 472.64 472.64 7.44 480.08
- 88.69 88.69 1.87 90.56
0.23 11.25 11.25 0.16 11.41
0.01 0.06 0.06 0.00 0.06
- - - 0.00 -
- - - 0.00 -
- 3.12 - 1,209.81 - 1,209.81 - - - - 25.66 1,235.48
3.03 649.71 649.71 9.76 659.48
- 322.95 322.95 8.09 331.03
- 220.60 220.60 7.61 228.21
- 1.67 1.67 0.04 1.72
0.09 14.88 14.88 0.16 15.04
- - - 0.00 -
- 0.36 - 141.76 - 141.76 - - - - 2.74 144.50
0.23 111.84 111.84 2.20 114.04
0.11 27.73 27.73 0.46 28.20
0.02 2.19 2.19 0.08 2.27
- - - 0.00 -
- 0.26 - 23.19 - 23.19 - - - - 0.75 23.94
0.07 8.41 8.41 0.38 8.79
0.20 14.77 14.77 0.37 15.15
0.00 311.10 311.10 7.95 319.05
- 1.04 - 1,483.64 - 1,483.64 - - - - 35.93 1,519.58
0.01 7.92 7.92 0.23 8.15
- 0.31 - 201.31 - 201.31 - - - - 3.69 205.00
0.25 169.89 169.89 3.02 172.91
- 24.78 24.78 0.57 25.35
- - - 0.00 -
0.06 6.64 6.64 0.10 6.74
- - - 0.00 -
- - - 0.00 -
- 0.64 - 1,224.16 - 1,224.16 - - - - 30.74 1,254.89
0.61 468.02 468.02 6.89 474.91
- 373.14 373.14 9.96 383.09
- 268.72 268.72 10.13 278.84
- 1.02 1.02 0.03 1.05
0.01 7.48 7.48 0.13 7.61
0.02 105.78 105.78 3.61 109.39
- 0 - 1 - 1 - - - - 0 1
0.00 0.37 0.37 0.00 0.37
0.00 1.05 1.05 0.02 1.07
- - - 0.00 -
- - - 0.00 -
- 0 - 49 - 49 - - - - 1 50
0.01 0.12 0.12 0.00 0.12
0.06 48.72 48.72 1.24 49.96
- 0.25 - 3,259.33 - 3,259.33 - - - - 97.41 3,356.74
- - - - -
- 0 - 67 - 67 - - - - 1 68
0.03 50.36 50.36 0.87 51.23
- 9.44 9.44 0.22 9.66
- - - 0.00 -
0.02 6.90 6.90 0.10 7.00
- - - 0.00 -
- - - 0.00 -
227

Consumer Categories No of consumers
Energy
Charges
(Rs/kWh) or
(Rs.kVAh)
Demand
charges
(Rs/kVA/Yr)
Demand
charges
(Rs/HP/Yr)
Customer
charges
Energy Sales
(MU)
Energy sales
(MVAh)
Connected Load/
Contract Demand
(MW)
Connected Load/
Contract
Demand
(HP)
Energy Charges
(Rs Crores)
Demand
/Fixed
charges
(Rs Crores)
III INDUSTRY -HT 40 4,119 905 - 2,106 298
III (A) : Industry (General) -HT 28 5.40 5,700 - 2,813 303 523 - 163.75 298.37
Time of Day tariff (TOD)- Peak - 6.40 5,700 - - 450 - - 288.26 -
Time of Day tariff (TOD) - Off Peak - 4.40 5,700 - - 465 - - 204.70 -
Industrial Colonies - 7.00 - - - 65 - - 45.80 -
III (B) : Seasonal Industries (off- season) -HT - 6.70 5,700 - 2,813 - - - - -
III (C) : Energy Intensive Industries -HT 12 4.95 - - 2,813 2,835 381 - 1,403.15 -
IV INSTITUTIONAL -HT 18 796 242 - 438 101
IV (A) : Utilites (Street Lighting, NTR Sujala Pathakam, CPWS - 6.70 5,700 - 2,813 - - - - -
IV (B) : General Purpose -HT - 7.00 5,700 - 2,813 - - - - -
IV (C) : Religious Places -HT - 5.00 360 - 2,813 - - - - -
IV (D) : Railway Traction -HT 18 5.50 4,200 - 2,813 796 242 - 437.61 101.43
V AGRICULTURE AND RELATED -HT 3.00 348.76 244.91 - 249 -
V (B) : Aquaculture and Animal Husbandry -HT - 3.85 360 - 2,813 - - - - -
V (E) : Government / Private Lift Irrigation Schemes -HT 3 7.15 - - 2,813 349 245 - 249.36 -
Total HT 4,274.00 - - - - 9,862.60 3,092.92 - 5,777.37 1,229
Total (LT + HT) 6,455,673.00 - - - - 22,596.46 11,512.23 2,075,744.61 10,111.22 1,492.83
228

Consumer Categories
III INDUSTRY -HT
III (A) : Industry (General) -HT
Time of Day tariff (TOD)- Peak
Time of Day tariff (TOD) - Off Peak
Industrial Colonies
III (B) : Seasonal Industries (off- season) -HT
III (C) : Energy Intensive Industries -HT
IV INSTITUTIONAL -HT
IV (A) : Utilites (Street Lighting, NTR Sujala Pathakam, CPWS
IV (B) : General Purpose -HT
IV (C) : Religious Places -HT
IV (D) : Railway Traction -HT
V AGRICULTURE AND RELATED -HT
V (B) : Aquaculture and Animal Husbandry -HT
V (E) : Government / Private Lift Irrigation Schemes -HT
Total HT
Total (LT + HT)
Minimum
Charges
(Rs Crores)
Customer
Charges
(Rs crores)
Others
(Rs Crores)
Gross Tariff
Revenue
(Rs Crores)
Incentives
(Rs. Crs)
Net Revenue
from Tariff
(Rs. Crores)
Surcharge
(Rs.Crs)
Additional
Surcharge
(Rs.Crs)
Grid Support
Charges
(Rs. Crs)
Direct Apportioned
Total Revenue
(Net of
incentives)
(Rs.Crs)
- 0 - 2,404 - 2,404 - - - - 75 2,479
0.09 462.21 462.21 5.54 467.75
- 288.26 288.26 8.23 296.50
- 204.70 204.70 8.50 213.21 - 45.80 45.80 1.20 46.99 - - - 0.00 -
0.04 1,403.20 1,403.20 51.82 1,455.01
- 0 - 539 - 539 - - - - 15 554
- - - 0.00 - - - - 0.00 - - - - 0.00 -
0.06 539.10 539.10 14.54 553.65
- 0 - 249 - 249 - - - - 6 256 - - - 0.00 -
0.01 249.37 249.37 6.38 255.75
- 8 - 7,014 - 7,014 - - - - 180 7,194
25.31 273.20 - 11,902.90 - 11,902.90 - - - - 413.05 12,315.94
229

Form 13 Cost and Revenue
FY 2021-22
Consumer CategoryDetail
Links
Cost of
Service
Revenue from
Tariff & Charges
(Class Deficit) /
Class Surplus
(=Revenue from
Tariff & Charges -
CoS)
External
Subsidy
Cross
SubsidyRemarks
Low Tension
FOR LT LEVEL 9114.50 5,093.03 (4,021.47) (4,021.47)
High Tension
FOR 11KV LEVEL 1765.17 2,044.82 279.66 279.66
FOR 33KV LEVEL 1309.26 1,516.76 207.50 207.50
FOR 132KV LEVEL AND ABOVE 3450.91 3,355.15 (95.76) (95.76)
Total (LT + HT) 15639.84 12009.76 (3,630.08) (3,630.08)
230