KELLOGG COMPANY - cloudfront.net
49
Table of Contents UNITED STATES SECURITIES AND EXCHANGE COMMISSION Washington, D.C. 20549 FORM 10-Q QUARTERLY REPORT UNDER SECTION 13 OR 15(d) OF THE SECURITIES EXCHANGE ACT OF 1934 (Mark One) ☒ QUARTERLY REPORT PURSUANT TO SECTION 13 OR 15(d) OF THE SECURITIES EXCHANGE ACT OF 1934 For the quarterly period ended July 03, 2021 OR ☐ TRANSITION REPORT PURSUANT TO SECTION 13 OR 15(d) OF THE SECURITIES EXCHANGE ACT OF 1934 For the transition period from to Commission file number 1-4171 KELLOGG COMPANY State of Incorporation— Delaware IRS Employer Identification No. 38-0710690 One Kellogg Square, P.O. Box 3599, Battle Creek, MI 49016-3599 Registrant’s telephone number: 269-961-2000 Securities registered pursuant to Section 12(b) of the Act: Title of each class Trading symbol(s) Name of each exchange on which registered Common Stock, $.25 par value per share K New York Stock Exchange 0.800% Senior Notes due 2022 K 22A New York Stock Exchange 1.000% Senior Notes due 2024 K 24 New York Stock Exchange 1.250% Senior Notes due 2025 K 25 New York Stock Exchange 0.500% Senior Notes due 2029 K 29 New York Stock Exchange Indicate by check mark whether the registrant: (1) has filed all reports required to be filed by Section 13 or 15(d) of the Securities Exchange Act of 1934 during the preceding 12 months (or for such shorter period that the registrant was required to file such reports), and (2) has been subject to such filing requirements for the past 90 days. Yes ☒ No ☐ Indicate by check mark whether the registrant has submitted electronically every Interactive Data File required to be submitted pursuant to Rule 405 of Regulation S-T (§ 232.405 of this chapter) during the preceding 12 months (or for such shorter period that the registrant was required to submit such files). Yes ☒ No ☐ Indicate by check mark whether the registrant is a large accelerated filer, an accelerated filer, a non-accelerated filer, smaller reporting company, or an emerging growth company. See the definitions of “large accelerated filer,” “accelerated filer”, “smaller reporting company,” and "emerging growth company" in Rule 12b-2 of the Exchange Act. Large accelerated filer ☒ Accelerated filer ☐ Non-accelerated filer ☐ Smaller reporting company ☐ Emerging growth company ☐ If an emerging growth company, indicate by check mark if the registrant has elected not to use the extended transition period for complying with any new or revised financial accounting standards provided pursuant to Section 13(a) of the Exchange Act. ☐ Indicate by check mark whether the registrant is a shell company (as defined in Rule 12b-2 of the Exchange Act). Yes ☐ No ☒ Common Stock outstanding as of July 3, 2021 — 340,878,954 shares
-
Upload
khangminh22 -
Category
Documents
-
view
5 -
download
0
Transcript of KELLOGG COMPANY - cloudfront.net

Table of Contents
UNITED STATESSECURITIES AND EXCHANGE COMMISSION
Washington, D.C. 20549
FORM 10-QQUARTERLY REPORT UNDER SECTION 13 OR 15(d)
OF THE SECURITIES EXCHANGE ACT OF 1934
(Mark One)☒ QUARTERLY REPORT PURSUANT TO SECTION 13 OR 15(d) OF THE SECURITIES EXCHANGE ACT OF 1934
For the quarterly period ended July 03, 2021
OR ☐ TRANSITION REPORT PURSUANT TO SECTION 13 OR 15(d) OF THE SECURITIES EXCHANGE ACT OF 1934
For the transition period from to Commission file number 1-4171
KELLOGG COMPANYState of Incorporation— Delaware IRS Employer Identification No. 38-0710690
One Kellogg Square, P.O. Box 3599, Battle Creek, MI 49016-3599
Registrant’s telephone number: 269-961-2000
Securities registered pursuant to Section 12(b) of the Act:
Title of each class Trading symbol(s) Name of each exchange on which registeredCommon Stock, $.25 par value per share K New York Stock Exchange
0.800% Senior Notes due 2022 K 22A New York Stock Exchange1.000% Senior Notes due 2024 K 24 New York Stock Exchange1.250% Senior Notes due 2025 K 25 New York Stock Exchange0.500% Senior Notes due 2029 K 29 New York Stock Exchange
Indicate by check mark whether the registrant: (1) has filed all reports required to be filed by Section 13 or 15(d) of the Securities Exchange Act of 1934 during the preceding12 months (or for such shorter period that the registrant was required to file such reports), and (2) has been subject to such filing requirements for the past 90 days.
Yes ☒ No ☐
Indicate by check mark whether the registrant has submitted electronically every Interactive Data File required to be submitted pursuant to Rule 405 of Regulation S-T (§232.405 of this chapter) during the preceding 12 months (or for such shorter period that the registrant was required to submit such files).
Yes ☒ No ☐
Indicate by check mark whether the registrant is a large accelerated filer, an accelerated filer, a non-accelerated filer, smaller reporting company, or an emerging growthcompany. See the definitions of “large accelerated filer,” “accelerated filer”, “smaller reporting company,” and "emerging growth company" in Rule 12b-2 of the Exchange Act.
Large accelerated filer ☒ Accelerated filer ☐ Non-accelerated filer ☐ Smaller reporting company ☐ Emerging growth company ☐
If an emerging growth company, indicate by check mark if the registrant has elected not to use the extended transition period for complying with any new or revised financialaccounting standards provided pursuant to Section 13(a) of the Exchange Act. ☐
Indicate by check mark whether the registrant is a shell company (as defined in Rule 12b-2 of the Exchange Act).
Yes ☐ No ☒
Common Stock outstanding as of July 3, 2021 — 340,878,954 shares

Table of Contents
KELLOGG COMPANY
INDEX
PagePART I — Financial InformationItem 1:
Financial StatementsConsolidated Balance Sheet — July 3, 2021 and January 2, 2021 3Consolidated Statement of Income — quarter and year-to-date periods ended July 3, 2021 and June 27,2020 4Consolidated Statement of Comprehensive Income – quarter and year-to-date periods ended July 3, 2021and June 27, 2020 5Consolidated Statement of Equity — quarter and year-to-date periods ended July 3, 2021 6Consolidated Statement of Equity — quarter and year-to-date periods ended June 27, 2020 7Consolidated Statement of Cash Flows — year-to-date periods ended July 3, 2021 and June 27, 2020 8Notes to Consolidated Financial Statements 9
Item 2:Management’s Discussion and Analysis of Financial Condition and Results of Operations 24
Item 3:Quantitative and Qualitative Disclosures about Market Risk 41
Item 4:Controls and Procedures 42
PART II — Other InformationItem 1A:
Risk Factors 43Item 2:
Unregistered Sales of Equity Securities and Use of Proceeds 43Item 6:
Exhibits 43Signatures 44Exhibit Index 45

Table of Contents
Part I – FINANCIAL INFORMATIONItem 1. Financial Statements.Kellogg Company and SubsidiariesCONSOLIDATED BALANCE SHEET(millions, except per share data)
July 3, 2021 (unaudited)
January 2, 2021
Current assetsCash and cash equivalents $ 395 $ 435 Accounts receivable, net 1,659 1,537 Inventories 1,365 1,284 Other current assets 328 226 Total current assets 3,747 3,482 Property, net 3,666 3,713 Operating lease right-of-use assets 661 658 Goodwill 5,783 5,799 Other intangibles, net 2,454 2,491 Investments in unconsolidated entities 394 391 Other assets 1,508 1,462 Total assets $ 18,213 $ 17,996 Current liabilitiesCurrent maturities of long-term debt $ 17 $ 627 Notes payable 551 102 Accounts payable 2,491 2,471 Current operating lease liabilities 127 117 Accrued advertising and promotion 802 776 Other current liabilities 958 1,145 Total current liabilities 4,946 5,238 Long-term debt 7,029 6,746 Operating lease liabilities 517 520 Deferred income taxes 647 562 Pension liability 688 769 Other liabilities 506 525 Commitments and contingenciesEquityCommon stock, $.25 par value 105 105 Capital in excess of par value 973 972 Retained earnings 8,688 8,326 Treasury stock, at cost (4,741) (4,559)Accumulated other comprehensive income (loss) (1,663) (1,732)Total Kellogg Company equity 3,362 3,112 Noncontrolling interests 518 524 Total equity 3,880 3,636 Total liabilities and equity $ 18,213 $ 17,996
See accompanying Notes to Consolidated Financial Statements.
3

Table of Contents
Kellogg Company and SubsidiariesCONSOLIDATED STATEMENT OF INCOME(millions, except per share data) Quarter ended Year-to-date period ended
(unaudited)July 3,
2021June 27,
2020July 3,
2021June 27,
2020Net sales $ 3,555 $ 3,465 $ 7,139 $ 6,877 Cost of goods sold 2,331 2,268 4,749 4,536 Selling, general and administrative expense 720 691 1,414 1,375 Operating profit 504 506 976 966 Interest expense 58 69 117 133 Other income (expense), net 86 30 155 79 Income before income taxes 532 467 1,014 912 Income taxes 144 109 253 203 Earnings (loss) from unconsolidated entities (3) (4) (5) (5)Net income 385 354 756 704 Net income attributable to noncontrolling interests 5 3 8 6 Net income attributable to Kellogg Company $ 380 $ 351 $ 748 $ 698 Per share amounts:
Basic earnings $ 1.12 $ 1.02 $ 2.19 $ 2.04 Diluted earnings $ 1.11 $ 1.02 $ 2.18 $ 2.02
Average shares outstanding:Basic 341 343 341 342 Diluted 343 345 343 345
Actual shares outstanding at period end 341 343
See accompanying Notes to Consolidated Financial Statements.
4

Table of Contents
Kellogg Company and SubsidiariesCONSOLIDATED STATEMENT OF COMPREHENSIVE INCOME(millions)
Quarter ended Year-to-date period endedJuly 3, 2021 July 3, 2021
(unaudited)Pre-tax amount
Tax (expense) benefit
After-tax amount
Pre-tax amount
Tax (expense) benefit
After-tax amount
Net income $ 385 $ 756 Other comprehensive income (loss):
Foreign currency translation adjustments:Foreign currency translation adjustments during period $ 8 $ 11 19 $ 41 $ (23) 18
Cash flow hedges:Unrealized gain (loss) (39) 11 (28) 39 (10) 29 Reclassification to net income 10 (3) 7 15 (4) 11
Postretirement and postemployment benefits:Reclassification to net income: Net experience (gain) loss (1) 1 — (2) 1 (1)
Available-for-sale securities:Unrealized gain (loss) 1 — 1 (1) — (1)
Other comprehensive income (loss) $ (21) $ 20 $ (1) $ 92 $ (36) $ 56 Comprehensive income $ 384 $ 812
Net Income attributable to noncontrolling interests 5 8 Other comprehensive income (loss) attributable to noncontrollinginterests (3) (13)
Comprehensive income attributable to Kellogg Company $ 382 $ 817
Quarter ended Year-to-date period ended June 27, 2020 June 27, 2020
(unaudited)Pre-tax amount
Tax (expense) benefit
After-tax amount
Pre-tax amount
Tax (expense) benefit
After-tax amount
Net income $ 354 $ 704 Other comprehensive income (loss):
Foreign currency translation adjustments:Foreign currency translation adjustments during period $ (20) $ 10 (10) $ (261) $ (10) (271)
Cash flow hedges:Unrealized gain (loss) on cash flow hedges 12 (3) 9 (53) 14 (39)Reclassification to net income 5 (2) 3 7 (2) 5
Postretirement and postemployment benefits:Reclassification to net income:
Net experience (gain) loss (1) 1 — (2) 1 (1)Prior service cost (1) — (1) (1) — (1)
Available-for-sale securities:Unrealized gain (loss) 5 — 5 2 — 2
Other comprehensive income (loss) $ — $ 6 $ 6 $ (308) $ 3 $ (305)Comprehensive income $ 360 $ 399
Net Income attributable to noncontrolling interests 3 6 Other comprehensive income (loss) attributable to noncontrollinginterests (4) (36)
Comprehensive income attributable to Kellogg Company $ 361 $ 429
See accompanying Notes to Consolidated Financial Statements.
5

Table of Contents
Kellogg Company and SubsidiariesCONSOLIDATED STATEMENT OF EQUITY(millions)
Quarter ended July 3, 2021
Common
stock Capital in excess of par value
Retained earnings
Treasury
stockAccumulated
other comprehensive
income (loss)
Total Kellogg Company
equity
Non-controlling interests
Total equity(unaudited) shares amount shares amount
Balance, April 3, 2021 421 $ 105 $ 954 $ 8,506 81 $ (4,762) $ (1,665) $ 3,138 $ 517 $ 3,655 Net income 380 380 5 385 Dividends declared ($0.58 per share) (197) (197) (197)Distributions to noncontrolling interest — (1) (1)Other comprehensive income 2 2 (3) (1)Stock compensation 19 19 19 Stock options exercised and other — (1) (1) 21 20 20 Balance, July 3, 2021 421 $ 105 $ 973 $ 8,688 80 $ (4,741) $ (1,663) $ 3,362 $ 518 $ 3,880
Year-to-date period ended July 3, 2021
Common
stock Capital in excess of par value
Retained earnings
Treasury
stockAccumulated
other comprehensive
income (loss)
Total Kellogg Company
equity
Non-controlling interests
Total equity(unaudited) shares amount shares amount
Balance, January 2, 2021 421 $ 105 $ 972 $ 8,326 77 $ (4,559) $ (1,732) $ 3,112 $ 524 $ 3,636 Common stock repurchases 4 (240) (240) (240)Net income 748 748 8 756 Dividends declared ($1.15 per share) (392) (392) (392)Distributions to noncontrolling interest — (1) (1)Other comprehensive income 69 69 (13) 56 Stock compensation 39 39 39 Stock options exercised and other (38) 6 (1) 58 26 26 Balance, July 3, 2021 421 $ 105 $ 973 $ 8,688 80 $ (4,741) $ (1,663) $ 3,362 $ 518 $ 3,880
See accompanying Notes to Consolidated Financial Statements.
6

Table of Contents
Kellogg Company and SubsidiariesCONSOLIDATED STATEMENT OF EQUITY (cont.)(millions)
Quarter ended June 27, 2020
Common
stock Capital in excess of par value
Retained earnings
Treasury
stockAccumulated
other comprehensive
income (loss)
Total Kellogg Company
equity
Non-controlling interests
Total equity(unaudited) shares amount shares amount
Balance, March 28, 2020 421 $ 105 $ 911 $ 8,010 78 $ (4,625) $ (1,727) $ 2,674 $ 538 $ 3,212 Net income 351 351 3 354 Dividends declared ($0.57 per share) (195) (195) (195)Distributions to noncontrolling interest — (1) (1)Other comprehensive income 10 10 (4) 6 Stock compensation 18 18 18 Stock options exercised and other — — — 12 12 12 Balance, June 27, 2020 421 $ 105 $ 929 $ 8,166 78 $ (4,613) $ (1,717) $ 2,870 $ 536 $ 3,406
Year-to-date period ended June 27, 2020
Common
stock Capital in excess of par value
Retained earnings
Treasury
stockAccumulated
other comprehensive
income (loss)
Total Kellogg Company
equity
Non-controlling interests
Total equity(unaudited) shares amount shares amount
Balance, December 28, 2019 421 $ 105 $ 921 $ 7,859 79 $ (4,690) $ (1,448) $ 2,747 $ 567 $ 3,314 Net income 698 698 6 704 Dividends declared ($1.14 per share) (390) (390) (390)Distributions to noncontrolling interest — (1) (1)Other comprehensive income (269) (269) (36) (305)Stock compensation 37 37 37 Stock options exercised and other (29) (1) (1) 77 47 47 Balance, June 27, 2020 421 $ 105 $ 929 $ 8,166 78 $ (4,613) $ (1,717) $ 2,870 $ 536 $ 3,406
See accompanying Notes to Consolidated Financial Statements.
7

Table of Contents
Kellogg Company and SubsidiariesCONSOLIDATED STATEMENT OF CASH FLOWS(millions) Year-to-date period ended
(unaudited)July 3,
2021June 27,
2020Operating activitiesNet income $ 756 $ 704 Adjustments to reconcile net income to operating cash flows:
Depreciation and amortization 232 234 Postretirement benefit plan expense (benefit) (137) (58)Deferred income taxes 50 23 Stock compensation 39 37 Other 3 (17)
Postretirement benefit plan contributions (10) (12)Changes in operating assets and liabilities, net of acquisitions:
Trade receivables (138) (165)Inventories (89) (33)Accounts payable 139 105 All other current assets and liabilities (158) 153
Net cash provided by (used in) operating activities 687 971 Investing activitiesAdditions to properties (301) (218)Issuance of notes receivable (29) (19)Repayments from notes receivable 28 — Purchase of marketable securities — (200)Investments in unconsolidated entities (10) — Acquisition of cost method investments (1) (4)Purchases of available for sale securities (5) (70)Sales of available for sale securities 6 7 Other (18) (11)Net cash provided by (used in) investing activities (330) (515)Financing activitiesNet issuances (reductions) of notes payable 450 13 Issuances of long-term debt 361 554 Reductions of long-term debt (616) (40)Net issuances of common stock 38 60 Common stock repurchases (240) — Cash dividends (392) (390)Collateral received on derivative instruments — 38 Other (2) (1)Net cash provided by (used in) financing activities (401) 234 Effect of exchange rate changes on cash and cash equivalents 4 (40)Increase (decrease) in cash and cash equivalents (40) 650 Cash and cash equivalents at beginning of period 435 397 Cash and cash equivalents at end of period $ 395 $ 1,047
Supplemental cash flow disclosures of non-cash investing activities: Additions to properties included in accounts payable $ 79 $ 78
See accompanying Notes to Consolidated Financial Statements.
8

Table of Contents
Notes to Consolidated Financial Statementsfor the quarter ended July 3, 2021 (unaudited)
Note 1 Accounting policies
Basis of presentationThe unaudited interim financial information of Kellogg Company (the Company) included in this report reflects all adjustments, all of which are of anormal and recurring nature, that management believes are necessary for a fair statement of the results of operations, comprehensive income,financial position, equity and cash flows for the periods presented. This interim information should be read in conjunction with the financialstatements and accompanying footnotes within the Company’s 2020 Annual Report on Form 10-K.
The condensed balance sheet information at January 2, 2021 was derived from audited financial statements, but does not include all disclosuresrequired by accounting principles generally accepted in the United States. The results of operations for the quarter ended July 3, 2021 are notnecessarily indicative of the results to be expected for other interim periods or the full year.
Accounts payableThe Company has agreements with third parties to provide accounts payable tracking systems which facilitate participating suppliers’ ability tomonitor and, if elected, sell payment obligations from the Company to designated third-party financial institutions. Participating suppliers may, at theirsole discretion, make offers to sell one or more payment obligations of the Company prior to their scheduled due dates at a discounted price toparticipating financial institutions. The Company’s goal is to capture overall supplier savings, in the form of payment terms or vendor funding, and theagreements facilitate the suppliers’ ability to sell payment obligations, while providing them with greater working capital flexibility. The Company hasno economic interest in the sale of these suppliers’ receivables and no direct financial relationship with the financial institutions concerning theseservices. The Company’s obligations to its suppliers, including amounts due and scheduled payment dates, are not impacted by suppliers’ decisionsto sell amounts under the arrangements. However, the Company’s right to offset balances due from suppliers against payment obligations isrestricted by the agreements for those payment obligations that have been sold by suppliers. The payment of these obligations by the Company isincluded in cash used in operating activities in the Consolidated Statement of Cash Flows. As of July 3, 2021, $937 million of the Company’soutstanding payment obligations had been placed in the accounts payable tracking system, and participating suppliers had sold $672 million of thosepayment obligations to participating financial institutions. As of January 2, 2021, $909 million of the Company’s outstanding payment obligations hadbeen placed in the accounts payable tracking system, and participating suppliers had sold $670 million of those payment obligations to participatingfinancial institutions.
Note 2 Sale of accounts receivableThe Company has a program in which a discrete group of customers are allowed to extend their payment terms in exchange for the elimination ofearly payment discounts (Extended Terms Program).
The Company has two Receivable Sales Agreements (Monetization Programs) described below, which are intended to directly offset the impact theExtended Terms Program would have on the days-sales-outstanding (DSO) metric that is critical to the effective management of the Company'saccounts receivable balance and overall working capital. The Monetization Programs sell, on a revolving basis, certain trade accounts receivableinvoices to third party financial institutions. Transfers under these agreements are accounted for as sales of receivables resulting in the receivablesbeing de-recognized from the Consolidated Balance Sheet. The Monetization Programs provide for the continuing sale of certain receivables on arevolving basis until terminated by either party; however the maximum receivables that may be sold at any time is $1,033 million.
The Company has no retained interest in the receivables sold, however the Company does have collection and administrative responsibilities for thesold receivables. The Company has not recorded any servicing assets or liabilities as of July 3, 2021 and January 2, 2021 for these agreements asthe fair value of these servicing arrangements as well as the fees earned were not material to the financial statements.
9

Table of Contents
Accounts receivable sold of $793 million and $783 million remained outstanding under these arrangements as of July 3, 2021 and January 2, 2021,respectively. The proceeds from these sales of receivables are included in cash from operating activities in the Consolidated Statement of CashFlows in the period of sale. The recorded net loss on sale of receivables was $2 million and $4 million for the quarter and year-to-date periods endedJuly 3, 2021, respectively and was $3 million and $8 million for the quarter and year-to-date periods ended June 27, 2020, respectively. Therecorded loss is included in Other income and expense, net (OIE).
Other programsAdditionally, from time to time certain of the Company's foreign subsidiaries will transfer, without recourse, accounts receivable invoices of certaincustomers to financial institutions. These transactions are accounted for as sales of the receivables resulting in the receivables being de-recognizedfrom the Consolidated Balance Sheet. Accounts receivable sold of $33 million and $55 million remained outstanding under these programs as ofJuly 3, 2021 and January 2, 2021, respectively. The proceeds from these sales of receivables are included in cash from operating activities in theConsolidated Statement of Cash Flows in the period of sale. The recorded net loss on the sale of these receivables is included in OIE and is notmaterial.
Note 3 Equity
Earnings per shareBasic earnings per share is determined by dividing net income by the weighted average number of common shares outstanding during the period.Diluted earnings per share is similarly determined, except that the denominator is increased to include the number of additional common shares thatwould have been outstanding if all dilutive potential common shares had been issued. Dilutive potential common shares consist principally ofemployee stock options issued by the Company, restricted stock units, and to a lesser extent, certain contingently issuable performance shares.There were 7 million and 11 million anti-dilutive potential common shares excluded from the calculation for the quarter and year-to-date periodsended July 3, 2021. There were 8 million and 7 million anti-dilutive potential common shares excluded from the calculation for the quarter and year-to-date periods ended June 27, 2020. Please refer to the Consolidated Statement of Income for basic and diluted earnings per share for the quarterand year-to-date periods ended July 3, 2021 and June 27, 2020.
Share repurchasesIn February 2020, the board of directors approved a new authorization to repurchase up to $1.5 billion of our common stock through December2022. During the quarter ended July 3, 2021, the Company did not repurchase any shares of common stock. During the year-to-date period endedJuly 3, 2021, the Company repurchased approximately 4 million shares of common stock for a total of $240 million. During the quarter and year-to-date periods ended June 27, 2020, the Company did not repurchase any shares of common stock.
Comprehensive incomeComprehensive income includes net income and all other changes in equity during a period except those resulting from investments by ordistributions to shareholders. Other comprehensive income consists of foreign currency translation adjustments, fair value adjustments associatedwith cash flow hedges, adjustments for net experience losses and prior service cost related to employee benefit plans, and adjustments forunrealized gains and losses on available-for-sale securities, net of related tax effects.
10

Table of Contents
Reclassifications out of Accumulated other comprehensive income (AOCI) for the quarter and year-to-date periods ended July 3, 2021 and June 27,2020, consisted of the following:
(millions) Details about AOCI components
Amount reclassified from AOCI
Line item impacted within Income Statement
Quarter ended
July 3, 2021
Year-to-date periodended
July 3, 2021 (Gains) losses on cash flow hedges:
Interest rate contracts (a) $ 10 $ 15 Interest expense$ 10 $ 15 Total before tax
(3) (4) Tax expense (benefit)$ 7 $ 11 Net of tax
Amortization of postretirement and postemploymentbenefits:Net experience (gain) loss (b) $ (1) $ (2) OIE
$ (1) $ (2) Total before tax1 1 Tax expense (benefit)
$ — $ (1) Net of taxTotal reclassifications $ 7 $ 10 Net of tax
(millions) Details about AOCI components
Amount reclassified from AOCI
Line item impacted within Income Statement
Quarter ended June 27, 2020
Year-to-dateperiod ended June 27, 2020
(Gains) losses on cash flow hedges:Interest rate contracts (a) $ 5 $ 7 Interest expense
$ 5 $ 7 Total before tax(2) (2) Tax expense (benefit)
$ 3 $ 5 Net of taxAmortization of postretirement and postemployment benefits:Net experience loss (b) $ (1) $ (2) OIEPrior service cost (b) (1) (1) OIE
$ (2) $ (3) Total before tax1 1 Tax expense (benefit)
$ (1) $ (2) Net of taxTotal reclassifications $ 2 $ 3 Net of tax
(a) See Derivative instruments and fair value measurements note(b) See Employee benefits note
11

Table of Contents
Accumulated other comprehensive income (loss), net of tax, as of July 3, 2021 and January 2, 2021 consisted of the following:
(millions)July 3,
2021January 2,
2021Foreign currency translation adjustments $ (1,637) $ (1,668)Cash flow hedges — unrealized net gain (loss) (17) (57)Postretirement and postemployment benefits:
Net experience gain (loss) 1 2 Prior service credit (cost) (12) (12)
Available-for-sale securities unrealized net gain (loss) 2 3 Total accumulated other comprehensive income (loss) $ (1,663) $ (1,732)
Note 4 Notes payable and long-term debt
The following table presents the components of notes payable at July 3, 2021 and January 2, 2021: July 3, 2021 January 2, 2021
(millions)Principal amount
Effective interest rate
Principal amount
Effective interest rate
U.S. commercial paper $ 425 0.15 % $ 25 0.20 %Bank borrowings 126 77 Total $ 551 $ 102
In May of 2021, the Company issued €300 million of eight-year 0.50% Euro Notes due 2029, resulting in net proceeds of €298 million after discountand underwriting commissions. The 2029 Euro Notes were issued as a sustainability bond, and thus an amount equal to the net proceeds will beused to finance or refinance, in whole or in part, one or more eligible environmental or social projects described in the Company's SustainabilityBond Framework. The Notes contain customary covenants that limit the ability of the Company and its restricted subsidiaries (as defined) to incurcertain liens or enter into certain sale and lease-back transactions, as well as a change of control provision.
Additionally, in May of 2021, the Company repaid the €500 million, seven-year 1.75% Euro Notes due 2021, upon maturity.
In May of 2020, the Company issued $500 million of ten-year 2.10% Notes due 2030, resulting in net proceeds after discount and underwritingcommissions of $496 million. The proceeds from these notes were used for general corporate purposes, including the payment of offering relatedfees and expenses, repayment of a portion of the $600 million 4.00% Notes when they matured on December 15, 2020, and repayment of a portionof commercial paper borrowings. The Notes contain customary covenants that limit the ability of the Company and its restricted subsidiaries (asdefined) to incur certain liens or enter into certain sale and lease-back transactions, as well as a change of control provision.
Note 5 Employee benefitsThe Company sponsors a number of U.S. and foreign pension plans as well as other nonpension postretirement and postemployment plans toprovide various benefits for its employees. These plans are described within the footnotes to the Consolidated Financial Statements included in theCompany’s 2020 Annual Report on Form 10-K. Components of Company benefit plan (income) expense for the periods presented are included inthe tables below. Excluding the service cost component, these amounts are included within Other income (expense) in the Consolidated Statementof Income.
12

Table of Contents
Pension
Quarter ended Year-to-date period ended(millions) July 3, 2021 June 27, 2020 July 3, 2021 June 27, 2020Service cost $ 9 $ 9 $ 18 $ 18 Interest cost 25 33 50 68 Expected return on plan assets (77) (85) (155) (170)Amortization of unrecognized prior service cost 2 2 4 4 Recognized net (gain) loss (11) 43 (20) 57 Net periodic benefit cost $ (52) $ 2 $ (103) $ (23)Curtailment (gain) loss — (7) — (7)Total pension (income) expense $ (52) $ (5) $ (103) $ (30)
Other nonpension postretirement
Quarter ended Year-to-date period ended(millions) July 3, 2021 June 27, 2020 July 3, 2021 June 27, 2020Service cost $ 3 $ 4 $ 6 $ 7 Interest cost 5 8 10 16 Expected return on plan assets (23) (23) (46) (46)Amortization of unrecognized prior service cost (2) (3) (4) (5)Total postretirement benefit (income) expense $ (17) $ (14) $ (34) $ (28)
Postemployment
Quarter ended Year-to-date period ended(millions) July 3, 2021 June 27, 2020 July 3, 2021 June 27, 2020Service cost $ 1 $ 1 $ 2 $ 2 Recognized net (gain) loss (1) (1) (2) (2)Total postemployment benefit expense $ — $ — $ — $ —
For the quarter and year-to-date periods ended July 3, 2021, the Company recognized a gain of $11 million and a gain of $20 million, respectively,related to the remeasurement of certain U.S. pension plans. For the quarter and year-to-date periods ended June 27, 2020, the Companyrecognized a gain of $6 million and a loss of $8 million, respectively, related to the remeasurement of a U.S. pension plan. These remeasurementswere each the result of distributions that exceeded or are expected to exceed service and interest costs resulting in settlement accounting for thatparticular plan. The amount of the remeasurements recognized were due primarily to changes in the discount rate relative to the previousmeasurements. For the current quarter remeasurement, the gain was driven by an increase in the discount rate from the prior year-end, partiallyoffset by lower than expected asset returns.
During the second quarter of 2020, the Company recognized a curtailment gain of $7 million, as certain U.S. pension plan benefits were frozen for aportion of the population. The Company remeasured the benefit obligation for the impacted pension plan, resulting in a mark-to-market loss of $49million. The loss was due primarily to a lower discount rate partially offset by plan asset returns in excess of the expected rate of return.
13

Table of Contents
Company contributions to employee benefit plans are summarized as follows:
(millions) PensionNonpension
postretirement TotalQuarter ended:
July 3, 2021 $ 1 $ 7 $ 8 June 27, 2020 $ — $ 6 $ 6
Year-to-date period ended:July 3, 2021 $ 2 $ 8 $ 10 June 27, 2020 $ 3 $ 9 $ 12
Full year:Fiscal year 2021 (projected) $ 6 $ 19 $ 25 Fiscal year 2020 (actual) $ 8 $ 24 $ 32
Plan funding strategies may be modified in response to management's evaluation of tax deductibility, market conditions, and competing investmentalternatives.
Multi-employer pension plan exit liabilityDuring the second quarter of 2020, the Company adjusted the estimated withdrawal liability associated with a plan withdrawn from during the thirdquarter of 2019. The adjustment resulted in a gain of $5 million during the second quarter and resulted from a July 2020 agreement with the planunder which the Company paid $7 million in full settlement of the withdrawal liability.
Note 6 Income taxesThe consolidated effective tax rate for the quarters ended July 3, 2021 and June 27, 2020 was 27% and 23%, respectively. The consolidatedeffective tax rate for the year-do-date periods ended July 3, 2021 and June 27, 2020 was 25% and 22%, respectively. The effective tax rate for thequarter and year-to-date periods ended July 3, 2021, were unfavorably impacted by tax legislation in the United Kingdom (UK). During the secondquarter of 2021, the Company recorded tax expense of $23 million as a result of tax legislation enacted in the UK in June 2021, which increased thestatutory UK tax rate from 19 percent to 25 percent for tax periods after April 1, 2023. The Company revalued its net deferred tax balances related tothe UK business to reflect the increased tax rate.
As of July 3, 2021, the Company classified $15 million of unrecognized tax benefits as a net current tax liability. Management's estimate ofreasonably possible changes in unrecognized tax benefits during the next twelve months consists of the current liability expected to be settled withinone year, offset by approximately $3 million of projected additions related primarily to ongoing intercompany transfer pricing activity. Management iscurrently unaware of any issues under review that could result in significant additional payments, accruals or other material deviation in this estimate.
The Company’s total gross unrecognized tax benefits as of July 3, 2021 was $62 million. Of this balance, $53 million represents the amount that, ifrecognized, would affect the Company’s effective income tax rate in future periods.
The accrual balance for tax-related interest was approximately $14 million at July 3, 2021.
Note 7 Derivative instruments and fair value measurementsThe Company is exposed to certain market risks such as changes in interest rates, foreign currency exchange rates, and commodity prices, whichexist as a part of its ongoing business operations. Management uses derivative and nonderivative financial instruments and commodity instruments,including futures, options, and swaps, where appropriate, to manage these risks. Instruments used as hedges must be effective at reducing the riskassociated with the exposure being hedged.
The Company designates derivatives and nonderivative hedging instruments as cash flow hedges, fair value hedges, net investment hedges, anduses other contracts to reduce volatility in interest rates, foreign currency and commodities. As a matter of policy, the Company does not engage intrading or speculative hedging transactions.
14

Table of Contents
Derivative instruments are classified on the Consolidated Balance Sheet based on the contractual maturity of the instrument or the timing of theunderlying cash flows of the instrument for derivatives with contractual maturities beyond one year. Any collateral associated with derivativeinstruments is classified as other assets or other current liabilities on the Consolidated Balance Sheet depending on whether the counterpartycollateral is in an asset or liability position. Margin deposits related to exchange-traded commodities are recorded in accounts receivable, net on theConsolidated Balance Sheet. On the Consolidated Statement of Cash Flows, cash flows associated with derivative instruments are classifiedaccording to the nature of the underlying hedged item. Cash flows associated with collateral and margin deposits on exchange-traded commoditiesare classified as investing cash flows when the collateral account is in an asset position and as financing cash flows when the collateral account is ina liability position.
Total notional amounts of the Company’s derivative instruments as of July 3, 2021 and January 2, 2021 were as follows:
(millions)July 3,
2021January 2,
2021Foreign currency exchange contracts $ 3,104 $ 2,856 Cross-currency contracts 1,390 1,411 Interest rate contracts 2,799 2,632 Commodity contracts 717 314 Total $ 8,010 $ 7,213
Following is a description of each category in the fair value hierarchy and the financial assets and liabilities of the Company that were included ineach category at July 3, 2021 and January 2, 2021, measured on a recurring basis.
Level 1 – Financial assets and liabilities whose values are based on unadjusted quoted prices for identical assets or liabilities in an active market.For the Company, level 1 financial assets and liabilities consist primarily of commodity derivative contracts.
Level 2 – Financial assets and liabilities whose values are based on quoted prices in markets that are not active or model inputs that are observableeither directly or indirectly for substantially the full term of the asset or liability. For the Company, level 2 financial assets and liabilities consist ofinterest rate swaps, cross-currency swaps and over-the-counter commodity and currency contracts.
The Company’s calculation of the fair value of interest rate swaps is derived from a discounted cash flow analysis based on the terms of the contractand the interest rate curve. Over-the-counter commodity derivatives are valued using an income approach based on the commodity index prices lessthe contract rate multiplied by the notional amount. Foreign currency contracts are valued using an income approach based on forward rates less thecontract rate multiplied by the notional amount. Cross-currency contracts are valued based on changes in the spot rate at the time of valuationcompared to the spot rate at the time of execution, as well as the change in the interest differential between the two currencies. The Company’scalculation of the fair value of level 2 financial assets and liabilities takes into consideration the risk of nonperformance, including counterparty creditrisk.
Level 3 – Financial assets and liabilities whose values are based on prices or valuation techniques that require inputs that are both unobservableand significant to the overall fair value measurement. These inputs reflect management’s own assumptions about the assumptions a marketparticipant would use in pricing the asset or liability. The Company did not have any level 3 financial assets or liabilities as of July 3, 2021 orJanuary 2, 2021.
15

Table of Contents
The following table presents assets and liabilities that were measured at fair value in the Consolidated Balance Sheet on a recurring basis as ofJuly 3, 2021 and January 2, 2021:
Derivatives designated as hedging instruments July 3, 2021 January 2, 2021(millions) Level 1 Level 2 Total Level 1 Level 2 TotalAssets:Cross-currency contracts:
Other current assets $ — $ 30 $ 30 $ — $ 14 $ 14 Other assets — 10 10 — 16 16
Interest rate contracts(a):Other current assets — 47 47 — — — Other assets — 50 50 — 60 60
Total assets $ — $ 137 $ 137 $ — $ 90 $ 90 Liabilities:Cross-currency contracts:
Other current liabilities $ — $ — $ — $ — $ (13) $ (13) Other Liabilities — (18) (18) — (21) (21)Interest rate contracts:
Other current liabilities — — — — (3) (3)Other liabilities — (1) (1) — — —
Total liabilities $ — $ (19) $ (19) $ — $ (37) $ (37)
(a) The fair value of the related hedged portion of the Company's long-term debt, a level 2 liability, was $1.3 billion as of July 3, 2021 and $0.8 billion as of January 2, 2021.
Derivatives not designated as hedging instruments July 3, 2021 January 2, 2021(millions) Level 1 Level 2 Total Level 1 Level 2 TotalAssets:Foreign currency exchange contracts:
Other current assets $ — $ 30 $ 30 $ — $ 48 $ 48 Other assets — 2 2 — — — Interest rate contracts:
Other current assets — 4 4 — 4 4 Other assets — 4 4 — 13 13
Commodity contracts:Other current assets 24 — 24 9 — 9
Total assets $ 24 $ 40 $ 64 $ 9 $ 65 $ 74 Liabilities:Foreign currency exchange contracts:
Other current liabilities $ — $ (70) $ (70) $ — $ (73) $ (73)Other liabilities — (3) (3) — (4) (4)
Interest rate contracts:Other current liabilities — (6) (6) — (6) (6)Other liabilities — (13) (13) — (22) (22)
Commodity contracts:Other current liabilities (11) — (11) (1) — (1)
Total liabilities $ (11) $ (92) $ (103) $ (1) $ (105) $ (106)
The Company has designated its outstanding foreign currency denominated debt as a net investment hedge of a portion of the Company’sinvestment in its subsidiaries’ foreign currency denominated net assets. The carrying
16

Table of Contents
value of this debt, including current and long-term, was approximately $2.5 billion as of July 3, 2021 and $2.8 billion as of January 2, 2021.
The following amounts were recorded on the Consolidated Balance Sheet related to cumulative basis adjustments for existing fair value hedges asof July 3, 2021 and January 2, 2021.
(millions)
Line Item in the ConsolidatedBalance Sheet in which the
hedged item is includedCarrying amount of the hedged
liabilities
Cumulative amount of fair valuehedging adjustment included in
the carrying amount of thehedged liabilities (a)
July 3, 2021
January 2, 2021
July 3, 2021
January 2, 2021
Interest rate contracts Long-term debt $ 2,975 $ 2,568 $ 26 $ 25 (a) The hedged long-term debt includes $15 million and $16 million of hedging adjustment on discontinued hedging relationships as of July 3, 2021 and January 2, 2021,respectively.
The Company has elected to not offset the fair values of derivative assets and liabilities executed with the same counterparty that are generallysubject to enforceable netting agreements. However, if the Company were to offset and record the asset and liability balances of derivatives on a netbasis, the amounts presented in the Consolidated Balance Sheet as of July 3, 2021 and January 2, 2021 would be adjusted as detailed in thefollowing table:
As of July 3, 2021: Gross Amounts Not Offset in the
Consolidated Balance Sheet
Amounts Presented in the
Consolidated Balance Sheet
Financial Instruments
Cash Collateral Received/
PostedNet
AmountTotal asset derivatives $ 201 $ (90) $ 5 $ 116 Total liability derivatives $ (122) $ 90 $ 32 $ —
As of January 2, 2021: Gross Amounts Not Offset in the
Consolidated Balance Sheet
Amounts Presented in the
Consolidated Balance Sheet
Financial Instruments
Cash Collateral Received/
PostedNet
AmountTotal asset derivatives $ 164 $ (116) $ — $ 48 Total liability derivatives $ (143) $ 116 $ 5 $ (22)
17

Table of Contents
The effect of derivative instruments on the Consolidated Statements of Income and Comprehensive Income for the quarters ended July 3, 2021 andJune 27, 2020 was as follows:
Derivatives and non-derivatives in net investment hedging relationships
(millions)
Gain (loss) recognized in
AOCIGain (loss) excluded from
assessment of hedge effectivenessLocation of gain (loss) in
income of excluded component
July 3,
2021June 27,
2020July 3,
2021June 27,
2020Foreign currency denominated long-term debt $ (32) $ (18) $ — $ — Cross-currency contracts (10) (4) 5 9 Interest expenseTotal $ (42) $ (22) $ 5 $ 9
Derivatives not designated as hedging instruments
(millions)
Location of gain (loss) recognized
in income
Gain (loss) recognized in
income
July 3,
2021June 27,
2020Foreign currency exchange contracts COGS $ (9) $ (5)Foreign currency exchange contracts Other income (expense), net — (3)Foreign currency exchange contracts SG&A 1 — Interest rate contracts Interest expense — 1 Commodity contracts COGS 55 (26)Total $ 47 $ (33)
18

Table of Contents
The effect of derivative instruments on the Consolidated Statements of Income and Comprehensive Income for the year-to-date periods endedJuly 3, 2021 and June 27, 2020 was as follows:
Derivatives and non-derivatives in net investment hedging relationships
(millions)
Gain (loss) recognized in
AOCIGain (loss) excluded from
assessment of hedge effectivenessLocation of gain (loss) in
income of excluded component
July 3,
2021June 27,
2020July 3,
2021June 27,
2020Foreign currency denominated long-term debt $ 71 $ (9) $ — $ — Cross-currency contracts 17 62 10 18 Interest expenseTotal $ 88 $ 53 $ 10 $ 18
Derivatives not designated as hedging instruments
(millions)
Location of gain (loss) recognized
in income
Gain (loss) recognized in
income
July 3,
2021June 27,
2020Foreign currency exchange contracts COGS $ (26) $ 46 Foreign currency exchange contracts Other income (expense), net (1) 6 Foreign currency exchange contracts SGA 5 4 Interest rate contracts Interest expense 1 1 Commodity contracts COGS 67 (50)Total $ 46 $ 7
The effect of fair value and cash flow hedge accounting on the Consolidated Income Statement for the quarters ended July 3, 2021 and June 27,2020:
July 3, 2021 June 27, 2020(millions) Interest Expense Interest ExpenseTotal amounts of income and expense line items presented in the Consolidated IncomeStatement in which the effects of fair value or cash flow hedges are recorded $ 58 $ 69
Gain (loss) on fair value hedging relationships:Interest contracts:Hedged items (6) (2)Derivatives designated as hedging instruments 7 2
Gain (loss) on cash flow hedging relationships:Interest contracts:
Amount of gain (loss) reclassified from AOCI into income (10) (5)
19

Table of Contents
The effect of fair value and cash flow hedge accounting on the Consolidated Income Statement for the year-to-date periods ended July 3, 2021 andJune 27, 2020:
July 3, 2021 June 27, 2020(millions) Interest Expense Interest ExpenseTotal amounts of income and expense line items presented in the Consolidated IncomeStatement in which the effects of fair value or cash flow hedges are recorded $ 117 $ 133
Gain (loss) on fair value hedging relationships:Interest contracts:Hedged items — (3)Derivatives designated as hedging instruments — 4
Gain (loss) on cash flow hedging relationships:Interest contracts:
Amount of gain (loss) reclassified from AOCI into income (15) (7)
During the next 12 months, the Company expects $17 million of net deferred losses reported in AOCI at July 3, 2021 to be reclassified to income,assuming market rates remain constant through contract maturities.
Certain of the Company’s derivative instruments contain provisions requiring the Company to post collateral on those derivative instruments that arein a liability position if the Company’s credit rating is at or below BB+ (S&P), or Baa1 (Moody’s). The fair value of all derivative instruments withcredit-risk-related contingent features in a liability position on July 3, 2021 was not material. In addition, certain derivative instruments containprovisions that would be triggered in the event the Company defaults on its debt agreements. There were no collateral posting as of July 3, 2021triggered by credit-risk-related contingent features.
Other fair value measurements
Marketable SecuritiesDuring the quarter ended June 27, 2020, the Company invested $200 million in a mutual fund holding short term debt securities. The investment ismeasured at fair value using the net asset value (NAV) per share as a practical expedient and as a result, this investment has not been classified inthe fair value hierarchy. As of June 27, 2020, fair value using NAV was $200 million.
Available for sale securities
July 3, 2021 January 2, 2021Unrealized Unrealized
(millions) Cost Gain (Loss) Market Value Cost Gain (Loss) Market ValueCorporate bonds $ 61 $ 2 $ 63 $ 62 $ 3 $ 65
During the year-to-date period ended July 3, 2021, the Company sold approximately $6 million of investments in level 2 corporate bonds. Theresulting gain from the sale of these investments was less than $1 million dollars and was recorded in Other income and (expense).
The market values of the Company's investments in level 2 corporate bonds were based on matrices or models from pricing vendors. Unrealizedgains and losses were included in the Consolidated Statement of Comprehensive Income. Additionally, these investments were recorded withinOther current assets and Other assets on the Consolidated Balance Sheet, based on the maturity of the individual security. The maturity dates of thesecurities range from 2022 to 2036.
The Company reviews its investment portfolio for any unrealized losses that would be deemed other-than-temporary and requires the recognition ofan impairment loss in earnings. If the cost of an investment exceeds its fair value, the Company evaluates, among other factors, general marketconditions, the duration and extent to which the fair value is less than its cost, the Company's intent to hold the investment, and whether it is morelikely than not that the Company will be required to sell the investment before recovery of the cost basis. The Company also considers the type ofsecurity, related industry and sector performance, and published investment ratings. Once a decline in
20

Table of Contents
fair value is determined to be other-than-temporary, an impairment charge is recorded and a new cost basis in the investment is established. Ifconditions within individual markets, industry segments, or macro-economic environments deteriorate, the Company could incur future impairments.
Financial instruments
The carrying values of the Company’s short-term items, including cash, cash equivalents, accounts receivable, accounts payable, notes payable andcurrent maturities of long-term debt approximate fair value. The fair value of the Company’s long-term debt, which are level 2 liabilities, is calculatedbased on broker quotes. The fair value and carrying value of the Company's long-term debt was $7.8 billion and $7.0 billion, respectively, as ofJuly 3, 2021. The fair value and carrying value of the Company's long-term debt were $7.7 billion and $6.7 billion, respectively, as of January 2,2021.
Counterparty credit risk concentration and collateral requirementsThe Company is exposed to credit loss in the event of nonperformance by counterparties on derivative financial and commodity contracts.Management believes a concentration of credit risk with respect to derivative counterparties is limited due to the credit ratings and use of masternetting and reciprocal collateralization agreements with the counterparties and the use of exchange-traded commodity contracts.
Master netting agreements apply in situations where the Company executes multiple contracts with the same counterparty. Certain counterpartiesrepresent a concentration of credit risk to the Company. If those counterparties fail to perform according to the terms of derivative contracts, thiswould result in a loss to the Company of approximately $74 million, net of collateral already received from those counterparties, as of July 3, 2021.
For certain derivative contracts, reciprocal collateralization agreements with counterparties call for the posting of collateral in the form of cash,treasury securities or letters of credit if a fair value loss position to the Company or its counterparties exceeds a certain amount. In addition, theCompany is required to maintain cash margin accounts in connection with its open positions for exchange-traded commodity derivative instrumentsexecuted with the counterparty that are subject to enforceable netting agreements. As of July 3, 2021, the Company posted $37 million in margindeposits for exchange-traded commodity derivative instruments, which was reflected as an increase in accounts receivable, net on the ConsolidatedBalance Sheet.
Management believes concentrations of credit risk with respect to accounts receivable is limited due to the generally high credit quality of theCompany’s major customers, as well as the large number and geographic dispersion of smaller customers. However, the Company conducts adisproportionate amount of business with a small number of large multinational grocery retailers, with the five largest accounts encompassingapproximately 23% of consolidated trade receivables at July 3, 2021.
Note 8 Reportable segmentsKellogg Company is a leading producer of snacks, cereal, and frozen foods. It is the second largest producer of crackers, and a leading producer ofsavory snacks, and the world's leading producer of cereal. Additional product offerings include toaster pastries, cereal bars, veggie foods andnoodles. Kellogg products are manufactured and marketed globally. Principal markets for these products include the United States, United Kingdom,Nigeria, Canada, Mexico, and Australia.
The Company manages its operations through four operating segments that are based on geographic location – North America which includes U.S.businesses and Canada; Europe which consists of European countries; Latin America which consists of Central and South America and includesMexico; and AMEA (Asia Middle East Africa) which consists of Africa, Middle East, Australia and other Asian and Pacific markets. These operatingsegments also represent our reportable segments.
21

Table of Contents
The measurement of reportable segment results is based on segment operating profit which is generally consistent with the presentation ofoperating profit in the Consolidated Statement of Income. Reportable segment results were as follows: Quarter ended Year-to-date period ended
(millions)July 3,
2021June 27,
2020July 3,
2021June 27,
2020Net sales
North America $ 2,013 $ 2,167 $ 4,143 $ 4,264 Europe 618 546 1,196 1,072 Latin America 266 223 502 450 AMEA 658 529 1,298 1,091 Consolidated $ 3,555 $ 3,465 $ 7,139 $ 6,877
Operating profitNorth America $ 363 $ 464 $ 742 $ 830 Europe 101 92 181 162 Latin America 32 31 59 53 AMEA 63 38 126 84 Total Reportable Segments 559 625 1,108 1,129 Corporate (55) (119) (132) (163)Consolidated $ 504 $ 506 $ 976 $ 966
Supplemental product information is provided below for net sales to external customers:Quarter ended Year-to-date period ended
(millions)July 3,
2021June 27,
2020July 3,
2021June 27,
2020Snacks $ 1,656 $ 1,522 $ 3,303 $ 3,076 Cereal 1,336 1,444 2,710 2,769Frozen 267 284 564 578Noodles and other 296 215 562 454
Consolidated $ 3,555 $ 3,465 $ 7,139 $ 6,877
Note 9 Supplemental Financial Statement DataConsolidated Balance Sheet
(millions)July 3, 2021(unaudited) January 2, 2021
Trade receivables $ 1,407 $ 1,272 Allowance for credit losses (23) (19)Refundable income taxes 18 66 Other receivables 257 218
Accounts receivable, net $ 1,659 $ 1,537 Raw materials and supplies $ 358 $ 338 Finished goods and materials in process 1,007 946
Inventories $ 1,365 $ 1,284 Intangible assets not subject to amortization $ 2,050 $ 2,068 Intangible assets subject to amortization, net 404 423
Other intangibles, net $ 2,454 $ 2,491
22

Table of Contents
Note 10 ContingenciesThe Company is subject to various legal proceedings, claims, and governmental inspections or investigations in the ordinary course of businesscovering matters such as general commercial, governmental regulations, antitrust and trade regulations, product liability, environmental, intellectualproperty, workers’ compensation, employment and other actions. These matters are subject to uncertainty and the outcome is not predictable withassurance. The Company uses a combination of insurance and self-insurance for a number of risks, including workers’ compensation, generalliability, automobile liability and product liability.
In 2016, a class action complaint was filed against Kellogg in the Northern District of California relating to statements made on packaging for certainproducts. In August 2019, the Court ruled in favor of the plaintiff regarding certain statements made on the Company’s products and ordered theparties to conduct settlement discussions related to all matters in dispute. In October 2019, the plaintiff filed a motion to the Court to approve asettlement between Kellogg and the class. During 2019, the Company concluded that the contingency related to the unfavorable ruling was probableand estimable, resulting in a liability being recorded. In January 2021, the parties reached a new settlement that was within the amount of thecontingency the Company recorded in December 2019. In June 2021, the court entered an order granting preliminary approval of the settlement.
The Company has established accruals for certain matters where losses are deemed probable and reasonably estimable. There are other claimsand legal proceedings pending against the Company for which accruals have not been established. It is reasonably possible that some of thesematters could result in an unfavorable judgment against the Company and could require payment of claims in amounts that cannot be estimated atJuly 3, 2021. Based upon current information, management does not expect any of the claims or legal proceedings pending against the Company tohave a material impact on the Company’s consolidated financial statements.
23

Table of Contents
KELLOGG COMPANYPART I—FINANCIAL INFORMATION
Item 2. Management’s Discussion and Analysis of Financial Condition and Results of Operations
Business overviewThe following Management’s Discussion and Analysis of Financial Condition and Results of Operations (MD&A) is intended to help the readerunderstand Kellogg Company, our operations and our present business environment. MD&A is provided as a supplement to, and should be read inconjunction with, our Consolidated Financial Statements and the accompanying notes thereto contained in Item 1 of this report. Our MD&Areferences consumption and net sales in discussing our sales trends for certain categories and brands. We record net sales upon delivery ofshipments to our customers. Consumption and share data noted within is based on Nielsen x-AOC or other comparable source, for the applicableperiod. Consumption refers to consumer purchases of our products from our customers. Unless otherwise noted, consumption and shipment trendsare materially consistent.
For more than 115 years, consumers have counted on Kellogg for great-tasting, high-quality and nutritious foods. Currently, these foods includesnacks, such as crackers, savory snacks, toaster pastries, cereal bars and bites; and convenience foods, such as, ready-to-eat cereals, frozenwaffles, veggie foods and noodles. Kellogg products are manufactured and marketed globally.
COVID-19 ResponseAs over a year has passed since the World Health Organization categorized the novel coronavirus (COVID-19) as a pandemic in March 2020, ourkey objectives continue to be 1) protecting the health and safety of our employees, 2) safely producing and delivering our foods to customers andconsumers, and 3) supporting the communities in which we operate. Our efforts have been led by the Company’s Executive Committee, acommittee composed of senior leaders, and our global Crisis Management Process. As part of that process, we have worked closely with medical,regulatory and other experts as we deliver on our objectives.
Employee health and safetyThe health and safety of our employees is our top priority. From the outset of the pandemic, the Company has designed and implemented a numberof actions across the business including restricting travel and visitors to its facilities, prohibiting external group meetings and establishing quarantineprocedures for any potentially exposed employees. At this time, most of our office employees continue to work remotely to minimize the exposure ofour employees to COVID-19. For those who are not able to work remotely, the Company has implemented enhanced protocols at all of our facilitiesto protect our employees, including temperature checks, social distancing, response plans, face coverings, contact tracing, enhanced sanitationprocedures, and additional personal protection equipment
Maintain our ability to produce and deliver essential food supplyIn addition to our efforts to keep our people safe, the Company has taken several actions to ensure that we maintain our ability to operate effectivelyduring this pandemic, providing our foods to our customers and consumers. In certain parts of the world, the reacceleration of COVID cases hasbrought new governmental restrictions, in some instances causing temporary reductions in production. Additionally, as a result of global supplyimbalances, we have managed through bottlenecks and shortages of materials, labor, and freight that have required us to pursue alternativesources, incremental capacity, and temporary labor. Amidst a related rise in cost inflation, the Company has taken steps to preserve underlyingprofitability through productivity, mix, and revenue growth management. While to date we have experienced limited disruption in the operation of ourfacilities, we continue to take the appropriate actions to ensure the continuity of our business.
We have partnered with our strategic technology providers in order to maintain support for our critical business and finance systems as well asadditional network bandwidth and support for the transition to a work-from-home environment. We have worked to mitigate system-related risks inthis environment through heightened monitoring of cybersecurity and network capacity as well as reevaluation of contingency plans.
24

Table of Contents
Community supportKellogg is a company with a heart and soul, and we are working together across our company to help our food bank partners and neighbors in need.Kellogg and our charitable funds have donated cash and food to global COVID-19 hunger relief efforts. As always, through our global Kellogg’sBetter Days purpose platform, we help deliver critical nourishment to people when they need it most. Local governments have identified foodsecurity as a top priority in their fight against COVID-19. Kellogg is providing support to our food bank partners on the front-lines, helping those whomay not know where their next meal is coming from.
Monitoring future impactsThe severity, magnitude and duration of the current COVID-19 pandemic is uncertain and rapidly changing. The Company continues to activelymonitor the pandemic including, infection and hospitalization rates, vaccination efforts, and related governmental actions such as expanded orreduced stay-at home orders and social distancing guidelines. We will adjust our mitigation strategies as necessary to address any changing health,operational or financial risks that may arise. Since the onset of the pandemic, the Company has experienced a significant increase in demand for ourretail products as consumers stocked up on food for at-home consumption in those markets. While this demand has moderated for certain products,we will continue to manage our production capacity during this period of volatility. We continue to monitor the business for adverse impacts of thepandemic, including volatility in the foreign exchange markets, reduced demand in our away from home businesses, supply-chain disruptions incertain markets, increased costs of employee safety and maintaining food supply, and potential disruptions for certain emerging market countries. Inthe event the Company experiences adverse impacts from the above or other factors, the Company would also evaluate the need to perform interimimpairment tests for the Company’s goodwill, indefinite lived intangible assets, investments in unconsolidated affiliates and property, plant andequipment. There can be no assurance that volatility and/or disruption in the global capital and credit markets will not impair our ability to accessthese markets on terms acceptable to us, or at all. See further discussion within Future Outlook.
SegmentsWe manage our operations through four operating segments that are based primarily on geographic location – North America which includes theU.S. businesses and Canada; Europe which consists principally of European countries; Latin America which consists of Central and South Americaand includes Mexico; and AMEA (Asia Middle East Africa) which consists of Africa, Middle East, Australia and other Asian and Pacific markets.These operating segments also represent our reportable segments.
Non-GAAP financial measuresThis filing includes non-GAAP financial measures that we provide to management and investors that exclude certain items that we do not considerpart of on-going operations. Items excluded from our non-GAAP financial measures are discussed in the "Significant items impacting comparability"section of this filing. Our management team consistently utilizes a combination of GAAP and non-GAAP financial measures to evaluate businessresults, to make decisions regarding the future direction of our business, and for resource allocation decisions, including incentive compensation. Asa result, we believe the presentation of both GAAP and non-GAAP financial measures provides investors with increased transparency into financialmeasures used by our management team and improves investors’ understanding of our underlying operating performance and in their analysis ofongoing operating trends. All historic non-GAAP financial measures have been reconciled with the most directly comparable GAAP financialmeasures.
Non-GAAP financial measures used for evaluation of performance include currency-neutral and organic net sales, adjusted and currency-neutraladjusted operating profit, adjusted and currency-neutral adjusted diluted earnings per share (EPS), currency-neutral adjusted gross profit, currencyneutral adjusted gross margin, adjusted effective tax rate, net debt, and cash flow. We determine currency-neutral results by dividing or multiplying,as appropriate, the current-period local currency operating results by the currency exchange rates used to translate our financial statements in thecomparable prior-year period to determine what the current period U.S. dollar operating results would have been if the currency exchange rate hadnot changed from the comparable prior-year period. These non-GAAP financial measures may not be comparable to similar measures used by othercompanies.
• Currency-neutral net sales and organic net sales: We adjust the GAAP financial measure to exclude the impact of foreign currency, resultingin currency-neutral net sales. In addition, we exclude the impact of acquisitions, divestitures, foreign currency, and differences in shippingdays including the 53rd week, resulting in organic net sales. We excluded the items which we believe may obscure trends in our underlyingnet sales performance. By providing these non-GAAP net sales measures, management intends to provide investors with a meaningful,consistent comparison of net sales performance for the Company
®
25

Table of Contents
and each of our reportable segments for the periods presented. Management uses these non-GAAP measures to evaluate the effectivenessof initiatives behind net sales growth, pricing realization, and the impact of mix on our business results. These non-GAAP measures are alsoused to make decisions regarding the future direction of our business, and for resource allocation decisions.
• Adjusted: operating profit and diluted EPS: We adjust the GAAP financial measures to exclude the effect of restructuring programs, mark-to-market adjustments for pension plans (service cost, interest cost, expected return on plan assets, and other net periodic pension costs arenot excluded), commodities and certain foreign currency contracts, multi-employer pension plan withdrawal liabilities, gain/loss on thedivestiture, and other costs impacting comparability resulting in adjusted. We excluded the items which we believe may obscure trends inour underlying profitability. By providing these non-GAAP profitability measures, management intends to provide investors with ameaningful, consistent comparison of the Company's profitability measures for the periods presented. Management uses these non-GAAPfinancial measures to evaluate the effectiveness of initiatives intended to improve profitability, as well as to evaluate the impacts ofinflationary pressures and decisions to invest in new initiatives within each of our segments.
• Currency-neutral adjusted: gross profit, gross margin, operating profit, and diluted EPS: We adjust the GAAP financial measures to excludethe effect of restructuring programs, mark-to-market adjustments for pension plans (service cost, interest cost, expected return on planassets, and other net periodic pension costs are not excluded), commodities and certain foreign currency contracts, multi-employer pensionplan withdrawal liabilities, gain/loss on the divestiture, other costs impacting comparability, and foreign currency, resulting in currency-neutral adjusted. We excluded the items which we believe may obscure trends in our underlying profitability. By providing these non-GAAPprofitability measures, management intends to provide investors with a meaningful, consistent comparison of the Company's profitabilitymeasures for the periods presented. Management uses these non-GAAP financial measures to evaluate the effectiveness of initiativesintended to improve profitability, as well as to evaluate the impacts of inflationary pressures and decisions to invest in new initiatives withineach of our segments.
• Adjusted effective income tax rate: We adjust the GAAP financial measures to exclude the effect of restructuring programs, mark-to-marketadjustments for pension plans (service cost, interest cost, expected return on plan assets, and other net periodic pension costs are notexcluded), commodities and certain foreign currency contracts, multi-employer pension plan withdrawal liabilities, gain/loss on thedivestiture, and other costs impacting comparability. We excluded the items which we believe may obscure trends in our pre-tax income andthe related tax effect of those items on our adjusted effective income tax rate, and other impacts to tax expense, including tax reform in theUK and U.S. By providing this non-GAAP measure, management intends to provide investors with a meaningful, consistent comparison ofthe Company's effective tax rate, excluding the pre-tax income and tax effect of the items noted above, for the periods presented.Management uses this non-GAAP measure to monitor the effectiveness of initiatives in place to optimize our global tax rate.
• Net debt: Defined as the sum of long-term debt, current maturities of long-term debt and notes payable,less cash and cash equivalents and marketable securities. With respect to net debt, cash and cash equivalents and marketable securitiesare subtracted from the GAAP measure, total debt liabilities, because they could be used to reduce the Company’s debt obligations.Company management and investors use this non-GAAP measure to evaluate changes to the Company's capital structure and credit qualityassessment.
• Cash flow: Defined as net cash provided by operating activities reduced by expenditures for property additions. Cash flow does notrepresent the residual cash flow available for discretionary expenditures. We use this non-GAAP financial measure of cash flow to focusmanagement and investors on the amount of cash available for debt repayment, dividend distributions, acquisition opportunities, and sharerepurchases once all of the Company’s business needs and obligations are met. Additionally, certain performance-based compensationincludes a component of this non-GAAP measure.
These measures have not been calculated in accordance with GAAP and should not be viewed as a substitute for GAAP reporting measures.
26

Table of Contents
Significant items impacting comparability
Mark-to-market accounting for pension plans, commodities and certain foreign currency contractsWe recognize mark-to-market adjustments for pension plans, commodity contracts, and certain foreign currency contracts as incurred. Actuarialgains/losses for pension plans are recognized in the year they occur. Changes between contract and market prices for commodities contracts andcertain foreign currency contracts result in gains/losses that are recognized in the quarter they occur. We recorded a pre-tax mark-to-market benefitof $23 million and $14 million for the quarter and year-to-date periods ended July 3, 2021, respectively. Included within the aforementioned was apre-tax mark-to-market benefit for pension plans of $10 million and $20 million for the quarter and year-to-date periods ended July 3, 2021,respectively. Additionally, we recorded a pre-tax mark-to-market expense of $86 million and $74 million for the quarter and year-to-date periodsended June 27, 2020, respectively. Included within the aforementioned was a pre-tax mark-to-market expense for pension plans of $43 million and$57 million for the quarter and year-to-date periods ended June 27, 2020, respectively.
Business and portfolio realignmentOne-time costs related to reorganizations in support of our Deploy for Growth priorities and a reshaped portfolio; investments in enhancingcapabilities prioritized by our Deploy for Growth strategy; and completed and prospective divestitures and acquisitions, including the divestiture ofour cookies, fruit snacks, pie crusts, and ice-cream cone businesses. As a result, we incurred pre-tax charges, primarily related to reorganizations, of$5 million and $13 million for the quarter and year-to-date periods ended July 3, 2021, respectively. We also recorded pre-tax charges of $17 millionand $23 million for the quarter and year-to-date periods ended June 27, 2020, respectively.
Multi-employer pension plan withdrawalDuring the second quarter of 2020, the Company recorded a pre-tax gain of approximately $5 million related to the settlement of a multi-employerpension plan withdrawal liability.
UK tax rate changeDuring the second quarter of 2021, the Company recorded tax expense of $23 million as a result of tax legislation enacted in the UK in June 2021,which increased the statutory UK tax rate from 19 percent to 25 percent and required us to re-value our net deferred tax liability related to our UKbusiness to reflect this higher rate.
Foreign currency translationWe evaluate the operating results of our business on a currency-neutral basis. We determine currency-neutral operating results by dividing ormultiplying, as appropriate, the current-period local currency operating results by the currency exchange rates used to translate our financialstatements in the comparable prior-year period to determine what the current period U.S. dollar operating results would have been if the currencyexchange rate had not changed from the comparable prior-year period.
Financial resultsFor the quarter ended July 3, 2021, our reported net sales increased 2.6% versus the prior year on favorable foreign currency translation. Organicnet sales decreased 0.4% from the prior year due to lapping elevated demand for packaged foods consumed at home during the early stages of thepandemic last year, mostly offset by strong growth in emerging markets, recovery in away-from-home channels, and positive price/mix.
Second quarter reported operating profit decreased 0.4% versus the year-ago quarter due to lapping unusually high operating leverage and delayedbrand investment in the prior year quarter, partially offset by favorable mark-to-market and foreign currency translation. Currency-neutral adjustedoperating profit decreased 15%, after excluding the impact of mark-to-market, business and portfolio realignment, and foreign currency translation.
Reported diluted EPS of $1.11 for the quarter increased 8.8% compared to the prior year quarter of $1.02 due to favorable mark-to-market impactscompared to the prior year. Currency-neutral adjusted diluted EPS of $1.08 for the quarter decreased 13% compared to prior year quarter of $1.24,due to lapping unusually strong prior year growth.
27

Table of Contents
Reconciliation of certain non-GAAP Financial Measures
Quarter ended Year-to-date period endedConsolidated results (dollars in millions, except per share data)
July 3, 2021
June 27, 2020
July 3, 2021
June 27, 2020
Reported net income $ 380 $ 351 $ 748 $ 698 Mark-to-market (pre-tax) 23 (86) 14 (74)Business and portfolio realignment (pre-tax) (5) (17) (13) (23)Multi-employer pension plan withdrawal (pre-tax) — 5 — 5 Income tax impact applicable to adjustments, net* (4) 23 (1) 23 UK tax rate change (23) — (23) — Adjusted net income $ 389 $ 426 $ 770 $ 766 Foreign currency impact 20 — 32 — Currency-neutral adjusted net income $ 369 $ 426 $ 738 $ 766
Reported diluted EPS $ 1.11 $ 1.02 $ 2.18 $ 2.02 Mark-to-market (pre-tax) 0.07 (0.25) 0.04 (0.21)Business and portfolio realignment (pre-tax) (0.02) (0.05) (0.03) (0.07)Multi-employer pension plan withdrawal (pre-tax) — 0.01 — 0.01 Income tax impact applicable to adjustments, net* (0.01) 0.07 — 0.07 UK tax rate change (0.07) — (0.07) — Adjusted diluted EPS $ 1.14 $ 1.24 $ 2.24 $ 2.22 Foreign currency impact 0.06 — 0.09 — Currency-neutral adjusted diluted EPS $ 1.08 $ 1.24 $ 2.15 $ 2.22 Currency-neutral adjusted diluted EPS growth (12.9)% (3.2)%
Note: Tables may not foot due to rounding.For more information on the reconciling items in the table above, please refer to the Significant items impacting comparability section.* Represents the estimated income tax effect on the reconciling items, using weighted-average statutory tax rates, depending upon the applicable jurisdiction.
28

Table of Contents
Net sales and operating profitThe following tables provide an analysis of net sales and operating profit performance for the second quarter of 2021 versus 2020:
Quarter ended July 3, 2021
(millions)North
America EuropeLatin
America AMEA CorporateKellogg
ConsolidatedReported net sales $ 2,013 $ 618 $ 266 $ 658 $ — $ 3,555
Foreign currency impact on total business (inc)/dec 17 54 23 8 — 103 Organic net sales $ 1,997 $ 564 $ 242 $ 650 $ — $ 3,452
Quarter ended June 27, 2020(millions)Reported net sales $ 2,167 $ 546 $ 223 $ 529 $ — $ 3,465
% change - 2021 vs. 2020:Reported growth (7.2)% 13.2 % 19.0 % 24.3 % — % 2.6 %
Foreign currency impact on total business (inc)/dec 0.8 % 9.9 % 10.5 % 1.5 % — % 3.0 %Organic growth (8.0)% 3.3 % 8.5 % 22.8 % — % (0.4) %
Volume (tonnage) (11.9)% (3.8)% (0.7) % 9.5 % — % (4.2) %Pricing/mix 3.9 % 7.1 % 9.2 % 13.3 % — % 3.8 %
Note: Tables may not foot due to rounding.For more information on the reconciling items in the table above, please refer to the Significant items impacting comparability section.
Quarter ended July 3, 2021
(millions)North
America EuropeLatin
America AMEA CorporateKellogg
ConsolidatedReported operating profit $ 363 $ 101 $ 32 $ 63 $ (54) $ 504
Mark-to-market — — (1) — 13 13 Business and portfolio realignment (3) — — — (2) (5)
Adjusted operating profit $ 367 $ 101 $ 32 $ 63 $ (66) $ 497 Foreign currency impact 2 10 3 3 1 18
Currency-neutral adjusted operating profit $ 364 $ 91 $ 29 $ 60 $ (67) $ 478
Quarter ended June 27, 2020(millions)Reported operating profit $ 464 $ 92 $ 31 $ 38 $ (119) $ 506
Mark-to-market — — — — (43) (43)Business and portfolio realignment — (1) (4) (10) (1) (17)Multi-employer pension plan exit liability 5 — — — — 5
Adjusted operating profit $ 459 $ 94 $ 35 $ 48 $ (75) $ 562
% change - 2021 vs. 2020:Reported growth (21.6) % 9.2 % 1.5 % 63.6 % 54.3 % (0.4) %
Mark-to-market — % — % (1.7) % — % 43.5 % 10.2 %Business and portfolio realignment (0.7) % 1.7 % 12.1 % 33.6 % (1.1) % 1.7 %Multi-employer pension plan withdrawal (0.8) % — % — % — % — % (0.7) %
Adjusted growth (20.1) % 7.5 % (8.9) % 30.0 % 11.9 % (11.6) %Foreign currency impact 0.5 % 10.5 % 8.4 % 5.3 % 1.2 % 3.3 %
Currency-neutral adjusted growth (20.6) % (3.0)% (17.3) % 24.7 % 10.7 % (14.9) %
Note: Tables may not foot due to rounding.For more information on the reconciling items in the table above, please refer to the Significant items impacting comparability section.
29

Table of Contents
North AmericaReported net sales for the second quarter decreased 7.2% versus the prior year due to lapping elevated demand for packaged foods consumed athome during the early stages of the pandemic last year as well as timing of shipments into the first quarter of 2021. Organic net sales decreased8.0% after excluding the impact of foreign currency.
Net sales % change - second quarter 2021 vs. 2020:North America Reported net sales Foreign currency Organic net salesSnacks 1.6 % 0.5 % 1.1 %Cereal (20.1) % 1.2 % (21.3)%Frozen (6.1) % 0.7 % (6.8)%
North America snacks net sales increased 1.6% due primarily to the performance of key brands and favorable foreign currency translation, despitecontinued weakness in away-from-home channels. In salty snacks, Pringles growth outpaced the category, posting consumption growth during thequarter. In crackers, Cheez-it grew both consumption and share during the quarter.
North America cereal net sales decreased 20.1% and North America frozen foods net sales decreased 6.1% during the quarter, both due to lappinga pandemic-related surge in consumption growth during the prior-year quarter.
North America operating profit decreased 22% primarily due to the lower net sales and to lapping the prior year postponement of brand investment.Currency-neutral adjusted operating profit decreased 21%, after excluding the impact of business and portfolio realignment.
EuropeReported net sales increased 13% due to favorable foreign currency translation as well as growth in snacks, led by Continental Europe and Russia.Organic net sales increased 3.3% after excluding the impact of foreign currency.
Cereal net sales growth for the quarter was driven largely by foreign currency translation offset by declines due to lapping a pandemic-related surgein consumption growth during the prior-year quarter.
Snacks net sales growth was led by sustained momentum in Pringles, driven by innovation, effective advertising, and successful consumerpromotions.
Reported operating profit increased 9.2% due primarily to higher net sales and favorable foreign currency translation partially offset by lappingunusually high operating leverage and postponement of brand investment during the onset of the pandemic. Currency-neutral adjusted operatingprofit decreased 3.0% after excluding the impact of foreign currency, and business and portfolio realignment.
Latin AmericaReported net sales increased 19% due primarily to broad-based growth across the region, led by snacks, and favorable foreign currency translation.Organic net sales increased 8.5%, after excluding the impact of foreign currency.
Reported operating profit increased 1.5% due to primarily to favorable foreign currency translation and lower business and portfolio realignmentcosts, partially offset by lapping unusually high operating leverage during the onset of the pandemic. Currency-neutral adjusted operating profitdecreased 17% after excluding the impact of business and portfolio realignment costs and foreign currency.
AMEAReported net sales increased 24% and organic net sales increased 23% after excluding the impact of foreign currency. This growth was due to bothvolume and price-mix, and was broad-based across Asia, Africa, and Australia, as well as across cereal, snacks, and noodles and other.
Reported operating profit increased 64% due primarily to operating leverage from higher net sales and the lapping of prior year business andportfolio realignment charges. Currency-neutral adjusted operating profit increased 25%, after excluding the impact of business and portfoliorealignment, and foreign currency.
30

Table of Contents
CorporateReported operating profit increased $65 million versus the comparable prior year quarter due primarily to favorable mark-to-market impacts.Currency-neutral adjusted operating profit increased $8 million from the prior year after excluding the impact of mark-to-market.
31

Table of Contents
The following tables provide an analysis of net sales and operating profit performance for the year-to-date periods ended July 3, 2021 versus June27, 2020:
Year-to-date period ended July 3, 2021
(millions)North
America EuropeLatin
America AMEA CorporateKellogg
ConsolidatedReported net sales $ 4,143 $ 1,196 $ 502 $ 1,298 $ — $ 7,139
Foreign currency impact on total business (inc)/dec 26 91 10 5 — 132 Organic net sales $ 4,117 $ 1,105 $ 492 $ 1,293 $ — $ 7,008
Year-to-date period ended June 27, 2020(millions)Reported net sales $ 4,264 $ 1,072 $ 450 $ 1,091 $ — $ 6,877
% change - 2021 vs. 2020:Reported growth (2.9)% 11.6 % 11.5 % 19.0 % — % 3.8 %
Foreign currency impact on total business (inc)/dec 0.6 % 8.5 % 2.2 % 0.5 % — % 1.9 %Organic growth (3.5)% 3.1 % 9.3 % 18.5 % — % 1.9 %
Volume (tonnage) (6.9)% (1.9)% 1.8 % 3.7 % — % (2.5) %Pricing/mix 3.4 % 5.0 % 7.5 % 14.8 % — % 4.4 %
Note: Tables may not foot due to rounding.For more information on the reconciling items in the table above, please refer to the Significant items impacting comparability section.
Year-to-date period ended July 3, 2021
(millions)North
America EuropeLatin
America AMEA CorporateKellogg
ConsolidatedReported operating profit $ 742 $ 181 $ 59 $ 126 $ (132) $ 976
Mark-to-market — — (1) — (5) (6)Business and portfolio realignment (6) — (4) — (3) (13)
Adjusted operating profit $ 748 $ 181 $ 63 $ 126 $ (124) $ 994 Foreign currency impact 4 14 2 5 1 27
Currency-neutral adjusted operating profit $ 745 $ 167 $ 61 $ 120 $ (125) $ 967
Year-to-date period ended June 27, 2020(millions)Reported operating profit $ 830 $ 162 $ 53 $ 84 $ (163) $ 966
Mark-to-market — — — — (17) (17)Business and portfolio realignment — (2) (4) (12) (4) (23)Multi-employer pension plan exit liability 5 — — — — 5
Adjusted operating profit $ 825 $ 164 $ 57 $ 96 $ (142) $ 1,001
% change - 2021 vs. 2020:Reported growth (10.5) % 11.9 % 10.4 % 49.4 % 19.2 % 1.1 %
Mark-to-market — % — % (1.0) % — % 5.9 % 1.2 %Business and portfolio realignment (0.7) % 1.7 % 1.6 % 19.0 % 0.4 % 1.0 %Multi-employer pension plan withdrawal (0.5) % — % — % — % — % (0.4) %
Adjusted growth (9.3) % 10.2 % 9.8 % 30.4 % 12.9 % (0.7) %Foreign currency impact 0.4 % 8.7 % 3.8 % 5.5 % 0.8 % 2.6 %
Currency-neutral adjusted growth (9.7) % 1.5 % 6.0 % 24.9 % 12.1 % (3.3) %
Note: Tables may not foot due to rounding.For more information on the reconciling items in the table above, please refer to the Significant items impacting comparability section.
32

Table of Contents
North AmericaReported net sales for the year-to-date period decreased 2.9% versus the prior year lapping elevated demand for packaged foods consumed athome during the early stages of the pandemic last year. Organic net sales decreased 3.5% after excluding the impact of foreign currency.
Net sales % change - second quarter year-to-date 2021 vs. 2020:North America Reported net sales Foreign currency Organic net salesSnacks 2.7 % 0.4 % 2.3 %Cereal (11.6) % 0.9 % (12.5)%Frozen (2.7) % 0.5 % (3.2)%
North America snacks net sales increased 2.7% due primarily to the performance of key brands despite continued weakness in away-from-homechannels. In salty snacks, Pringles growth outpaced the category, posting consumption growth during the period. In crackers, Cheez-it grew bothconsumption and share during the period.
North America cereal net sales decreased 11.6% and North America frozen foods net sales decreased 2.7% during the year-to-date period, lappinga pandemic-related surge in consumption growth during the prior year.
North America operating profit decreased 10.5% compared to the prior year due to lower net sales and higher brand building expense, lappingelevated demand at the onset of the pandemic and postponement of brand investment. Currency-neutral adjusted operating profit decreased 9.7%,after excluding the impact of business and portfolio realignment.
EuropeReported net sales increased 11.6% due to growth in snacks, led by Continental Europe and Russia, as well as favorable foreign currencytranslation. Organic net sales increased 3.1% after excluding the impact of foreign currency.
Cereal net sales growth for the year-to-date period was driven by favorable foreign currency translation offset by lapping a pandemic-related surge inconsumption growth during the prior year.
Snacks net sales growth was led by sustained momentum in Pringles, driven by innovation, effective advertising, and successful consumerpromotions.
Reported operating profit increased 11.9% due primarily to higher net sales and favorable foreign currency translation partially offset by lappingunusually high operating leverage and postponement of brand investment during the onset of the pandemic. Currency-neutral adjusted operatingprofit increased 1.5% after excluding the impact of foreign currency, and business and portfolio realignment.
Latin AmericaReported net sales increased 11.5% due primarily to broad-based growth across the region, led by snacks, and favorable foreign currencytranslation. Organic net sales increased 9.3%, after excluding the impact of foreign currency.
Reported operating profit increased 10.4% due to primarily to higher net sales and favorable foreign currency translation, partially offset by lappingunusually high operating leverage during the onset of the pandemic. Currency-neutral adjusted operating profit increased 6.0% after excluding theimpact of foreign currency.
AMEAReported net sales increased 19% due to broad-based growth across the region and categories resulting from favorable price/mix and highervolume. Organic net sales increased 19% after excluding the impact of foreign currency.
Cereal net sales growth was driven by elevated demand across the region, most notably Australia, India, and Japan.
Snacks net sales increased due primarily to strong growth in Pringles across the region.
33

Table of Contents
Noodles and other net sales increased lead by strong growth from Multipro as well as our Kellogg's branded noodles business.
Reported operating profit increased 49% due primarily to operating leverage from higher net sales and the lapping of prior year business andportfolio realignment charges. Currency-neutral adjusted operating profit increased 25%, after excluding the impact of business and portfoliorealignment, and foreign currency.
CorporateReported operating profit increased $31 million versus the comparable prior year period due primarily to favorable mark-to-market impacts.Currency-neutral adjusted operating profit increased $17 million from the prior year after excluding the impact of mark-to-market.
Margin performanceOur currency-neutral adjusted gross profit and gross profit margin performance for the quarter ended July 3, 2021 and June 27, 2020 are reconciledto the directly comparable GAAP measures as follows:
Quarter ended July 3, 2021 June 27, 2020GM change vs. prior
year (pts.)Gross Profit (a) Gross Margin (b) Gross Profit (a) Gross Margin (b)Reported $ 1,225 34.5 % $ 1,197 34.5 % — Mark-to-market 11 0.4 % (43) (1.3)% 1.7 Business and portfolio realignment (1) (0.1)% (4) (0.1)% — Multi-employer pension plan withdrawal — — % 5 0.1 % (0.1)Adjusted 1,215 34.2 % 1,239 35.8 % (1.6)Foreign currency impact 41 0.2 % — — % 0.2 Currency-neutral adjusted $ 1,174 34.0 % $ 1,239 35.8 % (1.8)
Note: Tables may not foot due to rounding.For more information on the reconciling items in the table above, please refer to the Significant items impacting comparability section.(a) Gross profit is equal to net sales less cost of goods sold.(b) Gross profit as a percentage of net sales.
Reported gross margin for the quarter was flat versus the prior year as productivity improvements, price realization, and favorable mark-to-marketimpacts were offset by cost inflation, a mix shift towards emerging markets, and lapping substantial operating leverage during the second quarter of2020 when our plants were running limited SKUs at maximum capacity due to the acceleration of demand as a result of the pandemic. Currency-neutral adjusted gross margin decreased 180 basis points compared to the second quarter of 2020 after eliminating the impact of mark-to-marketand foreign currency.
Our currency-neutral adjusted gross profit and gross profit margin performance for the year-to-date periods ended July 3, 2021 and June 27, 2020are reconciled to the directly comparable GAAP measures as follows:
Year-to-date period ended July 3, 2021 June 27, 2020GM change vs. prior
year (pts.)Gross Profit (a) Gross Margin (b) Gross Profit (a) Gross Margin (b)Reported $ 2,391 33.5 % $ 2,341 34.0 % (0.5)Mark-to-market (12) (0.2)% (21) (0.3)% 0.1 Business and portfolio realignment (2) — % (4) (0.1)% 0.1 Multi-employer pension plan withdrawal — — % $ 5 0.1 % (0.1)Adjusted 2,405 33.7 % 2,361 34.3 % (0.6)Foreign currency impact 56 0.2 % — — % 0.2 Currency-neutral adjusted $ 2,349 33.5 % $ 2,361 34.3 % (0.8)
Note: Tables may not foot due to rounding.For more information on the reconciling items in the table above, please refer to the Significant items impacting comparability section.(a) Gross profit is equal to net sales less cost of goods sold.(b) Gross profit as a percentage of net sales.
34
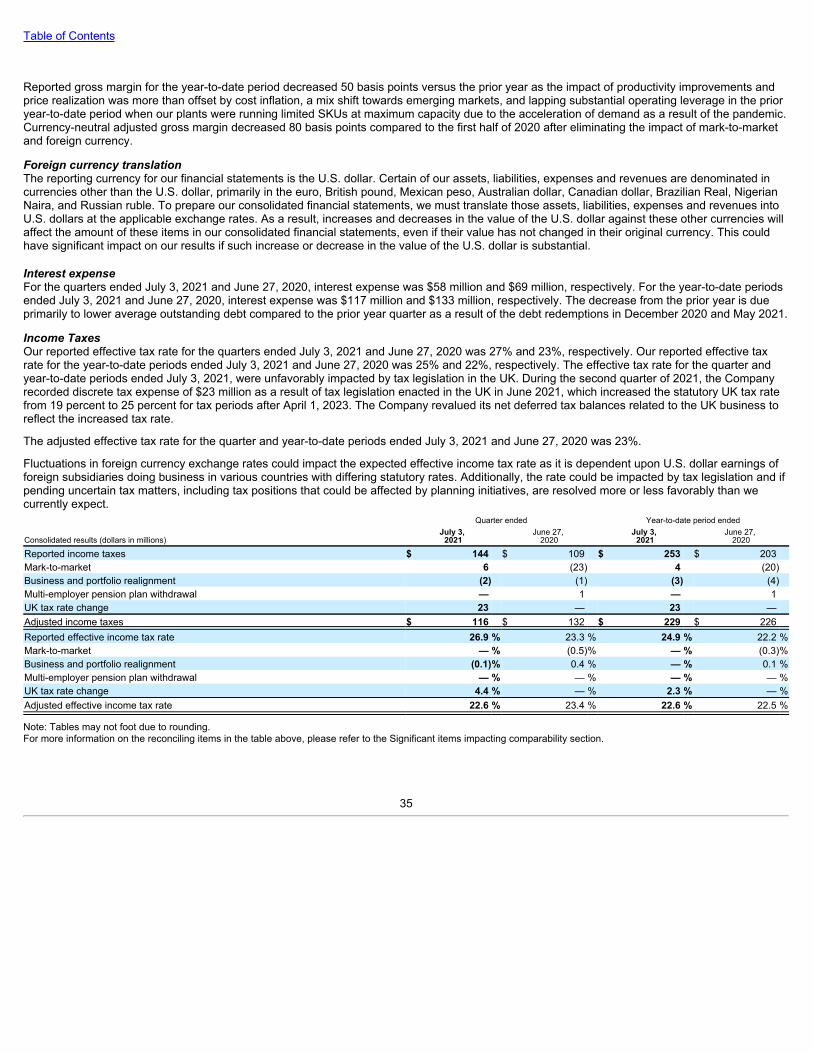
Table of Contents
Reported gross margin for the year-to-date period decreased 50 basis points versus the prior year as the impact of productivity improvements andprice realization was more than offset by cost inflation, a mix shift towards emerging markets, and lapping substantial operating leverage in the prioryear-to-date period when our plants were running limited SKUs at maximum capacity due to the acceleration of demand as a result of the pandemic.Currency-neutral adjusted gross margin decreased 80 basis points compared to the first half of 2020 after eliminating the impact of mark-to-marketand foreign currency.
Foreign currency translationThe reporting currency for our financial statements is the U.S. dollar. Certain of our assets, liabilities, expenses and revenues are denominated incurrencies other than the U.S. dollar, primarily in the euro, British pound, Mexican peso, Australian dollar, Canadian dollar, Brazilian Real, NigerianNaira, and Russian ruble. To prepare our consolidated financial statements, we must translate those assets, liabilities, expenses and revenues intoU.S. dollars at the applicable exchange rates. As a result, increases and decreases in the value of the U.S. dollar against these other currencies willaffect the amount of these items in our consolidated financial statements, even if their value has not changed in their original currency. This couldhave significant impact on our results if such increase or decrease in the value of the U.S. dollar is substantial.
Interest expenseFor the quarters ended July 3, 2021 and June 27, 2020, interest expense was $58 million and $69 million, respectively. For the year-to-date periodsended July 3, 2021 and June 27, 2020, interest expense was $117 million and $133 million, respectively. The decrease from the prior year is dueprimarily to lower average outstanding debt compared to the prior year quarter as a result of the debt redemptions in December 2020 and May 2021.
Income TaxesOur reported effective tax rate for the quarters ended July 3, 2021 and June 27, 2020 was 27% and 23%, respectively. Our reported effective taxrate for the year-to-date periods ended July 3, 2021 and June 27, 2020 was 25% and 22%, respectively. The effective tax rate for the quarter andyear-to-date periods ended July 3, 2021, were unfavorably impacted by tax legislation in the UK. During the second quarter of 2021, the Companyrecorded discrete tax expense of $23 million as a result of tax legislation enacted in the UK in June 2021, which increased the statutory UK tax ratefrom 19 percent to 25 percent for tax periods after April 1, 2023. The Company revalued its net deferred tax balances related to the UK business toreflect the increased tax rate.
The adjusted effective tax rate for the quarter and year-to-date periods ended July 3, 2021 and June 27, 2020 was 23%.
Fluctuations in foreign currency exchange rates could impact the expected effective income tax rate as it is dependent upon U.S. dollar earnings offoreign subsidiaries doing business in various countries with differing statutory rates. Additionally, the rate could be impacted by tax legislation and ifpending uncertain tax matters, including tax positions that could be affected by planning initiatives, are resolved more or less favorably than wecurrently expect. Quarter ended Year-to-date period ended
Consolidated results (dollars in millions)July 3,
2021June 27,
2020July 3,
2021June 27,
2020
Reported income taxes $ 144 $ 109 $ 253 $ 203 Mark-to-market 6 (23) 4 (20)Business and portfolio realignment (2) (1) (3) (4)Multi-employer pension plan withdrawal — 1 — 1 UK tax rate change 23 — 23 — Adjusted income taxes $ 116 $ 132 $ 229 $ 226 Reported effective income tax rate 26.9 % 23.3 % 24.9 % 22.2 %Mark-to-market — % (0.5)% — % (0.3)%Business and portfolio realignment (0.1)% 0.4 % — % 0.1 %Multi-employer pension plan withdrawal — % — % — % — %UK tax rate change 4.4 % — % 2.3 % — %Adjusted effective income tax rate 22.6 % 23.4 % 22.6 % 22.5 %
Note: Tables may not foot due to rounding.For more information on the reconciling items in the table above, please refer to the Significant items impacting comparability section.
35

Table of Contents
Liquidity and capital resourcesAt this time, the COVID-19 pandemic has not materially impacted our liquidity and we anticipate current cash and marketable security balances,operating cash flows, together with our credit facilities and other financing sources including commercial paper, credit and bond markets, will beadequate to meet our operating, investing and financing needs. We expect cash provided by operating activities of $1.6-$1.7 billion and capitalexpenditures of approximately $500 million in 2021. We currently have $2.5 billion of unused revolving credit agreements, including $1.5 billioneffective through 2023 and $1.0 billion effective through January 2022, as well as continued access to the commercial paper markets. We arecurrently in compliance with all debt covenants and do not have material uncertainty about our ability to maintain compliance in future periods. Wecontinue to utilize available capacity within the Monetization Programs to maintain financial flexibility without negatively impacting working capital.
As the impact of COVID-19 on the economy and our operations evolves, we will continue to assess our liquidity needs. There can be no assurancethat volatility and/or disruption in the global capital and credit markets will not impair our ability to access these markets on terms acceptable to us, orat all.
Our principal source of liquidity is operating cash flows supplemented by borrowings for major acquisitions and other significant transactions. Ourcash-generating capability is one of our fundamental strengths and provides us with substantial financial flexibility in meeting operating and investingneeds.
We have historically reported negative working capital primarily as the result of our focus to improve core working capital by reducing our levels oftrade receivables and inventory while extending the timing of payment of our trade payables. The impacts of the extended customer terms programand the monetization programs on core working capital are largely offsetting. These programs are all part of our ongoing working capitalmanagement.
We periodically monitor our supplier payment terms to assess whether our terms are competitive and in line with local market terms. To the extentthat such assessment indicates that our supplier payment terms are not aligned with local market terms, we may seek to adjust our terms, includingextending or shortening our payment due dates as appropriate. Supplier payment term modifications did not have a material impact on our cashflows during 2020, and are not expected to have a material impact in 2021.
We have a substantial amount of indebtedness which results in current maturities of long-term debt and notes payable which can have a significantimpact on working capital as a result of the timing of these required payments. These factors, coupled with the use of our ongoing cash flows fromoperations to service our debt obligations, pay dividends, fund acquisition opportunities, and repurchase our common stock, reduce our workingcapital amounts. We had negative working capital of $1.2 billion and $1.4 billion as of July 3, 2021 and June 27, 2020, respectively.
The following table reflects net debt amounts:
(millions, unaudited) July 3, 2021 January 2, 2021Notes payable $ 551 $ 102 Current maturities of long-term debt 17 627 Long-term debt 7,029 6,746 Total debt liabilities $ 7,597 $ 7,475 Less:Cash and cash equivalents (395) (435)Net debt $ 7,202 $ 7,040
36

Table of Contents
The following table sets forth a summary of our cash flows: Year-to-date period ended(millions) July 3, 2021 June 27, 2020Net cash provided by (used in):Operating activities $ 687 $ 971 Investing activities (330) (515)Financing activities (401) 234 Effect of exchange rates on cash and cash equivalents 4 (40)Net increase (decrease) in cash and cash equivalents $ (40) $ 650
Operating activitiesThe principal source of our operating cash flow is net earnings, meaning cash receipts from the sale of our products, net of costs to manufacture andmarket our products.
Net cash provided by our operating activities for the year-to-date period ended July 3, 2021, totaled $687 million compared to $971 million in theprior year period. The decrease is due primarily to higher year-over-year income tax payments and changes in incentive compensation and otheraccruals during the year.
Our cash conversion cycle (defined as days of inventory and trade receivables outstanding less days of trade payables outstanding, based on atrailing 12 month average), was approximately negative 11 days and negative 7 days for the 12 month periods ended July 3, 2021 and June 27,2020, respectively. The improvement from the prior year is due primarily to improvement in the number of days of trade payables outstanding whichresults from an increase in capital spending in accounts payable and other working capital initiatives.
We measure cash flow as net cash provided by operating activities reduced by expenditures for property additions. We use this non-GAAP financialmeasure of cash flow to focus management and investors on the amount of cash available for debt repayment, dividend distributions, acquisitionopportunities, and share repurchases. Our cash flow metric is reconciled to the most comparable GAAP measure, as follows:
Year-to-date period ended(millions) July 3, 2021 June 27, 2020Net cash provided by operating activities $ 687 $ 971 Additions to properties (301) (218)Cash flow $ 386 $ 753
Our non-GAAP measure for cash flow declined to $386 million in the year-to-date period ended July 3, 2021, from $753 million in the prior yearperiod due primarily to higher capital expenditures as projects were delayed in the prior year due to the pandemic, and higher year-over-year incometax payments and incentive compensation.
Investing activitiesOur net cash used in investing activities totaled $330 million for the year-to-date period ended July 3, 2021 compared to $515 million in thecomparable prior year period. The impact of cash outflow from the purchase of securities in the prior year period was partially offset by higher capitalexpenditures during the current period.
Financing activitiesOur net cash used in financing activities for the quarter ended July 3, 2021 totaled $401 million compared to cash provided of $234 million during thecomparable prior year period. The year-over-year variance was driven by the repayment of €500 million, seven-year 1.75% Euro Notes uponmaturity in May 2021 and the repurchase of $240 million of our common stock during the current year, partially offset by the May 2021 issuance of€300 million eight-year 0.50% Euro Notes due 2029.
In February 2020, the board of directors approved an authorization to repurchase up to $1.5 billion of the Company's common stock throughDecember 2022. The authorization is intended to allow us to repurchase shares for general corporate purposes and to offset issuances for employeebenefit programs. Total purchases for the year-to-date period ended July 3, 2021, were 4 million shares for $240 million. The Company did notpurchase shares in the year-to-date period ended June 27, 2020.
37

Table of Contents
We paid cash dividends of $392 million in the year-to-date period ended July 3, 2021, compared to $390 million during the comparable prior yearperiod. In July 2021, the board of directors declared a dividend of $.58 per common share, payable on September 15, 2021 to shareholders ofrecord at the close of business on September 1, 2021.
We entered into an unsecured Five-Year Credit Agreement in January 2018, allowing us to borrow, on a revolving credit basis, up to $1.5 billion andexpiring in January 2023.
In January 2021, we entered into an unsecured 364-Day Credit Agreement to borrow, on a revolving credit basis, up to $1.0 billion at any timeoutstanding, to replace the $1.0 billion 364-day facility that expired in January 2021.
The Five-Year and 364 Day Credit Agreements, which had no outstanding borrowings as July 3, 2021, contain customary covenants and warranties,including specified restrictions on indebtedness, liens and a specified interest expense coverage ratio. If an event of default occurs, then, to theextent permitted, the administrative agents may terminate the commitments under the credit facilities, accelerate any outstanding loans under theagreements, and demand the deposit of cash collateral equal to the lender's letter of credit exposure plus interest.
Our Notes contain customary covenants that limit the ability of the Company and its restricted subsidiaries (as defined) to incur certain liens or enterinto certain sale and lease-back transactions and also contain a change of control provision. There are no significant restrictions on the payment ofdividends. We were in compliance with all covenants as of July 3, 2021.
The Notes do not contain acceleration of maturity clauses that are dependent on credit ratings. A change in our credit ratings could limit our accessto the U.S. short-term debt market and/or increase the cost of refinancing long-term debt in the future. However, even under these circumstances,we would continue to have access to our 364-Day Credit Facility, which expires in January 2022, as well as our Five-Year Credit Agreement, whichexpires in January 2023. This source of liquidity is unused and available on an unsecured basis, although we do not currently plan to use it.
Monetization and Accounts Payable programsWe have a program in which customers could extend their payment terms in exchange for the elimination of early payment discounts (ExtendedTerms Program). In order to mitigate the net working capital impact of the Extended Terms Program for discrete customers, we entered intoagreements to sell, on a revolving basis, certain trade accounts receivable balances to third party financial institutions (Monetization Programs).Transfers under the Monetization Programs are accounted for as sales of receivables resulting in the receivables being de-recognized from ourConsolidated Balance Sheet. The Monetization Programs provide for the continuing sale of certain receivables on a revolving basis until terminatedby either party; however the maximum funding from receivables that may be sold at any time is currently $1,033 million, but may be increased ordecreased as customers move in or out of the Extended Terms Program and as additional financial institutions move in or out of the MonetizationPrograms. Accounts receivable sold of $793 million and $783 million remained outstanding under this arrangement as of July 3, 2021 and January2, 2021, respectively.
The Monetization Programs are designed to directly offset the impact the Extended Terms Program would have on the days-sales-outstanding(DSO) metric that is critical to the effective management of the Company's accounts receivable balance and overall working capital. Current DSOlevels within North America are consistent with DSO levels prior to the execution of the Extended Term Program and Monetization Programs.
Refer to Note 2 within Notes to Consolidated Financial Statements for further information related to the sale of accounts receivable.
We periodically monitor our supplier payment terms to assess whether our terms are competitive and in line with local market terms. To the extentthat such assessment indicates that our supplier payment terms are not aligned with local market terms, we may seek to adjust our terms, includingextending or shortening our payment due dates as appropriate, however, we do not expect supplier payment term modifications to have a materialimpact on our cash flows during 2021.
We have agreements with third parties (Accounts Payable Program) to provide accounts payable tracking systems which facilitate participatingsuppliers’ ability to monitor and, if elected, sell our payment obligations to designated
38

Table of Contents
third-party financial institutions. Participating suppliers may, at their sole discretion, make offers to sell one or more of our payment obligations priorto their scheduled due dates at a discounted price to participating financial institutions. Our goal is to capture overall supplier savings, in the form ofpayment terms or vendor funding, and the agreements facilitate the suppliers’ ability to sell payment obligations, while providing them with greaterworking capital flexibility. We have no economic interest in the sale of these suppliers’ receivables and no direct financial relationship with thefinancial institutions concerning these services. Our obligations to our suppliers, including amounts due and scheduled payment dates, are notimpacted by suppliers’ decisions to sell amounts under the arrangements. However, our right to offset balances due from suppliers against paymentobligations is restricted by the agreements for those payment obligations that have been sold by suppliers.
Refer to Note 1 within Notes to Consolidated Financial Statements for further information related to accounts payable.
If financial institutions were to terminate their participation in the Monetization Programs and we are not able to modify related customer paymentterms, working capital could be negatively impacted. Additionally, working capital could be negatively impacted if we shorten our supplier paymentterms as a result of supplier negotiations. For suppliers participating in the Accounts Payable Programs, financial institutions may terminate theirparticipation or we could experience a downgrade in our credit rating that could result in higher costs to suppliers. If working capital is negativelyimpacted as a result of these events and we were unable to secure alternative programs, we may have to utilize our various financing arrangementsfor short-term liquidity or increase our long-term borrowings.
39

Table of Contents
Future outlookKellogg Company affirmed its full-year financial guidance on operating profit, earnings per share and cash flow, as an improved outlook for net salesis offset by the impact of industry-wide supply chain challenges and high cost inflation expected to persist in the second half. Specifically, theCompany's updated its guidance as follows:
• Organic net sales growth is now expected to be 0-1% in 2021, an increase from previous guidance for flat net sales, reflecting recentmomentum in the business, and despite lapping last year's exceptional growth.
• Currency-neutral adjusted operating profit growth is unchanged from prior quarter, calling for a decline of approximately (1)-(2)% year onyear as it laps last year's exceptional growth.
• Currency-neutral adjusted earnings per share for the full year is unchanged from the prior quarter, estimated to increase by approximately+1-2% year on year.
• Net cash provided by operating activities is unchanged from prior quarter, expected to finish 2021 at approximately $1.6 - $1.7 billion, withcapital expenditure of approximately $0.5 billion. As a result, our non-GAAP measure for cash flow is estimated at $1.1 - $1.2 billion.
Excluded from this guidance are any significant supply chain or other prolonged market disruptions related to the pandemic, global economy or otherunexpected events in the second half of 2021.
We are unable to reasonably estimate the potential full-year financial impact of mark-to-market adjustments because these impacts are dependenton future changes in market conditions. Similarly, because of volatility in foreign exchange rates and shifts in country mix of our internationalearnings, we are unable to reasonably estimate the potential full-year financial impact of foreign currency translation. As a result, these impacts are not included in the guidance provided. Therefore, we are unable to provide a full reconciliation of these non-GAAPmeasures used in our guidance without unreasonable effort as certain information necessary to calculate such measure on a GAAP basis isunavailable, dependent on future events outside of our control and cannot be predicted without unreasonable efforts by the Company.
See the table below that outlines the projected impact of certain other items that are excluded from non-GAAP guidance for 2021:Impact of certain items excluded from Non-GAAP guidance: Net Sales Operating Profit Earnings Per ShareBusiness and portfolio realignment (pre-tax) $30-$40M $0.09-$0.12Income tax impact applicable to adjustments, net** ~$0.03UK tax rate change $0.07Currency-neutral adjusted guidance* ~(1)-(2)% ~1-2%Organic guidance* ~0-1%
* 2021 full year guidance for net sales, operating profit, and earnings per share are provided on a non-GAAP basis only because certain information necessary to calculatesuch measures on a GAAP basis is unavailable, dependent on future events outside of our control and cannot be predicted without unreasonable efforts by the Company.These items for 2021 include impacts of mark-to-market adjustments for pension plans (service cost, interest cost, expected return on plan assets, and other net periodicpension costs are not excluded), commodities and certain foreign currency contracts. The Company is providing quantification of known adjustment items where available.
** Represents the estimated income tax effect on the reconciling items, using weighted-average statutory tax rates, depending upon the applicable jurisdiction.
Reconciliation of Non-GAAP amounts - Cash Flow Guidance(billions) Full Year 2021Net cash provided by (used in) operating activities $1.6-$1.7Additions to properties ~($0.5)Cash Flow $1.1-$1.2
40

Table of Contents
Forward-looking statementsThis Report contains “forward-looking statements” with projections concerning, among other things, the Company’s restructuring programs, theintegration of acquired businesses, our strategy, financial principles, and plans, initiatives, improvements and growth; sales, margins, advertising,promotion, merchandising, brand building, operating profit, and earnings per share; innovation; investments; capital expenditures, asset write-offsand expenditures and costs related to productivity or efficiency initiatives; the impact of accounting changes and significant accounting estimates;our ability to meet interest and debt principal repayment obligations; minimum contractual obligations; future common stock repurchases or debtreduction, effective income tax rate; cash flow and core working capital improvements; interest expense; commodity and energy prices; andemployee benefit plan costs and funding. Forward-looking statements include predictions of future results or activities and may contain the words“expect,” “believe,” “will,” “can,” “anticipate,” “estimate,” “project,” “should,” or words or phrases of similar meaning. For example, forward-lookingstatements are found in this Item 1 and in several sections of Management’s Discussion and Analysis. Our actual results or activities may differmaterially from these predictions. Our future results could be affected by a variety of other factors, including uncertainty of the magnitude, duration, geographic reach, impact on theglobal economy and current and potential travel restrictions of the COVID-19 outbreak, the current, and uncertain future, impact of the COVID-19 outbreak on our business, growth, reputation, prospects, financial condition, operating results (including components of our financial results), andcash flows and liquidity, the expected benefits and costs of the divestiture of selected cookies, fruit and fruit flavored-snacks, pie crusts, and ice-cream cones businesses of the Company, risks relating to any unforeseen changes to or effects on liabilities, future capital expenditures, revenues,expenses, earnings, synergies, indebtedness, financial condition, losses and future prospects, the ability to implement restructuring as planned,whether the expected amount of costs associated with restructuring will differ from forecasts, whether we will be able to realize the anticipatedbenefits from restructuring in the amounts and times expected, the ability to realize the anticipated benefits and synergies from business acquisitionsin the amounts and at the times expected, the impact of competitive conditions, the effectiveness of pricing, advertising, and promotional programs;the success of innovation, renovation and new product introductions; the recoverability of the carrying value of goodwill and other intangibles, thesuccess of productivity improvements and business transitions, commodity and energy prices, transportation costs, labor costs, disruptions orinefficiencies in supply chain, the availability of and interest rates on short-term and long-term financing, actual market performance of benefit plantrust investments, the levels of spending on systems initiatives, properties, business opportunities, integration of acquired businesses, and othergeneral and administrative costs, changes in consumer behavior and preferences, the effect of U.S. and foreign economic conditions on items suchas interest rates, statutory tax rates, currency conversion and availability, legal and regulatory factors including changes in food safety, advertisingand labeling laws and regulations, the ultimate impact of product recalls; business disruption or other losses from war, terrorist acts or politicalunrest; and the risks and uncertainties described in Item 1A below. Forward-looking statements speak only as of the date they were made, and weundertake no obligation to publicly update them.
Item 3. Quantitative and Qualitative Disclosures about Market RiskOur Company is exposed to certain market risks, which exist as a part of our ongoing business operations. We use derivative financial andcommodity instruments, where appropriate, to manage these risks. Refer to Note 6 within Notes to Consolidated Financial Statements for furtherinformation on our derivative financial and commodity instruments.
Refer to disclosures contained within Item 7A of our 2020 Annual Report on Form 10-K. Other than changes noted here, there have been nomaterial changes in the Company’s market risk as of July 3, 2021.
Volatile market conditions arising from the COVID-19 pandemic may result in significant changes in foreign exchange rates, and in particular aweakening of foreign currencies relative to the U.S. dollar may negatively affect our net sales and operating profit when translated to U.S. dollars. Primary exposures include the U.S. dollar versus the euro, British pound, Australian dollar, Canadian dollar, Mexican peso, Brazilian real, Nigeriannaira, Russian ruble and Egyptian pound, and in the case of inter-subsidiary transactions, the British pound versus the euro. There is significantuncertainty surrounding the impact of COVID-19 on financial markets and we will continue to monitor the business for adverse impacts related to thepandemic.
41

Table of Contents
In May of 2021, the Company issued €300 million (approximately $353 million at July 3, 2021), which reflects the discount, fees and translationadjustments of eight-year 0.50% Euro Notes due 2029, resulting in net proceeds of €298 million after discount and underwriting commissions. Inconnection with this debt issuance, the Company terminated forward starting interest rate swaps with notional amounts totaling €250 million,resulting in a $6 million gain. These forward starting interest rate swaps were accounted for as cash flow hedges and the related gain was recordedin accumulated other comprehensive income and will be amortized to interest expense over the term of the Notes.
During the year-to-date period ended July 3, 2021, we entered into interest rate contracts with notional amounts totaling $450 million. The interestrate contracts are designated as fair value hedges of certain U.S. Dollar debt. We have interest rate contracts with notional amounts totaling $2.8billion representing a net settlement receivable of $85 million as of July 3, 2021. We had interest rate contracts with notional amounts totaling $2.6billion representing a net settlement receivable of $46 million as of January 2, 2021.
During the quarter ended July 3, 2021, we settled cross currency swaps with notional amounts totaling €565 million, resulting in a loss of $7 million.These cross currency swaps were accounted for as net investment hedges and the related loss was recorded in accumulated other comprehensiveincome. During the quarter ended July 3, 2021, we also entered into cross currency swaps with notional amounts totaling €565 million, as hedgesagainst foreign currency volatility associated with our net investment in our wholly-owned foreign subsidiaries. These swaps were designated as netinvestment hedges. We have cross currency swaps with notional amounts totaling $1.4 billion outstanding as of July 3, 2021 representing a netsettlement receivable of $22 million. The total notional amount of cross currency swaps outstanding as of January 2, 2021 was $1.4 billionrepresenting a net settlement obligation of $4 million.
Item 4. Controls and ProceduresWe maintain disclosure controls and procedures that are designed to ensure that information required to be disclosed in our Exchange Act reports isrecorded, processed, summarized and reported within the time periods specified in the SEC’s rules and forms, and that such information isaccumulated and communicated to our management, including our chief executive officer and chief financial officer as appropriate, to allow timelydecisions regarding required disclosure under Rules 13a-15(e) and 15d-15(e). Disclosure controls and procedures, no matter how well designed andoperated, can provide only reasonable, rather than absolute, assurance of achieving the desired control objectives.
As of July 3, 2021, we carried out an evaluation under the supervision and with the participation of our chief executive officer and our chief financialofficer, of the effectiveness of the design and operation of our disclosure controls and procedures.
Based on the foregoing, our chief executive officer and chief financial officer concluded that our disclosure controls and procedures were effective atthe reasonable assurance level.
42

Table of Contents
KELLOGG COMPANYPART II — OTHER INFORMATION
Item 1A. Risk Factors
There have been no material changes in our risk factors from those disclosed in Part I, Item 1A to our Annual Report on Form 10-K for the fiscalyear ended January 2, 2021. The risk factors disclosed under those Reports in addition to the other information set forth in this Report, couldmaterially affect our business, financial condition, or results. Additional risks and uncertainties not currently known to us or that we deem to beimmaterial could also materially adversely affect our business, financial condition, or results.
Item 2. Unregistered Sales of Equity Securities and Use of ProceedsIn February 2020, the board of directors approved an authorization to repurchase up to $1.5 billion of the Company's common stock throughDecember 2022. These authorizations are intended to allow the Company to repurchase shares for general corporate purposes and to offsetissuances for employee benefit programs.
The following table provides information with respect to purchases of common shares under programs authorized by our board of directors duringthe quarter ended July 3, 2021.
(c) Issuer Purchases of Equity Securities(millions, except per share data)
Period
(a) Total Number of Shares Purchased
(b) Average Price Paid Per Share
(c) Total Number of Shares
Purchased as Part of Publicly
Announced Plans or Programs
(d) Approximate Dollar Value of
Shares that May Yet Be
Purchased Under the Plans
or ProgramsMonth #1:4/4/2021 - 5/1/2021 — $ — — $ 1,260 Month #2:5/2/2021 - 5/29/2021 — $ — — $ 1,260 Month #3:5/30/2021 - 7/3/2021 — $ — — $ 1,260 Total — $ — —
Item 6. Exhibits(a) Exhibits: 4.1 Officers’ Certificate of Kellogg Company (with form of 0.500% Senior Notes due 2029), incorporated by
reference to Exhibit 4.1 of our Current Report on Form 8-K dated May 20, 2021, Commission file number 1-4171.
31.1 Rule 13a-14(e)/15d-14(a) Certification from Steven A. Cahillane31.2 Rule 13a-14(e)/15d-14(a) Certification from Amit Banati32.1 Section 1350 Certification from Steven A. Cahillane32.2 Section 1350 Certification from Amit Banati101.INS XBRL Instance Document101.SCH XBRL Taxonomy Extension Schema Document101.CAL XBRL Taxonomy Extension Calculation Linkbase Document101.DEF XBRL Taxonomy Extension Definition Linkbase Document101.LAB XBRL Taxonomy Extension Label Linkbase Document101.PRE XBRL Taxonomy Extension Presentation Linkbase Document
43

Table of Contents
KELLOGG COMPANYSIGNATURES
Pursuant to the requirements of the Securities Exchange Act of 1934, the registrant has duly caused this report to be signed on its behalf by theundersigned thereunto duly authorized.
KELLOGG COMPANY
/s/ Amit BanatiAmit BanatiPrincipal Financial Officer; Senior Vice President and Chief Financial Officer
/s/ Kurt ForcheKurt ForchePrincipal Accounting Officer; Vice President and Corporate Controller
Date: August 6, 2021
44

Table of Contents
KELLOGG COMPANYEXHIBIT INDEX
Exhibit No. Description
Electronic (E) Paper (P) Incorp. By Ref. (IBRF)
4.1 Officers’ Certificate of Kellogg Company (with form of 0.500% Senior Notes due 2029), incorporatedby reference to Exhibit 4.1 of our Current Report on Form 8-K dated May 20, 2021, Commission filenumber 1-4171.
IBRF
31.1 Rule 13a-14(e)/15d-14(a) Certification from Steven A. Cahillane E31.2 Rule 13a-14(e)/15d-14(a) Certification from Amit Banati E32.1 Section 1350 Certification from Steven A. Cahillane E32.2 Section 1350 Certification from Amit Banati E101.INS XBRL Instance Document E101.SCH XBRL Taxonomy Extension Schema Document E101.CAL XBRL Taxonomy Extension Calculation Linkbase Document E101.DEF XBRL Taxonomy Extension Definition Linkbase Document E101.LAB XBRL Taxonomy Extension Label Linkbase Document E101.PRE XBRL Taxonomy Extension Presentation Linkbase Document E
45

Exhibit 31.1
CERTIFICATION
I, Steven A. Cahillane, certify that:
1. I have reviewed this quarterly report on Form 10-Q of Kellogg Company;
2. Based on my knowledge, this report does not contain any untrue statement of a material fact or omit to state a material fact necessary tomake the statements made, in light of the circumstances under which such statements were made, not misleading with respect to the period coveredby this report;
3. Based on my knowledge, the financial statements, and other financial information included in this report, fairly present in all materialrespects the financial condition, results of operations and cash flows of the registrant as of, and for, the periods presented in this report;
4. The registrant’s other certifying officer(s) and I are responsible for establishing and maintaining disclosure controls and procedures (asdefined in Exchange Act Rules 13a-15(e) and 15d-15(e)) and internal control over financial reporting (as defined in Exchange Act Rules 13a-15(f)and 15d-15(f)) for the registrant and we have:
a) designed such disclosure controls and procedures, or caused such disclosure controls and procedures to be designed under our supervision, toensure that material information relating to the registrant, including its consolidated subsidiaries, is made known to us by others within thoseentities, particularly during the period in which this report is being prepared;
b) designed such internal control over financial reporting, or caused such internal control over financial reporting to be designed under oursupervision, to provide reasonable assurance regarding the reliability of financial reporting and the preparation of financial statements forexternal purposes in accordance with generally accepted accounting principles;
c) evaluated the effectiveness of the registrant’s disclosure controls and procedures and presented in this report our conclusions about theeffectiveness of the disclosure controls and procedures, as of the end of the period covered by this report based on such evaluation; and
d) disclosed in this report any change in the registrant’s internal control over financial reporting that occurred during the registrant’s most recentfiscal quarter (the registrant’s fourth fiscal quarter in the case of an annual report) that has materially affected, or is reasonably likely tomaterially affect, the registrant’s internal control over financial reporting; and
5. The registrant’s other certifying officer(s) and I have disclosed, based on our most recent evaluation of internal control over financialreporting, to the registrant’s auditors and the audit committee of the registrant’s board of directors (or persons performing the equivalent functions):
a) all significant deficiencies and material weaknesses in the design or operation of internal control over financial reporting which are reasonablylikely to adversely affect the registrant’s ability to record, process, summarize and report financial information; and
b) any fraud, whether or not material, that involves management or other employees who have a significant role in the registrant’s internal controlover financial reporting.
/s/ Steven A. CahillaneChairman and Chief Executive Officer
Date: August 6, 2021
Exhibit 31.2
CERTIFICATION
I, Amit Banati, certify that:
1. I have reviewed this quarterly report on Form 10-Q of Kellogg Company;
2. Based on my knowledge, this report does not contain any untrue statement of a material fact or omit to state a material fact necessary tomake the statements made, in light of the circumstances under which such statements were made, not misleading with respect to the period coveredby this report;
3. Based on my knowledge, the financial statements, and other financial information included in this report, fairly present in all materialrespects the financial condition, results of operations and cash flows of the registrant as of, and for, the periods presented in this report;
4. The registrant’s other certifying officer(s) and I are responsible for establishing and maintaining disclosure controls and procedures (asdefined in Exchange Act Rules 13a-15(e) and 15d-15(e)) and internal control over financial reporting (as defined in Exchange Act Rules 13a-15(f)and 15d-15(f)) for the registrant and we have:
a) designed such disclosure controls and procedures, or caused such disclosure controls and procedures to be designed under our supervision, toensure that material information relating to the registrant, including its consolidated subsidiaries, is made known to us by others within thoseentities, particularly during the period in which this report is being prepared;
b) designed such internal control over financial reporting, or caused such internal control over financial reporting to be designed under oursupervision, to provide reasonable assurance regarding the reliability of financial reporting and the preparation of financial statements forexternal purposes in accordance with generally accepted accounting principles;
c) evaluated the effectiveness of the registrant’s disclosure controls and procedures and presented in this report our conclusions about theeffectiveness of the disclosure controls and procedures, as of the end of the period covered by this report based on such evaluation; and
d) disclosed in this report any change in the registrant’s internal control over financial reporting that occurred during the registrant’s most recentfiscal quarter (the registrant’s fourth fiscal quarter in the case of an annual report) that has materially affected, or is reasonably likely tomaterially affect, the registrant’s internal control over financial reporting; and
5. The registrant’s other certifying officer(s) and I have disclosed, based on our most recent evaluation of internal control over financialreporting, to the registrant’s auditors and the audit committee of the registrant’s board of directors (or persons performing the equivalent functions):
a) all significant deficiencies and material weaknesses in the design or operation of internal control over financial reporting which are reasonablylikely to adversely affect the registrant’s ability to record, process, summarize and report financial information; and
b) any fraud, whether or not material, that involves management or other employees who have a significant role in the registrant’s internal controlover financial reporting.
/s/ Amit BanatiSenior Vice President and Chief Financial Officer
Date: August 6, 2021

Exhibit 32.1
SECTION 1350 CERTIFICATION
I, Steven A. Cahillane, hereby certify, on the date hereof, pursuant to 18 U.S.C. Section 1350, as adopted pursuant to Section 906 of theSarbanes-Oxley Act of 2002, that
(1) the Quarterly Report on Form 10-Q of Kellogg Company for the quarter ended July 3, 2021 (the “Report”) fully complies with therequirements of Section 13(a) or 15(d) of the Securities Exchange Act of 1934; and
(2) the information contained in the Report fairly presents, in all material respects, the financial condition and results of operations of KelloggCompany.
/s/ Steven A. CahillaneName: Steven A. CahillaneTitle: Chairman and Chief Executive Officer
A signed copy of this original statement required by Section 906 has been provided to Kellogg Company and will be retained by Kellogg Companyand furnished to the Securities and Exchange Commission or its staff on request.
Date: August 6, 2021

Exhibit 32.2
SECTION 1350 CERTIFICATION
I, Amit Banati, hereby certify, on the date hereof, pursuant to 18 U.S.C. Section 1350, as adopted pursuant to Section 906 of the Sarbanes-Oxley Act of 2002, that
(1) the Quarterly Report on Form 10-Q of Kellogg Company for the quarter ended July 3, 2021 (the “Report”) fully complies with therequirements of Section 13(a) or 15(d) of the Securities Exchange Act of 1934; and
(2) the information contained in the Report fairly presents, in all material respects, the financial condition and results of operations of KelloggCompany.
/s/ Amit BanatiName: Amit BanatiTitle: Senior Vice President and Chief Financial Officer
A signed copy of this original statement required by Section 906 has been provided to Kellogg Company and will be retained by Kellogg Companyand furnished to the Securities and Exchange Commission or its staff on request.
Date: August 6, 2021