Heavy metal distribution in the superficial bottom sediments of the Northern continental shelf of...
15
ORIGINAL ARTICLE Trace metal distribution in sediments of northern continental shelf of Crete Island, Eastern Mediterranean S. E. Poulos Æ C. G. Dounas Æ G. Alexandrakis Æ P. Koulouri Æ P. Drakopoulos Received: 3 June 2008 / Accepted: 17 September 2008 / Published online: 7 October 2008 Ó Springer-Verlag 2008 Abstract The present study investigates the distribution of trace metals (Zn, Hg, Cd, Cu, and Pb), as indicators of pollution, in the surficial offshore shelf sediments along the northern coast of Heraklion Prefecture (Crete, Mediterra- nean Sea). The concentrations and the spatial distribution of the different trace metals, in relation to the sedimento- logical characteristics and the water circulation pattern of the entire continental shelf, are associated with human inshore sources of pollutants located along the coastline of the study area. Although the trace metal concentrations measured are higher than the background values, they are not considered to be dangerous to human health, as they are lower than the standard values given by the World Health Organisation, with only a few localised exceptions. Fur- thermore, results reveal the important role of local hydrodynamism that moves fine-grained material and associated trace metals offshore (seawards to wave break- ing zone) and then transports them eastwards by entrapping them in the prevailing offshore shelf-water circulation. Keywords Trace metals Á Sediment Á Cretan shelf Á Pollution Á Human health Á Aegean Sea Introduction Trace metals found in coastal sediment may be derived from a variety of natural and anthropogenic sources (Bur- ridge et al. 1999). In most circumstances, the major part of the metal content in the water and the seabed sediments is anthropogenic and associated with terrestrial sources rela- ted to untreated municipal sewage (Shear et al. 1996; Isaac et al. 1997), industrial wastewaters (Majori et al. 1978), intensive aquaculture (Tovar et al. 2000), harbour activities (Tanner et al. 2000) as well as riverine fluxes loaded with urban and agricultural runoff (Pope et al. 1978; Granier et al. 1990). Relatively high metal contents are associated with finer- grained sediments, mainly clay and silt, which have high absorption capability due to their large specific surface area (Oakley et al. 1981; Cauwet 1987). Furthermore, a strong correlation exists between metals (e.g. Cu, Zn, Fe, Al, Mn, and Ni) and organic carbon content, implying either a primary relationship with grain size (i.e. complexation, adsorption on clay minerals) or a secondary one, as carbon content increases with increasing mud content (Loring 1982; Calvert et al. 1985). Several studies have been undertaken in the region of Aegean Sea for the determination of trace metals, as indicators of pollution, in coastal sediments. However, most of these studies were undertaken in semi-enclosed river-dominated embayments, such as Evoikos Gulf (Scoullos and Dassenakis 1983; Angelidis and Aloupi 2000), Elefsis Gulf (Scoulos 1983), Pagasitikos Gulf (Voutsinou-Taliadouri and Satsmadjis 1982), the inner part S. E. Poulos (&) Á G. Alexandrakis Department of Geography and Climatology, Faculty of Geology and Geoenvironment, National and Kapodistrian University of Athens, Panepistimioupoli, Zografou, 157 84 Attica, Greece e-mail: [email protected] C. G. Dounas Á P. Koulouri Hellenic Centre for Marine Research, Institute of Marine Biology and Genetics, Gournes Pediados, P.O. Box 2214, 71003 Heraklion, Crete, Greece P. Drakopoulos Department of Optics, Technological Education Institute of Athens, Athens, Greece 123 Environ Geol (2009) 58:843–857 DOI 10.1007/s00254-008-1560-1
Transcript of Heavy metal distribution in the superficial bottom sediments of the Northern continental shelf of...
ORIGINAL ARTICLE
Trace metal distribution in sediments of northern continentalshelf of Crete Island, Eastern Mediterranean
S. E. Poulos Æ C. G. Dounas Æ G. Alexandrakis ÆP. Koulouri Æ P. Drakopoulos
Received: 3 June 2008 / Accepted: 17 September 2008 / Published online: 7 October 2008
� Springer-Verlag 2008
Abstract The present study investigates the distribution
of trace metals (Zn, Hg, Cd, Cu, and Pb), as indicators of
pollution, in the surficial offshore shelf sediments along the
northern coast of Heraklion Prefecture (Crete, Mediterra-
nean Sea). The concentrations and the spatial distribution
of the different trace metals, in relation to the sedimento-
logical characteristics and the water circulation pattern of
the entire continental shelf, are associated with human
inshore sources of pollutants located along the coastline of
the study area. Although the trace metal concentrations
measured are higher than the background values, they are
not considered to be dangerous to human health, as they are
lower than the standard values given by the World Health
Organisation, with only a few localised exceptions. Fur-
thermore, results reveal the important role of local
hydrodynamism that moves fine-grained material and
associated trace metals offshore (seawards to wave break-
ing zone) and then transports them eastwards by entrapping
them in the prevailing offshore shelf-water circulation.
Keywords Trace metals � Sediment � Cretan shelf �Pollution � Human health � Aegean Sea
Introduction
Trace metals found in coastal sediment may be derived
from a variety of natural and anthropogenic sources (Bur-
ridge et al. 1999). In most circumstances, the major part of
the metal content in the water and the seabed sediments is
anthropogenic and associated with terrestrial sources rela-
ted to untreated municipal sewage (Shear et al. 1996; Isaac
et al. 1997), industrial wastewaters (Majori et al. 1978),
intensive aquaculture (Tovar et al. 2000), harbour activities
(Tanner et al. 2000) as well as riverine fluxes loaded with
urban and agricultural runoff (Pope et al. 1978; Granier
et al. 1990).
Relatively high metal contents are associated with finer-
grained sediments, mainly clay and silt, which have high
absorption capability due to their large specific surface area
(Oakley et al. 1981; Cauwet 1987). Furthermore, a strong
correlation exists between metals (e.g. Cu, Zn, Fe, Al, Mn,
and Ni) and organic carbon content, implying either a
primary relationship with grain size (i.e. complexation,
adsorption on clay minerals) or a secondary one, as carbon
content increases with increasing mud content (Loring
1982; Calvert et al. 1985).
Several studies have been undertaken in the region of
Aegean Sea for the determination of trace metals, as
indicators of pollution, in coastal sediments. However,
most of these studies were undertaken in semi-enclosed
river-dominated embayments, such as Evoikos Gulf
(Scoullos and Dassenakis 1983; Angelidis and Aloupi
2000), Elefsis Gulf (Scoulos 1983), Pagasitikos Gulf
(Voutsinou-Taliadouri and Satsmadjis 1982), the inner part
S. E. Poulos (&) � G. Alexandrakis
Department of Geography and Climatology,
Faculty of Geology and Geoenvironment,
National and Kapodistrian University of Athens,
Panepistimioupoli, Zografou, 157 84 Attica, Greece
e-mail: [email protected]
C. G. Dounas � P. Koulouri
Hellenic Centre for Marine Research,
Institute of Marine Biology and Genetics,
Gournes Pediados, P.O. Box 2214,
71003 Heraklion, Crete, Greece
P. Drakopoulos
Department of Optics, Technological Education
Institute of Athens, Athens, Greece
123
Environ Geol (2009) 58:843–857
DOI 10.1007/s00254-008-1560-1
of Thermaikos Gulf (Fytianos and Vasilikiotis 1983),
Lesvos Island (Aloupi and Angelidis 2001; Gavriil and
Angelidis 2005), Gulf of Saros (Sarı and Cagatay 2001),
Gulluk Bay (Dalman et al. 2006). Similar studies associ-
ated with river influxes have also taken place in many other
coastal Mediterranean areas, e.g. coasts of Spain (Guieu
et al. 1991; Liquete et al. 2005), coasts of Israel (Herut and
Kress 1997; Goldsmith et al. 2001), Gulf of Lions (Morley
et al. 1990; Jeftic 1990; Nicolaou et al. 2006).
The present study investigates the distribution of trace
metals (Zn, Hg, Cd, Cu, and Pb), as indicators of pollution,
in the surficial shelf sediments along the northern coast of
Heraklion Prefecture (Crete), an area characterized by an
exceptionally well-developed tourist infrastructure not only
for Greece but also for the entire Eastern Mediterranean.
Moreover, trace metal spatial concentration is discussed in
relation with the prevailing sedimentological characteris-
tics, the shelf water circulation pattern and the different
potential terrestrial sources of pollutants, i.e. influxes of
several torrential rivers, the urban sewage outfalls of
Heraklion city and its industrial area and finally the Her-
aklion harbour. As the present study is based on a data set
collected in early 1990s (1991), it could be used for a
comparison of current and future changes in the environ-
mental status of this particular coastal area. Such changes
could be or may have been induced by the increased tourist
activities, the operation of biological treatment plant of
Heraklion metropolitan area and the operation of the outfall
of the major Electric Power Station of Crete.
The study area
Physical geography
The study area is part of the northern continental shelf of
Crete island, extending to depths between 10 and 70 m
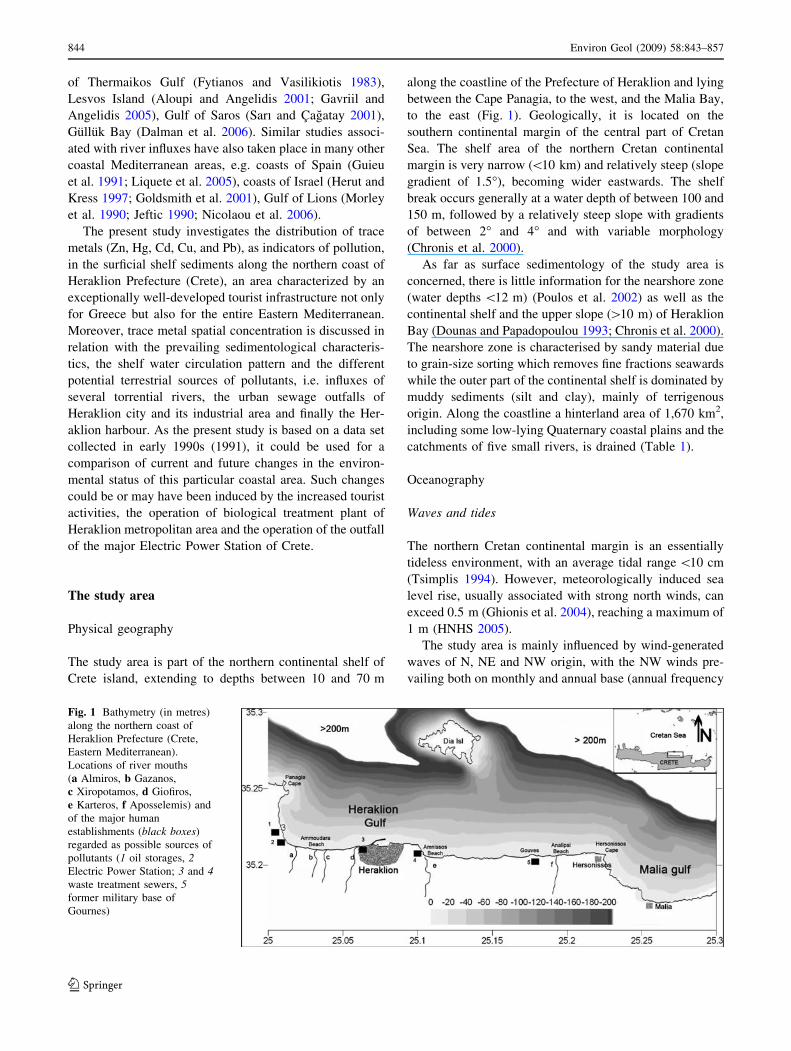
along the coastline of the Prefecture of Heraklion and lying
between the Cape Panagia, to the west, and the Malia Bay,
to the east (Fig. 1). Geologically, it is located on the
southern continental margin of the central part of Cretan
Sea. The shelf area of the northern Cretan continental
margin is very narrow (\10 km) and relatively steep (slope
gradient of 1.5�), becoming wider eastwards. The shelf
break occurs generally at a water depth of between 100 and
150 m, followed by a relatively steep slope with gradients
of between 2� and 4� and with variable morphology
(Chronis et al. 2000).
As far as surface sedimentology of the study area is
concerned, there is little information for the nearshore zone
(water depths \12 m) (Poulos et al. 2002) as well as the
continental shelf and the upper slope ([10 m) of Heraklion
Bay (Dounas and Papadopoulou 1993; Chronis et al. 2000).
The nearshore zone is characterised by sandy material due
to grain-size sorting which removes fine fractions seawards
while the outer part of the continental shelf is dominated by
muddy sediments (silt and clay), mainly of terrigenous
origin. Along the coastline a hinterland area of 1,670 km2,
including some low-lying Quaternary coastal plains and the
catchments of five small rivers, is drained (Table 1).
Oceanography
Waves and tides
The northern Cretan continental margin is an essentially
tideless environment, with an average tidal range \10 cm
(Tsimplis 1994). However, meteorologically induced sea
level rise, usually associated with strong north winds, can
exceed 0.5 m (Ghionis et al. 2004), reaching a maximum of
1 m (HNHS 2005).
The study area is mainly influenced by wind-generated
waves of N, NE and NW origin, with the NW winds pre-
vailing both on monthly and annual base (annual frequency
Fig. 1 Bathymetry (in metres)
along the northern coast of
Heraklion Prefecture (Crete,
Eastern Mediterranean).
Locations of river mouths
(a Almiros, b Gazanos,
c Xiropotamos, d Giofiros,
e Karteros, f Aposselemis) and
of the major human
establishments (black boxes)
regarded as possible sources of
pollutants (1 oil storages, 2Electric Power Station; 3 and 4waste treatment sewers, 5former military base of
Gournes)
844 Environ Geol (2009) 58:843–857
123
of 28.89%), except for the winter period (November to
January) when waves approach primarily from the North.
The highest predicted wind-generated waves, originat-
ing from the North, reach heights of up to 6 m with
corresponding periods of 11 s. The most frequent incoming
waves, from NW and NE, usually reach a height of usually
\1 m and last for periods of\5 s (Ghionis et al. 2004). On
the basis of the highest incoming waves, during storms, the
closure depth (which denotes the limit of the shore zone
with respect to the mobility of the seabed sediment), lies at
depths of 11.6, 4.7 and 3.5 m for the waves approaching
from the N, NE and NW directions, respectively. There-
fore, the offshore zone is considered as starting at water
depths [12 m.
Shelf water circulation
The northern coast of Crete is influenced by the variable
circulation of Cretan Sea which consists of a series of gyres,
eddies and small-scale structures, interconnected with cur-
rents and jets (Theocharis et al. 1999). Some of these
features are permanent and others seem to be transitional or
recurrent. The complex circulation pattern along with the
prevailing northerly and north-westerly winds, determines
the surface water mass transport of the inner shelf.
A synthesis of all existing information on the Cretan Sea
and its shelf circulation pattern (Theocharis et al. 1993;
Dounas and Papadopoulou 1993; Karakassis 1994; Drako-
poulos 1996; Kornilios et al. 1998; Theocharis et al. 1999;
Georgopoulos et al. 2000; Nittis et al. 2002; Cardin et al.
2003; Triantafyllou et al. 2003; Hamad et al. 2006) is sum-
marized in Fig. 2. Although the circulation pattern of the
study area is highly variable, some permanent features can be
identified. A permanent cyclonic gyre (Cretan cyclonic gyre)
is established at the eastern part of the Cretan Sea. During
high stratification conditions of the water column (observed
during the summer period and most of the winter periods
after 1994, Zervakis et al.1998), an anticyclone appears in
the central-western part of the Cretan Sea (West Cretan
anticyclone) and, with the Cretan cyclonic gyre, forms a
mesoscale dipole. The presence of this dipole results in a
south, southeastern flow towards the shelf. In winter, how-
ever, the cyclonic gyre usually appears enlarged and extends
to the central Cretan Sea. Thus, during periods of low anti-
cyclonicity, the flow over the shelf is E-SE becoming more
energetic when the anticyclone is present.
According to the above-mentioned observations, the
circulation along the north coast adjacent to Heraklion city
is mainly dictated by the general circulation pattern of the
Cretan Sea and the local bathymetry and to a lesser extent
by the prevailing wind conditions. Thus, during winter, the
S-SE flow over the shelf as it approaches to the coast is
topographically stirred to a clear eastward flow along iso-
baths. On the local scale a cyclonic eddy has been reported
within the western part of Heraklion Bay and an anticy-
clone in Malia Bay (Dounas and Papadopoulou 1993;
Karakassis 1994). In summer, depending on the position of
the dipole, the southward flow bifurcates near the coast and
can be both eastward and westward (Dounas and Papado-
poulou 1993). Finally, current metre records in the study
area showed that local currents are not very strong
(*10 cm/s) and 97% of the variability is along isobaths
(Nittis et al. 2002). On an annual basis, the net transport is
weak and towards the east, whilst spectral analysis indi-
cates that processes with periods of less than two days (e.g.
inertial currents, tidal currents, etc.) are energetically
insignificant with no effect on the local water circulation.
Human activities: potential sources of pollution
The coastal region under investigation, including Heraklion
city which is the administrative capital of Crete, is the most
important tourism centre of Crete. This area is also highly
industrialised. Among the various human infrastructures
and activities that influence coastal waters and associated
seabed sediment, the most important are the following: (1)
The Electric Power Station, which utilises sea water for
cooling, while tankers anchored at its nearshore area supply
crude oil; (2) the biological treatment plant of Heraklion
metropolitan area which during the sampling period dis-
charged waste waters in Giofiros river (1 km upstream of
its mouth); (3) the port of Heraklion, which is the third, as
far as commercial importance is concerned, in Greece and
one of the largest in the eastern Mediterranean; (4) the
mouths of five small rivers and a number of smaller
streams, which drain, in total, a hinterland area of about
1,700 km2, carrying urban wastes (originating from the
various inland villages), fertilisers and agrochemicals
produced by agricultural production, and wastes from
cattle-raising units; (5) the international airport of Herak-
lion, constructed very close to the coastline and with its
Table 1 Drainage area, maximum elevation and mean annual water
discharge of the fluvial systems discharging along the coastline of the
study area
Fluvial
systems
Area
(km2)
Water discharge
(106 m3/year)
Maximum
elevation (m)
Gazanos 192.0 15.6 380
Xiropotamos 35.0 – 280
Giofiros 279.0 21.6 428
Karteros 208.3 – –
Aposselemis 120.5 – 1,300
Other
streams
835.8 – \50
Total 1670.4
Environ Geol (2009) 58:843–857 845
123

main runway extending over Amnissos Bay; and (6) the
different tourist establishments built along and/or very
close to the coastline, being responsible for the pollution of
the nearshore waters (Fig. 1).
Data collection and analytical methods
Sampling procedure
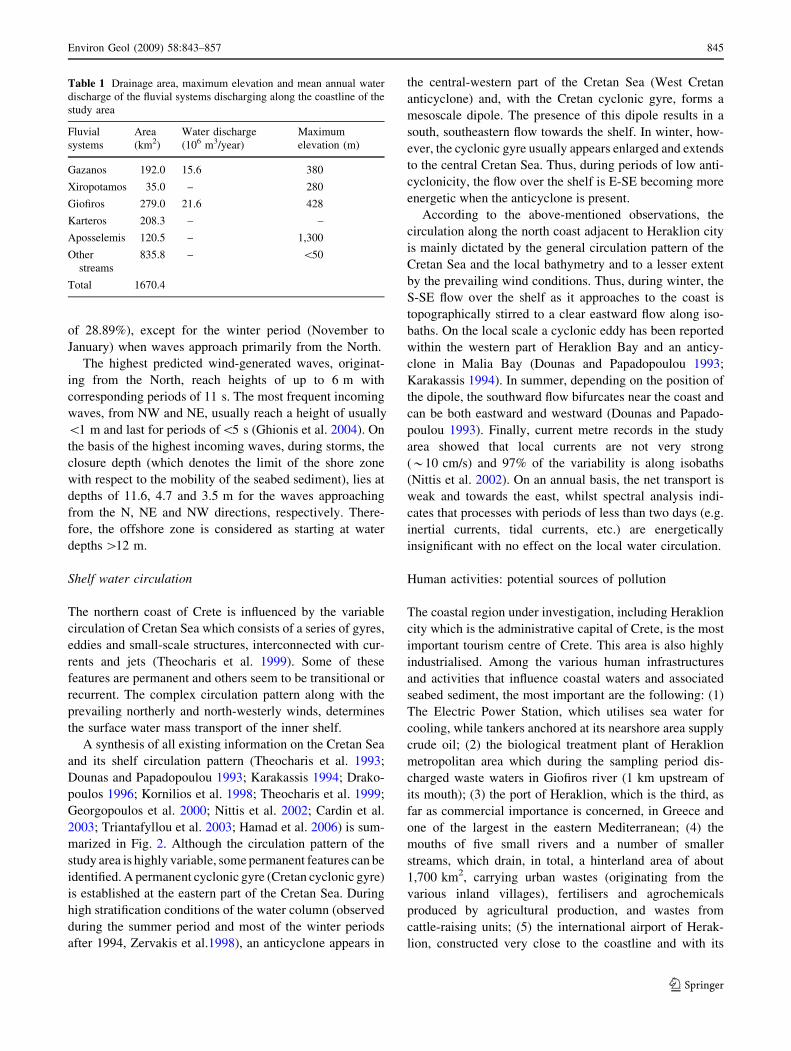
A field survey was carried out at 88 stations over 21
transects from 10 to 70 m depths perpendicular to the
coastline of Heraklion and Malia Bays (Fig. 3). Sampling
was carried out in September 1991 using the R/V Philia.
The positions of each station were calculated using a FU-
RUNO SFN-70 satellite navigator and depth was measured
by the SIMRAD K-400 echo sounder. At each station, a
single undisturbed sediment sample was taken using a
0.1 m2 top opening Smith McIntyre grab (Smith and
McIntyre 1954). Redox potential measurements were taken
at 1-cm increments using a conventional combined elec-
trode. From each sediment sample, three sub-samples of
surface sediment (0–2 cm) were collected by means of
plastic corers (2.2. cm diameter) for trace metals, chloro-
plastic pigment equivalent and particulate organic carbon
analysis as well as grain-size analysis. The sediment sub-
samples were frozen and stored on board at -20�C until
analysis upon return to the laboratory.
Laboratory analyses
In the laboratory the sediment samples were oven-dried at
60�C and after homogenization, representative portions of
the samples were separated for grain size analyses. The
standard sieve analysis technique (Folk 1980) was used to
determine the sand and mud (silt and clay) percentages, of
each of the surficial sediment samples. Chloroplastic pig-
ment equivalent (CPE) and particulate organic carbon
(POC) in sediment samples were determined according to
the techniques outlined by Strickland and Parsons (1972)
with the modifications described by Basford and Elefthe-
riou (1988).
For the determination of the heavy metals, sediment
samples were separated using a 63-lm plastic sieve, into
Fig. 2 Schematic presentation
of the upper thermohaline
circulation in Cretan Sea, during
the winter (a) and summer (b)
periods (dashed lines refer to
recurrent features)
846 Environ Geol (2009) 58:843–857
123
two classes: sand ([63 lm) and mud (\63 lm). This
approach permitted the quantitative analysis of metals in
both sand and mud (silt and clay) fractions and a satis-
factory degree of normalisation of the results, in order to
compare trace metal concentrations from samples of dif-
ferent granulometry. The total concentrations of heavy
metals (copper, zinc, mercury, lead and cadmium) in the
surface sediments were determined by means of Atomic
Absorption Spectrophotometry (AAS) with background
correction. The Graphite Furnace AAS was used in the
determination of copper, lead, cadmium and zinc levels and
the Cold Vapor AAS for the determination of mercury in
the prepared samples. The sediment samples were prepared
by freeze-drying, digestion with HNO3 65%: H2O2, cen-
trifugation and dilution with nanopure water. Together with
the samples, certified reference material from the Canadian
National Bureau of Standards (BCSS-1 and PACS-1) was
analysed in order to control the method used. During the
determination of heavy metals with AAS a matrix modifier
(NH4H2PO4 5%) was used. All the material used during the
analysis was precleaned with HNO3.
Statistical analyses
In order to examine to which extent the sediments are
polluted, the enrichment factor (Ef) has been calculated
(concentration of the metal/standard value of the metal for
the Mediterranean Sea according to World Health organi-
zation, WHO). Principal component analysis (PCA) was
performed, using Euclidean distances, in order to identify
any meaningful patterns and associations of the trace
metals and the most important environmental factors
measured across samples. Data were normalised prior to
analysis in order to have comparable (dimensionless)
scales. All variables were included at the same time in the
analysis since there was no high correlation between the
variables (q C 0.9) according to Spearman’s correlation
coefficient. Spearman’s coefficient was also applied in
order to explore any correlation between the PCA axes
scores and the values of the environmental data. These
relationships can largely contribute to the verification of
any significant pattern derived from PCA analysis. The
PRIMER v6 and STATISTICA statistical software pack-
ages were used for the above-mentioned data analyses.
Results and discussion
Sediment texture and redox potential
The grain-size distribution and relevant textural classifica-
tion of the surficial sediments of the continental shelf along
the coast of the study area is presented in Fig. 4 and also
tabulated in Appendix I. In relation to their sand and mud
(silt and clay) contents, the shelf surficial bottom sediments
can be divided into three sedimentary provinces: Province 1
(water depths\15 m), where the bed sediments were sandy
(sand content[90%); this zone more or less coincides with
the zone being under the influence of the incoming waves,
except for the offshore areas seaward to the mouth of River
Giofiros and Heraklion port as well as the promontory of
Cape Hersonissos, where the sandy bed reached 30 m of
water depth. Province 2, lying between depths of 20 and
40 m, has the characteristics of a transitional zone between
the nearshore sandy zone and the outer muddy shelf.
Province 3 (outer shelf), extending to water depths[40 m,
consisted of mud (silt and clay [90%); this dominance of
fine-grained material is related to the offshore distribution
of river plumes, wave-induced re-working and subsequent
offshore dispersion as well as the advection of fine material
by the inner shelf water circulation pattern.
Redox potential (Eh) showed positive values ranging
from 39 to 601 mV for the top 2 cm of sediment in the
study area (Appendix I). Surface sediment redox potential
values generally decreased with depth presenting high
values in the shallower part of the continental shelf of the
Fig. 3 Locations of (i)sampling stations (1–88), (ii)offshore reference station A;
(iii) river mouths (a–f) and (iv)
major coastal human activities
(1–5 black boxes) along the
northern coast of Heraklion
Prefecture
Environ Geol (2009) 58:843–857 847
123

study area (10 m), due to the strong hydrodynamism that
characterizes this zone, and lower values in the deeper part
(20–70 m). Most of the lowest values (\100 mV) were
observed over the western part of the area.
Particulate organic carbon and chloroplastic pigment
equivalent
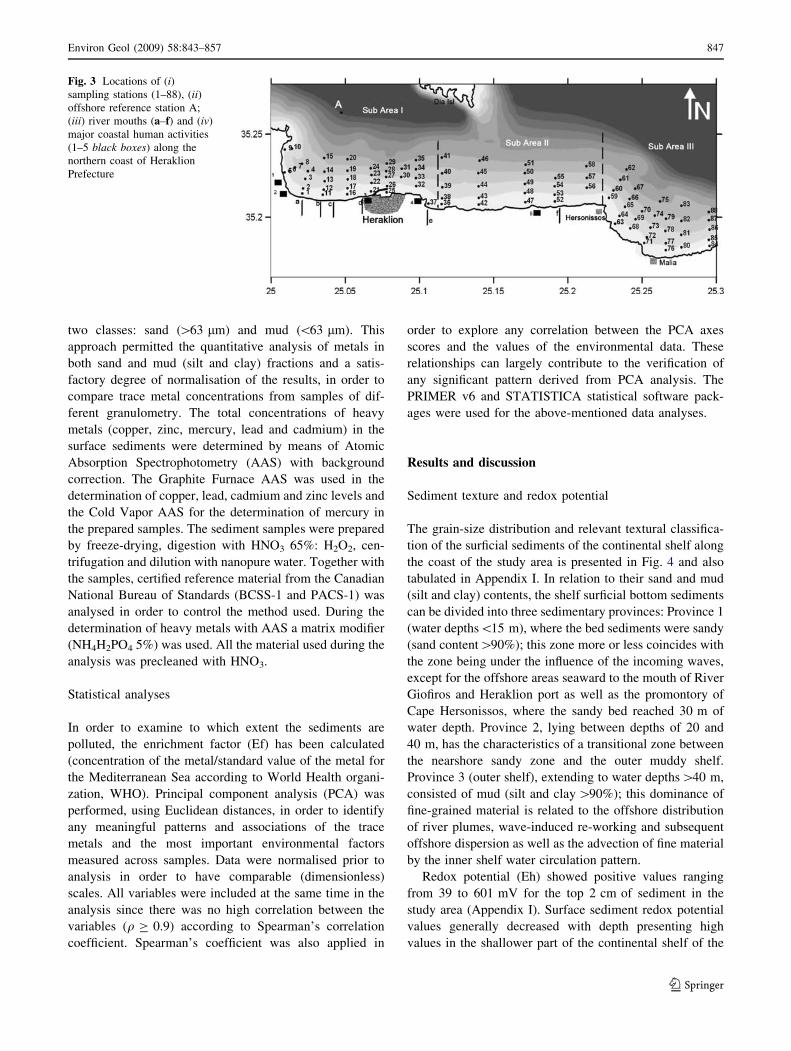
Particulate organic carbon content in surface sediments of
the study area varied between 0.02 and 10.13 mg/g, with
the majority of sediment samples presenting concentrations
\5 mg/g (Fig. 5a, Appendix I). The increasing POC con-
tent seawards indicates a strong association with fine-
grained sediments, while the overall low concentrations
throughout the study area denote the terrigenous origin of
the shelf sediment. Increased POC contents ([5 mg/g)
were observed over the western part of the study area and,
in some cases, over its central and eastern parts. These
relatively high concentrations may be related to local ter-
rigenous inputs (e.g. river fluxes) and the overall water
circulation pattern. The latter may be the cause of some
relatively high POC concentrations measured in Malia Bay,
favoured by the presence of the anticyclonic gyre (Fig. 2).
Chloroplastic pigment equivalent (CPE) in the surface
sediments of the study area ranged from 0.7 to 35 lg/g
with most of the samples presenting concentrations
\10 lg/g (Fig. 5b, Appendix I). The overall low concen-
trations of CPE were observed in the shallower part of the
continental shelf of the study area (10 m). The highest CPE
values were observed in the deeper zone of the study area
and especially over its western part.
Trace metals
Spatial distribution
Trace metal concentrations for all the surficial sediment
samples are tabulated in Appendix I and their minimum,
maximum as well as weighted-average values are given in
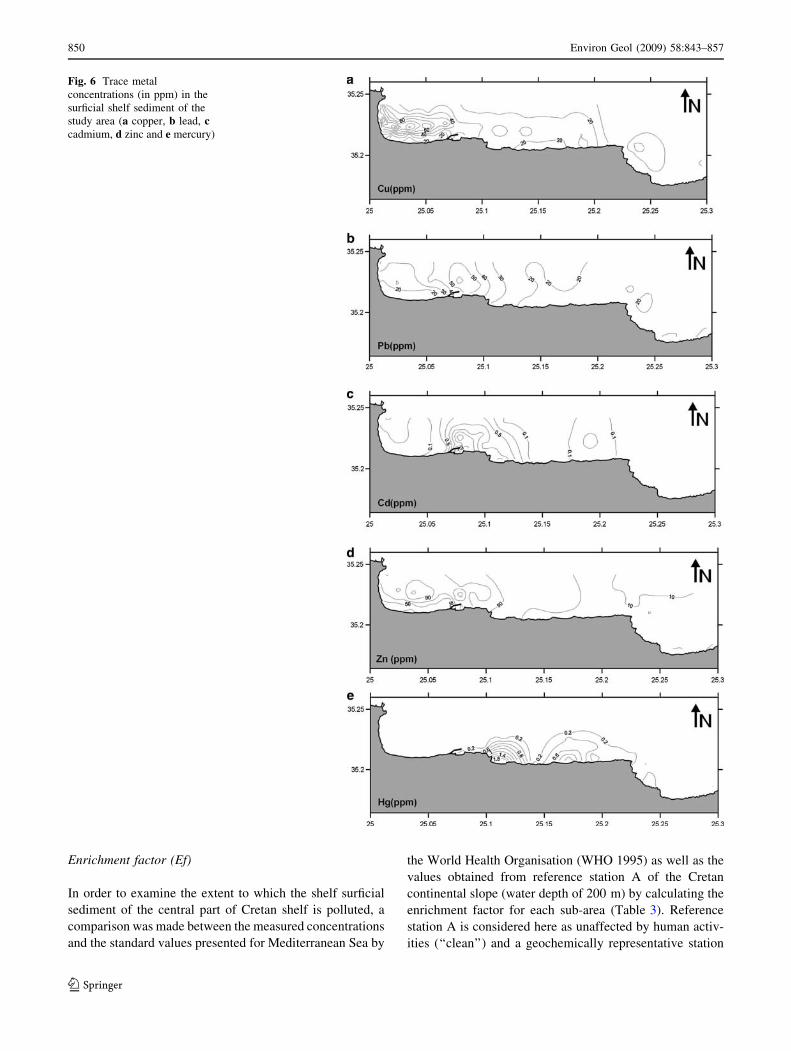
Table 2. In general, copper, lead and zinc showed the
highest concentrations at water depths of 20–40 m (Fig. 6).
In particular, copper showed the highest concentrations
in the western part of the study area (46–126 ppm) and in
water depths of 20–40 m (Fig. 6). These high values can be
attributed to the outfall of the Electric Power Station,
which is located at the backshore zone, and to cargo ships
carrying crude oil (Fig. 1). Over the central and eastern
parts of the study area, the Cu values were lower than
20 ppm, except for some locations presenting values of up
to 37 ppm most probably due to some localised terrestrial
inputs (i.e. anthropogenic influence) and to water circula-
tion, as in the case of the Malia Bay (depths of 30–40 m).
The highest concentrations of lead (40–60 ppm), zinc
(60–125 ppm) and cadmium (0.9–1.9 ppm) were measured
offshore of the zone extending along the coast of Heraklion
city and port (Fig. 6). Low values of these trace metals (Pb 8–
25 ppm, Zn 7–31 ppm, Cd 0.04–0.25 ppm) were observed at
the distal coastal areas to the west and the east of Heraklion
city, indicating areas of low human impact. Cadmium also
showed increased values in the area surrounding the harbour
of Heraklion city (1.22–1.86 ppm), being attributed to
intensive maritime activities (10 m depth).
Mercury showed high concentrations (0.5–2.0 ppm) at
the western end of the central part of the study area
(Fig. 6), and particularly in front of the outfall of the waste
treatment plant of the industrial zone of Heraklion city,
which is located at a water depth of about 10 m. The dis-
tribution pattern showed a second area of increased Hg
concentration (1.16 ppm) in front of the former military
base of Gournes in water depths of 10 m (Fig. 1) most
probably due to military wastes disposed locally.
According to the spatial distribution of trace metals
concentrations, the study area can be divided into three
sub-areas: the western (I), the central (II) and the eastern
(III) (Fig. 3):
Sub-area (I) is located over the western part of the area
under investigation, extending from Cape Panagia to Am-
nissos beach, where most of the main sources of potential
Fig. 4 The three sedimentary
provinces (1–3) according to the
spatial distribution of mud
(silt ? clay) percentages
848 Environ Geol (2009) 58:843–857
123
pollution are present, i.e. the sewage outfall of Heraklion
city, petrol storing facilities, the outfall of the Electricity
Power Station, the harbour zone and the urban waste
sewers. Over this section all of the metals examined, except
for Hg, presented the highest values and especially at water
depths of 20–40 m (Table 2). This sub-area can be divided
further into (a) the western part, where the main source of
trace metals is the Electricity Power Station and Cu pre-
sented the highest concentrations in water depths of 20–
40 m, decreasing eastwards and (b) the eastern part, where
pollutants were associated almost exclusively with the City
itself and the harbour (Pb, Zn and Cd presented the highest
values in this part).
Sub-area (II), extending from Amnissos beach to Hers-
onissos Cape (Fig. 3), where the coastal zone is
characterised generally by lower values of trace metals in
comparison with sub-area I (Table 2). An exception to this
general pattern is the distribution of Hg concentrations,
which presented here the highest values in two sites (1.16
and 1.92 ppm, respectively): in front of the former military
base of Gournes area and adjacent to the outfall of Her-
aklion industrial area. The latter being very close to the
coastline and at a water depth of 10 m (Fig. 1) appears to
pollute locally, without affecting the rest part and east-
ward-lying part of the sub-area II.
Sub-area III lies to the east of Cape Hersonissos and
Malia Bay (Fig. 3), which is associated with an anticyclonic
circulation of surface waters. Though trace metals con-
centrations generally showed the lowest values, there are no
great human infrastructures except for different tourist
establishments built along and/or very close to the coastline
in this sub-area; this is a consequence of the eastward-
moving waters (in sub-area II) and their subsequent
entrapment by the anticyclonic gyre of Malia Bay.
Fig. 5 Distribution of (a)
particulate organic carbon (POCin mg/g) and of (b) chloroplastic
pigment equivalent (CPE in lg/
g) in the surficial shelf sediment
of the study area
Table 2 Minimum, maximum and averaged values of trace metal concentrations (in ppm) in the three sub-areas and the study area as a whole
Sub-area I Sub-area II Sub area III Total study area
Min. Max. Aver. Min. Max. Aver. Min. Max. Aver. Min. Max. Aver.
Cu 13.65 126.10 46.20 3.01 37.30 21.68 2.07 29.5 8.39 2.07 126.1 27.11
Hg 0.03 0.21 0.06 0.04 2.04 0.50 0.03 0.25 0.11 0.03 2.04 0.19
Pb 10.40 63.00 34.99 10.31 33.26 20.44 8.26 25.79 14.33 8.26 63.00 24.26
Cd 0.04 1.86 0.44 0.04 0.97 0.25 0.04 0.10 0.07 0.04 1.86 0.27
Zn 29.63 125.32 72.24 7.99 50.01 31.66 6.89 32.4 15.93 6.89 125.32 42.74
Environ Geol (2009) 58:843–857 849
123
Enrichment factor (Ef)
In order to examine the extent to which the shelf surficial
sediment of the central part of Cretan shelf is polluted, a
comparison was made between the measured concentrations
and the standard values presented for Mediterranean Sea by
the World Health Organisation (WHO 1995) as well as the
values obtained from reference station A of the Cretan
continental slope (water depth of 200 m) by calculating the
enrichment factor for each sub-area (Table 3). Reference
station A is considered here as unaffected by human activ-
ities (‘‘clean’’) and a geochemically representative station
Fig. 6 Trace metal
concentrations (in ppm) in the
surficial shelf sediment of the
study area (a copper, b lead, ccadmium, d zinc and e mercury)
850 Environ Geol (2009) 58:843–857
123
for Cretan continental margin, where the study area is
included.
It is worth noticing the differences between the standard
values presented by WHO (1995) and those obtained from
Reference Station A (Table 3). The latter are characterised
by much lower values of Pb, Hg and Cd, by up to one order
of magnitude, than the standard values, while concentra-
tions of Cu and Zn were slightly higher (but less than 10%).
Table 3 Minimum, maximum and averaged values of enrichment factor of trace metal concentrations in each sub-area (S-A I, II and III) with
respect to standard values of the WHO (1995) and values calculated from the reference station (A) of the Cretan continental margin
WHO (1995) Reference station A
Metal Cu Pb Cd Zn Hg Cu Pb Cd Zn Hg
Standard values 13 38 1 45 0.3 16.77 0.23 0.13 48.49 0.03
S-A I Min. 1.05 0.27 0.04 0.66 0.11 0.81 1.30 0.27 0.61 1.10
Max. 9.70 1.66 1.86 2.78 0.69 7.52 7.88 14.31 2.58 6.93
Aver. 3.55 0.92 0.44 1.61 0.21 2.75 4.37 3.38 1.49 2.09
S-A II Min. 0.23 0.27 0.04 0.18 0.12 0.18 1.29 0.28 0.16 1.17
Max. 2.87 0.88 0.97 1.11 6.79 2.22 4.16 7.44 1.03 67.9
Aver. 1.67 0.54 0.25 0.70 1.65 1.29 2.56 1.90 0.65 16.53
S-A III Min. 0.16 0.22 0.00 0.15 0.11 0.12 1.03 0.00 0.14 1.13
Max. 2.27 0.68 0.1 0.72 0.82 1.76 3.22 0.75 0.67 8.20
Aver. 0.65 0.38 0.06 0.35 0.37 0.50 1.79 0.48 0.33 3.71
a
-4 -2 0 2
PC1
-6
-4
-2
0
2
PC2
st. 1st. 2
st. 3
st. 4 st. 5st. 6st. 7
st. 8st. 9
st. 10st. 11st. 12
st. 13
st. 14st. 15 st. 16
st. 17st. 18st. 19
st. 20
st. 21
st. 22st. 23
st. 24
st. 25
st. 26
st. 27
st. 28
st. 29
st. 30st. 31
st. 32st. 33
st. 34
st. 35
DepthEh
Mud
CPE
POC
Cu
HgPb
Cd
Zn
Sub-area I
b
-4 -2 0 2
PC1
-6
-4
-2
0
2
4
PC2
st. 59st. 60
st. 61
st. 62
st. 63
st. 64
st. 65
st. 66
st. 67
st. 68st. 69
st. 70 st. 71
st. 72
st. 73
st. 74
st. 75
st. 76
st. 77
st. 78
st. 79st. 80
st. 81
st. 82
st. 83
st. 84
st. 85
st. 86
st. 87
st. 88
Depth (m)
Eh (mV)
Mud (%)
CPE (µg/g)POC (mg/g)
Cu (ppm)
Hg (ppm)Pb (ppm)Cd (ppm)Zn (ppm)
Sub-area III
c
-6 -2 0 2 4
PC1
-4
-2
0
2
PC2
st. 36
st. 37st. 38
st. 39 st. 40
st. 41
st. 42
st. 43
st. 44st. 45
st. 46
st. 47
st. 48
st. 49st. 50
st. 51
st. 52st. 53
st. 54 st. 55
st. 56st. 57
st. 58
Depth
Eh
Mud CPE
POCCu Hg
Pb
Cd Zn
Sub-area II
4
4
-4
4
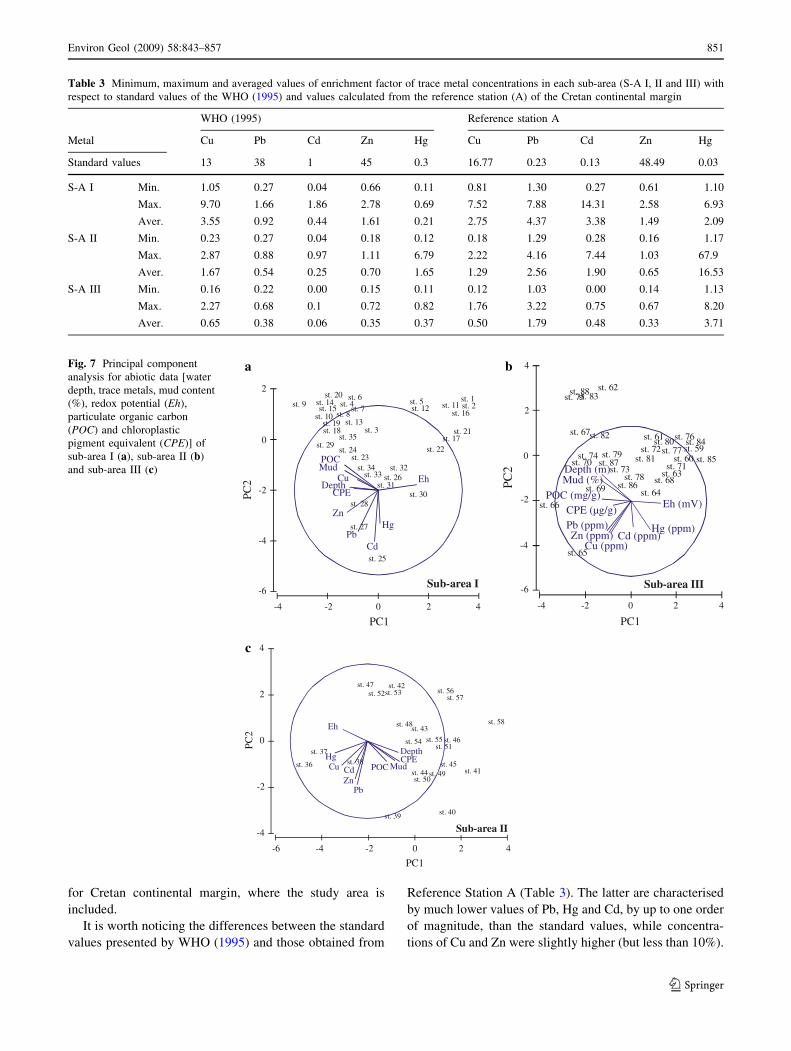
Fig. 7 Principal component
analysis for abiotic data [water
depth, trace metals, mud content
(%), redox potential (Eh),
particulate organic carbon
(POC) and chloroplastic
pigment equivalent (CPE)] of
sub-area I (a), sub-area II (b)
and sub-area III (c)
Environ Geol (2009) 58:843–857 851
123

Taking into account WHO values, sub-area I may be
regarded as affected by pollution, with most of the Ef
values being above unity ([1) with the exception of Hg,
presenting 0.69 as maximum and 0.21 as averaged Ef
values. Sub-area II presented Ef factors [1 only for Cu
(max. 2.87, aver. 1.67) and Hg (max. 6.79, aver. 1.65),
while sub-area III appears to be the ‘cleanest’ region,
characterised by the lowest values of enrichment factor,
except for the maximum value of Cu (max. 2.27).
With respect to the values obtained from the Reference
Station A, most of the Ef values, were[1, especially for the
first and second sub-areas, i.e. the western and central parts
of the study area. The fact that all the shelf sediment pre-
sented high concentrations of trace metals, in comparison
with the ones obtained from Station A (upper continental
slope), indicates the presence of pollutants in the study area,
but within the safe limits according to human health
established by WHO (1995). Exceptions to this general
situation are a few ‘hot spots’ located in the inshore zone.
Principal component analysis
In order to investigate further the relationship between the
observed trace metal concentrations and the prevailing
environmental conditions (e.g. bathymetry, sedimentolog-
ical characteristics) as well as the potential anthropogenic
sources of pollution, PCA for abiotic data of each sub-area
was applied separately (Fig. 7).
As far as sub-area I is concerned PCA showed that the
first principal component axe was characterized by the
opposition between redox potential and mud percentage
and organic carbon along with depth, accounted for almost
37% of the variability (Tables 4, 5). The second axe,
characterized by Pb and Cd concentrations, accounted for
an additional 24% of the variability and the third principal
component axe, characterized by Cu concentrations,
accounted for an additional 15% of the variability
(Tables 4, 5). Results for sub-area I showed that the deeper
muddy stations (30–70 m) grouped in the upper left part of
the PCA graph were mainly associated with increased POC
and Cu concentrations. The highest concentrations of Pb
were particularly present in the stations of intermediate
depth (20–40 m) and lower concentrations in the deeper
muddy ones. Additionally, increased Cd concentrations
were present in the stations of intermediate depth of Her-
aklion port (positioned in the lower part of the graph)
probably due to intensive maritime activities. Shallow
sandy stations (10–20 m) characterized by the highest
values of redox potential and present in the upper right part
of the graph were not really associated with high trace
metal concentrations.
For sub-area II, the first two axes of PCA explained 67%
of the total variance (Tables 4, 5). The first axis accounted
for 40% of the total variance, opposed depth and mud
percentage on one side and Hg concentrations on the other,
while the second axis was characterized by Pb and Zn
concentrations (27% of the variability). In this sub-area
PCA analysis showed that increased Hg concentrations
were present in the shallow sandy stations in front of the
former military base of Gournes area and adjacent to the
outfall of Heraklion industrial area positioned in the left
part of the graph. On the other hand, increased Pb and Zn
concentrations were generally associated with muddy
deeper stations and also with the sandy and muddy stations
of the western part of the area (positioned in the lower part
of the graph).
Finally, for sub-area III the first two axes explained 63%
of the total variance (Tables 4, 5). The first axe was
characterized by the opposition between redox potential
and mud percentage and particulate organic carbon along
with depth (38% of the variability). The second axe was
characterized by Cu and Zn concentrations (25% of the
variability). Results derived from PCA analysis of this sub-
area revealed that muddy stations are associated with high
POC concentrations and positioned in the left part of the
graph, while the highest Cu and Zn concentrations were
associated with stations of intermediate depth (20–40 m)
and particularly of muddy sand bottoms (positioned in the
lower part of the graph).
Spearman’s coefficient verifies the different patterns
derived from PCA analysis for the three sub-areas (Table 6).
Table 4 Eigenvalues and % variation of PCA of the three sub-areas
(I, II and III)
PC Eigen-values Variation (%) Cumulative %
variation
Sub-area I
1 3.68 36.8 36.8
2 2.43 24.3 61.2
3 1.46 14.6 75.8
4 0.88 8.8 84.5
5 0.68 6.8 91.3
Sub-area II
1 4.03 40.3 40.3
2 2.69 26.9 67.2
3 1.08 10.8 78.0
4 0.78 7.8 85.8
5 0.59 5.9 91.7
Sub-area III
1 3.85 38.5 38.5
2 2.46 24.6 63.1
3 1.11 11.1 74.2
4 0.82 8.2 82.4
5 0.60 6.0 88.4
852 Environ Geol (2009) 58:843–857
123
The general pattern derived from PCA for all the three
sub-areas revealed that the finer-grained sediments in the
deeper zone of the study area were associated with
increased particulate organic carbon, while trace metal
distribution seem to be associated partly with granulometry
and partly with a few localised anthropogenic sources of
pollutants.
Conclusions
The coastal area between Heraklion and Malia Bays on
the basis of trace metals spatial distribution and the
position of the terrestrial sources of pollution is divided
into three distinct sub-areas: the western sub-area where
most of the main sources of pollution are located, the
central sub-area and the eastern sub-area. In the western
sub-area, increased Cu concentration is mainly associated
with the operation of the largest Electric Power Station of
Crete and Pb–Zn–Cd–Hg concentrations are induced by
the sewage of Heraklion City and the industrial zone. In
the central sub-area trace metal concentrations were lower
in comparison with the western sub-area, except for the
increased Hg concentrations found at the dumping site of
wastes in front of the former military base at Gournes.
Although the eastern sub-area presents the lowest values
of trace metal concentrations of the study area, it would
be expected to present even lower values because there
are no important sources of pollution there. Trace metal
concentrations in this area are probably found due to the
entrapment by the Malia anti-cyclone gyre of eastward
moving heavy metals.
The observed pattern of the environmental variables
measured in the study area reflects gradients in physical
conditions and refers to a transition from a ‘‘high energy’’
and a ‘‘stressed’’ sandy shallow environment to a deeper
and more stable muddy one, attributed mainly to natural
forcing like storms and winds, strength of currents and
turbidity. This is further supported by the low sediment
POC concentrations measured in the study area, which are
well below the lower critical point (\10 mg/g) corre-
sponding to coastal areas without organic loading and
associated stressors (Hyland et al. 2005). This environ-
mental setup corresponds to the erosion, high combustion
and deposition sedimentary coastal areas exposed to the
wave action described by Graf (1992).
The relatively low concentrations of heavy metals, even
in front of the industrialised part of the coastal area of
Heraklion Bay, reveal the significant role of coastal marine
processes (e.g. wave activity, shelf water circulation) that
serve the ‘self cleaning’ of the local coastal system. Trace
metals are transferred along with the fine-grained sediment
seawards to the wave breaking zone, where they becomeTa
ble
5E
igen
vec
tors
of
PC
Ao
fth
eth
ree
sub
-are
as(I
,II
and
III)
Eig
env
ecto
rsS
ub
-are
aI
Su
b-a
rea
IIS
ub
-are
aII
I
Var
iab
les
PC
1P
C2
PC
3P
C4
PC
5P
C1
PC
2P
C3
PC
4P
C5
PC
1P
C2
PC
3P
C4
PC
5
Dep
th(m
)-
0.3
46
0.0
35
-0
.54
40
.14
80
.13
50
.40
3-
0.1
48
0.3
34
0.1
08
-0
.38
7-
0.3
77
0.3
54
0.0
98
0.1
85
-0
.15
8
Eh
(mV
)0
.46
00
.06
7-
0.1
30
-0
.11
60
.06
9-
0.3
22
0.1
52
-0
.27
1-
0.4
85
-0
.52
20
.39
5-
0.0
29
0.2
31
0.2
68
-0
.30
8
Mu
d(%
)-
0.4
02
0.2
31
-0
.27
20
.18
00
.35
50
.41
8-
0.2
64
0.1
82
0.0
14
-0
.17
5-
0.4
05
0.2
92
-0
.10
20
.18
10
.21
8
CP
E(l
g/g
)-
0.2
95
0.0
26
0.1
31
-0
.82
8-
0.0
06
0.3
67
-0
.23
4-
0.1
22
-0
.21
50
.39
6-
0.2
33
-0
.04
80
.69
9-
0.3
39
-0
.41
5
PO
C(m
g/g
)-
0.3
99
0.2
99
0.0
87
-0
.20
70
.15
50
.24
7-
0.2
64
-0
.41
7-
0.5
90
0.1
05
-0
.38
30
.02
6-
0.0
85
0.6
10
-0
.28
2
Cu
(pp
m)
-0
.24
50
.13
30
.62
90
.19
8-
0.1
94
-0
.17
0-
0.2
88
-0
.59
10
.52
60
.14
0-
0.2
82
-0
.42
7-
0.2
48
-0
.13
8-
0.1
28
Hg
(pp
m)
0.0
25
-0
.39
10
.33
90
.04
30
.81
5-
0.4
23
-0
.15
20
.33
1-
0.1
80
0.1
05
0.2
60
-0
.38
5-
0.2
55
0.3
11
-0
.34
3
Pb
(pp
m)
-0
.23
8-
0.4
92
-0
.18
2-
0.1
24
-0
.27
4-
0.1
29
-0
.56
40
.11
1-
0.0
72
-0
.09
5-
0.3
07
-0
.39
60
.03
80
.00
5-
0.2
52
Cd
(pp
m)
-0
.04
6-
0.6
09
-0
.11
1-
0.1
14
-0
.02
3-
0.3
35
-0
.31
30
.33
5-
0.1
46
0.3
77
0.0
28
-0
.34
80
.54
30
.46
90
.54
0
Zn
(pp
m)
-0
.37
5-
0.2
61
0.1
80
0.3
67
-0
.22
3-
0.1
62
-0
.48
9-
0.0
99
0.1
54
-0
.44
5-
0.3
07
-0
.42
0-
0.0
89
-0
.19
70
.30
3
Eh
red
ox
po
ten
tial
,m
ud
=si
lt?
clay
,C
PE
chlo
rop
last
icp
igm
ent
equ
ival
ent,
PO
Cp
arti
cula
teo
rgan
icca
rbo
n
Environ Geol (2009) 58:843–857 853
123
subject to the eastward prevailing (offshore) shelf-water
circulation pattern; the latter seems to act both as a natural
barrier to their further seaward dispersion and as a ‘con-
duit’ that transports eastwards the suspensates, including
trace metals. The anti-cyclone gyre in Malia Bay by
entrapping the advected material presents locally low trace
metal concentrations.
The heavy metal concentrations in the surficial shelf
sediment along the northern coast of Heraklion Prefecture
are not considered to be dangerous for human health, as
they are lower than the standard WHO values, with only a
few localised exceptions.
Acknowledgments The authors are grateful for comments on the
manuscript made by Dr C. Arvanitidis and also for the critical reading
of the manuscript made by Mrs M. Eleftheriou.
Appendix I
Table 7
Table 6 Values of Spearman’s
correlation coefficient between
the scores of PCA analysis of
the three sub-areas (I, II and III)
and the normalized
environmental variables
(significant level q\ 0.001)
Eh redox potential;
mud = silt ? clay; CPEchloroplastic pigment
equivalent, POC particulate
organic carbon
Variables PC axis
(sub-area I)
q PC axis
(sub-area II)
q PC axis
(sub-area III)
q
Depth (m) 1 -0.8 1 ?0.9 1 -0.8
Eh (mV) 1 ?0.8 – 1 ?0.8
Mud (%) 1 -0.9 1 ?0.9 1 -0.9
CPE (lg/g) – – – – – –
POC (mg/g) 1 –0.8 – – 1 -0.8
Cu (ppm) 3 ?0.7 – – 2 -0.6
Hg (ppm) – – 1 -0.8 – –
Pb (ppm) 2 -0.8 2 -0.9 – –
Cd (ppm) 2 -0.9 – – – –
Zn (ppm) – – 2 -0.8 2 -0.6
Table 7 The water depth (m), redox potential (Eh in mV), percentage of mud (silt ? clay), chloroplastic pigment equivalent (CPE in lg/g),
particulate organic carbon (POC in mg/g) and trace metal concentrations (ppm) of each surficial sediment sample
Stations Depth (m) Eh (mV) Mud (%) CPE (lg/g) POC (mg/g) Cu (ppm) Hg (ppm) Pb (ppm) Cd (ppm) Zn (ppm)
1 10 326 3.91 1.1668 0.236 25.35 0.035 10.4 0.035 33.04
2 20 369 1.31 0.6864 0.323 28.83 0.04 12.17 0.077 38.53
3 30 161 13.91 6.8542 2.043 117.86 0.066 30.91 0.112 88.26
4 40 98 82.5 8.6745 7.042 49.12 0.052 29.81 0.183 59.04
5 10 241 11.1 1.4906 5.17 56.76 0.053 21.03 0.039 52.66
6 20 39 18.36 2.6793 7.002 126.1 0.043 20.19 0.063 77.48
7 30 54 48.22 6.0337 6.61 61.96 0.053 25.12 0.102 81.35
8 40 160 73.06 13.0231 7.002 53.71 0.067 27.41 0.278 80.09
9 20 49 44.58 34.931 10.126 89.91 0.044 42.25 0.095 74.82
10 40 48 68.16 13.9625 8.788 39.03 0.066 30.67 0.327 68.33
11 10 389 5.22 1.6582 3.098 16.68 0.055 14.77 0.061 31.07
12 20 134 8.25 3.0608 3.163 21.23 0.045 17.94 0.059 35.6
13 30 126 54.64 4.7789 3.39 99.18 0.067 26.13 0.085 102.81
14 40 64 86.18 2.1341 6.244 74.51 0.043 27.3 0.081 114.94
15 70 86 90.11 5.8318 4.101 28.37 0.033 28.05 0.047 89.52
16 10 353 2.25 1.0536 0.021 23.14 0.033 10.42 0.083 41.27
17 20 332 4.35 1.2202 0.797 31.05 0.131 12.16 0.097 48.54
18 30 70 87.21 3.3171 5.527 84.6 0.089 39.99 0.092 99.35
19 40 87 73.79 4.9051 6.365 59.41 0.056 40.73 0.079 101.52
20 70 111 96.78 9.7602 6.169 27.82 0.043 36.22 0.053 74.99
21 10 354 2.7 1.3468 0.052 13.65 0.046 29.33 0.286 29.63
854 Environ Geol (2009) 58:843–857
123
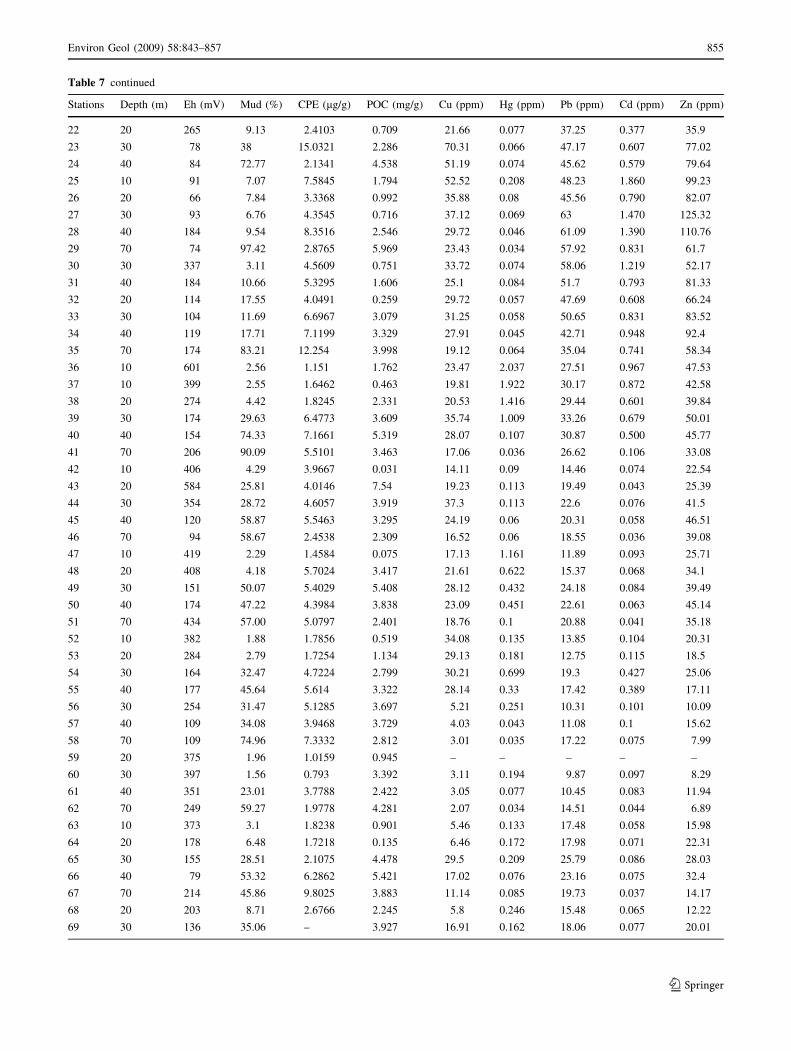
Table 7 continued
Stations Depth (m) Eh (mV) Mud (%) CPE (lg/g) POC (mg/g) Cu (ppm) Hg (ppm) Pb (ppm) Cd (ppm) Zn (ppm)
22 20 265 9.13 2.4103 0.709 21.66 0.077 37.25 0.377 35.9
23 30 78 38 15.0321 2.286 70.31 0.066 47.17 0.607 77.02
24 40 84 72.77 2.1341 4.538 51.19 0.074 45.62 0.579 79.64
25 10 91 7.07 7.5845 1.794 52.52 0.208 48.23 1.860 99.23
26 20 66 7.84 3.3368 0.992 35.88 0.08 45.56 0.790 82.07
27 30 93 6.76 4.3545 0.716 37.12 0.069 63 1.470 125.32
28 40 184 9.54 8.3516 2.546 29.72 0.046 61.09 1.390 110.76
29 70 74 97.42 2.8765 5.969 23.43 0.034 57.92 0.831 61.7
30 30 337 3.11 4.5609 0.751 33.72 0.074 58.06 1.219 52.17
31 40 184 10.66 5.3295 1.606 25.1 0.084 51.7 0.793 81.33
32 20 114 17.55 4.0491 0.259 29.72 0.057 47.69 0.608 66.24
33 30 104 11.69 6.6967 3.079 31.25 0.058 50.65 0.831 83.52
34 40 119 17.71 7.1199 3.329 27.91 0.045 42.71 0.948 92.4
35 70 174 83.21 12.254 3.998 19.12 0.064 35.04 0.741 58.34
36 10 601 2.56 1.151 1.762 23.47 2.037 27.51 0.967 47.53
37 10 399 2.55 1.6462 0.463 19.81 1.922 30.17 0.872 42.58
38 20 274 4.42 1.8245 2.331 20.53 1.416 29.44 0.601 39.84
39 30 174 29.63 6.4773 3.609 35.74 1.009 33.26 0.679 50.01
40 40 154 74.33 7.1661 5.319 28.07 0.107 30.87 0.500 45.77
41 70 206 90.09 5.5101 3.463 17.06 0.036 26.62 0.106 33.08
42 10 406 4.29 3.9667 0.031 14.11 0.09 14.46 0.074 22.54
43 20 584 25.81 4.0146 7.54 19.23 0.113 19.49 0.043 25.39
44 30 354 28.72 4.6057 3.919 37.3 0.113 22.6 0.076 41.5
45 40 120 58.87 5.5463 3.295 24.19 0.06 20.31 0.058 46.51
46 70 94 58.67 2.4538 2.309 16.52 0.06 18.55 0.036 39.08
47 10 419 2.29 1.4584 0.075 17.13 1.161 11.89 0.093 25.71
48 20 408 4.18 5.7024 3.417 21.61 0.622 15.37 0.068 34.1
49 30 151 50.07 5.4029 5.408 28.12 0.432 24.18 0.084 39.49
50 40 174 47.22 4.3984 3.838 23.09 0.451 22.61 0.063 45.14
51 70 434 57.00 5.0797 2.401 18.76 0.1 20.88 0.041 35.18
52 10 382 1.88 1.7856 0.519 34.08 0.135 13.85 0.104 20.31
53 20 284 2.79 1.7254 1.134 29.13 0.181 12.75 0.115 18.5
54 30 164 32.47 4.7224 2.799 30.21 0.699 19.3 0.427 25.06
55 40 177 45.64 5.614 3.322 28.14 0.33 17.42 0.389 17.11
56 30 254 31.47 5.1285 3.697 5.21 0.251 10.31 0.101 10.09
57 40 109 34.08 3.9468 3.729 4.03 0.043 11.08 0.1 15.62
58 70 109 74.96 7.3332 2.812 3.01 0.035 17.22 0.075 7.99
59 20 375 1.96 1.0159 0.945 – – – – –
60 30 397 1.56 0.793 3.392 3.11 0.194 9.87 0.097 8.29
61 40 351 23.01 3.7788 2.422 3.05 0.077 10.45 0.083 11.94
62 70 249 59.27 1.9778 4.281 2.07 0.034 14.51 0.044 6.89
63 10 373 3.1 1.8238 0.901 5.46 0.133 17.48 0.058 15.98
64 20 178 6.48 1.7218 0.135 6.46 0.172 17.98 0.071 22.31
65 30 155 28.51 2.1075 4.478 29.5 0.209 25.79 0.086 28.03
66 40 79 53.32 6.2862 5.421 17.02 0.076 23.16 0.075 32.4
67 70 214 45.86 9.8025 3.883 11.14 0.085 19.73 0.037 14.17
68 20 203 8.71 2.6766 2.245 5.8 0.246 15.48 0.065 12.22
69 30 136 35.06 – 3.927 16.91 0.162 18.06 0.077 20.01
Environ Geol (2009) 58:843–857 855
123

References
Aloupi M, Angelidis MO (2001) Geochemistry of natural and
anthropogenic metals in the coastal sediments of the island of
Lesvos, Aegean Sea. Environ Poll 113:211–219
Angelidis MO, Aloupi M (2000) River-transported pollution: south-
ern Evoikos Gulf, Greece. Mar Poll Bull 40(1):77–82
Basford D, Eleftheriou A (1988) The benthic environment of the
North Sea. J Mar Biol Assoc UK 68:125–141
Burridge LE, Doe K, Haya K, Jackman PM, Lindsoy G, Zitko V
(1999) Chemical analyses and toxicity tests on sediments under
Salmon Net Pens in the Bay of Fundy. Can Tech Rep Fish Aquat
Sci 2291:39
Cauwet G (1987) Influence of sedimentological features on the
distribution of trace metals in marine sediments. Mar Chem
22:221–234
Calvert SE, Mukherjee S, Morris RJ (1985) Trace metals in humic
and fulvic acids from modem organic-rich sediments. Oceanol
Acta 8:167–173
Cardin V, Gacic M, Nittis K, Kovacevic V, Perini L (2003) Sub-
inertial variability in the Cretan Sea from M3A buoy. Ann
Geophys 21:89–102
Chronis G, Lykousis V, Anagnostou C, Karageorgis A, Stavrakakis S,
Poulos S (2000) Sedimentological processes in the southern
margin of the Cretan Sea (NE Mediterranean). Prog Oceanogr
46:143–162
Dalman O, Demirak A, Balcı A (2006) Determination of heavy
metals (Cd, Pb) and trace elements (Cu, Zn) in sediments and
fish of the Southeastern Aegean Sea (Turkey) by atomic
absorption spectrometry. Food Chem 95:157–162
Drakopoulos PG (1996) Collection and analysis of ADCP data. In:
Hemleben R, Roether W, Stoffers P (eds) Meteor Cruise report,
Meteor Berichte, vol 96(4), pp 65–66
Dounas C, Papadopoulou K (1993) Oceanographic and environmental
study of Iraklion Bay. Technical report, Institute of Marine
Biology of Crete, Greece (in Greek)
Fytianos K, Vasilikiotis G (1983) Concentration of heavy metals in
seawater and sediments from the Northern Aegean Sea, Greece.
Chemosphere 12(1):83–91
Folk RL (1980) Petrology of sedimentary rocks. Hemphill, Austin, p
182
Gavriil AM, Angelidis MO (2005) Metal and organic carbon
distribution in water column of a shallow enclosed Bay at the
Aegean Sea Archipelago: Kalloni Bay, island of Lesvos, Greece.
Estuar Coastal Shelf Sci 64(2–3):200–210
Georgopoulos D, Chronis G, Zervakis V, Lykousis V, Poulos S, Iona
A (2000) Hydrology and circulation in the Southern Cretan Sea
during the CINCS experiment (May 1994–September 1995).
Prog Oceanogr 46:89–112
Goldsmith SL, Krom MD, Sandler A, Herut B (2001) Spatial trends in
the chemical composition of sediments on the continental shelf
and slope off the Mediterranean coast of Israel. Cont Shelf Res
21:1879–1900
Ghionis G, Poulos S, Bouziotopoulou N, Ntounas C (2004) The role of
a natural submerged breakwater in controlling the hydrodynamic
and sedimentological conditions of Ammoudara beach (Herak-
lion, Crete). Paper presented at the 7th Panhellenic geographical
conference, 14–17 October 2004, Mytilene (in Greek)
Graf G (1992) Benthic–pelagic coupling: a benthic view. Oceanogr
Mar Biol 30:149–190
Granier L, Chevreuil M, Carru AM, Lettole R (1990) Urban runoff
pollution by organochlorines (polychlorinated biphenyls and
lindane) and heavy metals (lead, zinc and chromium). Chemo-
sphere 21(9):1101–1107
Guieu C, Mouchel JM, Noel MH, Guan DM, Martin JM (1991) Flux
and behaviour of trace metals in the Ebro delta, Spain. Water
Poll Bull Rep 28:293–307
Hamad N, Millot C, Taupier-Letage J (2006) The surface circulation
in the eastern basin of the Mediterranean Sea. Sci Mar
70(3):457–503
Herut B, Kress N (1997) Particulate metals contamination in the
Kishon River estuary, Israel. Mar Poll Bull 34:706–711
Table 7 continued
Stations Depth (m) Eh (mV) Mud (%) CPE (lg/g) POC (mg/g) Cu (ppm) Hg (ppm) Pb (ppm) Cd (ppm) Zn (ppm)
70 40 148 63.02 8.5538 5.343 13.42 0.117 16.98 0.061 19.44
71 10 331 3.26 1.5554 1.941 7.89 0.162 11.51 0.061 12.86
72 20 169 4.35 1.9445 2.513 10.34 0.131 9.86 0.058 10.15
73 30 204 25.84 4.4621 3.058 19.32 0.079 12.73 0.05 25.32
74 40 154 74.6 3.3305 2.065 16.09 0.066 13.08 0.064 27.12
75 70 72 85.08 5.3721 4.214 9.17 0.035 10.71 – 12.68
76 10 381 2.6 1.9887 1.607 4.26 0.103 9.58 0.055 8.79
77 20 312 3.61 3.1175 1.296 3.38 0.087 10.07 0.079 13.06
78 30 232 6.6 8.1271 1.661 5.12 0.105 16.92 0.083 19.17
79 40 266 42.01 6.8139 5.323 4.23 0.117 15.49 0.079 15.86
80 20 154 1.75 2.5836 0.116 4.01 0.098 11.53 0.049 12.54
81 30 380 14.18 3.1467 2.629 6.27 0.076 16.54 0.071 15.06
82 40 170 92.86 2.3258 3.332 3.92 0.046 14.92 0.08 17.23
83 70 173 96.3 8.1208 3.429 3.15 0.055 10.39 – 13.86
84 10 279 6.5 0.9433 0.103 4.16 0.159 8.33 0.049 9.24
85 20 488 1.54 – 1.062 4.3 0.207 8.26 0.068 11.78
86 30 340 9.46 19.74 1.897 11.18 0.115 17.42 0.08 17.79
87 40 114 20.15 12.8698 0.999 9.42 0.034 15.79 0.091 15.44
88 70 53 91.81 3.4517 3.969 3.04 0.046 12.99 0.049 12.38
856 Environ Geol (2009) 58:843–857
123
Hellenic Navy Hydrographic Service (HNHS) (2005) Wave tide data
for Hellenic Ports. Oceanographic report, Hellenic Navy Hydro-
graphic Service, Athens, 94 pp (in Greek)
Hyland J, Balthis L, Karakassis I, Magni P, Petrov A, Shine J,
Vestergaard O, Warwick W (2005) Organic carbon content of
sediments as an indicator of stress in the marine benthos. Mar
Ecol Prog Ser 295:91–103
Isaac RA, Gil L, Cooperman AN, Hulme K, Eddy B, Ruiz M,
Jocobson K, Larson C, Pancorbo OC (1997) Corrosion of
drinking water distribution systems: a major contribution of
copper and lead to wastewater effluents. Environ Sci Technol
31:3198–3203
Jeftic L (1990) State of the marine environment in the Mediterranean
Region. MAP-UNEP Tech Rep 28:95–95
Karakassis I (1994) Oceanographic study of the Bay of Malia.
Technical report. Institute of Marine Biology of Crete, Greece
Kornilios S, Drakopoulos PG, Dounas C (1998) Pelagic tar, dissolved/
dispersed petroleum hydrocarbons and plastic distribution in the
Cretan Sea, Greece. Mar Poll Bull 36(12):989–993
Liquete C, Arnau P, Canals M, Colas S (2005) Mediterannean river
systems of Andalusia, southern Spain, and associated deltas: a
source to sink approach. Mar Geol 222:471–495
Loring DH (1982) Geochemical factors controlling the accumulation
and dispersal of heavy metals in the bay of Fundy sediments.
Can J Earth Sci 19:930–935
Majori L, Nedoclan G, Modonutti GB, Daris F (1978). Levels of
metal pollutants in sediments and biota of the Gulf of Trieste: a
long term survey. IV Journees Etud. Pollutions, CIESM,
Antalya, pp 237–243
Morley NH, Burton JD, Statham PJ (1990) Observations of dissolved
trace metals in the Gulf of Lions. Water Poll Res Rep 28:279–
291
Nicolaou R, Galera-Cunha A, Lucas Y (2006) Transfer of nutrients
and labile metals from the continent to the sea by a small
Mediterranean river. Chemosphere 63:469–476
Nittis K, Zervakis V, Papageorgiou E, Perivoliotis L (2002)
Atmospheric and oceanic observations from the POSEIDON
buoy network: initial results. Glob Atmos Ocean Syst 8:87–99
Oakley SM, Nelson PO, Williamson KJ (1981) Model of trace-metal
partitioning on marine sediment. Environ Sci Technol 15:474–
480
Poulos SE, Ntounas C, Petychakis G (2002) Study of the sedimen-
tological and hydrological conditions of the Gournes shorezone
(province of Heraklio, Crete). Paper presented at the 6th
Panhellenic Geographical Conference, 3–6 October 2002, Thes-
saloniki (in Greek)
Pope W, Graham NJD, Young RJ, Perry R (1978) Urban runoff from
a road surface—a water quality study. Prog Water Technol
10:533–539
Sarı E, Cagatay N (2001) Distribution of heavy metals in the surface
sediments of the Gulf of Saros, NE Aegean Sea. Environ Int
26:169–173
Scoullos M, Dassenakis M (1983) Trace metals in a tidal Mediter-
ranean embayment. Mar Poll Bull 14:24–29
Scoulos M (1983) Trace metals in a landlocked intermittently anoxic
basin. In: Wong PTS, Boyle E, Bruland KW, Barton JD,
Goldberg EO (eds) Trace metals in sea water. Plenum Press,
NewYork, pp 351–366
Shear NM, Schmidt CW, Huntley SL, Crawford DW, Finley BL
(1996) Evaluation of the factors relating combined sewer
overflows with sediment contamination of the Lower Passaic
River. Mar Poll Bull 32:288–304
Smith W, McIntyre AD (1954) A spring-loaded bottom sampler. J
Mar Biol Assoc UK 33:257–264
Strickland JDH, Parsons TR (1972) A practical handbook of seawater
analysis. Fisheries Research Board of Canada Bulletin 167
Tanner P, Lai Shing L, Pana SM (2000) Contamination of heavy
metals in marine sediment cores from Victoria Harbour, Hong
Kong. Mar Poll Bull 40(9):769–779
Theocharis A, Georgopoulos D, Lascaratos A, Nittis K (1993) Water
masses and circulation in the central region of the Eastern
Mediterranean: Eastern Ionian, South Aegean and Northwest
Levantine. Deep Sea Res II 40:1121–1142
Theocharis A, Balopoulos E, Kioroglou S, Kontoyiannis H, Iona A
(1999) A synthesis of the circulation and hydrography of the
South Aegean Sea and the Straits of the Cretan Arc (March
1994–January 1995). Prog Oceanogr 44:469–510
Triantafyllou G, Korres G, Petihakis G, Pollani A, Lascaratos A
(2003) Assessing the phenomenology of the Cretan Sea shelf
area using coupling modelling techniques. Ann Geophys
21:237–250
Tovar A, Moreno C, Manuel-Vez MP, Garcıa-Vargas M (2000)
Environmental impacts of intensive aquaculture in marine
waters. Water Res 34:334–342
Tsimplis MN (1994) Tidal oscillations in the Aegean and Ionian Seas.
Estuar Coastal Shelf Sci 39(2):201–208
Voutsinou-Taliadouri FG, Satsmadjis J (1982) Trace metals in the
Pagassitikos Gulf, Greece. Estuar Coast Shelf Sci 15:221–228
WHO/UNEP (1995) Health risks from marine pollution in the
Mediterranean. Part II. Review of hazards and health risks.
Document EUR/ICP/EHAZ94 01/MT 01 (2), World Health
Organization, Regional office for Europe, Copenhagen
Zervakis V, Nittis K, Theocharis A, Georgopoulos D (1998) The
interactive relation of water column structure and mesoscale
circulation in the Cretan Sea during the last decade, Paper
presented at EGS VVIII General Assembly Nice, France 20–24
April 1998
Environ Geol (2009) 58:843–857 857
123