Nonlinear wave interactions in patterned Silica and AlGaAs waveguides * Research Article Keywords:...
8
Cent. Eur. J. Phys. • 6(3) • 2008 • 555-562 DOI: 10.2478/s11534-008-0043-z Central European Journal of Physics Nonlinear wave interactions in patterned Silica and AlGaAs waveguides * Research Article Yoav Linzon 1† , Boris A. Malomed 2 , Michael Zaezjev 3 , Roberto Morandotti 3 , Maite Volatier 4 , Vincent Aimez 4 , Richard Ares 4 , Shimshon Bar-Ad 1 1 School of Physics and Astronomy, Faculty of Exact Sciences, Tel-Aviv University, Tel-Aviv 69978, Israel 2 Department of Physical Electronics, Faculty of Engineering, Tel-Aviv University, Tel-Aviv 69978, Israel 3 Universite’ du Quebec, Institute National de la Recherche Scientifique, Varennes, Quebec J3X 1S2, Canada 4 Centre de Recherche en Nanofabrication et en Nanocaracterisation (CRN), Universite de Sherbrooke, 2500 Boulevard Universite, Sherbrooke, J1K2R1, Qc/Canada Received 13 November 2007; accepted 4 January 2008 Abstract: We study nonlinear interactions between discrete optical solitons that propagate in different regimes of diffraction, and the nonlinear scattering of dispersive waves by local optical potentials. It is well known in optics that when linear coherent waves meet, they interfere without interactions. Linear waves also scatter through local optical structures not exchanging any power with the guided modes of these structures. As a focusing Kerr nonlinearity is present, such linearly-inhibited phenomena can exist. Our studies are performed in silica and AlGaAs nonlinear waveguides, excited by ultra-short pulses in the near infrared. PACS (2008): 42.65.Tg, 42.65.Sf, 52.35.Mw, 42.25.Fx Keywords: nonlinear waveguides • discrete solitons • nonlinear interactions • wave scattering • wave trapping © Versita Warsaw and Springer-Verlag Berlin Heidelberg. 1. Introduction In nonlinear guided waves, high polarization orders are excited in the dielectric medium in which the waves prop- agate. Considering third-order (Kerr) nonlinearities, mak- ing the paraxial approximation, and assuming a slowly- varying envelope, a wave equation for the 2D evolution of * Presented at 9-th International Workshop on Nonlinear Optics Applica- tions, NOA 2007, May 17-20, 2007, Świnoujście, Poland † E-mail: [email protected] the electric field envelope A () is obtained [1]: 2 0 ∂A ∂ + ∂ 2 A ∂ 2 + 2 0 2 ( ) A + 2 0 0 2 |A| 2 A =0 (1) Here is the principal propagation direction, is the transverse direction of the waveguide, 0 is the free-space wave number, ( ) is the transverse refractive index pro- file, and 2 is the nonlinear (field-squared) Kerr coeffi- cient. The beam is assumed to be confined to a coupled mode in the third () dimension. As a result, the beam effectively changes the medium properties, leading to an instantaneous effective (nonlinearity-induced) ”refractive 555
-
Upload
independent -
Category
Documents
-
view
3 -
download
0
Transcript of Nonlinear wave interactions in patterned Silica and AlGaAs waveguides * Research Article Keywords:...

Cent. Eur. J. Phys. • 6(3) • 2008 • 555-562DOI: 10.2478/s11534-008-0043-z
Central European Journal of Physics
Nonlinear wave interactions in patterned Silica andAlGaAs waveguides∗
Research Article
Yoav Linzon1† , Boris A. Malomed2, Michael Zaezjev3, Roberto Morandotti3, Maite Volatier4, VincentAimez4, Richard Ares4, Shimshon Bar-Ad1
1 School of Physics and Astronomy, Faculty of Exact Sciences, Tel-Aviv University, Tel-Aviv 69978, Israel
2 Department of Physical Electronics, Faculty of Engineering, Tel-Aviv University, Tel-Aviv 69978, Israel
3 Universite’ du Quebec, Institute National de la Recherche Scientifique, Varennes, Quebec J3X 1S2, Canada
4 Centre de Recherche en Nanofabrication et en Nanocaracterisation (CRN), Universite de Sherbrooke, 2500 BoulevardUniversite, Sherbrooke, J1K2R1, Qc/Canada
Received 13 November 2007; accepted 4 January 2008
Abstract: We study nonlinear interactions between discrete optical solitons that propagate in different regimes ofdiffraction, and the nonlinear scattering of dispersive waves by local optical potentials. It is well knownin optics that when linear coherent waves meet, they interfere without interactions. Linear waves alsoscatter through local optical structures not exchanging any power with the guided modes of these structures.As a focusing Kerr nonlinearity is present, such linearly-inhibited phenomena can exist. Our studies areperformed in silica and AlGaAs nonlinear waveguides, excited by ultra-short pulses in the near infrared.
PACS (2008): 42.65.Tg, 42.65.Sf, 52.35.Mw, 42.25.Fx
Keywords: nonlinear waveguides • discrete solitons • nonlinear interactions • wave scattering • wave trapping© Versita Warsaw and Springer-Verlag Berlin Heidelberg.
1. Introduction
In nonlinear guided waves, high polarization orders areexcited in the dielectric medium in which the waves prop-agate. Considering third-order (Kerr) nonlinearities, mak-ing the paraxial approximation, and assuming a slowly-varying envelope, a wave equation for the 2D evolution of∗Presented at 9-th International Workshop on Nonlinear Optics Applica-tions, NOA 2007, May 17-20, 2007, Świnoujście, Poland†E-mail: [email protected]
the electric field envelope A (x, z) is obtained [1]:2ik0 ∂A∂z + ∂2A
∂x2 + k20n2 (x)A+ k20n0n2 |A|2 A = 0 (1)Here z is the principal propagation direction, x is thetransverse direction of the waveguide, k0 is the free-spacewave number, n (x) is the transverse refractive index pro-file, and n2 is the nonlinear (field-squared) Kerr coeffi-cient. The beam is assumed to be confined to a coupledmode in the third (y) dimension. As a result, the beameffectively changes the medium properties, leading to aninstantaneous effective (nonlinearity-induced) ”refractive
555

Nonlinear wave interactions in patterned Silica and AlGaAs waveguides1
index” change. As suggested by Eq. (1), this nonlin-ear refractive index change is, approximately, ∆n = n′2I,where I = |E|2 is the instantaneous power density ofthe field and n′2 is the nonlinear index intensity coeffi-cient (n′2 6= n2). The most well-known examples of therefractive index change influence are the effect of self-focusing [2] (for n2 > 0), and the generation of solitons,in which this self-focusing counteracts wavepacket broad-ening caused by linear diffraction [3–5]. However, theintensity-dependent refractive index change can also leadto interactions between solitons [6–11] and interactionsbetween nonlinear waves and the local structures fromwhich they scatter [12–17]. Here, we will deal with theseparticular scenarios. Specifically, in section 2 we studyexperimentally the nonlinear interactions between dis-crete solitons [18, 19] that propagate in different regimesof diffraction [20], and in section 3 we examine nonlinearwavepacket scattering by local optical potentials.In the experiment, two lateral waveguide geometries areused: for the study of discrete soliton interactions we usewaveguide arrays, in which n (x) is periodic (Fig. 1(a),consisting of individually single-mode, weakly-coupledwaveguides [18, 19]), while in scattering experiments weuse the planar waveguide with local discontinuities, inwhich n (x) is generally constant (homogeneous), exceptfor some small interval of x that contains local refractiveindex variations (Fig. 1(b)-(c)). Local optical potentials,embedded inside the planar waveguide and thus produc-ing local discontinuities of the refractive index distribu-tion, may be either guiding centers (Fig. 1(b)), in whichthe local refractive index is increased with respect to thesurrounding medium, or anti-guiding centers (Fig. 1(c)), inwhich the local refractive index is repressed with respectto the surrounding medium. Images of the physical compo-sition of our samples are shown in Fig. 1(d)-(g). In silicasamples (Fig. 1(d),(f )), Ge-B doped waveguides are physi-cally embedded in pure silica substrates of lower refractiveindex [21]. In AlGaAs samples (Fig. 1(e),(g)), however, theeffective refractive index is decreased in regions in whichthe top cladding layers are etched [19]. While there aresome differences between the optical parameters of silicaand AlGaAs, both exhibit the focusing Kerr nonlinearitywhen they are optically excited by 80 femtosecond pulsesat 1 KHz repetition rate and a wavelength of 1520 nm,in the megawatt and kilowatt peak-power regime, respec-tively.With respect to wavepackets incident on such structuresfrom a homogeneous (continuum) region, there are fun-damental differences between the two geometries. As awave arrives from a semi-infinite continuum region towarda semi-infinite periodic waveguide array that has a pe-riodicity d (Fig. 2(a)), there is a linear band structure
relative to β (kx ), the propagation constants as a functionof the input lateral wave number (Fig. 2(b)). An excita-tion can penetrate into the structure at some incidenceangle intervals (corresponding to ”band” wave numbers)or be totally reflected at others (for ”gap” wave numbers)[22, 23]. In the case of wavepackets incident on a localoptical potential scattering center (Fig. 2(c)), the wave ispartially transmitted through the structure and partiallyreflected. The linear scattering problem is characterizedby a plane-wave transmission spectrum T (β) (Fig. 2(d)),showing the transmission coefficient T as a function ofthe incident propagation constant. Importantly, in thelinear-wave regime, these two problems are completelycharacterized by the above spectra. However, as the Kerrnonlinearity is introduced, deviations from the above situ-ation occur. For example, side-coupled excitations in thewaveguide array that belong to a linear gap can penetrateinto the array to form gap solitons [24]. This happens dueto the nonlinearity-induced effective wave number squareincrease k̃2 ∼ k20n0 (n0 + 2n2I), which shifts the beam todifferent spectrum locations, as √k2x + β2 = k̃ , where the
z-component of the wave vector is the propagation con-stant. Similarly, in the problem of scattering from localoptical potentials, while bound states are inaccessible toscattering waves (see Fig. 2(d), which illustrates that abound state has a propagation constant that is higher thanthe top-most scattering wave’s propagation constant), theKerr nonlinearity can effectively shift β to higher valuesand allow trapping of some fraction of a wavepacket inbound states.2. Discrete-soliton interactions innonlinear 1D waveguide arrays
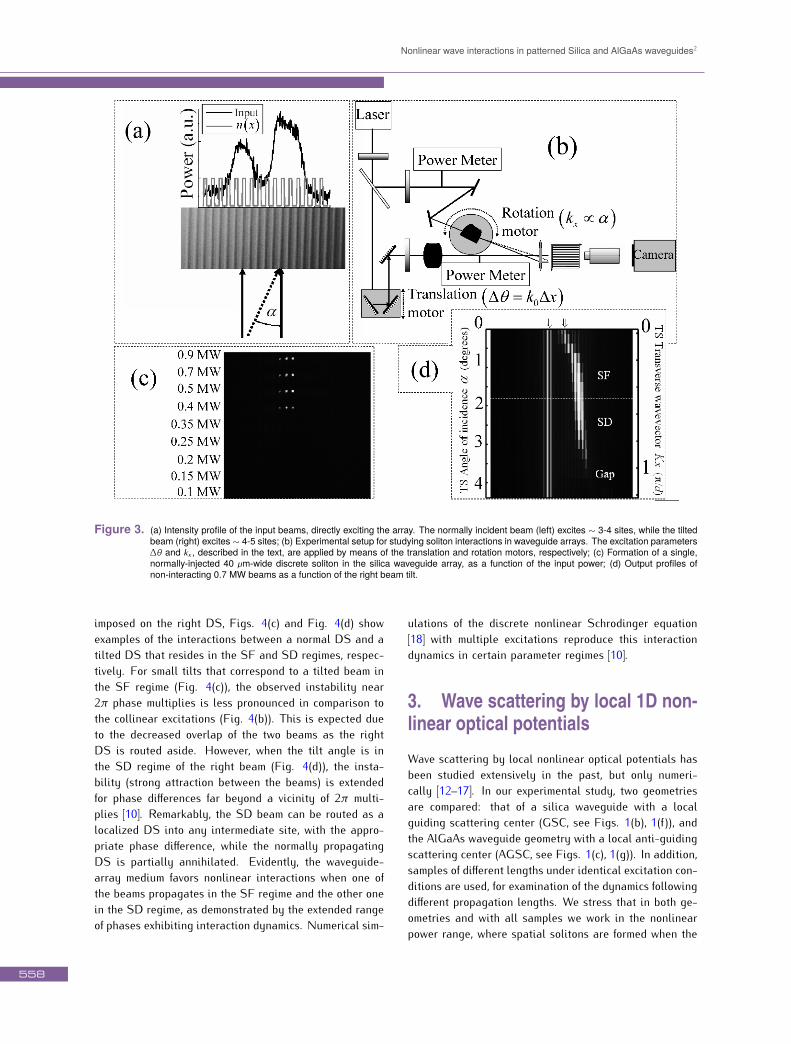
Discrete solitons (DSs) in waveguide arrays [18, 19] areformed by direct excitation of a narrow beam inside thearray (Fig. 3(a)), rather than by side excitations from acontinuum (Fig. 2(a)). Fig. 3(b) shows the experimen-tal setup used for the excitation of two discrete solitons,in close vicinity, with steerable input for one of them, toallow controllable diffraction, and a control of the inputphase difference between the coherent excitations, ∆θ.The sample used here is the silica waveguide array (Fig.1(d)). The formation of a single normally-injected discretesoliton in this array, as a function of the input power, isshown in Fig. 3(c). In the silica waveguide array, a dis-crete soliton is sustained even at input powers an orderof magnitude higher than its formation threshold (in thiscase, 0.4 MW), due to the balance between the Kerr non-linearity, anomalous temporal dispersion and stimulatedRaman scattering [25]. Other than that, the DS formed556

Yoav Linzon, Boris A. Malomed, Michael Zaezjev, Roberto Morandotti, MaiteVolatier, Vincent Aimez, Richard Ares, Shimshon Bar-Ad
Figure 1. (a) Lateral refractive index profile of the waveguide array; (b)-(c) Lateral refractive index profiles of the homogeneous waveguide withlocal guiding (b) and anti-guiding (c) scattering centers; (d)-(g) Cross-section images of the waveguides used in the experiments. (d),(e)Periodic waveguide arrays composed of (d) silica and (e) AlGaAs Kerr media; (f) Silica with local guiding centers; (g) AlGaAs with localanti-guiding centers. The vertical arrows in the images indicate the local scatterer positions.
Figure 2. (a) Illustration of the scattering from a semi-infinite waveguide array with a periodicity d, and (b) the corresponding linear band-gaptransmission spectrum. (c) Illustration of the scattering from a local optical potential center, and (d) the corresponding linear plane wavetransmission spectrum.
in silica arrays (Fig. 1(d)) is identical to the one that isusually formed in AlGaAs arrays (Fig. 1(e), see [19, 20]).As tilts are imposed on the right DS, it is routed aside, asshown in Fig. 3(d) (the data here is obtained with a verylarge time delay between the pulses, and therefore theydo not interact). The sideways shift of the beam increasesin the self-focusing (SF) regime, and it decreases in theself-defocusing (SD) regime, where the beam becomes de-localized [20].
Experimental results for interacting DSs are shown in Fig.4. When the two beams are at normal incidence and lowpower (Fig. 4(a)), linear-interference fringes are observedin the superposition of two discrete-diffraction patterns[18, 19], where the slope of the fringes exactly coincideswith the phase slope imposed by the translation motor.At high input power (Fig. 4(b)), nonlinear instability oc-curs around multiplies of ∆θ = 2π, which partially divertsthe beams into the intermediate sites [8–11]. As tilts are557
Nonlinear wave interactions in patterned Silica and AlGaAs waveguides2
Figure 3. (a) Intensity profile of the input beams, directly exciting the array. The normally incident beam (left) excites ∼ 3-4 sites, while the tiltedbeam (right) excites ∼ 4-5 sites; (b) Experimental setup for studying soliton interactions in waveguide arrays. The excitation parameters∆θ and kx , described in the text, are applied by means of the translation and rotation motors, respectively; (c) Formation of a single,normally-injected 40 µm-wide discrete soliton in the silica waveguide array, as a function of the input power; (d) Output profiles ofnon-interacting 0.7 MW beams as a function of the right beam tilt.
imposed on the right DS, Figs. 4(c) and Fig. 4(d) showexamples of the interactions between a normal DS and atilted DS that resides in the SF and SD regimes, respec-tively. For small tilts that correspond to a tilted beam inthe SF regime (Fig. 4(c)), the observed instability near2π phase multiplies is less pronounced in comparison tothe collinear excitations (Fig. 4(b)). This is expected dueto the decreased overlap of the two beams as the rightDS is routed aside. However, when the tilt angle is inthe SD regime of the right beam (Fig. 4(d)), the insta-bility (strong attraction between the beams) is extendedfor phase differences far beyond a vicinity of 2π multi-plies [10]. Remarkably, the SD beam can be routed as alocalized DS into any intermediate site, with the appro-priate phase difference, while the normally propagatingDS is partially annihilated. Evidently, the waveguide-array medium favors nonlinear interactions when one ofthe beams propagates in the SF regime and the other onein the SD regime, as demonstrated by the extended rangeof phases exhibiting interaction dynamics. Numerical sim-
ulations of the discrete nonlinear Schrodinger equation[18] with multiple excitations reproduce this interactiondynamics in certain parameter regimes [10].3. Wave scattering by local 1D non-linear optical potentialsWave scattering by local nonlinear optical potentials hasbeen studied extensively in the past, but only numeri-cally [12–17]. In our experimental study, two geometriesare compared: that of a silica waveguide with a localguiding scattering center (GSC, see Figs. 1(b), 1(f)), andthe AlGaAs waveguide geometry with a local anti-guidingscattering center (AGSC, see Figs. 1(c), 1(g)). In addition,samples of different lengths under identical excitation con-ditions are used, for examination of the dynamics followingdifferent propagation lengths. We stress that in both ge-ometries and with all samples we work in the nonlinearpower range, where spatial solitons are formed when the
558

Yoav Linzon, Boris A. Malomed, Michael Zaezjev, Roberto Morandotti, MaiteVolatier, Vincent Aimez, Richard Ares, Shimshon Bar-Ad
Figure 4. Output profiles as a function of the phase difference ∆θ, with: (a) Two beams at normal incidence, low power (0.1 MW); (b) Two beamsat normal incidence, high-power interaction (0.7 MW); (c)-(d) Two beams at high power, as the right beam is launched at the tilt anglesof (c) 0.6 degrees (self-focusing), and (d) 3 degrees (self- defocusing). The lower sections in each panel show the output in the absenceof the interaction.
excitation is in the continuum, far away from the localstructures, and the linear refractive index gradients of thelocal structures were chosen with the aim to approximatelymatch the nonlinearity-induced refractive index variation.The experimental setup is shown in Fig. 5(a), where a sin-gle beam is directed with a controlled tilt angle toward thelocal discontinuities (see Fig. 5(b) for a close-up of thesample’s input facet). Experimental results are shown inFig. 6 for the scattering by the guiding center and in Fig.7 for the scattering by the anti-guiding center. In mostof our measurements a 40 µm-wide input beam was used,which is comparable to the total widths of the scatteringcenters (see Figs. 1(f), 1(g)), and an order of magnitudelarger than individual scatterers. This beam yields suffi-cient angular resolution in the scattering experiment, andsimplifies coupling into the sample (when, in principle, abeam as wide as possible would be most desirable).We plot scans of the output facet as a function of the inputtilt angle, indicating the input beam and scatterer loca-tions. In Figs. 6(a), an 8 mm-long sample is excited undervery low input power (top) and identically excited under
high input power (bottom). With the low-power settingsa first transmission resonance is obtained in the angleinterval of 3-6 degrees, and only a negligible fraction ofthe power emerges from the GSC positions. As the peakpower is increased to levels in which the nonlinearity-induced refractive index variations are substantially shift-ing the beam beyond the scattering regime (see Fig. 2(d)),it clearly gets more focused, and importantly the powerfraction that emerges from the first waveguide dramati-cally and super-linearly increases in the angle intervalof 2-5 degrees. The output intensity distributions in theGSC coincide with the linear modal shape when directlyexcited. This suggests a nonlinearity-induced trapping ofpower in the GSC. To confirm this hypothesis, we repeatedthe measurements with a 28 mm-long sample, excited un-der identical conditions. In Fig. 6(b), the output from theshort (top) and long (bottom) samples are shown when anidentical high-power excitation is used. This measurementshows a substantial power fraction remaining inside thefirst GSC waveguide site, clearly in the same angle inter-val. The fact that the power is found inside the GSC in the
559

Nonlinear wave interactions in patterned Silica and AlGaAs waveguides3
Figure 5. (a) Experimental setup for studying nonlinear scattering by local potential discontinuities. The excitation input angle α is varied usingapplied motor translations. (b) Close-up of the sample region (top view).
same angle interval for both samples although the prop-agation lengths are substantially different (by a factor of3.5), suggests that power is indeed trapped in the GSC. Atthe same time, the fact that only a fraction of the power istrapped (up to 20%) suggests that the resulting excitationmay be either linear (for low trapped power) or nonlinear(for high trapping power). Fig. 6(c) shows results of non-linear trapping at the two samples, with a 150 µm-wideinput beam. Trapping at the first GSC site is observed inthe angle interval of 3-5 degrees, and at the second sitein the angle interval of 6-8 degrees, for both samples. Weinterpret the clear angular distinction between trappingat the first and second waveguides in this measurementas an indication that a higher angular resolution is ob-tained with the wider input beam (i.e. due to the narrowerspatial frequency content of the input beam, power can betrapped more efficiently and with higher resolutions be-tween adjacent linear modes). Numerical simulations ofthe nonlinear Schrodinger equation with comparable localscattering centers reproduce this trapping dynamics [26].With the AGSC AlGaAs samples, shorter propagationlengths and lower input powers were used, on accountof temporal dispersion, the higher Kerr coefficient, and alower damage threshold. A 40 µm-wide input beam wasused, and the input intensity was again adjusted to ap-proximately match the nonlinear refractive index variationto the linear refractive index gradient in this sample. TheAGSC does not have any linear bound states belongingto direct excitations. In this case direct excitations simplytunnel to the continuum in the course of the propagation,so trapping was not expected here. Indeed, while scans ofthe output facet as a function of the incidence angle fora 3 mm-long sample (left panel in Fig. 7) show substan-tial amount of power emerging from the AGSC positions
in the angle interval of 2-6 degrees, in the case of a 4.2mm-long sample under identical excitation (right panel inFig. 7), the AGSC is virtually empty in the same angleinterval, and it is only visible at larger angles. In parallel,the transmitted power fraction in the same angle interval(2-6 degrees) increases. This suggests that no trappingoccurs in this case, but only cavity oscillations of transientradiation passing through the anti-waveguides.4. ConclusionsWe have studied experimentally mutual-wave (for discretesolitons) and wave-structure (for scattering of dispersivewaves by local optical potentials) interactions in nonlinearpatterned silica and AlGaAs waveguides. Specifically, wehave demonstrated several novel effects that are impos-sible in the linear-wave regime, such as the annihilationof discrete solitons as they interact with certain relativephases, interaction-induced localization of (individually)self-defocusing discrete solitons, and the trapping of scat-tering waves in the linear modes of local guiding scatter-ers. These power-dependent, experimentally tested char-acteristics can prove useful in the design of devices forapplications in all-optical ultrafast switching and chan-neling in telecommunications, as the technology of high-power lasers is becoming more miniaturized and could beintegrated in all-optical networks.AcknowledgementThis research was supported by the Israel Science Foun-dation through grants 8006/03 and 944/05 and by the
560

Yoav Linzon, Boris A. Malomed, Michael Zaezjev, Roberto Morandotti, MaiteVolatier, Vincent Aimez, Richard Ares, Shimshon Bar-Ad
Figure 6. Scattering dynamics in the silica GSC samples (output facet profiles as a function of the input tilt angle α). The dashed lines andarrows indicate the input and GSC positions, respectively. (a) A short sample at low-power excitation (top, obtained with a large cameraintegration time) and high-power excitation (bottom), under identical conditions; (b) High-power excitation of a short sample (top) anda long one (bottom), under identical conditions; (c) Experimental data for a wide 150 µm input beam. Here the plots show the trappedpower fraction (L) as a function of input angle α (in degrees). In all cases, sample lengths (in z) and excitation peak powers (in megawatts)are indicated.
Natural Sciences and Engineering Research Council inCanada.
References
[1] R.W. Boyd, Nonlinear Optics 2nd ed. (AcademicPress, San Diego, 2002)[2] V.E. Zakharov, N.S. Synakh, V.V. Soloviev, Sov. Phys.JETP 33, 77 (1971)[3] V.E. Zakharov, A.B. Shabat, Sov. Phys. JETP 34, 62(1972)[4] A. Barthelemy, S. Maneuf, C. Froehly, Opt. Commun.
55, 201 (1985)[5] J.S. Aitchison et al., Opt. Lett. 15, 471 (1990)[6] A.B. Aceves et al., Phys. Rev. E 53, 1172 (1996)[7] G.I. Stegeman, M. Segev, Science 286, 1518 (1999)[8] J. Meier, G.I. Stegeman, Y. Silberberg, R. Morandotti,J.S. Aitchison, Phys. Rev. Lett. 93, 093903 (2004)[9] J. Meier et al., Opt. Express 13, 1797 (2005)[10] Y. Linzon et al., Phys. Rev. Lett. 97, 193901 (2006)[11] M. Stepic et al., Phys. Rev. E 74, 046614 (2006)[12] X.D. Cao, B.A. Malomed, Phys. Lett. A 206, 177 (1995)[13] H. Sakaguchi, M. Tamura, J. Phys. Soc. Jpn. 73, 503(2004)[14] R.H. Goodman, P.J. Holmes, M.I. Weinstein, PhysicaD 192, 215 (2004)561

Nonlinear wave interactions in patterned Silica and AlGaAs waveguides4
Figure 7. Scattering dynamics in the AlGaAs AGSC samples following 3 mm-long (left) and 4.2 mm-long (right) propagation. The excitation is 40µm-wide with a peak power of 1 kW.
[15] B. Piette, W.J. Zakrzewski, J. Brand, J. Phys. A 38,10403 (2005)[16] A.E. Miroshnichenko, S. Flach, B. Malomed, Chaos13 874 (2003)[17] K.T. Stoychev, M.T. Primatarowa, R.S. Kamburova,Phys. Rev. E 70, 066622 (2004)[18] D.N. Christodoulides, R.I. Joseph, Opt. Lett. 13, 794(1988)[19] H.S. Eisenberg et al., Phys. Rev. Lett. 81, 3383 (1998)[20] H.S. Eisenberg, Y. Silberberg, R. Morandotti, J.S.Aitchison, Phys. Rev. Lett. 85, 1863 (2000)[21] D. Cheskis et al., Phys. Rev. Lett. 91, 223901 (2003)
[22] D. Mandelik, H.S. Eisenberg, Y. Silberberg, R.Morandotti, J.S.Aitchison, Phys. Rev. Lett. 90, 053902(2003)[23] Y. Lahini, D. Mandelik, Y. Silberberg, R. Morandotti,Opt. Express 13, 1762 (2005)[24] D. Mandelik, R. Morandotti, J.S. Aitchison,Y.Silberberg, Phys. Rev. Lett. 92, 093904 (2004)[25] D. Cheskis, Y. Linzon, I. Ilsar, S. Bar-Ad, H.S. Eisen-berg, Opt. Lett. 32, 2459 (2007)[26] Y. Linzon et al., Phys. Rev. Lett. 99, 133901 (2007)
562


![BULLET Home @BULLET Soal -Soal @BULLET e-Book @BULLET Sitemap Belajar is Fun Tempat belajar secara online [Soal Pilihan Ganda] Sejarah, Perang Dunia II](https://static.fdokumen.com/doc/165x107/631f7560d10f1687490fcedb/bullet-home-bullet-soal-soal-bullet-e-book-bullet-sitemap-belajar-is-fun-tempat.jpg)