NML
38
Nishat Mills Limited – Security Valuation Reja Kamal Wadiah Akbar Ayesha Nadeem Sayyidah Fatimah tuz Zahrah Muhammad Bin Tariq
-
Upload
lahoreschoolofeconomics -
Category
Documents
-
view
1 -
download
0
Transcript of NML
Nishat Mills Limited – Security Valuation
Reja KamalWadiah AkbarAyesha NadeemSayyidah Fatimah tuz ZahrahMuhammad Bin Tariq
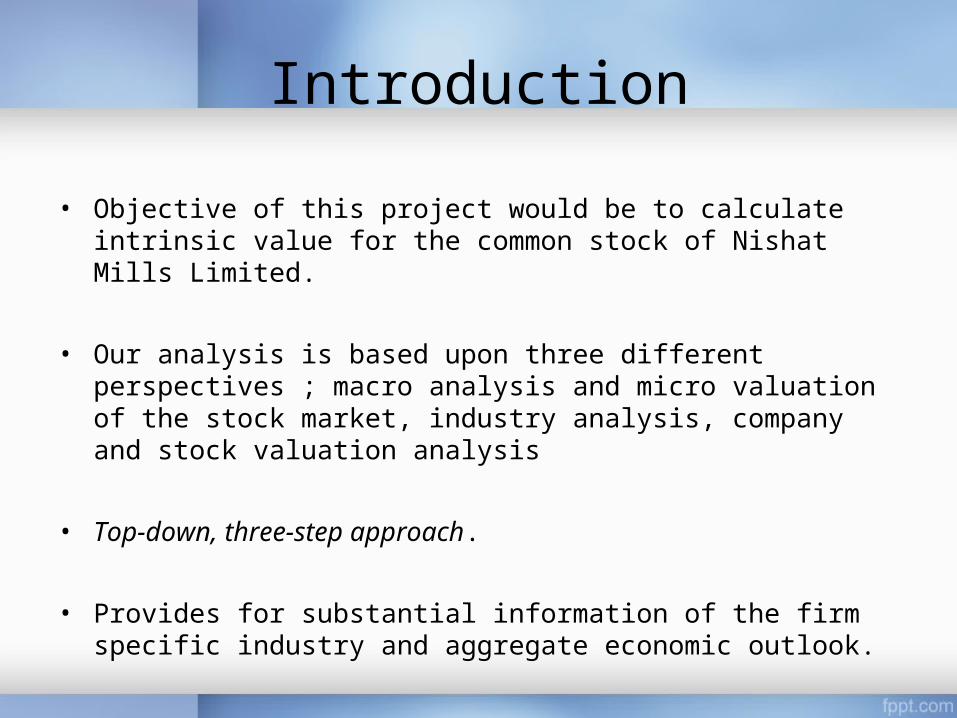
Introduction• Objective of this project would be to calculate
intrinsic value for the common stock of Nishat Mills Limited.
• Our analysis is based upon three different perspectives ; macro analysis and micro valuation of the stock market, industry analysis, company and stock valuation analysis
• Top-down, three-step approach.
• Provides for substantial information of the firm specific industry and aggregate economic outlook.

Real GDP
• Growth rate of 3.3% was recorded from the agricultural sector.
• The large scale manufacturing sector grew by 2.8% as compared to the growth rate of 1.2% in the former year.
Inflation• Inflation rate for PK came out to be 5.13 percent in May
2013.
• In PK, most important categories in the CPI are food and non-alcoholic beverages (35 percent of total weight).
• Year 2011-12 (Jul-Apr) witnessed both demand pull and cost push inflation.
• CPI was highest in July 2011 at 12.4 percent. However, in
December 2011 it declined to single digit at 9.7%.
• Main factor contributing to the rise of non-food inflation was the upward adjustment of energy, gas and fuel prices.

Monetary Policy• Source of stress is the financing burden of the
economic position.
• PK has had approximately no external financing in the 2013 and with the deficit of still 8.8%.
• During 1st July – 7th June, FY13, Rs1230 billion, including Rs413 billion from the SBP were taken from the baking system.
• Government has been able to contain the fiscal deficit at 3.1% during July-March, FY14.
• Consequently, government borrowing has come down to Rs. 276 billion during 1st July-2nd May, FY14 in comparison to Rs.1021 billion in the last year.

Stock & Bond Prices

Gold and Oil Outlook
• When it comes to gold, gold is characterized as a capacity of expansion, Interest rate, Exchange Rate of US Dollar with Pakistani Rupee, Stock Market Performance, cost of silver, for every capita salary and household reserve funds
• The reason behind higher gold prices in Pakistan can also be attributed to our culture where rituals allow for more gold to be exchanged such as wedding functions
• Pakistan gold rates are highly sensitive to the dollar value and generally assume to have an inverse relationship with each other

Business Environment of Textile Industry
• Textile being the largest industrial sector generates the country’s highest export
• As the economy of Pakistan is in a recovery phase, manufacturing sector is expected to grow.
Promising New Fiscal Year 2014: GSP Plus Status by EU
• Pakistan finally receives the coveted GSP Plus status from the European Union in January 2014.
• GSP plus is a special incentive arrangement for sustainable development and good governance.
• GSP plus status for Pakistan has been received enthusiastically by the textile industry of Pakistan.
• Textile sector is on a road to recovery and growth.
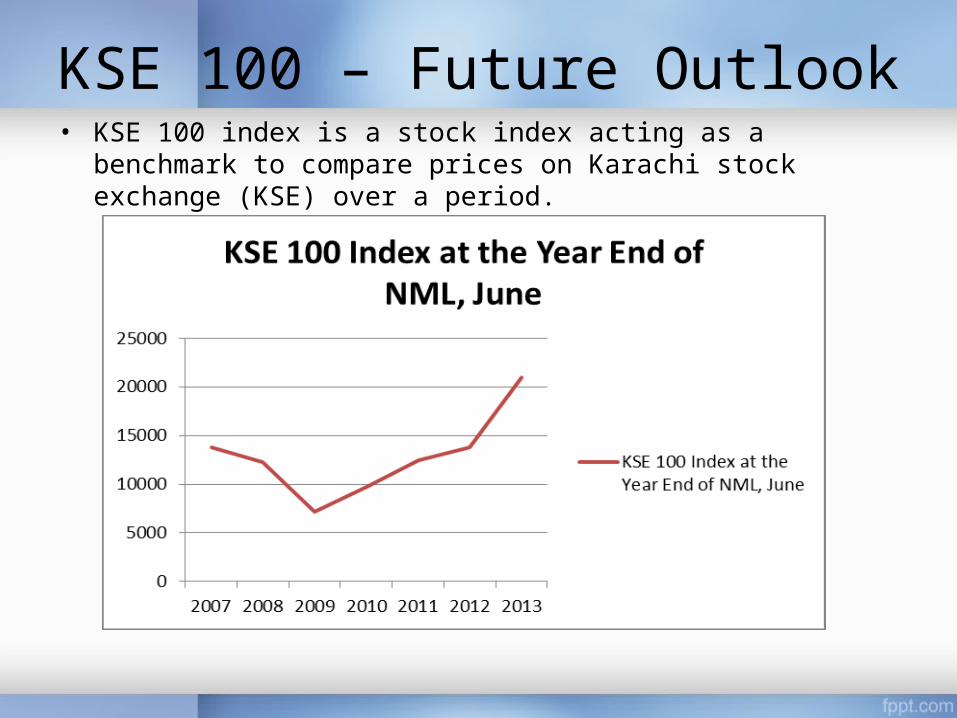
KSE 100 – Future Outlook• KSE 100 index is a stock index acting as a
benchmark to compare prices on Karachi stock exchange (KSE) over a period.

• The above graph shows the comparison of KSE 100 with BSE 100, and reflects that in all years after 2010, KSE 100 has been better than BSE 100.
Company Profile• Nishat Group is among the leading business houses
of the country and ranks among the top 5 groups in terms of assets and sales revenue.
• The group has its roots firmly planted into four core business namely textiles, power generation, banking, and cement.
• Macro environmental forces include political, economic, social and technological factors.
Security Valuation• Dividend Discount Model, • Free Cash Flow to Equity Model• Free Cash Flow to Firm.
• The formula for calculating the intrinsic value for NML’s stock would be:
• P = CF1 / (discount rate-g)
• Cost of equity for DDM and FCF to Equity models.
• WACC is used for FCF to firm model for stock valuation.
• CAPM approach would also be used to measure an R
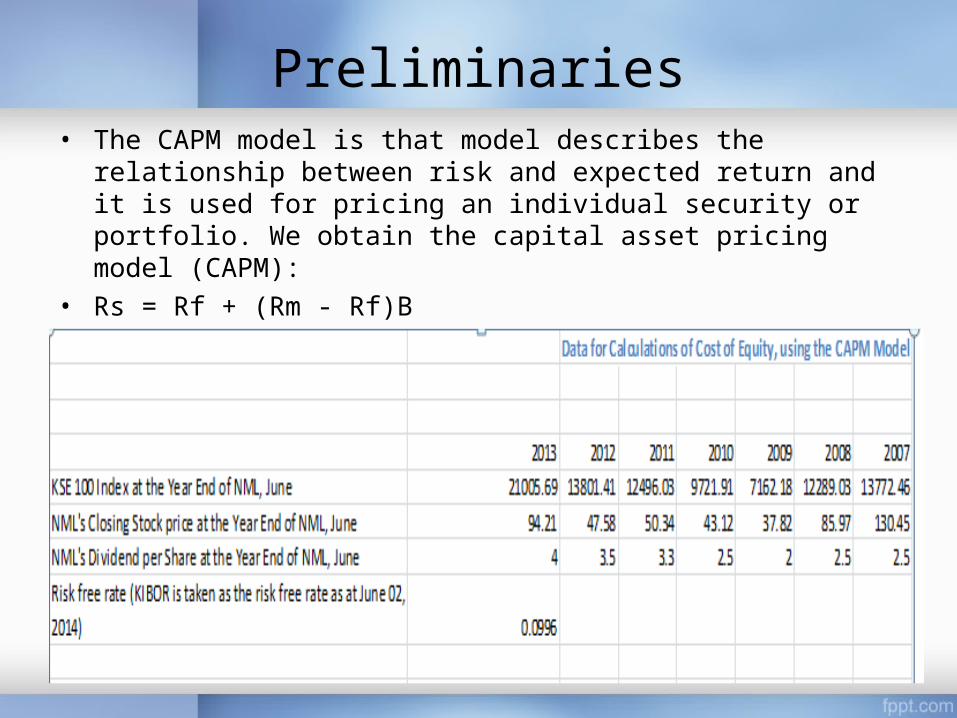
Preliminaries• The CAPM model is that model describes the
relationship between risk and expected return and it is used for pricing an individual security or portfolio. We obtain the capital asset pricing model (CAPM):
• Rs = Rf + (Rm - Rf)B

Beta
Data for Calculations of Cost of Equity, using the CAPM M odel
2013 2012 2011 2010 2009 2008 2007KSE 100 Index at the Year End of NM L, June 21005.69 13801.41 12496.03 9721.91 7162.18 12289.03 13772.46NM L's Closing Stock price at the Year End of NM L, June 94.21 47.58 50.34 43.12 37.82 85.97 130.45NM L's Dividend per Share at the Year End of NM L, June 4 3.5 3.3 2.5 2 2.5 2.5
0.0996
Beta CalculationM arket Returns 0.521995941 0.104463578 0.285347221 0.357395374 -0.417189152 -0.10771NM L Total Stock Returns 1.022491965 0.018733144 0.232993934 0.19811523 -0.507197024 -0.31189Expected M arket Return 0.124050514Expected NM L Return 0.108873935M ean Deviation of M arket Returns 0.397945427 0.104463578 0.285347221 0.357395374 -0.417189152 -0.10771M ean Deviation of NM L Returns 0.913618031 0.018733144 0.232993934 0.19811523 -0.507197024 -0.31189Covariance of M arket Returns with NM L Returns 0.072714023Variance of M arket Returns 0.031672113Beta 2.29583749Beta as per Reuters 1.55Industry Beta as per Reuters 0.98
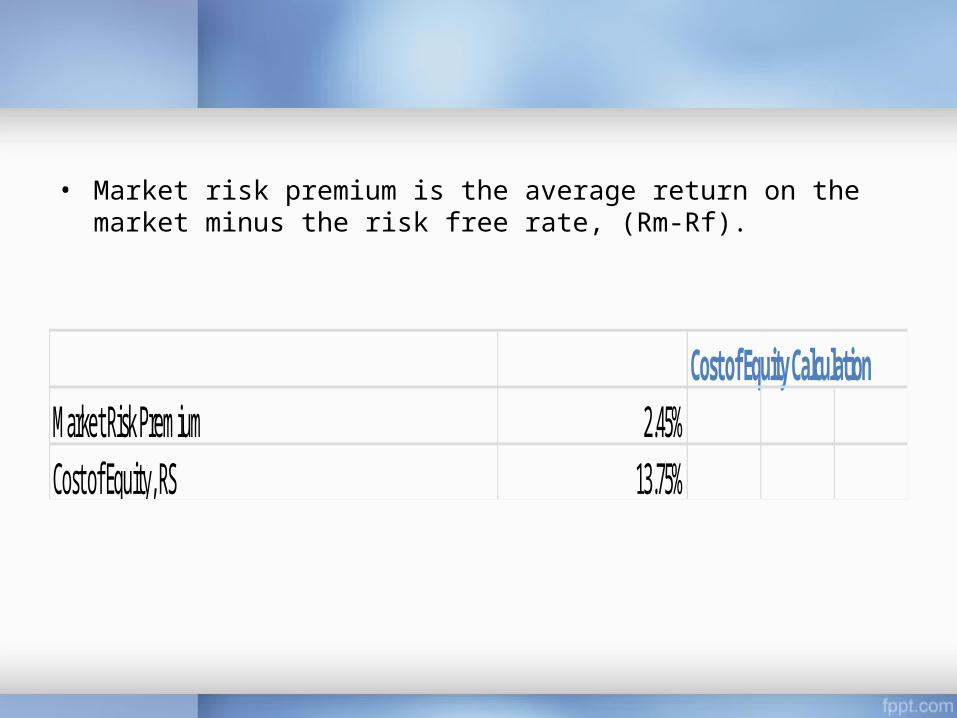
• Market risk premium is the average return on the market minus the risk free rate, (Rm-Rf).
Cost of Equity CalculationM arket Risk Prem ium 2.45%Cost of Equity, RS 13.75%

WACC
W ACC CalculationBond Yield = Cost of DEBT in percentage = Finance Cost/ Interest Bearing Debt of Com pany 23.65%Equity Risk Prem ium 4.00%W ACC = Bond Yield + Equity Risk Prem ium 27.65%
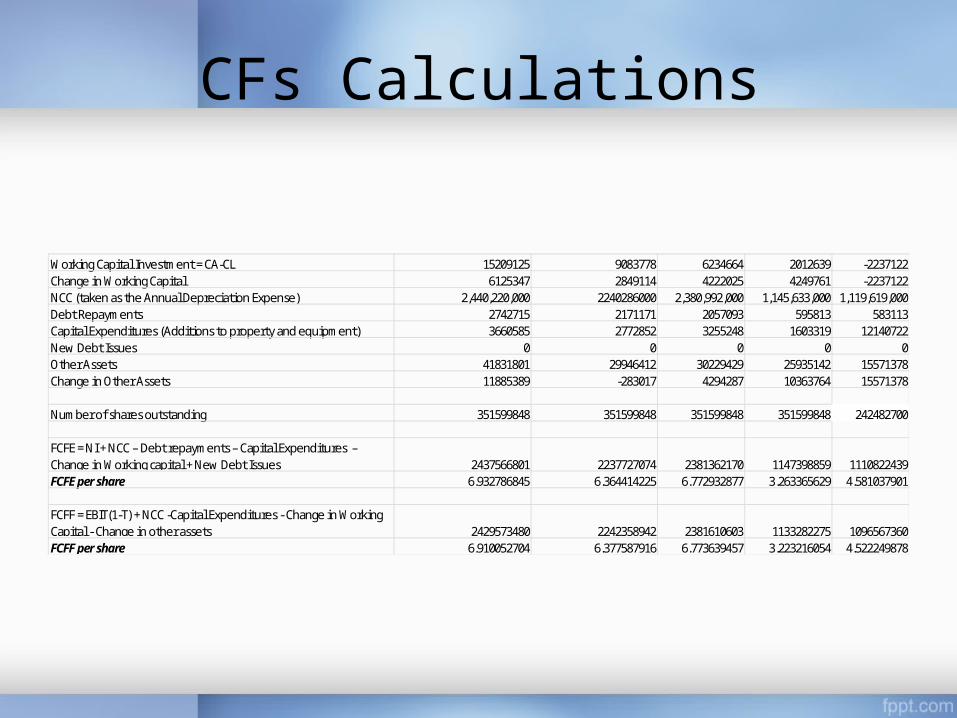
CFs Calculations
W orking Capital Investm ent = CA-CL 15209125 9083778 6234664 2012639 -2237122Change in W orking Capital 6125347 2849114 4222025 4249761 -2237122NCC (taken as the Annual Depreciation Expense) 2,440,220,000 2240286000 2,380,992,000 1,145,633,000 1,119,619,000Debt Repaym ents 2742715 2171171 2057093 595813 583113Capital Expenditures (Additions to property and equipm ent) 3660585 2772852 3255248 1603319 12140722New Debt Issues 0 0 0 0 0Other Assets 41831801 29946412 30229429 25935142 15571378Change in Other Assets 11885389 -283017 4294287 10363764 15571378
Num ber of shares outstanding 351599848 351599848 351599848 351599848 242482700
FCFE = NI + NCC – Debt repaym ents – Capital Expenditures – Change in W orking capital + New Debt Issues 2437566801 2237727074 2381362170 1147398859 1110822439FCFE per share 6.932786845 6.364414225 6.772932877 3.263365629 4.581037901
FCFF = EBIT(1-T) + NCC -Capital Expenditures - Change in W orking Capital - Change in other assets 2429573480 2242358942 2381610603 1133282275 1096567360FCFF per share 6.910052704 6.377587916 6.773639457 3.223216054 4.522249878
Growth Rates Assumptions & Calculations
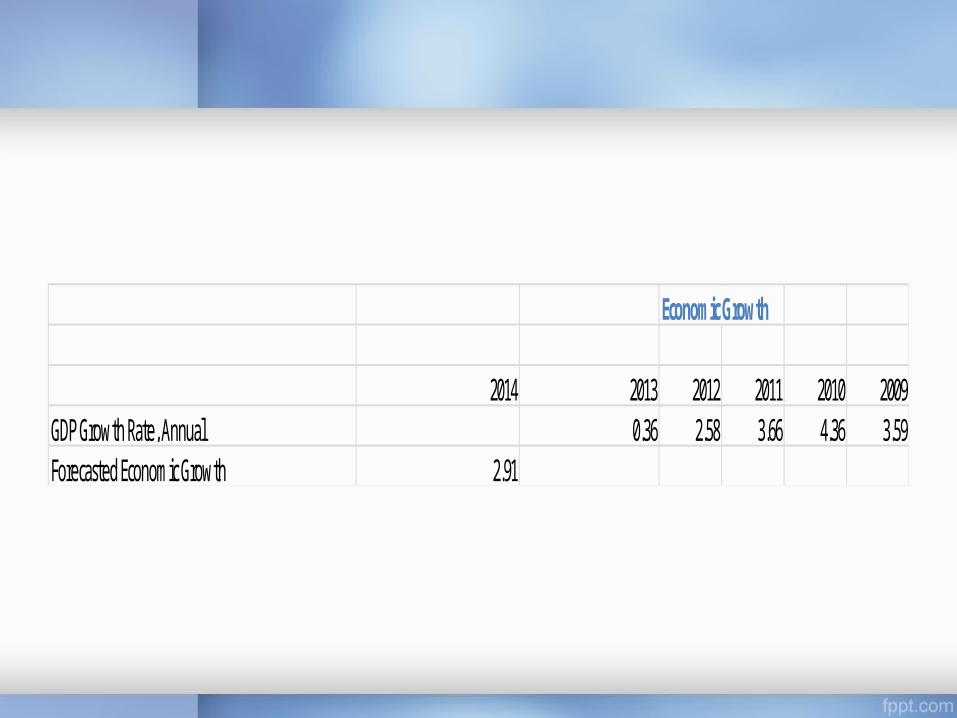
Econom ic Growth
2014 2013 2012 2011 2010 2009GDP Growth Rate, Annual 0.36 2.58 3.66 4.36 3.59Forecasted Econom ic Growth 2.91
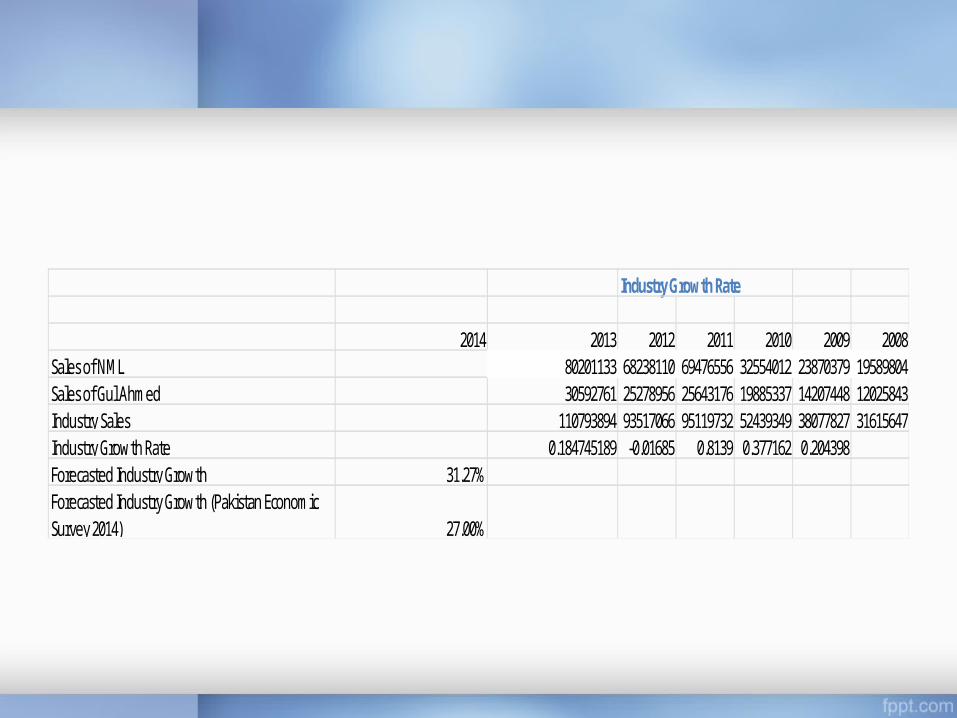
Industry Growth Rate
2014 2013 2012 2011 2010 2009 2008Sales of NM L 80201133 68238110 69476556 32554012 23870379 19589804Sales of Gul Ahm ed 30592761 25278956 25643176 19885337 14207448 12025843Industry Sales 110793894 93517066 95119732 52439349 38077827 31615647Industry Growth Rate 0.184745189 -0.01685 0.8139 0.377162 0.204398Forecasted Industry Growth 31.27%Forecasted Industry Growth (Pakistan Econom ic Survey 2014) 27.00%

Com pany Growth
2014C 2013 2012 2011 2010 2009 2008Constant Growth Rate Calculation for FCFFForm ula: g=(RR)(ROIC)
Retention Rate CalculationDividend Payout Ratio 24.05% 34.86% 23.95% 23.81% 32.10% 6.78%Retention Rate 75.95% 65.14% 76.05% 76.19% 67.90% 93.22%
Total Capital = Invested Capital = TE + Interest bearing debt 89413233 70369185 67296639 58111141 39982805 36610787ROIC = EBIT(1-T)/Total Capital 12.33% 10.53% 18.41% 6.65% 6.06% 18.15%
Growth Rates 9.36% 6.86% 14.00% 5.07% 4.12% 16.92%
Forecasted Last Five Year Sustainable Growth Rate 7.88%
Constant Growth Rate Calculation for FCFE and DDMForm ula: g=(RR)(ROE)
ROE = NI after taxation/Adjusted Equity 14.40% 10.53% 20.97% 21.46% 6.89% 18.97%
Growth Rates 10.94% 6.86% 15.95% 16.35% 4.68% 17.68%
Forecasted Last Five Year Sustainable Growth Rate 10.95%
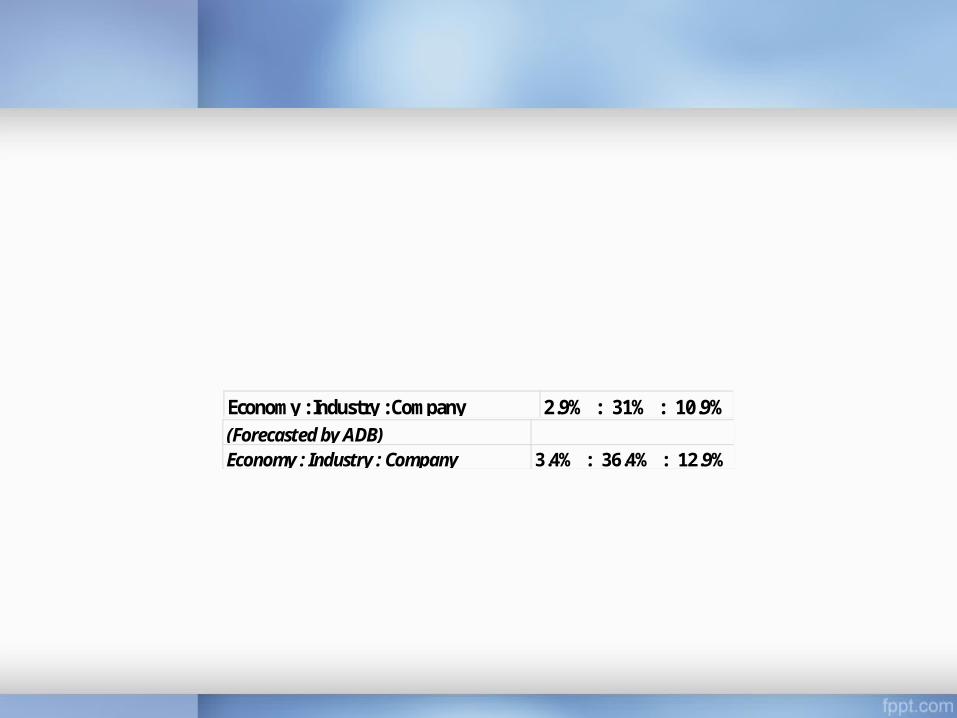
Econom y : Industry : Company 2.9% : 31% : 10.9%(Forecasted by ADB)Economy : Industry : Company 3.4% : 36.4% : 12.9%
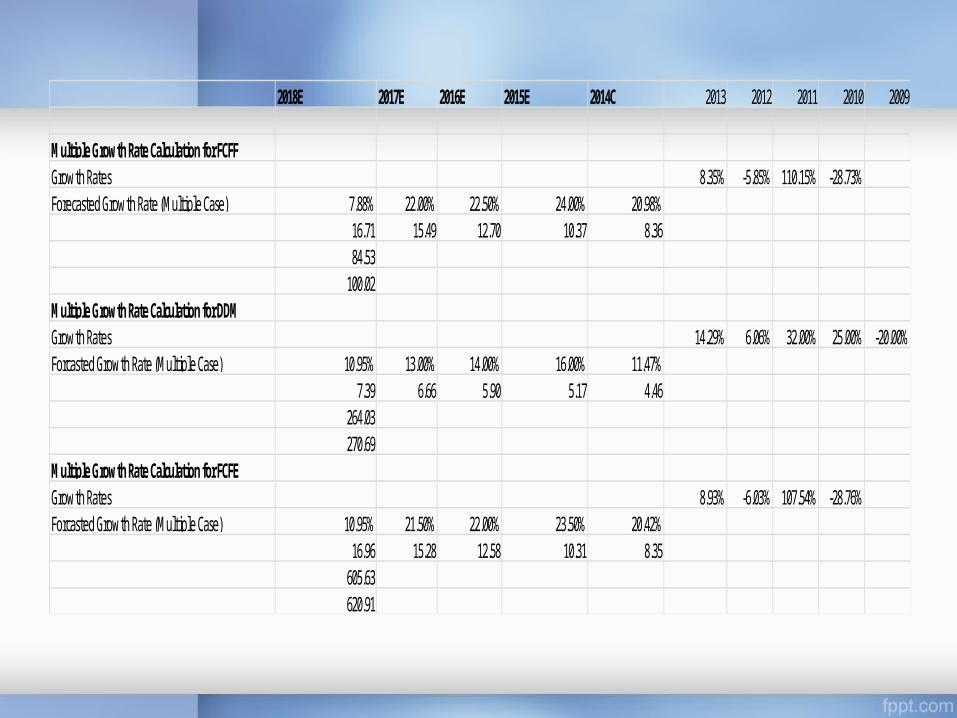
2018E 2017E 2016E 2015E 2014C 2013 2012 2011 2010 2009
M ultiple Growth Rate Calculation for FCFFGrowth Rates 8.35% -5.85% 110.15% -28.73%Forecasted Growth Rate (M ultiple Case) 7.88% 22.00% 22.50% 24.00% 20.98%
16.71 15.49 12.70 10.37 8.3684.53100.02
M ultiple Growth Rate Calculation for DDMGrowth Rates 14.29% 6.06% 32.00% 25.00% -20.00%Forcasted Growth Rate (M ultiple Case) 10.95% 13.00% 14.00% 16.00% 11.47%
7.39 6.66 5.90 5.17 4.46264.03270.69
M ultiple Growth Rate Calculation for FCFEGrowth Rates 8.93% -6.03% 107.54% -28.76%Forcasted Growth Rate (M ultiple Case) 10.95% 21.50% 22.00% 23.50% 20.42%
16.96 15.28 12.58 10.31 8.35605.63620.91

Assumptions - Multiple Growths Case
• Firstly, the granting of GSP Plus status to Pakistan will lead to greater than normal growths in the textile sector.
• We believe that the economy is in recovery and a growth of 2.9% in economy will lead to 31% growth in the industry, and 10.95% in NML.
• Hence for supernormal growth we assume the growth to DOUBLE, and also the average of changes in growth rates for FCFF for last four years comes up to be 20%.
• Since FCFF signifies the total value of the firm available to its stock and bond holders, we assume it to have the highest rate, FCFE a bit lower, and DDM the lowest as it comes only from the appropriated profits which are only a part of the company’s total earnings.
• We have assumed to the growth rates in FCFF to be hence the highest, FCFE the mid-way, and DDM the lowest!
• FY2015’s growth rate is assumed to be the highest in all cases as we believe that, this would be the year in which bounties of GSP plus Status will be cashed by NML. Also in the same year, NML has planned to increase its acquisition percentage of shares of MCB Bank Limited.
Assumptions - Multiple Growths Case
• Another reason for this is the upward revision of textile sector policies and lowering of tariffs, and easing of textile sector policies by the Nawaz Sharif Government in the upcoming budget of FY2014-FY2015.
• As far as the NML itself is concerned strong sales (owing to favorable export prospects with improved finished goods prices steady gross margins (courtesy lower cotton) and lower interest rate will all contribute to the earnings growth in FY2014.
• NML being the largest vertically integrated and most diversified company of the sector, we believe will have robust core margins, better export prospects, reduced lending rates, and energy efficient measures plus capacity expansion in coming five years.
• Driven by robust core operation on account of stellar performances under all divisions coupled with a healthy portfolio NML is all at set to post another year of robust growth as we foresee the company to post earnings growth and more than 20% in FY2014.
• Despite significant capacity additions in the past, the company is finding itself short of capacity to address the booming orders. As a result, company is pursuing to expand its production capacities.
Assumptions - Multiple Growths Case
• Given the strength of current demand and potential orders from materialization of EU duty waiver and GSP status, we believe the upcoming capacity addition will further boost revenues in the long term.
• The company also holds a well diversified portfolio invested in group companies present in financial services, cement and power sectors. The healthy payout and strong capital appreciation potential in these holding companies further strengthens the fundamental position of the company thus providing a strong guard against volatility in core operations.
• We believe that the growths will be slowed down from FY2016 to FY2017, and will resume to be the constant growth rate of 7.88% in case of FCFF and 10.95% in case of DDM and FCFE, because after five years we believe that TODAY’s sustainable growth rate will prevail.
• Also, this would be due to more new market entrants entering the sector, and as the GSP Status and government eases its policies and taxes for the sector, competition will rise.
• As competition would rise, opportunities which currently on NML has will be utilized by Gul Ahmed, Sapphire, and other competitors.
• This will eventually make NML a value company, achieving a sustainable growth rate after FY2018 as we have forecasted.
Discounted Cash Flow Analysis
• DCF is often used in the valuation of a company’s stock price.
• CFs used are Dividends for DDM, FCFE per share for FCFE Model, FCFF per share for FCFF Model.
• All CFs were positive and followed an increasing trend.
• Future CFs were estimated, using two-stage model when we can more accurately estimate growth in the near future and then assume a somewhat slower growth out into the future.
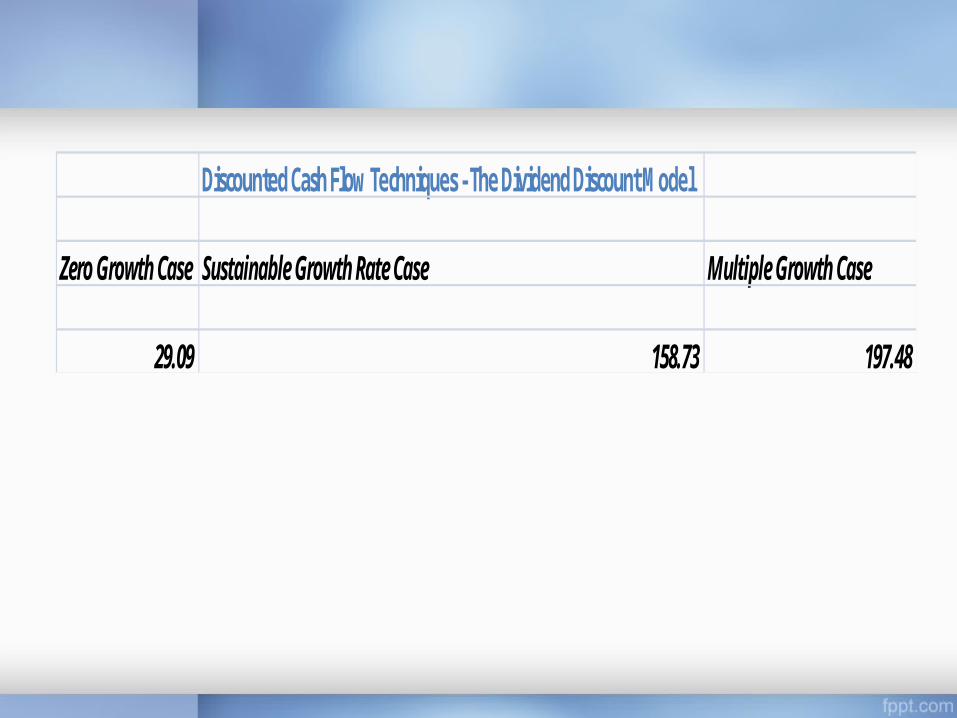
Discounted Cash Flow Techniques - The Dividend Discount M odel
Zero Growth Case Sustainable Growth Rate Case Multiple Growth Case
29.09 158.73 197.48

Discounted Cash Flow Techniques - The Free Cash Flow to Equity M odel
Zero Growth Case Sustainable Growth Rate Case Multiple Growth Case
FCFE per share (constant growth) 7.69FCFE per share (m ultiple growth)FCFE per share (zero growth) 6.93Intrinsic Stock Price (Forecast) as at 31st June, 2014 50.42 275.11 449.00

Discounted Cash Flow Techniques - The Free Cash Flow to Firm M odel
Zero Growth Case Sustainable Growth Rate Case Multiple Growth Case
FCFF per share (constant growth) 7.45FCFF per share (m ultiple growth)FCFF per share (zero growth) 6.91Intrinsic Stock Price (Forecast) as at 31st June, 2014 24.99 37.71 72.36
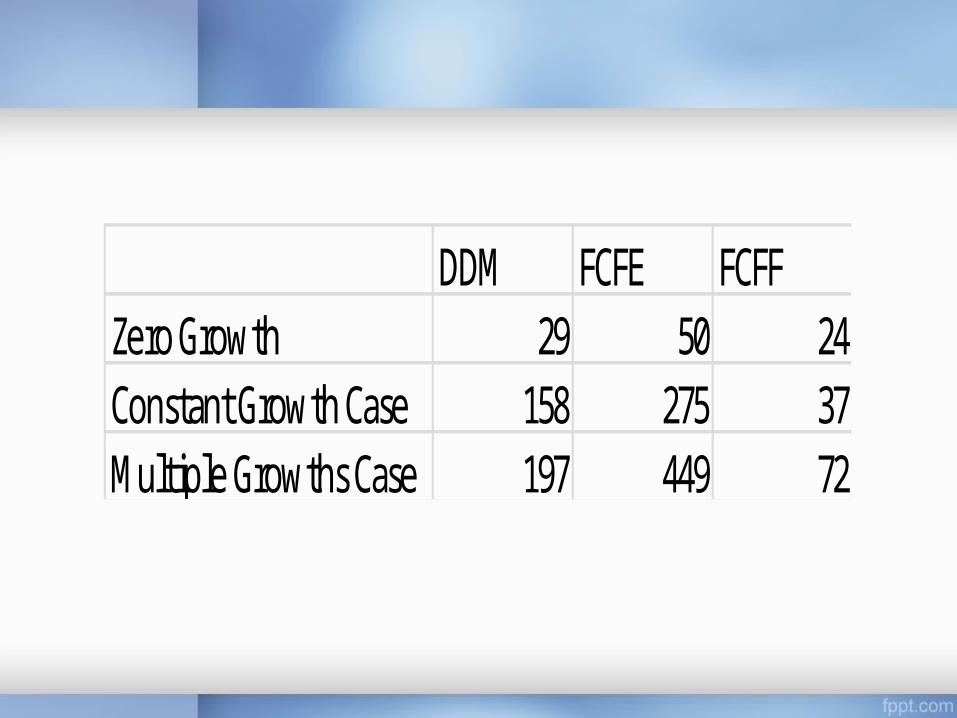
DDM FCFE FCFFZero Growth 29 50 24Constant Growth Case 158 275 37M ultiple Growths Case 197 449 72
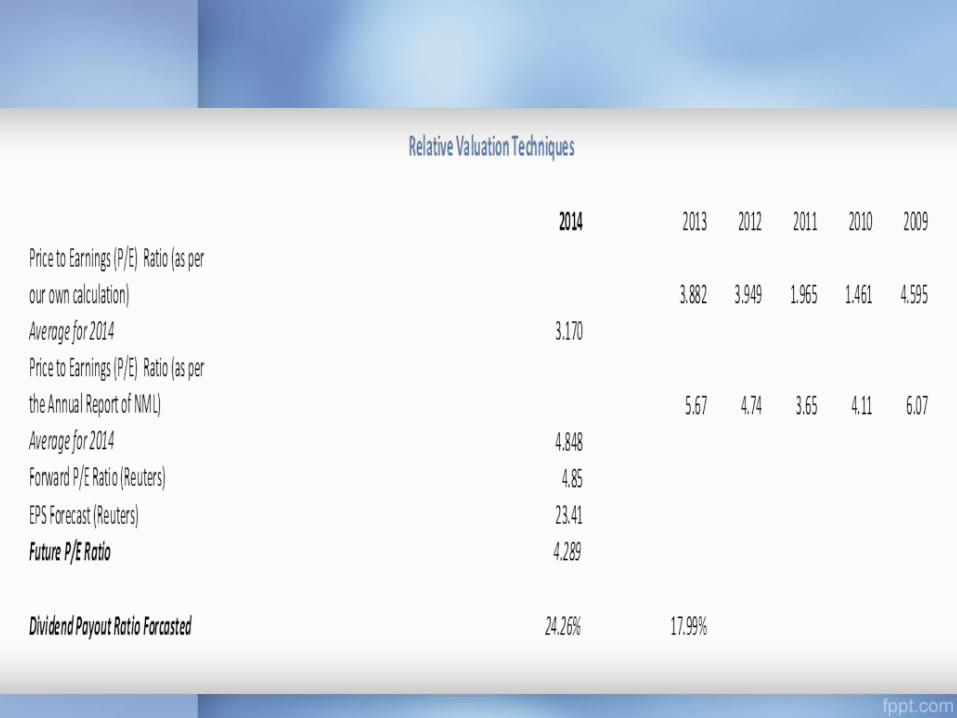
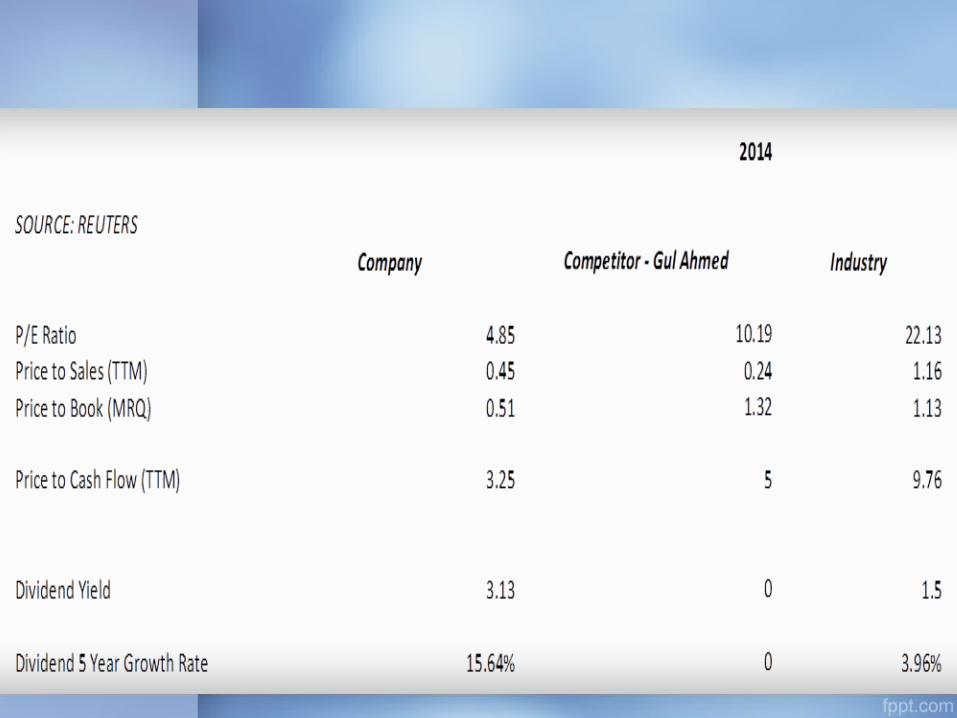
Relative Valuation Techniques
• Very useful and effective tool in valuing stocks
• Investors
• Firm's financial worth
• Absolute value models
• Determining whether a company's stock is worth it
Outlook for NML 2014• Due to the granting of GSP plus - NML’s competitiveness due to
duty free access to European markets and increasing contribution towards national exchequer in the form of valuable foreign exchange.
• NML’s policy of investment in enhancement of our production capacities will persist in future as well.
• Rise in the demand of Pakistani yarn in Chinese markets is expected to continue in near future.
• Setting up a new spinning unit at Feroze Watwan - increase production capacity.
• Has not ignored value added sector and is introducing innovative solutions to augment revenue on sales to designer based premium products.
• Future outlook of NML’s operations is bright for the FY 2014.
Conclusion – Buy, Hold or Sell?
• We believe that the 31st June, 2014 intrinsic price stands at Rs. 158 per share which has been the result of incorporating a sustainable growth rate of 10.9%, using the DDM.
• Currently the stock is somewhat undervalued (Rs.117) and we expect the price to further go up to Rs. 158 per share by December, if not June - possible after a favorable budget for the FY2014-FY2015 is released by the government which would potentially revive the sector.
• Our stance is to HOLD the security for this whole year, and even to BUY the security as soon as possible during June’14.
• Our results and conclusions are in line with those of BMA Capital (Rs. 150 per share target price), Taurus Research (Rs. 152 per share target price) and Reuters.
References
• Pakistan Textile Journal, December 2013 and January 2014 issue• Pakistan Economic Survey 2013• Highlights of the Pakistan Economic Survey 2013• Statistical Appendix from the Pakistan Economic Survey 2013• Pakistan Bureau of Statistics• World Bank: World Development Indicators• Nishat Mills Limited: Official Website• Annual Reports of Nishat Mills Limited from 2008 to 2013• KSE’s Official Website• BMA Capital’s Website for Research• Reuters• http://www.thenews.com.pk/Todays-News-3-257397-KSE-to-evolve-
around-political-events-next-week