
TIARA Annual Report 2001 - International Atomic Energy ...
376
JAERI-Review JP0250516 2002-035 TIARA Annual Report 2001 vember 2002 Advanced Radiation Technology CenteF El * OF, )J fff YE Ph Japan Atomic Energy Research Institute
-
Upload
khangminh22 -
Category
Documents
-
view
5 -
download
0
Transcript of TIARA Annual Report 2001 - International Atomic Energy ...
JAERI-Review JP0250516
2002-035
TIARA Annual Report 2001
vember 2002
Advanced Radiation Technology CenteF
El * OF, )J fff YE Ph
Japan Atomic Energy Research Institute
4� L� t I, B 4q-T- I ff Vfrt��/T-5i7M U -C V ff3M'M T�
(7319-1195
WK4#) SC,
(t319-11957S
This report is issued irregularly.
Inquiries about availability of the reports should be addressed to Research Information
Division, Department of Intellectual Resources, Japan Atomic Energy Research Institute,
Tokai-mura, Naka-gun, Ibaraki-ken, 319-1195, Japan.
(C Japan Atomic Energy Research Institute, 2002
ISA*-ZIT B Aq T )I 9 5E FT
JAERI-Review 2002-035
TIARA Annual Report 2001
Advanced Radiation Technology Center
Takasaki Radiation Chemistry Research Establishment
Japan Atomic Energy Research Institute
Watanuki-cho, Takasaki-shl, Gunma-ken
(Received October 3 2002)
This annual report describes research and development activities which have been performed with
the JAERI TIARA (Takasaki Ion Accelerators for Advanced Radiation Application) facilities from
April 1, 2001 to March 31, 2002. Summary reports of 109 papers and brief descriptions on the
status of TIARA in the period are ontained. A list of publications, the type of research
collaborations and organization of TIARA are also given as appendices.
Keywords: JAERI TIARA, Ion Accelerators, Solid State Physics, Radiation Effects in Materials,
Materials for Space, Semiconductors, Organic Materials, Iorganic Materials, Nuclear
Fusion Reactor, Functional Materials, Radiation Chemistry, Radiation Biology, Nuclear
Medicine, Biotechnology, Radioisotope Production, Nuclear Chemistry, Radiation
Shielding, Materials Analysis, Mcrobeam Technology, Accelerator Technology, Safety
Control
(Eds.) Masahiro SAIDOH, Yosbihiro OHARA, Hdeki NAMBA, Hsayoshi ITOH,
Shigeiru TANAKA, Hiroshi NARAMOTO, Toshiaki SEKINE, Atsushi TANAKA,
Yasuhiko KOBAYASHI, Kazuo ARAKAWA, Mchiaki OTSUBO, Satoshi
TAJIMA and Susumu TANAKA
JAERI-Review 2002-035
R (T I A R A) 3
(2002 1 A 3 Fi
71- 2001 q� 4 A I 6 2002 3 31 f -i
1)
4) MM/04, 5) #*A�fft 6 K**
6PIAVa�VfT T 370-1292 MRPMAK -f�,T&JRURT 1233
�ff*WtC 04,9U&
JAERI-Review 2002-035
PRUACE
This report covers research and development ativities which ave been conducted wth 11ARA(Takasaki Ion
accelerators for Advanced Radiation Application) during the period from April 2001 to March 2002 ad also givesan outline of the operation of TIARA in thesame pniod.
All accelerators in TIARA, the AVF cyclotron, the MV tandem accelerator, the MV ilgle-encled acceleratorand OkV ion mplanter. ave been operted steadily sce the construction were ompleteci III 1993, and ave
supplied the beam-tini t the research programs as had been recognized HI advance by the SUbconu-nittee of TIARAof Advisory Council for JAERl's Research Facilities, In the ame time, available species and energy ranges of ionshave been Widened to meet requirements from users, and the quality of ion beams ave been improved gmdually.
In the semiconductor devices for space applications. the otput characteristics ofInGaP/InGaAs/Ge solaT cells were examined with proton bam irradiation to characterize theradiation tolerance. e single event tolerance was investigated for I diodes using high-energy ionmicro-beam svstem installed in a beam course of AVF cclotron. New types of errors were alsoobserved for the commercial 16 Wit SRAM irradiated with heavy ion particles in addition to teusual single event phenomena. In the development of SIC devices', the radiation effects of SIC-basedp-channel metal-oxide-semicondtictor field-effect-transistors (MOSFETs) were examined and theirradiation tolerance was discussed.
In the field of heavy�ion-microbeani application for biology, the microbeam cell in-adiation system that providesprecise-numbered heavy ions has been improved in its throughput- Usirig this system, it was emortstiated that gapjunction intercellular communication may have an essential role in the radiation-induced bystander effect i nonnalhuman fibroblasts, For the positron emitting tracer imaging system (PMS), the PETIS was applied to an experimentof iron uptake by an iron absorpfion maze mutant, and was found to be useful iii testing quarititatively the ability of amutant, For the muttation 'induction of plants by ion-beam iirradiahon, new Carnation varieties Vital Ion series' wererapidly developed by a combination of carbon-ion mutagenizalicin tchnique and in vitro cell and tissue ulture
technique.In the field of radiation chemistry and organic materials eperimental studies of nano-Aire fonnation along an
ion trajectory, thin film dosimeter for ion beams, and sape control of etched pores have ben continued. The singletrack gelation of polysilane based on the selective adhesion by the surface treatment is very useful for the positioning
of the nano-wires on a substrate, With the aim of the application to nano-scopic electronic devices, it was confirmedthat copper nano-vares grew upon the copper electrode through the pores of ion track membranes by the electrodeposition technique. 'the thin film dosimeter was applied to measure the dose dtribution of 3-45 MeV/u ion beams.
The ftinctional nano-filters wit a ftinnel shape were fabricated by using the two-step etching method. as flus is a veryunique techruclue. The LET dependence on pmar pocess was investigated by measuring the G-value of oxides
generated in aueous phenol solution after heavy ion Irradiation and by using the absorption spectroscopy system forion bea pse radiolysis in polystyrene-cyclohexane system.
hi the field of nuclear fusion materials, various kinds of experiments were carried out. For smulating the neutrondamage and the effects of He and produced tansmutation reactions. dual or triple ion-bearris were rradiated
onto the candidate fusion materials (ferritic/martensitic steels, austenitic stainless steels. SiC/SiC cmposites LTiO3ceramics, etc,). Effects of implanted helium and dose rate on physical, chemical ad therino-mechanical. properties(He embrIttlement, hardness, high temperature strength) as well as microstruchual evolutions (dislocation loops,swelling) during irradiation were Investigated.
In the field of organic materials, election radiation effects have been widely irivestigated. Electrical resistance of
hydrogen-charged Pd aoys inadiated by 0.5MeV ections at low temperawres was measured to study the effect ofordering/clLsordering of hydrogen isotopes. Change in resistivity of EuBa�Cu.30y iriadiated with energetic elections
was also measured to ivestigate the process of defect production due to electron inadiation. In addition, Fe-Cu.
M
JAERI-Review 2002-035
alloys were irradiated by 2MeV electrons to lar* the mechanisms of radiation embrittlement. Structural changes nGo molecules with 7-MeV C" ions were investigated using Raman spectroscopy As for hhly efficient
photocataly4Cr-dopedTO2fi6nwfthconcenuauongracheiitswasreahzedwith150keVCr-'-ioni lantation.As the scientific ativities in 2001, the continuing effort has been devoted to the s"ce modification of inorganic
materials y employing the improved techniques. Especially a systematic approach to the modification of electronicT in
structurem i2hasbeenperfonnedi combmabonwiththecalculationbasedonthefustprinciple(F-LAPW).Forthe study of the interactions between energetic cluster ions and solid sur&w channeling expenment was performedby changing the number of aoms in clusters. From the view point of materials science, it sould be noted that thereappeared several papers teat the spontaneous structure formation or segregation ihornogeneous systems.
In nuclear science ad radioisotope production, the development of poskyon-emitting radioisotopes to be used nbiology was continued. In particular different materials of a target vial was tested to increase NO3 ions and to
decrease 13NO,- ions in a proton-inadiated. water. Using an isotope separator, energy dependence of the yield ofendohedral 132Xe Merene was studied.
hi the in-air micro-PI)CE analysis, the success of elemental mapping for a sce of animal tissue samples an
atmospheric evironment is worthy of one. To calculate the mass thickness and mass of each element for individualenvironmental samples, the method of quantitative analysis has been established by asing a calibi-ation curve of thestandard sample A large solid angle x-rays dector has ban successfully developW for high-efficiency elementanalyses in the living cells.
In the field of radiation shielding for accelerator facilities, three experiments have been performedaiming to contribute to the radiation safety of the accelerator facilities. The first one is on theformation of radioactive aerosols under high-energy radiation fields and te experimental results onthe effects of neutron energy and added aerosol are discussed in terms of the atLachment model. Thesecond is on the successful development of a Bragg Curve Spectrometer (BCS) for fragmentspectroscopy in neutron and proton induced reactions. The third oe is o the response of personaldosimeters to high-energy eutrons and it was confirmed that te lead-converter was effective toimprove the sensitivity of the bbble detector.
In the accelerator technology, a magnetic field of the AVF cyclotron was measwed by the NMR rykagnetometerA ft-top acceleration for the cyclotron as been designed to ummize te eergy spread niamly for inicrobearnfon-nation A new feedback loop with a pair of the slits was efective to sabilize the voltage of the sngie-ended.accelerator A new sputter negative ion source was installed to the tandem accelerator New emdLince monitor witha multiple clearance, an illuminator and a CCD camera was developed. The submicron ion bewri systein wassuccessfully acl-&ved to produce the beam of 0 I pnimi diameter.
The reception of the sers ad the spports on utilizations for the experiments, safi* nonagernent. of theradiation controlled aria, mid odier dses ave been practiced smoothly
The Eleventh TARA Research Review Meemig was held on July 11 mid 12, 2002 in Takasaki, of whichsubjects were reported in this ssue. 12 oral and 83 poster papers, and two invited lectures were presented. 287persos participated the meeting. Results of TIARA concerning to the micTobeam technologies ad teir applications
were also pesented in occasion of the 9" International Conference o Nuclear Mcroprobe Technology adApplications which was held at Takasak o September 813, 2002 oganized by JAERL
We owe the progress entioned above to advicles of the Consultative Coturnittee for the JAERI-UmversiftesJoint Research Projectand Subcommittee of TIARA of Advisory Cowicil for JAERI'Resemeh Facilities.
Masahiro Saidoli, DirectorAdvanced Radiation Technology Center
TAasaki Radiation Chemistry Research Establishment
i V
JAERI-Review 2002-035
Contents
1. Semiconductor for Space ..................................................
1.1 Measurement of Single Event Transient Current Using Collimated Heavy-ion
M icro-beam ........................................................
1.2 Analysis of Single Event Error Mode in 16Mbit SRAMs ..................... 5
1.3 Radiation Effects on High-efficiencv InGaP/lnGaAs/Ge Terrestrial Tiple-junction
Solar Cells ........................................................ 8
1.4 Analysis of Failure Caused by Cosmic Rays in High-voltage High-power
Sericonductor Devices (2nd. Report) ..................................... I
1.5 Study of Charge Collection Mechanism using Multi Lne Schottky
Barrier Diode ....................................................... 14
1.6 Gamma-ray Irradiation Effects on p-channel 6H-SIC Metal-xide 'conductor Transistors ........................................
-serm 7
2. Biotechnology ............................................................ 21
2.1 Lethality of Single Tobacco Cells Irradiated with Heavy Ions .................. 25
2.2 Mutation Generation Protoplasts of Chrysanthemum with 4He 2� and
12C5+ Ion Beams .................................................... 282.3 Effects of Ion Beams on Shoot Regeneration of Elatior Begoia (B. x hiemalis
Leaf Cultures ...................................................... 31
2.4 Isolation of an Arabidopsis Mutant Defective in Damage Tolerance ............. 33
2.5 Development of the Efficient Mutation Breeding Method using
Ion Beam Irradiation ................................................. 36
2.6 Development of Mutant Varieties "Vital Ion Series" in Carnation by
Ion Beam Breeding .................................................. 39
2.7 Mutation Generation in Chrysanthemum Plants Regenerated from Floral
Organ Cultures Irradiated with Ion Beams ................................. 42
2.8 Effects of Ion Beam Irradiation on Chrysanthemum Leaf Discs and
Sweetpotato Callus .................................................. 44
2.9 RAPD Analysis of Xanta and Waxy Mutants Induced by Ion Beam Irradiation
to Hinoki Cypress(Chamaecyparis obtuse) ................................ 47
2.10 Induction of Mutation in Garlic (Allium. Safivum L. by Ion Beam Irradiation ..... 49
2.11 Characters of Tomato cv. First Mutant with Short Intemode Induced by
Irradiation of 12C 5+ Ion Beam to the Seeds ................................. 521 ion ........2.12 Mutation Breeding of Rice, Eggplant and Glonosa by Ion Beam Irradiati 54
2.13 Regeneration of Variegated Plants From Ion-beam Irradiated Explants of
Ficus stipulata Thimb ................................................. 57
2.14 Effect of Ion Beam Irradiation on the Growth of Netted Melon
V
JAERI-Review 2002-035
(Cucumis melo L.) .................................................. 60
2.15 Mutation Induction with Ion Beam Irradiation Solanum Plants ............... 62
2.16 Instablity of Rice Chlorophyl Mutants Induced at MI by Carbon
Ion Beam Irradiation Is Inherited ........................................ 64
2.17 Studies on Flower Color and Morphological Mutations from In Vitro
Chrysanthemum Explants Irradiated with Ion Beams ........................ 68
2.18 Induction of Mutation in Delphinium L. by Ion-beam Irradiation ............... 70
ism ...............2.19 Isolation of Arabidopsis Mutants Defective Root Hydrotropi 72
2.20 Single-hit Effects on Mammalian Cultured Cells with Heavy-ion Microbeams ...... 74
2.21 Regeneration of Hemopoletic Organs in the Silkworm, Bombyx mori,
After the Selective Irradiation of I 0 Gy Carbon Ions ........................ 77
2.22 Mechanism of Bystander Effect Induced by Precise-numbered Heavy Ions ........ 86
2.23 The Effect to Mammalian Nucleus by Irradiation of Heavy Ion Beams ........... 83
2.24 Dynarical Study on Influence of the C02 Enrichment to the Photoassimilate
Transportation using Positron maging .................................... 86
2.25 Effect of Atmosphere Gas Conditions on Soybean (Glycine Max L.
13 1 ity . . . . . . . . . . . . . . . . . . . . . . . . . . . . . . . . . . . . . . . . . . . . . . . .N2 Fixation Activi 89
2.26 Absorption and Transfer of the Iron (52 Fe) in the Iron Absorption
Maize Mutantys] . .................................................. 92
2.27 Effects of Cold Stress on 11 C Distribution in Rice Plants 95
Detected by PETIS Detector ...........................................
2.28 Water and Trace Element Behavior in a Plant ............................. 98
2.29 Positron Imaging Analysis of Assimilation and Translocation of
Carbon and Nitrogen Sources in Rice Plant ................................ 100
2.30 Uptake of 18 FDG and 13 NO3_m' Tomato Plants ............................. 103
2.31 Utilization of Ion Beam-irradiated Pollen in Plant Breeding .................... 105
2.32 Study on the Apoptosis Induction by a Local Damage using
Penetration Controlled Ion-beam Exposure ................................ 108
3. Radiation Chemistry Organic Materials ....................................... 109
3.1 Preparation of Functional Nano-porous Membranes ......................... III
3.2 Preparation of Copper Nanowires using Ion Track Membranes . ................ 113
3.3 Nano-wire Formation and Selective Adhesion on Substrates bv
Single Track Gelation of Polysilanes ..................................... 115
Ox'dat' Product Y'elds of Phenol along Heavy Ion Trajectory in
Aqueous Solution Differential G-value . .................................. 117
3.5 Crosslinking of Polymers in Heavy Ion Tracks ............................. 119
I is ..........).6 Pnman7 Process of Radiation Chemistrv Studied bv Ion Pulse Rad'olvs' 121
3.7 Dosimetrv for 345 MeV/u Ion Beams using Thin Film Dosimeters ............. 123
Vi
JAERI-Review 2002-035
4. Inorganic M aterials .......................................................... 125
4.1 Effect of Helium on Ductile-brittle Transition Behavior in Reduced-activation
8Cr-2W Martensitic, Steel ............................................. 127
4.2 Swell' Behavior of F82H Steel Irradiated by Triple/Dual Ion Beams ........... 130
4.3 Microstructure Change with Ion Beam Irradiati n L TiO .................. 133
4.4 Effect of Multi Ion-beams Irradiation on Mechanical Properties of Advanced
SIC/SiC Composites for Fusion Systems .................................. 136
4.5 Damage Evolution High Energy Multi Ion-irradiated BCC Metals and
the Interaction between Gas Atoms (H and He) and Damage Defects ............. 140
4.6 Effects of Dose Rate on Microstructural Evolution in Austenitic Alloys .......... 143
4.7 Investigation of Iff adiation-mduced Hardening of F82H Steels rTadiated by
Dual/Triple Ion Beams ................................................... 146
4.8 Effect of Triple Ion Beam Irradiation on Mechanical Properties of High
Chromium Austenitic Stainless Steel ..................................... 149
4.9 Effect of Ion Irradiation on Mechanical Property of Materials Contact
with Liquid Metal ................................................... 152
4.10 Microstructure Evolution of the Advanced Fuel Claddi Material by
Triple Ion Irradiation ................................................. 155
4.11 Effects of Irradiation on Microstructure of Zircaloy-2 ........................ 158
4.12 Effects of Initial Grain Boundary Segregation on Radiation-mduced
Segregation ' SUS 3 16L Stainless Steel .................................. 161
4.13 Effect of an Electric Field on the Formation Process of Dislocation Loops in
He'Arradiated cE-A'203 ............................................... 164
4.14 Photolummescence Properties of Th Implanted GaN ......................... 167
4.15 Formation Process andStability of Radiatio n-induced Non-equilibrium
Phase in Silicon (111) ................................................. 170
4.16 Effect of Cr-ion Implantation in TiO2:
Realization of Impurity Concentration Gradients ..... 173
4-17 Modification Of C60 Thin Films by 7-MeV 12 C2+ Ion Irradiation ................ 1764.18 Investigation of the Resonant Vibration Modes of Self Interstitial Atoms in
Hcp Metals by Low Temperature Specific Heat Measurement ................... -179
4.19 Hydrogen Migration in Electron Iadiated Pd-based Alloys .................... 181
4.20 Electron Irradiation Effect in Oxygen-deficient EuBa2CU30 Y .................. 184
4.21 Interaction of Frenkel Pairs with Cu Atoms Fe-Cu Alloys ................... 186
4.22 Radiation Enhanced Copper Segregation Processes in Pressure Vessel
Steel Model Alloys during Electron Irradiation ................. I ............. 188
4.23 Radiation Effects on Li-vacancy Ordering in NaTI-type Li Compound ........... 191
4.24 Elastic Property of Nanocrystalline Gold after Low-temperature 2 MeV
Vii
JAERI-Review 2002-035
Electron Irradiation .................................................. 193
4.25 ESR Characterization of Activation of Implanted Phosphorus Ions in
Silicon Carbide ..................................................... 195
5. M aterial Analygis ........................................................... 199
5. i Fast Dffusion of Defect Clusters Copper under Irradiation with I 00-keV
Carbon Ions ........................................................ 201
5.2 In-situ Observation of Growth Processes of Transition Metal Nitride
Thin Films by Nitrogen-implantation ..................................... 203
5.3 Preparation of Epitaxial Anatase TiO2 Films by Pulsed Laser Deposition ......... 206
5.4 Fabrication of Titanium Dioxide Nanoparticles on Sapphire ................... 208
5.5 Development of High Performance Buffer Materials
-Sorption Mechanism of Europium. by Sniectite . .......................... 211
5.6 Electron Emission from Solids by Fast Cluster Impact ........................ 214
5.7 Improvement Surface Roughness of Nitrogen-implanted Glassy
Carbon by Hydrogen Doping 11 ......................................... 217
5.8 In-situ Analysis on Adsorption and Desorption of Atoms at Liquid-solid Interface by,
Use of Rutherford Backscattering Spectroscopy ............................. 220
5.9 Percolation of Liquid Indiurn through Porous Media Compos of
Ni and C60 .................... ;................................. ..... 2225.10 AFM Observation of Nano-sized SIC Dots Prepared by Ion Beam
Deposition Method ................................................... . 225
5.11 Encapsulated Structure in CO-C60 Sstem .... f ............................ 228
5.12 Structure and Optical Properties of Ge Implanted with Carbon Ions . .............. 231
5.13 Study of Improvement of Ion Irradiation I'd Using a Slow Positron Beam : ........ 234
5.14 Anomalous Cher'cal Bond Formation Polycarbonate by Cluster Impact ........ 237
5.15 Evaluation of Three Dimensional Microstructures oil Silica Glass Fabricated by
Ion Microbeam ............................... ...................... 240
5.16 Uptake of Heavy Metals by Synthetic Mica and Apatite ........ .............. 243
6. Nuclear Science and RI Production ....................................... 247
6.1 13 N03-Yield in Proton-irradiatdd Water for Diffirent Materials ofa Target Chamber .................................................... 249
6-2 Dose Effects of the Production Yield of Endohe&al 133 Xe-fullerene by
Ion Implantation .................................................... 251
7. Microbearn Application ...................................................... 253
7.1 Development of a High-energy Heavy Ion Microbeam &
S' le Ion Hit System ................................................ 255
Viii
JAERI-Review 2002-035
7.2 Simultaneous Mapping of Fluoride Both in the Tooth and in the Dental Material
Filled in a Cavity of the Tooth us' PIGE ................................ 258
7.3 Development of In-air Micro-PIXE Analysis System ........................ 261
A. Tanaka, K. Ishii, Y. Komori, S. Matsuyama, H. Yamazaki, K. Kubota,
7.4 Preliminary Study on Qantitative Elemental Analysis for Environmental
Samples Using Micro-PIXE .......................................... 264
7.5 Application of In-air-Micro-PIXE Analysis System to the Study of Metabolic
Function in the Cell .................................................. 267
7.6 Development of a Large-solid-angle Multi-element Detection System foris ....................................
High-sensitivity Micro-PLXE Analys' 270
7.7 Analysis of Arsenic Around an Arsenic Mine by �t-PIXE ...................... 273
8. Radiation Shielding for Accelerator Facilities .................................... 277
8.1 Effects of Neutron Energy and Added Aerosol on Radioactive Aerosol
Formation under High Energy Neutron Irradiation .......................... 279
8.2 Development of a Bragg Curve Spectrometer (BCS) for Fragment
Spectroscopy Neutron and Proton Induced Reactions ...................... 282
8.3 Response of Personal Dosimeters to High-energy Neutrons ................... 285
9. Accelerator Technology,/TIARA General ....................................... 289
9.1 Measurement of Secondary Charged Particles with MeV Energy
Cluster Ion Irradiation ................................................ 291
9.2 Study of Secondary Ion Emission Processes from Solid Targets
Bombarded by MeV Energy Cluster Ions ................................. 294
9.3 Development of a Magnetic Field Monitoring System for the JAERI
AVF Cyclotron ..................................................... 296
9.4 Development of the Flat-top Resonator for the JAERI AVF Cyclotron .......... 298
9.5 Present Status of JAERI AVF Cyclotron System ............................ 300
9.6 The Number of Operations for Auxiliary Safety Devices ................. 303
9.7 Modification of the Vacuum System for AVF Cyclotron ....................... 305
9.8 Energy Stabilization of TIARA 3MV S'gle-ended Accelerator ................ 308
9.9 Increase of a Negative Heavy Ion Source for the MV Tandem Accelerator ...... 311
9.10 Development of Image Analysis Type Emittance Monitor ...... .............. 312
9.11 Improvement of the Injection Electrode System for Formig a Submicron
Ion Beam .......................................................... 314
10. Status of TIARA 2001 ...................................................... 31710.1 UtilizationofTLkRAFacilities ......................................... 319
10.2 Operation of JAERI AVF Cyclotron System ............................... 321
ix

JAERI-Review 2002-035
10.3 Operation of the Electrostatic Accelerators ............................ . 22
10.4 Radiation Control Radioactive Waste Management in TARA ................ 323
Appendix ................................................................... 327
Appendix 1. List of Publication ................................................... 329
Appendix 2 Type of Research Collaboration ......................................... 358
Appendix 3 Organization and Personnel of TIARA .................................... 360
X
JAERI-Review 2002-035
1. Semiconductor for Space
1.1 Measurement of Sngle Event Transient Current Using Collimated Heavy-ion
M icro-beam ........................................................ 3
S. Onoda, T. Hirao, J. S. Laird, H. Mon', H. Abe and H. Itoh
1.2 Analysis of S' le Event Error Mode 16Mbit SRAMs ..................... 5
H. Shmdou, Y. fide, T. Aburaya, S. Kuboyama, S. Matsuda, T. Hirao,
T. Ohshima, M. Yoshikawa and H. Itoh
1.3 Radiation Effects on High-efficiency InGaP/InGaAs/Ge Terrestrial Triple-junction
Solar Cells ........................................................ 8
M. Imaizurru. 0. Anzawa, S. Kawakita, T. Ohshima, M. Yamaguchi, H. toh
and S. Matsuda
1.4 Analysis of Failure Caused by Cosmic Rays in High-voltage High-power
Semiconductor Devices (2nd. Report) ..................................... I I
H. Matsuda, 1. Omura, Y.Sakiyama, S. Urano, S. Iesaka, H. Ohashi, T. Hirao,
H. Abe, H. Itoh, H. Mori and S. Onoda
1.5 Study of Charge Collection Mechanism us' Multi Lne Schottkymg
Barrier Diode ....................................................... 14
H. Mori, T. Hirao, J. S. Laird, S. Onoda and H. toh
1.6 Gamma-ray Irradiation Effects on p-channel 6H-SIC Metal-
oxide-semiconductor Transistors ........................................ 17
T. Ohshima, K. K. Lee, A.Ohi, M. Yoshikawa and H. Itoh

This is a blank page.
JAERJ-Review 2002-035
Measurement of Single Event Transient Current UsingCollimated Heavy Ion Micro Beam
S. Onoda*, T. Hrao**, J. S. Laird", 1tMori*, H. Abe**, H. Itoh**
Graduate School of Engineering, Tokai University*
Department of Material Development, JAERl**
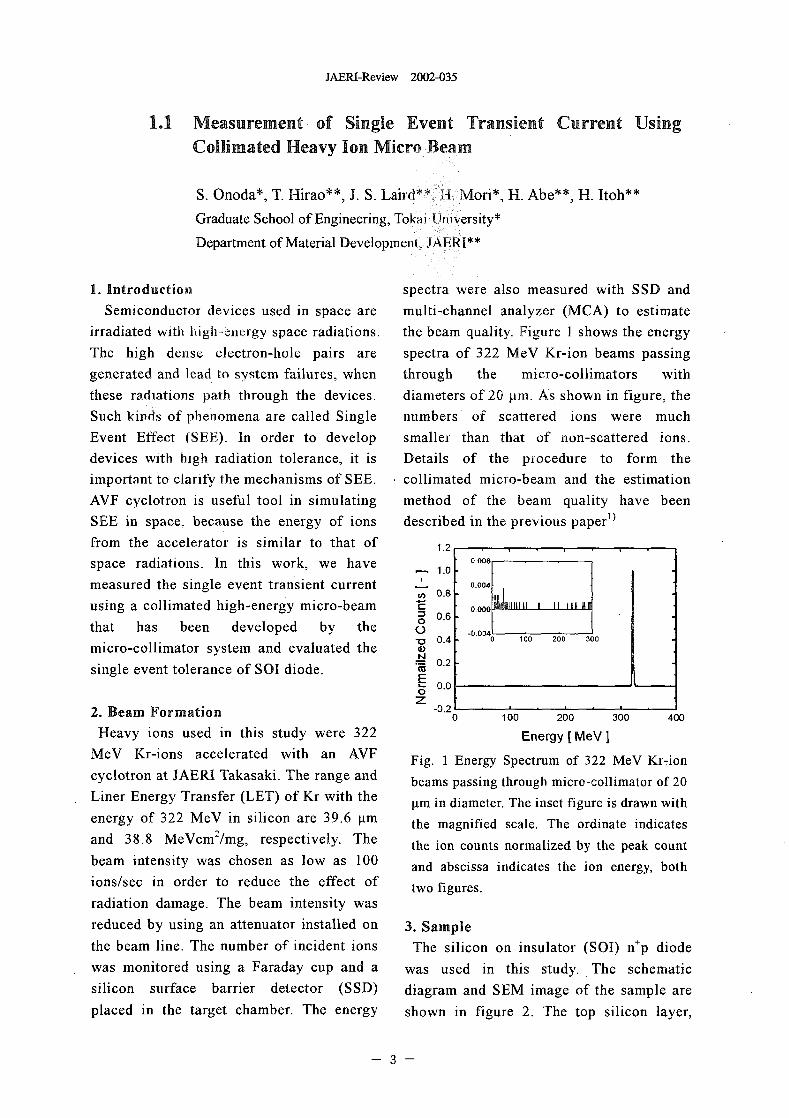
1. Introduction spectra were also measured with SSD andSemiconductor devices used in space are multi-channel analyzer (MCA) to estimate
irradiated with high-energy space radiations. the beam quality. Figure I shows the energyThe high dense electron-hole pairs are spectra of 322 MeV Kr-ion beams passinggenerated and lead to sstem failures, when through the micro-collimators withthese radiations path tough the devices. diameters of 20 pn. As shown in figure, theSuch kinds of penomena are called Single numbers of scattered ions were muchEvent Effect (SEE). In order to develop smaller than that of non-scattered ions.devices with high radiation tolerance, it is Details of the procedure to form theimportant to clarify the mechanisms of SEE. collimated micro-beam and the estimationAVF cyclotron is useful toot in simulating method of the beam quality have beenSEE in space. because the energy of ions described in the previous paper"from the accelerator is similar to that of 1.2
0.008space radiations. In this work, we havemeasured the single event transient current 0.004
U) 0.8-using a collimated high-energy micro-beam C 0 000
0= 0.6that has been developed by the 0 -O.OD
-0 0.4 0 1�0 280 3 micro-collimator system and evaluated the 0
0.2-single event tolerance of SOI diode. ME 0.00:7
2. Beam Formation -0.2 0 100 200 300 400
Heavy ions used in this study were 322 Energy MeV ]
MeV Kr-Ions accelerated with an AVF Fig. IEnergy Spectrum of 322 MeV Kr7ion
cyclotron at JAERI Takasaki. The range and beams passing through micro-collimator of 20
Liner Energy Transfer (LET) of Kr with the gm in diameter. The inset figure is drawn with
energy of 322 MeV in silicon are 39.6 m the magnified scale. The ordinate indicates
and 38.8 MeVCM2/Mg , respectively. The the ion counts normalized by the peak count
beam intensity was chosen as low as 100 and abscissa indicates the ion energy, both
ions/sec in order to reduce the effect of two figures.radiation damage. The beam intensity was
reduced by using an attenuator installed on 3. Sample
the beam line. The number of incident ions The silicon on insulator (SOI) np diode
was monitored using a Faraday cup and a was used in this study. The schematic
silicon surface barrier detector (SSD) diagram and SEM image of the sample are
placed in the target chamber. The energy shown in figure 2 The top silicon layer,
- 3 -
JAERI-Review 2002-035
E Al Electrode 50pm 200.IQ
n < 0.0
-200.0EU� O -400.0
E P Si icon layer (p)55 -600.0
Buried oxide layer CaF_
-800.00 10 20 30 40 50Back contact
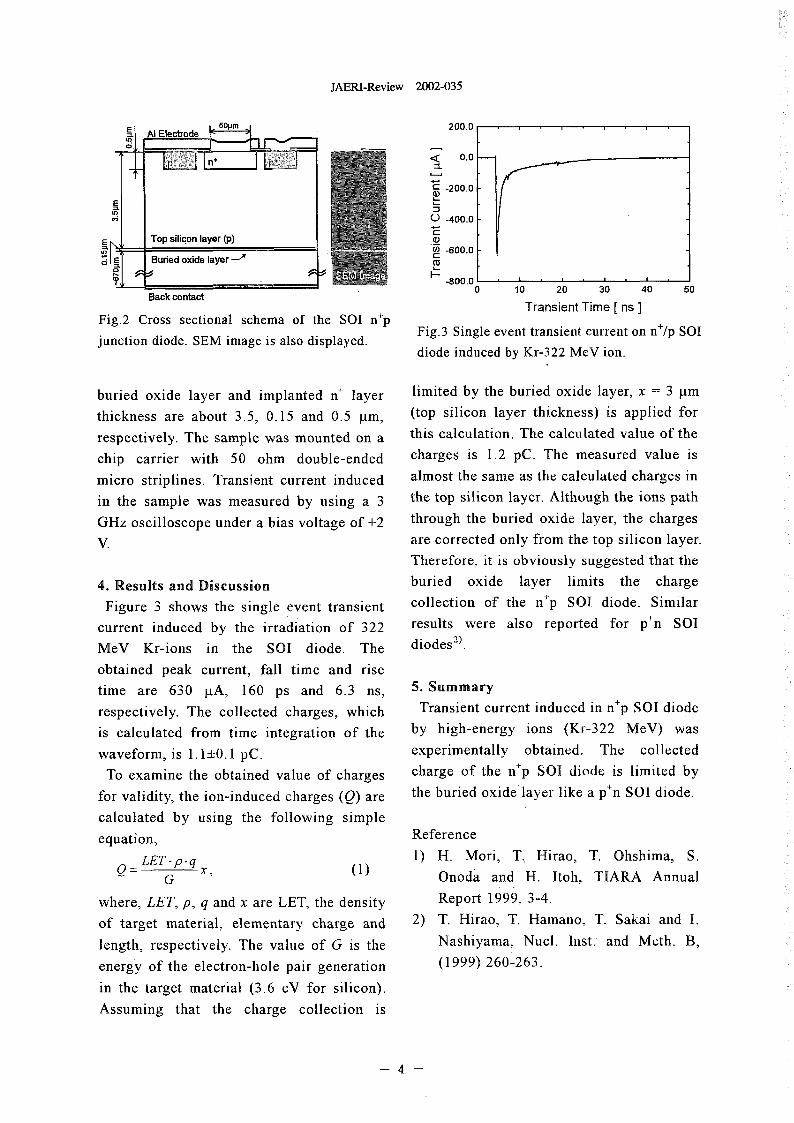
Fig.2 Cross sectional schema of the SOI np Transient Time ns
junction diode. SEM image is also displayed. Fig.3 Single event transient current on n/p SOIdiode induced by Kr-322 MeV ion.
buried oxide layer and implanted n layer limited by the buried oxide layer, = 3 gm
thickness are about 35, 0.15 and 0.5 gm, (top silicon layer thickness) is applied for
respectively. The sample was mounted on a this calculation. The calculated value of the
chip carrier with 50 ohm double-ended charges is 12 pC. The measured value is
micro striplines. Transient current induced almost the same as the calculated charges in
in the sample was measured by using a 3 the top silicon layer. Although the ions path
GHz oscilloscope under a bias voltage of 2 through the buried oxide layer, the charges
V. are corrected only from the top silicon layer.
Therefore, it is obviously suggested that the
4. Results and Discussion buried oxide layer limits the charge
Figure 3 shows the single event transient collection of the np SOT diode. Similar
current induced by the irradiation of 322 results were also reported for pn SOI
MeV Kr-Ions in the SOI diode. The diodeS2).
obtained peak current, fall time and rise5. Summarytime are 630 gA, 160 ps and 63 ns,
respectively. The collected charges, which Transient current induced in np SOI diode
is calculated from time integration of the by high-energy ions (Kr-322 MeV) was
waveform, is 1 1±0 I pC. experimentally obtained. The collected
To examine the obtained value of charges charge of the np SOI diode is limited by
for validity, the ion-induced charges (Q) are the buried oxide'layer like a p'n SOI diode.
calculated by using the following simple
equation, Reference
LET-p-q 1) H. Mori, T.. Hrao, T. Ohshirna S.O= X,
G Onoda and H. Itoh, TIARA Annual
where, LET, p q and x are LET, the density Report 1999, 34.
of target material, elementary charge and 2) T. Hrao, T. Hamano, T. Sakai and
length, respectively. The value of G is the Nashlyama, Nucl. hst. and Meth. B,
energy of the electron-hole pair generation (1999) 260-263).
in the target material 36 eV for silicon).
Assuming that the charge collection is
- 4
JAM-Review 2002-035
1.2 Analysis of Single Event Error mode in 16Mbit SRAMs
H.Shindou*, Ylide*, T.Aburaya*, S.Kuboyama*, S.Matsuda*,
T.Hirao**, T.Ohshima**, M.Yoshikawa** and H.Itoh**
National Space Development Agency of Japan (NASDA)
Depertment of Materials Development, JAERI**
1. Introduction 2.2 Test SetupMemory devices such as Static RAMs are Sample devices were controlled by a small
widely used at the electronic systems loaded into microprocessor unit card, Specific data werethe spacecraft. As the requirement of the space written to the sample device prior to irradiation.mission becomes more and more advanced, the The experiments were performed with monohigh-density memory cells become indispensable energetic ions obtained from the heavy-ionto achieve the mission. But it is well known that accelerator at Japan Atomic Energy Researchmany parameters.that defining characteristic of a Institute (JAERI) Takasaki. The direction of theCMOS device are scaled as the technology is incidence is perpendicular to the chip surface.downsized, and tat the radiation tolerance tends Memory cells were set all "O" state or all "I"to decline as the technology generation state this experiment.
) 2)progresses' Several new types of Single EventEffects, such as Multiple Bit upsets (MBU), 3. Results and discussionSingle Event Functional Interrupt (SEFI), Heavy Table I shows the cross section value aboution induced snapback phenomena, can be normal Single Event Upset (SEU). It wasobserved and studied in state of art memory possible to calculate the cross section only whendevices')- ). so it is very important to analyze the irradiating N ion, because another errormechanism about these eors and to construct mode, "Stack Error" (mentioned later) occurredthe effective error correction method in order to when irradiating Ne, Ar and Kr ion, and weapply high-density memory devices to the system cannot collect enough data to calculate the crossused in space. section. The significant difference of tolerance
This paper provides the heavy ion irradiation between all "O" state and all "' state wasn'ttest results on 16Mbit Static RAMs. Some new observed.types of Single event error were observed in The representative examples of the irradiationaddition to normal Single Event Upset (SEU). test result were shown in Table 2 Two types of
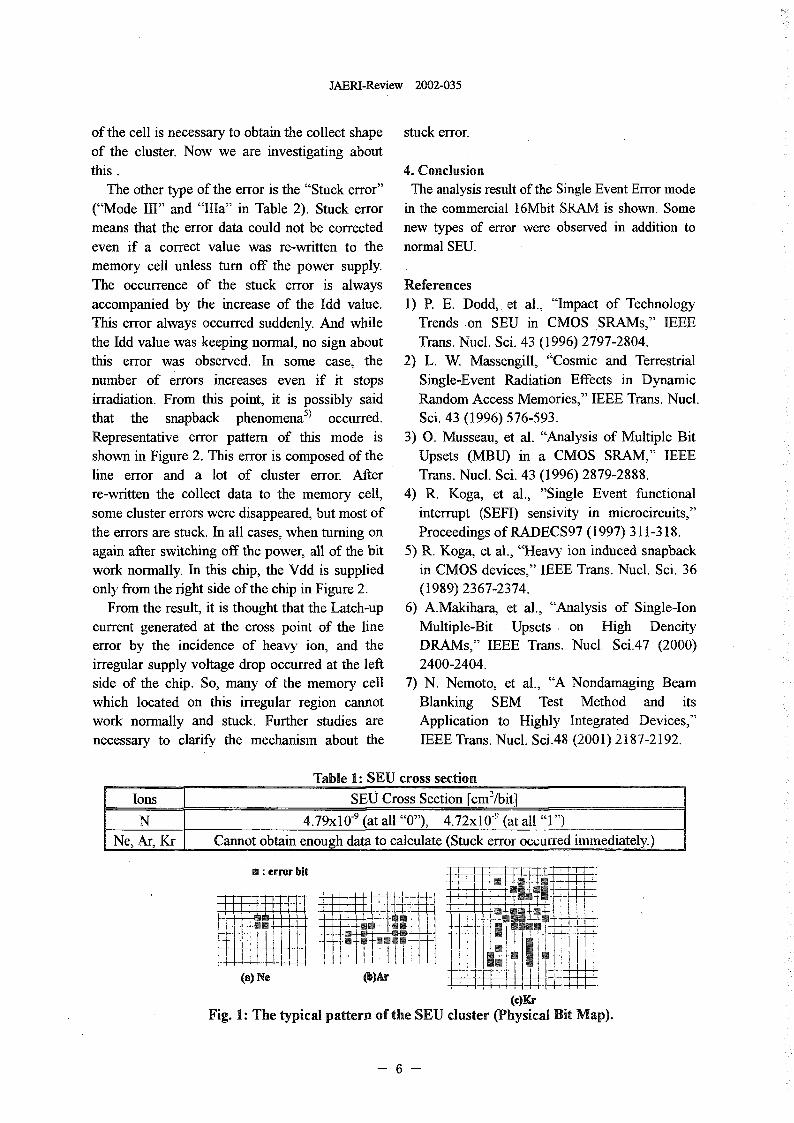
the error were identified besides the normal SEU.2. Exprimental One is the "Multiple bit Upset (MBU)" ("Mode2.1 Sample Devices IP in Table 1). Figure I sows the typical pattern
The sample device used for this experiment is of the MBU cluster. We used the physicalcommercial 16Mbit Static Random Access bit-map analysis method') in order to investigateMemory (TC55WI60OFT) organized as the shape of the error cluster. Most of the errors1,048,576 words by 16blt§ 2097,152 words by form clusters when irradiating Ne, Ar and Kr ion.8bits (two modes can be chosen) manufactured But some normal cells are also intermittentlyby TOSHIBA. The 0.18-micron CMOS process included in the error cluster. The size of thesetechnology was applied to his. This device clusters tends to increase with the increase ofoperates at power supply voltage of 2.3 )V to LET It is considered that these MBU clusters are+3 IV The chip is housed in a 48-pm' thin-small directly occurred by the ion incidence on theoutline package. In this experiment, the supply memory cell. Further investigation about thevoltage was set Wits minimum recommended. physical memory cell size and the arrangement
5
JAERI-Review 2002-035
of the cell is necessary to obtain the collect shape stuck error.of the cluster. Now we are vestigating aboutthis 4. Conclusion
The other type of the error is the "Stuck error" The analysis result of the Single Event Eror mode("Mode 111" and "Ma" in Table 2 Stuck error in the commercial 16Mbit SRAM is shown. Somemeans that the error data could not be corrected new types of error were observed in addition toeven 1'f a correct value was re-written to the normal SEU.memory cell unless turn off the power supply.The occurrence of the stuck eor is always Referencesaccompanied by the increase of the Idd value. 1) P. E. Dodd, et a., "Impact of TechnologyThis error always occurred suddenly. And while Trends on SEU in CMOS SRAMs," IEEEthe Idd value was keeping normal, no sign about Trans. Nucl. Sci. 43 1996) 2797-2804.this error was observed. In some case, the 2) L. W Massengill, 'Cosmic and Terrestnalnumber of errors increases even if it stops Single-Event Radiation Effects in Dynamicirradiation. From this point, it is possibly said Random Access Memories," IEEE Trans. Nucl.that the snapback phenomena') occurred. Sci. 43 1996) 576-593.Representative error pattern of this mode is 3) 0. Musseau, et al. "Analysis of Multiple Bitshown in Figure 2 This error is composed of the Upsets (MBU) in a CMOS SRAM," IEEEline error and a lot of cluster error. After Trans. Nucl. Si. 43 1996) 2879-2888.re-written the collect data to the memory cell, 4) R. Koga, et al., "Single Event functionalsome cluster errors were disappeared, but most of interrupt (SEFI) sensivity in microcircuits,"the errors are stuck. In all cases, whe n turning on Proceedings of P-ADECS97 1997) 311-318.
5) R. Koga. et al., Heavy ion' duced snapbackagain after switching off the power., all of the bit inwork normally. In this chip, the Vdd is supplied in CMOS devices." IEEE Trans. Nucl. Sci 36only from the right side of the chip in Figure 2 (1989) 2367-2374.
From the result, it is thought that the Latch-up 6) A.Makihara, et al., "Analysis of Single-Ioncurrent generated at the cross point of the line Multiple-Bit Upsets on High Dencityerror by the incidence of heavy ion, and the DRAMs," IEEE Trans. Nucl- Sci.47 2000)irregular supply voltage drop occurred at the left 2400-2404.side of the chip. So, many of the memory cell 7) N. Nemoto, et al., "A Nondamaging Beamwhich located on this irregular region cannot Blanking SEM Test Method and itswork normally and stuck. Further studies are Application to Highly Integrated Devices,"necessary to clarify the mechanism about the IEEE Trans. Nucl. Sci.48 2001) 2187-2192.
Table 1: SEU cross sectionIons SEV Cross Section [CM2 ibit]
N 4.79xlO-9(ata1l"O`), 4.72xlO-'(atall"1")Ne, Ar, Kr Cannot obtain enough data to calculate (Stuck error occurred immediately)
M emr bit
(a) e
(c)KrFig. 1: The typical pattern of the SEU cluster (Physical Bit Map).
6
JAERI-Review 2002-035
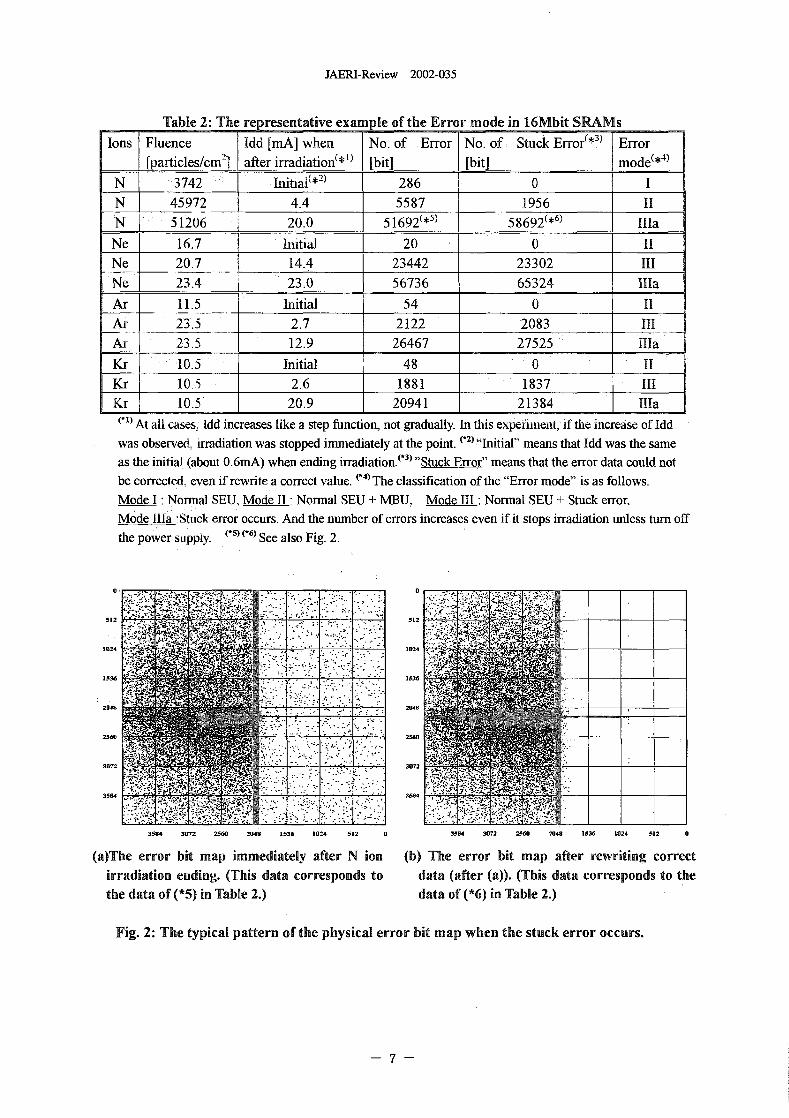
Table 2 The representative example of the Error mode in 16Mbit SRAMs(* 3)Ions Fluence Idd [mA] when No. of Error No. of Stuck Error Error
rparticles/cm'l after irradiation [bit [bit] mode (*4)
N 3742 Initial' *2) 286 0 1
N 45972 4.4 5587 1956 11N 51206 20.0 51692( *51 58692(*') Illa
Ne 16.7 Initial 20 0 11Ne 20.7 14.4 23442 23302 IIINe 23.4 23.0 56736 65324 Illa
Ar 11.5 Initial 54 0 11At ?3.5 2.7 2122 2083 IIIAi, 23.5 12.9 26467 27525 Illa
Kr 10.5 Initial 48 0 II10,5 2.6 1881 1837 III
20941 21384 + IllaAt all cases, Idd increases like a step function, not gradually In this experiment, if te increase of Idd
was observed, irradiation was stopped immediately at the point. 1*2),,jnitial�, means that Idd was the sameas the iitial (about 0.6niA) when ending irradiation.(*") "Stuck Error" means that the error data could notbe corrected. even if rewrite a correct value. (*4) The classification of the "Error mode" is as follows.Model-Non-na]SFUModell:NonnalSEU+NMU, Modelll:NonnalSEU+Stuckerror,Mode 11a 7Sttick error occurs. And the nuinber of errors increases even if it stops irradiation unless turn offthe power spply. 51 6) See also Fig. 2.
512 512
1024 1024
r
204* 204C
2560 2560
3584 3M
3584 3U72 2560 2049 1536 1024 512 0 3594 3D72 2560 2048 1536 1
(a)The error bit map immediately after N ion (b) The error bit map after rewriting correctirradiation ending. (This data corresponds to data (after (a)). (This data corresponds to thethe data of (*5) in Table 2 data of (*6) in Table 2)
Fig. 2 The typical pattern of the physical error bit map when the stuck error occurs.
7
JAERI-Review 2002-035
1.3 Radiation Effects on High-Efficiency InGaP/InGaAs/GeTerrestrial Triple-Junction Solar Cells
M. Imaizumi*, 0. Anzawa*, S. Kawakita*, T. Ohshima**, M. Yamaguchi***,H. Itoh**- and S. Matsuda*Department of Research and Development, NASDA*, Department of MaterialDevelopment, JAERI**, Toyota Technological Institute***
1. Introduction realized under I sun condition'), but the cell size
Despite that developing special electronic for this study is I cm x I cm.
devices for space use costs very high, the market Irradiations of I MeV electrons and 3 and 0
of such devices is not sufficiently large for MeV protons onto the cells were performed. In
business. Therefore, using commercial devices, the case of 10 MeV proton irradiation, AMO
which are supposed to be durable in space simulated light was illuminated to a cell in theenvironment, for space application has been irradiation chamber during the irradiation, and
idered recently. Meanwhile, for space solar the irradiation was interrupted at each
cells, InGaP/GaAs/Ge triple-junction cells have designated fluence and a current-voltage (I-V)
shown excellent performance and now become characteristic of a test cell was measured.the majority of space solar cells 1-2). Therefore, the change in -V parameters of a cell
In Japan, National Space Development can be collected immediately during irradiation
Agency of Japan (NASDA) has concentrated experiment (simultaneous method). On the other
only on development of Si space solar cells so hand, in the case of I MeV electron and 3 MeV
far, while a triple-junction cell with high proton irradiations, the particles of designated
efficiency over 30% (AM1.5) were achieved by fluences were irradiated to different cells under
Japan Energy Corp. (JE) as a terrestrial cell dark condition, and the -V curve of each cell
under one of the NEDO projects'). In this report, was measured after te irradiation experimentirradiation effects upon the terrestrial (sequential method).
triple-junction cell are shown and drability of Protons with various energies 30 keV-10
the cell in space, namely, radiation tolerance and MeV) were irradiated to the terrestrial
its dependency of output parameters o the triple-junction cells. According to TRIM
fluence of radiation particles is dscussed. calculation, protons with energy f 30 keV, 50
keV, 100 keV, 150 keV, 390keV I MeV, and 32. Experimental MeV are supposed to stop at approximately the
Fligh-Efficiency terrestrial triple-junction top cell junction, the top cell base region, the
solar cells produced by JE were adopted for this top/middle cell interface, the middle cellstudy. The design of the cell utilizes InGaAs junction, the mddle cell base region, the vicinitywith indium content of 1% as a middle cell of the bottom cell unction (several microns
material. Since the cell is optimized for AM 151) under the epitaxial laver/Ge substrate interface),
spectrum, the thickness of the InGaP top cell is and the bottom cell base region, respectively-,
relatively thick compared to that of and 10 MeV protons pass through entire the cell.
triple-junction space cells. Efficiency of as high The fluence was kept at 1.1012 CM-2 . The V
as 31.3% with the cell area of 25 CM2 has been characteristics were measured b the sequential
method described above.
8
JAERI-Review 2002-035
3. Results and Discussion by a combination of materials of sub-cells.
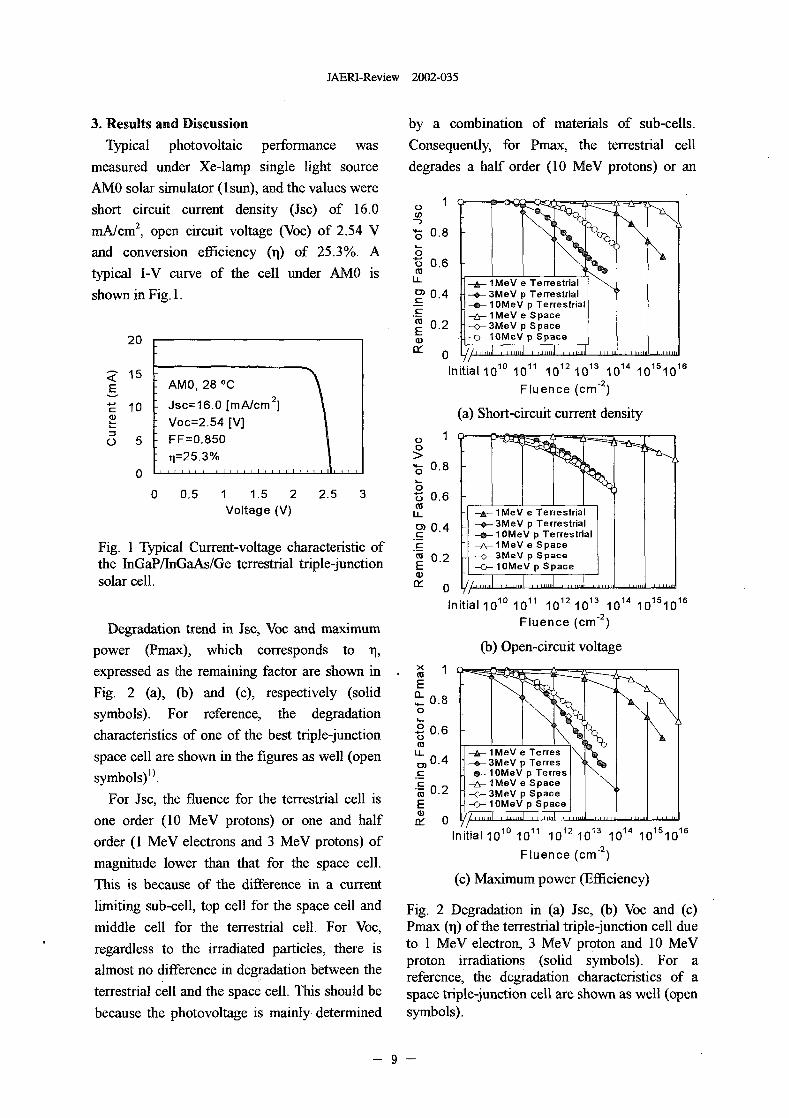
Typical photovoltaic performance was Consequently, for Pmax, the terrestrial cell
measured under Xe-lamp single light source degrades a half order (10 MeV protons) or an
AMO solar simulator (1sun), and the values were
short circuit current density Qsc) of 16.0U)
mA/cm2. open circuit voltage (Voc) of 254 V - 0.80and conversion efficiency (TI) of 25.3% A 8
- 0.6typical IN curve of the cell under AMO is MU_ 1 MeV e Te rr
shown in Fig. 1. 0 04 WeV Terres ria-a 1 MeV p Terrestrial--A- 1 MeV e Space
0.2 -o- WeV p SpaceE -r
20 W _�IGMeVpSpaceOf //__J _,J ''""d -- 'J
0 //1 5 Initial lo" lo" 1012,013 1014 115,016
E AMO, 28 OC Fluence (C M 2)
10 Jsc=16.0 [m cm (a) Short-circuit current densityVoc=2.54 [V]
5 FF=0.850 10
q=25.3% > 0.80 0
0 0.5 1 1.5 2 2.5 3 0.6cuVoltage (V) LL -A- 1 MeV e Te
0.4 - WeV Te1 MeV p T rrestrial
Fig. I Typical Current-voltage characteristic of C: --A- 1 MeV e SpaceCa 0.2 - -c- WeV p Space
the InGaP/InGaAs/Ge terrestrial tn'ple-j'unction E --r> 1 Mev p Spaced) -
solar cell. 13� 0 ...... -.. J -. Ainitial lo" lo" 1012 013 1014 1 015 10 6
Degradation trend Jsc, Voc, and maximum Fluence (CM-2)
power (Pmax), which corresponds to 9, (b) Open-circuit voltage
expressed as the remaining factor are shown inE
Fig. 2 (a), (b) and (c), respectively (solid 0-� 0.8
symbols). For reference, the degradation 00 0.6characteristics of one of the best triple-junction 0Ca
LL -A-lMevspace cell are shown in the figures as well (open CD 0 4 --*-3Mev p rres
symbols)'). C _491 1 WeV p TerresC _�_ I MeV e Space
For Jsc, the fluence for the terrestrial cell is M 0.2 --c-WeV p SpaceE 1 MeV p Space
one order (10 MeV protons) or one and half of 0 12 13 14 15 16
order (I MeV electrons and 3 MeV protons) of initial olo lo" lo 10 10 10 10
magnitude lower than that for the space cell. Fluence (CM 2)
This is because of the difference in a current (c) Maximum power (Efficiency)
limiting sub-cell, top cell for the space cell and Fig. 2 Degradation in (a) Jsc, (b) Voc and (c)
middle cell for the terrestrial cell. For Voc, Pmax (,q) of the terrestrial thiple-junction cell due
regardless to the irradiated particles, there is to I MeV electron, 3 MeV proton and 10 MeV
almost no difference degradation btween the proton irradiations (solid symbols). For areference, the degradation characteristics of a
terrestrial cell and the space cell. This should be space triple-junction cell are shown as well (open
because the photovoltage is mainly determined symbols).
9
JAERI-Review 2002-035
order (I MeV electrons and 3 MeV protons) of Jsc, in the energy range. This should be because
magnitude faste ' fluence in comparison with the InGaAs r'ddle cell has the le ast radiation
the space cell. Indeed distinct difference in tolerance among the three sub-cells and the cell
radiation tolerance of output power is observed is current limiting in the design of the terrestrial
between the terrestrial cell and the space cell, cell.
but the radiation tolerance of the terrestrial cell Observation of change in quantum efficiency
is equivalent to that of GaAs single Junction of the top cell and the middle cell due to the
cells4). Therefore, the terrestrial cell can be proton irradiations confirmed that not only the
applied to space missions of which radiation InGaAs middle cell but also the top InGaP cell
environment is predicted to be moderate. is degraded greatly in the case of 150 keV In the
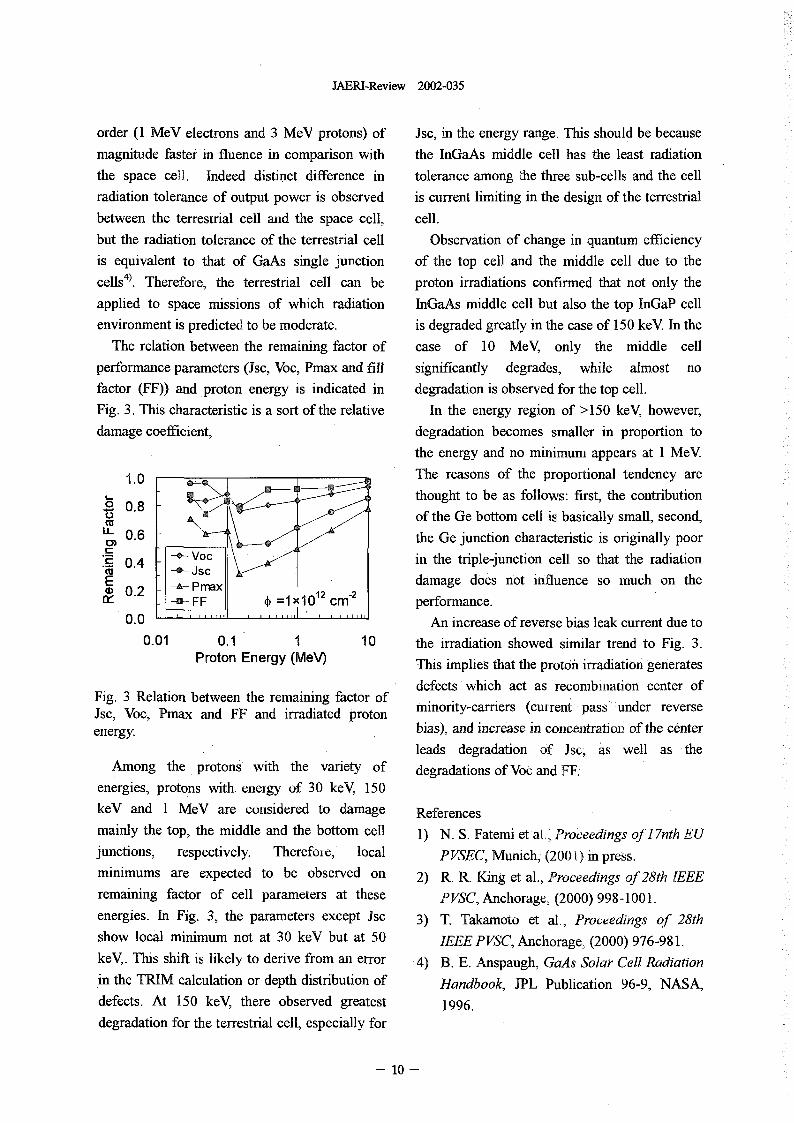
The relation between the remaining factor of case of 10 MeV, only the middle cell
performance parameters (Jsc, Voc, Pmax and fill significantly degrades, while almost no
factor FF)) and proton energy is indicated in degradation is observed for the top cell.
Fig. 3 his characteristic is a sort of the relative In the energy region of >150 keV, however,
damage coefficient, degradation becomes smaller in proportion to
the energy and no minimum appears at I MeV
The reasons of the proportional tendency are1.0
0 0.8 thought to be as follows: first, the contributiont of the Ge bottom cell is basically small, second,co AlLL 0.6 \IC--, the Ge unction characteristic is oginally poor
Voc i-c 0.4 n the triple-Junction cell so that the radiationCU JSCE damage does not influence so much on the(D 0.2 P max 12 -2
- -B- FF =1X10 cm performance.0.0 - An increase of reverse bias leak current due to
0.01 0.1 I I the irradiation showed similar trend to Fig. 3.Proton Energy (MeV) This implies that the proton rradiation generates
defects which act as recombination center ofFig. 3 Relation between the remaining factor ofJsc, Voc, Pmax and FF and irradiated proton minority-camers urrent pass under reverseenergy. bias), and increase in oncentration of the center
leads degradation of Jsc, as well as theAmong the protons with the variety of degradations of Voc and FF.
energies, protons with energy of 30 keV, 150
keV and I MeV are considered to damage References
mainly the top, the middle and the bottom cell 1) N. S. Faterni et al. 'Proceedings of 17nth EUTherefore, local P VSE C, (200 1) ' press
junctions, respectively Munich,
minimums are expected to be observed on 2) R. R. King et al., Proceedings of 28th IEEE
remaining factor of cell parameters at these PVSC, Anchorage, 2000) 998-1001.
energies. In Fig. 3 the parameters except Jsc 3) 1 Takamoto et al., Proceedings of 28th
show local minimum not at 30 keV but at 50 IEEE PVSC, Anchorage, 2000) 976-98 .
keV. This shift is likely to derive from a error 4) B. E. Anspaugh, GaAs Solar Cell Radiation
.in the TRIM calculation or depth distribution of Handbook, JPL Publication 96-9, NASA,defects. At 150 keV, there observed greatest 1996.
degradation for the terrestrial cell, especially for
- 10
JAERI-Review 2002-035
1.4 Analysis of Failure Caused by Cosmic Rays inHigh-Voltage High-Power Semiconductor Devices
(2 nd Report)
Hideo Matsuda% Ichiro Omura*, Yoko Sakiyama*,
Satoshi Urano*, Susumu lesaka*, Hiromichi Ohashi**,
Toshio Hirao***, Hiroyuki Abe***, Hisayoshi toh***,
Hideki Mori****, Shinobu Onoda****
Toshiba Corporation, Semiconductor Company
Toshiba Corporation, R&D Center *
Department of Material Development, JAERI***
Graduate School of Engineering, Tokai University""
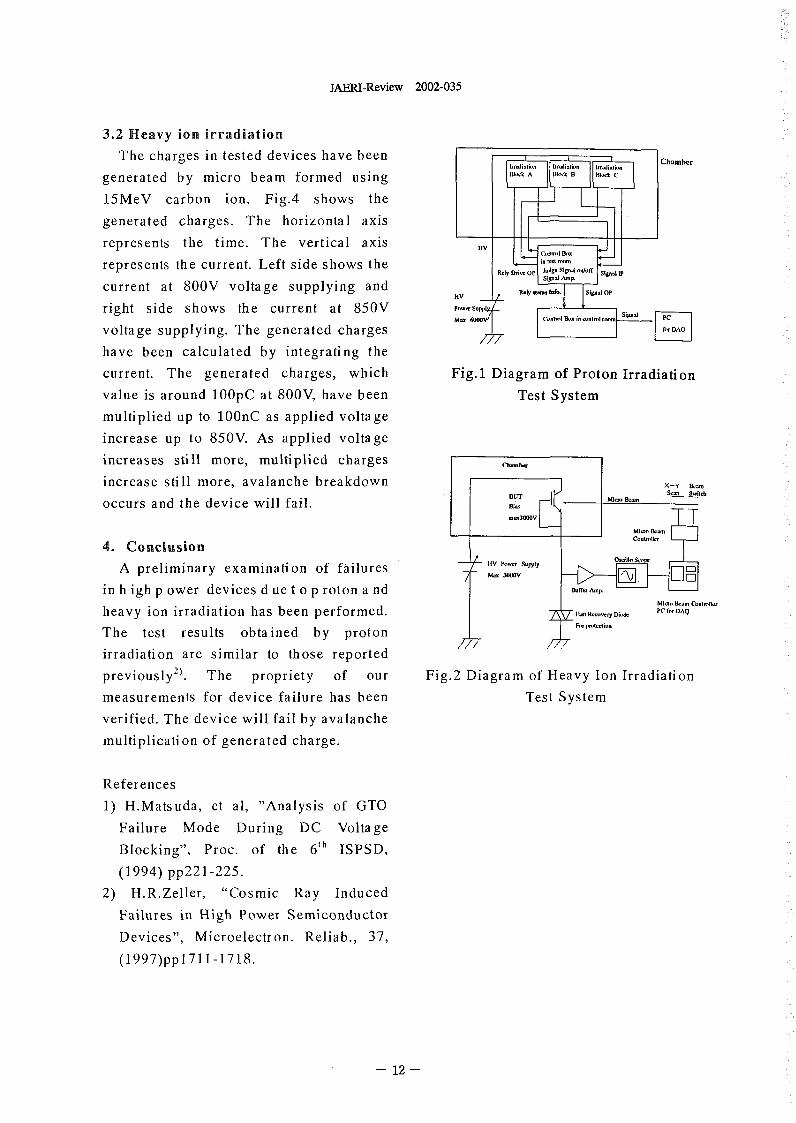
1. Introduction proton fluence. The block diagram of test
High power semiconductor devices system is schematically shown in Fig.l.
have b een w idely u sed i n k ey industries,
for instance, traction, transmission, etc. A 2.2 Heavy ion irradiation
failure of such power devices induced by An 3MV-tandem-accelerator has been
cosmic rays at the sea level has been used for heavy ion irradiati on. A
recently observed ). At the present stage micro-beam of 15MeV carbon ion was
it is considered that high power devices scanned on th e t est devices a t 2 m icrons
fail or breakdown by interaction between per pitch. The block diagram of test
Si and cosmic rays, e.g., high energy system is shown in Fig-2.
neutrons and protons.
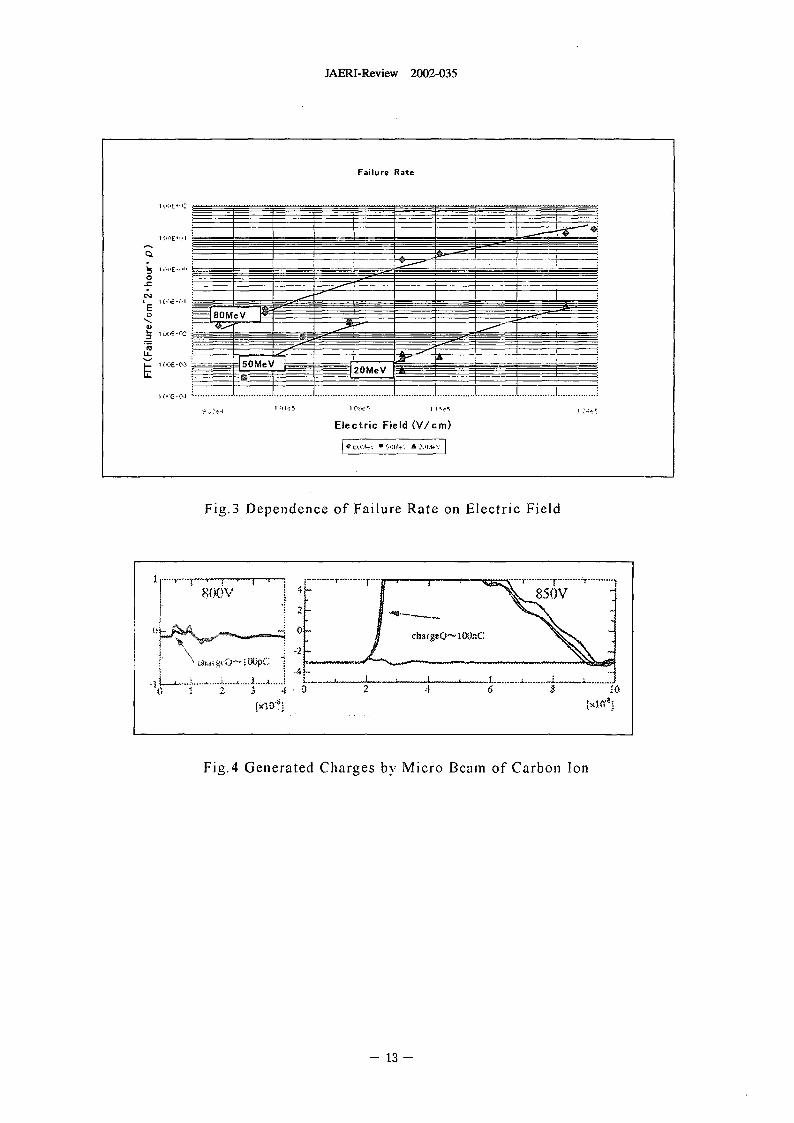
The aims of this work is (1):to verify 3. Results and discussion
theequivalence between the failure rates 3.1 Proton irradiation
obtained by proton irradiation and those The test devices suddenly failed by
by actual cosmic rays and (2):to examine proton irradiation-during voltage supplied.
the failure rates for various devices at The phenomenon is very similar to the
their nominal 'voltage, which aTe qite failure Caused by actual COSMiC ays.
useful for designing high power devices Fig.3 shows the failure rate as a function
having high p erformance a s w ell a s h gh of s upplied electric f ield. T he horizonta I
reliability. I order to clarify the failure axis represents the maximum electric
mechanisms, we have investigated the field in the devices. The vertical axis
failed areas in tested devices. represents the failure rate divided by
irradiated particle fluence. The failure
2. Experiments rate increases as irradiation energy or
2.1 Proton irradiation electric field ncreases.The slope of the
An AVF-cyclotron at TIARA has been failure rate obtained in this test is similar
used for proton irradiation. Parameters to that of the failure rate by actual cosmic
are proton energy and fluence. The failure rays or by neutrons irradiation 2). The test
rate of high power devices was derived results reflected the failure by actual
from the number of failures divided by cosmic rays.
JAERI-Review 2002-035
3.2 Heavy ion irradiation
The charges in tested devices have beenChamber
generated by micro beam formed using 13k,k C
15MeV carbon ion. Fig.4 shows the
generated charges. The horizontal axis
represents the time. The vertical axis
represents the current. Left side shows theHV My JU, jSiP:d..h'ff
Sil "U.],
current at 800V voltage supplying and HV R.Iya�. sip.1 OP
right side shows the current at 850V P" S.
voltage supplying. The generated charges
have been calculated by integrating the
current. The generated charges, which Fig.1 Diagram of Proton Irradiation
value is around 0pC at 80OV, have been Test System
multiplied up to 0nC as applied voltage
increase up to 85OV. As applied voltage
increases still more, multiplied charges a-b.,
increase still more, avalanche breakdown X-Y k.
DUToccurs and the device will fail. Bw
.. 30N"
Mi- P...
4. Conclusion C-Wk,
A preliminary examination of f5flures 11V -S.[,4y S,,,M- VWV
in h igh p ower devices d ue t o p roton a nd
heavy ion irradiation has been performed. F.I - Di,.k PC r., DI;
The test results obta ined by proton N�pmwi-
irradiation are similar to those reported 11'T7
previous IY2 ). The propriety of our Fig.2 Diagram of Heavy Ion Irradiation
measurements for device failure has been Test System
verified. The device will fail by avalanche
multiplication of generated charge.
References
1) H.Matsuda, et al, "Analysis of GTO
Failure Mode During DC Voltage
Blocking", Proc. of the 6 h ISPSD,
(1994) pp221-225.
2) H.R.Zeller, "Cosmic Ray Induced
Failures in High Power Semiconductor
Devices", Microelectron. Reliab., 37,
(1997)ppt7ll-1718.
- 12 -
JAERI-Review 2002-035
Failure Rate
I Oi E
CV
EBOM
m
l.- Omev
0- - 4 ................ .............. ............... ............... ............. ........... _ j ...............
............... ............ ...................
Electric Field (V/cm)
Fig.3 Dependence of Failure Rate on Electric Field
............ .......... ...... r ---------- ..........4- SSW
1 -4
A ..... k .........2 6
x WO
Flg.4 Generated Charges by Micro Beam of Carbon on
- 13 -
JAERI-Review 2002-035
1.5 Study of Charge Collection Mechanism usingMulti Line Schottky Barrier Diode
H. Mori*, T. Hirao, J. S. Laird, S. Onoda* and H. Itoh
*Graduate School of Engineering, Tokai UniversityDepartment of Materials Development, JAERI
1. Introduction transfer (LET) and the p 'ected range in
Single-Event Phenomena (SEP) are common silicon are 675 MeV / (mg/CM2 ) and I I [im
occurrences in electronic devices used high respectively For ion iradiation a microbeam
radiation fields such as the space environments. of about I m in diameter was formed using a
SEP are primarily caused by an interaction heavy ion microbeam system connected to a 3
between the ionization track generated by a MV tandem accelerator at JAERI Takasaki
high-energy heavy ion and the sensitive region TIARA facility.
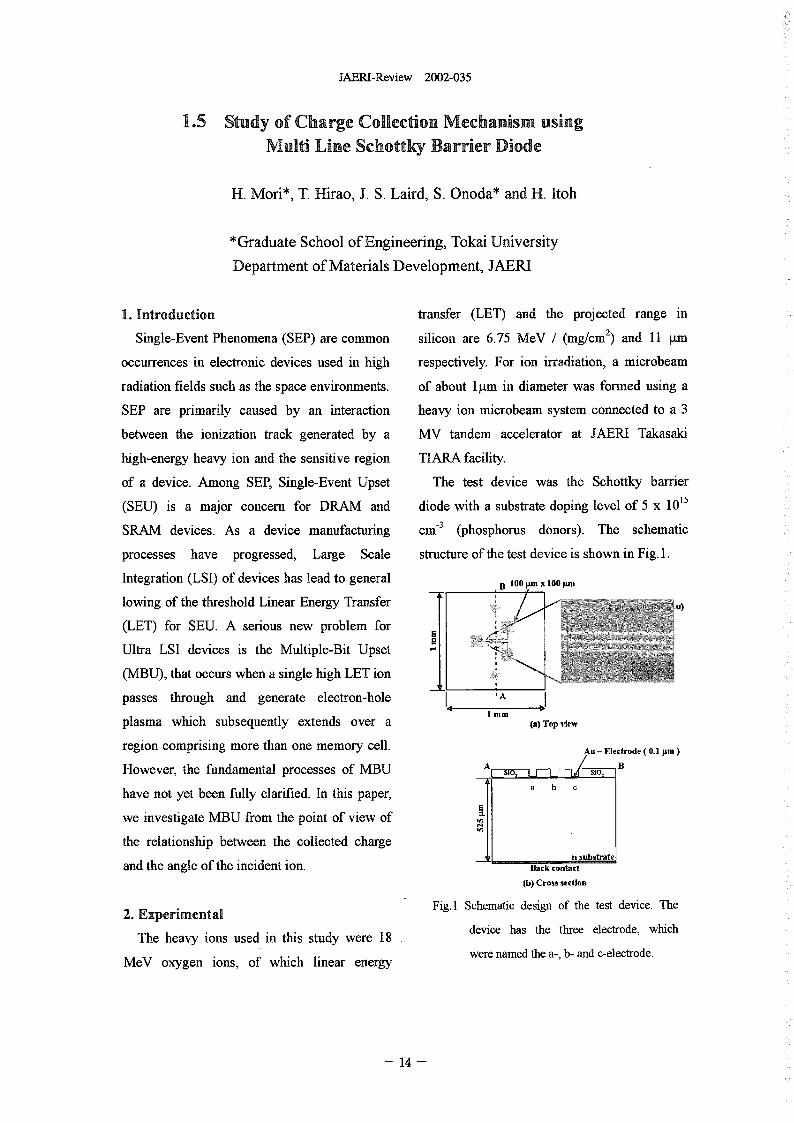
of a device. Among SEP, Single-Event Upset The test device was the Schottky barrier
(SEU) is a major concern for DRAM and diode with a substrate doping level of x 1015
SRAM devices. As a device manufacturing cm-3 (phosphonis donors). The schematic
processes have progressed, Large Scale structure of the test device is shown in Fig. .
Integration (LSI) of devices has lead to general B 100 gal I 100 gal
lowing of the threshold Linear Energy Transfer U)Z
(LET) for SEU. A serious new problem for ;1
Ultra LSI devices is the Multiple-Bit Upset _7
(NIBU), that occurs when a single high LET ion
passes through and generate electron-hole 'A
plasma which subsequently extends over a I nim (a) Top view
region comprising more than one memory cell. Au - Electrode 0. I put
However, the fundamental processes of MBU A B
I a b chave not yet been fully clarified. In this paper,
E=Lwe investigate MBU from the point of view of
the relationship between the collected chargeVI AMUM-1el
and the angle of the incident ion. Back contact
lb) Cross section
Fig. I Schematic design of the test device. The2. Experimental
The heavy ions used in this study were 18 device has the three electrode, which
MeV oxygen ions, of which linear energy were named the a-, b- and electrode.
- 14 -
JAERI-Review 2002-035
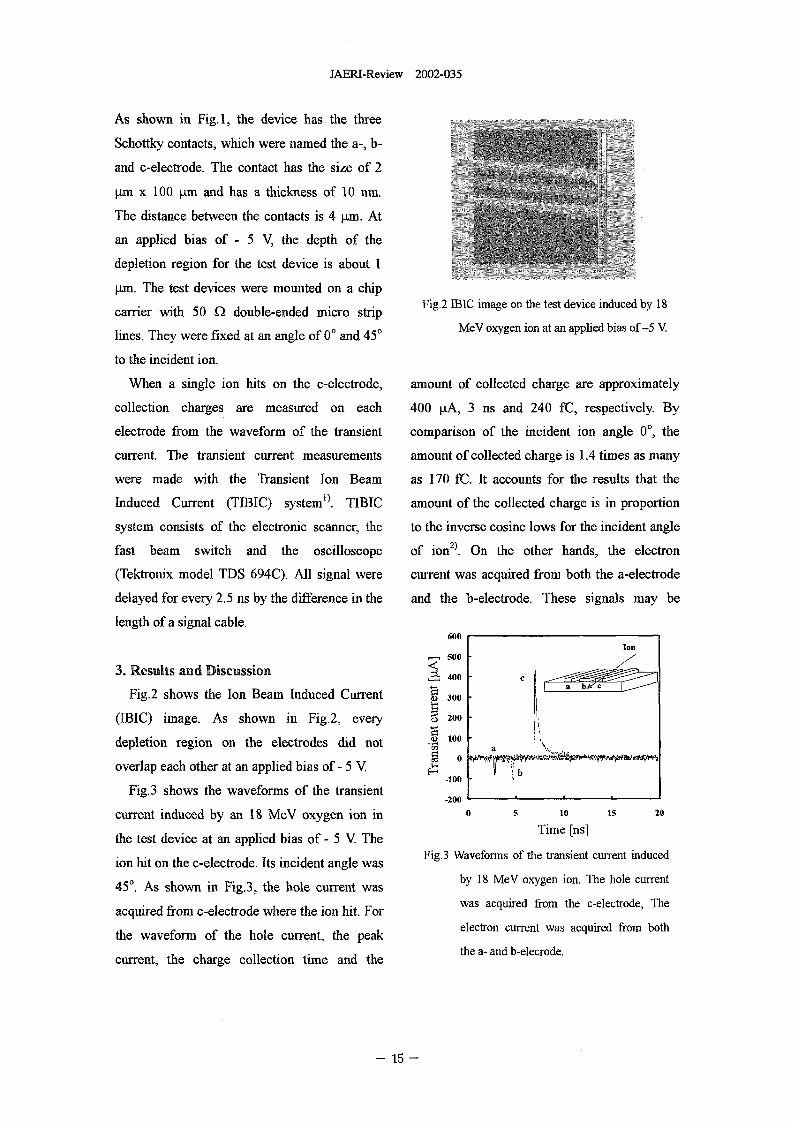
As shown in Fig. , the device has the three
Schottky contacts, which were named the a-, b-
and celectrode. The contact has the size of 2
�trn x 100 �Lm and has a thickness of 10 m.
The distance between the contacts is 4 �tm At
an applied bias of - V, the depth of the
depletion region for the test device is about I
�im. The test devices were mounted on a chip
carrier with 50 double-ended micro strip Fig.2 1131C image on the test device induced by 18
lines. They were fixed at an angle of 00 and 45' MeV oxygen ion at an applied bias of -5 V
to the incident ion.
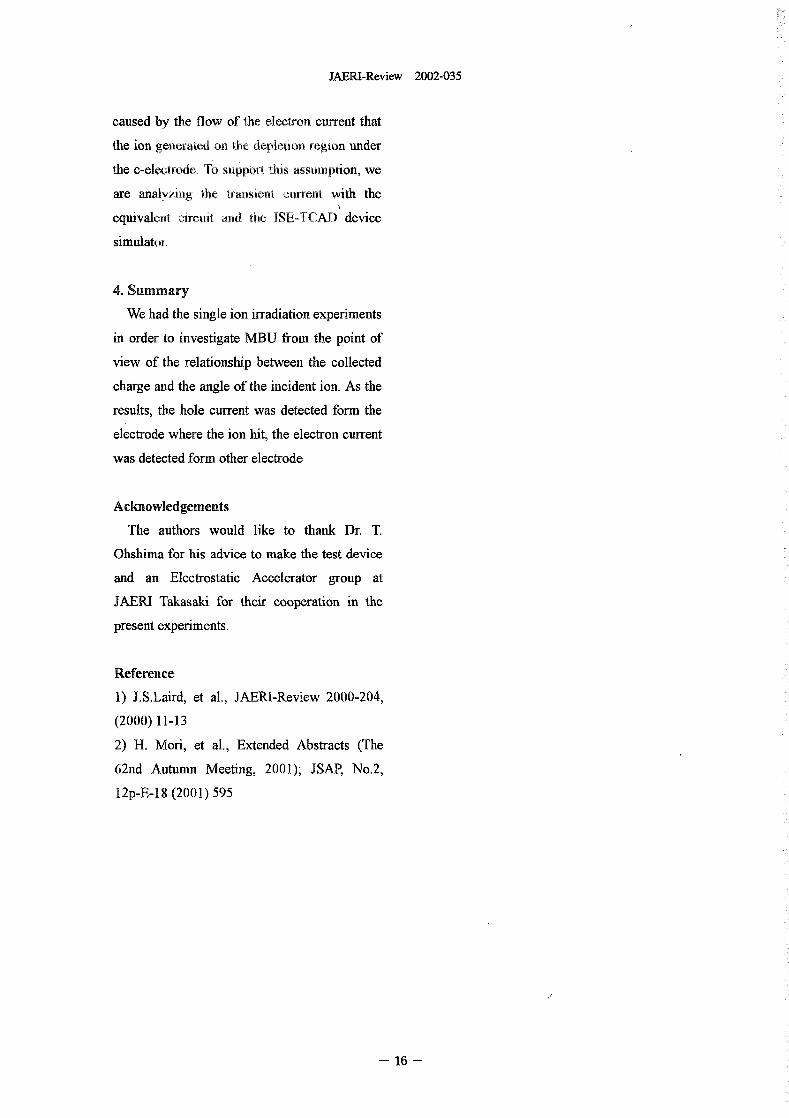
When a single ion hits on the celectrode, amount of collected charge are approximately
collection charges are measured on each 400 �LA 3 ns and 240 M, respectively. By
electrode from the waveform of the transient comparison of the incident ion angle ', the
current. The transient current measurements amount of collected charge is 14 times as many
were made with the Transient Ion Beam as 170 W. It accounts for the results that the
Induced Current (TIBIC) system'). TIBIC amount of the collected charge is in proportion
systcm consists of the electronic scanner, the to the inverse cosine lows for the incident angle
fast beam switch and the oscilloscope of ion 2). On the other hands, the electron
(Tektronix model TDS 694C). All signal were current was acquired fi7om both the a-electrode
delayed for every 25 ns by the difference in the and the b-electrode. These signals may be
length of a signal cable.600
Ion
3. Results and Discussion 500400
FIg.2 shows the Ion Beam Induced Current 300 bA,'c
(IRIQ image. As shown in Fg.2, every 200
depletion region on the electrodes did not 100 a0
overlap each other at an applied bias of - V E$_. -100 �b
Fig.3 shows the waveforms of the transient -2001
current induced by an 1 MeV oxygen ion in 0 S 10 1-11 20
the test device at an applied bias of - V The Time ns]
ion hit on the celectrode. Its incident angle was Fig.3 Waveforms of the transient current induced
by 18 MeV oxy45'. As shown in Fig.3, the hole current was . gen ion. The hole current
uired from c-electrode where the II ht. For was acquired from the celectrode, Theacq 10 I
the waveform of the hole current, the peak electron current was acquired from both
current, the charge collection time and the the a and belecrode.
- 1 -
JAERI-Review 2002-035
caused by the flow of the electron current that
the ion generated o the depletion region under
the c-electrode, To support this assumption we
are analyzing the transient unt with the
equivalent oircuit and tlie ISE-TCAD device
simulator,.
4. Summary
We had the single ion irradiation experiments
in order to investigate MBU fi7om te point of
view of the relationship between the collected
charge and the angle of the incident ion. As the
results, the hole current was detected form the
electrode where the ion hit, the electron current
was detected form other electrode
Acknowledgements
The authors would like to thank Dr. T.
Ohshima for his advice to make the test device
and an Electrostatic Accelerator group at
JAERI Takasaki for their cooperation in the
present experiments.
Reference
1) J.S.Laird, et al., JAERI-Review 2000-204,
(2000) 11-13
2) H. Mon', et al., Extended Abstracts (The
62nd Autumn Meeting, 2001); JSAP, No.2,
12p-E-18 2001) 595
- 16 -
JAERI-Review 2002-035
1.6 Gamma-ray Irradiation Effects on p-Channel 6H-SiC Metal-Oxide-Semiconductor Transistors
T. Ohshima, K. K. Lee, A. Ohi, M. Yoshikawa and H. ItohDepartment of Material Development, JAERI
1. Introduction aluminum (Al) ion implantation at 800 'CSilicon carbide (SIC) electronic devices and subsequently annealed at 1800 C for I
are expected to be used in harsh radiation min in an Ar atmosphere. The gate oxide wasenvironments. such as in space and nuclear fabricated by pyrogenic oxidation (H2:02
reactor facilities, due to its excellent physical 1:1) at 1100 'C for 30 min. The thickness ofproperties') and radiation resistance 2). For the gate oxide 33 nm) was determined bydeveloping radiation resistant devices based atomic force microscopy observation. Theon SIC, it is important to understand the gate length and width of te MOSFETs are 0radiation response of electrical characteristics gm and 200 m, respectively. The source andof both n-channel and p-channel metal-oxide- drain contacts were formed using Alsemiconductor (MOS) field effect transistors evaporation and subsequent alloying at 850
(FETs). In previous studies"'), Ohshima et al. 'C for min in Ar. Gamma-ray irradiationreported that n-channel SiC MOSFETs show was performed up to I MGy S102) at a rateextremely strong radiation resistance of 8.8 kGy/h at room temperature (RT) in air.compared to silicon (SI) MOSFETs. However, During the irradiation, no electrical bias wasthere is no report on the irradiation effects of applied to the gate, drain and source of thep-channel SIC MOSFETs because the MOSFETs.fabrication process of p-channel SiC The electrical characteristics wereMOSFETs with excellent electrical measured at RT under dark conditions. Thecharacteristics has not yet. been realized. channel mobility (,U) of the MOSFETs wasRecently, we established the fabrication derived from the linear region of the drainprocess of p-cbannel SIC MOSFETs using a current (ID) versus drain voltage (VD) curves.combination of hot ion implantation and The threshold voltage (VT) was determined ashigh-temperature anealing. In this paper, we the value at the intersection between the V.
report the influence of gamma-ray irradiation axis and the line extrapolated from the curve
on the electrical characteristics of p-channel of the square root of the drain current (ID).
SIC MOSFETs. Details in the procedure are described in ref.
4.
2. Experimental
The p-c�annel MOSFETs used in this 3. Results and Discussion
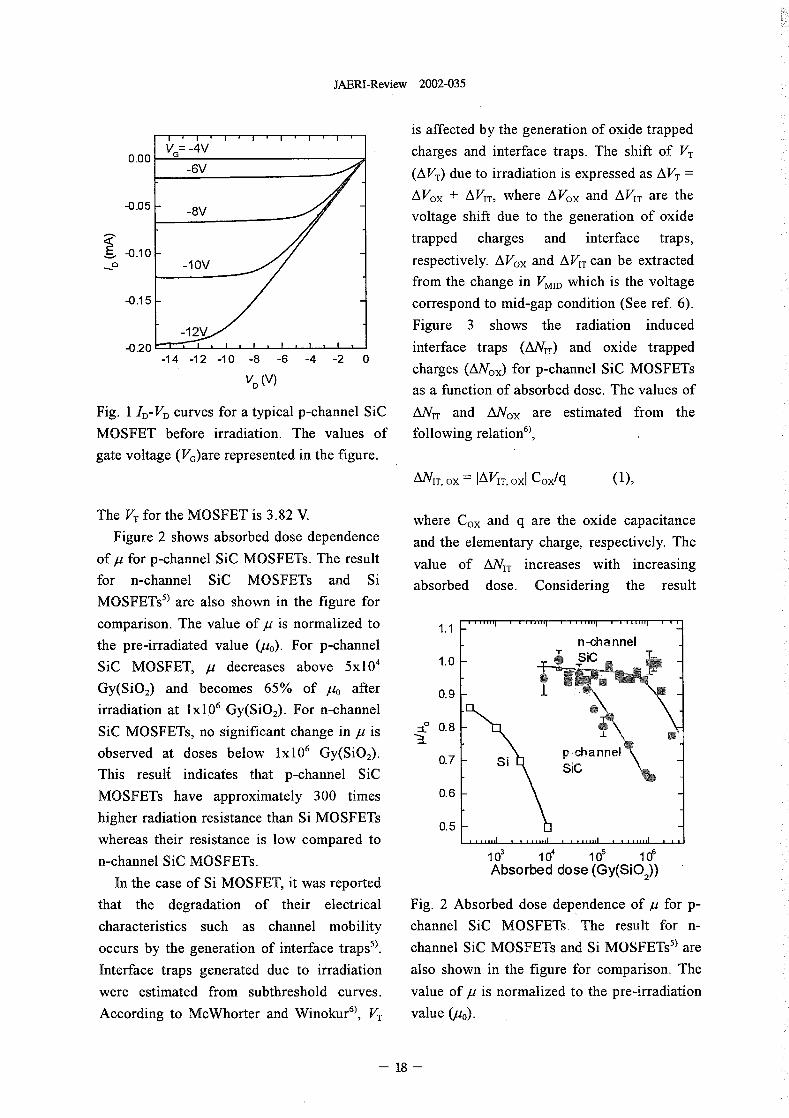
study were fabricated on n-type 6H-SIC Figure I shows ID-VD curves for a typical
epitaxial layer (thickness: gm) grown on n- p-channel SiC MOSFET before irradiation.
type 6H-SiC substrates 3.5' off Si-face). The The ID- VD characteristics can be controlled by
net donor concentration in the epitaxial layer bias applied to gate and the linear andIXIO16 /CM3is 5xlO - . The source and drain saturation regions are exhibited. The value of
of the MOSFETs were formed using u derived from the linear .region is cm'/Vs.
- 17 -
JAERI-Review 2002-035
is affected by the generation of oxide trapped
0.00 charges and interface traps. The shift of VT
_6V (AVT) due to irradiation is expressed as AVT
-0.0 - AVOX + AVIT, where Vox and AVIT are the-8V voltage shift due to the generation of oxide
trapped charges and interface traps,-0.1 0
_10V respectively. Vox and AVTcan be extracted
from the change In VMID which is the voltage
-0.1 - correspond to mid-gap condition (See ref. 6.
Figure 3 shows the radiation induced
-0.20 -14 12 10 -8 -6 -4 12 0 interface traps NIT) and oxide trapped
V, (V) charges (ANox) for p-channel SiC MOSFETsas a function of absorbed dose. The values of
Fig. I ID-VD curves for a typical p-channel SiC ANIT and Nox are estimated from the
MOSFET before irradiation. The values of following relation 6),
gate voltage (VG)are represented in the figure.
ANIT, OX = AVIT, OXI Cox/q (1),
The VT for the MOSFET is 382 where Cox and q are the oxide capacitance
Figure 2 shows absorbed dose dependence and the elementary charge, respectively. The
of p for p-channel SIC MOSFETs. The result value of ANT increases with increasing
for n-channel SiC MOSFETs and Si absorbed dose. Considering the result
MOSFETs') are also shown in the figure for
comparison. The value of lu is normalized to
the pre-irradiated value p). For p-channel n-channel
SIC MOSFET, p decreases above 5x1 04 1.0
Gy(SIO,) and becomes 65% of po after 0.9irradiation at lxl0' Gy(SAY For n-channel
SiC MOSFETs, no significant change in is 0.8IX106 Iobserved at doses below Gy(S'02)- P-channel0.7
This resuli indicates that p-channel SiC SIC
MOSFETs have approximately 300 times 0.6
higher radiation resistance than Si MOSFETs 0.5
whereas their resistance is low compared to
n-channel SiC MOSFETs. lo' lo' le 1 e
In the case of Si MOSFET, it was reported Absorbed dose (Gy(SiO 2))
that the degradation of their electrical Fig. 2 Absorbed dose dependence of u for p-
characteristics such as channel mobility channel SIC MOSFETs, The result f n-
occurs by the generation of interface traps5). channel SiC MOSFETs and Si MOSFETs') are
Interface traps generated due to irradiation also shown in the figure for comparison, The
were estimated from subthreshold curves. value of is normalized to the pre-irradiation
According to McWhorter and Winokur'), VT value po).
1 -
JAERI-Review 2002-035
3 becomes 65 of initial value at lxl0'10
Gy(SiO2). The radiation resistance of p-
channel SC MOSFETs is demonstrated to be
approximately 300 times stronger than that of
the Si MOSFETs.A E
--------------- ------------- 0012.lo 0 7 References0
00------ 1) W. E. Nelson, F. A. Halden and A.
Rosengreen: J. Appl. Phys. 37 1966)333.
ANIT 2) H. Itoh, M. Yoshikawa, 1. Nashiyama S.
11 ANx Misawa, H. Okumura and S. Yoshida:
10 . - 1 IEEE Trans. Nucl. Sci. NS37 1990) 1732.lo' 1 05 lo'
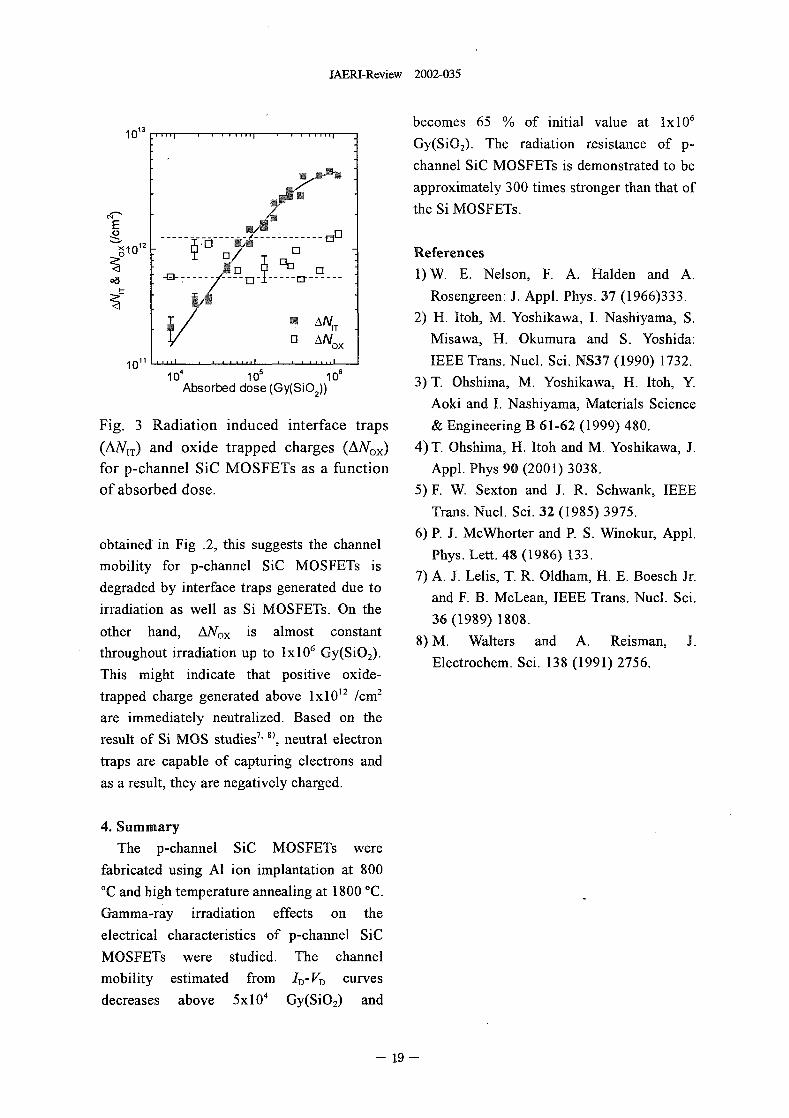
Absorbed dose (Gy(SiO 2)) 3) T. Ohshima, M. Yoshikawa, H. Itoh, Y
Aoki and 1. Nashiyama, Materials Science
Fig. 3 Radiation induced interface traps & Engineering 61-62 1999) 480.
(AAT IT ) and oxide trapped charges Nox) 4) T. Olishima, H. Itoh and M. Yoshikawa, J.
for p-channel SiC MOSFETs as a function Appl. Phys 90 2001) 3038.
of absorbed dose. 5) F. W Sexton and J. R. Schwank, IEEE
Trans. Nucl. Sci. 32 1985) 3975.
obtained in Fig 2 this suggests the channel 6) P. J. McWhorter and P. S. Winokur, Appl.
mobility for p-channel SIC MOSFETs is Phys. Lett. 48 1986) 133.
degraded by interface traps generated due to 7) A. J. Lells, T. R. Oldham, H. E. Boesch Jr.
irradiation as well as Si MOSFETs. On the and F. B. McLean, IEEE Trans. Nucl. Sci.
other hand, ANox is almost constant 36 1989) 1808.
throughout irradiation up to IX106 Gy(sio'). 8) M. Walters and A. Reisman, J.
This might indicate that positive oxide- Electrochem. Sci. 138 1991) 2756.
trapped charge generated above IXIO12 /CM2
are immediately neutralized. Based on the
result of Si MOS studies', '), neutral electron
traps are capable of capturing electrons and
as a result, they are negatively charged.
4. Summary
The p-channel SiC MOSFETs were
fabricated using Al ion implantation at 800
'C and high temperature annealing at 1800 'C.
Gamma-ray irradiation effects on the
electrical characteristics of p-channel SIC
MOSFETs were studied. The channel
mobility estimated from I-V,) curves
decreases above 5x10' Gy(SiO.2) and
- 19

This is a blank page.
JAERI-Review 2002-035
2. Biotechnology
2.1 Lethality of Single Tobacco Cells Irradiated with Heavy Ions .................. 25
Y. Yokota, Y. Hase, N. Shikazono, S. Kitamura, A. Tanaka and M. Inoue
2.2 Mutation Generation 'M Protoplasts of Chrysanthemum with 41-le and
12 C5+ Ion Beams .................................................... 28H. kegarmi, H. Murakami, K. Hirashima, T. Nakabara, Y. Hase and A. Tanaka
2.3 Effects of Ion Beams on Shoot Regeneration of Elatior Begoria (B. xhiemalis
Leaf Cultures ...................................................... 31
M. lzuka, N. Kudo, Y. Kimura, Y. Hase and A. Tanaka
2.4 Isolation of an Arabidopsis Mutant Defective in Damage Tolerance .............. 33
A. Sakarnoto, V.T.T. Lan, N. Shikazono, Y. Hase, H. Watanabe and A. Tanaka
2.5 Development of the Efficient Mutation Breeding Method using
Ion Beam Irradiation ................................................. 36
H. Yamaguchi, T. Morishita, K. Degi., A. Tanaka, Y. Hase and N. Shikazono
2.6 Development of Mutant Varieties "Vital Ion Series" in Carnation by
Ion Beam Breedm'g ......... I ..................... 39
M. Okarnura, N. Yasuno, M. Ohtsuka, A. Tanaka, N. Shikazono and Y. Hase
2.7 Mutation Generation 'M Chrysanthemum Plants Regenerated from Floral
Organ Cultures Irradiated with Ion Beams ................................. 42
M. Okamura, N. Yasuno, M. Takano, A. Tanaka, N. Shikazono and Y. Hase
2.8 Effects of Ion Beam Irradiation on Chrysanthemum Leaf Discs and
Sweetpotato Callus .................................................. 44
K. Ueno, S. Nagayoshi, K. Shimonlishi, Y. Hase, N. Shikazono and A. Tanaka
2.9 RAPD Analysis of Xanta and Waxy Mutants Induced by Ion Beam Irradiation
to Hinoki Cypress(Chamaecyparis obtuse) ................................ 47
K. Ishii, Y. Yamada, Y. Hase, N. Shikazono and A. Tanaka
2.10 Induction of Mutation 'M Garlic (Allium Safivum L. by Ion Beam Irradiation ...... 49
T. Tashiro, Y. Yamamoto, A. Tanaka, N. Shikazono and Y. Hase
2.11 Characters of Tomato cv. First Mutant with Short Internode Induced by
Irradiation of 12C 5+ Ion Beam to the Seeds ................................. 52M. Masuda, K. Murakaini, S. G. Agong, T. Yuasa, A. Tanaka and Y. Hase
2.12 Mutation Breeding of Rice, Eggplant and Glorlosa by Ion Beam Irradiation ...... 54
M. Mizobuchi, M. Okada, M. Matsumoto, A. Iwasaki, A. Tanaka and Y. Hase
2.13 Regeneration of Variegated Plants From Ion-beam Irradiated Explants: of
Ficus sh i p Thunb ................................................. 57
M. Takahashi, S. Kohama, K. Kondo, M. Hakata, Y. Hase, N. Shikazono,
A. Tanaka and H. Morikawa
2.14 Effect of Ion Beam Irradiation on the Growth of Netted Melon
(Cucumis melo L.) .................................................. 60
21 -
JAERI-Review 2002-035
M. Tanelshi, H. Katal, H. Yamada, H. Otsuka, Y. Hase, N. Shikazono and
A. Tanaka
2.15 Mutation Induction with Ion Beam Irradiation in Solanum Plants ............... 62
N. Matsuzoe, T.Umeda,. Y. Hase and A. Tanaka
2.16 Instablity of Rice Chlorophyl Mutants Induced at MI by Carbon
Ion Beam Irradiation Is Inherited ........................................ 64
M. Maekawa, Y. Hase, N. Shikazono and A. Tanaka
2.17 Studies on Flower Color and Morphological Mutations from In Vitro
Chrysanthemum Explants Irradiated with Ion Beams ........................ 68
T. Sato, H. Naganoma, Y. Hase and A. Tanaka
2.18 Induction of Mutation in Delphinium L. by on-bearn Irradiation ............... 70
T. Kimura, S. Tsuzuki, S. Kondo, Y. Tsuchiya, Y. Hase and A. Tanaka
2.19 Isolation of Arabidopsis Mutants Defective in Root Hydrotropism. ............... 72
K. Koizurm ,G. Takata, K. Nakaya, N. Negishi, Y. Sasuga, Y. Sakata, Y. Oono,
Y. Kobayashi, H. Takenaga and S. Tanaka
2.20 Single-hit Effects on Mammalian Cultured Cells with Heavy-ion Microbeams .... 74
Y. Kobayashi, T. Fimayama, S. Wada, M. Taguchi and H. Watanabe
2.21 Regeneration of Hemopoletic Organs in the Skworm, Bombyx mori,
After the Selective Irradiation of I 0 Gy Carbon Ions ........................ 77
K. Kiguchi, E. Ling, K. Fukamoto, S. Xu, K. Shirai, R. Kanekatsu ,
Y. Kobayashi, Z-.L� Tu, T. Funayama and H. Watanabe
2.22 Mechanism of Bystander Effect Induced by Precise-numbered Heavy Ions ........ 80
Y. Furusawa, C. Shao, M. Aoki, S. Wada, T. Funayama and Y. Kobayashi
2.23 The Effect to Mammalian Nucleus by Irradiation of Heavy Ion Beams ........... 83
S. Wada, M. Natsuhori, N. Ito, Y. Kobayashi, T. Funayama and K. Yamamoto
2.24 Dynamical Study on Influence of the C02 Enrichment to the Photoassimilate
Transportation using Positron mag' .... 86
S. Matsuhashi, S. Watanabe, N. S. Ishioka, C. Mzum'wa, T. Ito and T Sekine
2.25 Effect of Atmosphere Gas Conditions on Soybean (Glycine Max L.
13 N2 Fixation Activity ................................................ 89N. Ohtake, T. Ohyama, K. Sueyoshi, H. Fjikake, N. S. Ishioka, S. Matsuhashi,
S. Watanabe, T. Sekine, H. Uchida and A. Tsuji
2-26 Absorption and Transfer of the Iron 52 Fe) in the Iron AbsorptionMaize Mutantys] . ............................... ;. . . . . . . . .. . . . . . . . . .92
T.. Tsukamoto, S. Kiyonnya, H. Nakanishi, H. Uchida, S. Watanabe,
N.S. Ishioka, S. Matsuhashi, T. Sekine and S. Mori
2.27 Effects of Cold Stress on 11 C Distribution in Rice Plants 95Detected by PETIS Detector ...........................................
H. Hayashi, H. Mano, N. Suzui, S. Matsuhashi, C. Mzumwa T. Ito,
N. S. Ishioka, T. Watanabe, T. Sekine, H. Uchida and A. Tsuji
- 22 -
JAERI-Review 2002-035
2.28 Water and Trace Element Behavior in a Plant ............................. 98
T. M. Nakamishi, J. Furukawa, K. Tanoi, M. Yokota, S. Ueoka, N. Ikeue,
Y. Hayashi, N. S. Ishioka, S. Watanabe, T.Sekine, T. Ito, T. Mzuniwa,
S. Matsuhashi, H. Uchida and A. Tsu'1
2.29 Positron Imaging Aalysis of Assimilation and Translocation of
Carbon and Nitrogen Sources in Rice Plant ................................ 100
S. Otsuki, Y. Sonoda, S. Saiki, S. Matsuhashi, S. Watanabe, N. S. Ishioka,
T. Sekine and J. Yamaguchi
2.30 Uptake of is FDG and 13 N03- 'M Tomato Plants ............................. 103
A.Tsuji, H.Uchida, T.Yamashita, S.Matsuhashi, T.Ito, C.Mizuniwa, N.S.Ishioka,
S.Watanabe and T.Sekine
2.31 Utilization of Ion Bearn-Irradiated Pollen in Plant Breeding .................... 105
S. Kitamura, Y. Yokota, M. Inoue Y. Hase and A. Tanaka
2.32 Study on the Apoptosis Induction by a Local Damage using
Penetration Controlled Ion-beam Exposure ................................ 108
Y. Hase and S. Wada
23 -

This is a blank page.
JAERI-Review 2002-035
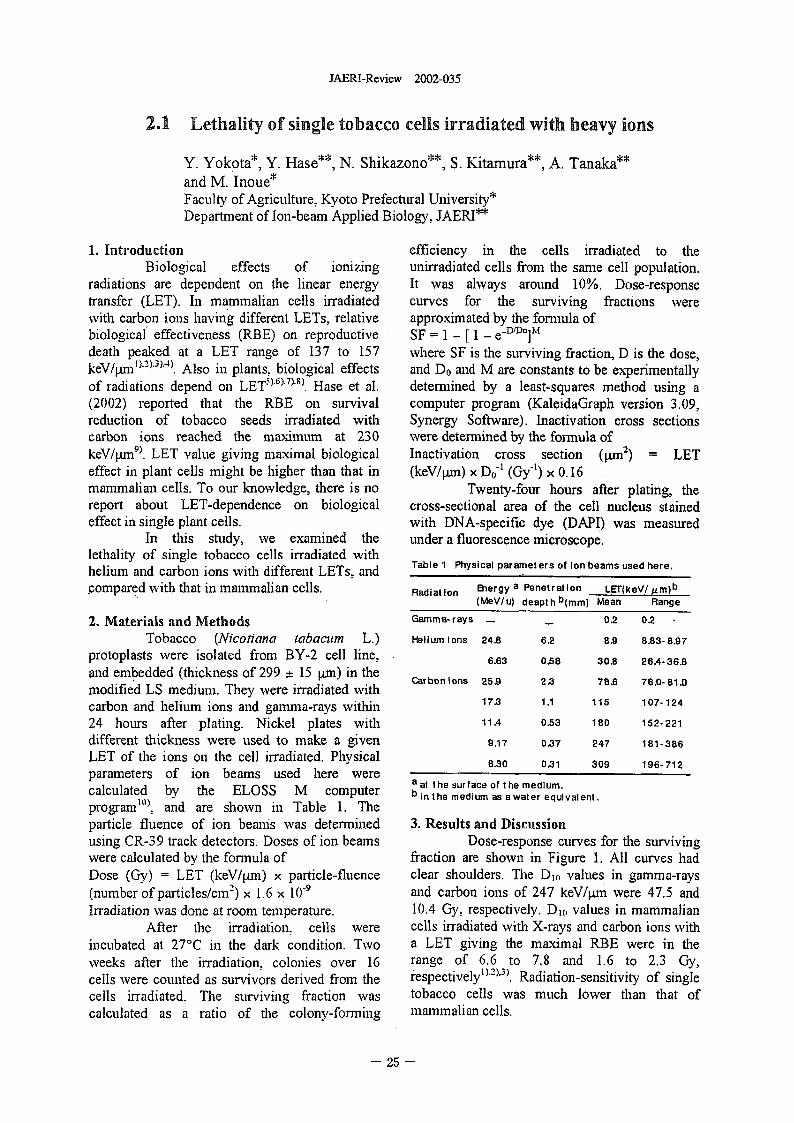
2.1 Lethality of single tobacco cells irradiated with heavy ions
Y. Yokota", Y. Hase", N. Shikazono", S. Kitarnura", A. Tanaka**and M. Inoue"Faculty of Agriculture, Kyoto Prefectural University*Department of Ion-beam Applied Biology, JAERI**
1. Introduction efficiency in the cells irradiated to theBiological effects of ionizing unirradiated cells from te same cell population.
radiations are dependent on the linear energy It was always around 10%. Dose-response
transfer (LET). In mammalian cells irradiated curves for the surviving fractions were
with carbon ions having different LETs, relative approximated by the formula of-D/Dojl%4biological effectiveness (RBE) on reproductive SF = I - I - e
death peaked at a LET range of 137 to 157 where SF is the surviving fraction, D is the dose,keV/�tm I)_2).3-4). Also in plants.. biological effects and Do ad M are constants to be experimentally
of radiations depend on LET5 _6).1)_1 ). Hase et al. detennined by a least-squares method using a
(2002) reported that the RBE on survival computer progrant. (KaleidaGraph version 309,
reduction of tobacco seeds irradiated with Synergy Software). Inactivation cross sectionscarbon ions reached te maximum at 230 were detennined by the formula of
keV/pm9). LET value giving maximal biological Inactivation cross section (PM2) LET
effect in plant cells might be higher tan that in (keV/pm) x DO-' (Gy-) x 0 16
mammalian cells. To our kowledge, tere is no Twenty-four hours after plating, the
report about LET-dependence on biological cross-sectional area of the cell nucleus stainedeffect in single plant cells. with DNA-specific dye (DAPI) was measured
In this study, we examined the under a fluorescence microscope.
lethality of single tobacco cells irradiated with Table Physical parameters of Ion beams used here.helium and carbon ions with different LETs. andpompared with tat in mammalian cells. Radi at Ion Energy a Penetration LET(k eV/ Am) b
(MeV/ u) deapthb(mm) mean Range
2 Mterials nd Methods Gamma- rays - - 02 02 -
Tobacco (Nicotiana tabacum L.) Pallum Ions 24.8 6.2 8.9 8.83 897
protoplasts were isolated from BY-2 cell line, 6.63 0.58 30.8 26A 36.8
and embedded (thickness of 299 t 15 p) in the Carbon Ions 25.9 22 70.6 76.0- 1.0modified LS medium. They ere irradiated withcarbon and helium ions and gamma-rays within 173 I'l 115 107-124
24 hours after plating. Nickel plates with 11.4 0.53 180 152-221
different thickness were used to make a given 9.17 OZ7 247 181-386
LET of te ions on te cell Irradiated. Physicalparameters of ion beams used here were 8.30 U1 309 196-712
a al the surface of the medium.calculated by the ELOSS M computer b n t he med um as a wat er equival nt.
W)prograin : and are shown in Table 1. The
particle fluence of ion beams was determined 3. Results and Discussion
using CR-39 track detectors. Doses of ion beams Dose-response crves for the survivingwere calculated by te forinula of fraction are shown in Figure 1. All curves had
Dose Gy = LET (keV/[un x particle-fluence clear shoulders. The DI(, values in gamma-rays
(number of particleS/Cin) X 1. 6 x 09 and carbon ions of 247 keV/W-n were 47.5 and
Irradiation Nvas done at room temperature. 10.4 Gy, respectively. Dic, values in mammalian
After the irradiation. cells were cells irradiated with X-rays and carbon ions with
incubated at 27'C in the dark condition. Two a LET giving te maximal RBE were in the
weeks after the irradiation. colonies over 16 range of 66 to 7.8 and 1.6 to 23 Gy,1,21.3
cells were counted as survivors derived from the respectively' Radiation-sensitivity of single
cells irradiated. The surviving fraction was tobacco cells was much lower than that of
calculated as a ratio of te colorty-forining mammalian cells.
- 25 -
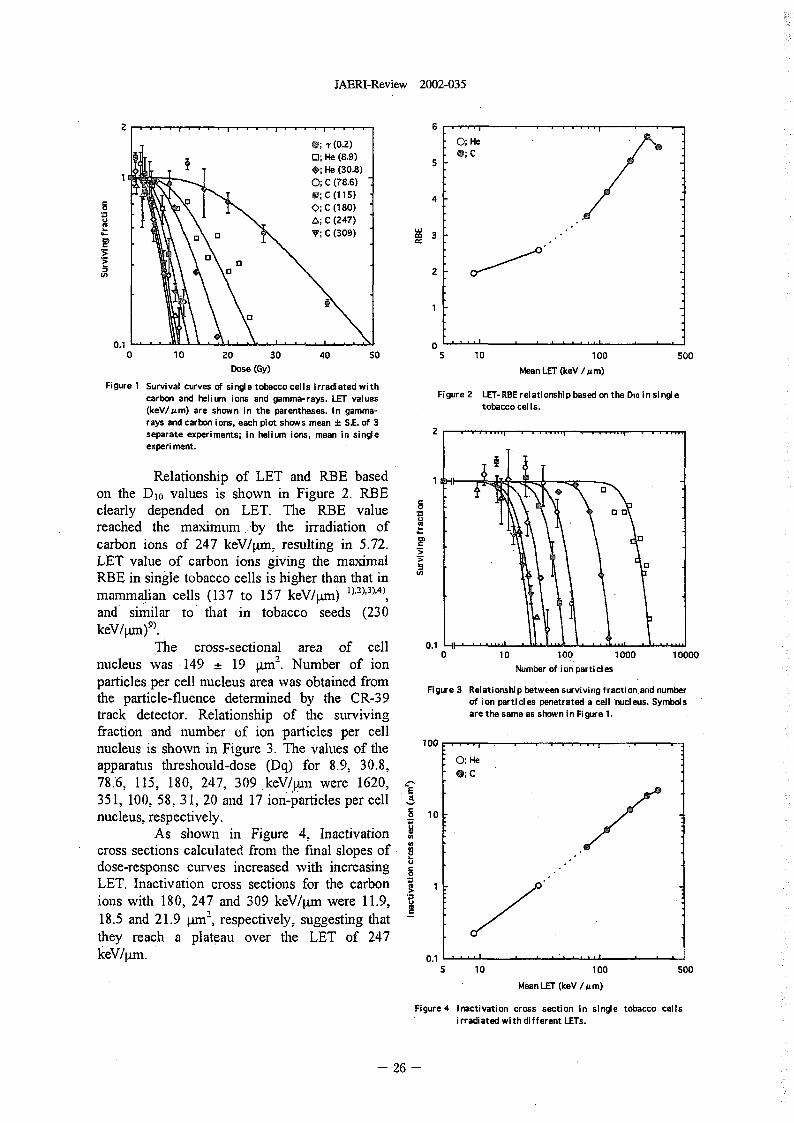
JAERI-Review 2002-035
6
0; r 0.2) 0 He0; He 8.9) 0 C
He 30.8)0; C 78.6)0; C (I I 5) 40; C (1 80)
VA; C 247)
Ui13 V; C 309) W 30) cc
EJ2
0.1 00 10 20 30 40 so 5 10 100 Soo
Dose (Gy) Mean LET (keV / m)
Figure I Survival curves of single tobacco cells irradiated withcarbon ad helium ions and gamma-rays. LET values Figure 2 LET-RBE relationshipbased on the Dio insingle
(keV/tLm) are shown in the parentheses. in gamma- tobacco cel Is.rays and carbon ions, each plot shows mean ± S.E. of 3separate experiments; in helium ions, mean in single 2experl ment.
Relationship of LET and RBE based 1 T_
on the Dio values is shown in Figure 2 RBEclearly depended on LET. The RBE value Ureached the maximum � v the irradiation of 2
carbon ions of 247 keV/W-n, resulting in 572.LET value of carbon ions giving the ma--amal > 13
RBE in single tobacco cells is higher than that inmammalian cells 137 to 157 keV/pm) 1,,2,,3),4)
and similar to that in tobacco seeds (230keV/pm)9'.
The cross-sectional area of cell 0.1 L-ii0 10 100 1000 10000
nucleus was 149 :t 19 11M2 . Number of ion Number of ion par ti cl es
particles per cell nucleus area was obtained fromFigure3 Relationshipbetweensurvivingfraction.andnumber
the particle-fluence determined by the CR-39 of on parti cl es penetrated a cel I nucl eus. Symbo s
track detector. Relationship of te surviving are the same as shown in Pi gure 1.
fraction and number of ion particles per cell 100nucleus is shown in Figure 3 The values of teapparatus threshould-dose (Dq) for 89. 30.8, 0 He
0 C78.6. 115. 180, 247, 309 keV/pm were 1620, x-
E'35 1. 100. 587 31, 20 and 17 ion-particles per cell .5nucleus, respectively. lo
As sown in Figure 4. Inactivationcross sections calculated from the final slopes ofdose-response curves increased with increasingLET. Inactivation cross sections for the carbon %ions with 180, 247 and 309 ke:V/pni were 19,
C18.5 and 21.9 pm2, respectively, suggesting thatthey reach a plateau over te LET of 247ke:V/�tm. 0.11
5 10 100 SooMean LET (keV /um)
Figure 4Inactivation cross section in single tobacco cellsirradiated with different LETs.
26
JAERI-Review 2002-035
References1 W K. Wevrather. S. Ritter. M. Scholz ad G.
Kraft 1999) Int. J. Radial. Bol... 75. 1357-1364
2) M, Aoki. Y Funisawa. T. Yamada 2000 J.Radiat, Res,. 41. 163-175
3) Y. Fur-usawa. K. FukUtSII. M. Aoki, H.
Itsukalchi. K. E-iichl-Kasal. H. Ohara. F.Yatagai, T. Karia ad K. Ando 2000) Radial.Res.. 154. 485-496
4) J Kiefer, P. Schmidt ad S. Koch 2001)Radiat, Res- 156- 607-6 It
5) Y. Hirono. H. H. Smith. J. T. Lyman, K. H.Thompson and J. W. Baum 1970) Radial.Res.. 44. 204 -223
6) M. M el .H. Dengr Y. Lit. C. Zhitan& Z. Lu�Q. Qu and T. C. Yang (1994) Adv. SpaceRes.. 14. 36'-372
7) A. Tanaka N Shikazono. Y. Yokota. H.Watanabe ad S. Tano 1997) Int. J. Radial.Res.. 72. 1 I- 1 7
8) N. Shikazono. A. Tanaka. S. Ktavairia H.Watanabe and S. Tano 2002) Radial. Environ.Blophys. i press
9) Y. Hase. M. Yiamaguchl, M. Inotle ad A.Tanaka 2002) Int. J. Radial. Biol. i press
10) S. Tanaka, M. Fukuda, K. Nishimura H.Watanabe ad N. Yamano 1997) JAERI-Data/Code- 97-019
27 -
JAERI-Review 2002-035
2.2 Mutation Generation in Protoplasts of Chrysanthemum with4He 2+ and 12C5+ Ion Beams
H.Ikegami*, H.Murakami*, K.Hirashima*, T.Nakahara*, Y.Hase"and A.Tanaka*'Fukuoka Agricultural Research Center*, Department of on-Beam-Applied Biology,
JAERI'
1. Introduction
Ion beams have high LET(linear energy transfer) type, and flower color. Among 660 mutants we
and are applied to induce various mutations to chose 21 lines in the first selection and are growing
many plants� It is also known that wide range of them for the second selection.
somaclonal mutations happened in protoplast Regenerants derived from protoplasts were about
culture. Thus a high mutation rate is expected 85% height of control (data not shown). Irradiated
when these techniques described above are plants totally exhibited dwarf characteristics, extent
combined. In addition, protoplast method is useful of which increase according to a dose (Table 1).
in a point that we can prevent mera from However some of irradiated plants were superior in
emerging and acquire numerous regenerated height to Gy line.
plants. Day of flowering distributed from October 6t to
We had already grown 660 mutants of December 10th. The average day of flowering was
chrysanthemum by irradiating protoplasts and about October 20th in all doses (Table 1), On the
culturing them. In this work, we investigated the other hand, the fact that both the earliest day of
phenotypes of the regener-ants and selected 21 flowering and the latest day were found in high
lines, comparing the differences among those dose irradiated lines shows ion beams iadiation
plants irradiated with several different doses. might have broaden the limits.
Though the rate of ray petals in total petals was
2. Experimental methods higher in He2' ion I Gy line than in low dose
Chrysanthemum variety, 'Syuhounochikara! lines (0 2 5Gy), there was no significant
(white flower) was used for the experiment. difference among the number of ray petals in each
Isolation and embedding of mesophyll protoplasts plot as well as the number of total petals (Table 1).
were conducted by the modified metho&. 'Me It is interesting that one of the irradiated plants had
protoplasts were irradiated with 50 MeV 'He or 385 ray petals and others had more tubular petals
220 MeV 2C-" ion beams from the AVF cyclotron than ray petals.
in JAERL Those irradiated protoplasts were High frequent mutations also occurred in flower
cultured, regenerated and grown in a field of type (Table 2. Among those mutations, twisted or
Fukuoka Agricultural Research Center. different length petals are frequently observed and
Mutation phenotypes were investigated after there were some exposed center or square, too. The
flowering. mutation rate of irradiated lines was more than two
times higher than that of OGy line.
3. Results and Discussion Flower-color change happened to one of 101
Various types of mutations were observed. The plants in 4He- ion with 2Gy, one of 204 in 4He2ion
mutants showed different traits especially in with 5Gy and two of 91 in V* ion with 5Gy
height, flowering day, the number of petals, flower (Table 3. The rate of color change was especially
- 28 -
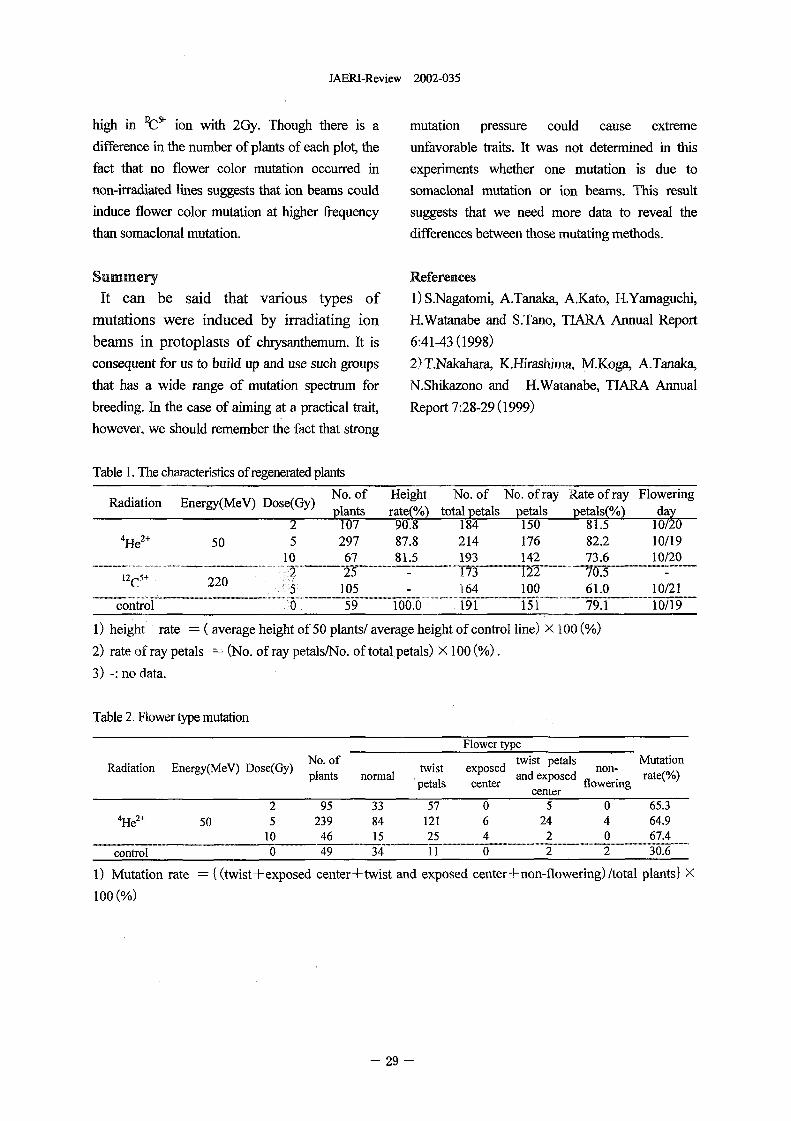
JAERI-Review 2002-035
high in PC" ion with 2Gy. Though there is a mutation pressure could cause extreme
difference in the number of plants of each plot the unfavorable traits. It was not determined in this
fact that no flower color mutation occurred in experiments whether one mutation is due to
non-irradiated lines suggests that ion beams could somaclonal mutation or ion beams. This result
induce flower color mutation at higher firequency suggests that we need more data to reveal the
than somaclonal mutation. differences between those mutating methods.
Summery References
It can be said that various types of I)S.Nagatomi, A.Tanaka, A.Kato, H.Yamaguchi,
mutations were induced by irradiating ion H.Watanabe and S.Tano TURA Annual Report
beams in protoplasts of chrysanthemum. It is 6:41-43 1998)
consequent for us to build up and use such groups 2)T.Nakahara, K.Hirashinia, M.Koga, A.Tanaka,
that has a wide range of mutation spectrum for N.Shikazono and H.Watanabe, TIARA Annual
breeding. In the case of aiming at a practical trait Report 728-29 1999)
however, we should remember the fact that strong
Table 1. The aracteristics of regenerated plants
Radiation Energy(MeV) Dose(Gy) No. of Height No. of No. of ray Rate of ray Floweringplants rateQ�o) total petals petals petals(%) day
2 107 90.8 184 15U 81.5 10/20
4He" 50 5 297 87.8 214 176 82.2 10/1910 67 81.5 193 142 73.6 10/20.... ... ....... ..... ....
12 7 1 TTC 220 5 105 164 100 61.0 10/21.................................. .....I. ....... ..... .... .................................. . ......... .. ....... . ... ........ . ................ . .....
59 100.0 191 151 79.1 10/19
1) height rate average height of 5 0 plants/ average height of control line) X I 0 N)
2) rate of ray petals (No. of ray petals/No. of total. petals) X 100 N.
3) -: no data.
Table 2 Flower type mutation
Flower typeNo. of twist petals Mutation
Radiation Energy(MeV) Dose(Gy) twist exposed non-plants normal petals center and exposed flowering rate(%)
center2 95 33 57 0 5 0 65.3
4He 21 50 5 239 84 121 6 24 4 64.910 46 15 25 4 2 0 67.40 49 0 3 6'. 6
1) Mutation rate (twist+exposed center+twist and exposed center+ non-flowering) /total plantsl X
I 00 W
29 -
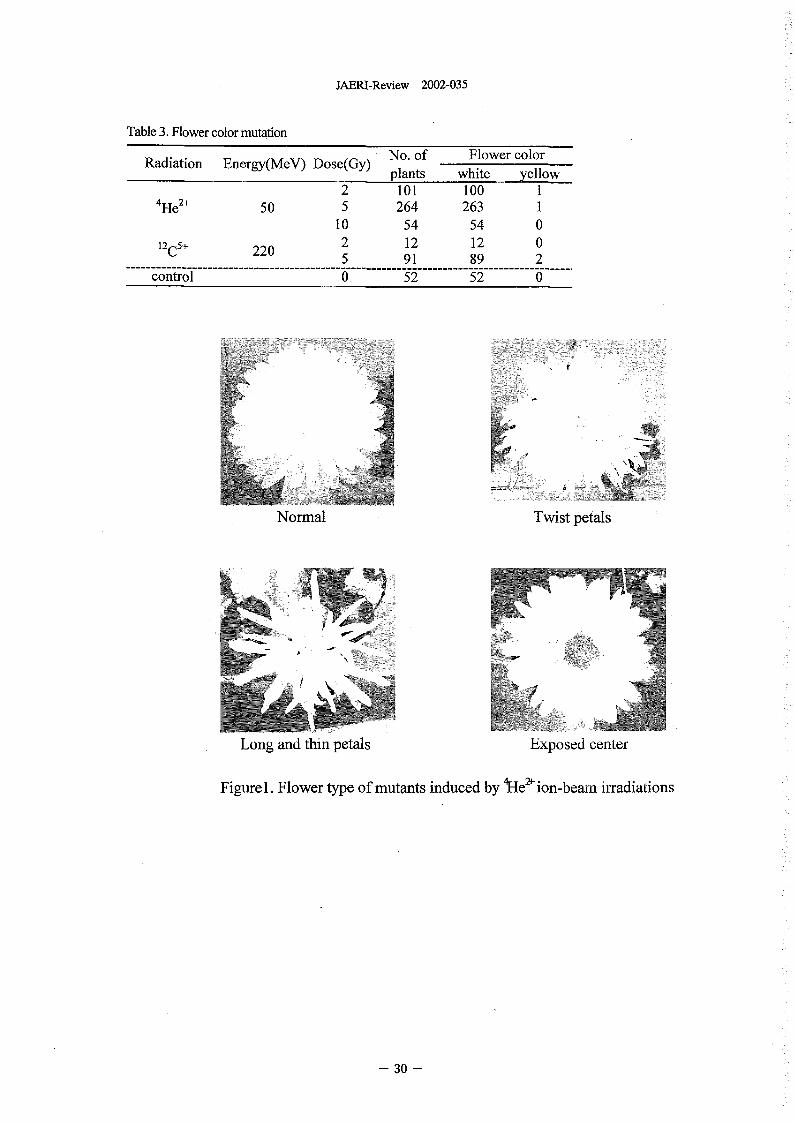
JAERI-Review 2002-035
Table 3. Flower color mutation
Radiation Energy(MeV) Dose(Gy) No. of Flower colorplants white yellow
4 2+ 2 101 100 IHe 50 5 264 263 1
10 54 54 0
12 C5+ 220 2 12 12 05 91 89 2
control 0. 52 52 0
Normal Twist petals
A
Long and thin petals Exposed center
Figure 1. Flower type of mutants induced by 4He2'- ion-beam irradiations
30 -
JAERI-Review 2002-035
2.3 Effects of Ion Beams on Shoot Regeneration of Elatior Begonia(B. x hiemalis) Leaf Cultures
Masahide IIZUKA*,Nobuhiro KUDO*, Yasuo KEVIURA*,Yoshihiro HASE** and Atushi TANAKA**
Gumma Horticultural Experiment Station%Department of Radiation Research for Environment and Resources, JAERI.**
Introduction samples covered with Kapton film wereIon beams, which have a higher linear irradiated with carbon ion beam 220
energy transfer (LET) than X and gamma MeV 12C5+ and 320 MeV 12C '+) at various
rays, is one of efficient inutagenic agents, doses 2 to 150 Gy). After irradiation theapplicable to mutation breeding of many leaf segments were transferred to thehorticultural crops. However, there have fresh medium and cultured at 20 'C andbeen few studies on the effects of ion 16 hr-photoperiod. Rgeneration rate wasbeam irradiation on induction of mutation investigated after 40-50 days of culture.in vegetables and ornamental crops. Thelethal dose of the 4He 2+ and 12C5+ ion Results and Discussion
beam irradiation to strawberry, hydrangea When the dosage of irradiationand spiraea seed became clear ),2)3) increased, the rgeneration rates of the
We have the mutation breeding of the leaf segments decreased. At the dose of12C5+,Elatior Begonia (B. xhiemalis) is more than I Gy I ion beams, the
important pot cultures.An ion beam was rgeneration rate decreased rapidly(Fig.1).
irradiated in Elatior Begonia for the And at the dose of more than G in
purpose of variation of the flower color. 12C6+ ion beams, the rgeneration rate
We examined effects of ion beam decreased rapidly(Fig.2).
irradiation on germination of Elatior We are performing cytological studies
Begonia. to investigate horticultural values of the
mutants and are screening mutants of
Materials and Methods flower color variation in the growing
Elatior Begonia(B.xhiemalis) cv.Line plants.
in greenhouse were used as plant
materials. Young leaves were excised, References
surface sterilized by immersing in 70% I)N. Kudo et al. TIARA Ann. Rep.,
ethyl alcohol for I min, followed in 16:62-64. 1998)
1%(W/V) sodium hypochlolite solution 2)M. lizuka et al. TIARA Ann. Rep.,
for 15 min and then rinsed three times in 2.3:30-31. 1999)
distilled water. The leaf segments were 3)M. Izuka et al. TIARA Ann. Rep.,
cultured on modified Murashige and 2.7:45-46. 2001)
Skoog's (MS) medium supplemented with
0.5 mg/I NAA and ling/I BA. The
- 31 -
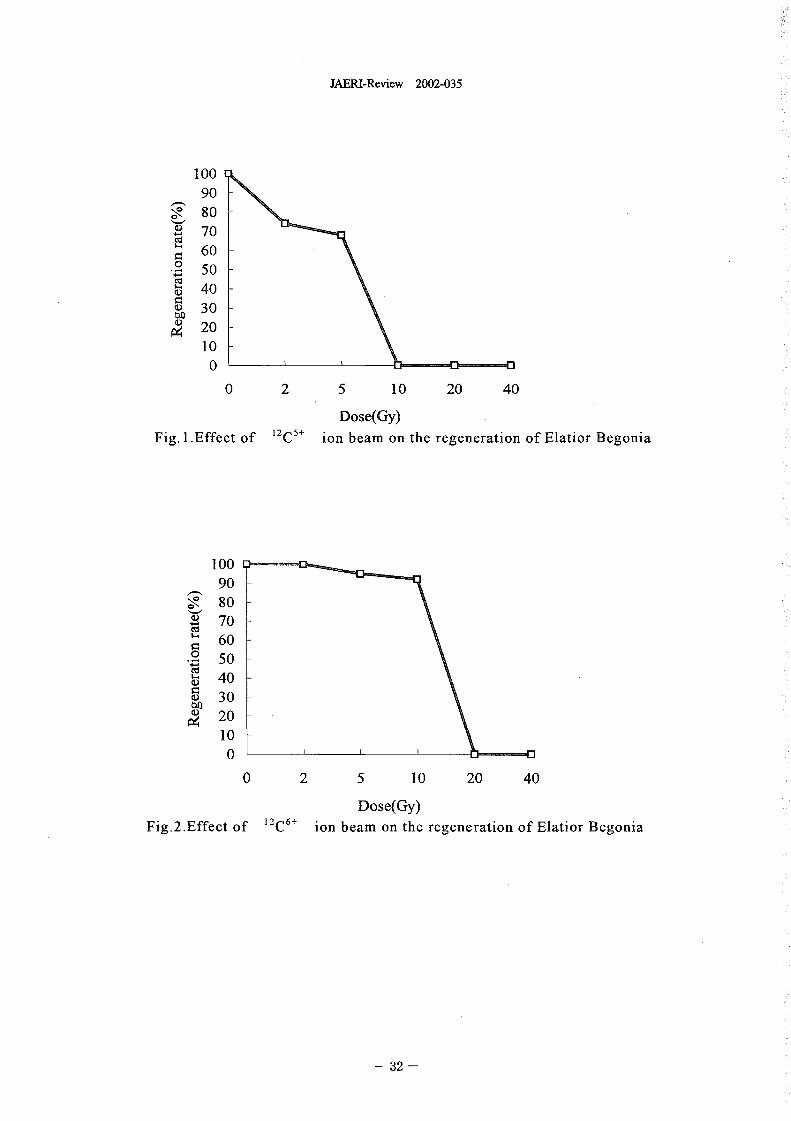
JAERI-Review 2002-035
100
908070
Cd
0 60 --;z 50 -Cd
40 -30 -20 -10 -
0 1 1 t
0 2 5 10 20 40
Dose(Gy)f 12C5+Fig. I.Effect o ion beam on the regeneration of Elatior Begonia
10090 -80 -70 -
.0 50 -40 -30 -20 -10 -0
0 2 5 10 20 40
Dose(Gy)Fig.2.Effect of 12C61 ion beam on the regeneration of Elatior Begonia
32 -
JAERI-Review 2002-035
2.4 Isolation of an Arabidopsis mutant defective in damagetolerance
Ayako Sakanioto*, Vo Thi Thuong Lan*, Naoya Shikazono*, Yoshihiro
Hase* Hroshi Watanabe" and Atsushl Tanaka*
Department of on-Beam-Applied 8iolog3-- JAERI*
JAERI**
1. Introduction seedlings were vertically grown on nutritivePlants require snlight for photosynthesis, agar plates under continuous white light forthus are destined to expose themselves to three days. After exposed to 0.5kj/M2 Of
harmful UV radiation for any ours. Even in UVB, seedlings ere incubated another threesuch a hard environment, however, plants days under the dark condition. The line thatgrow vigorously and breed. T reason hy showed a reduced root growth was picked up asplants are resistant to UV has been studied for a andidate of UVB sensitive mutant.years. Most known factor is te presence ofUV-absorbing compounds sch as flavoriold". 2.2 Mapping
In addition, plants have enzymes to repair Candidates of UVB-sensitive mutants were
darnaged DNA 2 ad the mechanisms by wich crossed to the Landsberg electa ecotype. F2
plants extinguish the active oxygen". The plants from this cross were grown and one leaf
presence of other unknown systern(s) has also was removed and stored for DNA preparation.
been predicted to regulate the response to UV. Then the plants allowed to self-pollinate, the
To isolate a novel gene involved i UV- seeds were harvested in each plant and
response in plant, e have tried to isolate preparing F2 line, seeds. The F2 lines were
UVB-scnsitlvc ]Militants. As a result, we screened for U`VB sensitivity by root bending
successfully solated six new' mutants named assay. DNA was extracted from the leaf
sm, (sensitive to 111). Among tese mutants, stocks of UVB sensitive homozygous lines and
here we report t identification and analvzed bv SSLp6) or CAPS') method.
characterization of se,].
3. Results and Discussion
2. MateHals and Methods To study the mechanisms of UV-tolerance in
2.1 Muta-enesis and Si-eening higher plants, we have isolated UVB sensitive
Arabielopsis thalicina ecotype Columbia seeds mutants. About 3000 of M2 lines derived
were irradiated with carbon ons wth a dose of from ]on beam-irradiated seeds were screened
150 Gy as previously described'. The MI for UVB sensitivities under non-
seeds ere grown and self-pollinated, preparing photoreactivating conditions. Thirteen 2
M2 seeds. The offspring seeds derived from lines, hose growths were inhibited by UVB
M2 ere harvested in each plant, preparing rradiation, ere selected as candidates of UVB
3000 lnes of sced. stocks. UVB snsitivity of sensitive utants. These lines ere mapped
all M is as xamined by root bending on six different positions o chromosome.
assay as described previ ously". In brief, We narned the six mutants as sm; (ensitiv to
33 -
JAERI-Review 2002-035
UV) I tosm,6 ad anahzed yin.-I further. digested patterns of se,] DNA. Using the
To characterize the sml utant, we probe of T2KIO (left side) or T I F 1 5 (right
applied several DNA damaging treatment to side, overlap ith F7135), we found that some
.Will] and analyzed te responses. First, we fragments ere lost in the siti,]DNA. Next,
irraditated various doses of UVB to the smJ we designed 14 pairs of PCR pnrriers covering
and wd type seedlings ad measured the root the mssing 14.5kb (left) and 6.6kb (right)
arow-th in non-photoreactivating (dark) or fragments. By PCR analyses, e found that
photoreactivating lght cdition. The the subfraginent I I in the 14.5kb fragment
result showed that the sulJ as ore sensitive and te subfraginen 3 in the 6.6kb fragment
to UVB than wild type ant in both were not aplified i 71,1. Then we
conditions. performed TAEL-PCR to aalyze the missing
'Fo know whether swvl mtant is lso regions M.57/14. SeqUencing of the TAIL-PCR
sensitive t other type of DNA damage, e fragments revealed that the sequence of
applied several agents inducing different type T I F 1 5 as broken in the middle and rej oined
of DNA damage. When we exposed to y-rays, to the sequence of T2K IO. Moreover, hen
the sm7l seedlings showed hypersensitivity we read the another half of T2KIO, this
compared to te wld type. On te other sequence was rqj oined to the DNA
hand, sedlings transplanted n te agar plates corresponding to the F8A5 located about
containing itliyliiietliane-siilfoiiate (MMS, 2OOkb downstrearn to T2KIO. Finally, we
alkylating agcnt) showed slightly reduced found that the szml mutant involves quite
growth compared to the wild type. complicate rearrangements including
Surprisingly, sll] was also inhibited t o grow chromosome inversion and translocation
on the plate containing rnitomycine C (Fig I A).
(MMC). Since MMC is tought to ause intra- Owing to the chroniosornal rearrangements,
or inter-strand ross-links o double strarid at least 'two genes ere disrupted in viill
DN .A, our results suggested a diverse fnction (Fig. I B). One gene encoded the protein that
of SUVI gene. has a homology to the large GTP binding
To identify the will,] gene, e performed protein farrifly. The other gene encoded the
fine Mapping using 269 chromosomes catalytic sbunit of DNA polymerase �
prepared from the cross of Ym4 with Ler. (AIRE173). In yeast or animal cells, REV3 has
However w found that there was no shown to be involved in the translesion
recombination over 5M region in the synthesis, a pathway to overcorne the stalled
bottom of chrorriosonle 1. We assurried that replication at the DNA lesion8). Therefore,
this strange recombination rate in sinl might we hypothesized that in the vnl darnaged
be due to a chromosome inversion induced by DNA nternists DNA replication because of
ion beam irradiation. To identify the mutation of AIREV3, leading to the inhibition
mutation, e tried to find te ends of inverted of cell diiision and root elongation
region. We utilized the squences of bacterial RE V3 is known to concern with the error-'f al chromosome (BAC) corresponding o
arti i c prone TLS and to cause most of UV-Induced
the boundaries of no-recombination region. mutations in yeast and animal cells"' Our
The DNA probes prepared from seven BACs finding suggests that there are error-prone
were used to detect te restriction nzyme- TLS activities in plants. However, since
- 34 -
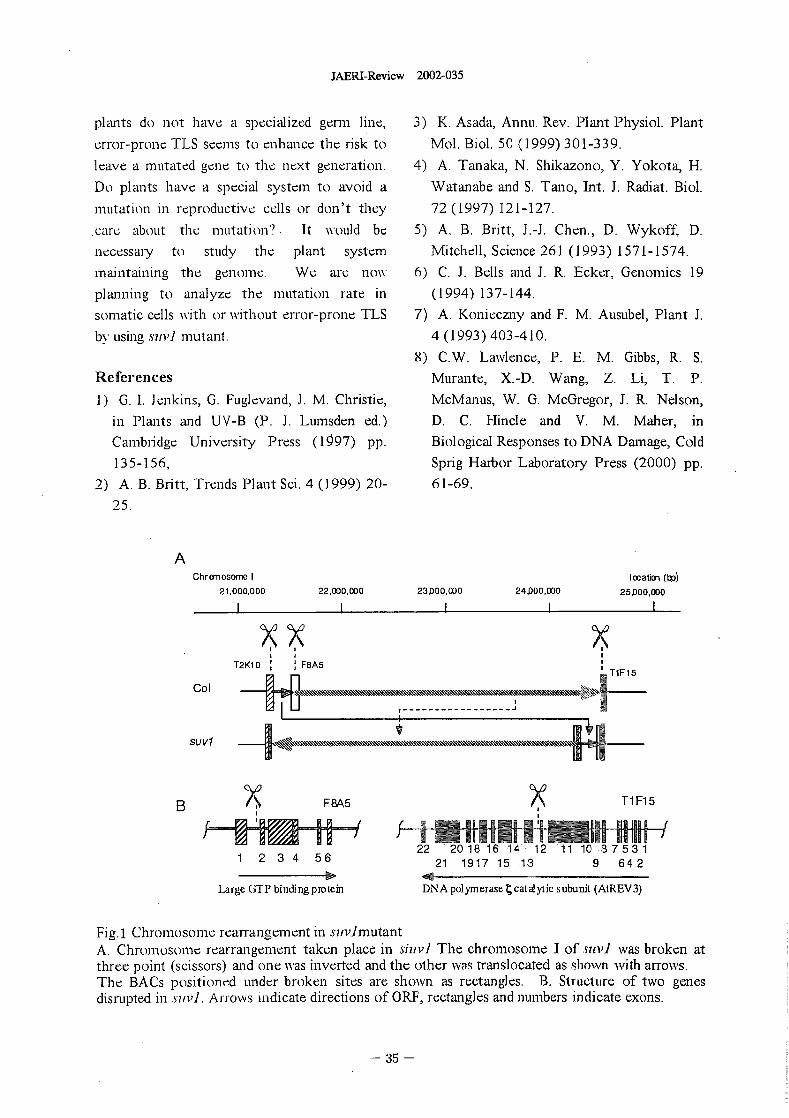
JAERI-Review 2002-035
plants do ot ave a specialized genii line, 3) K. Asada, Annu. Rev. Pant Physiol. Plant
error-prone TLS seems to nhance te risk to Mol. Bol. 50 1999) 301-339.
leave a mutated gene t te ext gneration. 4) A. Tanaka, N. Shikazono, Y. Yokota, H.
Do plants have a secial system to avoid a Watanabe and S. Tano, hit. J. Radiat. Bol.
mutation in rroductiv cls or don't tey 72 1997) 121-127.
.caru about t mutation') It would be 5) A. B. Britt, J.-J. Chen., D. Wykoff D.
necessary to study the plant system Mitchell, Science 261 1993) 1571-1574.
maintaining the genorne. We are nw 6) C. J. Bells ad J. R. Ecker, Genomics 19
planning to analyze the utation rate in (1994) 137-144.
somatic ells with or without error-prone TLS 7) A. Konleczny and F. M. Ausubel, Plant J.
by usingsi/1,1 mutant, 4 1993) 403-410.
8) CW. Lawlence, P. E. M. Gibbs, R. S.Refei-ences Murante, X.-D. Wang, Z. Li, T. P.
1) G. 1 Jnkins, G. Fuglevand, J. M. Christie, McManus, W. G. McGregor, J. R. Nelson,
in Plants ad UV-B (P. J. Lurnsden ed.) D. C. Hincle and V. M. Maher, in
Cambridge Uversity Press 1097) pp. Biological Responses to DNA Darnage, Cold
135-156, Sprig Harbor Laboratory Press 2000) pp.
2) A. B. Bitt, Trends Plant Si 4 1999) 20- 61-69.
25.
AChromosome I I ocation (bp')
21.000.000 2200,000 23,000.ODO 24,000,000 25.000,ODO
X.T2K1 0 FBA5
TIF15
Col
SUO
B FaA5 T1F15
22 20 18 16 1 12 11 10 7 3 1 2 3 4 56 21 1917 15 13 9 6 4 2
Large GTP binding protein DNApolyrnerasetcatEdyticsubunil (AtREV3)
Fig.1 Chromosome rearrangement in sul4mutantA. Chromosome rearrangement taken place in sizwl The chromosome I of sm,] was broken atthree point (scissors) and one was inverted ad the other was translocated as sbown with arrows.The BACs positioned under broken sites are shown as rectangles. B. Sucture of two genesdisrupted in szt14. Arrows indicate directions of ORF, rectangles and numbers indicate exons.
35 -
JAERI-Review 2002-035
2-5 Development of the efficient mutation breedingmethod using ion beam irradiation
H. Yamaguchi, T. Morishita, K. Degi,
A. Tanaka*, Y. Hase* and N. Shikazono*
Institute of Radiation Breeding, NIAS,
Department of Radiation Research for Environment and Resources, JAERI
1. Introduction chrysanthemum.
Most mutagens used for registered crop
mutant varieties in the world are gamma rays 2. Materials and Methods
and X rays. Ion beams are expected to be The chrysanthemum cultivar Taihei' was
widely utilized as new mutagens, because they used for this study. Leaf explants were plated
have very high linear energy tr ansfer (LET) on callus induction media (MS media
and relative biological effectiveness (RBE) in supplemented with 4 M BA, 1 uM NAA,
comparison with gamma rays and X rays. By 2 sucrose and 09 agar). They were
ion beam irradiation, specfic flower mutants irradiated with various doses of accelerated
that were not obtained with. gamma rays were 12C5+ (220 MeV 002 nA) ion and 4He 2, (100
induced in chrysanthemum". However, the MeV, 20 nA) particles using an AVF
differences among ion beams and gamma rays Cyclotron in JAERI and with various doses of
in the effect of mutation and in the spectrum of gamma rays in IRB. After irradiation, the
induced mutant are not evident. explants were plated on new media, and then
On the other hand, it is the problem in plated on regeneration media (MS media
mutation breeding that the mutation occurs not supplemented with 4 u M BA, 0.5 I-L M
only in the trait aimed to improve, but also in NAA 2 sucrose and 09 agar) three
other traits and the infection by irradiation. It weeks later. The regeneration rate was
was reported that some shoots produced after investigated six weeks later. The regenerated
gamma ray irradiation had lower chromosome plants were established and the flower color
number than te control plants and the was investigated.
reduction of chromosome number was In C ion beam irradiation with Gy 2 Gy
correlated with the size of inflorescence in and 3 Gy and in gamma ray irradiation with 0
chrysanthemum 2). It is also indicated the Gy� 20 Gy and 30 Gy, the nuclear DNA
nuclear DNA content measured with the flow contents of regenerated plants were measured
cytornetry was related to te plant size in sugar with flow CtOtnetflC analysis. Leaf of garden
cane 3) . Therefore, we considered that the pea (Pisum salivum cv. Narikorna Sanjunichi)
nuclear DNA content might be available for was used as standards and the ratio of nuclear
the index of infection by irradiation. DNA content in a sample to that in garden pea
In this study, to develop the efficient was calculated. The measurements were
mutation breeding method using ion beams, we repeated two times using two different leaves
investigated the effect of mutation and the of a plant in 50 plants of each irradiation dose.
influence of carbon ion beam irradiation on
nuclear DNA content of plants regenerated 3. Results and Discussion
from irradiated leaf explants in The influences of C ion beam, He ion beam
- 36 -
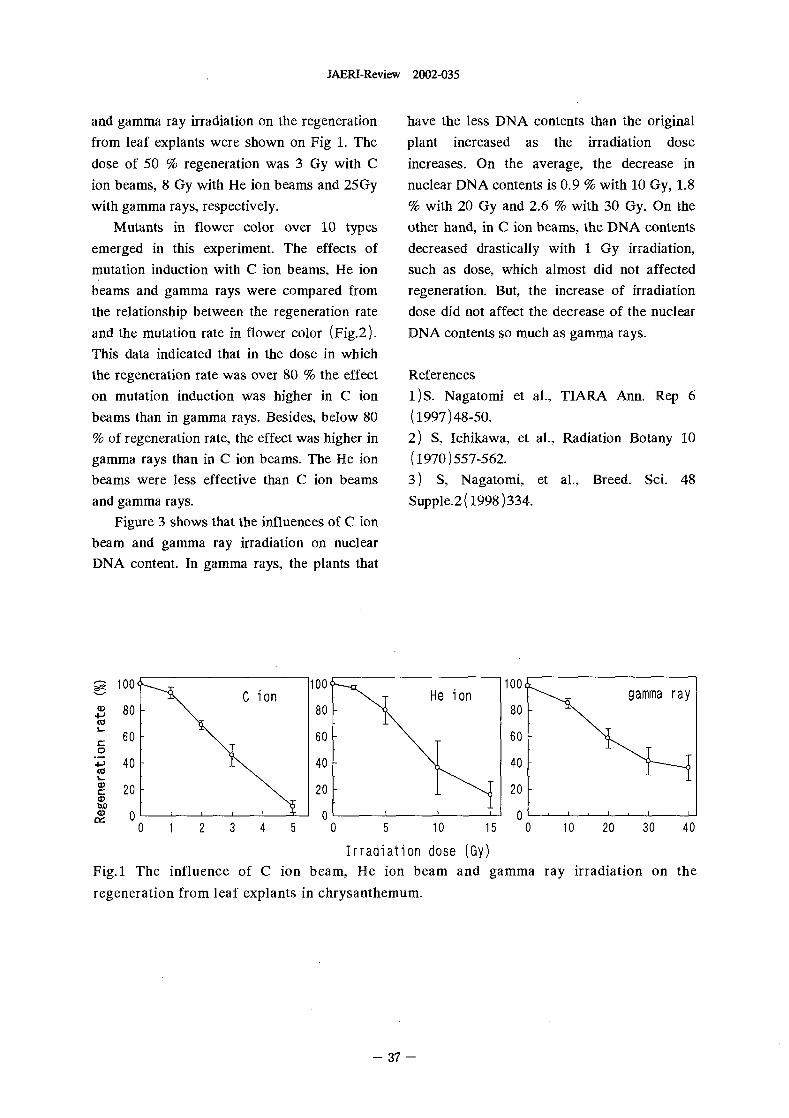
JAERI-Review 2002-035
and gamma ray irradiation on the regeneration have the less DNA contents than the original
from leaf explants were shown on Fig 1. The plant increased as the irradiation dose
dose of 50 regeneration was 3 Gy with C increases. On the average, the decrease in
ion beams, Gy with He ion beams and 25Gy nuclear DNA contents is 09 with 10 Gy, 1.8
with gamma rays, respectively. % with 20 Gy and 26 with 30 Gy. On the
Mutants in flower color over 10 types other hand, in C ion beams, the DNA contents
emerged in this experiment. The effects of decreased drastically with Gy irradiation,
mutation induction with C ion beams., He ion such as dose, which almost did not affected
beams and gamma rays were compared from regeneration. But, the increase of irradiation
the relationship between the regeneration rate dose did not affect the decrease of the nuclear
and the mutation rate in flower color (Fig.2). DNA contents so much as gamma rays.
This data indicated that in the dose in which
the regeneration rate was over 80 the effect References
on mutation induction was higher in C ion 1)S. Nagatomi et al., TIARA Ann. Rep 6
beams than in gamma rays. Besides, below 80 (1997)48-50.
% of regeneration rate, the effect was higher in 2) S, Ichikawa, et al., Radiation Botany 0
gamma rays than in C ion beams. The He ion (1970)557-562.
beams were less effective than C ion beams 3) S, Nagatomi, et al., Breed. Sci 48
and gamma rays. Supple.2(1998)334.
Figure 3 shows that the influences of C ion
beam and gamma ray irradiation on nuclear
DNA content. In gamma rays, the plants that
1 00 C ion 100 He i on loot gamma ray
-CD 80 - 80 - 80 -co
60 60 60
Z 40 40 40coI..CDC 20 20 20CDW
o o o
0 1 2 3 4 5 0 5 10 1 5 0 1 0 20 30 40
Irradiation dose (GY)Fig. 1 The influence of C ion beam, He ion beam and gamma ray irradiation on the
regeneration from leaf explants in chrysanthemum.
37 -
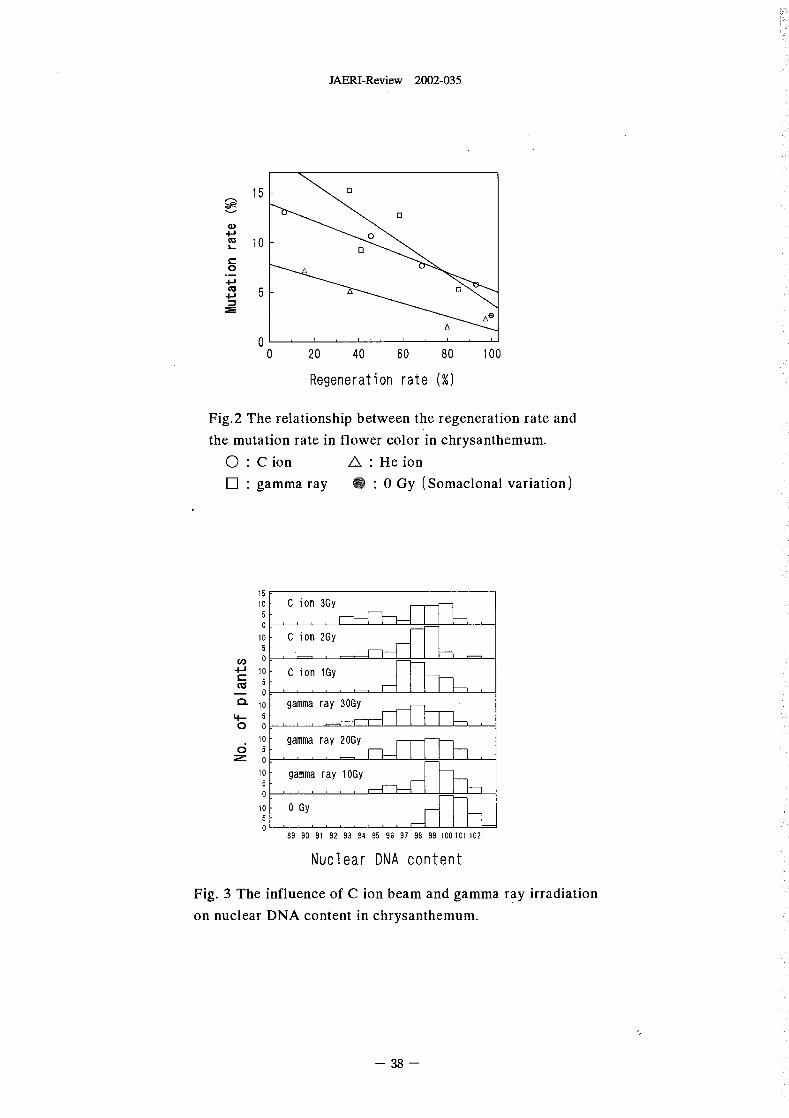
JAERI-Review 2002-035
15
CD4-J
10
04-JM4J 5
0
0 20 40 60 80 1 00
Regeneration rate (%)
Fig.2 The relationship between the regeneration rate and
the mutation rate in flower color in chrysanthemum.
0 C ion A He ion
El gamma ray 0 Gy (Somaclonal variation)
lo- C ion My5-0-
lo- C ion 2Gy
co 0.
4-J 10 C ion 1Gy50
10- gamma ray 3Gy5-
0 o
. 10 gamma ray 2Gy0 5
0.10- gamma ray 1OGy5-0
10. 0 Gy50. . . . . . .
89 90 91 92 93 94 95 96 97 98 99 1 0 I 1 102
Nuclear DNA content
Fig. 3 The influence of C ion beam and gamma ray irradiation
on nuclear DNA content in chrysanthemum.
- 38 -
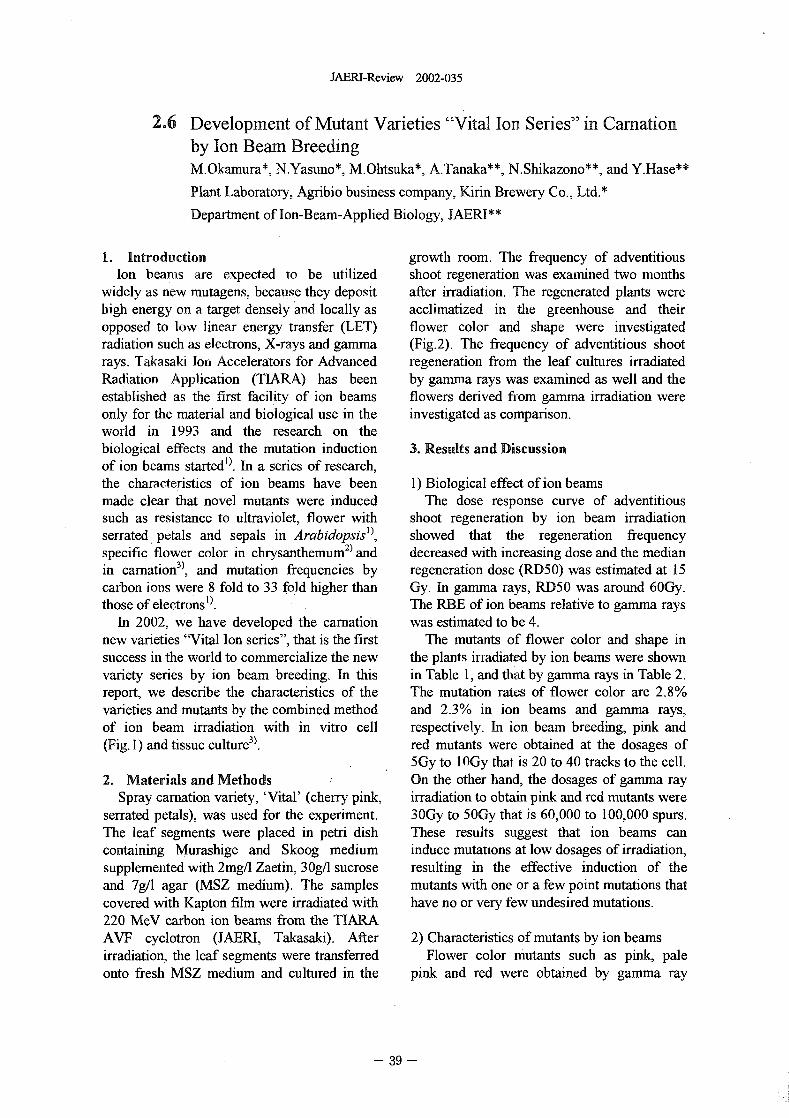
JAERI-Review 2002-035
2.6 Development of Mutant Varieties "Vital Ion Series" in Carnationby Ion Beam BreedingM.Okamura*, N.Yasuno*, M.Ohtsuka*, A.Tanaka**, N.Shikazono**, and Y.Hase**
Plant Laboratory, Agribio business company, Kinn Brewery Co., Ltd.*
Department of Ion-Bearn-Applied Biology, JAERI**
1. Introduction growth room. The frequency of adventitiousIon beams are expected to be utilized shoot regeneration was examined two onths
idely as new mutagens, because they deposit after irradiation. The regenerated plants werehigh energy on a target densely ad locally as acclimatized in te greenhouse and theiropposed to low linear energy transfer (LET) flower color and shape were investigatedradiation such as electrons, X-rays and gamma (Fig.2). The frequency of adventitious shootrays. Takasaki TOD Accelerators for Advanced regeneration from the leaf cultures irradiatedRadiation Application (TIARA) has been by gamma rays was examined as well and theestablished as the first facility of ion beams flowers derived from gamma irradiation wereonly for the material and biological use in the investigated as comparison.world in 1993 and the research on thebiological effects and the mutation induction 3. Results and Discussionof ion beams started'). In a series of research,the characteristics of ion beams have been 1) Biological effect of ion beamsmade clear that novel mutants were induced The dose response curve of adventitioussuch as resistance to ultraviolet, flower with shoot regeneration by ion beam irradiationserrated. petals and sepals in Arabidopsis'), showed that the regeneration frequency
2) d decreased with reasing dose and the medianspeci ic flower color chrysanthemum an Mc
3)in carnation and mutation frequencies by regeneration dose (RD50) was estimated at 5carbon ions were fold to 33 fold higher than Gy. In gamma rays, RD50 was around 6Gy.those of electrons'). The RBE of ion beams relative to gamma rays
In 2002, we have developed the carnation was estimated to be 4.new varieties "Vital Ion series", that is the first The mutants of flower color and shape insuccess in the world to commercialize the new the pants irradiated by ion beams were shownvariety series by ion beam breeding. In this in Table 1, and tat by gamma rays Table 2.report, we describe the characteristics of the The mutation rates of flower color are 28%varieties and mutants bv the combined method and 23% in ion beams and gamma rays,of ion beam irradiation with in vitro cell respectively. In ion beam breeding, pnk and
3)(Fig. ) and tissue culture red mutants were obtained at the dosages of5Gy to I Gy that is 20 to 40 tracks to the cell.
2. Materials and Methods On the other hand, the dosages of gamma raySpray carnation variety, 'Vital' (cherry pink, irradiation to obtain pink and red mutants were
serrated petals), was used for the experiment. 3OGy to Gy that is 60,000 to 100,000 spurs.The leaf segments were placed in petri dish These results sggest that ion beams cancontaining Murasbige and Skoog medium induce mutations at low dosages of irradiation,supplemented with 2mg/l Zaetin, 3 )0g/I sucrose resulting in the effective induction of theand 7g/l agar (MSZ medium). The samples mutants with one or a few point mutations thatcovered with Kapton film were irradiated with have no or very few undesired mutations.220 MeV carbon ion beams from the TIARAAVF cyclotron (JAERI, Takasaki). After 2) Characteristics of mutants by ion beamsirradiation, the leaf segments were transferred Flower color mutants such as pink, paleonto fresh MSZ medium and cultured in the pink and red were obtained by gamma ray
39 -
JAERI-Review 2002-035
irradiation, whereas those by carbon ion beam productivity, long vase life etc. By ion beamcontained pink, dark pink, light pink, salmon, breeding, we have succeeded in the breedingred, complex and striped types of flower color of cv. "Vital" color family and rose type(Fig.3). flowers (Fig.6) as well within two years that
The mutation spectnim of the flower color retained the superior characteristics of theand shapes was the widest in ion beam parent.breeding. Qualitative mutants such as salmon, The expected distribution amount of "Vitalred, striped color, etc. as well as quantitative Ion series" cut flowers in Japan is to be moremutants such as dark pink, pink, light pink, than several ten millions, that is about tenbicolored etc. have been obtained in carnation. billion yen. The "Vital Ion series" are tested inWide variety Of flower shape mutants have Europe as well, therefore more economicbeen obtained such as round petals, wild impact is expected. ffigher energy ion beamsDianthus type flowers etc (Fig.4). that have deeper penetration depth to the plant
tissue and organ will make it possible to3) Development of varieties "Vital Ion series" broaden the target crops and materials,
From among the new color mutants derived resulting in the progress of commercializationfrom ion beam breeding of cv. Vital, three of ion beam breeding.mutant varieties, dark pink, red and bcoloredtype had been developed and applied for Referencesregistration and commercialized (Fig.5). The 1) A. Tanaka, Gamma Field Symposia,other mutants such as salmon, pink, pearl and No.38 1999), 19-28yellow will be registered and commercialized 2) S. Nagatorm, et al., JAERI-Review 98-016as "Vital Ion series" in 2002. The original (1998), 41-43variety Vital is Kinn's superior variety that 3) M. Okamura et al., JAERI-Reviewhas resistance to Fusanum disease, high 2001-039 2001), 52-54
Table 1. No. of mutants in plants regenerated from leaf cultures irradiated by 12C5+ ion beamsDose No. lines Mutants in flower color and/or shape (No.) Mutation(Gy) tested in flower
263 ____!�oun ink 1.14T_5�tals Q, _L�S t P (1),k__ - --------------
10 284 Pink (1), Dark Pink (1), Light Pink 2), Salmon 2), 3.9Red (1), Striped type- pink and white 2),
__Djanthust�2�_petals 2)15 251 Pink 2) Pnk Round petals (1), Yellow(l) 3.6
Red (1), Red Round petals (1),Complex e, island white 2) - ------- ---
30 52 Striped type; pink and white (1), Cream (1) 3.8Total 850 Flower color and shape mutants 24) 2.8
Table 2 No. of mutants in plants regenerated from leaf cultures irradiated b gamma raysDose No. lines Mutants in flower color and/or shape (No.) Mutation(Gy) tested in flower30 350 _____P_ink_(I),_M inute: striped-(3) ---------------- - ------------------ 1.1 --- - ------------50 426 .-- Pink 2), Red (1), �Kinjj Leq�pSq_�j)�_Roundpetals(2) 2.170 264 Pink (1), Li ht pink 2), Minute striped 7) 3.8- I -- --------- --- - ------ -100 110 Red (1), Minute striped 2) 2.7Total 1150 Flower color and shape mutants 26) 2.3
- 40 -
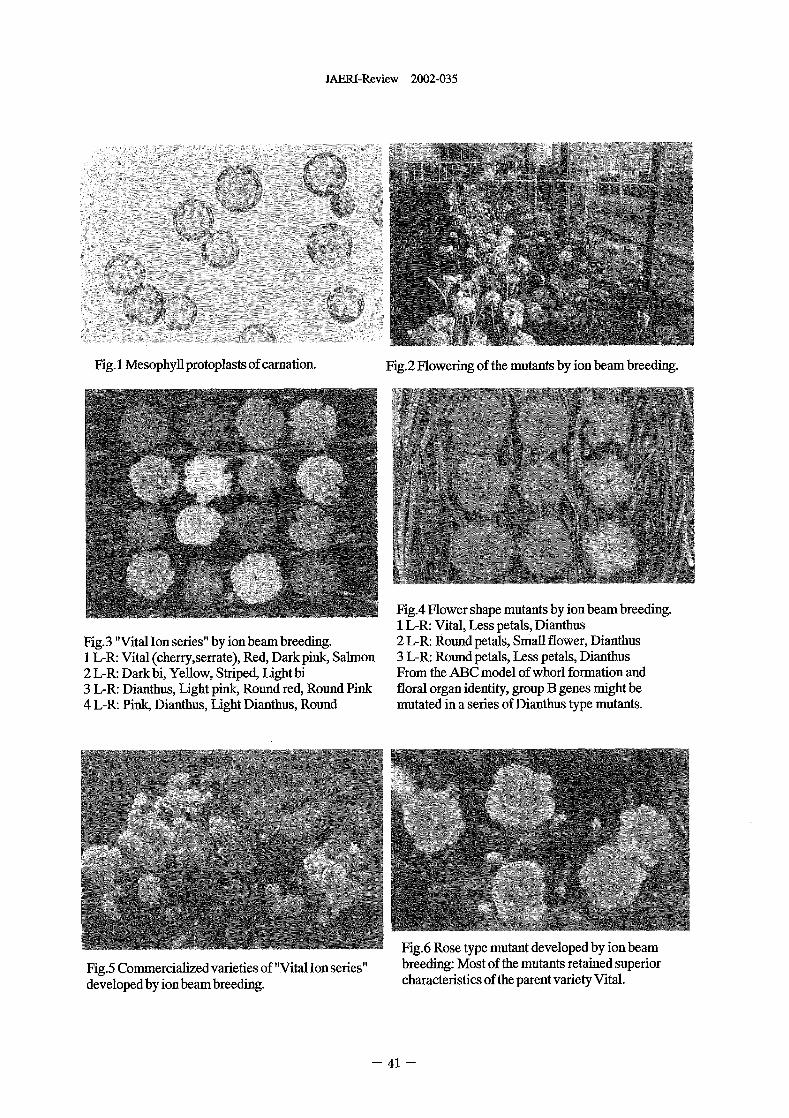
JAERI-Review 2002-035
Fig. I Mesophyll protoplasts of carnation. Fig.2 Flowering of the mutants by ion beam breeding.
Fig.4 Flower shape mutants by ion beam breeding.I L-R: Vital, Less petals, Dianthus
Fig.3 "Vital Ion series" by ion beam breeding. 2 L-R: Round petals, Small flower, DianthusI LR: Vital (cherryserrate), Red, Dark pink, Salmon 3 L-R: Round petals, Less petals, Dianthus2 L-R: Dark bi, Yellow, Striped, Light bi From the ABC model of whorl formation and3 L-R: Dianthus, Light pink, Round red, Round Pink floral organ identity, group B genes might be4 L-R: Pink, Dianthus, Light Dianthus, Round mutated in a series of Dianthus type mutants.
Fig.6 Rose type mutant developed by ion beam
Fig.5 Commercialized varieties of "Vital Ion series" breeding: Most of the mutants retained superiordeveloped by ion beam breeding. characteristics of the parent variety Vital.
- 41 -
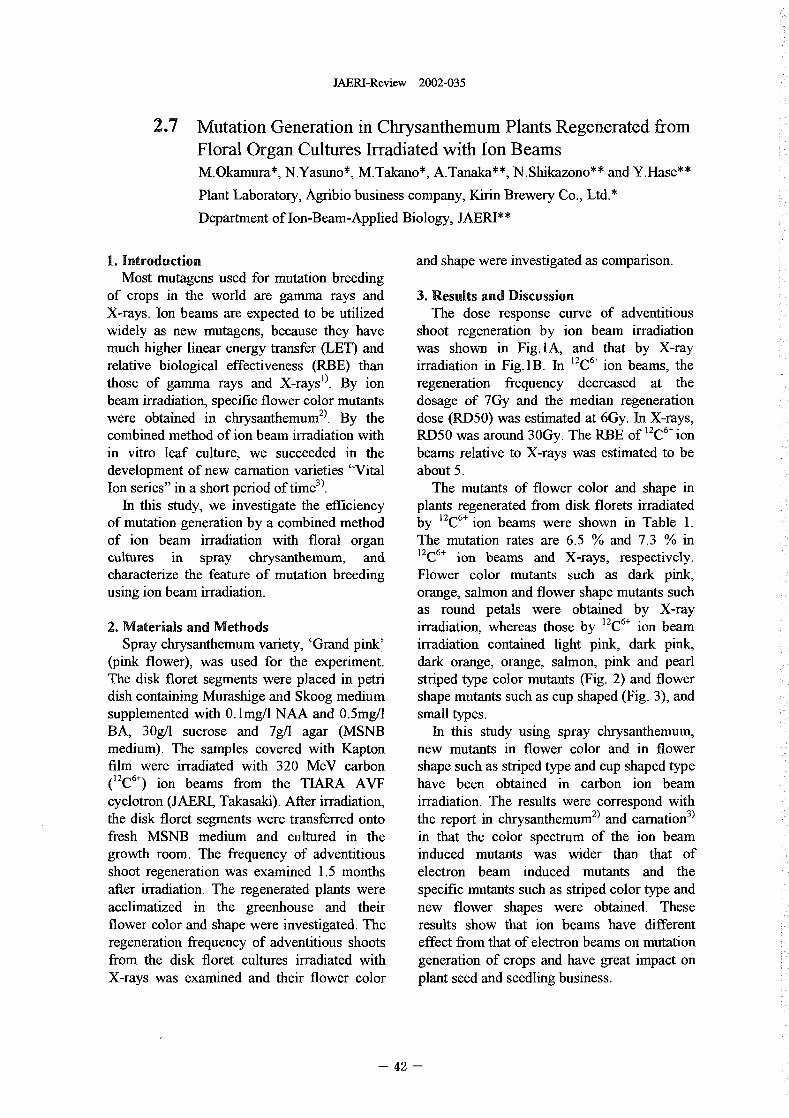
JAERI-Review 2002-035
2.7 Mutation Generation in Chrysanthemum Plants Regenerated fromFloral Organ Cultures Irradiated with Ion BeamsM.0kamura*, N.Yasuno*, M.Takano*, A.Tanaka**, N.Shikazono** and Y.Hase**
Plant Laboratory, Agribio business company, Kinn Brewery Co., Ltd.*
Department of on-Beam-Applied Biology, JAERI**
1. Introduction and shape were investigated as comparison.Most mutagens used for mutation breeding
of crops in the world are gamma rays and 3. Results and DiscussionX-rays. Ion beams are expected to be utilized The dose response curve of adventitious
idely as new mutagens, because they have shoot regeneration by 'on beam irradiationmuch higher linear energy transfer (LET) and was shown in Fig. IA, and that by X-rayrelative biological effectiveness (RBE) than irradiation in Fig. I B. In 12C" ion beams, tethose of gamma rays and X-rays'). By ion regeneration frequency decreased at thebeam irradiation, specific flower color mutants dosage of 7Gy and the median regenerationwere obtained in chrysanthemuM2). By the dose (RD50) was estimated at 6Gy. In X-rays,combined method of ion beam irradiation with RD50 was around 3Gy. The RBE of 12C6+ ion
in vitro leaf culture, we succeeded in the beams relative to X-rays was estimated to bedevelopment of new carnation varieties "Vital about .
3)Ion series" in a short period of time The mutants of flower color and shape inIn this study, we investigate the efficiency plants regenerated from disk florets irradiated
of mutation generation by a combined method by 12C61 ion beams were shown in Table of ion beam irradiation with floral organ The mutation rates are 65 and 73 incultures in spray chrysanthemum, and 12C6+ ion beams and X-rays, respectively.characterize the feature of mutation breeding Flower color mutants such as dark pink,using ion beam irradiation. orange, salmon and flower shape mutants such
as round petals were obtained by X-ray2. Materials and Methods irradiation, whereas those by 11C61 ion beam
Spray chrysanthemum variety, 'Grand pink' irradiation contained light pink, dark pink,(pink flower), was used for the experiment. dark orange, orange, salmon, pink and pearlThe disk floret segments were placed in petn' striped type color mutants (Fig. 2 and flowerdish containing Murashige and Skoog medium shape mutants such as cup shaped (Fig. 3, andsupplemented with 0 I mg/I NAA and 0. 5mg/I small types.BA, 30g/l sucrose and 7g/I agar (MSNB In this study using spray chrysanthemum,medium). The samples covered with Kapton new mutants in flower color and in flowerfilm were irradiated with 320 MeV carbon shape such as striped type and cup shaped type(12C61) iion beams from the TRA AVF have been obtained in carbon ion beamcyclotron (JAERI, Takasaki). After irradiation, irradiation. The results were correspond with
M2) 3)the disk floret segments were transferred onto the report in chrysanthemu and carnationfresh MSNB medium and cultured in the in that the color spectrum of the ion beamgrowth room. The frequency of adventitious induced mutants was wider than that ofshoot regeneration was examined 1.5 months electron beam induced mutants and theafter irradiation. The regenerated plants were specific mutants such as striped color type andacclimatized in the greenhouse and their new flower shapes were obtained. Theseflower color and shape were investigated. The results show that ion beams have differentregeneration frequency of adventitious shoots effect from that of electron beams on mutationfrom the disk floret cultures irradiated with generation of crops and have great impact onX-rays was examined and their flower color plant seed and seedlig business.
42 -
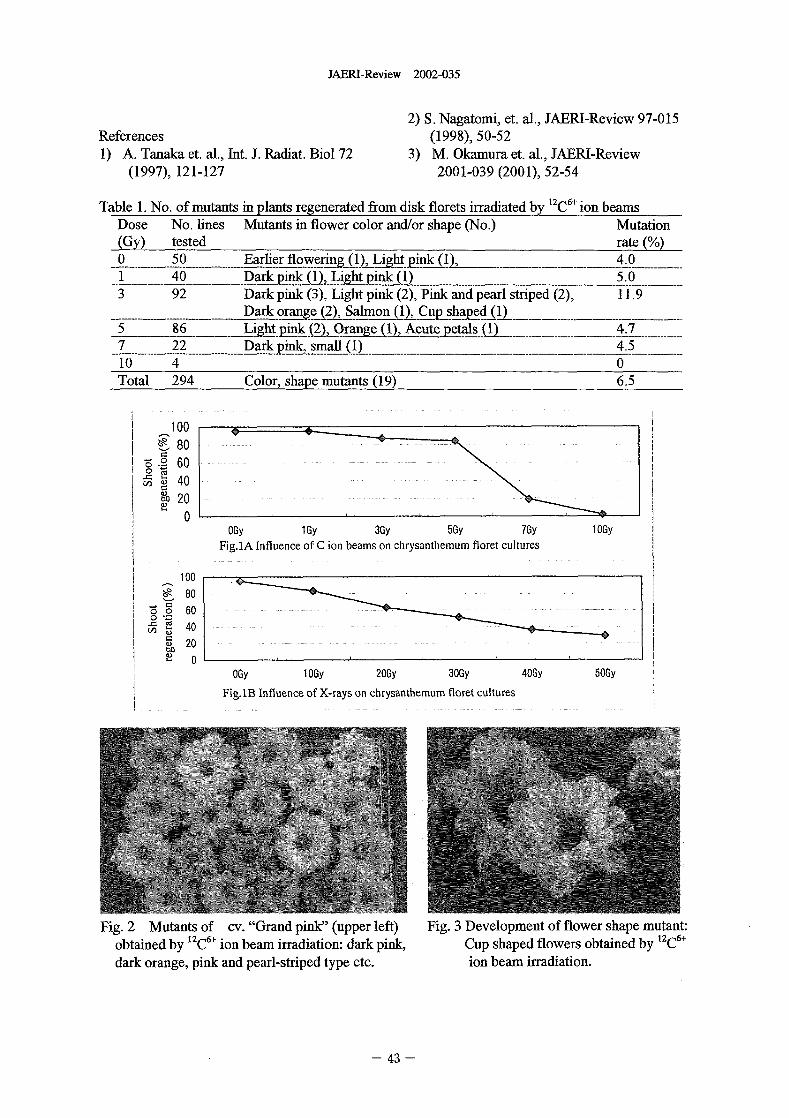
JAERI-Review 2002-035
2) S. Nagatomi, et. al., JAERI-Review 97-015References (1998), 50-521) A. Tanaka et. al., Int. J. Radiat. Bol 72 3) M. Okamura et. al., JAERI-Review
(1997), 121-127 2001-039 2001), 52-54
Table 1. No. of mutants in plants regenerated from disk florets irradiated by 12C61 ion beamsDose No. lines Mutants in flower color and/or shape (No.) Mutation(Gy) tested rate0 50 Earlier flowqing_Q),.��&�p1 40 D�aiLk mk ffl, �ight pink (1) 5.03 92 Dark pink 3). Light pink 2), Pink 11.9
D4,rk ijr�ge 2), Salmon (1). Cup shaped (1)5 86 L�gk�ink-Q qnLl I 4.77 22 a;�r� _small (1) -- - -------- - -10 4 0Total 294 Color, shape mutants 19) 6.5
10080
'6 .0 604020
0My 1Gy My 5Gy 7GY 10 Y
Fig.IA Influence of C ion beams on chrysanthemum floret cultures
1008060
co 40C4) 20
0My IOGy 2OGy 3OGy 4OGy 5OGy
Fig.1B Influence of X-rays on chrysanthemum loret cultures
Fig. 2 Mutants of cv "Grand pirW' (upper left) Fig. 3 Development of flower shape mutant:obtained by 12C61 ion beam iadiation: dark pink, Cup shaped flowers obtained by 12C6+
dark orange, pink and pearl-striped type etc. ion beam iadiation.
43 -
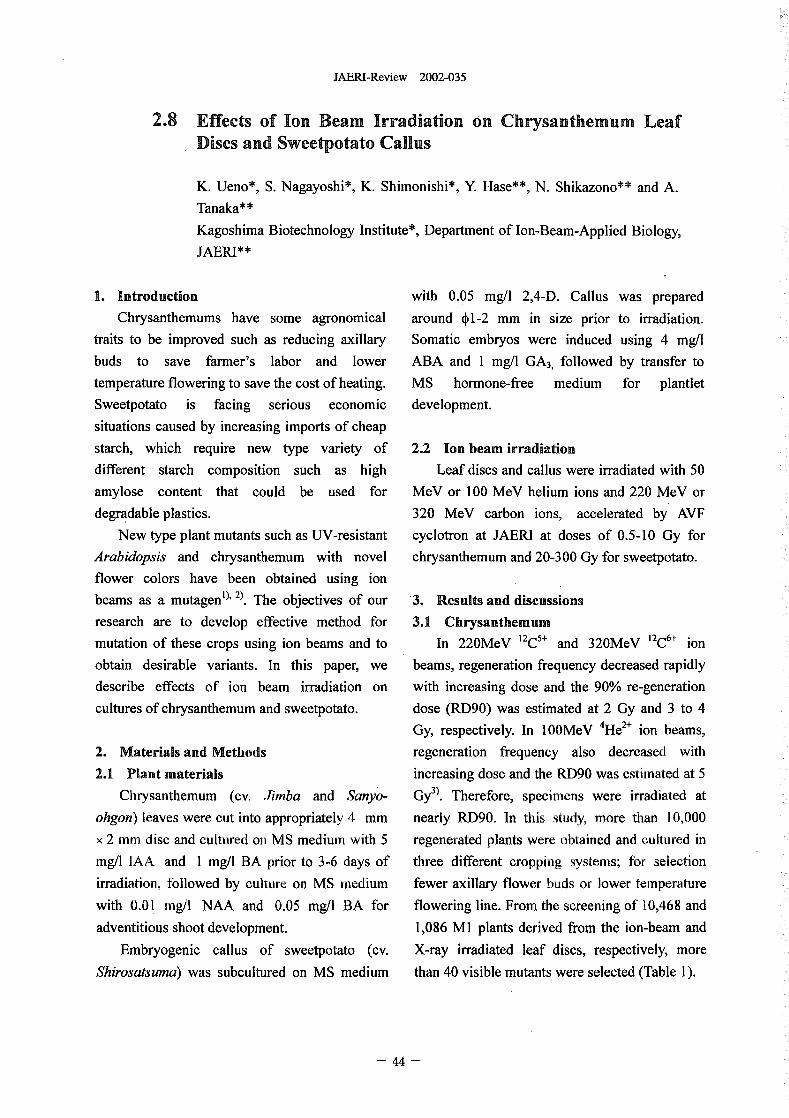
JAERI-Review 2002-035
2.8 Effects of Ion Beam Irradiation n Chrysanthemum LeafDiscs and Sweetpotato Callus
K. Ueno*, S. Nagayoshi*, K. Shimonishi*, Y. Hase", N. Shikazono** and A.
Tanaka"
Kagoshima Biotechnology Institute*, Department of on-Beam-Applied Biology,
JAERI**
1. Introduction with 0.05 mg/I 2,4-D. Callus was prepared
Chrysanthemums have some aronomical around 1-2 mm in size prior to irradiation.
traits to be improved such as reducing axillary Somatic embryos were induced using 4 mg/l
buds to save farmer's labor and lower ABA and I rng/I GA3, followed by transfer to
temperature flowering to save the cost of heating. MS hormone-free medium for plantlet
Sweetpotato is facing serious economic development.
situations caused by increasing imports of cheap
starch, which require new type variety of 2.2 Ion beam irradiation
different starch composition such as high Leaf discs and callus were irradiated with 0
amylose content that could be used for MeV or 100 MeV helium ions and 220 MeV or
degradable plastics. 320 MeV carbon ions, accelerated by AVF
New type plant mutants such as UV-resistant cyclotron at JAERI at doses of 0.5-10 Gy for
Arabidopsis and chrysanthemum with novel chrysanthemum and 20-300 Gy for sweetpotato.
flower colors have been obtained using ion
beams as a mutagen 1) 2 . The objectives of our 3. Results and discussions
research are to develop effective method for 3.1 Chrysanthemum
mutation of these crops using ion beams and to In 22OMeV 12CI+ and 32OMeV 12C6+ ion
obtain desirable variants. In tis paper, we beams, regeneration frequency decreased rapidly
describe effects of ion beam irradiation on with increasing dose and the 90% re-generation
cultures of chrysanthemum and sweetpotato. dose (RD90) was estimated at 2 Gy and 3 to 4
Gy, respectively. In l0OMeV 4 He 2+ ion beams,
2. Materials and Methods regeneration frequency also decreased with
2.1 Plant materials increasing dose and the D90 was estimated at 3Chrysanthemum (ev. Jimba and Sanyo- Gy ). Therefore, specimens were irradiated at
ohgon) leaves were cut into appropriately 4 mm nearly RD90. In this study, more than I 000
x 2 mm disc and cultured on MS medium with regenerated plants were obtained and ultured in
mg/l lAA and I mg/I BA prior to 36 days of three different cropping systems; for selection
irradiation, followed by culture on MS medium fewer axillary flower buds or lower temperature
with 0.01. mg/1 NAA and 0.05 mg/1 BA for flowering line. From the screening of 10,468 and
adventitious shoot development. 1,086 MI plants derived from the ion-beam and
Embryogenic callus of sweetpotato (cv. X-ray irradiated leaf discs, respectively, more
Shirosatsuma) was subcultured on MS medium than 40 visible mutants were selected (Table 1).
- 44 -
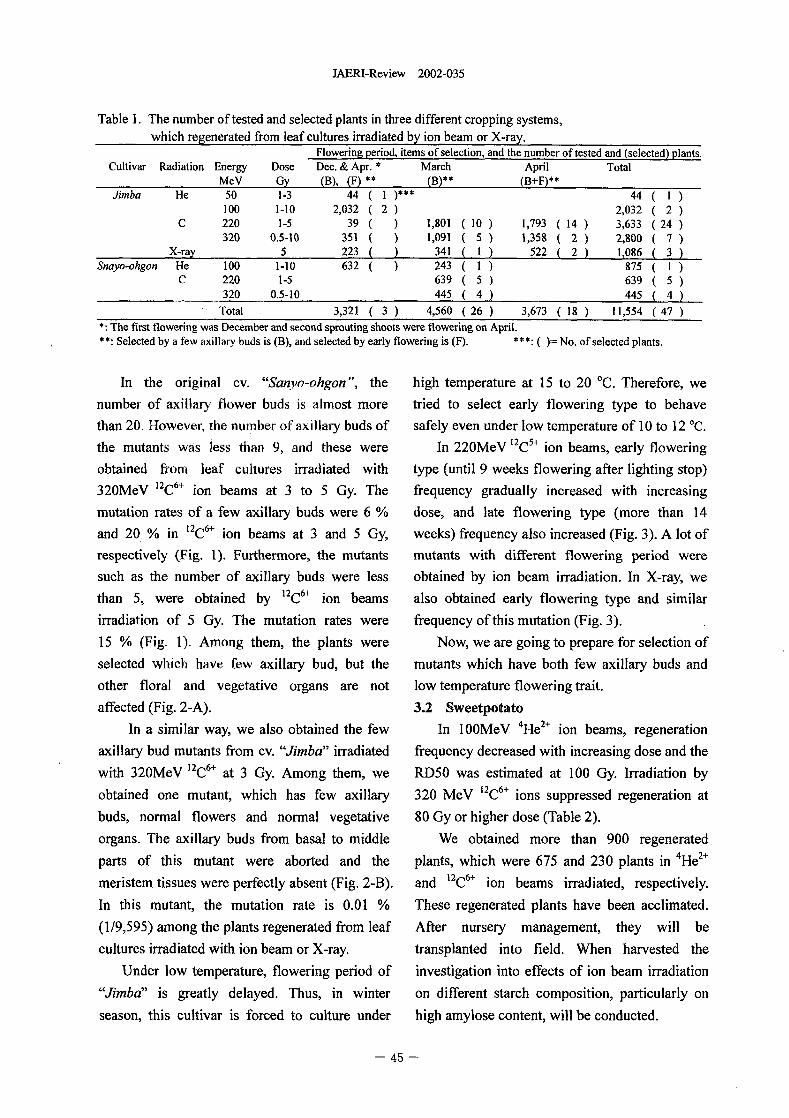
JAERI-Review 2002-035
Table 1. The number of tested and selected plants in three different cropping systems,
which regenerated from leaf cultures irradiated by ion beam or X-ray.Flowering period, items of selection, and the number of tested and (selected) plants
Cultivar Radiation Energy Dose Dec. Apr. March April TotalMeV Gy (B), (F) (B)** (B+F)**
Amba He 50 1-3 44 I 44 I100 1-10 2,032 2 2,032 2
C 220 1-5 39 1,801 ( I 0) 1,793 14 3,633 24320 0.5-10 351 1,091 ( 5 ) 1,358 2 2,800 7
X-ray 5 223 341 ( I ) 522 2 i,086 3Snayo-ohgon He 100 1-10 632 243 ( I ) 875 I
C 220 1-5 639 5 639 5320 0.5-10 445 4 445 4
Total 3,321 3 4,560 26 3,673 18 11,554 47The first flowering was December and second sprouting shoots were flowering on April.
Selected by a few axillary buds is (B) ad selected by early flowering is (F). * * *: ( = No. of selected plants.
In the original v. Sanyo-ohgon ", the high temperature at 15 to 20 C. Therefore, we
number of axillary flower buds is almost more tried to select early flowering type to behave
than 20. However, the number of axillary buds of safely even under low temperature of IO to 12 'C.
the mutants was less than 9 and these were In 22OMeV 12C51 ion beams, early flowering
obtained from leaf cultures irradiated with type (until 9 weeks flowering after lighting stop)
32OMeV 12C6+ ion beams at 3 to Gy. The frequency gradually increased with increasing
mutation rates of a few axillary buds were 6 dose, and late flowering type (more than 14
and 20 in 12C61 ion beams at 3 and Gy, weeks) frequency also increased (Fig. 3 A lot of
respectively (Fig. 1). Furthermore, the mutants mutants with different flowering period were
such as the number of axillary buds were less obtained by ion beam irradiation. In X-ray, we
than 5, were obtained by 1 2C61 ion beams also obtained early flowering type and similar
irradiation of Gy. The mutation rates were frequency of this mutation (Fig. 3.
15 (Fig. 1). Among them, the plants were Now, we are going to prepare for selection of
selected wch have few axillary bud, but the mutants which have both few axillary buds and
other floral and vegetative organs are not low temperature flowering trait.
affected (Fig. 2-A). 3.2 Sweetpotato
In a similar way, we also obtained the few In I MeV 4 He 2, ion beams, regeneration
axillary bud mutants from cv. Jimba" irradiated frequency decreased with increasing dose and the
with 32OMeV 12C6-'- at 3 Gy. Among them, we RD50 was estimated at 100 Gy. Irradiation by
obtained one mutant, which has few axillary 320 MeV 12C6, ions suppressed regeneration at
buds, normal flowers and normal vegetative 80 Gy or higher dose (Table 2.
organs. The axillary buds from basal to middle We obtained more than 900 regenerated
parts of this mutant were aborted and the plants, which were 675 and 230 plants in 4He 2+
meristern tissues were perfectly absent (Fig. 2-13). and 12C61 ion beams irradiated, respectively.
In this mutant, the mutation rate is 0.01 % These regenerated plants have been acclimated.
(1/9,595) among the plants regenerated from leaf After nursery management, they will be
cultures iradiated with ion beam or X-ray. transplanted into field. When harvested the
Under low temperature, flowering period of investigation into effects of ion beam irradiation
"Jimba" is greatly delayed. Thus, in winter on different starch composition, particularly on
season, this cultivar is forced to culture under high amylose content, will be conducted.
- 45 -
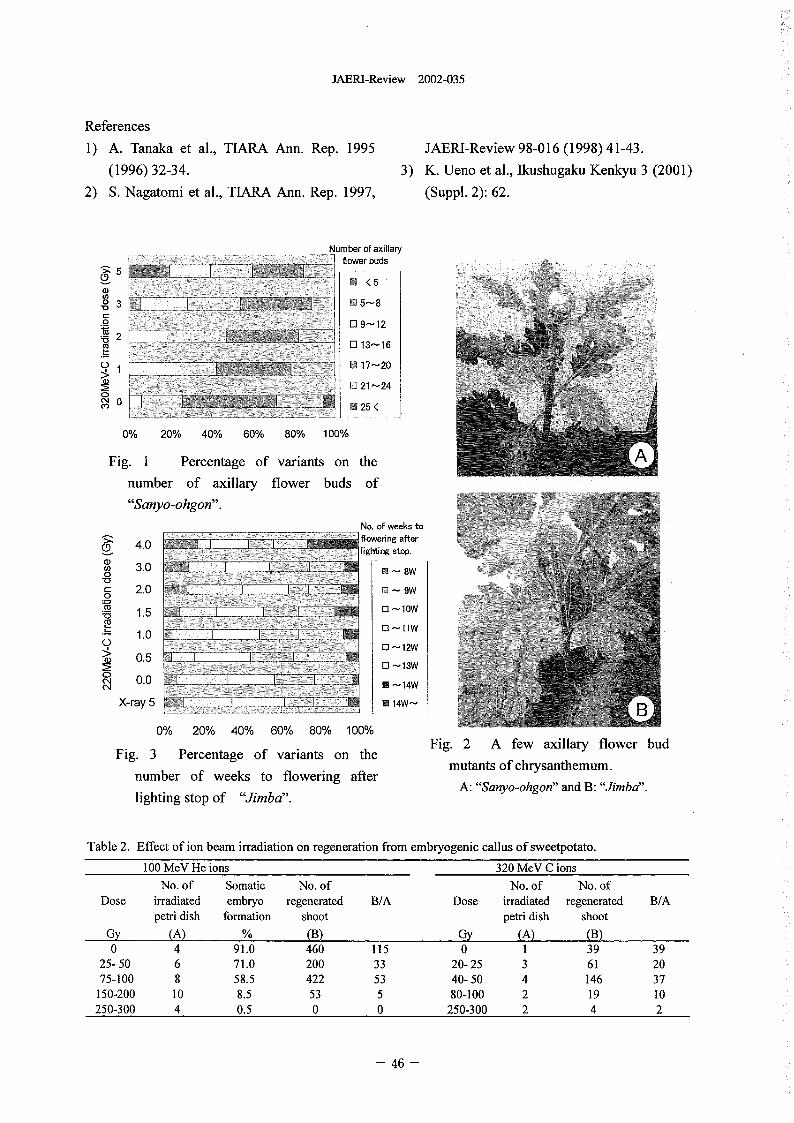
JAERI-Review 2002-035
References
1) A. Tanaka et al., TIARA Ann. Rep. 1995 JAERI-Review 98-016 1998) 41-43.
(1996) 32-34. 3) K. Ueno et al., Ikushugaku Kenkyu 3 2001)
2) S. Nagatorni et al., ARA Ann. Rep. 1997, (Suppl 2: 62.
Number of axillaryflower buds
5<5
Cn'0 3 0 5-8
0 9122
0 13-16
1 M 17-20
0 21-24CN 0M 0 25 <
0% 20% 40% 60% 80% 100%
Fig. I Percentage of variants on the
number of axillary flower buds of
"Sanyo-ohgon".
No. of weeks to>1 flowering afterCD 4.0 lighting stop.
U) 3.00 - W_0C: 2.0 El WSM 0 lowiE]i 1.5co1- 1.0 13 -11WC) El 1W
0.50 -13W
004 0.0 M -14WC14X-ray 5 M 14W-
0% 20% 40% 60% 80% 100%
Fig. 3 Percentage of variants on the Fig. 2 A few axillary flower bud
number of weeks to flowering after mutants of chrysanthemum.
lighting stop of "Jimba". A: "Sanyo-ohgon" and B: Jimba".
Table 2 Effect of ion beam irradiation on regeneration from embryogenic callus of sweetpotato.
100 MeV He ions 320 MeV C ionsNo. of Somatic No. of No. of No. of
Dose irradiated embryo regenerated B/A Dose irradiated regenerated B/Apetri dish formation shoot petri dish shoot
Gy (A) % (B) Gy (A) (B)0 4 91.0 460 115 0 1 39 39
25- 50 6 71.0 200 33 20- 25 3 61 2075-100 8 58.5 422 53 40- 50 4 146 37150-200 10 8.5 53 5 80-100 2 19 10250-300 4 0.5 0 0 250-300 2 4 2
-46 -
JAERI-Review 2002-035
2.9 RAPD Analysis of Xanta and Waxy Mutants Induced by IonBeam Irradiation to Hinoki Cypress(Chamaecypayis obtuse)
K. Ishii*, Y. Yamada*, Y. Hase", N. Shikazono", and A. Tanaka**
Department of Molecular and Cell Biology, Forestry and Forest Products Research
Institute*, Department of Radiation Research for Environment and Resources,
JAERI
1. Introduction 2. ExperimenW procedure
Hinoki cypress (Chamaecyparis obtuse Sieb. Shoot primordia of Hinoki cypress was used
et Zucc.) covers 24 of the plantation area in for the experiments. They are cultured on CD
Japan and is the most important endemic forest medium"o) supplemented with 2.25 mg/I
Conifer. It produces the highest quality wood 6-benzylaminopurine and 0.005 mg/I
and can be grown throughout Japan, excluding naphthalene acetic acid (NAA). Fresh shoot
Hokkaido and the Ryukyu Island. In forest tree primordia were subcultured on the same
species, many mutants were obtained by medium in petri dish 35 x 10 mm) which was
Gamma-rays radiation breeding. In Hinoki covered with Kapton film. They were irradiated
cypress, a juvenile leaf-form mutant was with 50 MeV 'He" or 220 MeV "C+ ion beam
reported'). from AVF cyclotron in AERL After irradiationIon beam is expected to increase the mutation
frequency and wide spectrum, since it has a high the shoot primordia were subcultured to the new
LET (linear energy transfer). The combination CD media containing 0.005 mg/l NAA for shoot
of ion beams iadiation and tissue culture was differentiation.
sometimes beneficial for high frequent mutation Plant genomic DNA was extracted from leaf
induction')"". In the previous report, we have tissue 200 mg) using a GenornicPrep Cells and
obtained te xanta and wax rich mutants by ion Tissue DNA Isolation Kit (Pharmacia Biotech)
beam iadiations). However, those mutants were according to the instructions of the anufacturer.
identified using the morphological PCR analysis was done according to following
characteristics. To clarify the genetic condition. Ten ng template DNA, and 0251 M of
background for such mutants, RAPD analysis is each primer were mixed with 2 I of 0 x stoffel
useful. There are many reports of detecting buffer containing 100 mM KC1, 100 mM
genetic aberration of plants by RAPD Tris-110, pH83) 3 rnM gC1, , 02 mM of aanalysis')7)8).
In this study, we conducted RAPD analysis of dNTP mixture equinrolar dATP, dCTP, dGTP
mutants obtained by irradiation of the shoot and dTTP) and unit of Arnpli Taq DNA
primordia of Hinoki cypress with 'He" and "C" polymerase (Parkin-ElmeT) in a total volume of
heavy ion beams. 20i 1. Fifty cycles of PCR were performed in a
programmed temperature control system
47 -
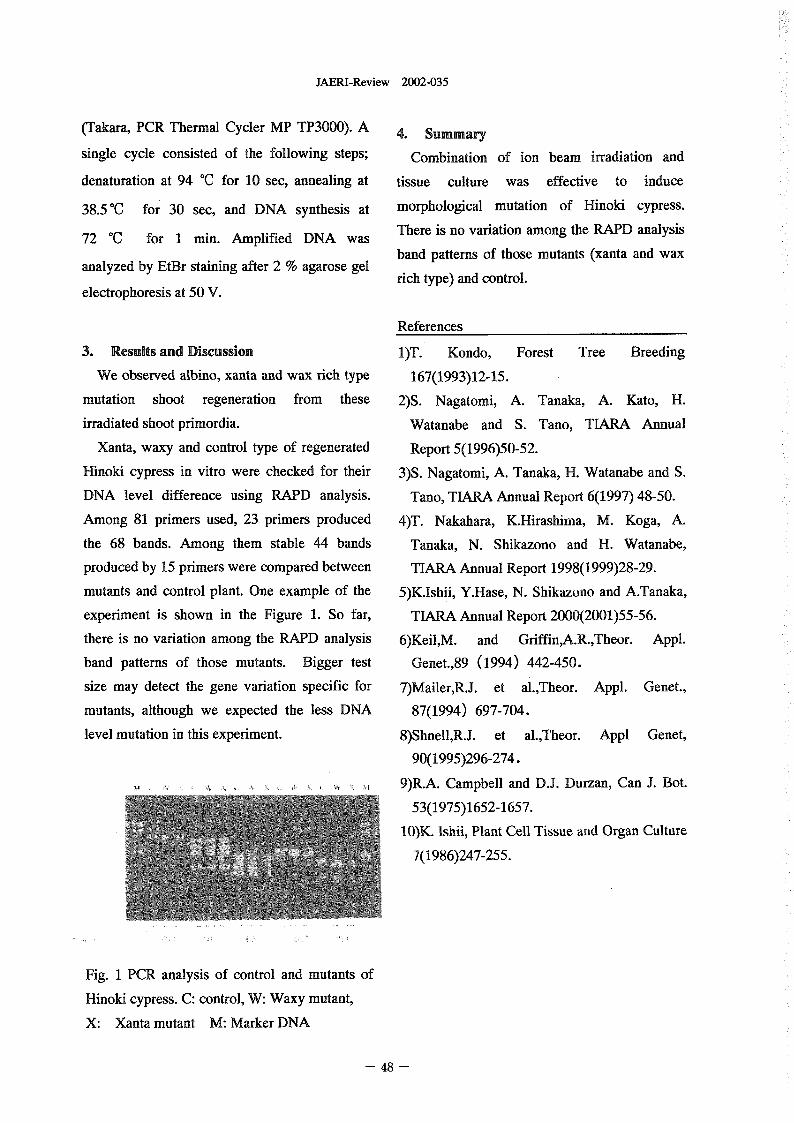
JAERI-Review 2002-035
(Takara, PCR Thermal Cycler MP TP3000) A 4. Summary
single cycle consisted of the following steps; Combination of ion beam irradiation and
denaturation at 94 for 10 sec, annealing at tissue culture was effective to induce
38.5'C for 30 sec, and DNA synthesis at morphological mutation of Hinoki cypress.
72 for min. Amplified DNA was There is no variation among the RAPD analysis
analyzed by EtBr staining after 2 % agarose gel band patterns of those mutants (xanta and wax
electrophoresis at 50 V. rich type) and control.
References
3. Results and Discussion 1)T. Kondo, Forest Tree Breeding
We observed albino, xanta and wax rich type 167(1993)12-15.
mutation shoot regeneration from these 2)S. Nagatomi, A. Tanaka, A. Kato, H.
irradiated shoot primordia. Watanabe and S. Tano TRA Annual
Xanta, waxy and control type of regenerated Report 51996)50-52.
Hinoki cypress in vitro were checked for their 3)S. Nagatomi, A. Tanaka, H. Watanabe and S.
DNA level difference using RAPD analysis. Tano TARA Annual Report 61997) 48-50.
Among 81 primers used, 23 primers produced 4)T. Nakahara, K.Hirashima, M. Koga A.
the 68 bands. Among them stable 44 bands Tanaka, N. Shikazono and H. Watanabe,
produced by 15 primers were compared between TIARA Annual Report 1998(1999)28-29.
mutants and control plant. One example of the 5)K.Ishii, Y.Hase, N. Shikazono and A.Tanaka,
experiment is shown in the Figure 1. So far, TIARA Annual Report 2000(2001)55-56.
there is no variation among the RAPD analysis 6)KeilM. and GriffinA.R.,Theor. Appl.
band patterns of those mutants. Bigger test Genet.,89 1994) 442-450.
size may detect the gene variation specific for 7)MailerR.J. et al.,Theor. Appl. Genet.,
mutants, although we expected the less DNA 87(1994) 697-704.
level mutation in this experiment. 8)ShnellR.J. et al.,Theor. Appl Genet,
90(1995)296-274.
9)R.A. Campbell and D.J. Durzan, Can J. Bot.
53(1975)1652-1657.
10)K. Ishii, Plant Cell Tissue ad Organ Culture
7(1986)247-255.
Fig. PCR analysis of control and mutants of
Hinoki cypress. C: control, W: Waxy mutant,
X: Xanta mutant M: Marker DNA
- 48 -
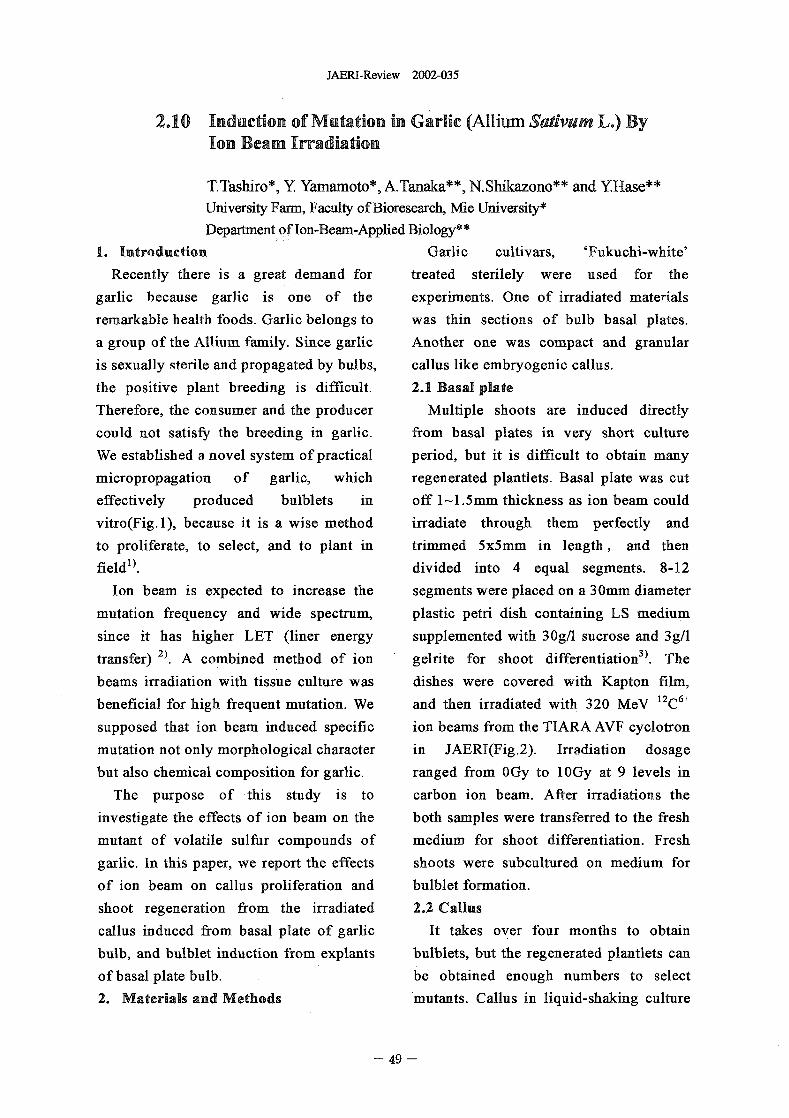
JAERI-Review 2002-035
2.10 Induction of Mutation in Garlic (Allium Sadvum L.) ByIon Beam Irradiation
T.Tashiro*, Y amamoto*, A.Tanaka**, N.Shikazono** and YHase**University Farm, Faculty of Bioresearch, Mie University*Department of on-Beam-Applied Biology"
1. Introduction Garlic cultivars, 'Fukuchi-white'
Recently there is a great demand for treated sterilely were used for te
garlic because garlic is one of the experiments. One of irradiated materials
remarkable health foods. Garlic belongs to was thin sections of bulb basal plates.
a group of the Allium. family. Since garlic Another one was compact and granular
is sexually sterile and propagated by bulbs, callus like embryogenic callus.
the positive plant breeding is difficult. 2.1 Basal plate
Therefore, the consumer and the producer Multiple shoots are induced directly
could not satisfy the breeding in garlic. from basal plates in very short culture
We established a novel system of practical period, but it is difficult to obtain many
micropropagation of garlic, which regenerated plantlets. Basal plate was cut
effectively produced bulblets in off 1-1.5mm thickness as ion beam could
vitro(Fig.1), because it is a wise method irradiate through them perfectly and
to proliferate, to select, and to plant in trimmed 5x5mm in length, and then
field'). divided into 4 equal segments. 812
Ion beam is expected to increase the segments were placed on a 0mm diameter
mutation frequency and wide spectrum, plastic petri dish containing LS medium
since it has higher LET (liner energy supplemented with 30g/l sucrose and 3g/I
transfer) 2 A combined method of ion gelrite for shoot differentiation ). The
beams irradiation with tiss ue culture was dishes were covered with Kapton film,
beneficial for high frequent mutation. We and then irradiated with 320 MeV 12C6+
supposed that ion beam induced specific ion beams from the TIARA AVF cyclotron
mutation not only morphological character in JAERI(Fig.2). Irradiation dosage
but also chemical composition for garlic. ranged from Gy to IOGy at 9 levels in
The purpose of this study is to carbon ion beam. After irradiations the
investigate the effects of ion beam on the both samples were transferred to the fresh
mutant of volatile sulfur compounds of medium for shoot differentiation. Fresh
garlic. In this paper, we report the effects shoots were subcultured on medium for
of ion beam on callus proliferation and bulblet formation.
shoot regeneration from the iadiated 2.2 Callus
callus induced from basal plate of garlic It takes over four months to obtain
bulb, and bulblet induction from explants bulblets, but the regenerated plantlets can
of basal plate bulb. be obtained enough numbers to select
2. Materials and Methods mutants. Callus in liquid-shaking culture
49 -
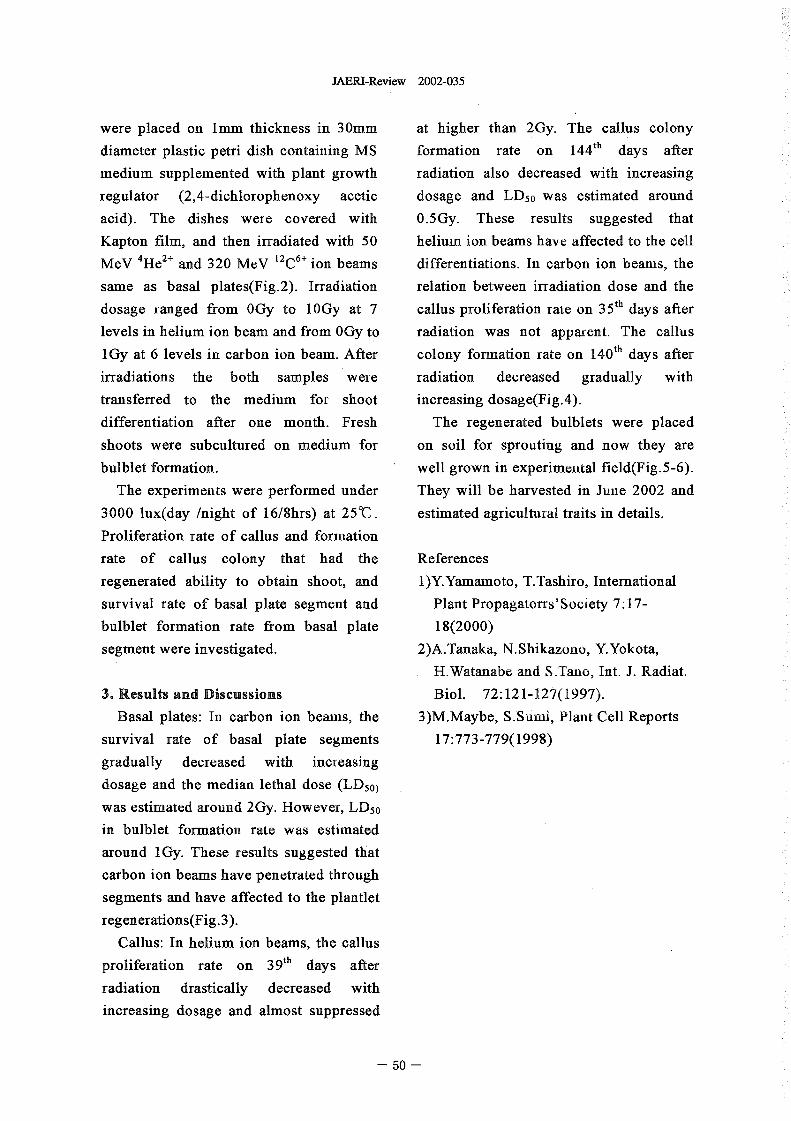
JAERI-Review 2002-035
were placed on Imm thickness in 30rum at higher than 2Gy. The callus colony
diameter plastic petri dish containing MS formation rate on 144 th days after
medium supplemented with plant growth radiation also decreased with increasing
regulator (2,4-dichlorophenoxy acetic dosage and LD50 was estimated around
acid). The dishes were covered with 0.5Gy. These results suggested that
Kapton film, and then irradiated with 50 helium ion beams have affected to the cell
MeV 4 He 2+ and 320 MeV 12C6+ ion beams differentiations. In carbon ion beams, the
same as basal plates(Fig.2). Irradiation relation between irradiation dose and the
dosage ranged from Gy to IOGy at 7 callus proliferation rate on 35 th days after
levels in helium ion beam and from Gy to radiation was not apparent. The callusOthIGy at 6 levels in carbon ion beam. After colony formation irate on 14 days after
irradiations the both samples were radiation decreased gradually with
transferred to the medium for shoot increasing dosage(Fig.4).
differentiation after one month. Fresh The regenerated bulblets were placed
shoots were subcultured on medium for on soil for sprouting and now they are
bulblet formation. well grown in experimental field(Fig.5-6).
The experiments were performed under They will be harvested in June 2002 and
3000 lux(day /night of 16/8hrs) at 259C. estimated agricultural traits in details.
Proliferation rate of callus and formation
rate of callus colony that had the References
regenerated ability to obtain shoot, and 1)Y.Yamamoto, T.Tashiro, International
survival rate of basal plate segment and Plant Propagatorrs'Society 7:17-
bulblet formation rate from basal plate 18(2000)
segment were investigated. 2)A.Tanaka, N.Shikazono, Y.Yokota,
H.Watanabe and S.Tano, Int. J. Radiat.
3. Results and Discussions Biol. 72:121-127(1997).
Basal plates: In carbon ion beams, the 3)M.Maybe, S.Sumi, Plant Cell Reports
survival rate of basal plate segments 17:773-779(1998)
gradually decreased with increasing
dosage and the median lethal dose (LD50)
was estimated around 2Gy. However, LD50
in bulblet formation rate was estimated
around ly. These results suggested that
carbon ion beams have penetrated through
segments and have affected to the plantlet
regenerations(Fig.3).
Callus: In helium ion beams, the callus
proliferation rate on 39th days after
radiation drastically decreased with
increasing dosage and almost suppressed
- 5 -
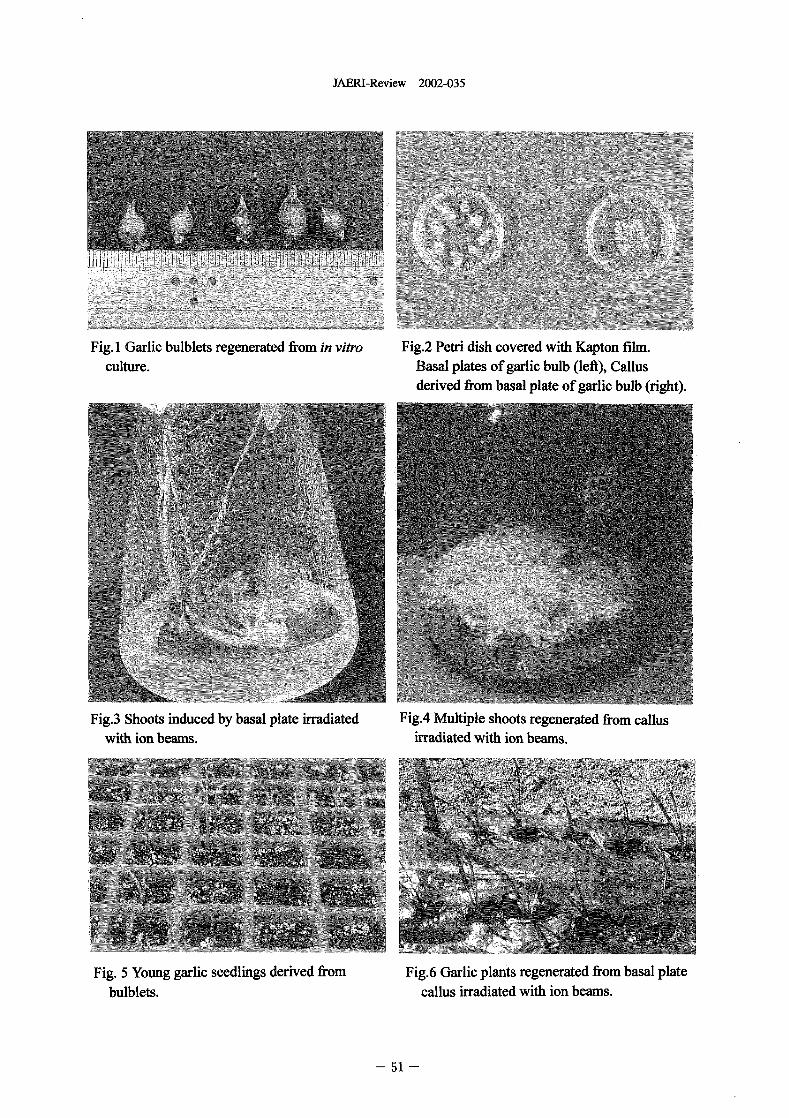
JAERI-Review 2002-035
Fig. I Garlic bulblets regenerated from in vitro Fig.2 Petri dish covered with Kapton film.culture. Basal plates of garlic bulb (left), Callus
derived from basal plate of garlic bulb (right).
Fig.3 Shoots induced by basal plate irradiated Fig-4 Multiple shoots regenerated from calluswith ion beams. irradiated with ion beams.
Fig. Young garlic seedlings derived from Fig.6 Garlic plants regenerated from basal platebulblets. callus irradiated with ion beams.
- 5 -
JAERI-Review 2002-035
2.11 Characters of Tomato cv. First Mutant with Short Internode
Induced by Irradiation of 2CI+ Ion Beam to the Seeds
M. Masuda*, K. Murakami*, S. G. Agong*, T. Yuasa*, A. Tanaka** andY. Hase**
Department of Applied Plant Science, Faculty of Agriculture, Okayama University*
Department of lon-Beam-Applied Biology, JAERI**
1. Introduction 2.2 Morphological character of mutant
With the increasing demand and the changing Seeds of mutant and original cv. First were
human taste preferences, there is a continuous sown in vermiculite on 27 March. Shoot length
drive to generate new tomato cultivars for the and number of leaves unfolded were measured
modern production and consumer purposes. every weeks. Morphological characters I were
Ion beam, a recently innovated technique has recorded I I weeks after sowing.
been shown to produce a new type of mutant
in Arabidopsis thaliana " . Since biological 2.2 Effect of GA,3 treatment on shoot growth
effects of ion beam is different from that of Mutant and original v. First plants at 3rd
gamma-rays, we expect that ion beam leaf-stage were used. GA3 at the concentration
irradiation will be ew technique for obtaining of 100 mg-L-' was applied with a sprayer.
novel utants. Masuda et al. ( 2001 Second application were made 10 days after
reported that Gy of "C' and 15OGy of 'He'� Ist application. Shoot length was measured
were the optimum dosages for irradiating every days.
tomato seeds with the possibility of generating
tomato nutants without causing excessive 2.3 Shoot growth of F, plant
injury to the mbryo') Short intemode is F, plants were obtained from crossing
useful character in tomato, especially in mutant ( M2) x original cv. First). Seeds of
protected cultivation. In this paper, we report mutant, F, and original cv. First were sown in
that characters of tomato cv. First mutant with vermiculite on 17 April. Shoot length was
short internode induced by irradiation of 2c5+ measured every days.
ion beam to the seeds.
3. Results and discussion
2. Experimental procedure
3.1 Morphological character of mutant
2.1 Plant material Mutant plant grew vigorously, but its shoot
A mutant with short internode was induced length was about 50 % of original cv. irst
from v. First tomato irradiated with 50 Gy of ( Table I Leaf number and size of mtant
"C" ion beam ( 220 MeV ) to their seeds" plants ( M3) were aost similar- to tat of
Material seeds ( M3) were derived from original v. First. Internode length ( stem
self-pollination of the M2 plant. length leaf number) was also about 50 %
of original v. Firsf.
- 52 -
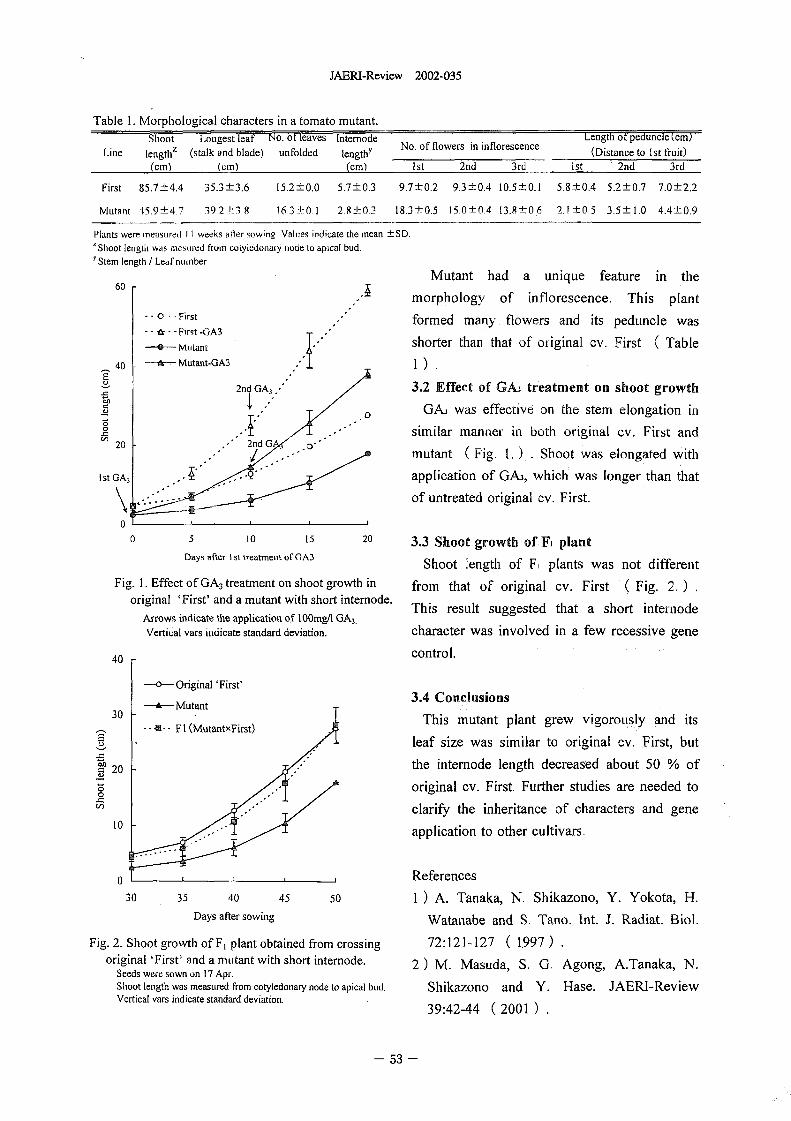
JAERI-Review 2002-035
Table 1. Morphological characters in a tomato mutant.
Shoot Longest leaf No- ot leaves Internode No. of flowers in inflorescence Length ot peiInn-HeTcinT-Line lengtliz (stalk and blade) unfolded lengthy (Distance to'Ist fruit)
(cm) (urn) (cm) Ist 2nd 3rd Ist . 2nd 3rd
First 85.7±4.4 35.3 ±3.6 15.2 ±0.0 5.7 ± 03 9.7±0.2 9.3 ±0.4 10.5±0.1 5.8±0.4 52±0.7 7.0±2.2
Mutant 45.9±47 39 2 ±3 16 3 ± 1 2.8 ± 3 18.3±0.5 15�0±04 13.8±0.6 2,ftO,5 35±1.0 4.4±0.9
Plants were measured I I weeks allersowing Values indicate the mean ±SD.'Shoot length was mesaired furn cotyledonary ode to apical bud.Y Stem length Leaf number
60 Mutant had a unique feature in themorphology of inflorescence. Tis plant
0 First formed many flowers and its peduncle wasFir9t -CjA3MUtant shorter than that of original cv. First ( Table
40 ---A-- Mutant-GA3E
2nd GA3 3.2 Effect of GA., treatment on shoot growth
GA3 was effective on the stem elongation in�50 similar manner i both original v. First andCn
20 2ndmutant ( H& 1. Shoot was elongated with
I St GA, application of GA3, Which Was longer than that
of untreated original cv. First.
00 5 10 15 20 3.3 Shoot growth of F, plant
Day-, after I t treatment of GA3 Shoot length of F plants was not differentFig. 1 Effect of GA3 treatment on shoot growth in from that of original cv. First ( Fig. 2.
C, Z�original 'First' and a mutant with short internode.C, This result suggested that a short internode
Arrows indicate the application of 100mg/l GA3.Vertical vars indicate standard deviation. character was involved in a few recessive gene
control.40 -
- Original 'First'
A Mutant 3.4 Conclusions30 - This Mtant plant grew vigorously and its
M F I MutantxFirst)E leaf size was similar to original cv. First, but
the internode length decreased about 5 of20luoriginal cv. First. Further studies are needed to
clarify the inheritance of characters and geneto application to other cultivars.
0 References30 35 40 45 50 1 ) A. Tanaka, N. Shikazono, Y. Yokota, H.
Days after sowing Watanabe and S. Tano. Int. J. Radiat. Biol.
Fig 2 Shoot growth of F, plant obtained from crossing 72:121-127 ( 1997ori-inal 'First' and a motant with short internode. 2 ) M. Masuda, S. G. Agong, A.Tanaka N.
Seeds were sown un 17 Apr.Shoot length was measured from cotyledonary node to apical bd. Shikazono and Y. Hase. JAERI-ReviewVertical vats indicate standard deviation. 39:42-44 ( 2001
53 -
JAERI-Review 2002-035
2.12 Mutation Breeding of Rice, Eggplant and Gloriosa by Ion Beam
Irradiation
M.Mizobuchi*,M.Okada*,M.Matsumoto*,A.Iwsald*,A-Tariaka**, Y.Hase**
Kochi Prefectural Agriculture Research Center *, Department of Radiation Research forEnvironment and Resources, JAERI* *
1. Introduction irradiated with Gy of 10OMeV He, -In Kochi Prefecture, we are carrying out 4OGy of 22OMev C or 5Gy of 32OMev C to
mutation breeding of rice, eggplant and investigate the germination rates. For the
gloriosa. While we have used ^( -rays and Si population of 'Misato Pink' raisedMNU as mutagens, we attempt to use ion from the seeds irradiated with 22OMeV Cbeams in this study, Because the linear ion beam, their morphologicalenergy transfer and relative biological characterizations were recorded.effectiveness of ion beams are extremely
higher than those of 'r -rays. Thus, seeds of 3. Results and Discussionsrice, eggplant, and goriosa were irradiated In rice, the storage periods did not
with ion beams and several biological influence the survival rates of irradiated Mleffects were examined. Moreover, we seeds. The less water content the seeds had,selected individuals that have excellent the lower survival rate the irradiated
mutant characters ' We used helium(He) and seeds showed (Fig.1). In 'Tosapika, thecarbon(C) ions that were accelerated by plants that had low amylose content seeds
using the AVF cyclotron in Takasaki, could not be obtained by the irradiations ofJAERI. 5OMeV He and 10OMeV He. By the
irradiation of 22OMeV C, the plants that had
2. Materials and Methods low amylose content seeds with suitableIn rice, dry seeds of varieties 'Tosapika growth traits and brown rice qualities wereand ' Koshihikari were irradiated to obtained. The adequate irradiation dosages
investigate their germination rates and were thought to be about Gy because of
survival rates. The seeds of 'Tosapika' with the large standard deviation of amylosevarious storage periods and water contents content (Table 1). In 'Koshihikari% thoughwere used to investigate the effects of ion the plants that had low amylose contentbeams to those seeds. Then we grew M2 seeds were not obtained by the irradiationsgeneration plants in the field and of 22OMeV C, these were obtained by thedetermined the adequate irradiation dosages irradiations of MeV He and 10OMeV He.on the basis of the amylose contents variance The adequate irradiation dosages wereof their seeds. thought to be about 10OGy of Me He
In eggplant, we irradiated 22OMeV C and about 175 Gy of 10OMeV He.ions to seeds of variety 'Waseshinnkuro' In eggplant, the plantlets were
and grew them. Then we cultured their regenerated from inside of anthers viaanthers to investigate the correlation of the embryoids. The higher dosage the
irradiation with regeneration rates of irradiation had, the lower the regenerationplantlets from anthers. rate showed, More than 506y tere were
In gloriosa, seeds of 10 cultivars were few regenerated plants obtained. There was
-54 -
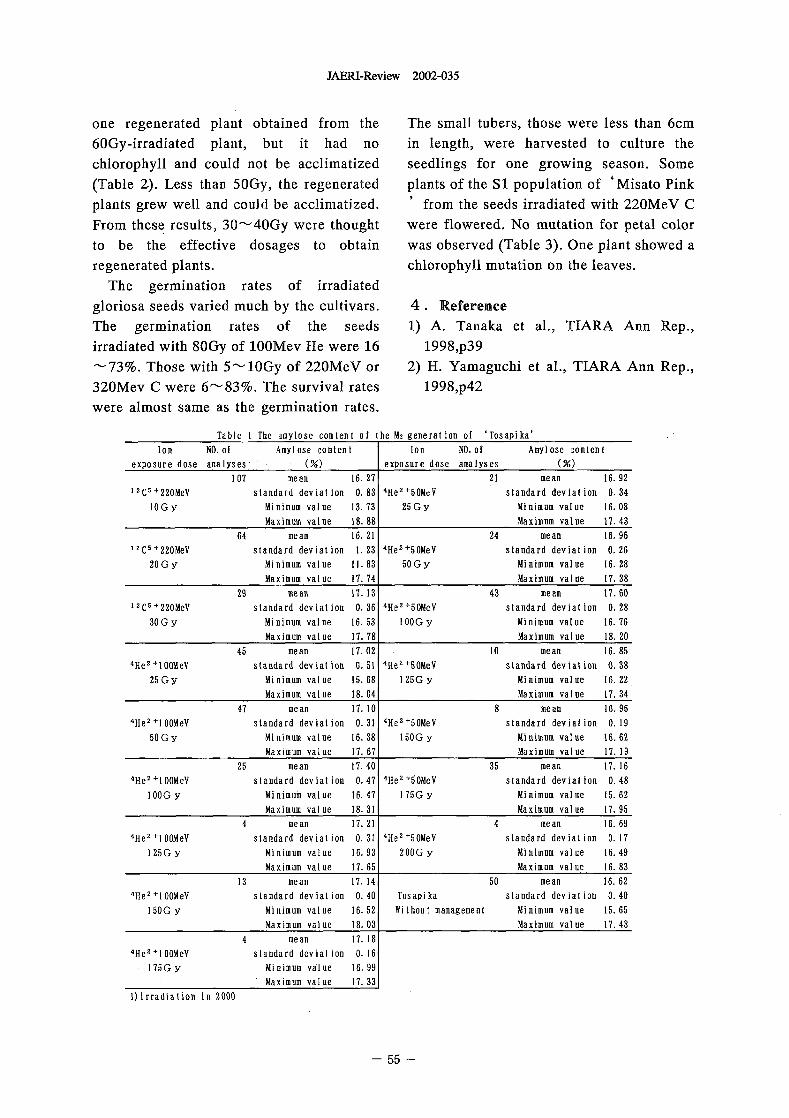
JAERI-Review 2002-035
one regenerated plant obtained from the The small tubers, those were less than 6cm6OGy-irradiated plant, but it had no in length, were harvested to culture thechlorophyll ad could not be acclimatized seedlings for one growing season. Some
(Table ). Less than 5Gy, the regenerated plants of the S1 population of 'Misato Pinkplants grew well and could be acclimatized. I from the seeds irradiated with 22OMeV C
From these results, 30-4OGy were thought were fowered. No mutation for petal color
to be the effective dosages to obtain was observed (Table 3. One plant showed aregenerated plants. chlorophyll mutation on the leaves.
The germination rates of irradiatedgloriosa seeds varied much by the cultivars. 4 ReferenceThe germination rates of the seeds 1) A. Tanaka et al., TIARA Ann Rep.,
irradiated with Gy of 10OMev He were 16 1998,p39-73%. Those with 510Gy of 22OMeV or 2) H. Yamaguchi et al., TIARA Ann Rep.,32OMev C were 683%. The survival rates 1998,p42were almost same as the germination rates.
Tab I e I The amy Io se con tent of the Mz gene ration of ' Tos ap i ka'Ion NO. of Amylose content Ion NO. of Amylose content
exposure dose aalyses W exposure dose analyses M1 07 me a 16. 27 2 mean 16. 9 2
C 2 MeV standard deviation 0. 83 "He '5OMeV standard deviation 0. 34IOGy Minimum value 13. 73 25Gy Minimum value 16. 08
Maximum value I 8. 88 Maximum alue 17. 4364 mean 16. 2 24 mean 16, 96
C 22OMeV standard deviation I 23 'He '5 Me V standard deviation 0. 262OGy Minimum value 11. 83 5OGy Minimum value 16. 28
Maximum value 17. 74 Maximum value 17. 3829 mean 17. 13 43 mean 17. 60
2 C I + 22OMeV standard deviation 0. 36 4Hel '5OMeV standard deviation 0. 2830 G y Minimum value 16. 53 1 00 G y Minimum value 16. 76
Maximum value 17. 78 Maximum value 18. 2045 mean 17. 02 1 0 mean 16. 85
4Hel 'I 00MeV standard deviation 0. 51 4He2+50MeV standard deviation 0. 3825Gy Minimum value 15. 68 125G y Minimum value 16. 22
Maximum value 18. 04 Maximum value 17. 3447 mean 17. 10 8 me a 16, 95
411el 'I OOMeV standard deviation 0. 31 4He1150MeV standard deviation 0. 1950GY Minimunt value 16. 38 15OG y Minimum value 16. 62
Maximum value 17. 67 Maximum value 17. 1925 mean 17.40 35 mean 17.16
4Hel 11 0MeV standard deviation 0. 47 'He' IOMeV standard deviation 0. 481 OOG y Minimum value 16. 47 175G y Minimum value 15. 62
Maximum value 18. 31 Maximum value 17. 954 me an 17. 2 4 me a 16. 69
4He ' OOMeV standard deviat ion 0. 31 4He1'50MeV standard deviat ion 0. 17125G y Minimum value 16. 93 20OG y Minimum value 16. 49
Maximum value 17. 65 Maximum value 16. 8313 mean 17. 14 50 mean 16. 62
411el +1 OOMeV standard deviation 0. 40 Tosapika standard deviation 0. 4015OG y Minimum value 16. 52 Without management Minimum value 15. 65
Maximum value 18. 03 Maximum value 17. 434 mean 17.18
4He2 'I OOMeV standard deviation 0. 16175G y Minimum value 16. 99
Maximum value 17. 330irradiation in 2000
- 5
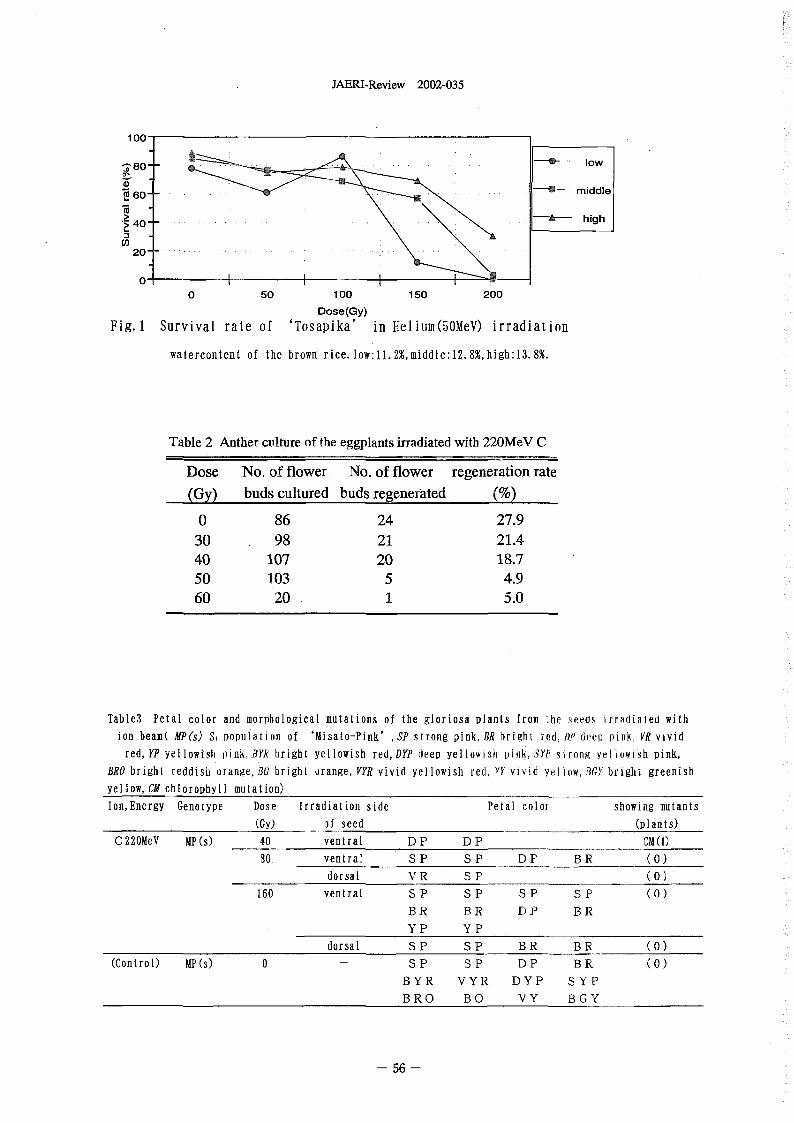
JAERI-Review 2002-035
100-
low0�0 80
60- middle
high40-
U)2 0 . . ...... . .. . ... ..
O-f0 50 100 150 200
Dose(Gy)Fig.1 Survival rate of 'Tosapika' in Helium(50MM irradiation
watercontent of the brown rice.low:11.2%,middle:12.8%,high:13.8%.
Table 2 Anther culture of the eggplants iradiated with 22OMeV C
Dose No. of flower No. of flower regeneration rate(Gy) buds cultured buds regenerated (%)
0 86 24 27.930 98 21 21.440 107 20 18.750 103 5 4.960 20 1 5.0
TWO Petal color and morphological mutations of the gloriosa plants from the seeds irradiated with
ion beam( P(s) S� population of 'Misato-Pink' SP strong pink, BR brigh r, DP deep pink, V vivid
red, YP ellowish pink, BYR bright yel lowish red, DYP deep yellowish pink, 3rP strong e lowish pink,
BRO bright reddish orange, BO bright orange, VYR vivid yellowish red, VY vivid yet low, Mr bright greenish
yellowCH chlorophyll mutation)
IonEnergy Genotype Dose Irradiation side Petal color showing mutants
(GY) of seed (plants)
C 22OMeV MP(s) 40 ventral D P D P cm )
80 ventral S P S F D P B R 0
dorsal V R S P 0
160 ventral S P S P S P S P 0
B R B R P B R
Y P Y P
dorsal S P S P B R B R 0
(Control) MP(s) 0 S P S P D P 13 R 0
BYR VYR DYP S
BRO B 0 Y BGY
56
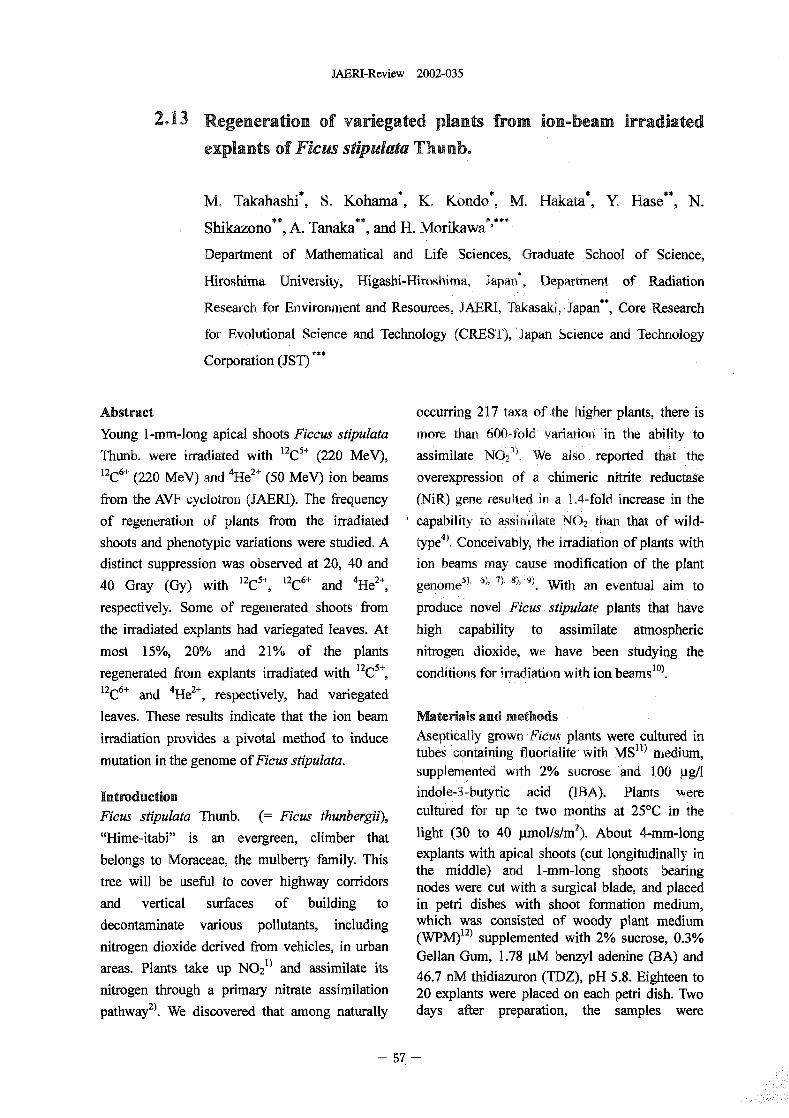
JAM-Review 2002-035
2.13 Regeneration of variegated plants from ion-beam irradiated
explants of Ficus stipulata Thunb.
M. Takahashi% S, Koharna K Kondo*, M. Hakata*, Y lase** N.
Shikazono", A. Tanaka", and H. Morikawa""
Department of Mathematical and Life Sciences, Graduate School of Science,
Hiroshima University, Higashi-Hiroshima, Japan% Department of Radiation
Research for Environment and Resources, JAERI, Takasaki, Japan", Core Research
for volutional Science and Technology (CREST), Japan Science and Technology
Corporation (JST)
Abstract occurring 217 taxa of the higher plants, there is
Young 1-mm-long apical shoots Ficcus stipulate more than 600-fold ariation in the ability to
Thunb. were irradiated with 12CI+ (220 MeV), assimilate NO 23). We also reported that the
I2C6+ (220 MeV) and 4He 21- (50 MeV) ion beams overexpression of a chimeric nitrite reductase
from the AVF cyclotrOD (JAERI). The frequency (NiR) gene resulted in a I 4-fold increase in the
of regeneration of plants from the irradiated , capability to assimilate N02 than that of wild-4)shoots and phenotypic variations were studied. A type Conceivably, the iradiation of plants with
distinct suppression was observed at 20, 40 and ion beams may cause modification of the plant
40 Gray (Gy) with 12CI-1, 2CI+ and 4 He2+, genorne 5) 6 7 9 'With an eventual aim to
respectively. Some of regenerated shoots from produce novel Fcus stipulate plants that have
the irradiated explants had variegated leaves. At high capability to assimilate atmospheric
most 15%, 20% and 21% of the plants nitrogen dioxide, we have been studying the
regenerated from explants irradiated with C'+, conditions for irradiation with ion bearrislo).
12CI+ and 4He2% respectively, had variegated
leaves. These results indicate that the ion beam Materials and methods
irradiation provides a pivotal method to induce Aseptically grown icus plants were cultured in
mutation in the genome of Ficus stipulate. tubes containing fluorialite with MS") medium,supplemented with 20/6 sucrose ad 100 gg/l
Introduction indole-3-butyric acid (113A). Plants were
Ficus stipulate Thunb. (= Ficus thunbergii), cultured for up to two months at 25'C in the
light 30 to 40 gmol/s/m 2). About 4-mm-long"Hime-itabi" is an evergreen, climber that
belongs to Moraceae, the mulberry family. This explants with apical shoots (cut longitudinally in
tree will be useful to cover highway corridors the middle) and 1-mm-long shoots bearingnodes were cut with a surgical blade, and placed
and vertical surfaces of building to in petri dishes with shoot formation medium,
decontaminate various pollutants, including which was consisted of woody plant medium(VVTM) 12) supplemented with 2 sucrose, 03%
nitrogen dioxide derived from vehicles, in urban Gellan Gum, 178 gM benzyl adenine (BA) and
areas. Plants take up NO21) and assimilate its 46.7 nM thidiazuron (TDZ), pH 5.8. Eighteen to
nitrogen through a primary nitrate assimilation 20 explants were placed on each petri dish. Two2)pathway . We discovered that among naturally days after preparation, the samples were
- 57 -
JAERI-Review 2002-035
irradiated with 12C5`_ 220 MeV), U& (320 2)T. Yoneyama, Hi Sasakawa. Plant and CellMeV) and 4He 2+ 50 MeV) ion beams, with an Physiol. 20 1979) 263-266.irradiation dose average ranging from 10 to 200Gray (Gy), by the AVF cyclotron at Japan 3) H. Morikawa, A. Higaki, M. Nohno M.Atomic Research Institute (JAERI, Takasaki). Takahashi, M. Kamada, M. Nakata G.During iadiation. the lid was removed and the Toyohara, Y. Okamura, K. Matsui, S. Kitani,petri dish was covered with a thin film to avoidthe energy loss of the ion beam 13). After K Fujita, K. Irifune, N. Goshinia. plant taxa.irradiation, the explants were transferred to fresh Plant, Cell Environ. 21 1998) 180-190.shoot formation media, and cultured for up to 4) M. Takahashi, Y. Sasaki, S, Ida, H. Morikawa.three months. When regenerated shoots became Plant Pbsiol. 126 2001) 731-741.about I cm long, they were tansferred into glasstubes, and the culture was continued. 5) A. Tanaka, S. Tano, T. Chantes, Y. Yokota, N.
Shikazono, H. Watanabe. Genes Genet. Syst.Results and Discussion 72 1997) 141 - 148.As reported previouslylo), the frequency of 6) A. Tanaka, N. Shikazono, Y. Yokota, H.regeneration of plants from iadiated explantschanged as a dosage-dependent manner in the Watanabe, S. Tano. Int. J. Rad. Biol Irange of 10 to 200 Gy. Regenerated shoots were (1997) 121 - 127.classified, depending on te length, into three 7)A. Tanaka, H. Watanabe, T. Shimizu M.groups; H ore than I cm long), M (between0.5 to I cm) and S (less than 0.5 cm). Along the Inoue, M. Kikuchi, Y Kobayashi, S. Tano.increase in te energy with 12C51, the frequency Research B. 129 1998) 42 - 48.of H- and M-type shoots was decreased and that 8) N. Shikazono Y Yokota, A. Tanaka, H.of the S-type increased. At more than 20 Gy, Watanabe, S. Tano. Genes Genet, Syst 73about one-fourth of the regenerated shoots wasthe S-type. At the same time, te frequency of (1998) 173 - 179.the appearance of plants with variegated leaves 9) Y. Hase, K. Shimono, M. Inoue, A. Tanaka, Hwas increased, at most 15% of regeneratedplants had variegated leaves (Fig. 1). Similar Watanabe. Radiat. Environ. Biophys 38results were obtained with 12C6,' and 4He 2+ a (1999) III - 15.distinct suppression was observed at 40 Gy with IO)M. Takahashi, S. Kohama, M. Hakata, Y
4 2+"C'+ and 40 Gy with He and at most 20%(12C6+) and 21% (4 He') of the regenerated plants Hase, N. Shikazono, A. Tanaka, and H.had variegated leaves. These variegated plants Morikawa. Annual Reports of TIARA, 39showed slow growth and less aerial roots. Taken (2001) 62-63.together, the present data strongly suggest that I 1) T. Musashighe, F. Skoog. Physiol, Plant, 5ion beam irradiation is a pivotal method to (1962) 473 - 489.induce mutations in the genome of usstipulate. We are currently studying the 12) G. Lloyd, B. McCown. Combinedcapability of these mutated Ficcus stipulate proceedings of the international plantplants to assimilate atmospheric nitrogen propagators society. 30 1980) 421 - 427idioxide.
13) A. Tanaka, H Watanabe, T. Simizu M.
References Inoue, M. Kikuchi, Y Kobayashi, S. Tano.
1) A.C. Hilli J. Air Pollut. Contr. Ass. 21 1971) Nucl. Instr. And Meth B 129 1997) 42-4&
341-346.
- 5 -
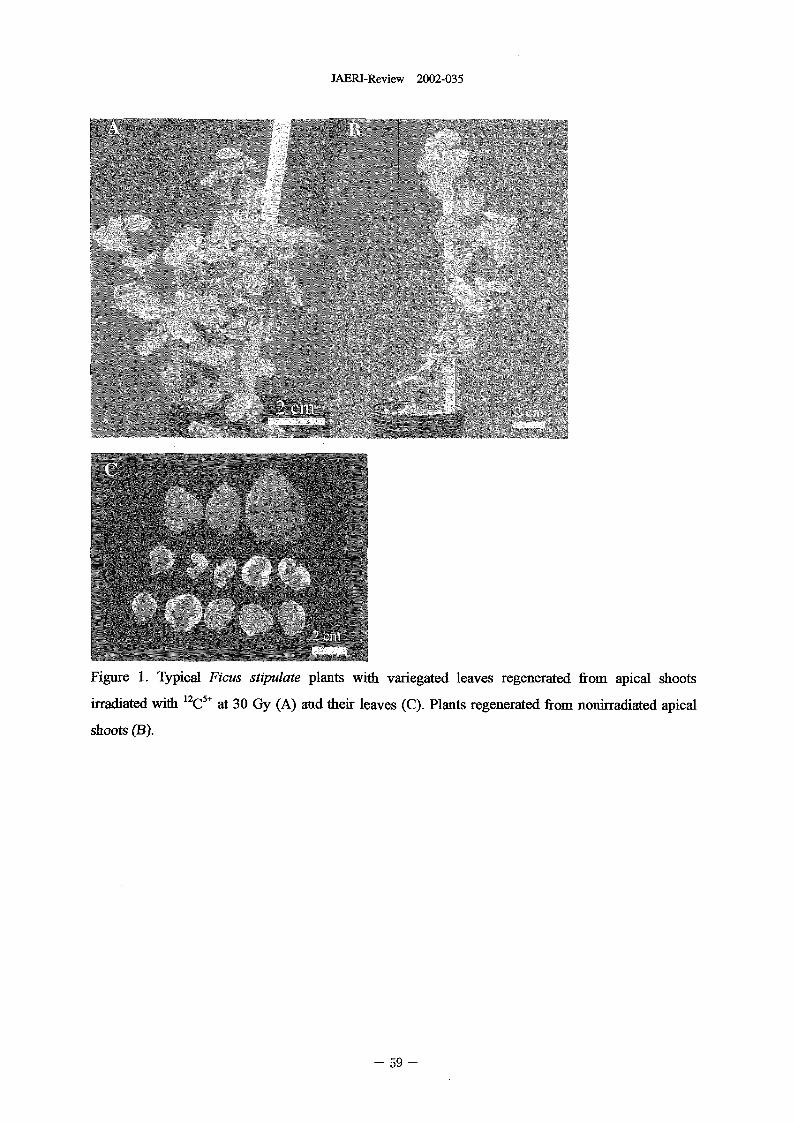
JAERI-Review 2002-035
Figure 1. Typical Ficus stipulate plants with variegated leaves regenerated from apical shoots
irradiated With 12C5+ at 30 Gy (A) and their leaves (C). Plants regenerated from nonirradiated apical
shoots (B).
- 59 -
JAERI-Review 2002-035
2.14 Effect of ion beam irradiation on the growth of netted melon(Cucumis melo L.)
M. Taneishi% H. katai*, R. Ymada% H. Otsuka*,Y. Hase**, N. Shikazono** and A. Tanaka**
ShizuokaAgriculturalExperiment Station*Department of on-Beams-Applied Biology, JAERI**
1. IntroductionNetted melon (Cucumis melo L.) is The melon seeds which were
cultivated as an important fruit in irradiated with 220 MeV carbon ion beamShizuoka prefecture. (2OGy to 7Gy) at the TIARA AVF
Because ion beams have higher LET cyclotron in JAERI was grown in a(Linear EnergyTransfer) and deposit their greenhouse, and the M2 seeds wereenergies quite locally, it is considered to obtained.be an efficient mutagenic agent applicable Germinating rate of non-irradiatedto mutation breeding of melon. seeds at 11, 13, 15, and 18'C was
The aim of this study is to develop recorded every days for 20 days. Aseed
high fruit-thickening ability lines under was considered tobe germinated when thelow-temperature by the irradiation of ion crevice was made between its radicle andbeams to melon seeds. We started the cotyledon..mutation breeding of melon in 2000,and Secondly, number of germinatedmelon seeds were irradiated with several seeds at 15'C was recorded daily for 13
doses of carbon ion beaml). days.
Ezura et al. developed highfruit-thickening ability lines by selection 3. Results and Discussionof low-temperature germinabilities in The number of fertile plants thatmelon 2). In order to breed the high could yield M2 seedswas shown in Table
fruit-thickening ability line, we also 1, and it was decreased with increase ofinvestigated the selection method of dose of ion beams. The main reason of
low-temperature germinabilities in netted reduced fertility was a problem in amelon. bisexual flower setting, and partially the
In this paper, we report the results of decrease of pollen germinabilities.
fruit set rate of MI plants and the The period of germination became
selection method of low-temperature longer as the incubation temperaturegermination in netted melon. became lower (Fig.1).
After 5 days incubation, all seeds
2. Materials and Methods were germinated at 18'C, but no seed was
Melon cultivar 'Earls Favorite Kenon germinated at lower than 15'C.
Fuyu2' was used in this study. At 15'C, the average of germination
60 -
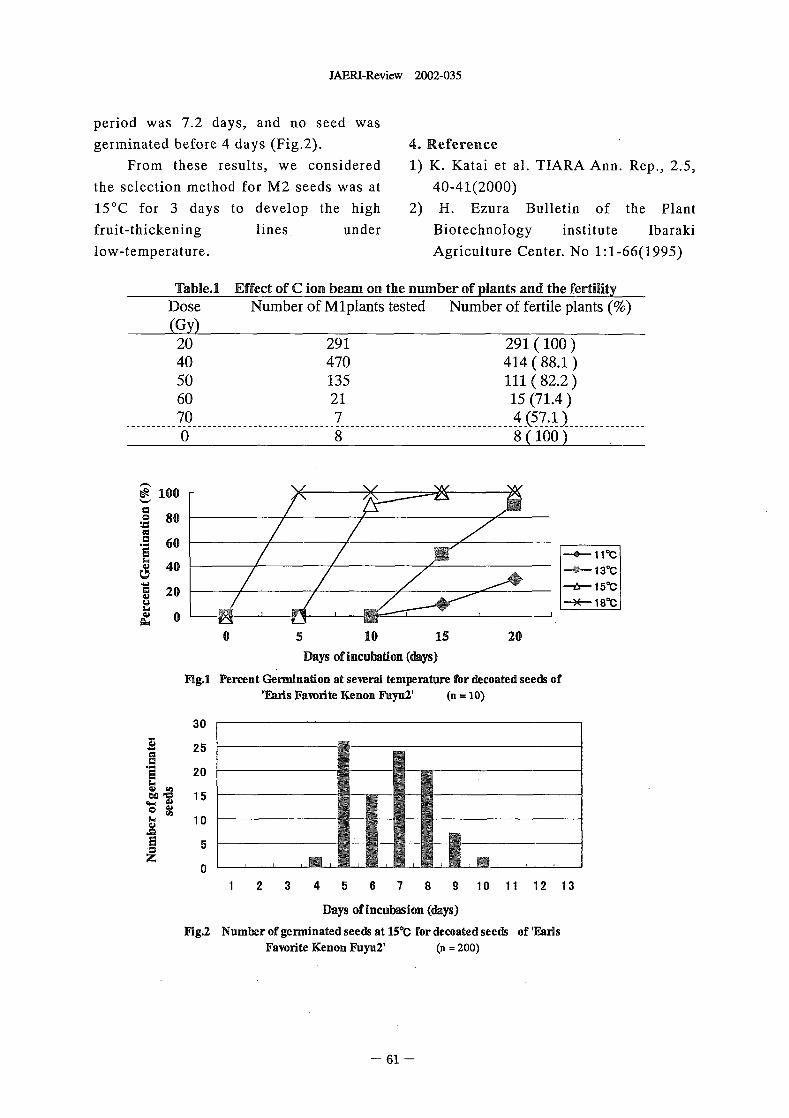
JAERI-Review 2002-035
period was 72 days, and no seed was
germinated before 4 days (Fig.2). 4. Reference
From these results, we considered 1) K. Katai et al. TIARA Ann. Rep., 25,
the selection method for M2 seeds was at 40-41(2000)
15'C for 3 days to develop the high 2) H. Ezura Bulletin of the Plant
fruit-thickening lines under Biotechnology institute Ibaraki
low-temperature. Agriculture Center. No 11-66(1995)
Table.1 Effect of C ion beam on the number of plants and the fertilityDose Number of Mlplants tested Number of fertile plants M(Gy)20 291 291 10040 470 414 88.150 135 111 82.260 21 15 71.470 7 4 _�Tl0 8 8 100
NM N/V100
80
60I IC
40 139C
M 2 0 159C180C
O0 5 1 0 15 20
Days of incubation (days)
F1g.1 Percent Germination at several temperature for decoated seeds of'Earls Favorite Kenon Faylat (n 10)
30
25
20
to 10 1 5
I
5
01 2 3 4 5 6 7 8 9 1 0 1 1 2 3
Days of incubasion (days)Fig.2 Numberofgerminatedseedsatl5'Cfordecoatedseeds of'Eads
Favorite Kenon Fuyu2' (n = 200)
61
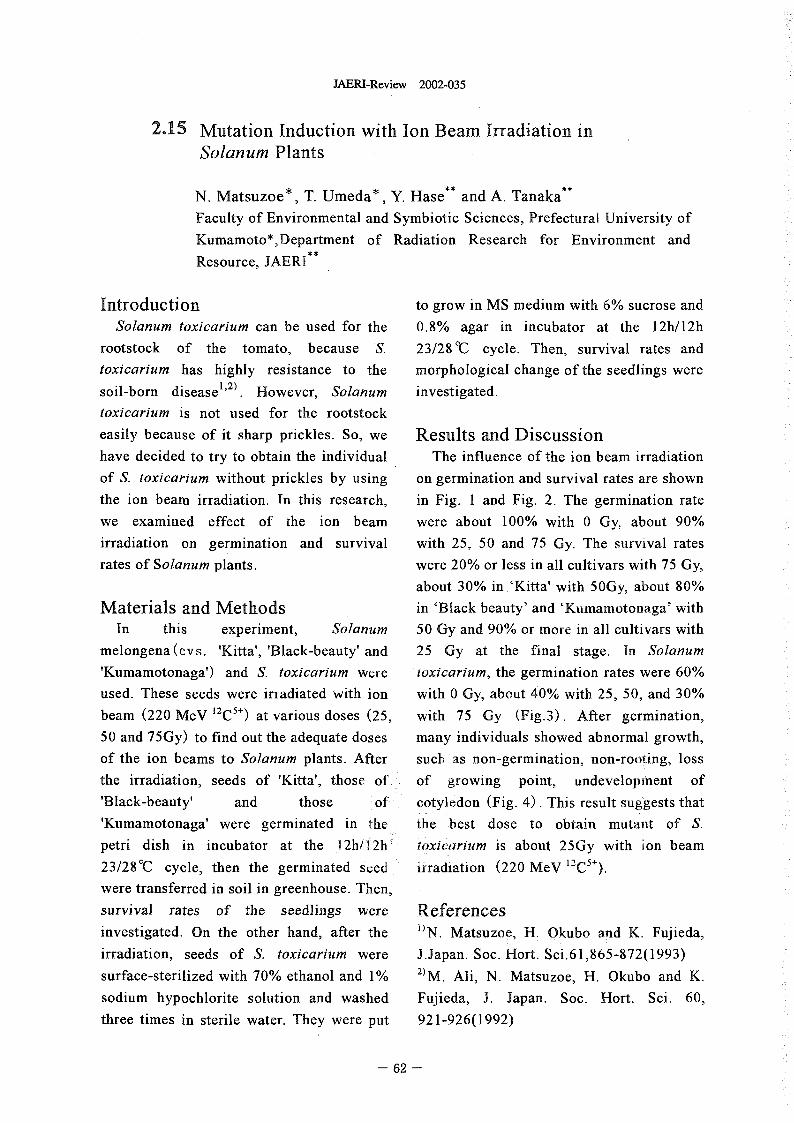
JAERI-Review 2002-035
2.15 Mutation Induction with Ion Beam Irradiation inSolanum Plants
N. Matsuzoe*, T. Umeda*, Y Hase** and A. Tanaka**Faculty of Environmental and Symbiotic Sciences, Prefectural University ofKumamoto*,Department of Radiation Research for Environment and
Resource, JAERI
Introduction to grow in MS medium with 6 sucrose andSolanum toxicarium can be used for the 0.8% agar in incubator at the 12h/12h
rootstock of the tomato, because S. 23/289C cycle. Then, survival rates and
toxicarium has highly resistance to the morphological change of the seedlings were
soil-born disease 1,2) . However, Solanum investigated.
toxicarium is not used for the rootstock
easily because of it sharp prickles. So, we Results and Discussionhave decided to try to obtain the individual The influence of the ion beam irradiation
of S. toxicarium without prickles by using on germination and survival rates are shown
the ion beam irradiation. In this research, in Fig. I and Fig. 2 The germination rate
we examined effect of the ion beam were about 100% with Gy. about 90%
irradiation on germination and survival with 25, 50 and 75 Gy. The survival rates
rates of Solanum pi ants. were 20% or less in all cultivars with 75 Gy,
about 30% in 'Kitta' with 5Gy, about 80%
Materials and Methods in 'Black beauty' and 'Kumamotonaga' with
In this experiment, Solanum 50 Gy and 90% or more in all cultivars with
melongena(evs. 'Kitta', 'Black-beauty' and 25 Gy at the final stage. In Solanum
'Kumamotonaga') and S. toxicarium were toxicarium, the germination rates were 60%
used. These seeds were irradiated with ion with Gy, about 40% with 25, 50, and 30%
beam 220 MeV 12C ") at various doses 25, with 75 Gy (Fig.3). After germination,
50 and 75Gy) to find out the adequate doses many individuals showed abnormal growth,
of the ion beams to Solanum plants. After such as non-germination, non-rooting, loss
the irradiation, seeds of 'Kitta', those of of growing point, undevelopment of
'Black-beauty' and those of cotyledon (Fig. 4. This result suggests that
'Kumamotonaga' were germinated in the the best dose to obtain mutant of S.
dish at the 12h/12h tt-)xic rium is about 25Gy with ion beam
23/289C cycle, then the germinated seed irradiation 220 MeV 12CI+).
were transferred in soil in greenhouse. Then,
survival rates of the seedlings were Referencesinvestigated. On the other hand, after the ')N. Matsuzoe H Okubo and K. Fjieda,
irradiation, seeds of S. toxicarium were J.Japan. Soc. Hort. Sci.61,865-872(1993)
surface-sterilized with 70% ethanol and 1% 2) M. Ali, N. Matsuzoe, H. Okubo and K.
sodium hypochlorite solution and washed Fujieda, J. Japan. Soc. Hort. Sci. 60,
three times in sterile water. They were put 921-926(1992)
62 -
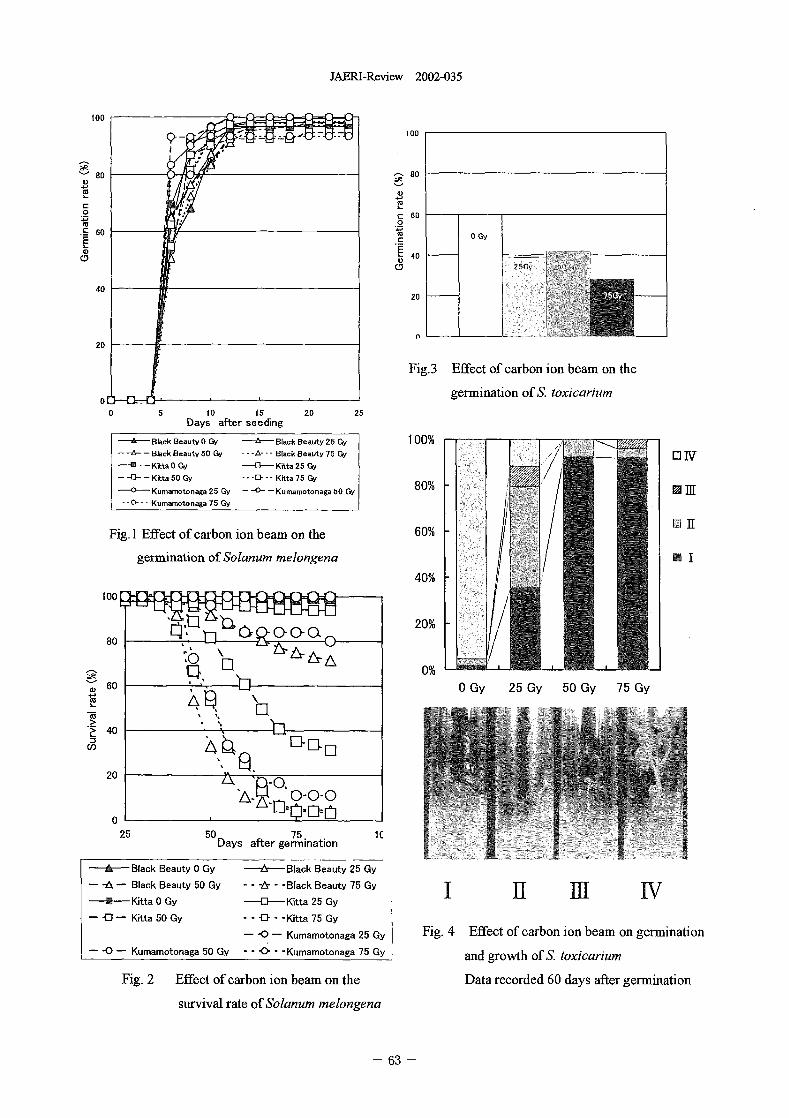
JAERI-Review 2002-035
100 - - -100
80
(D
0 60
.060 16 0 Gy
CE1 40a)O
4020
n20
Fig.3 Effect of carbon on beam on te
0 germination of S. toxicarium0 5 10 15 20 25
Days after seeding
Black Beauty 0 Gy A Black Beauty 26 Gy 100%Black Beauty 50 G --- A--- Black Beauty 75 Gy 1: IVKWta 0 GY ---C3-- Kitta 25 GyKitta 50 G --- El--- Kitta 75 Gy
0 80%Kumamotonaga 25 G Kumamotonaga 0 G M M
0--- Kumamotonaga 75 y
Fig. I Effect of carbon ion beam on the 60% U R
germination of Solanum melongena
40%
100
20%01 CL
80
"O El 0%
60 0 Gy 25 Gy 50 Gy 75 Gy
%
40
20U,
0-0-0
O '0--i5an
25 50 75 1(Days after germination
-- A- Black Beauty 0 Gy 6 Black Beauty 25 Gy
-A - Black Beauty 50 Gy -& -Black Beauty 75 Gy IU IV
Kitta 0 Gy 25 Gy
Kitta 50 Gy 0 -Kitta 75 Gy
-0 - Kumarnotonaga 25 Gy Fig. 4 Effect of carbon ion beam on germination
-0 Kurnarnotonaga 50 Gy < - Kurnarnotonaga 75 Gy and growth of S. toxicarium
Fig. 2 Effect of carbon ion beam on the Data recorded 60 days after germination
survival rate of Solanum melongena
- 63 -
JAM-Review 2002-035
2.16 Instablity of Rice Chlorophyl Mutants Induced at MI byCarbon Ion Beam Irradiation Is Inherited
M. Maekawa*, Y. Hase **, N. Shikazono" and A. Tanaka**
Research Istitute for Bioresources, Okavama University%
Department of on-Beam-Applied Biology, JAERI**1. Introduction 11 autonomous element and the stable phenotype
A DNA transposable element (TE) is en, was strongly suggested to be caused by defectiveuseful for gene4agging in several plant species type of the lement. Although a near sogenic
and maize AclDs or EnlSpm has been utilized for line (NIL) for stable yellow leaf with T-65).2)gene-tagging in heterologous plants' However, genetic background was bred, this line did not
Inactivation of TE has occurred frequently in show any variegations trough generations. So.
heterologous plants through generatlonS2). if variegation could be induced by mutation in
Since so far. anv class 1 tpe active TEs have this NIL and the variegation could be idierited
not been discovered in rice, AlDs system in together with segregation of revertants, it was
maize was introduced into rice and was tryed to strongly suggested tat a ryptic inactive element
be applied for gene-tagging in rice 3). If an was restored. Maekawa et al."') obtained one
endogenous active TE were discovered in ne, it variegated - plant induced at MI by carbon ion
could be used easily as a powerful tool for beam irradiation. Thus, this An& aims to
gene-tagging in ope evironments. As En/Spm confirm the iheritance of somatic nstabilit at
was discovered in a population of maize exposed MI in tis stable vellow leaf mutant line with ioni4to atomic bomb at Bikin and inactive u in beams
maize was reactivated by gamma-ray rradiation),It is possible tat a active TE may be nduced n 2. Experimental procedure
mutagenized rice. As loin beams are a type of Progeny tests derived from a variegated mutant
high linear energy transfer (LET) radiation and of yl-stb plants induced at M] by carbon-ion
call deposit high energ o a target compared to beam from an AVF cyclotron of JAERI,
low LET radiations such as gamma rays, the Takasaki., Japan were conducted by panicle-row
novel mutants or large DNA rearrangements are lines ethod. After tree weeks from seeding,
expected to be induced by Ion beam presence/absence of varlegations ere observed
irradiation 6)"). So, it is expected that inactive because vI mutants start withering from this time.
transposon may be reactivated by ion beam Spikelet fertility was scored as percentage of
irradiation in rice. Maekawa') found a fertile spikelets to total spikelets.
variegated yellow leaf yl-v) mutant in F2 of a
cross between distantly related rice varieties. 3. Results and Discussion
Through the genetic analysis, the yellow leaf Out of 992 M I plants survived after carbon
character was controlled by a nuclear recessive ion beam irradiation, one variegated plant was
gene. This mutant was also found to segregate obtained"'). The variegated v plant at MI bore 9
stable ellow leaf (,I-stb) plants and revertants9) ies of clear variegation
This results suggested that the variegation of were examined in panicle-row lines at M2.
the ellow leaf mutant might be caused by a class Spikelet fertilities in 9 particles were low, varying
64 -
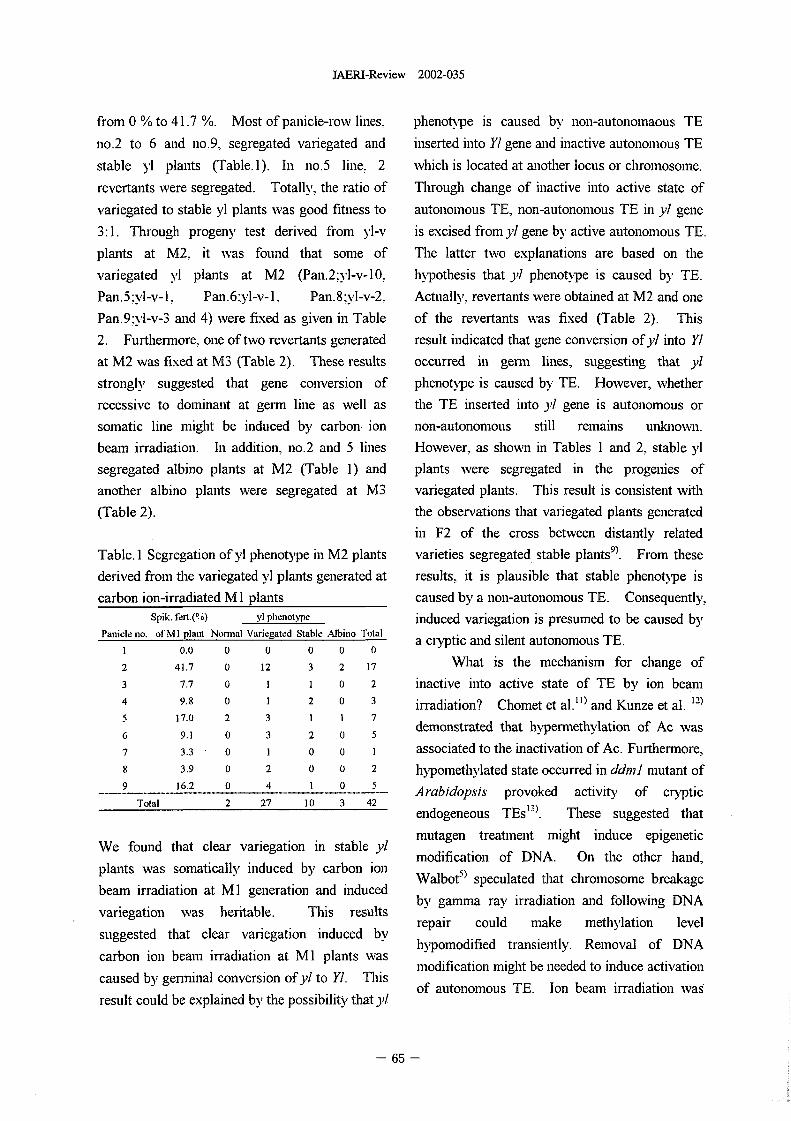
JAERI-Review 2002-035
from to 41.7 %. Most of panicle-row lines, phenotype is caused by non-autonornaous TE
no.2 to 6 ad no.9, segregated variegated ad inserted into Y gene ad inactive autonomous TE
stable yI plants (Table. ). In no.5 le 2 which is located at another locus or chromosome.
revertants were segregated. Totally, the ratio of Through change of inactive into active state of
variegated to stable v plants was good fitness to autonomous TE, non-autonomous TE I ) gene
.3: 1. Through progenN test derived from )?I-v is excised froillyl gene by active autonomous TE.
plants at M2, it was found that some of The latter two explanations are based on the
variegated A plants at M2 (Pan.2.N71-v-10. hypothesis tat ),/ phenotype is caused by TE.
Pan.5,vl-v-1, Pan.6,vI-v-l, Pan.8:v]-v-2. Actuallv. revertants were obtained at M2 and one
Pan.9,NI-v-3 and 4 were fixed as given in Table of te revertants was fixed (Table 2 This
2. Furthen-nore oe of two revertants generated result idicated that gene conversion of yl into Y1
at M2 was fixed at M3 (Table 2 These results occurred in gerrn lilies, suggesting tat yl
strongly suggested tat gene conversion of phenotype is caused by TE. However, whether
recessive to dominant at gerrn line as well as the TE inserted ito y gene is autonomous or
somatic line might be induced by carbon ion non-autonomous still remains unknown.
beam irradiation. I addition. no.2 and lilies However, as shown in Tables I ad 2 stable yl
segregated albino plants at M2 (Table 1) and plants were segregated in the progenies of
another albino plants were segregated at M3 variegated plants. This result is consistent with
(Table 2. the observations tat variegated plants generated
in F2 of the cross between distantly related
Table. I Segregation of yl phenotype in M2 plants varieties segregated stable plants9). Frorn tese
derived from te variegated v] plants generated at results, it is plausible that stable phenotype is
carbon ion-irradiated MI plants caused by a non-autonomous TE. Consequently,Spik. 1erl.(P Y1 henolype nduced variegation s presumed to be caused by
Panicle no. of MI plant Nonnal Variegated Stable Albino Tolal a cryptic ad silent autonomous TE.I 0.0 0 0 0 0 02 41.7 0 2 3 2 17 What is the mechanism for change of3 7.7 0 1 1 0 2 inactive ito active state of TE by ion beam4 9.8 0 1 2 0 3 irradiation? Chomet et al.") and Kunze et al. 12)
5 17.0 2 3 1 1 7 demonstrated that hypernlethylation of Ac was6 9.1 0 3 2 0 5
7 3.3 0 1 0 0 1 associated to the inactivation of Ac. Furthennore,8 3.9 0 2 0 0 2 hypornethylated state occurred in ddin] utant of
16.2 0 4 1 0 Arabidopsis provoked activity of cticTotal 2 27 10 3 42 13)
endogeneous TEs These suggested that
We found tat clear variegation in stable y mutagen treatment might induce epigeneticmodification of DNA. Oil the other hand,
plants was somatically, induced b carbon ionWalbot-') speculated tat chromosome breakage
beam irradiation at MI generation ad induced by garru-na rav rradiation ad following DNAvariegation was heritable. This results - -
I levelsuggested tat clear variegation induced bv repair could make methylation- hypomodified transiently. Removal of DNA
carbon ion beam irradiation at MI plants wascaused b gen-ninal conversion of 1 to Y1. This modification Inight be eeded to induce activation
of autonomous TE. Ion beam rradiation wagresult could be explained by the possibility thaty/
65 -
JAERI-Review 2002-035
found to induce large structural cange of 5) V. Walbot, Molecular ad General Genetics
chromosome'). Thus, transient hN ometlivIation 212 1988) 2 59-264.
state could be brought b chromosome breakages 6) A. Tanaka, Gamina Field Smposia 38 1999)
induced bv ion beam irradiation and folINN-Ing 19-28.
DNA repair ad this state could make active 7) N. Shikazono, A. Tanaka, H. Watanabe ad S.
autonomous TE active. As shown Table 2 Tano, Genetics 157 200 1) 3 )79-3 )87.
low fertile MI plants segregated hgh fertile 8) M. Maekawa, In Modification of Gene
pedigrees ith a frequency of 44%. ndicating Expression ad Non-Mendelian Iheritance.
that the frequency of high fertile plants is in good Oono, K. and F. Takaiwa. (eds.). Nati. Inst. Agr.
agreement wth 50% for segregation frequency of Res., (I 995) p. 3 ) 79-3 8 8.
reciprocal translocation. Although any check 9) M. Maekawa, K. Rikiishl, T. Matsuura ad K.
for chromosome association in MI plants are not Noda, Japan Jpurnal of Breeding 46 (Suppl 2)
conducted, - chromosome breakages might (1996) 107.(In Japanese)
occurred in M I plants by ion beam irradiation. 10) M. Maekawa, A. Tanaka, N. Shikazono and
"genomic stress"McClintok 14) addressed. such as Y. Hase. JAERI-Review 2001-039 2001)
chromosome breakages, deletion or translocation 64-66.2)possi reactivates a cyptic silent TE . Stable I 1) P. S. Choinet S. Wessler and S. L.
yl phenotype is useful for monitoring induction of Dellaporta, EMBO Journal 6 1987) 295-302.12) R. Kunze, P. Starlinger and D. Schwartz,
variegation by mutagen treatments. I
It is very important to reveal te genornic Molecular and General Genetics 214 1988)
sequence for )/ gene in order to prove tat te 325-327.
variegation induced by ]on beam irradiation 13) A. Miura, S. Yonebavashi, K. Watanabe, T.
might be caused by reactivation of cryptic TE Toyania, H. Shimada and T. Kakutaiii. Nature
and utilize an active TE in functional genomics 411 2001) 212-214.
of rice. 14) B. McClintock, Science 226 1984) 792-801.
References
1) V. Sundaresan, V., Trends in Plant Science I
(1996) 184-190.
2) R. Kunze, H. Saedler and W.E. Lonnig,
Advances in Botanical Research 27 1997)
331-470
3) T. Izawa.. T. Ohnishi, T. Nakano, N. Ishida H.
Enoki, H. Hashimoto, K. Itoh, C. Wu. C.
Miyazaki, T. Endo, S. lida and K. Shirnamoto,
Plant Molecular Biology 5 1997) 219-229.
4) P. A. Peterson, Genetics '8 1953) 682-683.
66 -
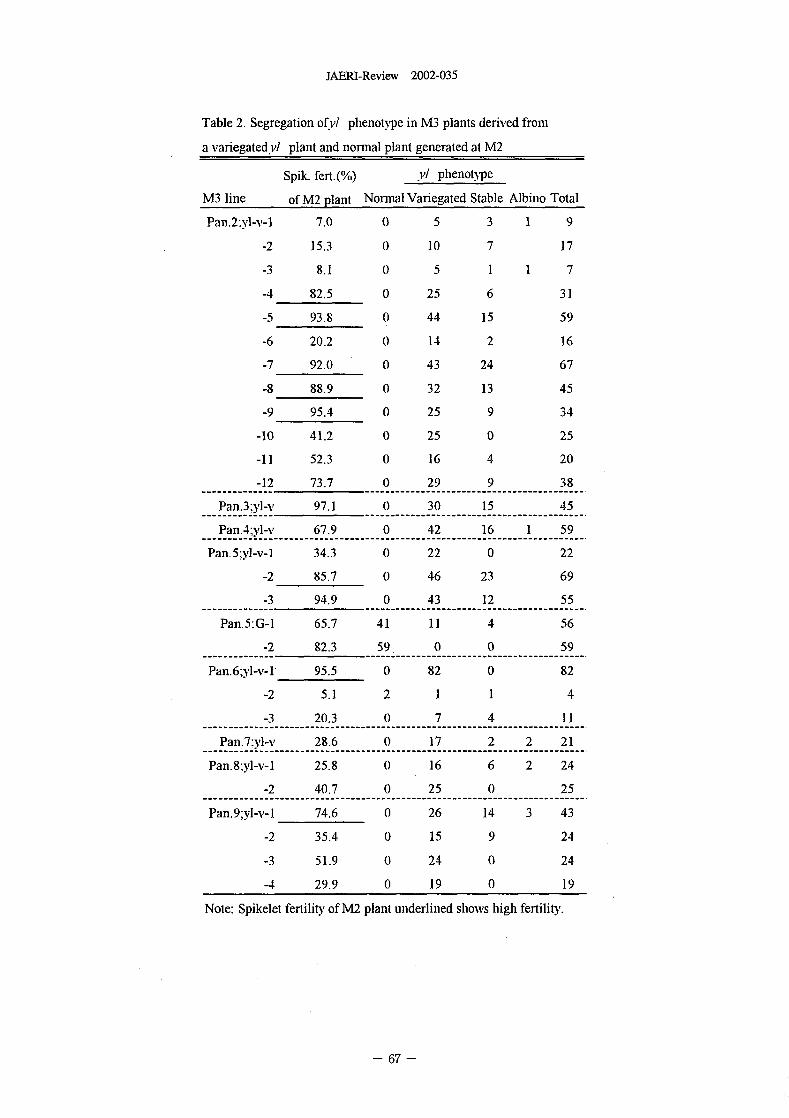
JAERI-Review 2002-035
Table 2 Segregation of.v/ phenotype in M3 plants derived from
a variegated.v/ plant and normal plant generated at M2
Spik. fert.(%) - Yl penotype
M3 line of M2 21ant Normal Variegated Stable Albino Total
Pan.2-.Yl--,,-l 7.0 5 3 1 9
-2 15.3 10 7 17
-3 8.1 0 5 1 1 7
-4 82.5 0 25 6 31
-5 93.8 0 44 15 59
-6 20.2 0 14 2 16
-7 92.0 0 43 24 67
-8 88.9 0 32 13 45
-9 95.4 0 25 9 34
-10 41.2 0 25 0 25
-11 52.3 0 16 4 20
------------ 12 73.7 ---- 0------- 29 --------- 9------------- 38--.
--- Pan.3;yl-v 97.1 .-- 30 -------- 15 ------------- 45--.
--- Pan.4;yl-N --------- 67.9 --------- 0------- 42 -------- 16 ------ I----- 59--.
Pan.5,yl-v-1 343 0 22 0 22
-2 85.7 46 23 69
3 94.9 0 43 12 55
Pan.5:G-1 65.7 41 1 4 56
2 82.3 59 0 0 59
Pan.6;yl-v-l' 95.5 82 0 82
-2 5.1 2 1 1 4
3 20.3 7 4 1-1
Pan.7-.),I-,%, 28.6 17 2 2 2 Di -----------------------------------------------------------------
Pan.8-,yl-v-l 25.8 16 6 2 24
2 40.7 0 25 ( 25
Pan.9:yl-N,-l 74.6 0 26 14 3 43
-2 35.4 0 15 9 24
-3 51.9 24 0 24
-4 29.9 0 1 9 0 1 9
Note-, Spikelet fertility of M2 plant underlined shows igh fertility-
67 -
JAERI-Review 2002-035
2.17 Studies on Flower Color and Morphological Mutations fromIn Vitro Chrysanthemum Explants Irradiated with IonBeams
T.Sato*, H.Naganoma*, Y.Hase** and A.Tanaka**
Department of Vegetables and Flowers, Akita prefecture Agricultural experiment
station.* Department of Radiation Research for Environment and Resources,
JAERI**
1. Introduction
Chrysanthemum is important flower in materials were transferred to a newAkita prefecture. Especially medium for callus proliferation. Twochrysanthemum cultivar "Natsuyasumi" weeks after, callus was transferred to(purplish red flower) is suited for climate plant regeneration medium.of Akita prefecture. However, producer,market and consumer are demanding 3. Results and Discussionyellow or white color cultivar. In 12C51 ions, more than 5Gy of
Ion beam is expected to be a new and irradiation influenced callus inductionefficient mutagen for plant mutation (Fig.1). Median lethal dose (LD50) wasbreeding. In flower color of between and 2Gy. At more than 3Gy,chrysanthemum, it has been reported that callus induction was not observed.mutant was frequently regenerated from Plant regeneration was suddenly
in vitro explants with irradiation of ion decreased by ion beam irradiation. At
beam'). 5Gy plant regeneration was about 20%.
The final goal of this study is breeding At more than 2Gy, it was not observed.
of yellow or white flower color line with Therefore, we adopted 5Gy as an
ion beam irradiation to chrysanthemum. adequate dose.
In this paper, we report the effect of ion In 12C6, ions, the irradiation with 5Gy
beam irradiation on callus induction and influenced callus induction (Fig.2). LD5o
plant regeneration from chrysanthemum of callus induction was about 5Gy At
cultivar "Natsuyasumi" in vitro explants. more than 2Gy, callus induction was not
observed.
2. Materials and Methods Plant regeneration was 10% by the
Using a chrysanthemum cultivar, irradiation of 5Gy. At more than Gy,
"Natsuyasumi", the explants of petals on plant regeneration was not observed.
callus inducing medium were irradiated Therefore, we adopted less than 5G as
with 12C5+ or 12C6+ ion beam from TIARA an adequate dose.
AVF cyclotron in JAERL The energy of From these results, in comparison with
12C5+ was 22OMeV, and that of 12C6+ was 12C5+ ions, it was thought that 12C6+ ions
32OMeV. have higher influence on callus induction
After irradiation, the cultured and plant regeneration of chrysanthemum
- 68 -
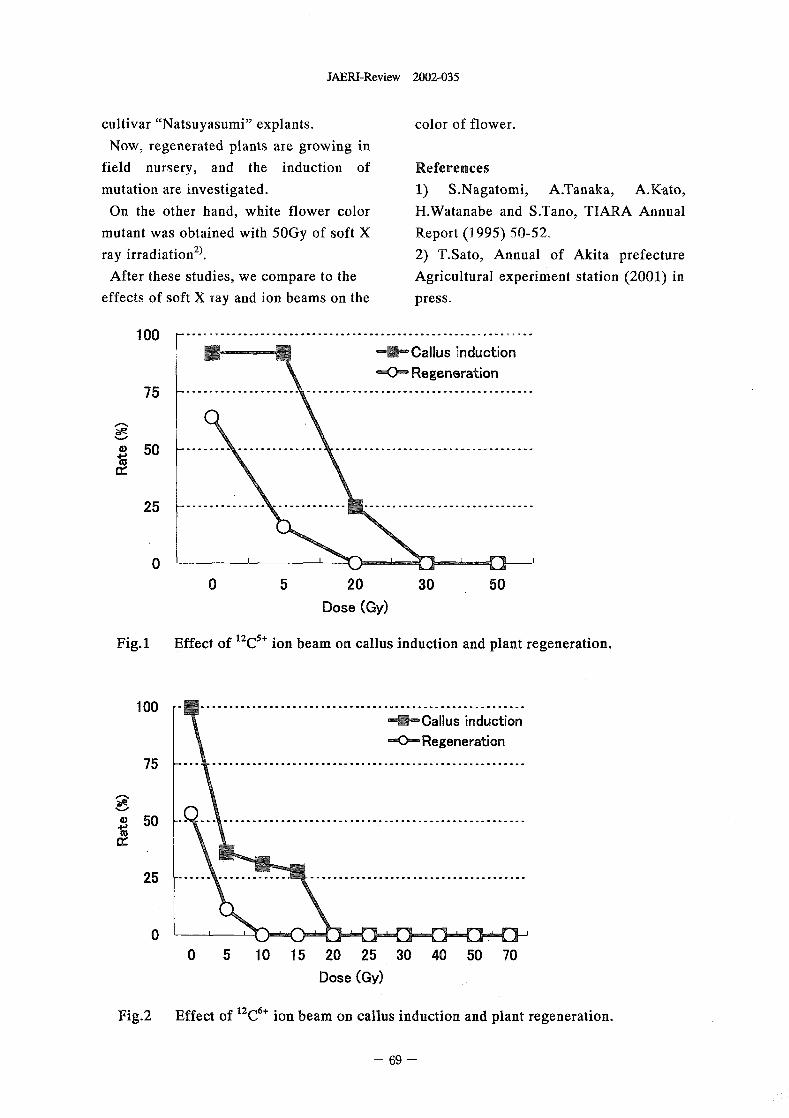
JAERI-Review 2002-035
cultivar "Natsuyasumi" explants. color of flower.
Now, regenerated plants are growing in
field nursery, and the induction of References
mutation are investigated. 1) S.Nagatomi, A.Tanaka, A.Kato,
On the other hand, white flower color H.Watanabe and S.Tano, TIARA Annual
mutant was obtained with Gy of soft X Report 1995) 50-52,
ray irradiation 2). 2) T.Sato, Annual of Akita prefecture
After these studies, we compare to the Agricultural experiment station 2001 in
effects of soft X ray and ion beams on the press.
100 .............................................................
--M-Callus induction
-- O- Regeneration
75 ------------------- --------------------------------------
40 50 ......... ..............................
25 ------------- ....................
0
0 5 20 30 50
Dose (Gy)
FFig.1 'ffeCt of 2C51 ion beam on callus induction and plant regeneration.
100 --------------------------------------------------------�*-Callus induction
-0-Regeneration
75 -------------------------------------------------------
50 -- ....................................................
25 ------- ......................................
0
0 5 10 15 20 25 30 40 50 70
Dose (GY)
Fig.2 Effect of 2C61 ion beam on callus induction and plant regeneration.
- 69 -
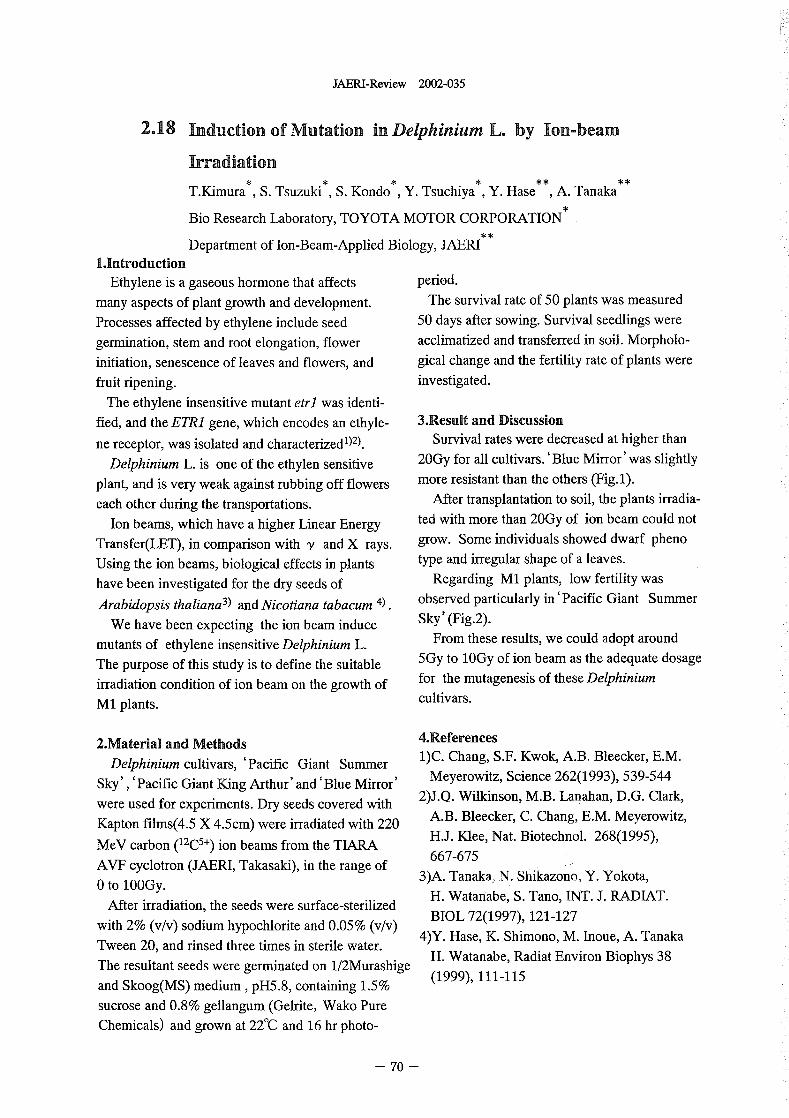
JAERI-Review 2002-035
2.18 Induction of Mutation in Delphinium L. by Ion-beam
Irradiation
T.Kimura S. Tsuzuki S. Kondo Y. Tsuchiya Y. Hase A. Tanaka
Bio Research Laboratory, TOYOTA MOTOR CORPORATION
Department of on-Beam-Applied Biology, JAERI
LIntroduction
Ethylene is a gaseous hormone that affects period.
many aspects of plant growth and development. The survival rate of 50 plants was measured
Processes affected by ethylene include seed 50 days after sowing. Survival seedlings were
germination, stem and root elongation, flower acclimatized and transferred in soil. Morpholo-
initiation, senescence of leaves and flowers, and gical change and the fertility rate of plants were
fruit ripening. investigated.
The ethylene insensitive mutant etrl was identi-
fied, and the ETR1 gene, which encodes an ethyle- 3.Result and Discussion
ne receptor, was isolated and characterizedl)2). Survival rates were decreased at higher than
Delphinium L. is one of the ethylen sensitive 2OGy for all cultivars.'Blue Mirror'was slightly
plant, and is very weak against rubbing off flowers more resistant than the others (Fig.1).
each other during the transportations. After transplantation to soil, the plants irradia-
Ion beams, which have a higher Linear Energy ted with more than Gy of ion beam could not
Transfer(LET), in comparison with y and X rays. grow. Some individuals showed dwarf pheno
Using the ion beams, biological effects in plants type and irregular shape of a leaves.
have been investigated for the dry seeds of Regarding Ml plants, low fertility was
Arabidopsis thaliana3) and Nicotiana tabaCUM 4 observed particularly in'Pacific Giant Summer
We have been expecting the ion beam induce Sky'(Fig.2).
mutants of ethylene insensitive Delphinium L. From these results, we could adopt around5Gy to Gy of ion beam as the adequate dosageThe purpose of this study is to define the suitable
irradiation condition of ion beam on the growth of for the mutagenesis of these Delphinium
Ml plants. cultivars.
2.Material and Methods 4.References
Delphinium cultivars, 'Pacific Giant Summer I)C. Chang, S.F. Kwok, A.B. Bleecker, E.M.
Sky','Pacific Giant King Arthur'and'Blue Mirror' Meyerowitz, Science 262(1993), 539-544
were used for experiments. Dry seeds covered with 2P.Q. Wilkinson, M.B. Lanahan, D.G. Clark,
Kapton films(4.5 X 4.5cm) were irradiated with 220 A.B. Bleecker, C. Chang, E.M. Meyerowitz,
MeV carbon 12C5+) ion beams from the TARA H.J. Klee, Nat. Biotechnol. 268(1995),
AVF cyclotron (JAERI, Takasaki), in the range of 667-675
0 to 10OGy. 3)A. Tanaka, . Shikazono, Y. Yokota,
After irradiation, the seeds were surface-sterilized H. Watanabe, S. Tano, TNT. J. RADIAT.
with 2 (v/v) sodium hypochlorite and 0.05% v/v) BIOL 72(1997), 121-127
Tween 20, and rinsed three times in sterile water. 4)Y. Hase, K. Shimono, M. Inoue, A. Tanaka
The resultant seeds were germinated on 1/2Murashige H. Watanabe, Radiat Environ Biophys 38
and Skoog(MS) medium, pH5.8, containing 1.5% (1999), 111-115
sucrose and 0.8% gellangurn. (Gelrite, Wako Pure
Chemicals) and grown at 220C and 16 hr photo-
_70 -
JAERI-Review 2002-035
I(O
80
60 AB
40 c
C/)20
00 5 10 20 W 40 60 80 100
Irradiation dose (Gy)
Fig.1Survival rate of Delphinium plant in carbon(22OMeV) irradiation.
A:Pacific Giant ummer Sky, B:Pacific Giant King Arthur, C:BlueMirror.
100 -
80 -
4-J 60 EMA2
1 B40 - 0 c
'-ELL
20 -
0
OGY 5GY I Gy
Irradiation dose (Gy)
Fig.2Fertility rate of MI Delphinium plant in cubon(22OMev) irradiation.
A:Pacific Giant Summer Sky, B:Pacific Giant King Arthur, C:Blue
Mirror.
71 -
JAERI-Review 2002-035
2.19 Isolation of arabidopsis mutants defective in root hydrotropism
K. Koizumi*, G. Takata*, K. Nakaya*, N. Negishi*, Y. Sasuga*, Y. Sakata*, Y.Oono**, Y. Kobayashi***, H. Takenaga*, and S. Tanaka*Faculty of Applied Bioscience, Tokyo University of Agriculture*, Advanced RadiationTechnology Center, JAERI**, Department of Radiation Research for Environmentand Resources, JAERI***
1. Introduction A bioassay system for hydrotropism 2 cmThe roots of terrestrial plants detect a long, 14 cm wide and cm high) is shown in
moisture gradient around them and grow Fig. 1A. About 50 seeds of rabidopsistowards a soil on a higher moisture level f6r thaliana (Columbia) pretreated with a lowtheir life. This phenomenon termed temperature of 4C for days were sown on ahydrotropism was found early in the 19th filter paper at the topmost acrylic rectangularcentury. Little attention has been paid to bar (Fig. 113). The other end of the filter paperhydrotropism for a long time whereas was soaked in water in a tray to supplygravitropism and phototropism have been germinating seeds with water (Fig.lA and .studied extensively. Recently, Takahashi et al. The relative humidity in the s ace near rootsshowed that higher plants such as Pisum was adjusted by changing the level of watersativum and Zea mays perceive a moisture surface in the tray. The seedlings were usuallygradient in the root capi) and seem to transduce grown for 4 days in 50% relative humidity at
some signals to produce differential growth in 25'C under . �� -continuous feeble light 2
the growing zone of the rooe)3) . However, RMOI/M2/S) . HyOrotropic activity was expressed
molecular mechanism of hydrotropism has as a mean angle of root curvature.
remained unsolved.
To elucidate the molecular mechanism 11) Isolation of mutants defective in
responsible for root hydrotropism, molecular hydrotropism
genetic analysis was carried out using The dry seeds of A. thaliana (Columbia)
arabidopsis which has played air important role were sandwiched between kapton films and
in the latest development of plant physiology. irradiated with carbon ion 220 MeV) at'a dose
So far, arabidopsis mutants showing aberrant of 100, 150, and 200 Gy at TLARA. The
root hydrotropism have not been reported. irradiated seeds were grown and the
In this study, we ) developed a new research self-pollinated seeds (M2 seeds) harvested.
system of detecting the positive root After the M2 seedlings underwent the bioassay
hydrotropism of arabidopsis, and 11) attempted for hydrotropism, each seedling whose root
to isolate mutants that are defective in root failed to respond to water stimulus was grown
hydrotropism. to yield the self-pollinated seeds (Wseeds).
The M3 seeds were re-screened to select
2. Materials and Methods mutants.
1) Development of bioassay for hydrotropic
activity
- 72 -
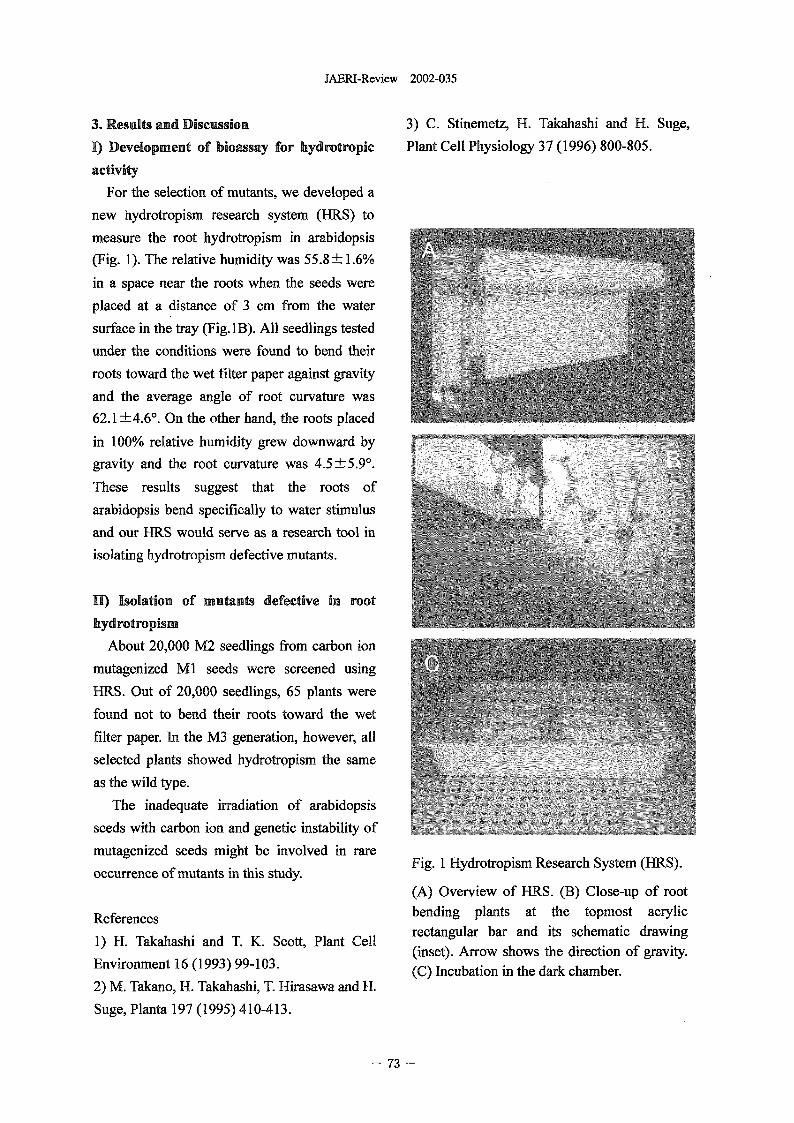
JABRI-Review 2002-035
3. Results and Discussion 3) C. Stinemetz, H. Takahashi and H. Suge,
1) Development of bioassay for hydrotropic Plant Cell Physiology 37 1996) 800-805.
activity
For the selection of mutants, we developed a
new hydrotropism research system (HRS to
measure the root hydrotropisin in arabidopsis
(Fig. 1). The relative humidity was 55.8-4-1.6%
in a space near the roots when the seeds were
placed at a distance of 3 cm from the water
surface in the tray (Fig. B). All seedlings tested
under the conditions were found to bend their
roots toward the wet filter paper against gravity
and the average angle of root curvature was
62.1 ± 4.6'. On the other hand, the roots placed
in 100% relative humidity grew downward by
gravity and the root curvature was 4.5-L5.9'.
These results suggest that the roots of
arabidopsis bend specifically to water stimulus
and our HRS would serve as a research tool in
isolating hydrotropism defective mutants.
11) 1solation of mutants defective in root
hydrotropism
About 20,000 M2 seedlings from carbon ion
mutagenized MI seeds were screened using
FIRS. Out of 20,000 seedlings, 65 plants were
found not to bend their roots toward the wet
filter paper. In the M3 generation, however, all
selected plants showed hydrotropism the same
as the wild type.
The inadequate irradiation of arabidopsis
seeds with carbon ion and genetic instability of
mutagenized seeds might be involved in rare Fig. Hydrotropism Research System (HRS).occurrence of mutants in this study.
(A) Overview of HRS. (B) Close-up of root
References bending plants at the topmost acrylic
1) H. Takahashi and T. K. Scott, Plant Cell rectangular bar and its schematic drawing
Environment 16 1993) 99-103. (inset). Arrow shows the direction of gravity.(C) Incubation in the dark chamber.
2) M. Takano, H. Takahashi, T. Hirasawa and H.
Suge, Planta 197 1995) 410-413.
- 73 -
JAERI-Review 2002-035
2.20 Single-hit Effects on Mammalian Cultured Cells with Heavy-
ion Microbeams
Y. Kobayashi*, T. Funayama*, S. Wada**, M. Taguchi*** and H. Watanabe*
Department of on-Beam-Applied Biology, JAERI*, Department of Veterinary
Medicine, Kitasato University", Department of Material Development JAERI***
1. Introduction communications such as "bystander effects",A icrobeam is a source of focused or that is, radiation effects of heavy ions
collimated radiation whose effects are transmitted from irradiated cells to neighboringlocalized to a micron-sized area of specimen. un-ir-radiated cells.The se of heavy ion microbearns rovides a Furthermore, a microbearn with sufficientunique way to control precisely the umber of spatial resolution will be useful for analyzingions traversing individual cells and the the interaction of damages produced bylocalization of dose in an irradiated cell. In separate events in an irradiated cell, therecent years there has been an ireasing dynamics of cellular repair, and the intra-interest in the use of microbeams to study a cellular process such as apoptosis by means ofnumber of important radiobiological processes highly localized irradiation of a part of ain ways that aot be achieved using nucleus or cytoplasm.conventional "broad-field" irradiation'-'), Therefore, we have developed a cell
Heavy ions a transfer their energy to irradiation system for targeting cellsbiological organisms through high-density individually with a precise number of high-ionization and excitation of molecules and LET heavy ionS4). To elucidate radiobiologicalatoms along the particle trajectories. The effects of exactly one particle, we tried topopulation of cells exposed to a very low dose improve the cell irradiation system and toof high-LET beavy ins Contains a few cells bit detect effects of single hit of 13.0 MeV/u
by a particle, while the majority of te cells 'ONe`+ and 11.5 MeV/U 4Ar` ion onreceive no radiation damage, At somewhat mammalian cultured CelIS5,6). The irradiation
higher doses, some of the cells receive two or procedure is shown in Figure .more vts according to the Poissondistribution of ion injections. Using 2. Experimental proceduremicrobeams, we will be able to overcome this The cell irradiation system has beenlimitation by delivering an exactly counted incorporated into the high-energy heavy ionnumber of ions to each cell. microbearn apparatus') which was installed
A microbeam can be used for selective under a vertical beam line of the AVFirradiation of individual cells, which can be cyclotron at the TIARA of JAERI-Takasaki.subsequently observed to ascertain what Preparation and detection of target cellschanges occur to that cell and to neighboring Chinese ha nster ovary cells (CHO-Kl)un-irradiated cells. The use of microbeam were inoculated to the cell dish, the bottom ofallows direct investigation of cell-to-cell which was made of 100 m thick ion track
- 74 -
JAERI-Review 2002-035
detector Harz1as TNF-l (modified CR-39). The plastic scintillator coupled to a photomultiplier
cell dishes were incubated for 612 hours to let tube (PMT) assembly mounted on the on-line
the cells attach to the CR-39, then the cells microscope turret. The collimated ions were
were stained with gM CellTracker Orange detected with the PMT assembly after passing
(Molecular Probe). Positional data of the through a target cell and the bottom of the cell
individual cells were obtained by fluorescent dish. Energy spectra of collimated ions were
microscopically searching at the Off-line measured with a multi-channel analyzer by
microscope in the preparation room before analyzing scintillation pulses. The number of
irradiation. The object database created by the ions having traversed the sample was counted
Off-line microscope controlling PC was shared with a constant fraction discriminator coupled
by On-line microscope controlling PCs and the to a preset counter/timer. Every irradiation was
ion-bearn irradiation system. terminated by the action of beam shutter,
Cell targeting and irradiation which was controlled by the preset
Just before irradiation, the medium was counter/timer module or manually.
removed to make ions penetrate both the cells Detection of ion tracks at irradiation nw
and the bottom of the cell dish. The cells were Immediately after irradiation, the cell dish
covered with a Kapton (8 gm thick polyimide) was refilled with medium, and then the bottom
film to prevent dry-up and microbiological was etched from the opposite side of the cells
contamination during the exposure to air. Then with alkaline-ethanol solution at 37'C for 5
the cell dish mounted on a holder was minutes. After a rinse with distilled water, the
transported from the Off-line microscope to the bottom of the cell dish was observed
On-line microscope in the beam room. microscopically for evaluation of the targeting
Using the object database, targeting and accuracy. Almost all the ion track pits were
irradiation at the On-line microscope were concentrated within a collimated diameter
carried out quickly. However, the mechanical range. The cells were then incubated at 37'C
positioning accuracy was not sufficient for continuously to check the effect of etching
automatic targeting of mammalian cultured treatment on the cell growth. No significant
cells, Therefore, the cells, once targeted effect of the etching treatment on the cell
according to the object database, needed to be growth was observed.
observed at the On-line microscope, and to be
re-targeted emotely from the On-line Remote 3 Effects of single ht of heavy ions
PC console. However, it was difficult to obtain After irradiation of 13.0 MeV/u Ne' and
a clear image of cells with a reflected 11.5 MeV/U 4Ar13+ ions, the position and the
illumination system installed in the On-line number of ion tracks penetrating the CHO-KI
microscope. To obtain a phase-contrast iage cells were detected with prompt etching of CR-
of CHO-KI cells for precise targeting, a light- 39 with alkaline ethanol etching solution at
guided ring-illumination device was newly 37'C. The growths of the cells were observed
attached around the newly developed individually up to 60 hours after irradiation.
sharpened microaperture, from which the The continuous observation of the individual
collimated ions were extracted. cell growth indicated that a single ion traversal
Then the object lens was replaced with a of a cell nucleus resulted in complete growth
- 75 -
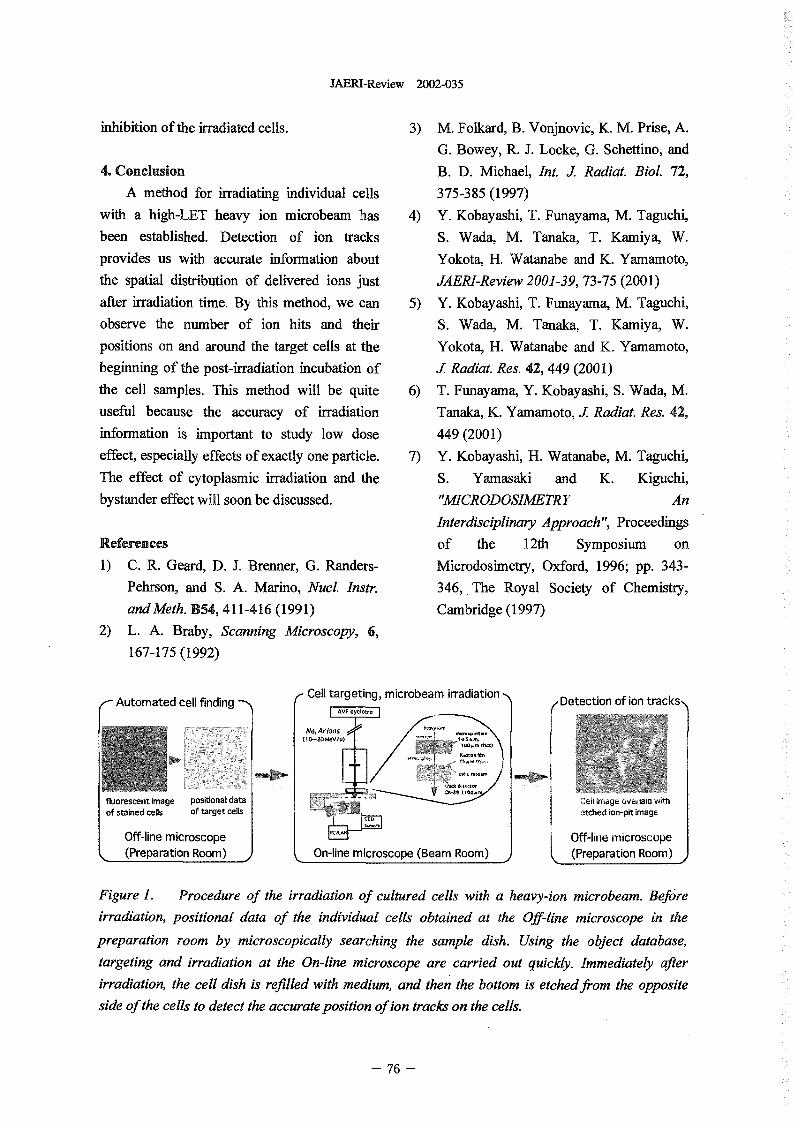
JAERI-Review 2002-035
inhibition of the irradiated cells. 3) M. Folkard, B. Vonjnovic, K. M. Prise A.
G. Bowey, R. J. Locke, G. Schettino, and
4. Conclusion B. D. Michael, Int J Radiat. Biol. 72,
A method for irradiating individual cells 375-385 1997)
with a high-LET heavy ion microbeam has 4) Y. Kobayashi, T. Funayarna, M. Taguchi,
been established. Detection of ion tracks S. Wada, M. Tanaka, T. Kamiya W.
provides us with accurate information about Yokota, H. Watanabe and K. Yamamoto,
the spatial distribution of delivered ions just JAERI-Review 2001-39, 73-75 200 )
after irradiation time. By this method, we can 5) Y. Kobayashi, T. Funayama, M. Taguchi,
observe the number of ion hits and their S. Wada, M. Tanaka, T. Kamiya W.
positions on and around the target cells at the Yokota, H. Watanabe and K. Yamamoto,
beginning of the post-irradiation incubation of J Radiat. Res. 42, 449 200 )
the cell samples. This method will be quite 6) T. Funayarna, Y. Kobayashi, S. Wada M.
useful because the accuracy of irradiation Tanaka, K. Yamamoto J Radiat. Res. 42,
information is iportant to study low dose 449 2001)
effect, especially effects of exactly one particle. 7) Y. Kobayashi, H. Watanabe, M. Taguchi,
The effect of cytoplasmic irradiation and the S. Yamasaki and K. Kiguchi,
bystander effect will soon be discussed. "MCRODOSMETRY An
Interdisciplinary Approach", Proceedings
References of the 12th Symposium on
1) C. R. Geard, D. J. Brenner, G. Randers- Microdosimetry, Oxford, 1996; pp. 343-
Pehrson, and S. A. Marino, Nucl. Instr. 346, The Royal Society of Chemistry,
and Meth. B54,411-416 1991) Cambridge 1997)
2) L. A. Braby, Scanning Microscopy, 6,
167-175 1992)
Automated cell finding Cell targeting, microbeam irradiation O/Detection of ion tracks,,I AVF �YEHJ
NeAriarTs(10_20WV1.)
fluorescent image positional data Cei image overlaid with
of stained ells of target cells etclied ion-pit image
Off-line microscope Off-line microscope(Preparation Room) On-line microscope (Beam (Preparation Room)
Figure 1. Procedure of the irradiation of cultured cells with a heavy-ion microbeam. Bef6re
irradiation, positional data of the individual cells obtained at the Off-line microscope in the
preparation room by microscopically searching the sample dish. Using the object database,
targeting and irradiation at the On-line microscope are carried out quickly. Immediately after
irradiation, the cell dish is refilled with medium, and then the bottom is etchedftom the opposite
side of the cells to detect the accurate position of ion tracks on the cells.
- 76 -
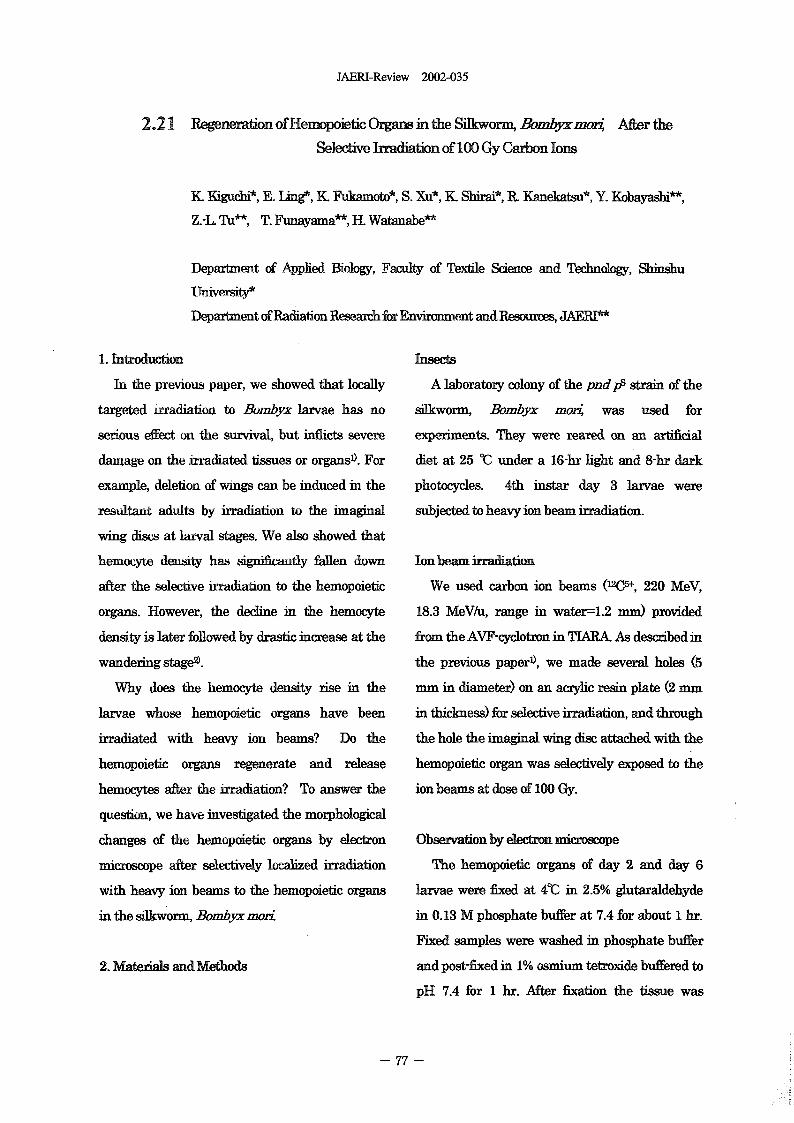
JAERI-Review 2002-035
2.21 RegenerationofHemopoieticOrgammtheS,&worn,�BombyxmoA Afterthe
Selective h-radiation of 100 Gy Carbon Ions
Y, Kiguch?, E. IIW, YL Fukamoto;*, S. Xe, Y Shirai-, R Kanekatsu- Y obayashi*-,
Z.-L Tu", T. Funayama'-, 11 Watanabe-
Department of Applied Biology, Faculty of Txtile Science and Teclindogy Shinshu
University'
Department of Radiation Research for Environment and Resources, JAERI**
i Itroduction Insects
In the previous paper, we showed that locally A laboratory colony of the pndpP strain of the
targeted irradiation to Bbyx larvae has no silkworm, Bombyx moii was used for
serious effect on the survival, but fhets severe experiments. They were reared on an artificial
damage on the irradiated tissues or organs). For diet at 25 C under a 16-hr light and 8-hr dark
example, deletion of wings can be induced in the photocycles. 4th instar day 3 larvae were
resultant adults by irradiation to the imaginal subjected to heavy ion beam irradiation.
wing discs at larval stages. We also showed that
hemocyte density has significantly fallen down Ion beam irradiation
after the selective Nation to the hemopoietic We used carbon ion beams 12C5+, 220 MeV,
organs. However, the decline in the hernowte 18.3 MeV/u, range in water--1.2 mm) provided
density is later followed by drastic increase at the from the AVF-cydotron in TMBA As escribed n
wandering stage2). the previous paper'), we made several holes
Why does the hernocyte density rise in the mm in diameter) on an acrylic resin plate 2 mm
larvae whose hemopoietic organs have been in thidmess) for selective irradiation, and through
irradiated with heavy ion beams? Do the the hole the i m a ai n al wing disc attached with the
hemopoietic organs regenerate and release hemopoietic organ was selectively exposed to the
hemocytes after the irradiation? To answer the ion beam at dose of 100 Gy.
question, we have investigated the morphological
changes of the heinopoietic organs by electron Observation by electron microscope
microscope after selectively localized irradiation The hemppoietic organs of day 2 and day 6
with heavy ion beams to the herappoietic organs larvae were fixed at eC in 25% glutaraldehyde
in the silkw orm, Bbmbyxmozi in 0 13 M phosphate buffer at 74 for about I hr.
Fixed samples were washed in phosphate buffer
2. Materials and Methods and post-fixed in 1% osmium tetroxide buffered to
pH 74 for hr. After fixation the tissue was
- 77 -
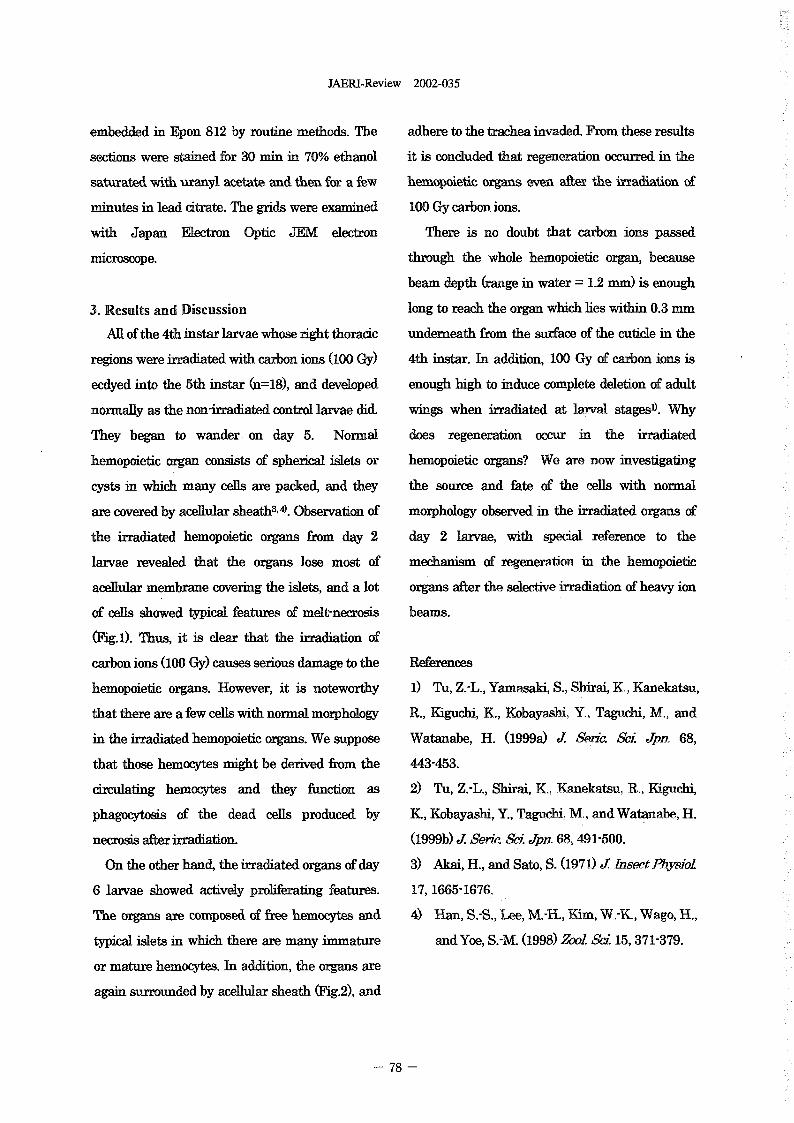
JAERI-Review 2002-035
embedded in Epon 812 by routine methods. The adhere to the trachea invaded. From these results
sections were stained for 30 min in 70% ethanol it is concluded that regeneration ocurred in the
saturated with anyl aetat ad then for a few hemppoielac, organs even after the adiatio of
minutes in lead citrate. The grids were examined 100 Gy carbon ions.
with Japan Electron Optic JEM electron There is no doubt that carbon ions passed
microscope. through the whole hernopoletic organ, because
beam depth (range in water 12 mm) is enough
3. Results and Discussion long to reach the organ which hes within 03 mm
AU of the 4th instar larvae whose right thoracic underneath from the surface of the Cuticle in the
regions were irradiated with carbon ions (100 Gy) 4th instar. In addition, 100 Gy of carbon ions is
ecdyed into the 5th instar (n=18), and developed enough high to induce complete deletion of adult
normally as the non-irrachated control larvae did. wings when irradiated at larval stages). Why
They began to wander on day 5. Normal does regeneration occur in the irradiated
hemopoletic organ consists of spherical ilets or hemopoletic organs? We are now investigating
cysts in which many cells are packed, and they the source and fate of the es wth normal
are covered by acellular sheath3,4). Observation of morphology observed in the irradiated organs of
the iradiated hemopoietic organs from day 2 day 2 arvae, with special reference to the
larvae revealed that the organs lose most of mechanism of regeneration in the hemopoietic
acellular membrane covering the islets, and a lot organs after the selective irradiation of heavy ion
of cells showed typical features of melt-necro-,as beam
(Fig.1). Thus, it is dear that the irradiation of
carbon ions (100 Gy) causes serious damage to the References
hemopoietic organs. However, it is noteworthy 1) Tu, Z.-L., Yamasaki, S., Shirai� K., Kanekatsu,
that there are a few cells with normal morphology R., Kiguchi, K., Kobayashi, Y Taguchi, M,, and
in the rradiated hernopoietic organs. We suppose Watanabe, H. (1999a) SWic. S. Jpn� 68,
that those hemocytes might be derived from the 443-453.
circulating hemocytes and they function as 2) Tu., Z.-L., Shirai, K,, Kanekatsu, R., Kiguchi,
phagocytosis of the dead cells produced by K., Kobayashi, Y., Taguchi, M., and Watanabe, H.
necrosis after irradiation. (1999b) J Smic. &.i Jpn� 68, 491-500.
On the other hand, the irradiated organs of day 3) AkaiH.,andSatoS.(1971)J-TnseetPhvsioI
6 larvae showed actively proliferating features. 17,1665-167&
The organs are composed of free hemocyte ad 4) Han, S.-S., Lee, M.-H., Kim, W.-K, Wago, H.,
typical ilets in which there are many immature and Yoe, S.-M. 1998) Zool S. 15, 371-379.
or mature hemocytes. In addition, the organs are
again surrounded by acellular sheath (Fig.2), and
- 78 -
JAERI-Review 2002-035
Fig. The hemopoiedc organ of 5th instar day 2 larva which has been irradiated with carbon ions (100
Gy) at the 4th instar premolting stage. Most cells show typical features of melt-necrosis. Note that there
are a few cellswith normal morphology in the organ. Scale bar =7 p m
Fig. 2 The hemopoietic organ of 5th instar day 6 larva which has been irradiated with carbon ions (100
Gy) at the 4th instar premoltmg stage. The organ is filled with many cells and surrounded with acelular
sheath, suggesting that regeneration occurs after the irradiation. Scale bar =5,u m
- 79 -
JAERI-Review 2002-035
2.22 Mechanism of Bystander Effect Induced by Precise-Numbered Heavy Ions
Y. urusawa*, C. Sao*, M. Aoki*, S, Wada", T_ Fultayarna", and Y.KobayashiHeavy Ion Radioblology Research Group, NIRS , Department of RdiationResearch for Environment and Resources, JAERI **
1. Introduction a GI -phase arrest, in the confluent humanConsiderable evidences have recentiv been fibroblast cell population exposed to a particles
accumulated in support of the xstence of a with a very low dose, and these expressions"bystander effect" which cells having received were effectively educed when GJIC wasno irradiation show biological consequences inhibited bv uldat)J.from their neighbor irradiated cells, Previously Therefore, two derent manifestations,studies have shown tat the number of sister medium-derived factors aiad GJIC, of a radia-chromatid exchange (SCE) in fibroblast cells tion-induced bystander effect have previouslygreatly exceeded the statistical umber of te been demonstrated. However, it is largely un-cells having sustained a traversal by an a known which one has a dominative role orparticle track'). It has been reported that some whether they just have a parallel role in thesoluble factors, such as reactive oxygen species bystander effect. With present study, it was(ROS) and transfortning growth factor I TGF- believed that GJIC likely played an essentialPI), generated from irradiated cells were invol- role, although ROS also had an obvious effect,ved in the medium-mediated bystander effect. in the radiation-induced bystander effect byROS might also contribute to the mutation using PMA to inhibit GJIC and using DMSO toproduction when te cyto lasm of mammalian scavenge ROS,cell was irradiated by precise urnberod x-particles 2). Most recently, we ound that nitric 2, Experimentaloxide could be released froin irradiated HSG 2.1 Cell Culture and Treatmentscells so that plating efficiency and cell AG1522 uortnal hirinati-diplold skin fibro-proliferation were increased as well tat blasts urcha sed font the Coriell Cell Reposi-micromicleus (MN) was induced in arurradiated tories were Cultured at 37'C in humidified
S3,4)� C02neighbor cell atmosphere of 95% air ad 5% withOn the other harld, a lot of evidences Eagle7s inimum ssential medium (E-MEM '
showed that gap junctionat ntorcellular comirill- Sigma 5650) supplemented with 20 mM L_nication (GJIC) was an iportant mediator to Glutamin ad 18% ftal vine serum (FBS,radiation-induced bystander offeu, The bk Lenexa ps 1,00 4ghril treptomycin and 100researches concerning bystander effect are in the Ututs/ml Penicillin. Cells destined for heavy-ionsfield of gene terapy of which tile gne product irradiation were seeded in 35 ilim plastic dishesof transfected DNA call travel tough gap wine 85 [un-thick replaceable Kapton filmjunction from tajisfecled cells to neighboring bottotus at a density of 2x 1 05 cells per dish 4cells. RecentIv, cell-cell communication has days before irradiation and were fed on the daysbeen thought to be rlevant to radiation-induced 2. At te time of rradiatio te cells were in fulleffect. Cells with mictocolonies where cell-cell confluence, n §oine flasks, cell culture mediuminteractions occurred were demonstrated to be was changed wth that ontaining 10-9 M PMAmore sensitive than single cells when they were (4p, 9a, 12P, 13a, 20-pentahydroxytiglia-1, 6-irradiated with a dose less than 2 Gy. With a dien-3-one 12p-myristate 13-acetate., 10-6 Mthree-dimensional tissue culture model, it was prepared in DMSO I h bfore irradiation; inalso proved that GJIC played a role in this case, 0.1% DMSO was contained in theenhancing cell damage and so reducing the culture medium. As a control of the PMAsurvival of unirradiated neighbor V79 cells. In treatment, the culture medium was replaced withaddition, Azzam et al found that TP53 and one containing 01% of DMSO 'M some flasksCDKNIA were over expressed, associated with also I h before irradiation.
- 8 -
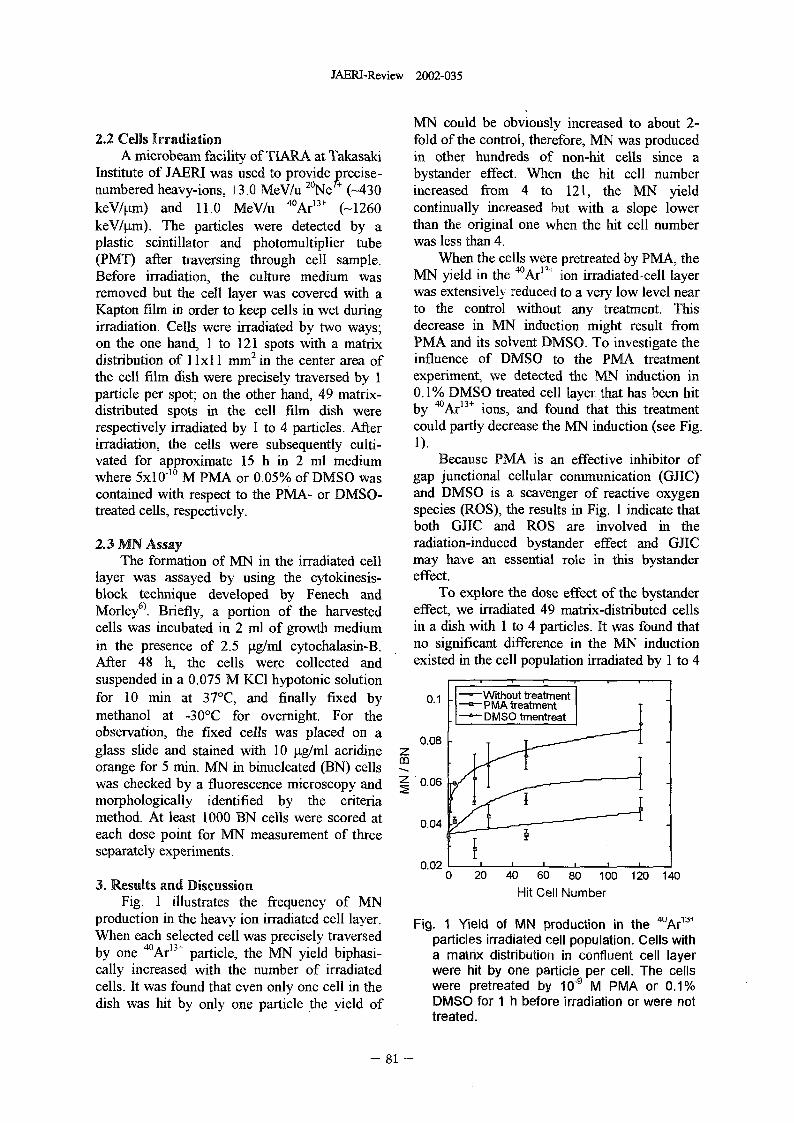
JAERI-Review 2002-035
NIN could be obviously increased to about 2-2.2 Cells Irradiation fold of the control, therefore, NM was produced
A mrobeam. facility of TURA at Takasaki in other hundreds of non-hit cells since aInstitute of JAERI was used to provide precise- bystander effect. When the hit cell numbernumbered heavy-ions, 13.0 NeV/U 2Ne7+ (-430 increased from 4 to 12 1, the NIN yield_keV/[tm) and I 1.0 MeV/U 4Ar 13+ (-1260 continually increased but with a slope lowerkeV/Iim). The particles were detected by a than the original one when the hit cell numberplastic scintillator and photomultiplier tube was less than 4.(PMT) after traversing through cell sample. When the cells were pretreated by PNIA, theBefore irradiation, the culture medium was MN Yield in the 4Arl!-� ion irradiated-cell layerremoved but the cell layer was covered with a was extensively reduced to a very low level nearKapton film in order to keep cells in wet during to the control without any treatment. Thisirradiation. Cells were irradiated by two ways; decrease in MN 'induction might result fromon the one hand, I to 121 spots with a matrix PMA and its solvent DMSO. To investigate the
2 distribution of I I x I I mm in the center area of influence of DMSO to the PNM treatmentthe cell film dish were precisely traversed by I experiment, we detected the NIN induction inparticle per spot- on the other hand, 49 matrix- 0.1% DMS 0 treated cell layer that has been hitdistributed spots in the cell film dish were by 4Ar"+ ions, and found that this treatmentrespectively irradiated by I to 4 particles. After could partly decrease the N induction (see Fig.irradiation, the cells were subsequently culti- 1).vated for approximate 15 h in 2 ml medium Because PMA is an effective inhibitor ofwhere 5xlO-I M PMA or 0.05% of DMSO was gap junctional cellular communication (GJIC)contained with respect to the PMA- or DMSO- and DMSO is a scavenger of reactive oxygentreated cells, respectively. species (ROS), the results in Fig. I indicate that
both GJlC and ROS are 'involved in the2.3 MN Assay radiation-induced bystander effect and GJlC
The formation of MN in the irradiated cell may have an essential role in this bystanderlayer was assayed by using the cytokinesis- effect.block technique developed by Fenech and To explore the dose effect of the bystanderMorley6). Briefly, a portion of the harvested effect, we irradiated 49 matrix-distributed cellscells was cubated in 2 ml of growth medium in a dish with I to 4 particles. It was found thatin the presence of 25 4g/ml cytochalasin-B. no significant difference in the MN inductionAfter 48 h, the cells were collected and existed in the cell population irradiated by I to 4suspended in a 0075 M KCI hypotonic solutionfor 10 min at 37'C, and finally fixed by 0.1 - Withouttreatmen- PMA treatmentmethanol at 30'C for overnight. For the DMSO tmentreatobservation, the fixed cells was placed on a 0.08glass slide and stained with 10 �Lg/ml acridine zorange for in. MN in biucleated (BN) cellswas checked by a fluorescence microscopy and Z 0.06morphologically identified by the criteriamethod. At least 1000 BN cells were scored at 0.04each dose point for MN measurement of threeseparately experiments.
0.023. Results and Discussion 0 20 40 60 80 100 120 140
Fig. I illustrates the frequency of NN Hit Cell Number
production in the heavy ion irradiated cell layer. Fig. 1 Yield of MN production in the 4uArl�'+When each selected cell was precisely traversed particles irradiated cell population. Cells withby one 4'Ar 131 particle, the NIN yield bphasi- a matrix distribution in confluent cell layercally increased with the number of irradiated were hit by one particle per cell. The cellscells. It was found that even only one cell the were pretreated by 10-9 M PMA or 0.1%dish was hit by only one particle the yield of DMSO for h before irradiation or were not
treated.
- 8 -
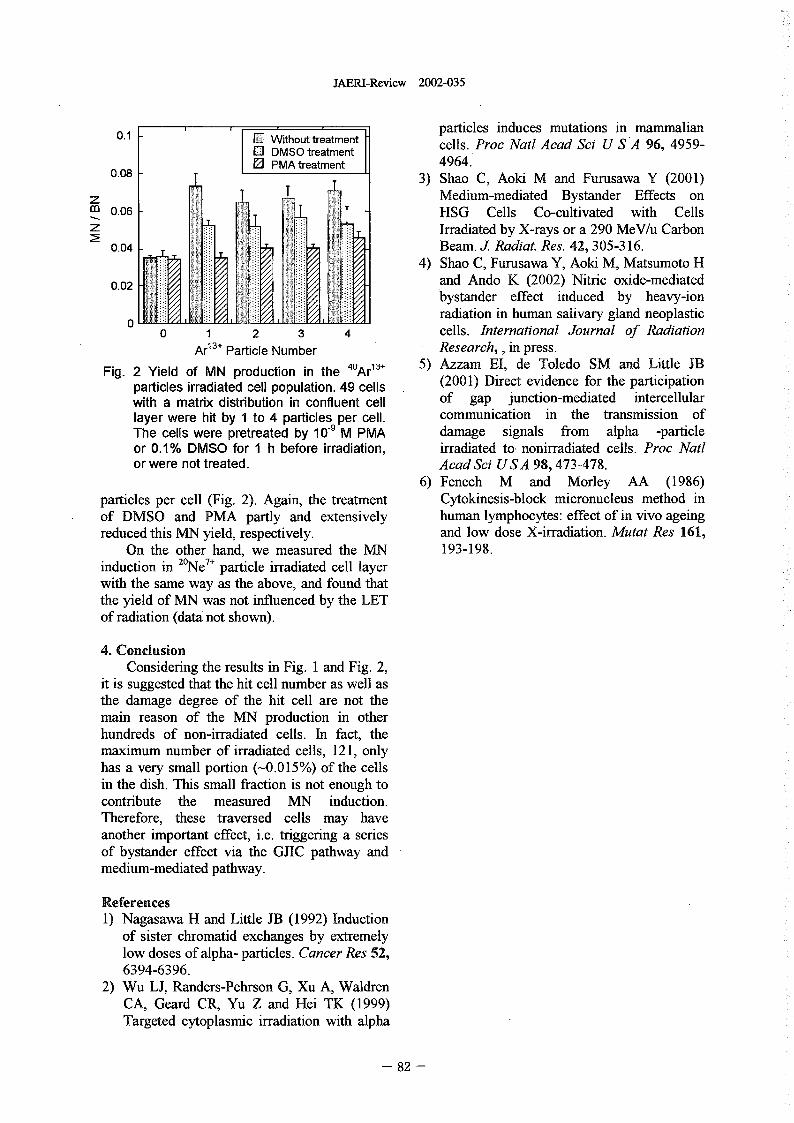
JAERI-Review 2002-035
0.1 ED Without treatment particles induces mutations in mammalianEl DIVISO treatment cells..Proc Nat! Acad Sci U SA 96, 4959-
0.0 - PMA treatment 4964.3) Shao C, Aoki M and Furusawa Y 2001)
z Medium-mediated Bystander Effects on0.06 HSG Cells Co-cultivated with Cells
z Irradiated by X-rays or a 290 MeV/u Carbon0.04 Beam. J. Radiat. Res. 42 3 5 -3 16.
4) Shao, C, Furusawa Y, Aoki M, Matsumoto H
0.02 and Ando, K 2002) Nitnc oxide-mediatedbystander effect nduced by heavy-ionradiation in human salivary gland neoplastic
00 1 2 3 4 cells. International Journal of Radiation
Ar'3+ Particle Number Research, in press.Fig. 2 Yield of MN production in the 4uAr':'� 5) Azzam El, de Toledo SM and Little JB
particles irradiated cell population. 49 cells (2001) Direct evidence for the participationwith a matrix distribution in confluent cell of gap junction-mediated intercellularlayer were hit by to 4 particles per cell. communication in the transmission ofThe cells were pretreated by 10 -9 M PMA damage signals from alpha -particleor 0.1% DMSO for h before irradiation, irradiated to. nonirradiated cells. Proc Natlor were not treated. AcadSci USA 98,473-478.
6) Fenech M and Morley AA (1986)particles per cell (Fig. 2 Again, the treatment Cytokinesis-block micronucleus method inof DMSO and PMA partly and extensively human lymphocytes: effect of in vivo ageingreduced this MN yield, respectively. and low dose X-irradiation. Mutat Res 161,
On the other hand, we measured the NIN 193-198.induction in 2ONe7' particle irradiated cell layerwith the same way as the above, and found thatthe yield of MN was not influenced by the LETof radiation (data not shown).
4. ConclusionConsidering the results in Fig. I and Fig. 2,
it is suggested that the hit cell number as well asthe damage degree of the hit cell are not themain reason of the MN production in otherhundreds of non-irradiated cells. In fact, themaximum number of iradiated cells, 121, onlyhas a very small portion (-0.015%) of the cellsin the dish. This small fraction is not enough tocontribute the measured MN induction.Therefore, these traversed cells may haveanother important effect, i.e. triggering a seriesof bystander effect via the GJIC pathway andmedium-mediated pathway.
References1) Nagasawa H and Little JB 1992) Induction
of sister chromatid exchanges by extremelylow doses of alpha- particles. Cancer Res 52,6394-6396.
2) Wu LJ, Randers-Pehrson G, Xu A, WaldrenCA, Geard CR, Yu Z and Hei TK 1999)Targeted cytoplasr'c irradiation with alpha
- 82 -
JAERI-Review 2002-035
2.23 The Effect to Mammalian Nucleus by Irradiation of
Heavy Ion Beams.
S.Wada*,**, M.Natsuhori*, N.Ito*YKobayashi** T.Funayama**, K.Yamamoto**Department of Veterinary Medicine, Kitasato University*Biotechnology Lab., JAERl- Takasakl**
I.Introduction methods. To estimate the number ofIn space environment high LET ions traversing cells and to evaluate
heavy ions at low fluence are a the radiation damage induced by onecomponent of cosmic rays. Extended or precise number of ions, wemission above atmosphere of the earth established the method ofput humans at an inherent risk due to simultaneous detection of ionsexposure to cosmic rays. For cells traversing the cellular nuclei andexposed to high LET heavy charged DNA damage in the individual cells.particles DNA double strand breaks We compared the number of ions(dsbs) have an important role in traversing the cell and the DNAbiological effects. Adequate damage detected with the comet assay.assessment of this risk will lead to animproved understanding of the 2.Materials and methodsbiological response to heavy ion CHO-KI cells were grown in Ham'sradiation. At present there are many F12 medium supplemented with 10%studies with regard to the serum (Nichirei, Tokyo) and 0.1measurements of DNA dsbs induced mg/ml kanamaycin in 10 cm diameterby the heavy ions that deposit energy culture dishes. Cells were incubatedat very high LET. Previously the at 37C in humidified atmosphere ofclassical sucrose gradient 5% carbon dioxide and 95% air.centrifugation method was used for Cells were harvested after incubat-detection of DNA dsbs. Recently filter ing for 12 hr with medium containingelution, conventional electrophoresis I mM Hydroxyurea. Then cells wereand pulsed-field gel electrophoresis attached on the CR-39 plate that iswere used. The quantitative analysis'of particle track detector. Acceleratedevery approach relies on the heavy ion of 17.3 MeV/u 12CI+, 15.7assumption that ions hit randomly to MeV/u 2'Ne'+, 10.4 MeV/U 2Ne 7+ andthe cells and Poisson statistics was 6.9 MeV/u "Ar"+ were provided byapplied. However the biological effect the AVF cyclotron at TIARAof one charged particle to cell can not JAERI-Takasaki.be calculated with the analysis of these Immediately After irradiation the
- 83 -
JAERI-Review 2002-035
CR-39 plate on the which cells were stored using CCD camera. Becauseattached was placed in chilled PBS. the area of cellular nucleus was iden-The CR-39 was placed on the slide tified with the area of high fluorescentglass and then was embedded in 1% intensity of comet image, the numberagarose-LGT GP-42 (Nacalai Tesque, of ions traversing individual cellularKyoto, Japan). Finally 100 [tl of 1% nuclei was counted by merging bothagarose GP-42 (Nacalai Tesque, images. The comet image was ana-Kyoto, Japan) was quickly layered. lyzed using a Komet software (KometThe slide glasses were placed imme- 4.0, Kinetic imaging, LTD, UK). Thediately in a chilled nucleus lysing so- parameter used as an index of DNAlution pH 10 of 25 M NaCl, 100 damage was tail moment, which com-mM Na2EDTA, 1% sarkosyl, 10% bines a measure of the length ofDMSO, and 1% Triton X100 and kept comet tail and the proportion of DNAat 4C in the dark for 60 min. Under to migrate into the tail.the neutral condition for comet assaythe slides were placed on a horizontal 3.Result and Discussiongel electrophoresis platform and cov- The number of ions traversing theered wish chilled neutral solution cellular nuclei and DNA damage inmade up of 90 mM Tris 2 mM the individual cells was detectedNa2EDTA and 90 mM boric acid (pH simultaneously. The DNA damage8) for I hour. Electrophoresis was induced in the heavy ion irradiatedconducted at 4C in dark for 30 min cells was detected by comet assay.at 25 V 0.89 V/cm). The comet image of cell attached onThe slide glasses were wash with the CR-39 was observed using
300 mM NaOH and I mM Na2EDTA fluorescence microscope. Moreover,and then rinsed gently with OmM the image of etched ion pits wasTris (pH 75 to neutralize the excess observed at the opposite side of cellsalkali. After air drying the CR-39 attached on the CR-39 by changingplate was take off from the slide glass. the focus. When both images werethe agarose gel on the CR-39 was merged, the number of pits etched wasstained with 50[tl of 0.4[tg/ml detected on the area of cellular nucleiethidium bromide- and the opposite that is the area of high fluorescentside of the CR-39 plate was etched intensity of the comet image. Thus thewith KOH-ethanol solution at 370C. number of ions traversing the cellularUsing a fluorescence microscope nuclei can be estimated.equipped with a green filter (Olympus, DNA dsbs induced by heavy ionTokyo) we examined about cells on irradiation was evaluated as tailone slide at 400 magnification. The moment that generally used forcomet image was stored using CCD evaluating DNA damage with cometcamera. Then the microscope was fo- assay. Tail moment increased with thecused on the image of pits etched on number of ions traversing the cellularthe CR-39, and the image was also nuclei. Fig. I shows the relationship
- 84 -
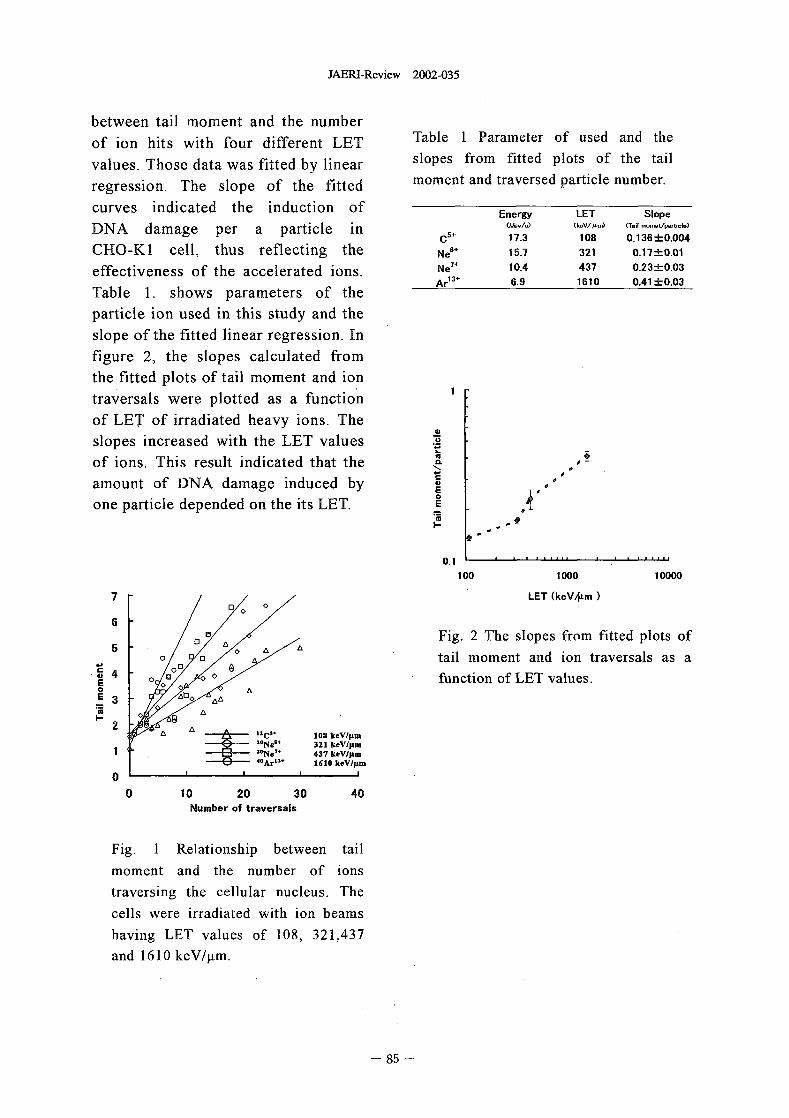
JAERI-Review 2002-035
between tail moment and the numberof ion hits with four different LET Table I Parameter of used and thevalues. Those data was fitted by linear slopes from fitted plots of the tailregression. The slope of the fitted moment and traversed particle number.
curves indicated the induction of Energy LET Slope
DNA damage per a particle in 5. (W�/U) (k.V/110 Mil -- t/pftid.)
C 17.3 108 0.136:LO.004CHO-KI cell, thus reflecting the Ne" 15.7 321 0.17.hO.01
effectiveness of the accelerated ions. Ne 7- 10.4 437 0.23-LO.03Ar 13- 6.9 1610 0.41 -LO.03
Table 1. shows parameters of theparticle ion used in this study and theslope of the fitted linear regression. Infigure 2 the slopes calculated fromthe fitted lots of tail moment and iontraversals were plotted as a functionof LET of irradiated heavy ions. Theslopes increased with the LET values -5
'Eof ions. This result indicated that the 0
C 0amount of DNA damage induced by e 0E0one particle depended on the its LET. E
M
0.1100 1000 100007 LET (keV*m
6
5 Fig. 2 The slopes from fitted plots of'I moment and 'on traversals astal 1
41
5 4E 0 function of LET values.0E 3
"C3' 108 keV/lLm.ONO' 321 keV/pm2ONC7. 437 keV/pm4. Ar13- 1610 keV/pm
0 I
0 10 20 30 40Number of traversals
Fig. I Relationship between tailmoment and the number of ionstraversing the cellular nucleus. Thecells were irradiated with ion beamshaving LET values of 108, 321,437and 16 0 keV/Rm.
8 -
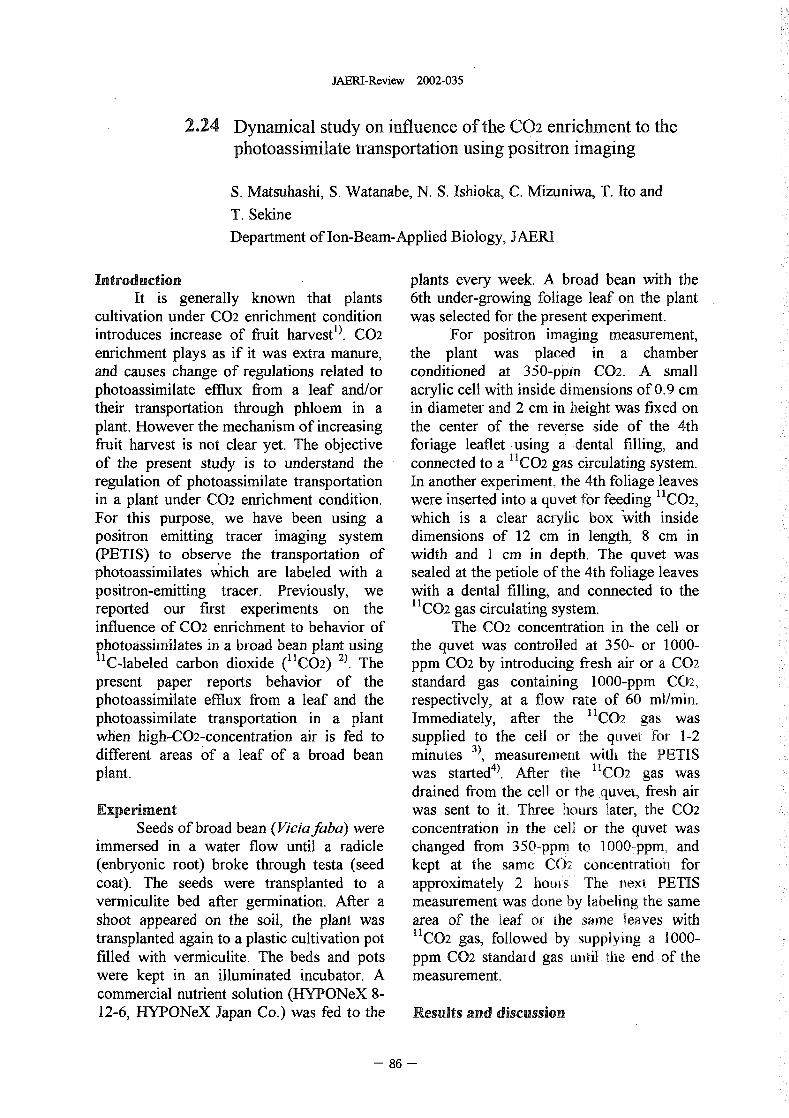
JAERI-Review 2002-035
2.24 Dynamical study on influence of the C02 enrichment to thephotoassi-Milate transportation using positron imaging
S. Matsuhashi, S. Watanabe, N. S. Ishioka, C. Mizuniwa, T. Ito and
T. SekineDepartment of on-Beam-Applied Biology, JAERI
Introduction plants every week. A broad bean with theIt is generally known that plants 6th under-growing foliage leaf on the plant
cultivation under C02 enrichment condition was selected for the present experiment.introduces increase of fuit harvest'). C02 For positron imaging measurement,enrichment plays as if it was extra manure, the plant was placed in a chamberand causes change of regulations related to conditioned at 350-ppM C02 A smallphotoassimilate eux from a leaf and/or acrylic cell with inside dilliensions of 0.9 cmtheir transportation through phloem in a in diameter and 2 cm in height was fixed onplant. However the mechanism of increasing the center of the reverse side of the 4thfruit harvest is not clear yet. The objective foriage leaflet -using a dental filling, andof the present study is to understand the connected to a "CO2 gas circulating system.regulation of photoassimilate transportation In another experiment, the 4th foliage leavesin a plant under C02 enrichment condition. were inserted into a quvet for feeding 11 C02,
For this purpose, we have been using a which is a clear acrylic box 'With insidepositron emitting tracer imaging system dimensions of 12 cm in length, cm in(PETIS) to observe the transportation of width and I cm in depth. The quvet wasphotoassimilates hich are labeled with a scaled at the petiole of the 4th foliage leavespositron-emitting tracer. Previously, we with a dental filling, and connected to thereported our first experiments on the "CO2 gas circulating system.influence of C02 enrichment to behavior of The C02 concentration in the cell orchotoassfirillates in a bi-oad bean plant using the quvet was controlled at 350- or 1000-'C-labeled carbon dioxide CO2 2 The ppM C02 by introducing fresh air or a C02
present paper reports behavior of the standard gas containing 1000-ppM C02,
photoassimilate eux from a leaf and the respectively, at a flow rate of 60 ml/min.photoassimilate transportation in a plant Immediately, after the 11CO2 gas waswhen high-C02-concentration air is fed to supplied to the cell or the quvet for 12different areas of a leaf of a broad bean minutes 3) , measurement with the PETISplant. was started 4) . After tile 11CO2 gas was
drained from the cell or the quvet, fresh airExperiment was sent to it. Three hours later, the C02
Seeds of broad bean (Viciafaha) were concentration in the cell or the quvet was
immersed in a water flow until a radicle changed from 350-ppm to 1000-ppm, and
(embryonic root) broke through testa (seed kept at the same C2 concentration for
coat). The seeds were transplanted to a approximately 2 os, The next PETIS
vermiculite bed after germination. After a measurement was done by labeling the same
shoot appeared on the soil, the plant was area of the leaf or the same leaves with
transplanted again to a plastic cultivation pot 11CO2 gas, followed by supplying a 000-
filled with vermiculite. The beds and pots ppM C02 standard gas ui)tll the end of the
were kept in an illuminated incubator. A measurement.
commercial nutrient solution (HYPONeX 8-
12-6, HYPONeX Japan Co.) was fed to the Results and discussion
86 -
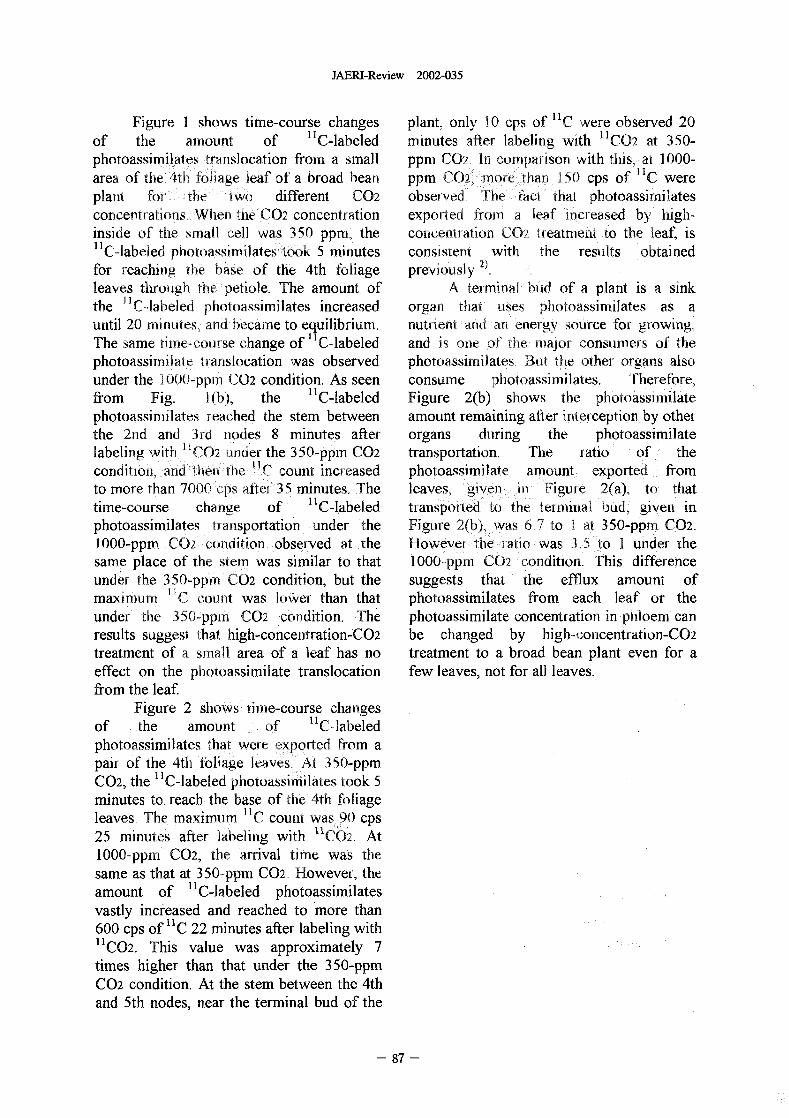
JAERI-Review 2002-035
Figure I shows time-course changes plant, only 10 cps of 'IC were observed 20of the airrount of "C-labeled minutes after labeling with 11CO2 at 350-photoassimilates trarislocation from a small ppM C02, In comparison with this, at 1000-area of the 4th foliage leaf of a broad beat) ppm C02, ore tan 150 cps of IC wereplant for tile two different C02 observed. The fact that photoassimilatesconcentrations When the C02 concentration exported front a leaf increased by hgh-
inside of te small cell was 350 ppm, the concentration C02 treatment to the leaf, is
"C-labeled photoassimilates took mutes consistent with the results obtained
for reaching the base of the 4th foliage previously ).
leaves thirough the petiole. The amount of A terminal bud of a plant is a sink
the "C-labeled pot6assimilates increased organ tat ss photoassimilates as a
until 20 minutes, and bcame to equilibrium. nutrient and a energy source for growing,
The same time-course change of C-labeled and is one of the ajor consumers of the
photoassimilate translocation was observed photoassirnilates. But the other organs also
under the I 000-ppm C02 condition. As seen consume photoassimilates. Therefore,
from Fig. I (b), the "C-labeled Figure 2(b) shows te ph6toassirnilate
photoassimilates reached the stem between amount remaining after nterception by other
the 2nd and 3rd odes minutes after organs during the photoassimilate
labeling with 1 'CO2 under the 3 50-ppm C02 transportation. The ratio of the
coriditi6fi, and then the 'IC count increased photoassimilate amount exported from
to ore than 7000 cps after 35 minutes. The leaves, given in Figure 2(a), to that
time-course change of "C-labeled transported the terminal bud gve in
photoassimilates transportation under the Figure 2(b), was 67 to I at 350-ppm C02.
1000-ppm C02 condition observed at the However te ratio was 35 to I under the
same place of te stem was similar that 1000-ppni C02 condition. This difference
under the 350-ppm C02 condition, but the suggests that the efflux amount of
maximurn 11C count was lower than that photoassimilates from each leaf or the
under the 350-ppi-n C02 condition. The photoassimilate concentration in phloem can
results suggest tat high-concentration-CO2 be changed by higb-concentration-CO2
treatment of a sinall area of a leaf has no treatment to a broad bean plant even for a
effect on the photoassimilate translocation few leaves, not for all leaves.
from the leaf
Figure 2shOws time-course changes
of the amount of "C-labeled
photoassimilates that were exported from a
pair of the 4th foliage leaves. At 350-ppm
C02, the C-labeled photoassl6rilates took
minutes to reach the base of the, 4th foliage
leaves, The maximum 'IC count was 90 cps
25 minutes after labeling with IIC02 At
1000-ppill C02, te arrival time was te
same as that at 350-ppm C02. However, the
amount of C-labeled photoassimilates
vastly increased and reached to more than
600 cps of 11 C 22 minutes after labeling with
11CO2. This value was approximately 7
times higher than that under the 350-ppm
C02 condition. At the stem between the 4th
and 5th nodes, near the terminal bud of the
- 87 -
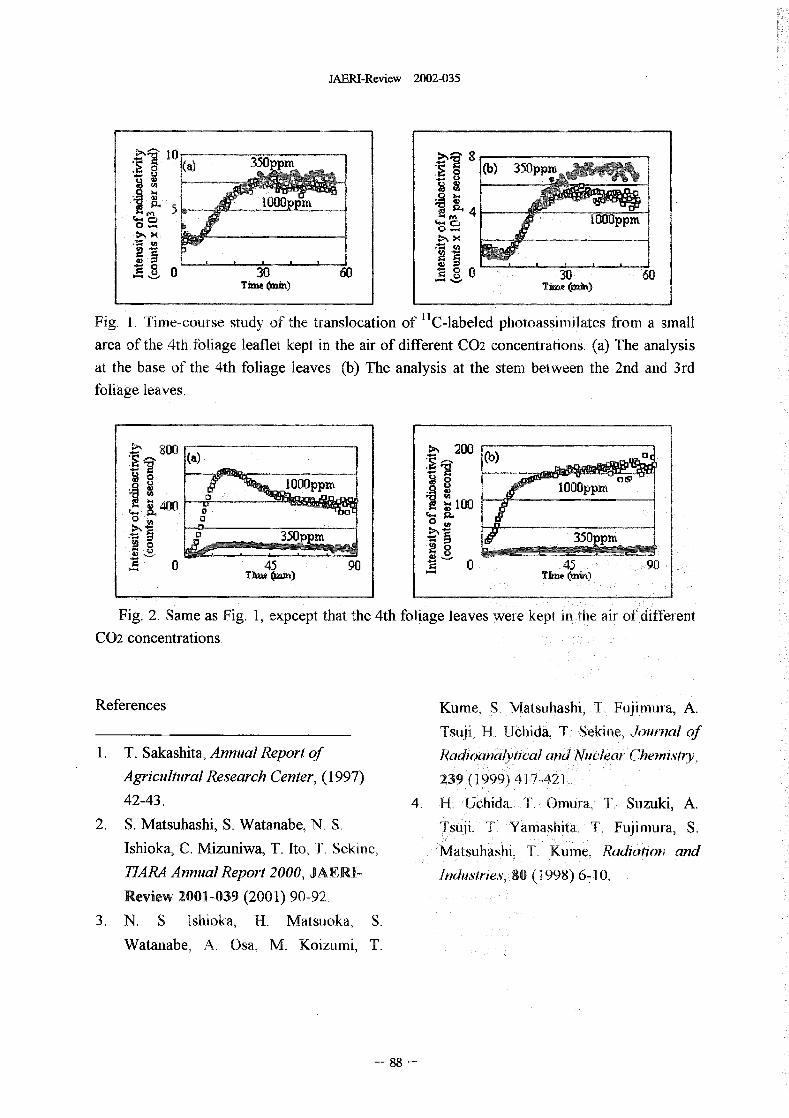
JAERI-Review 2002-035
to 350 8t (a) q (b) 350ppm
U
5 IL 410 0
0 L------7i -E30 60 0 30 60
Ttme Onift) Time Oxin)
Fig. 1. Time-course study of the translocation of "C-labeled photoassimilates from a small
area of the 4th foliage leaflet kept in the air of different C02 concentrations. (a) The analysis
at the base of the 4th foliage leaves. (b) The analysis at the stem between the 2nd and 3rd
foliage leaves.
800 >� 200�Sj (a) t (b)
jj 0
400 IOU0
350
0 45 90 0 45 90Thb* �wm) Thu* Onin)
Fig. 2 Same as Fig, 1, expcept that the 4th foliage leaves were kept in the air of different
C02 concentrations.
References Kume, S, Matsuhashi, T. F 'imura A.Ui
Ts 'i, H. Uchida, T, Sekme, Journal ofUJ
1. T. Sakashita, Annual Reporf of Radi(atOyfica ad Nuclear Chemistry,
Agricultural Research Cenfer, (I 997) 239 1999) 417-421.
42-43. 4. K Uchida, T. Omura, T. Szuki A.
2. S. Matsuhashi, S. Watanabe, N. S. T 'i, Y Yarnashita, T, Fjimura S.SUJ
Ishioka, C. Mizuniwa, T. Ito, T. Sekine, Matsubashl, T, Kume, Radiation and
TIARA Annual Report 2000, JAERI- Indiisiries, 80 1998) 6710-
Review 2001-039 2001) 90-92,
3. N. S. shioka, H. Matsuoka S.
Watanabe, A, Osa, M. Koizurni T.
8 -
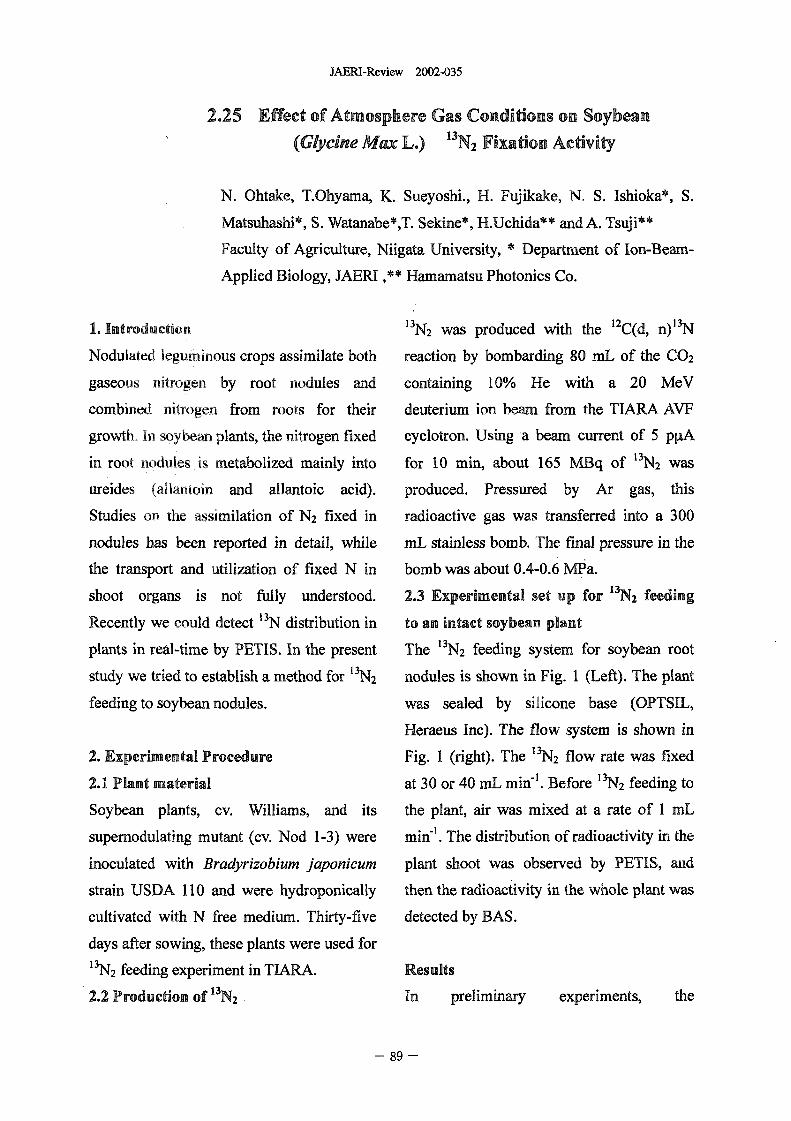
JAERI-Review 2002-035
2.25 Effect of Atmosphere Gas Conditions on Soybean
(Glycine Max L.) 13 N2flxation Activity
N. Ohtake, T.Ohyania, K. Sueyoshi., H. Fujikake, N. S. Ishioka* S.
Matsuhashi*, S. Watanabe*j. Sekine*, H.Uchida* * and A. Tsuu'l* *
Faculty of Agriculture, Niigata University, Department of on-Beam-
Applied Biology, JAERI , Hamamatsu Photonics Co.
I1. IntroductioR I3N2 was produced with the "C(d, n)'3N
Nodulated leguminous crops assimilate both reaction by bombarding 80 niL of the C02
gaseous nitrogen by root nodules and containing I 0% He with a 20 MeV
combined nitrogen from roots for their deuterium ion beam from the TIARA AVF
growth. In soybean plants, the nitrogen fixed cyclotron. Using a beam current of pRA
in root nodules is metabolized mainly into for 10 min, about 165 Bq of 13 N2 was
ureides (allantoin and allantoic acid). produced. Pressured by Ar gas, this
Studies on the assimilation of N2 fixed in radioactive gas was transferred into a 300
nodules has been reported in detail, while mL stainless bomb. The final pressure in the
the transport and utilization of fixed N in bomb was about 04-0.6 NVa.
shoot organs is not fully understood. 2.3 Experimental set up for 13 N2 feeding
Recently we could detect 3N distribution in to an intact soybean plant13plants in real-time by PETIS. In the present The N2 feeding system for soybean root
study we tried to establish a method for 13 N2 nodules is shown in Fig. I (Left). The plant
feeding to soybean nodules. was sealed by silicone base (OPTSIL,
Heraeus Inc). The flow system is shown in
2. Experimental Procedure Fig. (right). The N2 flow rate was fixed
2.1 Plant material at 30 or 40 niL nin-'. Before N2 feeding to
Soybean plants, cv. Williams, and its the plant, air was mixed at a rate of I niL
supernodulating mutant (cv. Nod 13) were min-'. The distribution of radioactivity in the
inoculated with Bradyrizobium japonicum plant shoot was observed by PETIS, and
strain USDA 110 and were hydroponically then the radioactivity in the whole plant was
cultivated with N free medium. Thirty-five detected by BAS.
days after sowing, these plants were used for
13N2 feeding experiment in TIARA. Results
2.2 Production of 13 N2 In preliminary experiments, the
89 -
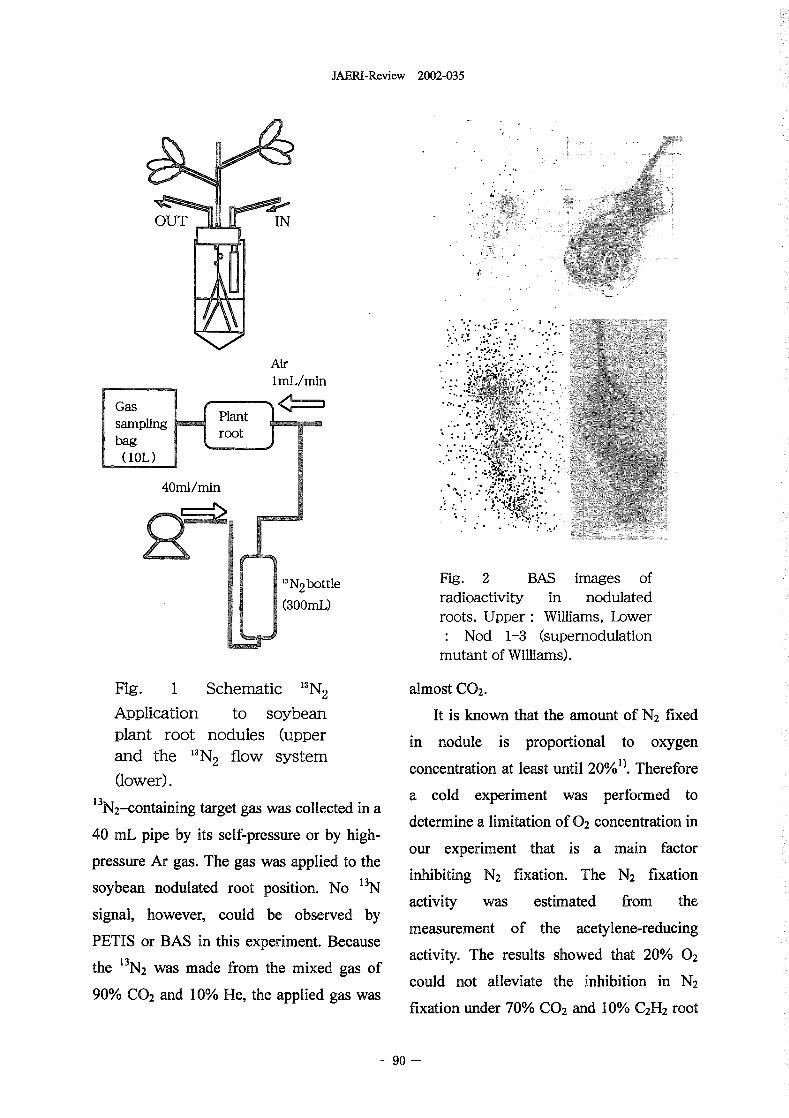
JAERI-Review 2002-035
�Q'IN
AirImL/min
GasPlantsamplingrootbag
(10L)
40ml/min
IIN2bottle Fig. 2 BAS images of(3OOmL) radioactivity in modulated
roots. Upper: Williams, Lower: Nod 13 (supernodulation
mutant of Williams).
Fig. I Schematic 1N2 almost C02.
Application to soybean It is known that the amount of N2 fixed
plant root nodules (upper in nodule is proportional to oxygen
and the N2 flow system concentration at least until 20%1). Therefore(lower).
13 N2-containing target gas was collected in a a cold experiment was performed to
40 mL pipe by its self-pressure or by high- determine a limitation Of 02 concentration in
pressure Ar gas. The gas was applied to the our experiment that is a main factor
soybean odulated root position. No 13N inhibiting N2 fixation. The N2 fixation
signal, however, could be observed by activity was estimated from the
PETIS or BAS in this experiment. Because measurement of the acetylene-reducing
the 13 N2 was made from the mixed gas of activity. The results showed that 20 02
90% C02 and 10% He, the applied gas was could not alleviate the inhibition in 2
fixation under 70% C02 and IO% C21-12 root
- 90
JAERI-Review 2002-035
atmosphere condition, We supposed that the the logical assumption that it would be inert
presence of high-concentration C02 might in the nitrogen-fixing reaction�). Nowadays
disturb nitrogen fixation directly or the phenomenon has been recognized that
indirectly. The root environmental gas H2 inhibits N2 fixation in an ordered
changed into C02, including 10% C2112 for sequential reaction in which H2 binds to3)fixation assay, led complete inhibition of N2 nitrogenase before N2 bind On the other
fixation. By investigating optinitim had, there are few reports about negative
conditions for N2 fixation with the presence C02 effect on the nitrogen fixation to our
Of C02, N2 fixation was found to recover to knowledge. Further experiment was
about 60% of the maximum activity by necessarily to improve the 'N2 supplying
replacing IO% of the gas with air. method for soybean nodules without
From the results obtained above, the inhibition of nitrogenase.
present experiment was designed as
described in Experimental Procedure. In this References
procedure, te irradiated target gas (80 niL) 1) Ohyama T. and Kumazawa K., 1979. Soil
was diluted 5 7 times by Ar. When the Sci. Plant Nutri. 25 919.
mixed gas was supplied to a plant 40 mL 2) Wilson P. W., 1940. Madison, Wis.
min-'), air was also supplied at I niL min-'. (USA): University of Wisconsin Press.
Using this method 13N accumulation in 3) Guth J. H., Burris R. H., 1983.
nodules could be visualized as a BAS image Biochemistry 22: 511-5122.
(Figure 2 while that in a plant shoot could
not still be detected by PETIS.
Discussion
Symbiotic relationship between legume crop
and rhizobia has been studied for a long time.
Wilson 1940) first reported the effect of
environmental gas condition on nitrogen
fixation activity. He showed that the pN2
supporting half-maximum fixation was
about 0.05 atm. N2- In this experiment,
helium was used as dilution gas to bring the
pressure in the bottle to one atmosphere,
while hydrogen was used as dilution gas on
JAERI-Review 2002-035
2.26 Absorption and transfer of the iron Fe) in the ironabsorption maize mutant ysl'T. Tsukarnoto*, S. Kiyomiya*, H. Nakanishi*, H. Uchida***,S. Watanabe", N. Ishloka", S. Matsuhashi", T. Sekine**,and S. Mori*Department of Applied Biological Chemistry, The University of Tokyo*,Department of on-Beam-applied Biology, JAERII*,Central Research Laboratory, Hamamatsu Photonics K.K.***
1. Introduction graminaceous monocotsIron is required for many functions in
plants, including home and chlorophyll 2.Miterial and mthodsbiosynthesis, photosynthesis, and as a The maize (Zea mays L. v. Alice) yellowcomponent of iron-sulfur cluster containing stripe] (ys]) mutant which is defective in
yS 16enzymes. Although iron exists in large Fe(III)- MAs transporter ) and wildquantities in the environment, plants cannot type plants were grown hydroponically inabsorb iron easily in high pH soil because absence of iron fo 2 weeks afterof the low solubility of the oxidized form of germination.iron, Fe(OH)3. Therefore, plants have Figure I shows pictures of plants used indeveloped evolutionally efficient the experiment. In the ys] mutant, chlorosismechanisms of iron acquisition that are was observed for all the leaves other thandirected at solubilizing iron. As a the I st leaf.mechanism of this kind, grarninaceous The poduction and the radiochemicalmonocots release Fe(Ill)-chelating separation f 52 Fe(III) was carried out withcompounds, mugmeic acid family a method described by Watanabe et al.") Thephytosiderophore (MAs) into the separated 52Fe(lIl) was chelated with
rhizosphere. MAs solubilize inorganic deoxymugineic acids,
Fe(Ill)-compounds by chelation. The roots of a single plant were placed in
Very recently it was reported that the a polyethylene bag that contained 15 mL of
Fe(III)-MAs complexes are 'taken up culture solution without iron. 52Fe(Ill)-
through Fe(Ill)-MAs transporter 'YSI' in deoxymugineic acid (DMA) was supplied to
the root plasmamembrane.7) Although the the culture solution. We analyzed 2Fe
ability of YS I was shown in a gowth test absorption from roots using the PETIS
(comp lamentation) in a yeast iron uptake method.
mutant, and from the effect of Fe starvation
on ys] gene expression in maize roots, it is
not shown whether YS I works actually to
absorb Fe(Ill)- MAs in plants.
Here we used the positron-emitting 52 Fe,1-6, 8)
and, using the PETIS method, traced
the time-course of 52 Fe translocation in
maize plant, which is a family of
- 92 -
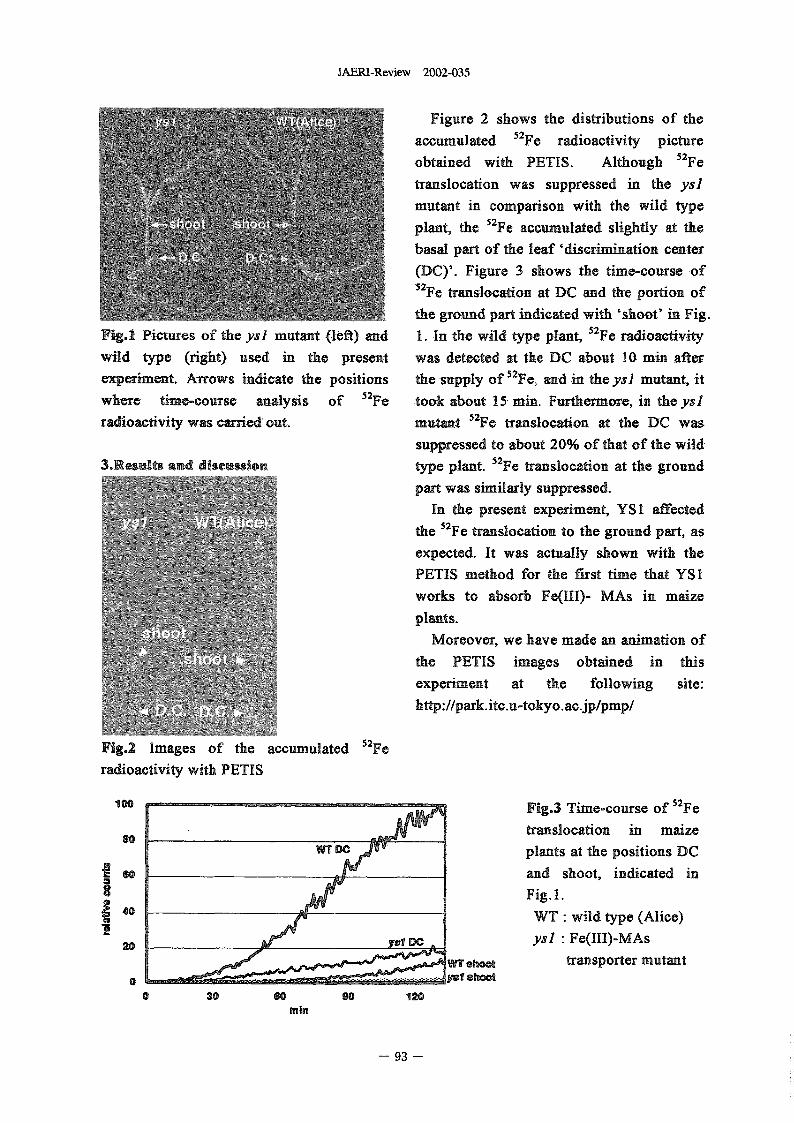
JAERI-Review 2002-035
Figure 2 shows the distributions of the
accumulated 52 Fe radioactivity picture
obtained with PETIS. Although 52 Fe
translocation was suppressed in the ys]
mutant in comparison with the wild type
plant, the 12 Fe accumulated sghtly at the
basal part of the leaf discrimination center
(DC)'. Figur 3 shows the time-course of
52 Fe translocation at DC and the portion of
the ground part indicated with 'sho0t' in Fig.
FiS.1 Pictures of the ys] mutant (left) and 1. In the wild type plant, 12 Fe radioactivity
wild type (right) used in the present was detected at the DC about 10 min after
experiment. Arrows indicate the positions the Supply Of 52 Fe, and in the ys] mutant, it
where time-course analysis of 52 Fe took about 15 min. Furthermore, in theys]
radioactivity was carried: out. mutant 52Fe translocation at the DC was
suppressed to about 20% of that of the wild
3.Results and discussion type plant. -2Fe translocation at the ground
part was similarly suppressed.
In the present experiment, YS I affected
the 52 Fe translocation to the ground part, as
expected. It was actually shown with the
PETIS method for the first time that YSI
works to absorb Fe(III)- MAs in maize
plants.
Moreover, we have made an animation of
the PETIS images obtained in this
experiment at the following site:
http://park.itc.u-tokyo.acjp/pmp/
Fig.2 Images of the accumulated 52 Fe
radioactivity with PETIS
100 Fig.3 Time-course of 52 Fe
so J ," translocation in maizeWT DC JOW plants at the positions DC
so and shoot, indicated in
Fig. .40 Ar WT: wild type (Alice)
20 Y61 DC ys] : Fe(III)-MAsWT show transporter mutant
0 W shoot
0 30 so go 120
min
- 93 -
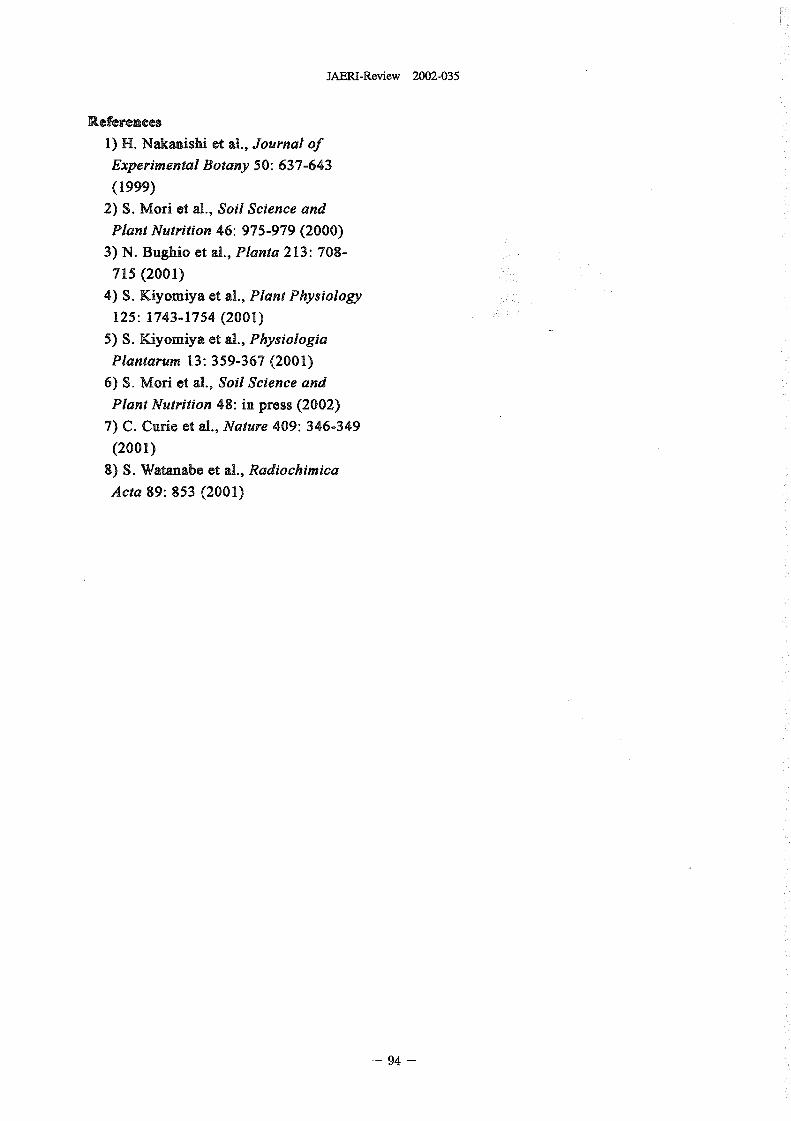
JABRI-Review 2002-035
References
1) H. Nakanishi et al., Journal of
Experimental Botany 50: 637-643
(1999)
2) S. Mori et al., Soil Science and
Plant Nutrition 46: 975-979 2000)
3) N. Bughio, et al., Planta 213: 708-
715 2001)
4) S. Kiyomiya et al., Plant Physiology
125: 1743-1754 2001)
5) S. Kiyomiya et al., Physiologia
Plantarum 13: 359-367 2001)
6) S. Mori et al., Soil Science and
Plant Nutrition 48: in press 2002)
7) C. Curie et al., Nature 409: 346-349
(2001)
8) S. Watanabe et al., Radiochimica
Acta 89: 853 2001)
94 -
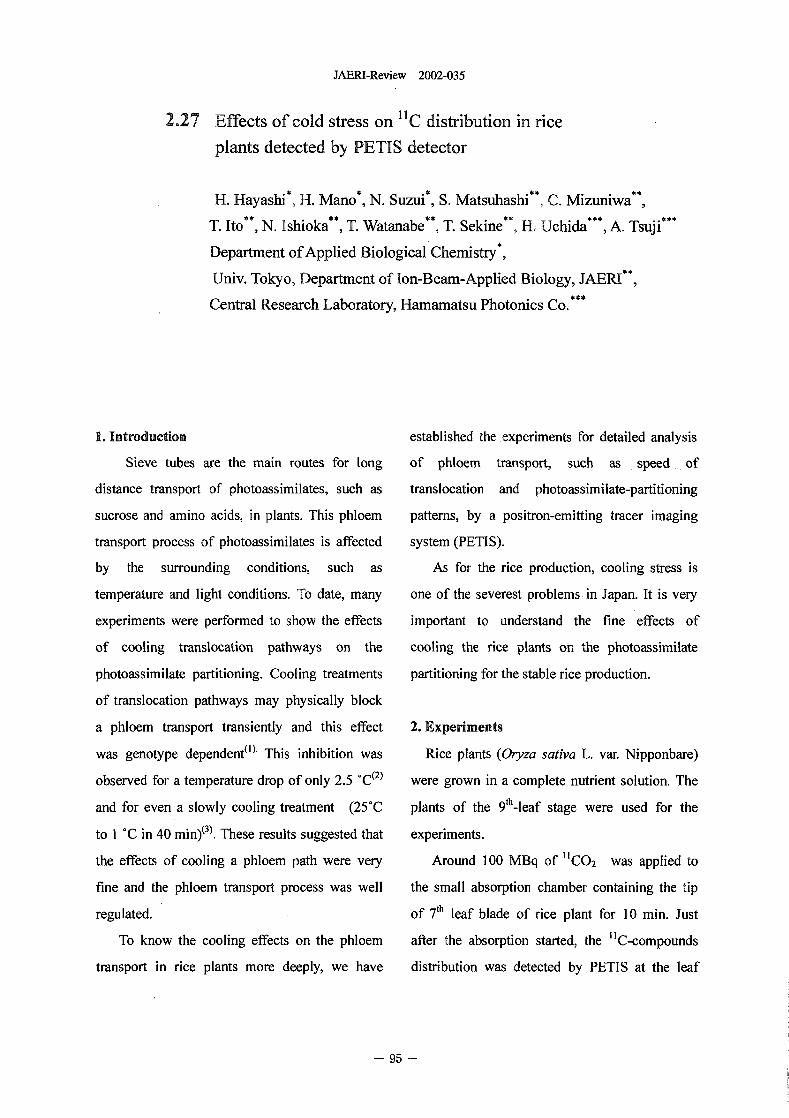
JAERI-Review 2002-035
2.27 Effects of cold stress on C distribution in rice
plants detected by PETIS detector
H. Hayashi*, H. Mano*, N. Suzui*, S. Matsuhashi", C. Mizuniwa**,
T. Ito**, N. shioka**, T. Watanabe", T. Sekine", E Uchida***, A. Tsuji***
Department of Applied Biological Chemistry%
Univ. Tokyo, Department of on-Beam-Applied Biology, JAEFJ**,
Central Research Laboratory, Hamamatsu Photonics Co.***
1. Introduction established the experiments for detailed analysis
Sieve tubes are the main routes for long of phloern transport, such as speed of
distance transport of photoassimilates, such as translocation and photoassimilate-partitioning
sucrose and amino acids, in plants. This phloern patterns, by a positron-emitting tracer imaging
transport process of photoassimilates is affected system (PETIS).
by the surrounding conditions, such as As for the rice production, cooling stress is
temperature and light conditions. To date, many one of the severest problems in Japan. It is very
experiments were performed to show the effects important to understand the fine effects of
of cooling translocation pathways on the cooling the rice plants on the photoassimilate
photoassimilate partitioning. Cooling treatments partitioning for the stable rice production.
of translocation pathways may physically block
a phloem transport transiently and this effect 2. Experiments
was genotype dependent"'- This inhibition was Rice plants (Oryza saliva L. var. Nipponbare)
observed for a temperature drop of only 25 C(2) were grown in a complete nutrient solution. The
and for even a slowly cooling treatment (25'C plants of the 91h -leaf stage were used for the
to I 'C in 40 min)(31 . These results suggested that experiments.
the effects of cooling a phloem path were very Around 100 MBq Of 1CO2 was applied to
fine and the phloem transport process was well the small absorption chamber containing the tip1hregulated. of 7 leaf blade of rice plant for 10 min. Just
To know the cooling effects on the phloem after the absorption started, the "C-compounds
transport in rice plants more deeply, we have distribution was detected by PETIS at the leaf
95 -
JAERI-Review 2002-035
sheath position. To detect the effects of cooling, transport rate by this cooling treatment was
a basal part of the leaf blade was cooled down to clearer when the treatment was done after 11CO2
5 by a cooling block before (before-cooling application (Figure I cool 2 In this aer-
treatment) or after (after-cooling treatment) treatment, radioactivity was detected at the
I C02 absorption by the leaf blade to the end of bottom of leaf sheath at min after 1CO2
experiments. application start. Total amount of translocated
"C-compounds from leaf blade was severely
3. Results and discussion decreased by the after-cooling treatment, not
Phloem transport of "C-compounds before-cooling treatment.
measured by PETIS is very useful to discuss the These results obtained by PETIS showed the
effects of environmental stress on the long reversible effects of cooling on the phloern
distance phloern transports of photoassimilates, transport in rice plants. Namely once the plant
specially the rate of transport and the pattern of body was cooled down for a long time, the long
photoassimilate distributions. In this experiment, distance tansport process through sieve tubes
the rate of phloem transport was calculated could recover the performance. owever, just
directly based on the data by PETIS. after cooling, the phloem transport was severely
Figurel shows the. PETIS images of the affected. Unexpectedly, phloem transport rate
absorption and translocation of C-compounds was accelerated by the cooling treatments.
during experiments. The absorbed 11C- Decreased amount of translocation may be
compounds at the leaf blade were transported compensated by the acceleration of phloem
only to the leaf sheath direction, namely to the transport rate.
leaf sheath, roots and other leaves, not to the tip
of the leaf blade. Absorbed 11CO2 was
metabolized at the leaf blade and translocated to References
the bottom of the leaf sheath within 16 min in 1) H. A. Hannah, M. J. qbal and F E. Sanders,
control plant (Figure I Control, Position A). Journal of Experimental Botany 52 2001)
Activities in positions and C in the control 1123-1127.
plant started to increase at 12 min after C 2) P, E. H. Minchin and M. R. Thorpe, Journal
application start and reached to a plateau at 30 of Experimental Botany 34 1983) 529-536
min after application. In case of before-cooling 3) M. A. Grusak and P. E. H. Minchin, Journal
treatment, 11C reached to the position A within of Experimental Botany 40 1989) 215-223
14 min after 11C application start, 2 min earlier
than control plant. This acceleration of phloern
- 96 -
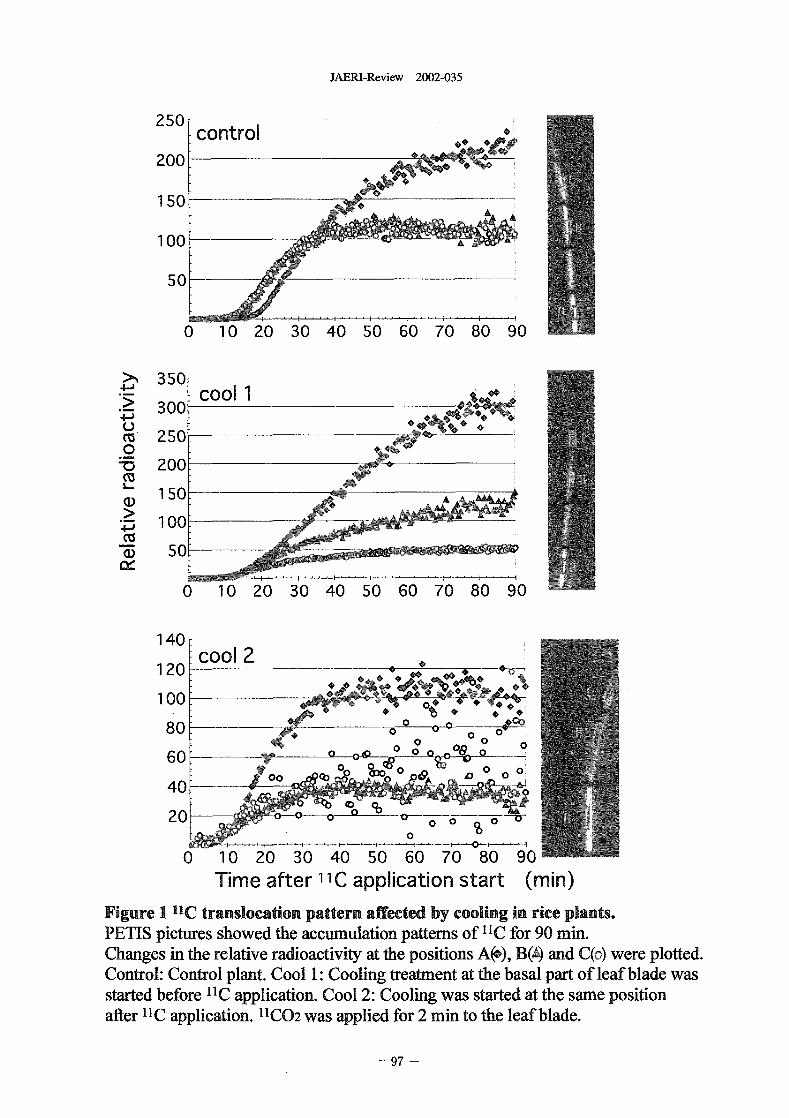
JAERJ-Review 2002-035
250control
200 Ah
150AA A
100 -
50
0 10 20 30 40 50 60 70 80 90
>-, 3504-j cool 5 300��Z;m 250- !Ci%0
-a 200-M
150 A1 00-
MQ) 5 0
0 10 20 30 40 50 60 70 80 0
140 -: cool 21 20.
VOJ rVWtAt100' III RNA O*0 0 0 C',80. 0 0 -60L
0 00 0 0 0. O 060 00 ip
0 000 040
20 -0 0 6- % O O0
0 1 0 20 30 40 50 60 70 80 90Timeafter"Capplicationstart (min)
Figure I 11C translocation pattern affected by cooling in rice plants.PETIS pictures showed the accumulation patterns of II C for 90 min.Changes in the relative radioactivity at the positions A(p), BA) and Cq) were plotted.Control: Control plant. Cool 1: Cooling treatment at the basal part of leaf blade wasstarted before 'IC application. Cool 2 Cooling was started at the same positionafter 'IC application. IIC02 was applied for 2 min to the leaf blade.
97 -
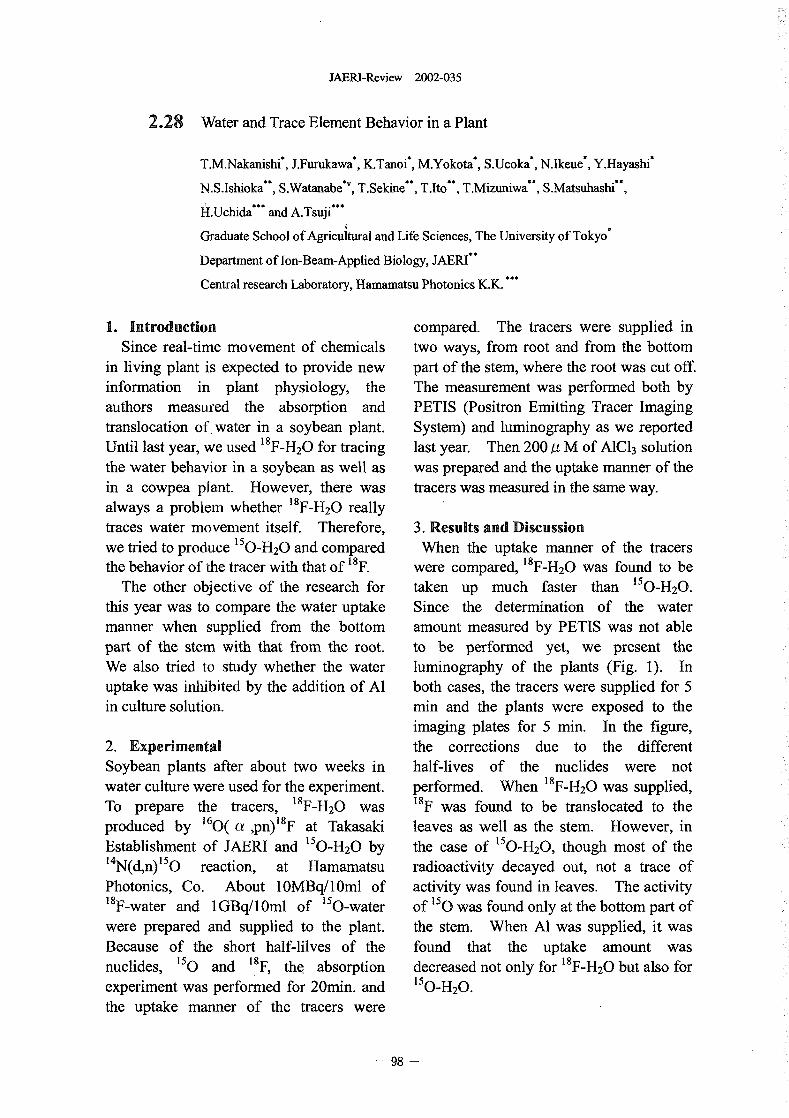
JAERI-Review 2002-035
2.28 Water and Trace Element Behavior in a Plant
T.M.Nakanishi', J.Furukawa', KTanoi', M.Yokota', S.Ueoka', N.Ikeue', Y.Hayashi'
N.S.Ishioka", S.Watanabe*v, T.Sekine**, T.1to", T.Mizuniwa", S.Matsuhashi7%
H.Uchida... and A.Tsuji-
Graduate School of Agricultural and Life Sciences, The University of Tokyo'
Department of on-Beam-Applied Biology, AERI-
Central research Laboratory, Hamamatsu Photonics KX-
1. Introduction compared. The tracers were supplied inSince real-time movement of chemicals two ways, from root and from the bottom
in living plant is expected to provide new part of the stem, where the root was cut off.information in plant physiology, the The measurement was performed both byauthors measured the absorption and PETIS (Positron Emitting Tracer Imagingtranslocation of. water in a soybean plant. System) and luminography as we reportedUntil last year, we used 8F-H20 for tracing last year. Then 200 a M of AIC13 solutionthe water behavior in a soybean as well as was prepared and the uptake manner of thein a cowpea plant. However, there was tracers was measured in the same way.always a problem whether 18 F-H20 really
traces water movement itself Therefore, 3. Results and Discussionwe tried to produce 15 0-H20 and compared When the uptake manner of the tracersthe behavior of the tracer with that of 18 F. were compared, 18 F-H20 was found to be
The other objective of the research for taken up much faster than "O-H20.this year was to compare the water uptake Since the determination of the watermanner when supplied from the bottom amount measured by PETIS was not ablepart of the stem with that from the root. to be performed yet, we present theWe also tried to study whether the water luminography of the plants (Fig. 1) Inuptake was inhibited by the addition of Al both cases, the tracers were supplied for in culture solution. min and the plants were exposed to the
imaging plates for min. In the figure,2. Experimental the corrections due to the differentSoybean plants after about two weeks in half-lives of the nuclides were notwater culture were used for the experiment. performed. When 18 F-H20 was supplied,To prepare the tracers, 18 F-H20 was I8 F was found to be translocated to theproduced by 160 a pn)I8 F at Takasaki leaves as well as the stem. However, in
Establishment of JAERI and O-H20 by the case of 150-H20, though most of the14N(dn) 150 reaction, at Hamamatsu radioactivity decayed out, not a trace ofPhotonics, Co. About IOMBq/10ml of activity was found in leaves. The activity18 F-water and IGBq/10ml of 15 O-water of 150 was found only at the bottom part of
were prepared and supplied to the plant. the stem. When Al was supplied, it was
Because of the short half-lilves of the found that the uptake amount wasnuclides, 15 0 and 18 F, the absorption decreased not only for 18 F-H20 but also for
15experiment was performed for 20min. and O-H20-the uptake manner of the tracers were
- 98 -
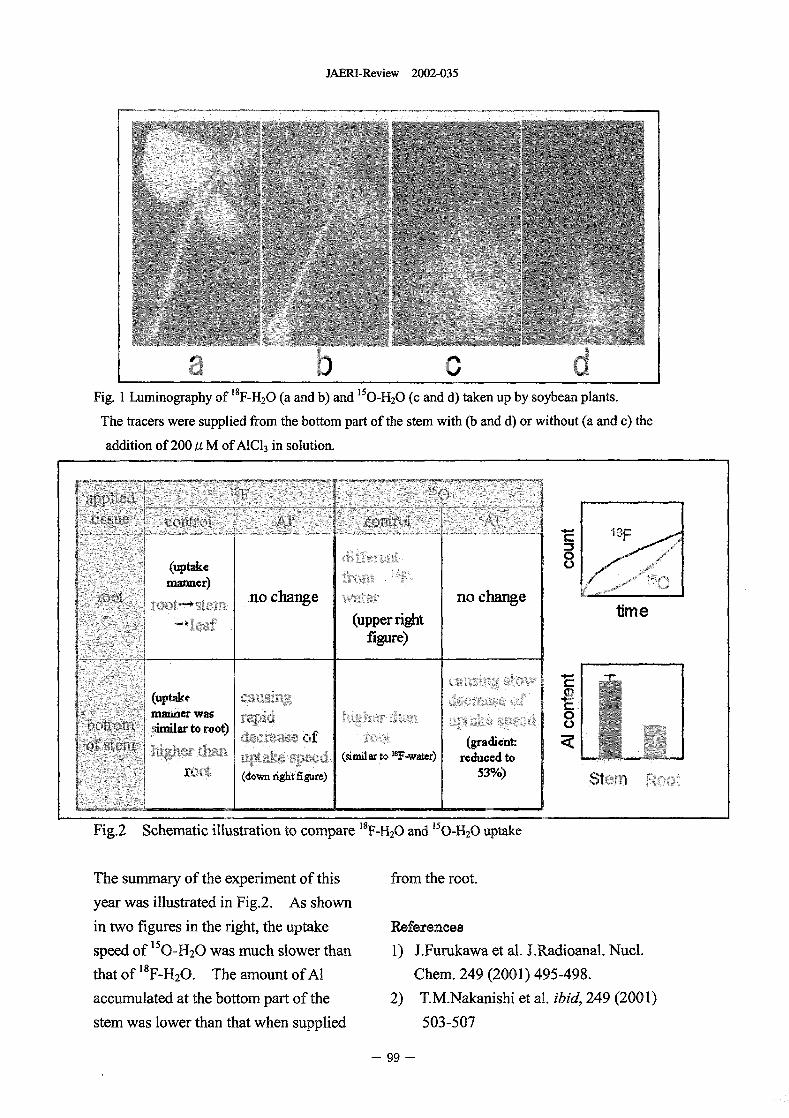
JAERI-Review 2002-035
b- dFig. I Luminography of 18 F-H20 (a and b) and 150-1120 (c and d) taken up by soybean plants.
The tracers were supplied from the bottom part of the stem with (b and d) or without (a and c) the
addition of 200 M of AIC13 in solution.
OF0
(uptakemanner) 60",
106t--"* 9tetli no change Waer no change tme(upper right
figure)
Can Mc (uptake Oman f
Cinatiner was gher time 0similar to root)
UZ Mc of (gradient: :Zz
UP(&O "Od (simiiarto"F-waw) reduced toWwn right figure) 530%) Stem Root
Fig.2 Schematic illustration to compare "F-H20 and 150_H20 uptake
The summary of the experiment of this from the root.
year was illustrated in Fig.2. As shown
in two figures in the right, the uptake References
speed of 150-1120 was much slower than 1) J.Furukawa et al. J.Radioanal. Nucl.
that of F-H20. The amount of Al Chem. 249 2001) 495-498.
accumulated at the bottom part of the 2) T.M.Nakanishi et al. ibid, 249 2001)
stem was lower than that when supplied 503-507
99
JAERI-Review 2002-035
2.29 Positron imaging analysis of assimilation and translocation
of carbon and nitrogen sources in rice plant
S. Otsuki, Y. Sonoda, S. Saiki, S, Matsuhashi*, S, Watanabe*,
N. S� Ishioka*, T. Sekme* and I Yamaguchi
Graduate School of Division of Bioiogical Sciences, Hokkaido University,
*Department of Ion-Beatir-Applied Biology, JAERI
Introduction 'IN03' and "NH4' uptake; translocation of
Leaf photosynthesis is known to be affected "CO2, IIN03- and IINH4' under elevated C02
by the levels of environmental nitrogen where conditions.
the plants are gown". It is also known that
Nitrogen assimilation needs a carbon source to Experiments
produce amino acid 11. Thus, interaction Rice (Oyza saliva L. cv. Nipponbare) seeds
between carbon assimilation and nitrogen were genninated in water and cultured
assimilation is one of the most important hydroponically in a growth chamber with a 14-
factors regulating plant growth, in particular h light (25'C) / I O-h dark 20 'Q. The
under elevated C02 conditions. The procedure for production o IIN03--, IINH4+
suppression of photosynthesis by C02 and "CO2 was described esewhere".
enrichment is associated with a decrease in 1) Effects of nitrogen supply to soil water on
total leaf nitrogen content). This suggests that IIN03- and 11NH4' uptake
the elevated C02 condition may affect the IINH4 + was fed to the roots of rice plants
assimilation and translocation of carbon and cultivated for a month under distinct
nitrogen sources. conditions: control; 4-day nitrogen deficiency;
It has been impossible to conduct dynamical pretreatment with 03 niM NH4+ for 2 after
studies in translocation and partitioning of 4-day nitrogen deficiency. Meanwhile, 3NO3-
fixed carbon as sugars and taken nitrogen as was fed to the roots pretreated with 03 mM
amino acids. Use of Positron Emitting Tracer N03- for 2 h after 4-day nitrogen deficiency.
Imaging System (PETIS) can visualize the 2) Translocation of "CO2, 11NO3
real-time movement of these compounds and and'INH4under elevated C02 conditions
biosynthetic products 1),I). Here we report the After rice plants were cultured on tap water
results of two experiments for rice plants: for 3 weeks, half of the group was transferred
effects of nitrogen supply to soil water on to ambient 40 Pa) conditions, and the other
- 100
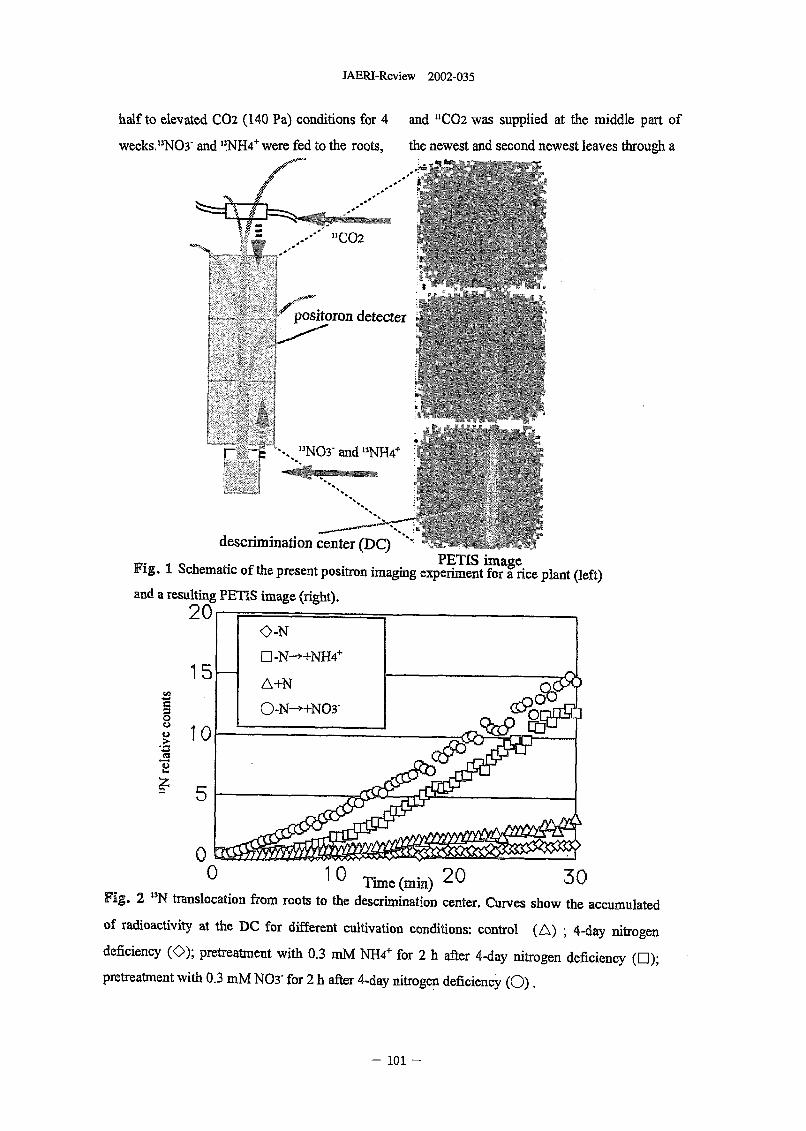
JAERI-Review 2002-035
half to elevated C02 140 Pa) conditions for 4 and "CO2 was supplied at the middle part of
weeks."NO3- and NH4'were fed to the roots, the newest and second newest leaves through a
"CO2
detecter
IIN03- and 13 NHe
descrimination center (DC) PETIS im
Fig. I Schematic of the present positron imaging experiment foraigence plant Qeft)
and a resulting PEUS image (right).20
O-N
0 -N-+NH4"'15 A+N
W
0 O-N-+NO3-0
5
0
0 1 0 Time (min) 2 30Fig 2 N translocation from roots to the descrimination center. Curves show the accumulated
of radioactivity at the DC for different cultivation conditions: control (A) ; 4-day nitrogen
deficiency ); pretreatment with 03 MM NH4' for 2 h after 4-day nitrogen deficiency (0);
pretreatment with 03 mM N03- for 2 h after 4-day nitrogen deficien (0).CY
- 101
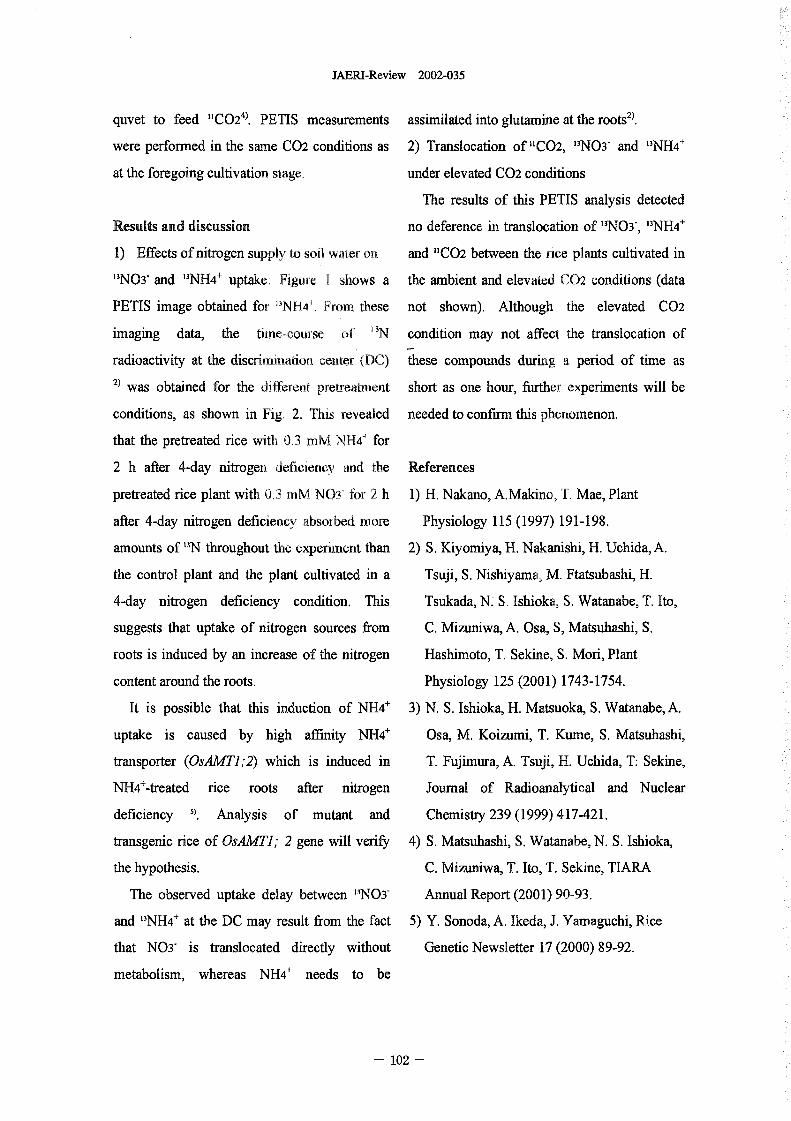
JAERI-Review 2002-035
quvet to feed CO2'). PETIS measurements assimilated into glutamirie at the roots').
were performed in the same C02 conditions as 2) Translocation of 11CO2, IIN03- and IINH4+
at the foregoing cultivation stage. under elevated C02 conditions
The results of this PETIS analysis detected
Results and discussion no deference in translocation of IIN03-, IINH4'
1) Effects of nitrogen supply to soil water on and "CO2 between the rice plants cultivated in
"NO3- and "NH4' uptake: Figure shows a the abient and elevated C02 conditions (data
PETIS image obtained for IINH4". From these not shown). Although the elevated C02
imaging data, the time-oourse of "N condition may not affect the translocation of
radioactivity at the discrimination enter (DC) these compounds during a period of time as
2) was obtained for the different pretreatment short as one hour, further experiments will be
conditions, as shown in Fig. 2 This revealed needed to confirm this phenomenon.
that the pretreated rice with 03 MM NH4' for
2 h after 4-day nitrogen deficiency and the References
pretreated rice plant with 03 M NO�- for 2 h 1) H. Nakano, A. Makino, T. Mae, Plant
after 4-day nitrogen deficiency absorbed more Physiology 115 1997) 191-198.
amounts of N throughout the experiment than 2) S. Kiyomiya, H. Nakanishi, H. Uchida, A.
the control plant and the plant cultivated in a Tsuji, S. Nishiyama, M. Ftatsubashi H.
4-day nitrogen deficiency condition. This Tsukada, N. S. Ishioka, S. Watanabe, T. Ito,
suggests that uptake of nitrogen sources from C. Mizuniwa, A. Osa, S, Matsuhashi S.
roots is induced by an increase of the nitrogen Hashimoto, T. Sekine, S. Mori, Plant
content around the roots. Physiology 125 2001) 1743-1754.
It is possible that this induction of NH4' 3) N. S. Ishioka, H. Matsuoka, S. Watanabe, A.
uptake is caused by high affimity NH4' Osa, M. Koizumi, T. Kume, S. Matsuhashi,
transporter (sAMTI;2) which is induced in T. Fujimura, A. Tsuji, H. Uchida, T: Sekine,
N-H4+-treated rice roots after nitrogen Journal of Radioanalyfical and Nuclear
deficiency 1). Analysis of mutant and Chemistry 239 1999) 417-421.
transgenic rice of sAA4TI 2 gene will verify 4) S. Matsuhashi, S. Watanabe, N. S. Ishioka,
the hypothesis. C. Mizuniwa, T. Ito, T. Sekine, TIARA
The observed uptake delay between IIN03- Annual Report 2001) 90-93.
and IINH4+ at the DC may result from the fact 5) Y. Sonoda, A. Ikeda, J. Yamaguchi, Rice
that N03- is translocated directly without Genetic Newsletter 17 2000) 89-92.
metabolism, whereas NH4' needs to be
102 -
JAERI-Review 2002-035
2.30 Uptake of 18 FDG and 13 N03- in Tomato Plants
A. Tsuji, H. Uchida, T. Yamashita, S. Matsuhashi*, T. Ito*, C. Mizunlwa*,
N. S, Ishloka*, S. Watanabe* and T. Sekine*
Central Research Lab., Hamamatsu Photonics K.K.,
*Department of on-Beam-Applied Biology, JAERI,
1. Introduction BGO scintillators, placed with a 22 mm pitch,Conventionally, observation of the each of which is 2 mm square in cross section
movement or distribution of chemical and 20 mm in depth.compounds in plant bodies has been mainly "FDG and NO3- were produced by using the
carried out by using static methods sch as TLkRAAVF cyclotron.
autoradiography. We have developed a dynamic Tomato plants were grown from seed in
imaging method using positron emitting vermiculite at 27C 'n a controlled
nuclides, which allows us to investigate environmental chamber. The plants cultivated
biological functions of higher plants from a new for 46 weeks (about 40 cm in height) were
angle. used for the experiment.
The Positron Emitting Tracer Imaging System The water containing ca. 10 MBq/ml of
(PETIS) which we have developed is comprised 18FDG or 10 MBq/ml of fed to a
of two planar detectors with position sensitivity scratched leafstalk of a plant or a cut leafstalk,
to detect'positron-electron-annihilation -y -rays. which naturally loses its leaf. Furthermore, a
This measurement method visualizes dynamic part of a leafstalk was heated with a heater to
movements of substances within a plant, without make the phloem tissue in the part lose its
touching it, as a series of two-dimensional function as a translocation pipe for assimilation
images. products.
In the present work, PETIS is used to study
movements of nutrients or assunilation products 3. Results and discussion
introduced into a leafstalk in which those When 13 N03- was fed onto a cut leafstalk,
compounds are considered to be vigorously the 13 N03- taken was found to be translocated to
translocated. Behavior of 13 N03- as a nutrient the main stem. But, the 'NO3_ taken from a
and 18FDG as an assimilation product in a Scratched leafstalk, with its leaf attached,
tomato plant was studied with PETIS. showed no such , movement. Since the
translocatioll of water depends on leaves'
2. Experiments actlvih7 in photosynthesis and transpiration, it
The PETIS used in this experiment consists of was aticipated that'. when a leaf was removed, a
two-dimensional block detectors one of which is taken radioactive tracer mav be translocated in a
composed of a B14Ge3O12 scintillator array countercurrent water flow.
coupled to a position sensitive photomultiplier When a part of a leafstalk without the leaf
tube (PS PMT, Hamamatsu R3941-2). The was heated, NO3-. and "FDG were found to be
mosaic BGO array is formed of 22(X) x 23(Y) translocated from te cut leafstalk to the main
103 -
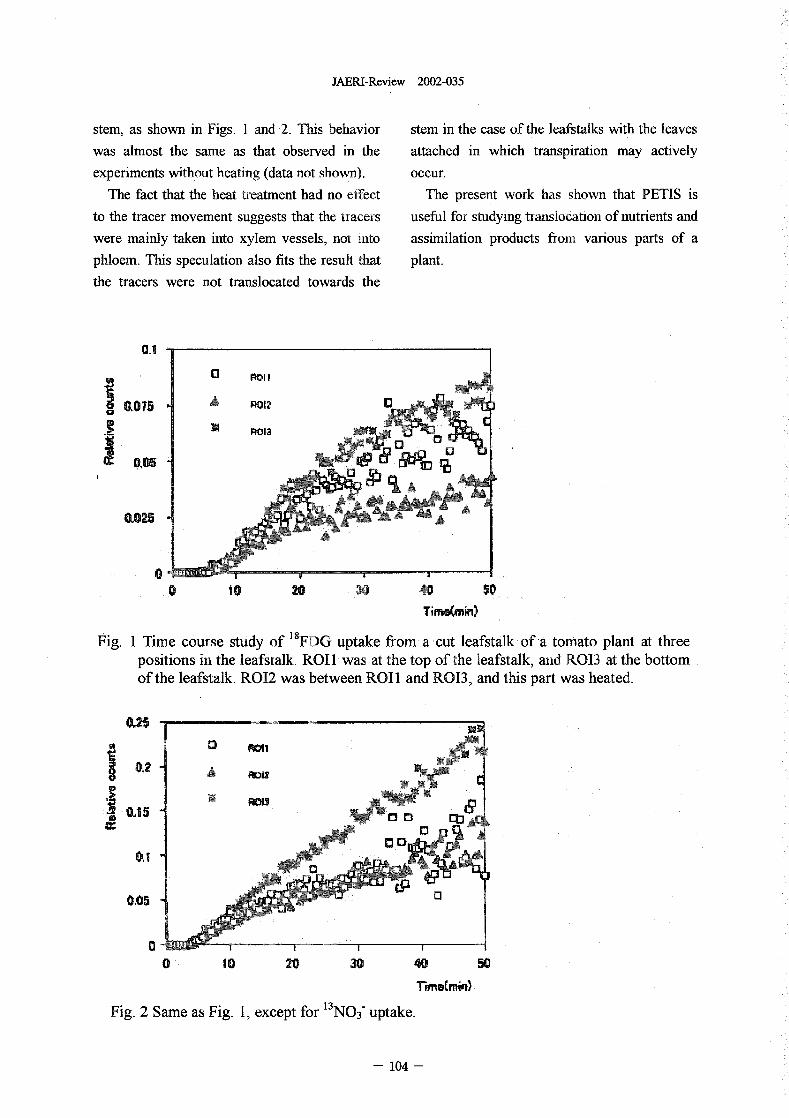
JAERI-Review 2002-035
stem, as shown in Figs. I and 2 This behavior stem in the case of the leafstalks with the leaves
was almost the same as that observed in the attached in which transpiration may actively
experiments without beating (data not sown). occur.
The fact that the heat treatment had no effect The present work has shown that PETIS is
to the tracer movement suggests that the tracers useU for studying trauslocation of nutrients and
were mainly taken into xylem vessels, not into assimilation products from various parts of a
phloem. This speculation also fits the result that plant.
the tracers were not translocated towards the
poll
A P012
A
P0 10 20 30 40 so
TiRbe(min)
Fig. I Time course study of 18FDG uptake from a cut leafstalk of a tomato plant at threepositions i the leafstalk, ROII was at the top of the leafstalk ad R013 at the bottomof the leafstalk. R012 was between ROII and RB, and this part was heated.
INDJOHN t
0.2 A few ogrx� C
E3
0.1 k
0.05 13
0 1 0 20 30 40 50
T-FMO(MiR)
Fig. 2 Same as Fig. 1, except for 13 N03- uptake.
- 104 -
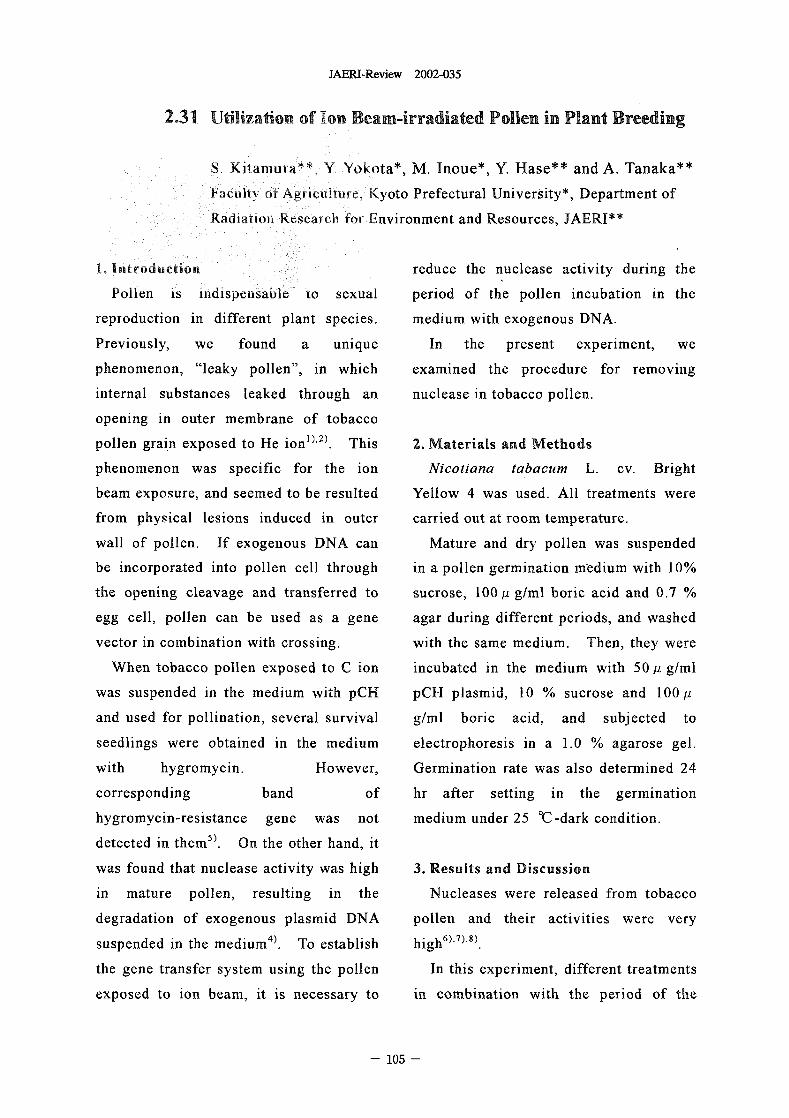
JAERI-Review 2002-035
2.31 Utilization of Ion Beam-irradiated Pollen in Plant Breeding
S. Kitamura" Y Yokota*, M. Inoue*, Y. Hase** and A. Tanaka**
Faculty of Agriculture, Kyoto Prefectural University*, Department of
Radiation Research for Environment and Resources, JAERI**
1. Introduction reduce the nuclease activity during the
Pollen is indispensable to sexual period of te pollen incubation in the
reproduction in different plant species. medium with exogenous DNA.
Previously, we found a unique In the present experiment, we
phenomenon, "leaky pollen", in which examined the procedure for removing
internal substances leaked through an nuclease in tobacco pollen.
opening in outer membrane of tobacco
pollen grain exposed to He ion')"). This 2. Materials and Methods
phenomenon was specific for the ion Nicotiana tabacum L. cv. Bright
beam exposure, and seemed to be resulted Yellow 4 was used. All treatments were
from physical lesions induced in outer carried out at room temperature.
wall of pollen. If exogenous DNA can Mature and dry pollen was suspended
be incorporated into pollen cell through in a pollen germination edium with 10%
the opening cleavage and transferred to sucrose, 100 p g/ml boric acid and 07
egg cell, pollen can be used as a gene agar during different periods, and washed
vector in combination with crossing. with the same medium. Then, they were
When tobacco pollen exposed to C ion incubated in the medium with 50,u g/ml
was suspended in the medium with pCH pCH plasmid, 10 sucrose and 1001L
and used for pollination, several survival g/ml boric acid, and subjected to
seedlings were obtained in the medium electrophoresis in a 1.0 % agarose gel.
with hygromycin. However, Germination rate was also determined 24
corresponding band of hr after setting in the germination
hygromycin-resistance gene was not medium under 25 C -dark condition.
detected in theM5 ). On the other hand, it
was found that miclease activity was high 3. Results and Discussion
in mature pollen, resulting in the Nucleases were released from tobacco
degradation of exogenous plasmid DNA pollen and their activities were very
,UM4 6),7),8)suspended in the medi ). To establish high
the gene transfer system using the pollen In this experiment, different treatments
exposed to ion beam, it is necessary to in combination with the period of the
- 10 -
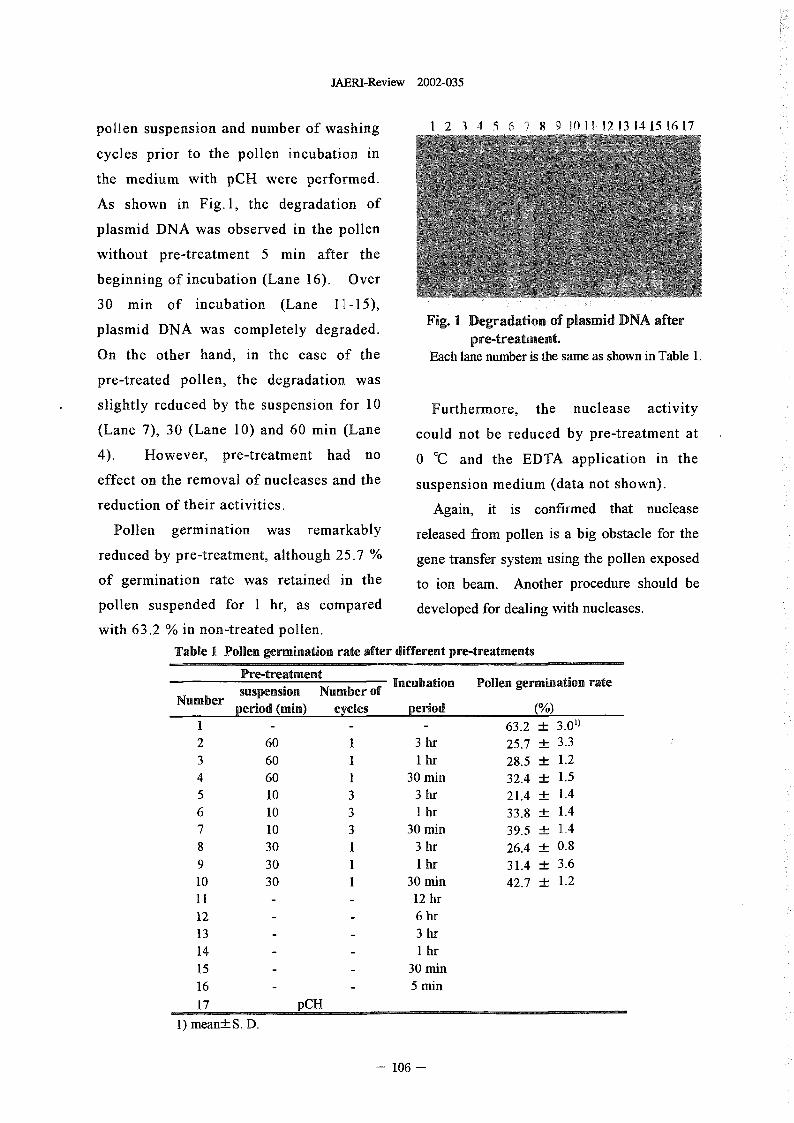
MERI-Review 2002-035
pollen suspension and number of washing 2 3 4 6 9 13 14 15 6 17
cycles prior to the pollen incubation in
the medium with pCH were performed.
As shown in Fig. 1, the degradation of
plasmid DNA was observed in the pollen
without pre-treatment min after the
beginning of incubation (Lane 16). Over
30 min of incubation (Lane 11-15),
plasmid DNA was completely degraded. Fig. Degradation of plasmid DNA afterpretreatment.
On the other hand, in the case of the Each lane number is the same as shown in Table .
pre-treated pollen, the degradation was
slightly reduced by the suspension for 10 Furthermore, the nuclease activity
(Lane 7 30 (Lane 10) and 60 min (Lane could not be reduced by pre-treatment at
4). However, pre-treatment had no 0 C and the EDTA application in the
effect on the removal of nucleases and the suspension medium (data not shown).
reduction of their activities. Again, it is confirmed that nuclease
Pollen germination was remarkably released from pollen is a big obstacle for the
reduced by pre-treatment, although 25.7 gene transfer system using the pollen exposed
of germination rate was retained in the to ion beam. Another procedure should be
pollen suspended for I hr, as compared developed for dealing with nucleases.
with 63.2 in non-treated pollen.
Table I Pollen germination rate after different pre-treatments
Pre-treatment Incubation Pollen germination rateNumber suspension Number of
period (min) cycles periodI - 63.2 J- 3.0')2 60 1 3 hr 25.7 -+- 3.33 60 1 1 hr 28.5 J- 1.24 60 1 30 min 32.4 J- 1.55 10 3 3 hr 21.4 +- 1.46 10 3 1 hr 33.8 1.47 lo 3 30 min 39.5 L48 30 I 3 hr 26.4 0.89 30 1 1 hr 31.4 3.610 30 1 30 min 42.7 J- 1.21 1 - - 12 hr12 - - 6 hr13 - - 3 hr14 - - I hr15 - - 30 min16 - - 5 in17 pCH
1) mean-+- S. D.
106 -
JAERI-Review 2002-035
References
1) M. Inoue, H. Watanabe, A. Tanaka and
A. Nakamura, TIARA Annual Report
2 1992) 50-52.
2) A. Tanaka, H. Watanabe, S. Simizu,
M. Inoue, Y. Kikuchi, Y. Kobayashi
and S. Tano, Nuc. Instr. Meth. Phys.
Res. B129 1997) 42-48.
3) M. Ioue, S, Kitamura, Y. Toda H.
Watanabe, A. Tanaka and Y. Hase,
JAERI-Review 99-025 1999) 80-81.
4) Y. Hase, Y. Toda, A. Tanaka, M. Inoue
and H. Watanabe, JAERI-Review
99-025 1999) 82-83.
5) Y. Toda 1998). Thesis of Master
Degree, Kyoto Prefectural University.
6) M. Vschi and S. Marchetti, Theor.
Appl. Genet. 95 1997) 185-190.
7) J. Matousek and J. Tupy, Plant Sci.
Lett. 30 1983) 83-89,
8) 1. Negrutlu, E. 1, Bors and 1. Potrykus,
Biotechnology and Ecology of pollen,
Springer Verlag 1986) pp.65-70.
107 -
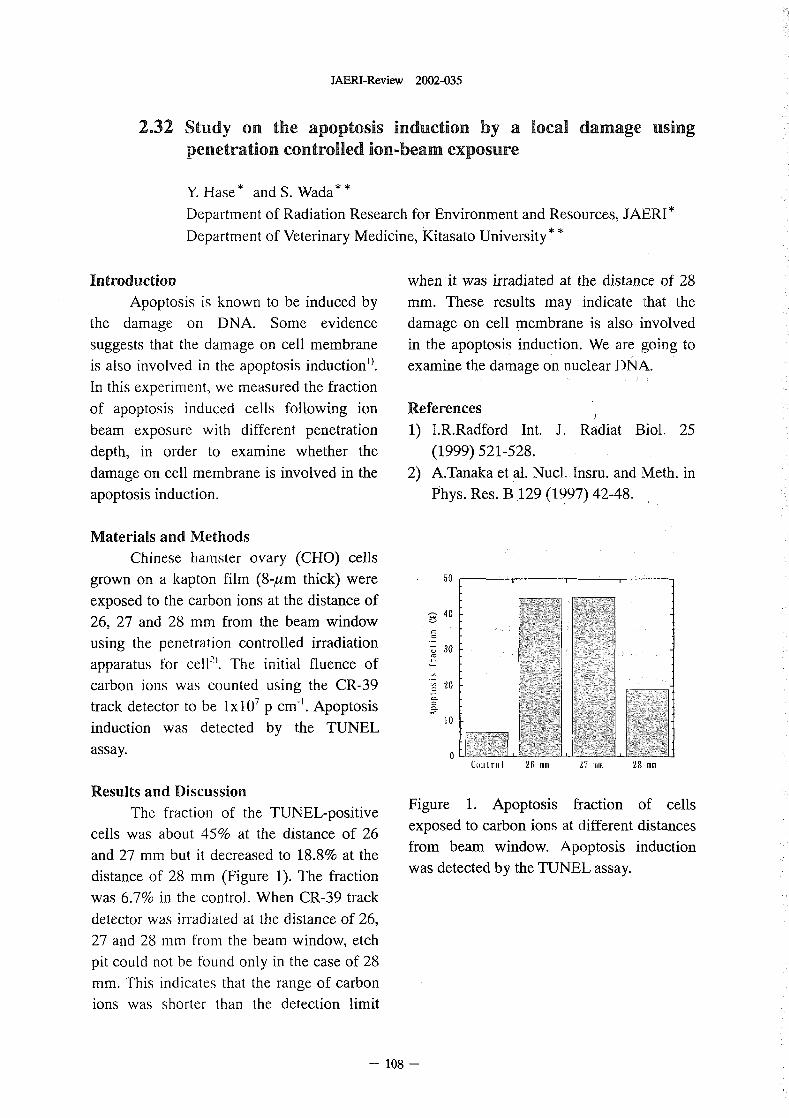
JAERI-Review 2002-035
2.32 Study on the apoptosis induction by a local damage usingpenetration controlled ion-beam exposure
Y. Hase * and S. Wada * *
Department of Radiation Research for Environment and Resources, JAERI*
Department of Veterinary Medicine, kitasato University*
Introduction when it was irradiated at the distance of 28
Apoptosis is known to be induced by mm. These results may indicate that the
the damage on DNA. Some evidence damage on cell membrane is also involved
suggests that the damage on cell membrane in the apoptosis induction. We are going to
is also involved in the apoptosis induction'). examine the damage on nuclear DNA.
In this experiment. we measured the fraction
of apoptosis induced cells following ion References
beam exposure with different penetration 1) I.R.Radford Int. J Radiat Biol 25
depth, in order to examine whether the (1999) 521-528.
damage on cell membrane is involved in the 2) A.Tanaka et al. Nucl, Insru. and Meth in
apoptosis induction. P hys. Res. B.129 1997) 42-48,
Materials and Methods
Chinese harrister ovary (CHO) cells
grown on a kapton film (8-ym thick) were 50
exposed to the carbon ions at the distance of40
26, 27 and 28 mm from the beam window
using the penetration controlled irradiation Z 30apparatus for ce112'. The initial fluence of
carbon ions was counted using the CR-39 20
IX107track detector to be p cm-'. ApoptosisI 0
induction was detected by the TUNEL
assay. ohmControl 26 mm '27 w[ft 28 mm
Results and DiscussionThe fraction of the TUNEL-positive Figure 1. Apoptosis fraction of cells
cells was about 45% at the distance of 26 exposed to carbon ions at different distances
and 27 mm but it decreased to 18.8% at the from beam window. Apoptosis induction
distance of 28 mm (Figure 1). The fraction was detected by the TUNEL assay.
was 67% in the control. When CR-39 track
detector was irradiated at the distance of 26,
27 and 28 rnm fom the beam window, etch
pit could not be ound only in the case of 28
mm. This indicates that the range of carbon
ions was shorter than the detection limit
- 10 -
JAERI-Review 2002-035
3. Radiation Chemistry Organic Materials
3.1 Preparation of Functional Nano-porous Membranes ......................... III
M. Asano, H. KoshikawaY. Maekawa, M. Yoshida and K. Ogura
3.2 Preparation of Copper Nanowires using Ion Track Membranes . ................. 113
H. Koshikawa, Y. Maekawa, M. Asano and M. Yoshida
3.3 Nano-wire Formation and Selective Adhesion on Substrates by
Single Track Gelation of Polysilanes ..................................... 115
S. Seki, S.Tsukuda, Y. Yoshida, S. Tagawa, M. Sugimoto, N. Morishita and
S. Tanaka
3.4 Oxidation Product Yields of Phenol along Heavy Ion Trajectory in
Aqueous Solution: Differential G-value . .................................. 117
M. Taguchi, N. M. Thu, T. Kojima
3.5 Crosslinking of Polymers 'M Heavy Ion Tracks ............................. 119
H. Koizumi, M. Taguchi, Y. Kobayashi and T. Ichikawais .........3.6 Primary Process of Radiation Chemistry Studied by Ion Pulse Radiolysi 121
Y. Yoshida, S. Seki, A. Saeki, S. Tagawa, M. Taguchi, T. Kojima, and H. Namba
3.7 Dosimetry for 345 MeV/u Ion Beams us' Thin Fm Dosimeters ............. 123
T. Kojima, H. Sunaga, H. Takizawa, H. Hanaya and H. Tachibana.
109

This is a blank page.
JAERI-Review 2002-035
3.1 Preparation of functional nano-porous membranes
M. Asano*, H. Koshikawa*� Y. Maekawa*, M. Yoshida*
and K. Ogura**
Department of Material Development, JAERI*
College of Industrial Technology, Nihon University"
1. Introduction prepared according to a conventional castIf the membrane of poly(ethylene polymerization with 3 wt-% of di-
tereplithalate) (PET) and poly(diethyglycol-bis- isopropylperoxydicarbonate as a radicalaryicarbonate)(PDEGAC) is etched after ion initiator at 70'C for 24 houres, The films wereirradiation, the pore will be formed along the irradiated with 'Ar ion (15OMeV), "Ar ionion path. The shape and the diameter size of (195MeV), 8Kr ion (322MeV), and 2Xe ionthe pore can be controlled according materials, (45OMeV) in the densities of 3x10⁶ ions/cm�ions, accelerated energies, and etching using TIARA cyclotron. The followingconditions. Based on this method, solution (PEWx) was used as etching solutionmembraneswhich have niform pore sizes, are in the first step of etching treatment.applied to the separation of fission product PEWx = 15wt-% KOH + x wt-% C211 5OH
elements. The ion porous membranes which (85-x)wt-% H20
have nauo-scale pore resulting from ion Then, AN-03N NaOH aqueous solutionsirradiation and etching treatment, have been were used as etching solutions in the secondused to test their performance for theseparation step. The pores size was confirmed by electronof polyethylene gycol with various molecular conductivities through the membranes. Theweight as well as the separation of albumin and shapes and sizes of ion pores were confirmed
-globulin from the mixture solutions'). Gas by using scan electron microscope(SEM).
and liquid generally flow smoothly throughsuch porous separation membranes. In current 3. Results and Discussionwork, the shape of the pores in the membranes Fig. shows the effect of PEWx solutionhas been controlled by combination of ion concentration on the Vb of PET beforeirradiation and etching treatment. In this paper, irradiation. From the figure, it is clear thatwe reportthe two step etching method to higher the x of PEWx solutions, as well asprepare the membranes that posses pores with C2H 5OH concentrations, higher the Vb Inthe funnel shape (horizontally spread) at the addition, when the treatment is done in highsurface, conected by the cylindrical pore at the temperature, Vb will be high. However, thecenter of the membrane. etching sensitivity S, which is expressed as Vt/
Vb, will be low when the treatment is done in
2. Experimental high concentration of CH 5OH and highThe PET(38gm) filrris(Diafoill) used in this temperature. When etching sensitivity is small,
sutudy were obtained from Diafoil Hoechst the etch pit will horizontally formed and spread,Co., Ltd.. The PDEGAC(38gm) film was and then based on this characteristic, the pore
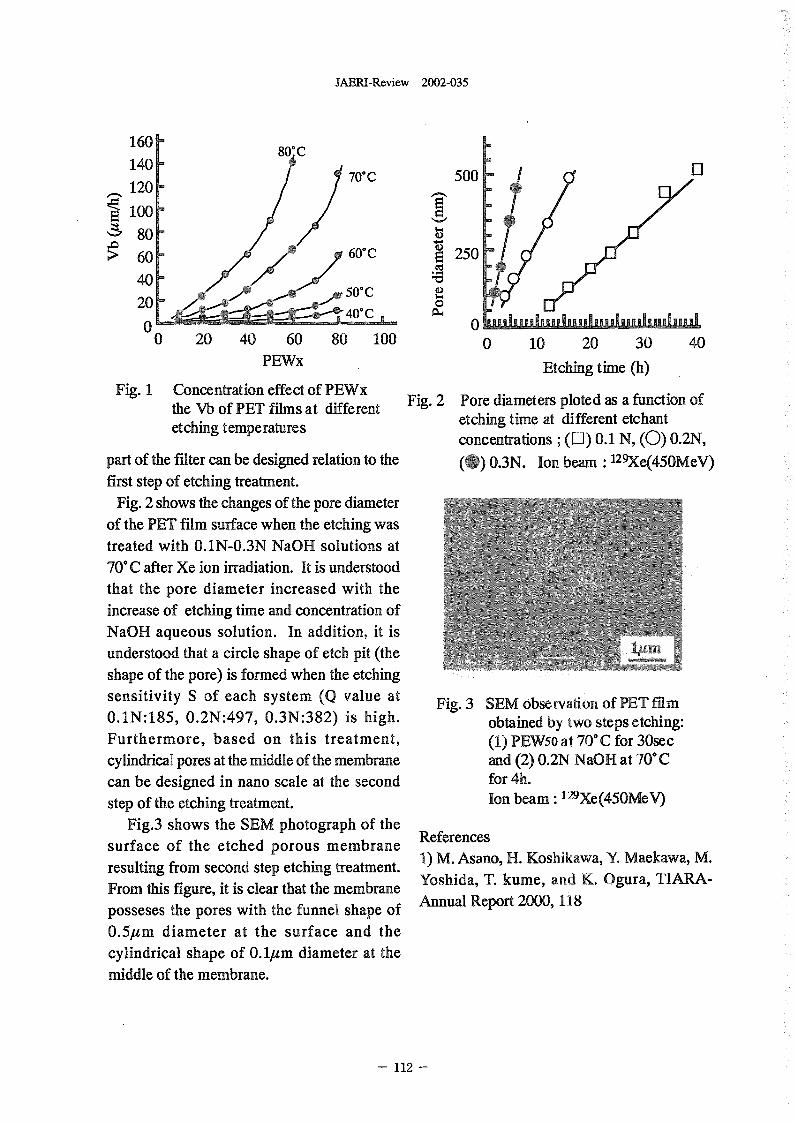
JAERI-Review 2002-035
160 - 80'C
140 -70'C 500
120 -
100
8 - t> 60 - 10 60T 250
4050T
20 - 040'C CL4
0 0 kuakuiluj�0 20 40 60 80 100 0 10 20 30 40
PEWX Etching time (h)
Fig. 1 Concentration effect of PEWxthe Vb of PET films at different Fig. 2 Pore diameters ploted as a function ofetching temperatures etching time at different etchant
concentrations ; (0) 0.1 N, (0) 0.2N,part of the filter can be designed relation to the 03N. Ion beam : 129Xe(45OMeV)first step of etching treatment.
Fig. 2 shows the changes of the pore diameterof the PET film surface when the etching wastreated with .lN-0.3N NaOH solutions at70'C after Xe ion irradiation. It is understoodthat the pore diameter increased with theincrease of etching time and concentration ofNaOH aqueous solution. In addition, it isunderstood that a circle shape of etch pit (theshape of the pore) is formed when the etching
sensitivity of each system value at Fig. 3 SEM observation of PET filmOAN:185, 0.2N:497, 0.3N:382) is high. obtained by two steps etching:Furthermore, based on this treatment, (1) PEW5o at 70'C for 30seccylindrical pores at the middle of the membrane and 2) 0.2N NaOH at 70'Ccan be designed in nano scale at the second for 4h.step of the etching treatment. Ion beam: 9Xe(45OMeV)
Fig.3 shows the SEM photograph of the References
surface of the etched porous membrane 1) M. Asano, H. Koshikawa, Y Maekawa, M.resulting from second step etching treatment. Yoshida, T. kume, and K. Ogura, TIARA-From this figure, it is clear that the membrane Annual Report 2000, 118posseses the pores with the funnel shape of0.51zm diameter at the surface and thecylindrical shape of .llzm diameter at themiddle of the membrane.
112 -
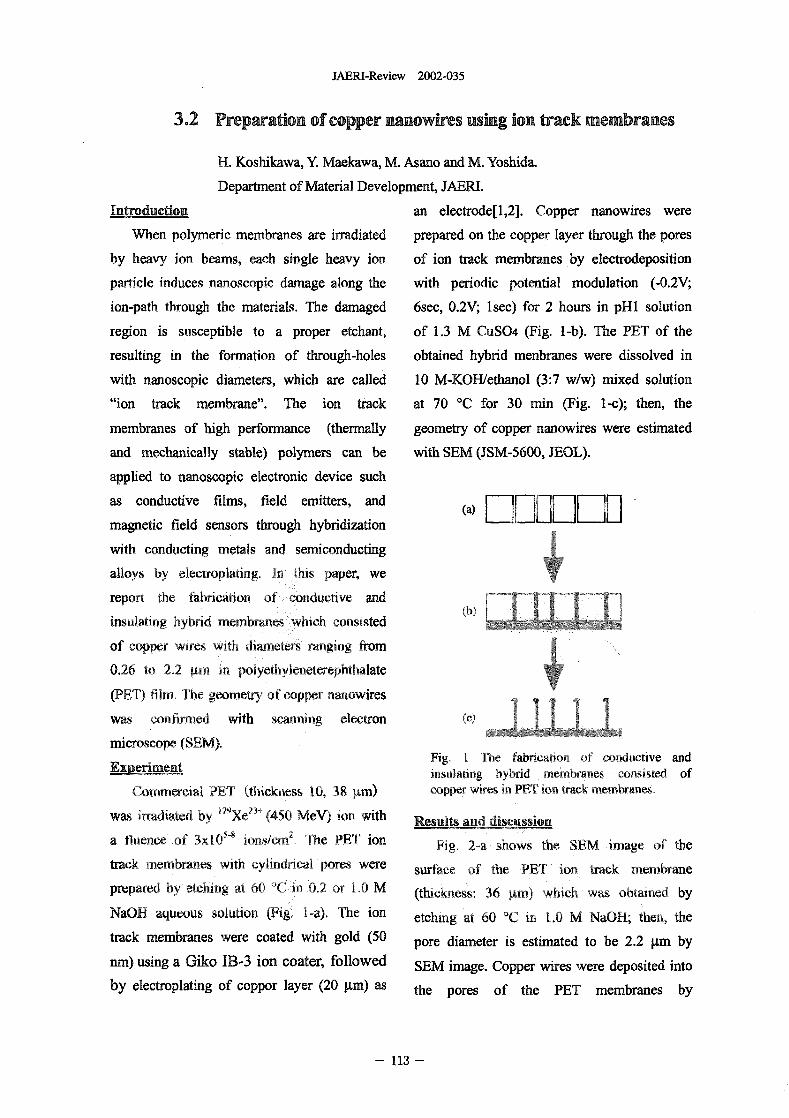
JAERI-Review 2002-035
3.2 Preparation of copper nanowires using ion track membranes
H. Koshikawa, Y. Maekawa, M. Asano and M. Yoshida.
Department of Material Development, JAERL
Introduction an electrode[1,21. Copper nanowires were
When polymeric membranes are irradiated prepared on the copper layer through the pores
by heavy ion beams, each single heavy ion of ion track membranes by electrodeposition
particle induces nanoscopic damage along the with periodic potential modulation (-0.2V;
ion-path trough the materials. The damaged 6sec, 0.2V; Isec) for 2 hours in pH1 solution
region is susceptible to a proper etchant, of 13 M US04 (Fig. 1-b). The PET of the
resulting in the formation of through-holes obtained hybrid membranes were dissolved in
with nanoscopic diameters, which are called 10 M-KOlVethanol 3:7 w/w) mixed solution
"ion track membrane". The ion track at 70 'C for 30 min (Fig. 1-c); then, the
membranes of high performance (thermally geometry of copper nanowires were estimated
and mechanically stable) polymers can be with SEM (JSM-5600, JEOL).
applied to nanoscopic electronic device such
as conductive films, field emitters, and (a)magnetic field sensors through hybridization
with conducting metals and semiconducting
alloys by electroplating. In this paper, we
report te fabrication of conductive and
insulating hybrid membranes which consisted N J I of copper wires with diameters ranging from
0.26 to 2.2 gm n polyethyleneterephthatate
(PET) film� The geometry of copper nanowires
was confirmed with scanning electron (C) a ll
microscope (SEM).ExRerhuent Fig� I The fabrication of conductive and
insulating hybrid membranes consisted ofCommercial PET thickbess 10, 38 4m) copper wires i PET ion track membranes.
was irradiated by '29V" 450 MeV) ion with Results and discussion
a fluence of 054 ions/cm2, The PT ion Fig, 2-a shows the SEM image of the
track embranes with cylindrical pores were surface of the PET ion track embrane
prepared by etching at 60 'C i 0 or 1. M (thicknesses 36 gm) which 'was obtained by
NaOH aqueous solution (Fig. I-a). The ion etching at 60 'C in, L M NaOH; then, the
track membranes were coated with gold (50 pore diameter is estimated to be 22 gm by
nm) using a Giko IB-3 ion coater, followed SEM image. Copper wires were deposited into
by electroplating of coppor layer 20 gm) as the pores of the PET membranes by
- 113 -
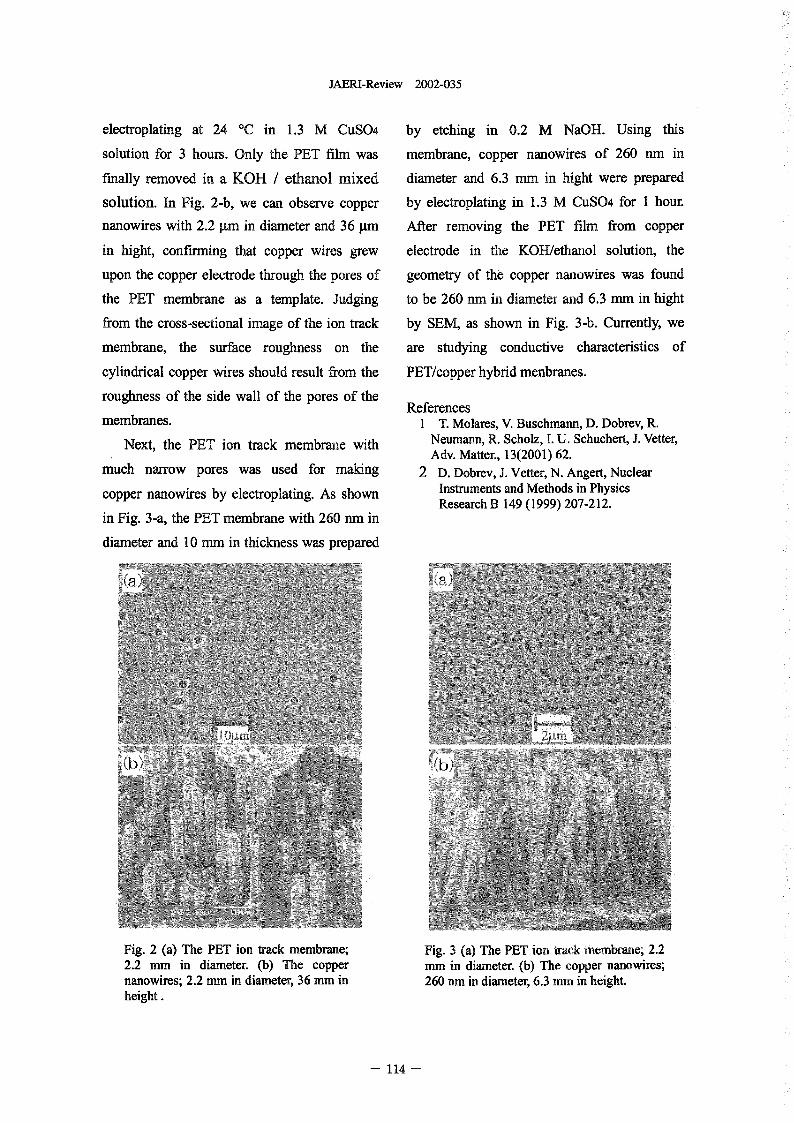
JAERI-Review 2002-035
electroplating at 24 'C in 13 M CuSO4 by etching in 02 M NaOH. Using this
solution for 3 hours. Only the PET film was membrane, copper nanowires of 260 ru in
finally removed in a KOH ethanol mixed diameter and 63 mm in hight were prepared
solution. In Fig. 2-b, we can observe copper by electroplating in 13 M CUS04 for I hour.
nanowires with 22 gm in diameter and 36 gm After removing the PET film from copper
in hight, confirn-iing that copper wires grew electrode in the KOH/ethanol solution, the
upon the copper electrode through the pores of geometry of the copper nanowires was found
the PET membrane as a template. Judging to be 260 mu in diameter and 63 nun in hight
from the cross-sectional image of the ion track by SEM, as shown in Fig. 3-b. Currently, we
membrane, the surface roughness on the are studying conductive characteristics of
cylindrical copper wires should result from the PET/copper hybrid membranes.
roughness of the side wall of the pores of the References
membranes. I T. Molares, V. Buschmann, D. Dobrev R.Next, the PET ion track membrane with Neumann, R. Scholz, 1. U, Schuchert, J. Vetter,
A dv. Matter., 13(2001) 62.much narrow pores was used for making 2 D. Dobrev, J. Vetter, N. Angert, Nuclear
copper nanowires by electroplating. As shown Instruments and Methods in PhysicsResearch B 149 1999) 207-212.
in Fig. 3-a, the PET membrane with 260 nm in
diameter and 10 nun in thickness was prepared
Fig. 2 (a) The PET ion track membrane; Fig. 3 (a) The PET ion track membrane 222.2 mm in diameter. (b) The copper mm in diameter. (b) The copper nanowires;nanowires 22 mm in diameter, 36 mm in 260 mn in diameter, 63 mm in heightheight
- 114 -
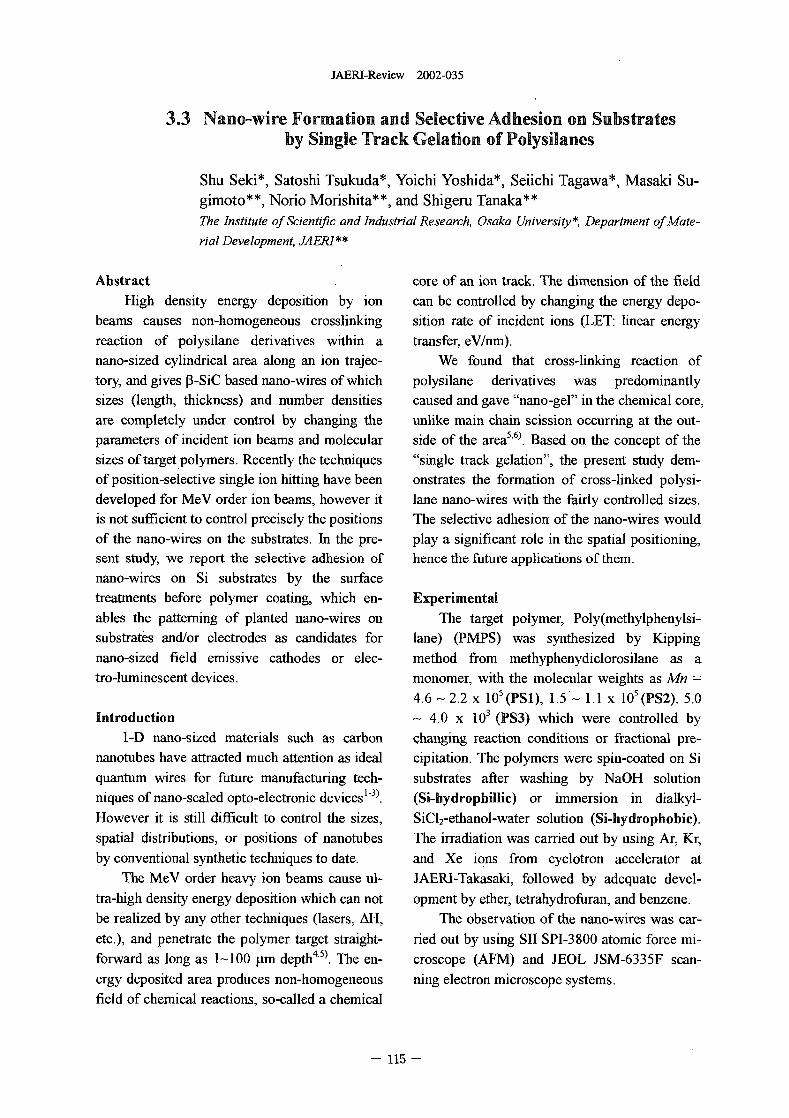
JAM-Review 2002-035
3.3 Nano-wire Formation and Selective Adhesion on Substratesby Single Track Gelation of Polysilanes
Shu Seki*, Satoshi Tsukuda*, Yoichi Yoshida*, Seiichi Tagawa*, Masaki Su-gimoto**, Norio Morishita", and Shigeru Tanaka**The Institute of Scientific and Industrial Research, Osaka University t Department ofMate-
rial Development, AERI**
Abstract core of an ion track. The dimension of the fieldHigh density energy deposition by ion can be controlled by changing the energy depo-
beams causes non-homogeneous crosslinking sition rate of incident ions (LET: linear energyreaction of polysilane derivatives within a transfer, eV/nm).nano-sized cylindrical area along an ion trajec- We found that cross-linking reaction oftory, and gives SIC based nano-wires of which polysilane derivatives was predominantlysizes (length, thickness) and number densities caused and gave "nano-gel" in the chemical core,are completely under control by changing the unlike main chain scission occurring at the out-parameters of incident ion beams and molecular side of the area"'). Based on t he concept of thesizes of target polymers. Recently the techniques single track gelation", the present study dem-of position-selective single ion hitting have been onstrates the formation of cross-linked polysi-developed for MeV order ion beams, however it lane nano-wires with the fairly controlled sizes.is not sufficient to control precisely the positions The selective adhesion of the nano-wires wouldof the nano-wires on the substrates. In the pre- play a significant role in the spatial positioning,sent study, we report the selective adhesion of hence the ftiture applications of them.nano-wires on Si substrates by the surfacetreatments before polymer coating, which en- Experimentalables the patterning of planted nano-wires on The target polymer, Poly(methylphenylsi-substrates and/or electrodes as candidates for lane) (PMPS) was synthesized by Kippingnano-sized field emissive cathodes or elec- method from methyphenydiclorosilane as atro-luminescent devices. monomer, with the molecular weights as Mn =
4.6 - 22 x 10'(PS1), 1.5'- 11 x 105 (PS2)� 5.0
Introduction - 40 x 103 (PS3) which were controlled byI-D nano-sized materials such as carbon changing reaction conditions or actional pre-
nanotubes have attracted much attention as ideal cipitation. The polymers were spin-coated on Siquantum wires for ftiture manufacturing tech- substrates after washing by NaOH solutionn ques of nano-scaled opto-electronic devices 1-3) (Si-hydrophillic) or immersion in dialkyl-However it is still difficult to control the sizes, SiC12-ethanol-water solution (Si-hydrophobic).spatial distributions, or positions of nanotubes The irradiation was carried out by using Ar, Kr,by conventional synthetic techniques to date. and Xe ions from cyclotron accelerator at
The MeV order heavy ion beams cause ul- JAERI-Takasaki, followed by adequate devel-tra-high density energy deposition which can not opment by ether, tetrahydrofuran, and benzene.be realized by any other techniques (lasers, AH, The observation of the nano-wires was car-etc.), and penetrate the polymer target straight- ned out by using SlI SPI-3800 atomic force mi-forward as long as 1-100 �tm depth4�5). The en- croscope (AFM) and JEOL JSM-6335F scan-
ergy deposited area produces non-homogeneous ning electron microscope systems.
field of chemical reactions, so-called a chemical
- 11 -
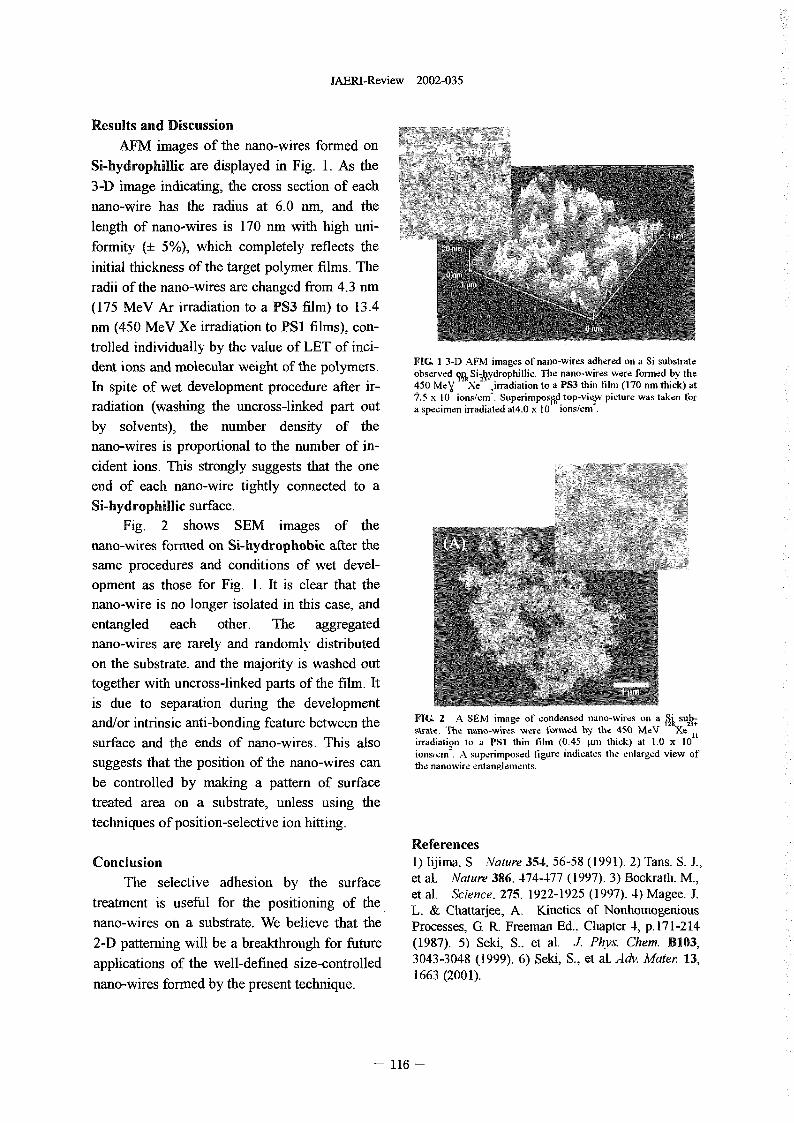
JAERI-Review 2002-035
Results and DiscussionAFM images of the nano-wires formed on
Si-hydrophillic are displayed Fig. 1. As the3-D image indicating, the cross section of eachnano-wire has the radius at 60 nin, and thelength of nano-wires is 170 n with high uni-formity (± 5%), which completely reflects theinitial thickness of the target polymer films. Theradii of the nano-wires are changed ftom 43 m(175 MeV Ar irradiation to a PS3 film) to 3.4nm 450 MeV Xe irradiation to PS1 films), con-trolled individually by the value of LET of inci-dent ions and molecular weight of the polymers. FIG 1 3-D AFM images of nano-wires adhered on a Si substrate
observed yj Si-�ydrophi Ilic. The nano-wires were formed by theIn spite of wet development procedure after ir- 450 Mey -Xe irradiation to a PS3 thin film 170 nm thick) at
1.5 x 10 ions/cm-. Superimposfo.top-vie�w picture was taken forradiation (washing the uncross-linked part out aspecimenirradiatedat4.0x]O ons/cm-.
by solvents), the number density of thenano-wires is proportional to the number of in-cident ions. This strongly suggests that the oneend of each nano-wire tightly connected to a
Si-hydrophillic surface.Fig. 2 shows SEM images of the
nano-wtres fonned on Si-hydrophobic after thesame procedures and conditions of wet devel-opment as those for Fig. 1. It is clear that thenano-wire is no longer isolated in this case, andentangled each other. The aggregatednano-wires are rarely and randomly distributedon the substrate. and the majority is washed outtogether with uncross-linked parts of the film. Itis due to separation during the developmentand/or intrinsic anti-bonding feature between the FIG 2 A SEM image of condensed nano-wires on a su�;'ate. The riano 11AT -%viTes. were formed b; the 4 MeV Xtsurface and the ends of nano-wires. This also irradiation to a PSI thin film 045 pm thick) at 1.0 x 10
ionst cm A superimposed figure idicates the elarged view ofsuggests that the position of the nano-wires can the nanowire entanalements.
be controlled by making a pattern of surfacetreated area on a substrate, unless using thetechniques of position-selective ion hitting.
ReferencesConclusion 1) Iijima. S Nature 354. 56-58 1991) 2 Tans. S. J.,
The selective adhesion by the surface et al. Naiure 386. 474-477 1997) 3 Bockrath. M.,et al. Science. 275. 1922-1925 1997) 4 Magee J.
treatment is useful for the positioning of die. L. Cliattarjee, A. Kinetics of Nontiomogeniousnano-wires on a substrate. We believe that the Processes, G R. Freeman Ed., Cliapter 4 p 171-2142-D patterning will be a breakthrough for future (1987). 5) Seki, S.. et al. .. Ph 'vs. Chem. B103,appli 3043-3048 1999) 6 Seki, S., et al. Adv. Mater 13,
ications of the well-defined size-controlled1663 2001).
nano-wires formed by te present technique.
- 116 -
JAERI-Review 2002-035
3.4 Oxidation product yields of phenol along heavy ion trajectory inaqueous solution Differential G-value.
Mitsurnasa Taguchi, Nguyen Minh Thu, Takuji KojimaDepartment of Radiation Research for Environment and Resources, JAERI
Untroduction TIARA facility. The ion beams were scanned in
It is well known that the yields of transient the X and Y directions at I and 50 Hz,
species ad final products change along the respectively to provide uniform intensity
heavy ion trajectories in water' 2). Reactive (fluence rate) at the surface of the sample cell,
transient species, eg,, OH radical and hydrated The scaiining area was over 50-mm square at the
electron' are produced in water by heavy ion sample surface. The differeDt energy ions were
irradiation, Te itial distributions of the provided by te attenoation of the incident
transient species corresponding to the initial energy using a set of aluminum foils with
dose distribution ae non-homogeneous aroun di ce thickness of 10- to 500-pm installed
the ion tajectory, Heavy ions form spurs on the sample cell, The incident energies, the
densely aound their trajectories, while low LET energies of the ion at te surface of the sample
radiations fm spurs sparsely. The transient solution after penetrating the aluminum foils and
species produced in the track are so near as to the windows, were calculated using the TRIM
interact easily with each other. Therefore, the code 3�. Penetration depth of the ion was less than
changing the yield along the trajectory of the ion 1 I nun in water. Therefore, the sample solution
will be due to the magnitude of interactions was stirred during the irradiation by a
between transient species in the track. It is magnetically coupled stirrer chip to keep the
necessary to have a detailed knowledge about solution homogeneous, Changing the irradiation
dependence of the differential G-value (the 'eld time up to 200 seconds controlled dose. Forylat a particular energy or LET of an ion in the comparison, the sample solution was also
sample solution) of products by OH radical upon irradiated with 60CO y-rays as a low LET
kind and LT of the ions. In the present report, radiation.
we investigated the differential G-value of The irradiated sample solutions were
ox 1 products from aqueous phenol analyzed by Fligh Performance Liquid
solutions irradiated with several hundred MeV C, Chromatography (HPLC) with a reversed phase
Ne, and Ar ions. colurrm (Shodex, Rspak DE-613) at 40 C.
Acetonitrile mixed with 70-% aqueous H3PO4
2.Experimental solution (0.01 M) was used at a flow rate of 1.0
Water containing phenol of 10-mM mL/minute as an eluent.
concentration was saturated with helium gas for
30 minutes to purge dissolved oxygen. The 3.Results and discussion
solution was put into an aluminum cell with a Hydrouinone and atechol were identified as
magnetic stirrer chip. The cell has an aluminum products after the Ar ion irradiations from the
window of 15-�tm thickness and 40-mm. HPLC chromatogram, as shown in Figure
diameter for the irradiation. The volume of the Concentrations of these oxidized products were
sample solution was 54 mL and its depth was estimated from the itegration of the spectral
about 4 mm. area aound the rvant specific peaks on
Irradiations were performed with 220-MeV chromatograms. Yields of te oxidized products12C O_MeV 2Nel+, 4OAr 3+35 and 460-MeV increased linearly with an increase of dose.
ions using Irradiation Apparatus for S&ed' in The number of molecules (N) produced by a
117 -
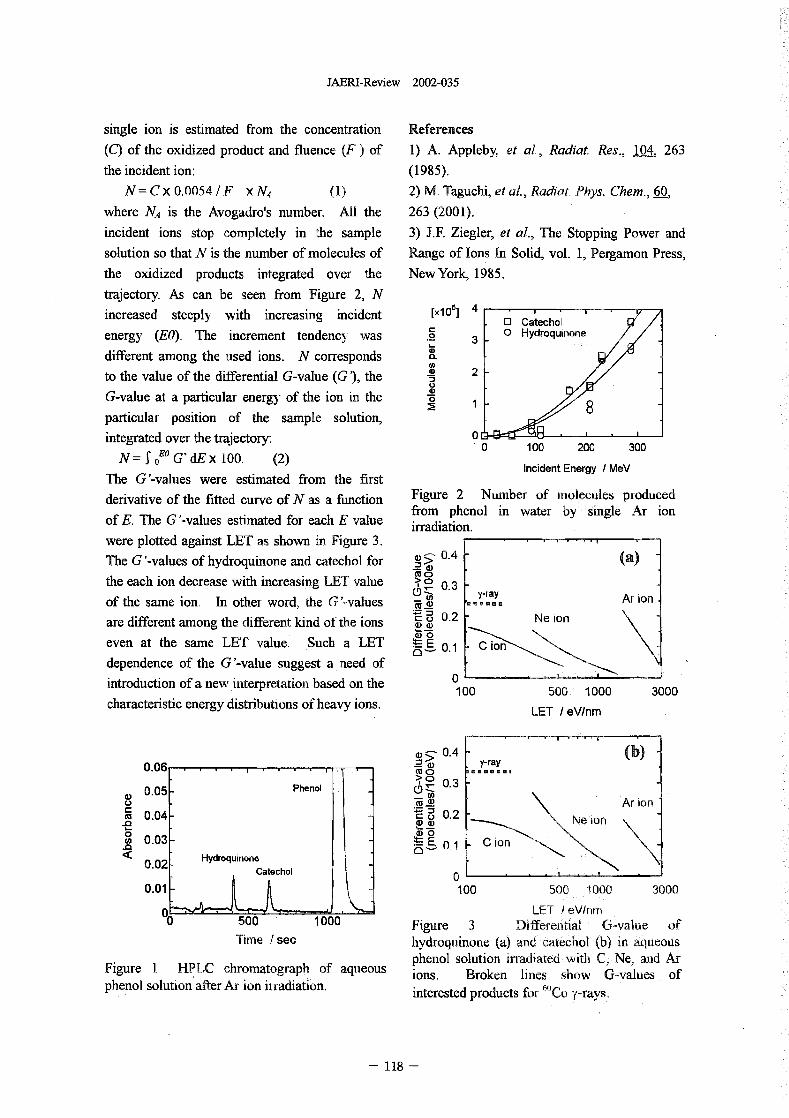
JAERI-Review 2002-035
single ion is estimated from the concentration References
(C) of the oxidized product and fluence F of 1) A. Appleby, et al., Radiat. Res., 104, 263
the incident ion: (1985).
N=CxO.00541F xNA (1) 2) M. Taguchi, et al., Rudiat, Phys. Chem., 60
where NA is the Avogadro's number. All the 263 2001).
incident ions stop completely in the sample 3) J.F. Ziegler, et al., The Stoppig Power and
solution so that N is the number of molecules of Range of Ions In Solid, vol. 1, Pergamon Press,
the oxidized products integrated over the New York, 1985.
trajectory. As can be seen from Figure 2 N
increased steeply with increasing incident [.101] 4. 0 Catechol
energy (EO). The increment tendency was C 0 Hydroquino'.(D
different among the used ions. N correspondsID 2
to the value of the differential G-value (G), the
G-value at a particular energy of the ion i the 0
particular position of the sample solution,
integrated over the trajectory: 0 I I0 100 200 300
N OE GdE x 100. (2) Incident Energy MeV
T'he G values were estimated from the first
derivative of the fitted curve of N as a function Figure 2 Number of molecules produced
of E. The G-values estimated for each E value from phenol in water by single Ar ionirradiation.
were plotted against LET as shown in Figure 3.
The G-values of hydroquinone and catechol for 0.4MO
the each ion decrease with increasing LET value 'O 0.3T-fay Ai ionof the same ion. In other word, the G-values -FU a) ... Men
1E �0 0.2 - Ne ionare different among the different kind of the ions a)0
even at the same LET value 0.1
dependence of the G-value suggest a need of
introduction of a new interpretation based on the 0100 500 1000 3000
characteristic energy distributions of heavy ions. LET eV/nm
(D 0.4 (b):3 , Y-ray0.0 M ........
c.) 0.3CD 0.0 - Phenol
-a a) Ar ionC 0.04 �E 0.2 Ne ion
0 -60.03 - E, 0,1 C io
< 0.02 - HydroquinoneCatechol
0
0.01 100 500 1000 3000
10 LET I V/nm1) 500 1000 Figure 3 Differential G-value of
Time / sec hydroquinone (a) and catechol (b) in aqueous
phenol solution irradiated wit C Ne, and ArFigure I HPLC chromatograph of aqueous Iions. Broken lines show G-values ofphenol solution after Ar ion irradiation. interested products for 6CO _rays.
11 -
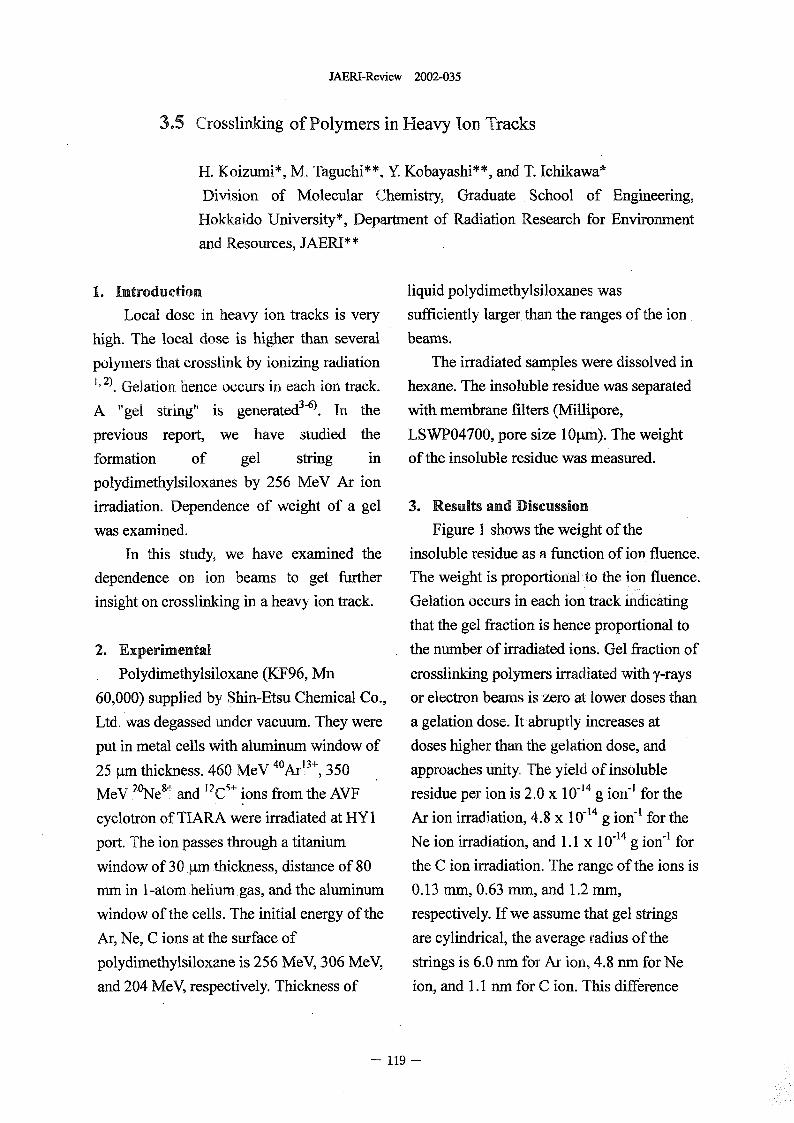
JAERI-Review 2002-035
3.5 Crosslinking of Polymers in Heavy Ion Tracks
H. Koizumi*, M. Taguchi", Y Kobayashi**, and T. Ichikawa*Division of Molecular Chemistry, Graduate School of Engineering,
Hokkaido University*, Department of Radiation Research for Environmentand Resources, JAERI**
1. Introduction liquid polydimethylsiloxanes wasLocal dose in heavy ion tracks is very sufficiently larger than the ranges of the ion
high. The local dose is higher than several beams.polymers that crosslink by ionizing radiation The irradiated samples were dissolved in1,2) . Gelation hence occurs in each ion track. hexane. The insoluble residue was separated
-6)A " get string" is generated� In the with membrane filters (Millipore,previous report, we have studied the LSVvTO4700, pore size I Opm). The weightformation of gel string in of the insoluble residue was measured.polydimethylsiloxanes by 256 MeV Ar ionirradiation. Dependence of weight of a gel 3. Results and Discussionwas examined. Figure I shows the weight of the
In this study, we have examined the insoluble residue as a ftinction of ion fluence.dependence on ion beams to get finther The weight is proportional to the ion fluence.insight on crosslinking i a heavy ion track. Gelation occurs in each ion track indicating
that the gel fraction is hence proportional to2. Experimental the number of irradiated ions. Gel fraction of. Polydimethylsiloxane KF96, Mn crosslinking polymers irradiated with y-rays60,000) supplied by Shin-Etsu, Chemical Co., or electron beams is zero at lower doses thanLtd. was degassed under vacuum. They were a gelation dose. It abruptly increases atput in metal cells with aluminum window of doses higher than the gelation dose, and25 4m thickness. 460 MeV4OAr"+, 350 approaches unity. The yield of insoluble
V 2NeV 12CI+ 10-14 g on-1Me and ions from the AVF residue per ion is 20 x for thecyclotron of TIARA were irradiated at HY l Ar ion irradiation, 48 x 0-14 g iorf 1 for theport. The ion passes through a titanium Ne ion irradiation, and 1. 1 x 0-14 g ion-' forwindow of 30 4m thickness, distance of 80 the C ion iadiation. The range of the ions ismm in I -atom helium gas, and the aluminum 0.13 mm, 063 mm, and 12 mm,window of the cells. The initial energy of the respectively. If we assume that gel stringsAr, Ne, C ions at the surface of are cylindrical, the average radius of thepolydimethylsiloxane is 256 MeV,.306 MeV, strings is 60 nm for Ar ion, 48 nm for Neand 204 MeV, respectively. Thickness of ion, and 1. 1 rim for C ion. This diff6rence
119
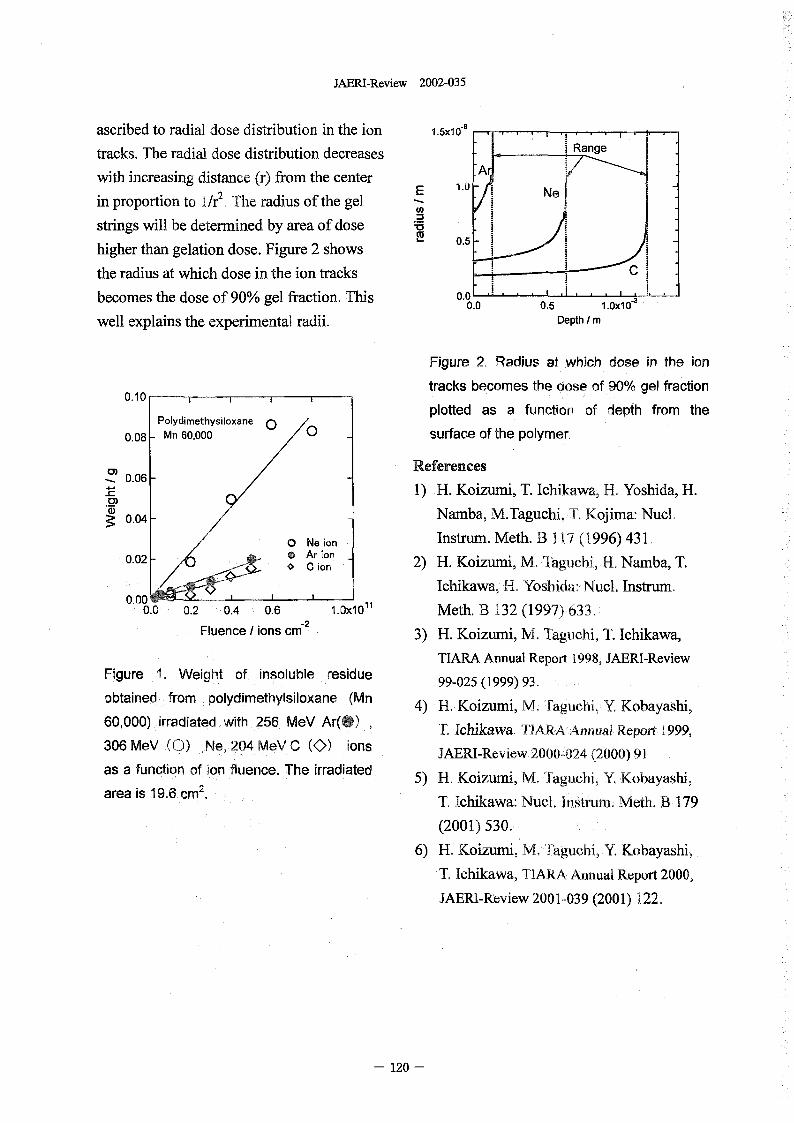
JAERI-Review 2002-035
ascribed to radial dose distribution in the ion 1.5x1O_8 . . .
Rangetracks. The radial dose distribution decreases'Ar -7with increasing distance () from the center 1.0E Ne
in proportion to I r2l The radius of the gel,2strings will be determined by area of dose
0.5higher than gelation dose. Figure 2 shows
the radius at which dose in the ion tracks
becomes the dose of 90% gel fraction. This 0.00.0 0.5 1.0xio-,
well explains the experimental radii. Depth m
Figure 2 Radius at which dose in the ion
0.10 tracks becomes the dose of 90% gel fraction
Polydimethysiloxane plotted as a function of depth from the0.0 - Mn 60,000 surface of the polymer,
References0.06 -
1) H. Koizumi, T. Ichikawa, H. Yoshida, H..2)
0.04 - Namba, M.Taguchi, T. Kojima: Nucl.
0 Ne ion Instrum. Meth. 13 117 1996) 43 .0.02 0 Ar ion 2) H. Koizurni, M, Taguchi, H, Namba T.0 ion
Ichikawa, H. Yoshida- Nucl. Instrum.0.00
0.0 0.2 0.4 0.6 I.OX1011 Meth. B 132 1997) 633�
Fluence ions cm 3) H. Koizurni, M. Taguchi, T. Ichikawa,
TIARA Annual Report 1998, JAERI-Review
Figure 1. Weight of insoluble residue 99-025 1999) 93�
obtained from polydimethylsiloxane Min 4) H, Koizumi, M. Taguchi, Y Kobayashi,
60,000) irradiated with 256 MeV Ar(O) , T. Ichikawa. TIARA Annual Report 1999,
306 MeV (0) Ne, 204 MeV C (0) ions JAERI-Review 2000-024 2000 91
as a function of ion fluence. The irradiated 5) H. Koizurni, M. Taguchi Y Kobayashi,
area is 19.6 CM2. T. Ichikawa: Nucl. lnstftlru� Meth, B 179
(2001) 530�
6) H. Koizumi, M. Taguchi, Y Kobayashi,
T, Ichikawa, TIARA Annual Report 2000,
JAERl-Review 2001-039 2001) 121
120 -
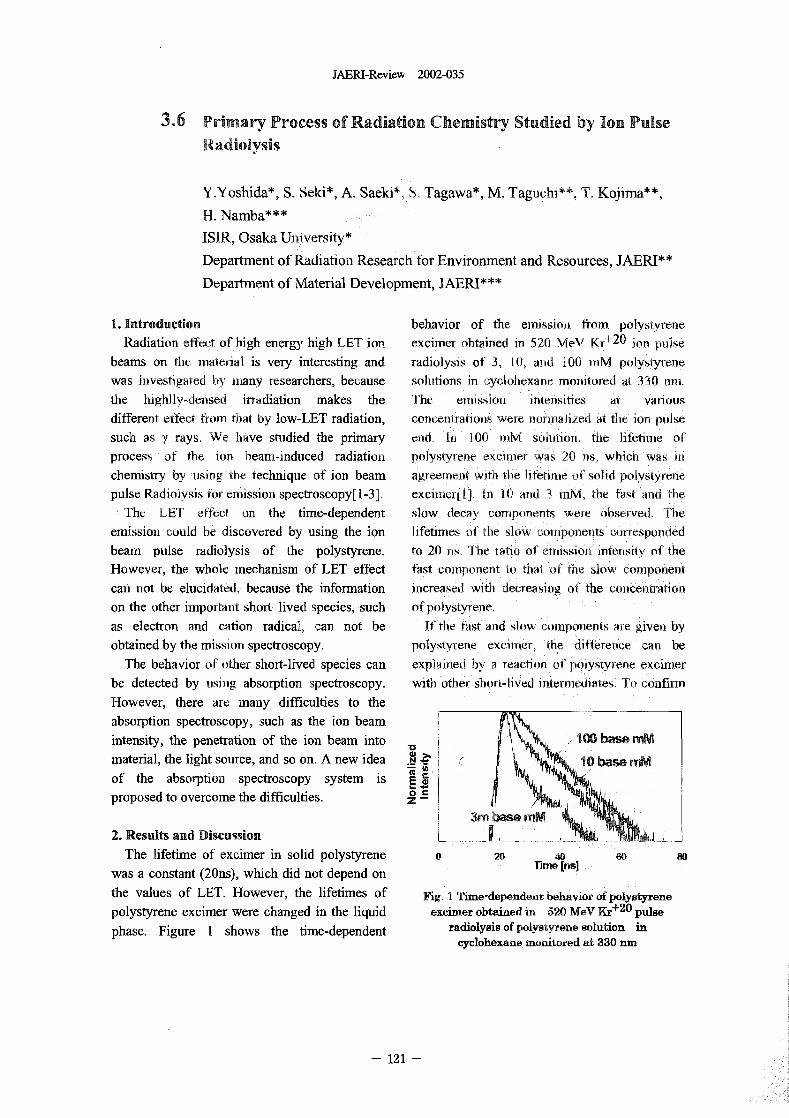
JAERI-Review 2002-035
3.6 Primary Process of Radiation Chemistry Studied by Ion PulseRadiolysis
Y.Yoshida*, S, Seki*, A. Saeki*, S. Tagawa*, M. Taguchi-*-, T, Kojima**,H. Namba***ISIR, Osaka University*Department of Radiation Research for Environment and Resources, JAER1**Department of Material Development, JAERI***
1. Introduction behavior of the eission from polystyreneRadiation effect of igh energy high LET ion excirner obtained in 520 M01 Kr+20 Ion pulse
beams on te material is very interesting and radiolysis of 3 10, ad 100 mM polystyrenewas ivestigated by many researchers, because solutions in cyclohexan mnitored at 330 mri.the highily-densed irradiation makes the The emission intensities at variousdifferent effect from tat by low-LET radiation, Concentrations were normalized at the ion pulsesuch as rays. We ave studied the primary end, In 00 mM solution, te lifetime ofprocess of te ion beam-induced radiation polystyrene Orner was 20 us wich was inchemistry by rising the technique of ion beam agreement with the lfetime of solid polystyrenepulse Radiolysis for enhssion spectroscopy[ 13]. excilner[l), ID 10 and 3 M, the fast and the
The LET effect on the time-dependent slow decay omponents were, observed. Theemission could be discovered by using the ion lifetimes oftbe slow components correspondedbeam pulse radiolysis of te polystyrene. to 20 s, The ratio of emissio itensity of theHowever, the wole echanism of LET effect fast component to that of tile slow componentcan ot be elucidated, because the iformation increased with decreasing of the concentrationon the other important short-lived species, such of polystyrene.as electron and cation radical, can not be If the fast and slow components are gen byobtained by the mission spectroscopy, polystyrene t=imer, the difference can be
The behavior of other short-lived species can explained by a eaction of polystyrene excimerbe detected by using absorption spectroscopy. with other sbort-lived intentiediates. To c6nfin-nHowever, there are many difficulties to theabsorption spectroscopy, such as the ion beamintensity, the penetration of the ion beam into 10 bse mMmaterial, the light source, and so on. A new idea 4� IO base mMof the absorption spectroscopy system is Eproposed to overcome the difficulties. 0.S
3m base mm2. Results and Discussion
The lifetime of excimer in solid polystyrene o 20 40 60 80
was a constant 20ns), which did not depend on Tilne ["S]
the values of LET. However, the lifetimes of Fig. I Tme-dependent behavior of polystyrenepolystyrene excimer were changed in the liquid excimer obtained in 520 MeV Kr+20 pulsephase. Figure I shows the time-dependent radiolysis of polystyrene solution in
cyclohexane. monitored at 330 m
121
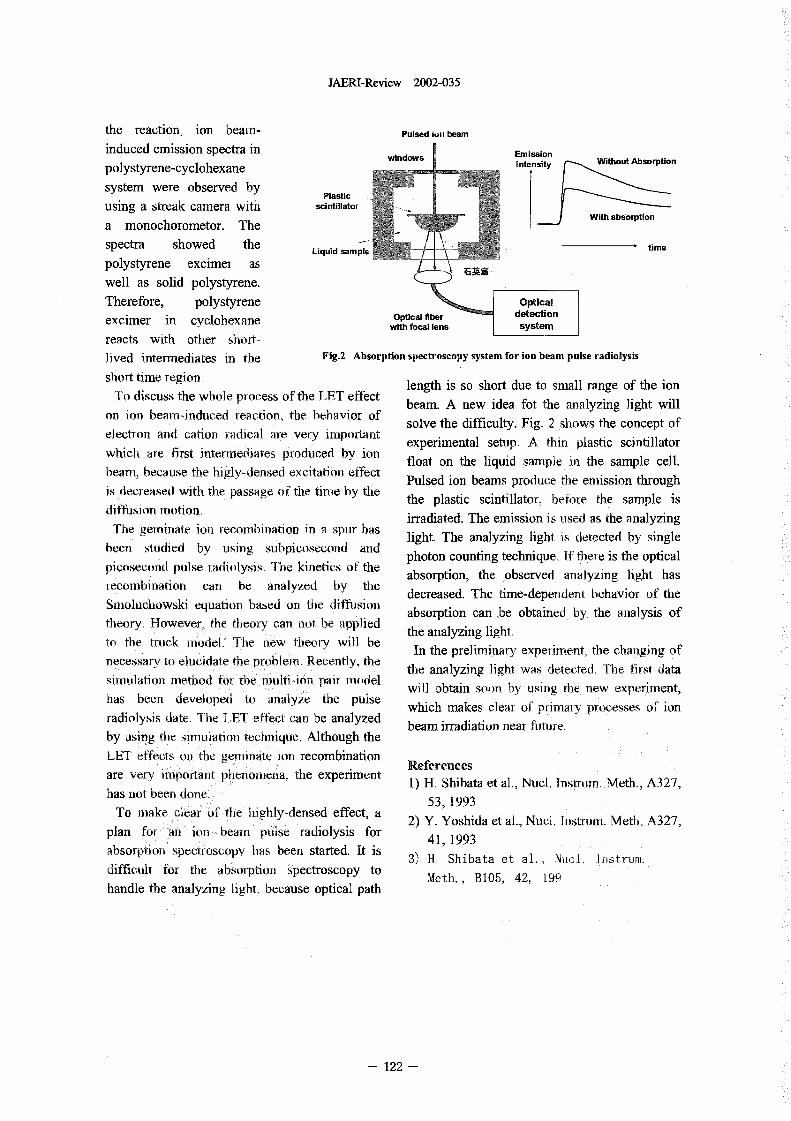
JAERI-Review 2002-035
the reaction, ion beam- Pulsed ion bearn
induced emission spectra in windows Emission Without Absorption
polystyrene-cyclohexane In ity
system were observed by Plastic
using a streak camera with scintillator
a monochorometor. The a on
spectra showed theLiquid sample time
polystyrene excime as
well as solid polystyrene.
Therefore, polystyrene Optical
excimer in cyclobexane Optical fiber detectionwith focal lens system
reacts with other short-lived intermediates in the Fig.2 Absorption spectroscopy system for ion beam pulse radiolysis
short time region, length is so short due to small range of the ion
To discuss the whole process of te LET effect beam. A new idea fot the analyzing light will
on ion beam-induced reaction, te behavior of solve the difficulty. Fig 2 shows the concept ofelectron and ation radical are very importantwhich are first intermediates produced by lot] experimental setup. A thin plastic scintillator
beani, because the higly-densed ecitation effect float on the liquid sample in the sample cell.
is decreased with the passage of the time by the Pulsed ion beams produce the emission through
diffusion motion. the plastic scintillator, before the sample is
The geminate ion recombination in a spur has irradiated. The emission is used as the analyzing
been studied by using subpicosecond and light. The analyzing light is detected by single
picosecond pulse radiolysis, The kinetics of the photon counting technique, If there is te opticalabsorption, the observed Orlalyzing light has
recombination can be analyzed by the decreased. The time-dependent behavior of the
Smoluchowski equation based o te difftislon absorption can be obtained by the analysis of
theory. However, te teory can not be applied the analyzing light.
to the tck model. The Dew theory will be In the preliminary experiment, te canging of
necessary to elucidate the problem. Recently, the the analyzing light was detected. The first datasimulation method for the multi-ion pair odelhas been developed to analyze the pulse will obtain soon by sing the new experiment,
radiolysis (late, Te LET effect can be analyzed which makes clear of primary processes of ionbeam irradiation near hiture,
by uing the simulation technique, Although the
LET effects on te gerninate ion recombination References
are very Anportant phenomena, the experiment 1) B. Shibata et al., Nucl, Instruni M&, A327,has Dot been done. 53, 1993
To make lear of the highly-densed effect, a 2) Y. Yoshida et al., Nuel. Instrom. Meth, A327,plan for an ion bearn pulse radiolysis for 41, 1993
absorption spectroscopy has been started. It is 3) H. Shibata et al., Ntj(,,],. Itrim.
difficult for te absorption spectroscopy to Meth., B105, 42, 199
handle the analyzing light, because optical path
122 -
JAERI-Review 2002-035
3.7 Dosimetry for 345 MeV/u ion beams using thin film dosimeters
T.KOJIMA, .SUNAGA, H.TAKIZAWA, H.HANAYA, -TACHIBANA
Advanced Radiation Technology Center, JAERI
1. Introduction 0.05 mm) and Gafchromic (MD-1260: 10
Various advanced material science X IO X 0 007 mm) were used as candidates
and biological studies have been applicable also to ion beams. These film
performed using ion beams obtained from dosimeters are enough thin for most of ion
the TIARA AVF cyclotron (e.g. H: max. beams to completely penetrate. The
90 MeV). Practical evaluation of absorbed averaged LET calculated using ELOSS3 4)dose and dose distribution is crucial for code based on Ziegler's Table , was in
interpretation of radiation effects of ion agreement within ± 2% with those
beams on materials or biological calculated using TRIM-98 code 5).
substances considering different radiation The ion, beams wth the energies
qualities and inhomogeneity of energy ranging 3 - 45 MeV/amu were uniformly
deposition in an interested volume. scanned to 1 00 1 00 mm2 in area and used
Dosimetry required for these research for irradiation study on dosimeters under
works should cover the doses ranging from vacuum about 2X 04 Pa. The absorbed
0.005 to 200 kGy with high precision dose preliminarily estimated by fluence
within :E5% and the spatial resolution of and stopping power values were chosen in
about Itm for lateral and depth directions. linear dose response range of films when
Thin film dosimeters of about 10-200 irradiated by the low LET radiations.
�tm in thickness, which are well Beam fluence was monitored
-characterized for 60CO y -rays or 2-MeV employing a custom-made Faraday cup
electrons in the above dose range, have (suppression:-IOOV) in terms of integrated
been applied to dosimetry for ion beams, charge. In advance to characteristic study
by means of the linear energy transfer of film dosimeters, uncertainty in fluence
(LET) characteristics study of films measurement was estimated by
involving development of precise fluence simultaneous use of a total-absorption,2)measurement and dose mapping technique calorimeter' These two detectors were
with high spatial resolution" 2). The exposed to scanning ion beams through a
outline of the development is summarized pair of circular apertures of 30 mm in2in this paper. dia.(7.07 CM in area). The fluence values
measured by the Faraday cup q) (CM-2)
2.Experimental were compared with those estimated from
The thin film dosimeters: alanine-PE calorimetry based on nominal incidentjD " -2)(DL-alanine 60wt%, low density particle energy (CM . The related
polyethylene 40wt%: 8X30XO.223 mm), ratios of fluence(P. and those estimated
Cellulose-triacetate(CTA 85wt%, triphnyl using energy values derived from the
-phosphate 15wt%: 8X50XO.125(or 003) -magnetic field amplitude at an analyzing
mm), Radiochromic (FWT-60: 10 X 10 X magnet. The average value of the ratios
- 123 -
JAERI-Review 2002-035
(D �,,/(D , is 102 and averaged coefficients 19-�Lm line-to-line inner distance. Color
of variation for (D c is 4 2% at a 68% change of irradiated area relevant to the
confidence level. These results lead us to mesh pattern on the mask was analyzed
confirm that this fluence measurement using a microscopic spectrophotometer
system is sufficient to use for 3- 45 MeV/ (HITACHI, U-6500). Color change
amu ion beams covering wide range down patterns relevant to irradiated areas were
to a few nA/cm2: about 0.0 - 270 nC/cm 2 clearly identified with sufficient sharpness
as integrated charge in the Faraday cup. equivalent to the spatial resolution of
I �tm.
3.Dosimeter characteristics study
Dose responses, electron spin 5.Conclusion
resonance signal amplitude per unit dose Overall uncertainty in ion beam
for alanine, and optical density change per dosimetry employing thin film dosimeters
unit dose for others estimated from linear is estimated better than ±5% at a 68
fitting of four dose points were normalized confidence level, by addition in quadrature60COto those for y -rays or 2-MeV of uncertainty components of fluence
electrons. All the film dosimeters have a measurement( ± 2) and film dosimetry
similar tendency showing decrease of ± 4). This accuracy and spatial
relative dose response with increase of resolution of I �tm meet fully the
linear energy transfer (LET). The requirement to ion beam dosimetry in
scattering range of one dose response is material science and biological research
about ± 4 at a 68% confidence level. using a TIARA cyclotron.
It suggests the applicability of these
dosimeters to ion beams when calibrated References
by low LET radiations with appropriate I)T.K0j1ma et al.: Radiat.Phys.Chem., 53,
correction on dose responses on the basis (1998) 115
of obtained relations. 2)T.Kojima et al.:IAEA-TECDOC-1070
(1999) 197�
4. Dose profile measurement 3)K.Hata and H.Baba: JAERI-M 88-184
Gafcbromic dosimeter which has only 7 (1988)
ju in thick sensitive layer was tested for 4)J.F.Ziegler, J.PBiersack and U.
depth dose profile measurement with high Littmark "The stopping power and
spatial resolution by irradiation through a range of ions i solids", Vol.1(1985)
stepping multi-layer polyimide phantom. (Permagon Press, Oxford).
The result shows a potential of depth dose 5)T.K0j1ma et al.:JAERI-Conf 2000-1
distribution measurement in 12 Mg/CM2 (2000) 3
(7.5 IL m) step observing of the Bragg
-peaks.
The lateral dose distribution measurement
was tried by irradiation of films to 0.5-5
kGy with 450-MeV 129Xe23+ ions through a
Cu mesh mask having 6Lm linewidth and
-124 -
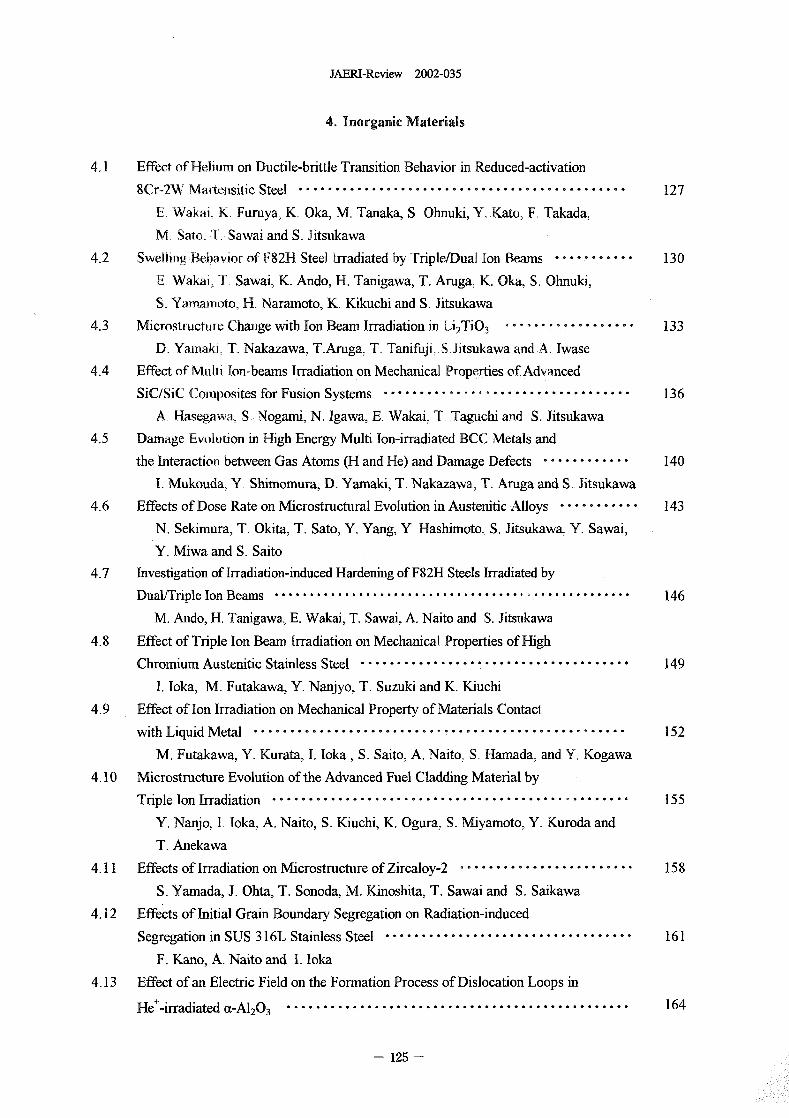
JAERI-Review 2002-035
4. Inorganic Materials
4.1 Effect of Helium on Ductile-brittle Transition Behavior in Reduced-activation
8Cr-2W Mar(ensitic Steel ............................................. 127
E. Wakal. K. Furuya, K. Oka, M. Tanaka, S, Ohnuki, Y. Kato, F. Takada.
M, Sato, T. Sawal and S. Jitsukawa
4.2 Swelling Behavior of F82H Steel Irradiated by Tiple/Dual Ion Beams ........... 130
E, Wakai, T, Sawai, K. Ando, H. Tarugawa, T. Aruga, K. Oka. S. Ohnuki,
S. Yamamoto, H. Naramoto, K. Kikuchi and S. Jitsukawa
4.3 Microstructure Change with Ion Beam Irradiation in Li2TIO3 ................. 133
D. Yamak), T. Nakazawa, T.Aruga, T. Tanifuji, SJitsukawa and A. wase
4.4 Effect of Multi Ion-beams Iradiation on Mechanical Properties of Advanced
SiC/SiC Composites for Fusion Systems .................................. 136
A. Hasegawa, S, Nogami, N. Igawa, E- Wakai. T, Taguchi ad S. Jitsukawa
4.5 Damage Evolution in High Energy Multi Ion-irradiated BCC Metals and
the Interaction between Gas Atoms (H and He) and Damage Defects ............ 140
1. Mukouda, Y, Shimomura, D. Yamaki, T. Nakazawa, T. Aruga and S. Jitsukawa
4.6 Effects of Dose Rate on Microstructural Evolution in Austenitic Alloys ........... 143
N. Sekimura, T. Okita, T. Sato, Y. Yang, Y, Hashimoto. S. Jitsukawa. Y. Sawal,
Y. Mwa and S. Saito
4.7 Investigation of Irradiation-mduced Hardening of F82H Steels Irradiated by
Dual/Triple Ion Beams ................................................... 146
M. Ando, H. Tanigawa, E. Wakal, T. Sawai, A. Naito and S. Jitsukawa
4.8 Effect of Triple Ion Beam Irradiation on Mechanical Properties of High
Chromium Austenitic Stainless Steel ..................................... 149
1. loka, M. Futakawa, Y. Nanjyo, T. Suzuki and K. Kiuchi
4.9 Effect of Ion Irradiation on Mechanical Property of Materials Contact
with Liquid Metal ................................................... 152
M. Futakawa, Y. Kurata, 1. loka, S. Saito, A. Naito, S. Hamada, and Y Kogawa
4.10 Microstructure Evolution of the Advanced Fuel Cladding Material by
Triple Ion Irradiation ................................................. 155
Y. Nanjo, 1, loka, A. Naito, S. Kuchi, K. Ogura, S. Myamoto, Y. Kuroda and
T. Anekawa
4.11 Effects of Iradiation on Microstructure of Zircaloy-2 ........................ 158
S. Yamada, J. Ohta, T. Sonoda, M. Kinoshita, T. Sawal and S. Saikawa
4.12 Effects of Initial Grain Boundary Segregation on Radiation-induced
Segregation in SUS 316L Stainless Steel .................................. 161
F. Kano, A. Naito and 1. loka
4.13 Effect of an Electric Field on the Formation Process of Dislocation Loops in
He+-Irradiated a-A1203 ............................................... 164
- 125 -
JAERI-Review 2002-035
T. Hguchi, K. Yasuda, K. Shliyama, M. KutsuwadaK. Tanaka, C. Knoshita and
H. Abe
4.14 Photoluminescence Properties of Th Implanted GaN ......................... 167
Y. Nakanisbi, A. Wakahara, H. Okada, A. Yoshida, T. Ohshima and H. Itoh
4.15 Formation Process and Stability of Radiation-induced Non-equilibrium
Phase in Silicon (111) ................................................. 170
S. Ohnuki, E. Shioya, M. Takeda, T. Suda, S. Watanabe, A. Miyashita, M. Ishino
and .Yoda
4.16 Effect of Cr-lon Implantation in T102:
Realization of Impurity Concentration Gradients ............................ 173
T. Yamaki, T, Sumita, S. Yamamoto, A. Mlyashita. and H. Itoll
4.17 Modification Of C60 Thin Films by 7-MeV 12C21- Ion Irradiation ................. 176K. Narumi, Y.Xu, K. Myashita and H. Naramoto
4.18 Investigation of the Resonant Vibration Modes of Self Interstitial Atoms 'M
Hcp Metals by Low Temperature Specific Heat Measurement .......... .... 179
M. Watanabe
4.19 Hydrogen Migration in Electron Irradiated I'd-based Alloys .................... 181
K. Yamakawa, Y, Chiml, A. Iwase, T. Yano and N. Ishikawa
4.20 Electron Irradiation Effect in Oxygen-deficient EuBa2CU30 Y .................. 184
N. Ishikawa, Y. Chiri, A. wase, H. Wakana, T. Hashimoto and 0. Mchikarm'
4.21 Interaction of Frenkel Pairs with Cu Atoms in Fe-Cu Alloys ................... 186
Y. Chiri, A. Iwase, N. Ishikawa and S. Ishino
4.22 Radiation Enhanced Copper Segregation Processes in Pressure Vessel
Steel Model Alloys during Electron Irradiation .............................. 188
S. Ishino, A. Iwase, Y. Chimi, N. Ishikawa, Baglyono. M. Suzuki, T. Tobita and
K. Aizawa
4.23 Radiation Effects o Li-vacancy Ordering NaTI-type Li Compound .......... 191
M. Yahagi, T. Hashimoto, H. Sugai, A. Iwase, Y. Chimi, N. Ishikawa.
H, Hamanaka and K, Kuriyama
4.24 Elastic Property of Nanocrystalline Gold after Low-temperature 2 MeV
Electron Irradiation .................................................. 193
H. Tanimoto, Y. Koda, T. Yamada, S. Sakai, H. Mzubayashi, N. Ishikawa.
Y. Chuini and A. Iwase
4.25 ESR Characterization of Activation of Implanted Phosphorus Ions in
Silicon Carbide ..................................................... 195
J. Isova, N. Mzuochi- T. Ohshima. A. Ohl, N. Mon'shita and H. Itoh
126 -
JAEPd-Review 2002-035
4.1 Effect of Helium on Ductile-Brittle Transition Behavior
in Reduced-Activation 8Cr-2W Martensitic Steel
E. Wakai*, K. Furuya**, K. Oka***, M. Tanaka***, S. Ohnuki*** Y.Kato* F. Takada****, M. Sato**,T. Sawai* and S. Jtsukawa*Department of Materials Science, Tokai Establishment, JAERI*, Department ofFusion Engineering Research, Naka Establishment, JAEF-I**, Faculty ofEngineering, Hokkaido University***, Department of JMTR Hot Laboratory,Oarai Establishment, JAERI****
1. Introduction energy degrader was used to implantLow-activation martensitic, steels are helium into the specimens uniformly The
candidate materials for the fa-st wall and total helium concentration andblanket structure of ftision reactors and displacement damage were estimated to bealso prominent materials for the target 100 appm and 004 dpa, respectively. fhevessel of spallation neutron source. In implantation temperature was monitored bythese systems, the lugh-energy neutrons or then-nocouple located at the specimenprotons reduce displacement damage and holder.generate hydrogen and helium gas atoms Following the helium implantation,in the materials. Helium and hydrogen small purich (SP) tests were carried out ataccumulations due to transmutation and temperatures between 93 K and RT Theimplantation in these systems of displacement rate was 02 mm/min.Themartensitic steels have been considered as DBTT was obtained by measuring thea potential cause for SP-fracture energy, which was defined asirradiation-hellum-f--i-nbrittlement 1-51 and the total area below e SP load-deflection-hydrogen-ernbrittlement [6-7]. In ts curve, at various test temperatures A diskstudy, the effect of helium o ductile-brittle of 3 nNn in diameter was gjasped by dies attransition temperature of martengitic steel its peripheral edge and deformed by bulge
has been exarnined by small-punch test, deformation mode in a cold bath. After theSP tests, the fiacture surface w oserved
2. Experimental by a sanning eectron microscope (SEM).,_ rhe aterial used in this study was
the F82H reduced-activation 8%Cr 3. Results and ]Discussionmartensitic steel '17he load-deflection curves were(Fe-8Cr-2W-0.2V-0.04Ta-0.IQ Seet of measured at arious temperatures from 930.3 mm in thickness polished by sand paper K to room temperature in te unimplanted.(#1000) was punched into 3 mm diameter and implanted specimens. For thedisks. A of the specimens were fixed on unimplanted F82H steel, te ductilethe specimen holder by molten indiuni, and behavior in the curves was observed atsimultaneously implanted with a bearn of temperatures between II 0 K, and RT and50 MeV-He particles, whose range was the brittle behavior was seen below II K.estimated to be 04 m, from te AVF For the I 0 appin He-irnplanted F82H steel,cyclotron at TLA.RA facility of JAERI. An the brittle behavior was observed below
- 127 -
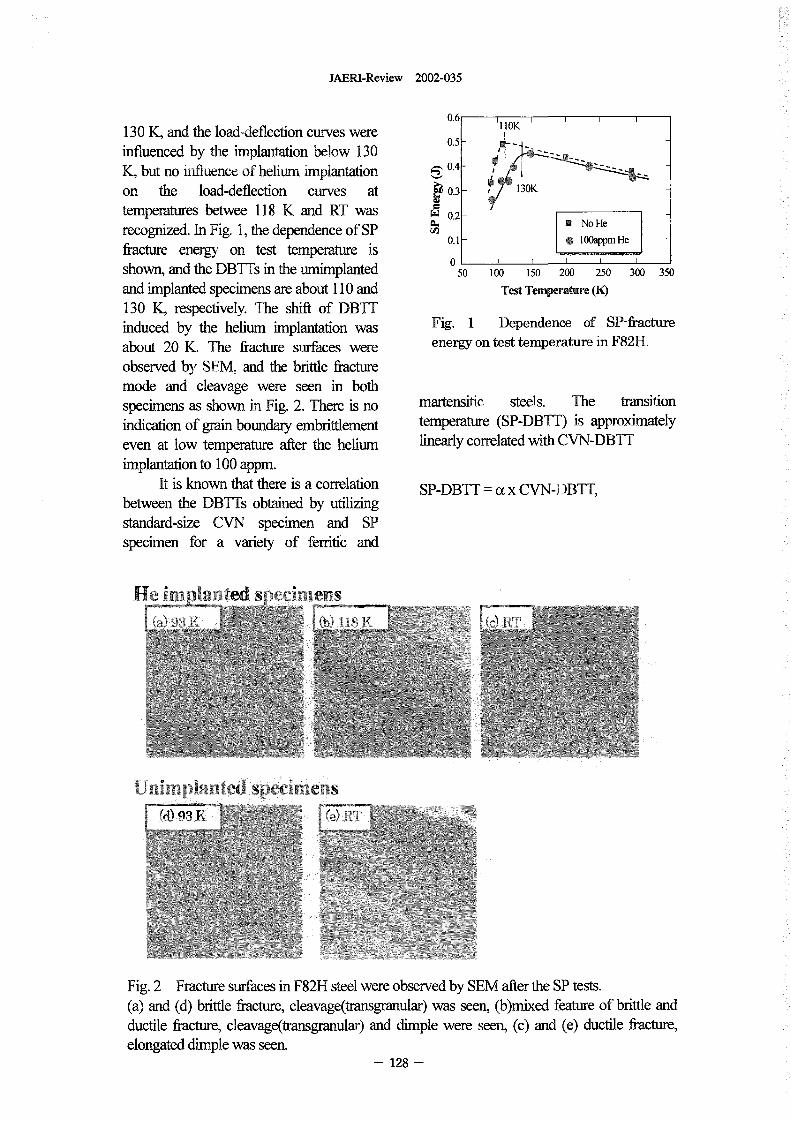
JAERI-Review 2002-035
0.6 110K130 K, and the load-deflection curves were 0. -
influenced by the implantation below 130K, but no influence of helium implantation 0.4-
on the load-deflection curves at 0.3 - OK
temperatures betwee 118 K and RT was 0.2-C6. No He
recognized. hi Fig. 1, the dependence of SP 0.1 - 1 00appm Hefracture energy on test temperature is
0shown, and the DBTTs in the urnimplanted 50 100 150 200 250 300 350
and implanted specimens are about I 0 and Test Temperature K
130 K respectively. The shift of DBTrinduced by the helium implantation was Fig. 1 Dependence of SP-fractureabout 20 K. The fracture surfaces were energy on test temperature F82H.observed by SEM, and the brittle fi-acturemode and cleavage were seen in bothspecimens as shown in Fig. 2 There is no martensitic steels. The transitionindication of grain boundary embrittlement temperature (SP-DBTT) is approximatelyeven at low temperature after the helium linearly con-elated with CVN-DBfTimplantation to I 0 appm.
It is known that there is a correlation SP-DBTT = cc x CVN-DBTT,between the DBTTs obtained by utilizingstandard-size CVN specimen and SPspecimen for a vety of ferritic and
He
UnImplanted secimens
Fig. 2 Fracture surfaces in F82H steel were observed by SEM after the SP tests.(a) and (d) brittle fi-acture, cleavage(trawgranular) was seen, (b)mixed feature of brittle andductile fracture, cleavage(transgranidar) and dimple were seen, (c) and (e) ductile fcture,elongated dimple was seen.
- 128 -
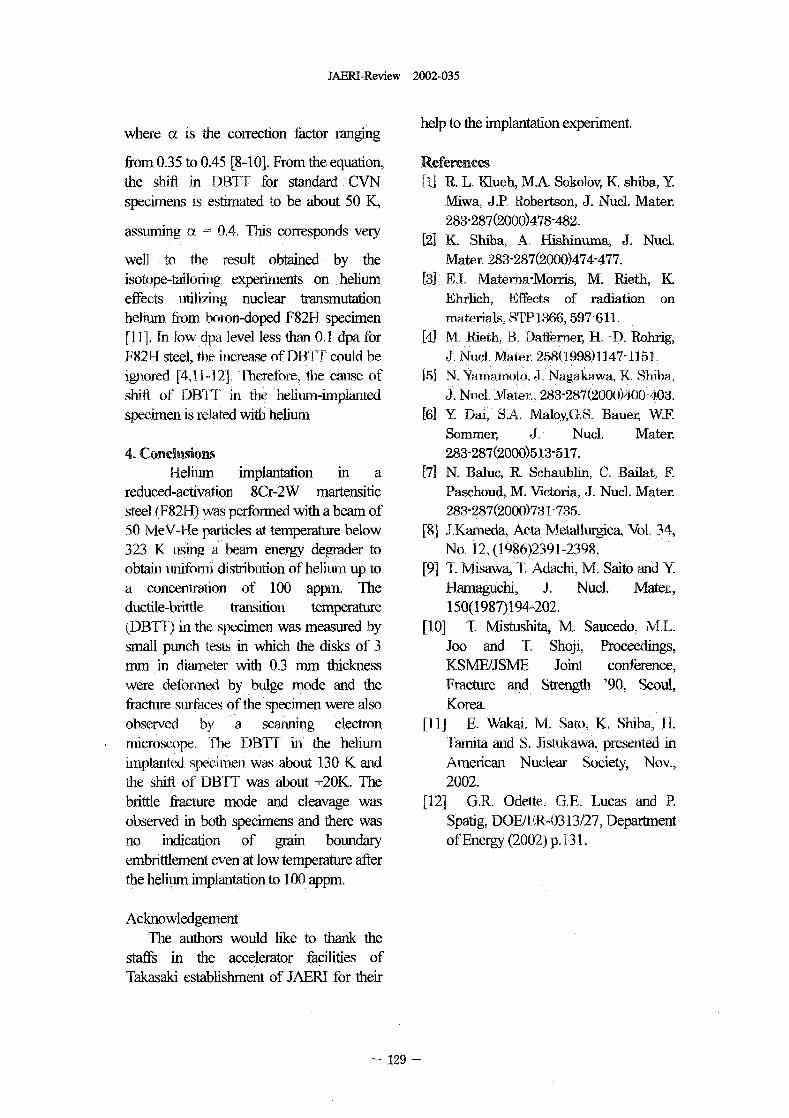
JAERI-Review 2002-035
where a is the correction factor ranging help to the implantation experiment.
from 035 to 045 8-10]. From the equation, Referencesthe shift in DBTT for standard CVN [11 R. L. Uueh, MA. Sokolov, K. shilia, Yspecimens is estimated to be about 50 K, Miwa, J.P Robertson, J. Nucl. Mater.
assuming ot 0A This corresponds very 283-287(2000)478-482.[21 K. Shiba, A. Hishinuma, J. Nucl.
well to the result obtained by the Mater. 283-287(2000)474-477.
isotope-tailonng experiments on helium [31 E.1, Materna-Morris, M. Rieth K
effects utilizing nuclear transmutation Ehrlich, Effects of radiation on
helium from boron-doped F82H specimen materials, STP1366,597-611.
[I I]. In low dpa level less than 0 I dpa for [41 M. ieth, B, Dafterner, H. -D. Rohrig,
F82H steel, the icrease of DBTF could be J. Nucl. Mater 258(11,998)1I47-115L
ignored [4,11 _ erefor te cause of 05] N. Yamamoto, J. Nag K. Siba,
shift of DBTT' in the heliuni-implanted J. Nucl, Mater., 283-287(20004oo-4w.
specimen is related with helium [61 Y Dai, SA, MaloyG.S. Bauer, WE
Sommer, J, Nucl. Mater.
4. Conclusions 283-287(2000)5 3517.
Helium implantation in a [71 N. Baluc, R. Schaublin, C. Bailat F.
reduced-activation 8Cr-2W martensitic Paschoud, M. Victoria, J. Nucl. Mater.
steel (F82H) was performed with a beam of 283-287(2000)731-735�
50 MeV-He prticles at temperature below [9] J.Kameda, Acta Metallurgica, Vol. 34,
323 K Using a beam energy degrader to No. 2,(1986)2391-2398.
obtain uniforrn distribution of helium up to [91 T. Msawa,'E Adachi, M. Saito and
a concentration of 100 appar. The flaniaguchi, J. Nucl. Mater.,
ductile-brittle transition temperature 150(1987)194-202.
(DBTT i the specimen was measured by [10] T, Mistushita, M. Saucedo, M.L.
small cb tests in which the disks of 3 Joo and T Shoji, Proceedings,punmm in diameter with 03 m tkness KSNOJSME Joint conference,
were defortned by bulge mode and the Fracture and Strength 90, Soul,
fracture surfaces of the specimen were also Korea
observed by a scanning electron [II J E. Wakai. M. Sato. K Shiba, H.
rylicroscope. The DBTT 'Hi the helium Tarnita and S. istakawa, presented 'M
implanted specimen was about 130 K ad American Nuclear Society, Nov.,
the shift of DBI-f was about +20K. The 2002.
brittle fi-acture mode and cleavage was [12] G.R. Odette� .E. Lucas and, P.
observed in both specimens and there was Spatig, DOE/ER-0313/27, Department
no indication of grain boundary of Energy 2002) p 13 .
embrittlement even at low temperature after
the hefium implantation to I 0 appin.
Acknowledgement
The authors would like to thank the
staffs in the accelerator facilities of
Takasaki establishment of JAERI for their
129 -
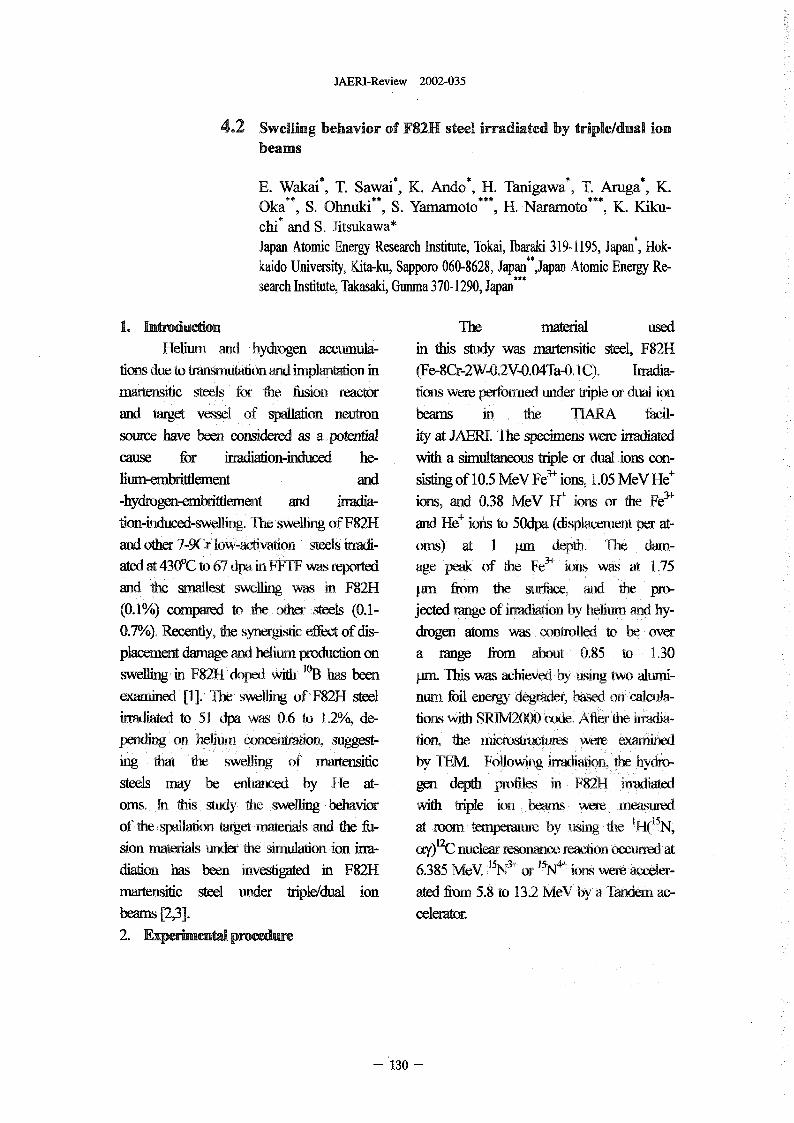
JAERI-Review 2002-035
4.2 Swelling behavior of F82H steel irradiated by triple/dual ionbeams
E. Wakai*11 T. Sawai% K. Ando*, H. Tanigawa% T. Aruga* K.Oka**, S. Ohnuki**, S. Yamamoto***, H. Naramoto"', K. Kiku-chi* and S. itsukawa*Japan Atomic Eergy Research Institute, Tokai, lbaraki 319-1195, Japan', Hok-kaido University, Kita-ku, Sapporo 060-8628, Japan"Japan Atomic Energy Re-search Institute, Takasaki, Gunina 370-1290, Japan***
1. Introduction The material usedHelitim and, hydrogen accumula- in this study was martensitic steeL F82H
tions due to transmuwition and implantation in (Fe-8Cr-2W-0,2V-0.04Ta-0 I Q. Irradia-martemitic steds for the fusion eor tions were performed under tiple or dual ionand target vessel of spallation neutron beams in, the TIARA facil-
source have bew considered as a potential ity at JAERI The specimens were irradiatedcause for irrddiation-hxhiced he- with a smultaneous tple or dal ions con-
hum-embrittlernent and sisting of 10.5 MeV Fe+ ions, 1.05 MeV He+-hydrogen-embrittlement and irmdia- ions, and 038 MeV W ions or the Fe3+
tion-induced-swelling. The swelling of F82H and He ons to 50dpa displacement per a-and other 7-9Cr low-activabon steels in-di- oms) at I Wn depth. Te damated at 43CPC to 67 dpa in WIT was reported age peak Of the ions was at 1 35and the smallest swelling was in F82H Itm. from the surface, and the pro-(0.1%) compared to the other steels 0.1- jected range of irradiabon by helium and hy-0.7%). Recently, the synergistic effect of dis- drogen atoms was controlled to be overplacement damage and helium. production on a range from about 0.85 to 1.30swellingin F82H doped with N has been pm. Tins was achieved by ]using two alumi-examined [. The swelling of F82H steel num foil eergy degrader, based on calcula-irradiated to 51 pa was 06 to 12%, de- tions with SRIWOOO code. After the inwfia-pending on helium concentration, suggest- tion, the microstiveftwes wre examineding that the swellin of martensitic by Follo ng abon,
9 TFM %vi irmdi the hydro-steels my be enhanced by He at- gen depth profiles in F82H irradiatedorns, In this sly the swelling behavior with triple ion beams were easured
of the spallation target materials and the fu- at room temperature by using aw '("N,sion materials under the simulation ion irra- (xy)C nuclear esonance reaction occurred atdialion has been nvestigated in F82H 6.385 WV N3+ or V+ ions were acceler-inartensitic steel under triple/dual ion ated fiom 5.8 to 13.2 MeV by a tandem ac-beams 2,3]. celerator.
2. Experknental procedure
130 -
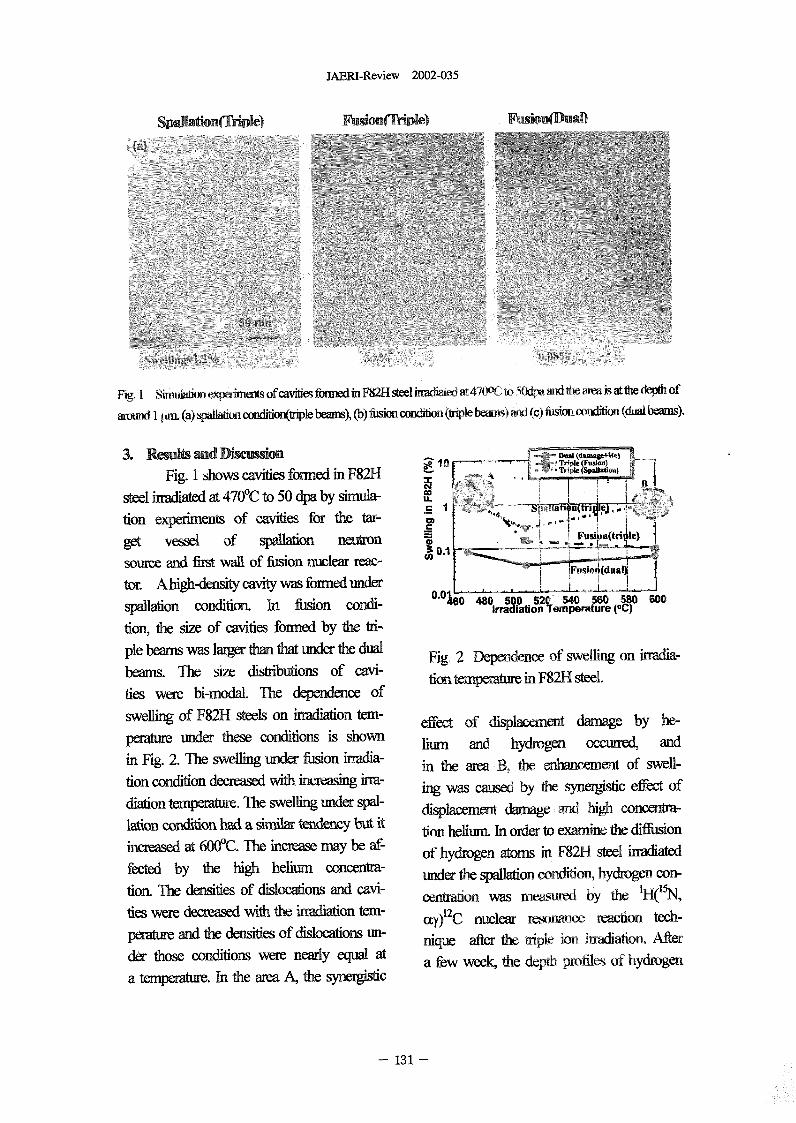
JAERI-Review 2002-035
Spaftbon(Tnple) Fusion(Triple) Fusion(DURA
Fig I Suia6onexpenmemofcavibesfomiedmF82Hsteelftra&teoat4700(-'to5odpamidti*,wetisatthedMffiof&uund i Vu (a) sp&dhon cotdum(�Tle beams), (b) fusion confton (triple beams) dW (c) fosion wndfton (dual beams)
3. Resufts wd Diwmion .gFig. 1 shows cavities formed in F82H
Nsteel irradiated at 4700C to 50 dpa by simula- U.
C Ition experiments of cavities for the tar-
CFusi� n(tri
get Vessel of spallation neutron OAsource and first waU of flision nuclear reac-
lor. Abigh-densitycavitywasfortnedm-rIn ftision condi- "0160 480 5 52
spallation condition. ,,On �e S411ra-611 Boo
tion, he sin of cavities ormed by the t-
pie beams was larger than dim under the dual Fig, 2 Dependence of swelling on irradia,-
beam. he size distributions of cavi- tion temperature in F82H steel.
ties were bi-modal. he dependence of
swelling of F82H steels on iadiation tem- effect of displacement darnage by he
perature under these conditions is sown hum and hydrogen occurred, and
in Fig. 2. The swelling under fiision irradia- in the area B, the eancement of swell-tion condition decreased with increasing irra-diation Witiperatute. The swelling under spal mg was caused by te s�mergistic effect of
Mon condition had a sm,Zu tendency but it displacement darnag a high concentra-ton helium. In order to examine the Mmon
increased at 600-C. The increase may be af- of hydrogen atoms in F82H steel uradiated.
fected. by the high heliurn concentra- under the spoliation condition, hydrogen con-
tion. The densities of dislocations and cavi- centration was measuied by the 'H("N'ties were decreased wilh the irradiation tem- OLY) 12C nuclear M)MICC reaetion tech_
perature and the densities of dislocations un- nique after the tripie ion iitiation. After
der those conditions were nearly equal at a few week, the depth profiles of hydiogena temperature. In the area A, the synergistic
- 131 -
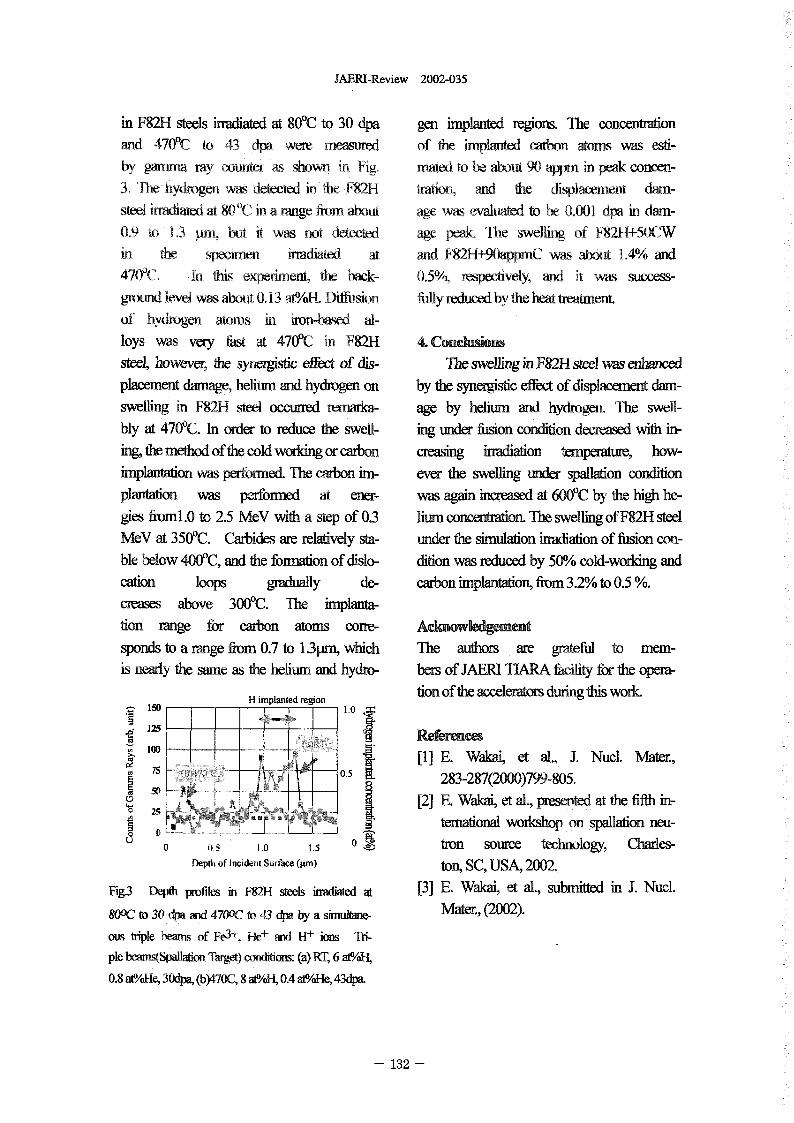
JAERI-Review 2002-035
in F82H steels irradiated at 800C to 30 dpa gen implanted regions. The concentration
and 47CPC to 43 dpa were measured of the implanted carbon atoms was estiby garatm ray counter as shown in Fig� maW to be about 90 appm in peak concen-I The hydrogen was detected i the F82H tration, and the displacement dain-steel iradiated at 80T in a range from about age was evaluated to be 0001 dpa in darn-
09 to 13 pm b it was not detected, age peak. The swelling of F82H+50CW
in lie specimen nrAated at and 82H+90appmC was about 1.4% and47WC. In Ibis erifflent te ack- 0.5%, respectively, and it was success-ground level was aout 0 13 ar/oH. Ddusion Rilly reared by the heat treatment
of hydrogen atoms in iron-based al-loys was very II& at 470'C in F82H 4. ConchL4onssteet however, he synergistic effect of dis- 'The swelling in F8214 sted was enhanced
placement damage, helium, and hydrogen on by the synergistic effect of displacement dam-swelling in F82H sl occurred rernarka- age by helium and hydrogen. The swell-
bly at 470"C. hi order to reduce the swell- ing under ftision condition decreased with in-ing, the method of the cold working or carbon creasing irradiation temperature, how-implantation was performed. The arbon im- ever the swelling under spallation conditionplantation was pefformed at ener- was gain mmsed at 60OPC by the high he-
gies fwml.O to 25 MeV with a step of 03 lium concentration. The swelling of F82H steelMeV at 3500C. Carbides axe relatively sta- under the simulation i-achation of fitsion cn-
ble below 4000C, and the formation of dislo- dition was reduced by 501/1o cold-working andcation loops gradually de- carbon implmtafion, fi-om 3.2% to 0.5 %.creases above 30ODC. The implanta-tion range for carbon atoms corre- Acknowkdgementsponds to a range from 07 to 1.3pni, which The authors are grateful to mern-Ls nearly the same as the helium and hydro- bers of JAER1 TLkRA facility for the opera-
H implanted region tion of the accelerators dining this work.1.0
125 References10D a
[1] E. WakA et al.. J. Nucl. Mater.,75 (j, 0.5 283-287(20W)799-805�
9 SD 40, -4-0 [2] E. Wak4 et al., presented at the fiffit in-I.-0 2,1,;
M ternational workshop on spallation neu-0 0�5 1.0 1.5 0 tron source teclintology, Charles-
Depth of ncident Suf face (gm) ton, SC, USA, 2002,
Fig3 Dq ples 82H steels mwitated at P] E. " et al., sub-nitted in J. Nucl.Matm, 2002).800C to 30 dpa ar)d 47W to 3 4m by a shnukane-
ous triple beams of Fe3+� He+ aW H+ ions Tn-pie bearns(Spallation Target) w)Mm: (a) K 6 ID/&I,0.8 aNaHe, 3dpa, (b)470C, 8 af/oK 04 atO/olie, 43dpa.
- 132 -
JAERI-Review 2002-035
4.3 Microstructure change with ion beam irradiation in J'03
D. YamakiT, Nakazawa, T. Aruga, T. Tanifuji, S. Jitsukawa, A. Iwase
Department of Materials ScienceJAERI
1. Introduction The I,JiO, ceramics used in this experiment
The J'03 ceramic is regarded as one of the have been fabricated from 99% pure powder
most suitable candidates for the solid tritium purchased from CERAC, Inc. The powder was
breeder material of D-T fusion reactors[l]. It is cold pressed at 300 Pa into cylinders
known that in an operating fusion reactor, the subsequently sintered at 1223K for 6 h in an Ar
radiation damage in Li2T'03 wl be caused by atmosphere. The obtained LJ'03 ceramics
fast neutrons, energetic tritons (2.7MeV) and have approximately 78% of theoretical density.
helium ions (2,lMeV) generated in 'Li(na)'H The specimens were machined from the
reaction. The irradiation damage caused by such cylinders to the orm of disks with diameter of
radiations may result in the microstructure I Onun and thickness of around I.Onun.
changes, and the changes may affect the The J'03 ceramic samples were irradiated
characteristics of Li2T'03 such as tritium at 73K with the single and the triple ion beams
release behavior, thermal properties, and so on. of 025 MeV H% 06 MeV He+ and 24 MeV
Thus the study of irradiation defects and 02+ . The fluence of the espective ions were
microstructure change caused by irradiation in estimated to be I x I e' ions/rn'. The ion energies
LJ'03 is essential to evaluate its irradiation were so chosen that the projected ranges of the
performance. irradiated ions in J'03 were around 22
Simulation of the fusion reactor environment �tm[3].
and hence the study of a synergistic effect of
atomic displacement damage in J'03 are 3. Results and dscussion
presumed to be approached by a simultaneous 3-1. Raman spectroscopy
irradiation with "triple" ion beams which The Raman spectra of irradiated Li2T'03
consist of 02% He� and H ion beams. In the samples with the respective single ion beam
previous study, the formation of the anatase are displayed in Figure I From the comparison
(T'02) layer on the surface of J'03 by with the reference spectra of LJ'03 ceramics
irradiation with triple ions has been found with and anatase shown ref[21, it can be seen that
Raman spectroscopy and XRD analysis[2]. In the Raman spectra of L�TiO. irradiated with
the present study, the irradiation damages in single Wion beam and ingle He+ ion beam are
LJ'03 samples irradiated with the single and quite resemblant to the Raman spectru of
the triple ion beams were examined with Raman reference spectrum of LiT'03 ceramics.
spectroscopy and FT-IR photoacoustic However, the spectrum of the sample irradiated
spectroscopy (PAS). with single ion beam seems to be a
superposition of the J'03 and anatase
2. Experimental spectra. It clearly suggests that the formation of- 133 -
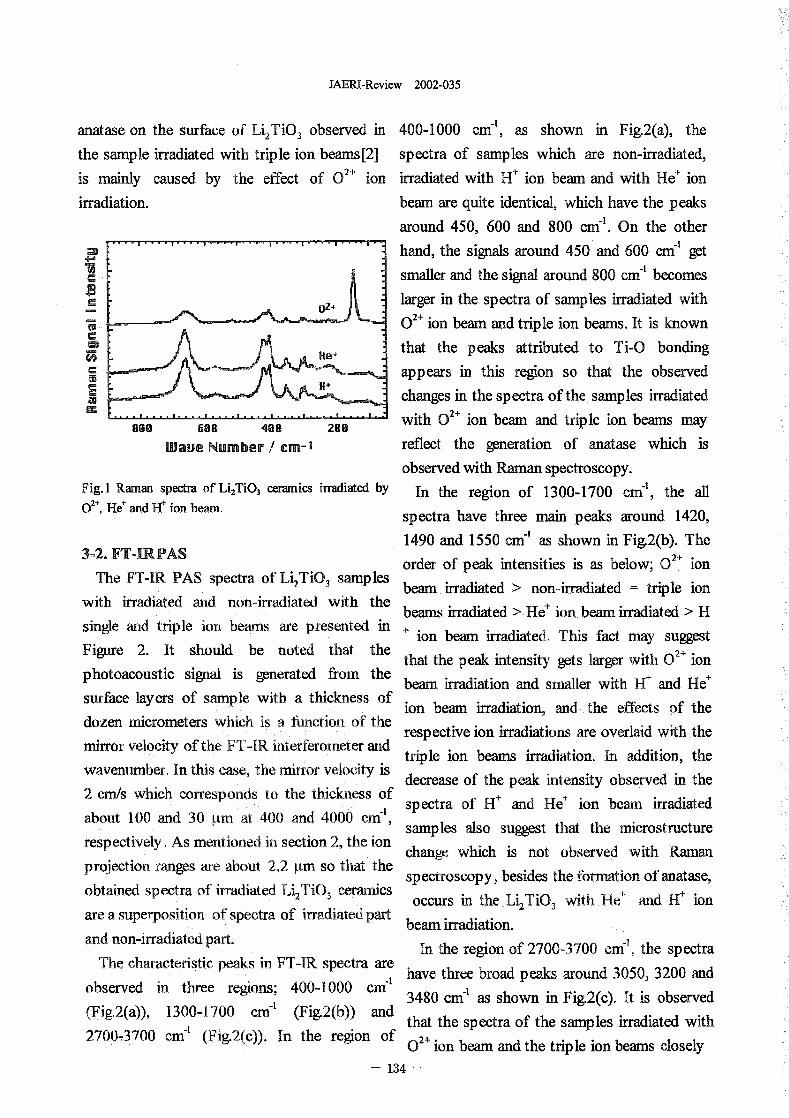
JAERI-Review 2002-035
anatase on the surface of LiT'03 observed in 400-1000 cnf', as shown in Fig.2(a), the
the sample irradiated with triple ion bearns[2] spectra of samples which are non-irradiated,
is mainly caused by the effect of 0 ion irradiated with H ion beam and with He+ ion
irradiation. beam are quite identical, which have the peaks
around 450, 600 and 800 m71. On the other
hand, the signals around 450 and 600 crif I getVC smaller and the signal around 80 c-' becomes
02+ larger in the spectra of samples irradiated with
02+ ion beam and triple ion beams. It is knownC
+ that the peaks attributed to Ti-O bonding
appears in this region so that the observedE changes in the spectra of the samples irradiated
with 02+ ion beam and triple ion beams may800 680 400 288
Waue Number cm-' reflect the generation of anatase which is
observed with Raman spectroscopy.
Fig.] Raman spectra of LiJiO, ceramics irradiated by In the region of 1300-1700 enfl, the all
02+, He+ and W ion beam. spectra have three main peaks around 1420,
1490 and 1550 m7 I as shown in Fig.2(b). The3-2. FT-IR PAS
The FT-IR PAS spectra of Li2T'03 samples order of peak intensities is as below; 02+ ion
with irradiated and non-irradiated with the beam irradiated > non-irradiated = triple ionbeams irradiated > He+ ion beam iadiated > H
single and triple ion beams are presented in , ion beam irradiated. This fact may suggest
Figure 2. It should be noted that the that the peak intensity gets larger With 02+ ion
photoacoustic signal is generated from the beam irradiation and saller with H' and He+
surface layers of sample with a thickness of ion beam irradiation, and the effects of the
dozen micrometers which is a unction of the respective ion irradiations are overlaid with the
mirror velocity of the FT-IR interferometer and triple ion beams irradiation. In addition, the
wavenumber. In this case, te mirror velocity is decrease of the peak intensity observed in the
2 cmA which corresponds to the thickness of spectra of H and He+ ion beam irradiatedabout 100 and 30 �im at 400 and 4000 cm -1,respectively, As mentioned in section 2 the ion samples also suggest that the microstructure
projection ranges are about 22 �tm so that the change which is not observed with Raman
obtained spectra of irradiated Li2T'03 ceramics spectroscopy, besides the formation of anatase,
are a superposition of spectra of irradiated part occurs in the Li2TiO, with H+ and H ionbeam irradiation.
and non-irradiated part. In the region of 2700-3700 cif', the spectra
The characteristic peaks in FT-IR spectra are have three broad peaks around 3050, 3200 and
observed in three regions; 400-1000 cm7' 3480 cirf Ias shown in Fig.2(c). It is observed
(Fig.2(a)), 13004700 cm-' (ig.2(b)) and that the spectra of the samples irradiated with
2700-73700 nf' (Fig.2(c)). In the region of 0 2+ ion beam and the triple ion beams closely
- 134 -
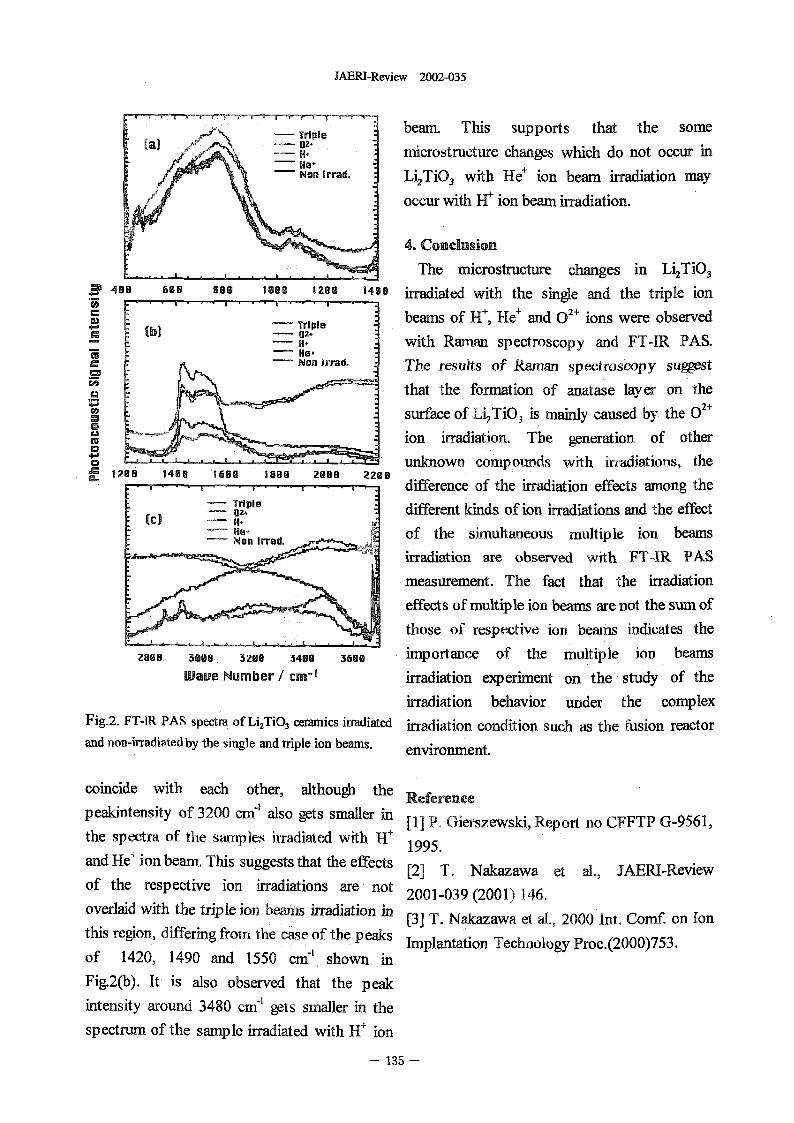
JAM-Review 2002-035
- Triple beam. This supports that the some- 02-- H. tnicrostructure changes wch do not occur in
Non rrad. Li2T'03 with He+ ion beam irradiation may
occur with H+ ion beam irradiation.
4. Conclusion
The microstructure changes in Li2T'03
M 400 668 see logo 1286 14013 irradiated with the single and the triple ion021
co - Triple beams of H He+ and ions were observed(bl - 02.E - H. with Raman spectroscopy and FT-IR PAS.
Non )read, The results of Raman spectroscopy suggest
that the formation of anatase layer on the02+
surfke of Li2T'03 is mainly caused by the
to ion irradiation. The generation of other
unknown compounds with irradiations, the126i 140 9 1689 logo 2668 2206
. . . . . . difference of the irradiation effects among theTripleO'. different kinds of ion irradiations and the effect
(c) H+2N of the simultaneous multiple ion beams
on Irrad
irradiation are observed with FT-IR PAS
measurement. The fact that the irradiation
effects of multiple ion beams are not the sum of
those of res ective ion beams indicates the
2800 3880 3208 3409 3688 importance of the multiple ion beamsWaue Number cm-' irradiation experiment on the, study of the
irradiation behavior under the complex
Fig.2. FT-IR PAS spectra of Li2TiO, ceramics inadiated irradiation condition such as the fusion reactor
and non-irradiated by the single and triple ion beams. environment.
coincide with each other, although the
peakintensity of 3200 m7' also gets smaller in Reference
the spectra of the samples irradiated with H' [11 P. Gierszewski, Report no CFFTP G-9561,
and He-' ion beam. This suggests that the effects 1995.
of the respective ion irradiations are not E2] T. Nakazawa et al., JAERI-Review
overlaid with the triple ion bearns irradiation in 2001-039 2001) 146.
this region, differing from the case of the peaks [31 T. Nakazawa et al., 2000 nt. Comf on Ton
of 1420, 1490 and 1550 cm -1 shown in Implantation Technology Proc.(2000)753.
Fig.2(b). It is also observed that the peak
intensity around 3480 id' gets smaller in the
spectrum of the sample irradiated with H+ ion
- 135 -
JAERI-Review 2002-035
4.4 Effect of Multi Ion-beams Irradiation on Mechanical Propertiesof Advanced SiC/SiC Composites for Fusion Systems
A. I-lasegawa*, S. Nogami*, N. Igawa**, E. Wakai**, T. Taguchi", S.
Jitsukawa**
Department of Quantum Science and Energy Engineering, Tohoku University*,
Department of Materials Science, JAERI**
1. INTRODUCTION irradiation resistance because they haveSilicon carbide W) fibers reinforced SiC dimensional and microstructural. stability during
omposites (SiC/SiC composites) are irradiation 3,5) -stoichiometricmatrix c while nonconsidered to be one of the candidates for the SiC-fibers, for example Nica)on CG andblanket and shielding structural materials of Hi-Nicalon, were unstable under irradiation 2,4,6),
fusion systems. These materials will be exposed Therefore, lack of the clear understanding of theto igh energy (about 4 MeV) neutron synergistic effects on these radiation-resistantirradiation. The displacement damage and SiGfibers as to be essentially solved.transmutation caused by the neutron irradiation The purpose of this study is to investigate thewill occur. Transtmitant products during neutron synergisticeffects of displacement damage, Hirradiation are dependent on the neutron energy and He on the mechanical properties ofspectra. The oss-section of (n, a) and (n, p) advanced SiC/SiC composites by using multireactions is elativel large under 14 MeV ion-beams iradiations at TIARA facility.neutron irradiation. Therefore, helium (He) andhydrogen (H) gases will he ormed in these 2. EXPERIMENTALSmaterials. The He and 1 concentrations per dpa Materials used in this study were a SiC/SiC(displacement per atorn) on the ARIES SiC couiposite,%Wth Hi-NicaJon Tm Type-S fiber and ablanket are calculated to be approximately 130 monolithic polyerystalline P-SiC. The interfaceat.ppm and 50 at.ppm in the first-wall material between SiC-fibers and SiGmatrix ofcomponent, respectively 1). the SiC/SiC composite was the pyrolytic
The material property change of SiC/SiC graphite (-150 nm in thickness), which wascomposites due to the simultaneous existence of fabricated by a CVD (chemical vapordisplacement damage, and He is need to be deposition) process. SiGmatrix (polyelystallineclarified because the solubilities of H and He in P-SiC) was fabricated by an FCV1 (forcedSiC are very low and these gases may affect chemical vapor infiltration) process, Theseclustering of point defects, Nevertheless study processes were carried out at the Highon them has been limited ''). Especially, the Temperature Materials Laboratory (HTML ofknowledge on the synergistic effects of the Oak Ridge National aboratory (ORNL).displacement damage, H ad He on the recent The monolithic �-SiCwas fabricated by a CVDadvanced SiGfibers is very limited " ). process at Roam&Haas. These samples wereSiGfibers used in SiC/SiC composites machined for iradiation tests into the form of 2developed for fusion systems ave been rinn x 45 to i x 04 m.improved recently, Stoichiometric SiC-fibers The simultaneous tipie-ion bear irradiationwith almost no oxygen such as Hi-Nicalonrm was carried out at TAkA facility, The ions wereType-S, and TyrannoTm SA are considered to be 6.0 MeV-Si2-'-, 1.0 MeV-14e' and 034 MeV-H+�very promising in the view of the neutron The He- and H-ions were iradiated using energy
- 136 -
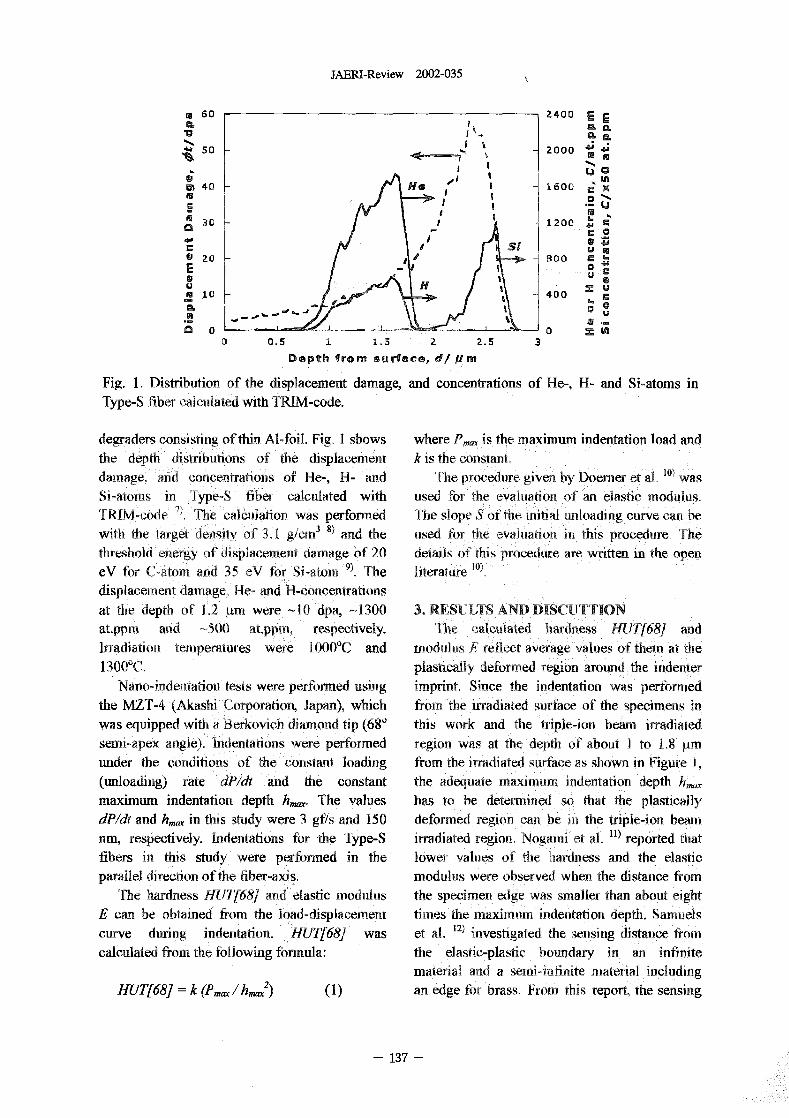
JAERI-Review 2002-035
60 2400 E ECL CL cL
1k, CL CL
so 2000 4; ';
p 40 - '1600is C)E ; tj
16 .30 - 1 200 C
ZC
2( - Roo CC)E
6 QW X
.1 O 40 C
CL
a O 0 FA0 0. I 1.5 2 2.5 3
Depth from surface, dl p m
Fig. 1. Distribution of the displacement damage, and concentrations of He-, H- and Si-atoms in
Type-S fiber alculated with TRIM-code.
degraders consisting of thin Al-foil. Fig. I shows where P,,, is te maximum indentation load and
the depth distributions of the displacerne"t k is the constant.
damage, ad concentrations of He-, 14- and The procedure given by Doemer et at. 11) was
Si-atoms in Type-S fiber calculated with used for the evaluation Of an elastic odulus.
TRIM-code 7) � The alculation was performed The slope Of the iitial unloading curve a be
with te target density of 3A gie"11 8) and te used for the evaluation in this procedure, The
threshold energy of isplacement damage of 20 details of thi�-, procedure are written in the open
eV for C-atorn. ad 35 eV for Si-ato 9 The literature 10)
displacement damage, He- and -concentrations
at the depth of 1.2 4ra were -10 dpa, 1300 3. RESULTS AND DISCUTTION
at.ppm and -500 atppm, respectively. The aated hardness HUTf68 andVIrradiation temperatures were JOOOT and modulus reflect average values of them at the
13000C, plastically deformed region around the identer
Narro-indentation tests were performed using imprint. Since te indentation was performed
the MT-4 (Akashi Corporation, Japan), wich fTOITI the irradiated srface of the specimens in
was equipped with a Berkovich diamond tip 68' this work and the triple-ion beam iadiated
SeDb-apeX angle). Indentations wre performed region was at the depth of about I to L8 �tm
under the conditions of the constant loading from the irradiated surface as shown in Figure ,
(unloading) rate Oldt and the constant the adequate maximum identation depth h
maximum indentation depth The vlues has to be determined so that the Plastically
dPIdt and h, in this study were 3 gf/s and 150 deformed region can be it) the triple-ion beam
nm, espectively Identations for te Type-S irradiated region. Ngal"i et a]. 11) reported that
fibers in this study were performed in te lower values of the hardness and the elastic
parallel direction of the fiber-axis. modulus were observed when the distance from
Ile hardness HUT[68] and elastic odulus the specimen dge was smaller than about eight
E can be obtained from the load-displacement fil'"es the aximum identation depth. Samuels
curve during indentation. HUT[681 was et al. 2 investigated the sensing distance fom
calculated ftom the following formula: the elastic-plastic odary in an infinite
material and a semi-infinite material icluding
HUT[681 = k P.,,, h,.,,2) (1) an edge for brass. from this report, the sensing
137 -
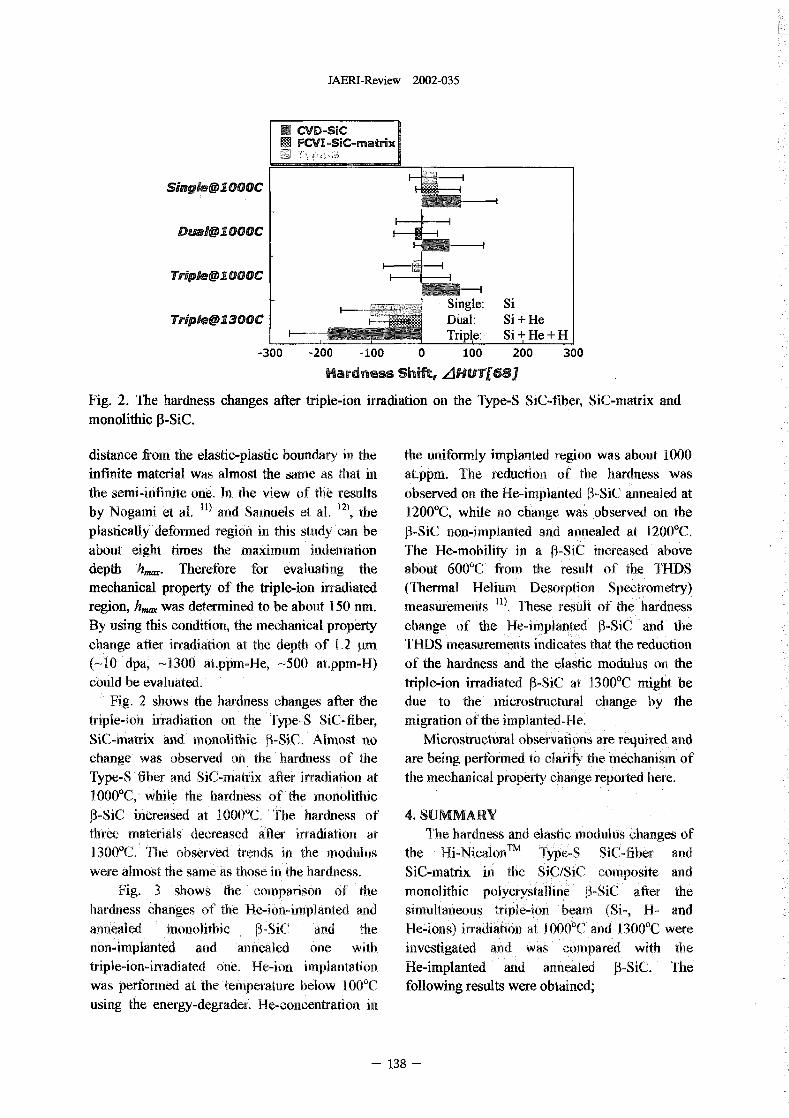
JAERI-Review 2002-035
E CVD-$iCM KVI-SiC-matrix
single�1000C
Dual�1000C
Triple�1000C
Single: SiTripie�1300C Dual: Si He
Triple: Si+He+H j
-300 -200 -100 0 100 200 300
Hardness Shift, AHUT[68]
Fig. 2 The hardness changes after triple-ion irradiation on the Type-S SiC-fiber, SiC-matrix andmonolithic P-SiC.
distance from the elastic-plastic boundary in the the uiformly implanted region was about 1000infinite material was almost the same as that in at.ppm. The reduction of the hardness wasthe serm-infinite one. In te view of the results observed on te He-implanted �-SiC annealed at
12)by Nogami et al. 11) and Samuels et al. te 12000C, while no change was observed on theplastically deformed region in this study can be P-SiC non-implanted and annealed at 1200 ,about eight times the maximum indentation The He-mobility in a P-SiC increased abovedepth hmax. Therefore for evaluating the about 600'C from the result of the TDSmechanical property of the triple-ion irradiated (thermal Helium Desorption Spectrometry)region, h.,,, was determined to be about 15 rm. measurements "). These result of e hardnessBy using this ondition, the mechanical property change of the He-implanted P-SiC and thechange after iffadiation, at the depth of L2 �tm THDS measurements idicates that the reduction(-10 dpa, 1300 at-ppm-He, 500 at.ppm-H) of the hardness and the eastic modulus on thecould be evaluated triple-ion irradiated �-SiC at 1300T might be
Fig 2 shows the bardness changes after the due to the nucrostructural change by thetriple-ion iadiation on the Type-S SiC-fiber, migration of te it"planted-Me.SiGmatrix and monolithic �-SiC. Almost no microstructura oservation ae required andchange was observed on the hardness of te are being performed to clarify the mechanism ofType-S fiber ad SiGrnatrix after irradiation at the mechaDical property hange reported here.10000C, while the hardness of the monolithicP-SiC increased at 1000T. he hardness of 4. SUMMARYthree materials decreased after irradiation at The ardness ad eastic modulus changes of1100T. Te observed trends in the modulus the Hi-NiCalon TM TVVe_S W-fiber and
were almost te same as those in the hardness. SiGniatri i the SiC/SiC composite andFig. shows the oarison of the monolithic olyerystalline P-SiC after the
hardness changes of the He-ion-miplanted and simultaneous tiple-ion beam (Si-, 1 andannealed monolithic �_Sic and the He-ions) adiation at I OOGC and 1300'C werenon-implanted and annealed one with investigated and was compared with tetriple-ion-iffadiated one, He-ion mplantation He-implanted and annealed P-SiC. Thewas performed at te temperature below IOOT following results were obtained;using the energy-degrader. He-concentration in
- 138 -
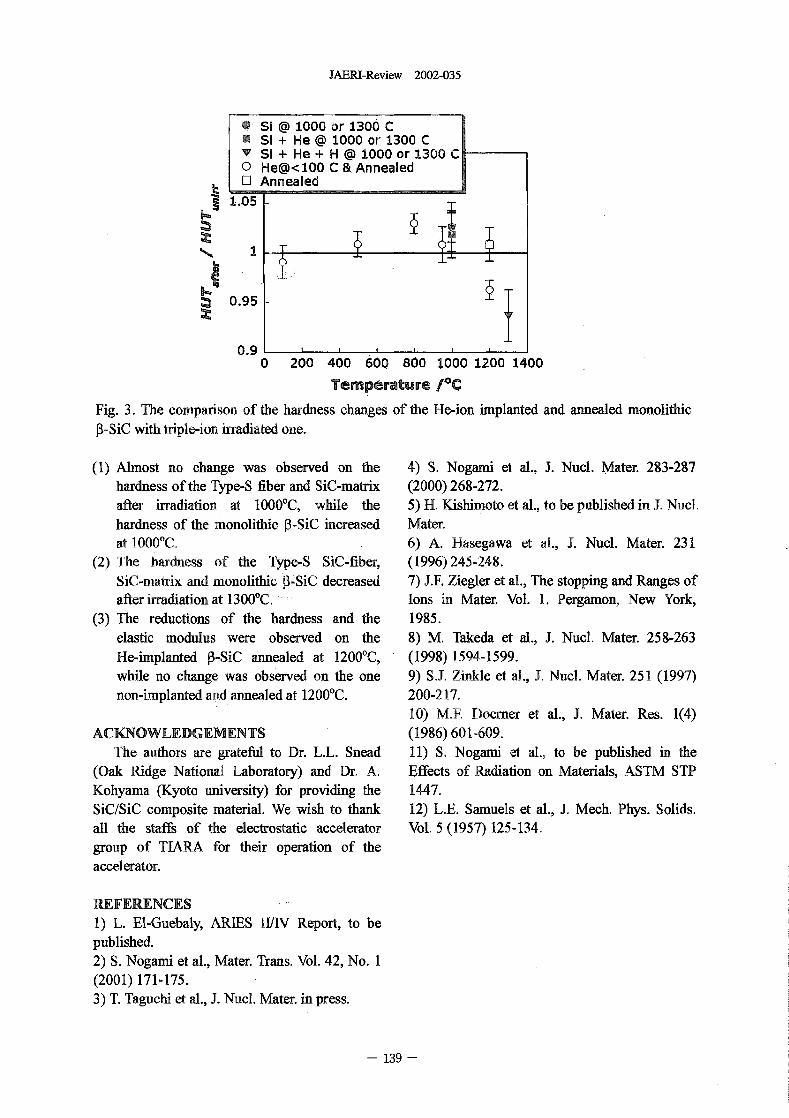
JAERI-Review 2002-035
0 Si 1000 or 1300 N Si He 1000 or 1300 CV Si He H 1000 or 1300 C0 He�< 100 C AnnealedF-1 Annealed
1.05
0.95
0.90 200 400 60D 800 1000 1200 1400
Temperature /*C
Fig. 3 The comparison of the hardness chan ges of the He-ion implanted and annealed monolithic
P-SiC with riple-ion irradiated one.
(1) Almost no change was observed on the 4) S. Nogami et al., J. Nucl. Mater. 283-287
hardness of the Type-S fiber and SiC-matrix (2000) 268-272.
after irradiation at 10000C, while the 5) H. Kishimoto et al., to be published in J. Nucl.
hardness of the monolithic P-SiC increased Mater.
at I OOOOC. 6) A. Hasegawa et al., J. Nucl. Mater. 231
(2) The ardness of the Type-S SiC-fiber, (1996) 245-248.
SiGmatrix and monolithic PSiC decreased 7) J.F. Ziegler et al., The stopping and Ranges of
after irradiation at 13000C. Ions in Mater. Vol. 1. Pergamon, New York,
(3) The reductions of the hardness and the 1985.
elastic modulus were observed on the 8) M. Takeda et al., J. Nucl. Mater. 258-263
He-implanted P-SiC annealed at 12000C, (1998) 1594-1599.
while no change was observed on the one 9) SJ, Zinkle et al., J. Nucl. Mater. 251 1997)
non-implanted and annealed at 1200T. 200-217.
10) MY Doerner et al., J. Mater. Res. 14)
ACKNOWLEDGEMENTS (1986) 601-609.
The authors are grateful to Dr. L.L. Snead I 1) S. Nogami et al., to be published in the
(Oak Ridge National Laboratory) and Dr, A. Effects of Radiation on Materials, ASTM STP
Kohyama (Kyoto university) for providing the 1447.
SiC/SiC composite material. We wish to thank 12) L.E. Samuels et al., J. Mech. Phys. Solids.
all the staffs of the electrostatic accelerator Vol. 5 1957) 125-134.
group of TIARA for their operation of the
accelerator.
REFERENCES
1) L. E-Guebaly, ARIES II/IV Report, to be
published.
2) S. Nogami et al., Mater. Trans. Vol. 42, No.
(2001) 171475.
3) T. Taguchi et al., J. Nucl. Mater. in press.
139 -
JAERI-Review 2002-035
4.5 Damage evolution in high energy multi ion-irradiated BCC metalsand.the interaction between gas atoms (H and He) and damagedefects
L Mukouda*, Y. Slihnotnura", D. Yamaki***, T. Nakazawa*** T.Aruga* * * and S. Jitsukawa* * *Graduate School of Engineering, Hiroshima University*, Hiroshima Institute ofTechnology", Department of Materials Science, JAERI***
1. Introduction (V(AR)). Some specimens were degassed byFor fusion reactor applications, there is an melting in vacuum at 10 -5 Pa in a levitationinterest in vanadium and its alloys. Hydrogen furnace [2]. This specimen was calledand helium atoms are generated. by nuclear residual-gas-free V V(RGF)). Annealed diskstransmutation in the fusion environment. These of 3mm in diameter and 0,05 mm thick weregas atoms play an important role in the evolution prepared from each material. The irradiation wasof the damage microstructure. It is well known carried out with the TIARA (Takasaki Ionthat helium is active in cavity nucleation. Accelerators for Advanced RadiationSekirnura et al. [1] have carried out on multiple Application) accelerators at the Takasaki-beam ion irradiation to study the role of gases. establishment of JAERI (Japan Atomic EnergyIn the present work, uantitative experiments Research Institute) at 500 and 600T. The ionwere carried out study the role of helium and energy was selected so that the projected rangehydrogen in the evolution of damage ofthe gas ions in vanadium coincides with themicrostructure in irradiated materials. It is depth of peak damage 1.3 �un) calculated by thepossible to control the concentration of gas MM 95 code 3]. The peak damage rate was 2atoms in irradiated metals by ion irradiation at X 10-3 dpa/s and total dose at the damage peakhigh energy. We examined void formation in was 22 dpa. The ions stop within the depth ofhigh energy ion-irradiated pure vanadium by two icrons frorn the surface and damage wasboth single beam (5 MeV Ni) and dual-beam formed up to this depth. For quantitative(5MeV Ni ion and 600 keV He or 26OkV H ion) investigation, the amage sucture has to beirradiation. The ion energy was selected so that observed as a function of depth. We utilized FIBthe projected range of the gas ions in vanadium microscopy. The FIB generates 30 keV Oa ionsmight coincide with depth of peak damage (I 3 and illuminates specimen surface with glancingJim) calculated by the TRIM 95 code. angle. To preserve the surface of theSpecimens for TEM cross sectional observation ion-iffadiated metals from sputtering, wewere prepared by a FIB (Focused Ion Beam)- deposited tungsten on the irradiated surface. Indevice. The relation between gas atoms and our previous work, it was found that interstitialdamage structure was derived from experimental atoms form near surface clusters throughoutresults. FIB-thinned specimens, To overcome this
difficulty, we developed a TEM specimen2. Expertinental Procedure preparation method which is a combination ofThe pure vanadium had a nominal purity of FIB thinning and electro-polishing 46] To99.8%. This material was called as-received V remove regions damaged by the G ions, the
- 140 -
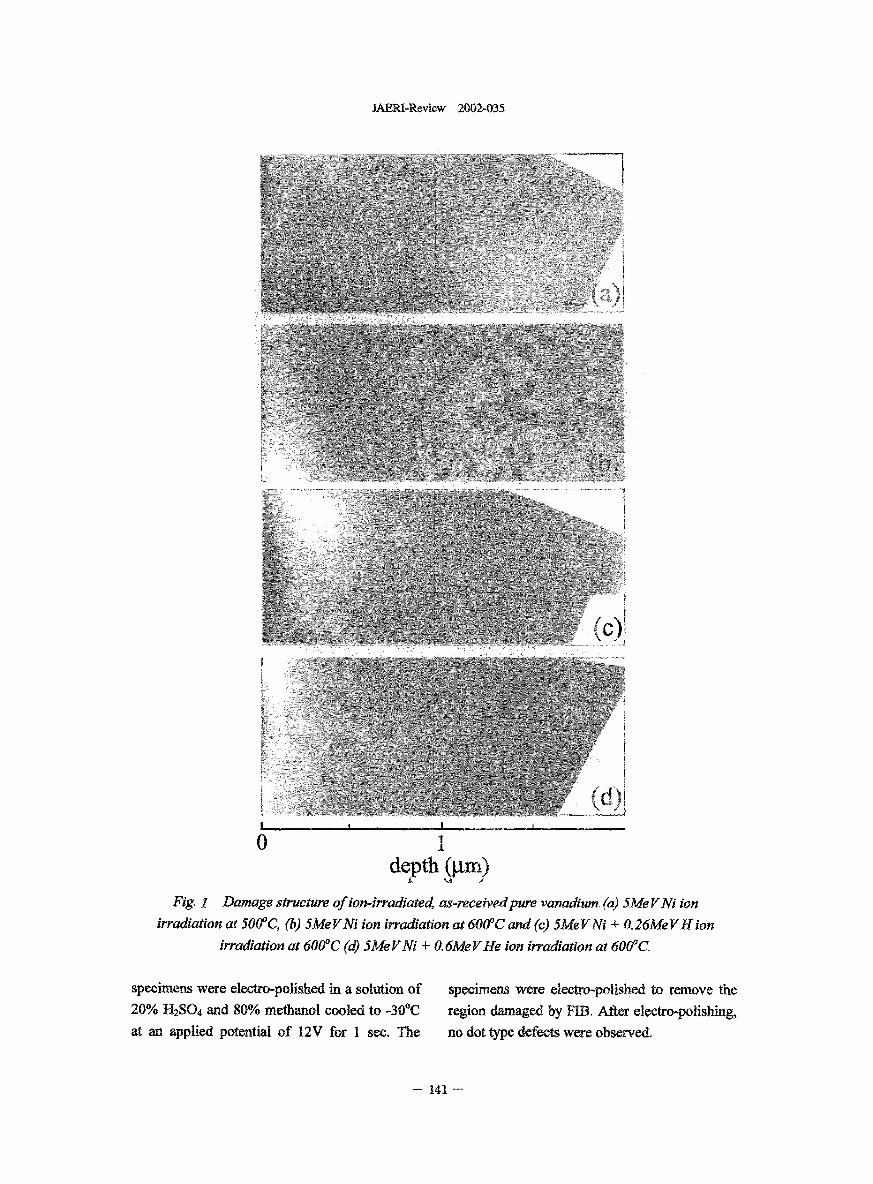
JAERI-Review 2002-035
(CY
(d)
0depth (gm)
Figi Damagestmetureofion-irradiatedas-receivedpurevanadi�um,(a)5MeVNiion
irradiationat5OOoC,(b)5MeVNiionirradiationat6OO'Cand(c)SMeVNi+0.26MeVHion
irradiation at MOT (d) 5Me VNi + 0. We VHe ion irradiation at 600'C
specimens were electro-polished in a solution of specimens were electro-polished to remove the
20% 12SO4 and 80% methanol cooled to 30'C region damaged by FIB, After electro-polishing,
at an applied potential of 12V for I see. The no dot type defects were observed.
- 11
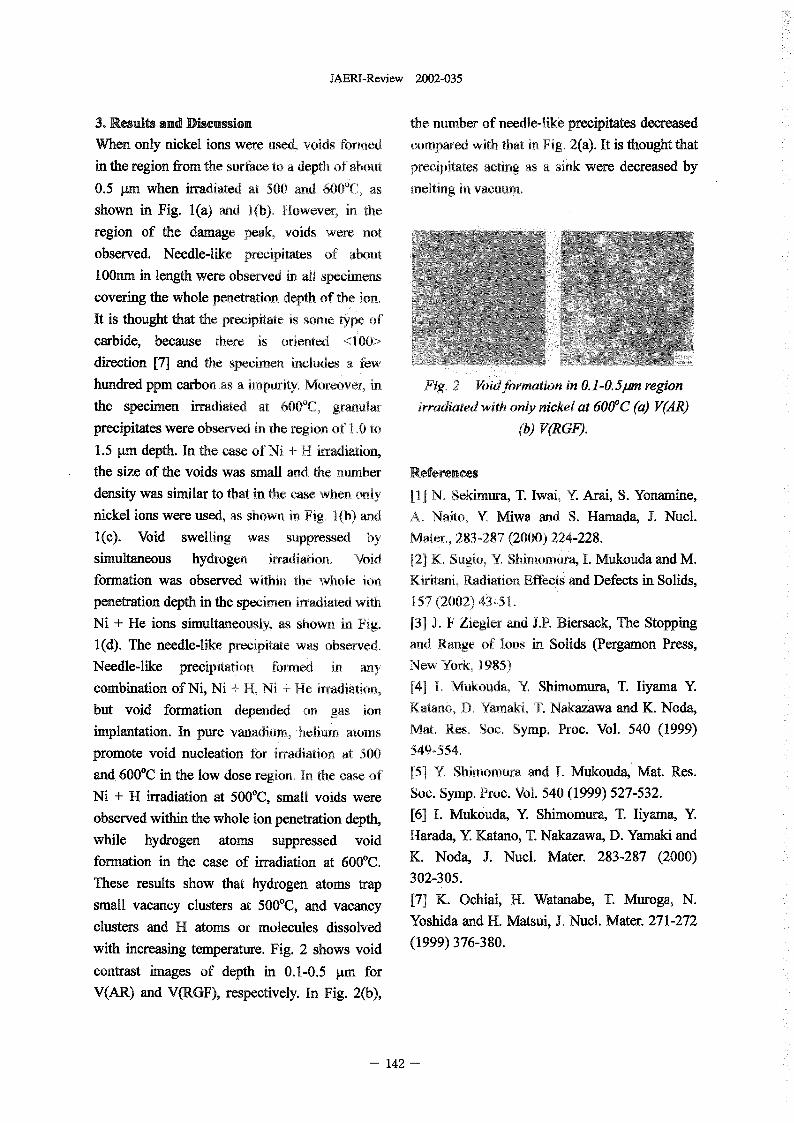
JAERI-Review 2002-035
3. Results and Discussion the number of needle-like precipitates decreased
When only nickel ions were used, voids formed compared with that in Fig. 2(a). It is thought that
in the region from the srfaced, to a depth of about precipitates acting as a sink were decreased by
0.5 gm when irradiated at 500 and 600'C, as melting in vacuuni.
shown in Fig. 1(a) and 1(b). However, i he
region of the damage peak, voids were not
observed. Needle-like precipitates of about
100nm in length were observed in all specimens
covering the whole penetration depth of e ion,
It is thought that the precipitate is some type of
carbide, because there is oriented <00>
direction 7] and the specimen includes a few
hundred ppm. carbon as a impurity. oreover, in Fig,2 YbidformationinO.1-0.51onregion
the specimen irradiated at 600T, granular irradiated with only nickel at 600'C (a) V(AR)
precipitates were observed in the region of LO to (h) V(R G).
1.5 l.Lm depth. In the case of Ni + H irradiation,
the size of the voids was small and the number References
density was similar to that in the case when only [11 N. Sekimura, T. Iwai, Y. Arai, S. Yonamine,
nickel ions were used, as shown in Fig I b) and A. Naito, Y Miwa and S. Hamada, J. Nucl.
1(c). Void swelling was suppressed by Mater, 283-287 2000) 24-228.
simultaneous hydrogen irradiation, Void [2 K Sugio Y Snnomura, 1. Mukouda and M.
formation was observed within the whole ion Kiritani, Radiation Effects and Defects in Solids,
penetration depth in the specimen irradiated with 157 2002 4-31.
Ni + He ions simultaneously, as shown in Fig. (3] J. F Ziegler and J.P. Biersack, The Stopping
1(d). The needle-like precipitate was observed. and Range of Ions in Solids (Pergamon Press,
Needle-like precipitation formed in any New York, 1985)
combination of Ni, Ni + 14, Ni + He adiation, [4] 1. Mukouda, Y. Simornura, T. Iiyama Y
but void formation depended on gas ion Katano., D. Yamaki, T. Nakazawa and K. Noda,implantation. In pure vanadium, helium atoms Mat, Res, Soc. Symp. Proc. Vol. 540 1999)
promote void nucleation for irradiation at 500 549-554�and. 600'C in the low dose region. In the cases of [5] Y. Shimomura, and 1. Mukouda, Mat. Res.
Ni + H irradiation at 500T, small voids were Soc. ymp. Proc. Vol. 540 1999) 527-532.
observed within the whole ion penetration depth, [6] I. Mukouda, Y. Shimomura, T. Iyama Y.
while hydrogen atoms suppressed void Harada Y Katano, T. Nakazawa, D. Yamaki and
formation in the case of irradiation at 6000C. K. Noda, J. Nucl. Mater. 283-287 2000)302-305.These results show that hydrogen atoms trap
small vacancy clusters at 500T, and vacancy [71 K. Ochiai, H. Watanabe, T. Muroga N.
clusters and H atoms or molecules dissolved Yoshida and H. Matsui, J. Nucl. Mater. 271-272
with increasing temperature. Fig. 2 shows void (1999) 376-380.
contrast images of depth in 0.1-0.5 �trrr for
V(AR) and VRGF), respectively. In Fig. 2b),
- 142 -
JAERI-Review 2002-035
4.6 Effects of Dose Rate on Microstructural Evolution in Austenitic Alloys
N. Sekimura I Okita, T. Sato, Y. Yang, Y Hashimoto,
S. Jitsukawa*, Y. Sawai*, Y. Miwa* and S. Saito*
Department of Quantum Engineering and Systems Science, niversity of Tokyo
Department of Nuclear Energy System, JAERI*
1. Introduction mechanically and electrically polished.
Most of high fluence data required for the Irradiation proceeds with 12.0 MeV N i3+ ions in
irradiation testing of fusion and fission reactor the TIARA (Takasaki on Accelerators for
materials are derived from accelerated Advanced Radiation Application). In this first
irradiation experiments such as accelerators or series of irradiation., no gas atoms are pre-
test reactors with high dose rates, although some injected or simultaneously injected. Irradiation
excellent experiments have recently shown dose ranges from -,0.2dpa to 20dpa, irradiation
strong effects of dose rate on macroscopic dose rate from lOXIO-4 dpa/sec to I.OXIO-3
2)changes It is therefore very important to dpa/sec and irradiation temperature 300, 400 and
fully evaluate the effects of dose rate on 500'C. After irradiation, the specimens were
microstructural evolution, and to develop electrochemically thinned to reach an
models incorporating such dose rate effects in observation depth, followed b back-thinning.
order to make predictions of the irradiation Analysis was conducted using a JEOL
performance of structural materials. 200CX transmission electron microscope
In this study, dose rate effects on operating at 200 kV
microstructural evolution are investigated in
austenitic model alloys employing ion 3. Results and Discussion
irradiation. Figure I shows dislocation microstructures
observed in Fe-15Cr-16Ni irradiated with N l
2. Experimental Procedure ions. The radiation-induced microstructures are
Simple model austenitic alloy, Fe-15Cr- dense, especially at the lower temperatures, but
I6Ni is prepared from high purity Fe, Cr, and Ni. rather simple. being comprised primarily of
by arc-melting. They are rolled to sheets of 02 faulted dislocation loops, some unfaulted perfect
mm in thickness. Standard 3 mm TEM disks loops, and a few network dislocations. At lower
are then punched and annealed for 30 minutes at dose rate, the dislocation structure is mainly
of -51050'C in a high vacuum Pa wrapped. dominated by the faulted loops with the
within Zr foils. Afterwards, they are Burger's vector b= I 3a [III], and the density of
- 143 -
JAERI-Review 2002-035
the faulted loops increases with dose. On the 4. Summary
other hand, at higher temperature and higher Solution-annealed model austenitic alloys
dose, it is clearly observed that faulted loops are irradiated with ions to investigate the effects
grow large enough to become unfaulted perfect of dose rate on microstructural evolution. The
loops and decomposed into the network dislocation is mainly dominated by faulted loops
dislocations. These findings indicate that the at the temperature between 300 and 500'C up to
dislocation evolution model should 2 dpa, and lowering dose rate increases the
quantitatively incorporate not only the density of faulted loops. Al higher dose,
nucleation and growth of loops, but also their however, it is observed that faulted loops grow
unfaulting and conversion to network, especially large enough to become unfaulted and form
for predictions of materials irradiated for long network dislocations. The interstitial migration
periods. energy is estimated to be I eV by the
Figure 2 shows an Arrhenius plot of Arrhenius plot of the dislocation loop density.
dislocation loop density at 017 dpa. At every
test temperature tested, lower dose rate enhances References
loop nucleation. At lower dose rates, the ratio of 1) T. Okita, N. Sekimura, F. A. Garner. L. R.
point defect fraction absorbed by sinks to that by Greenwood, W. G. Wolfer and Y. Isobe, theI threcombination is higher compared to high dose International Symposium on
rateS 3 which accelerates nucleation of the Environmental Degradation of Materials in
dislocation oops. When the controlling process Nuclear Power Systems 2001, on CD-ROM
of interstitial loop nucleation is the reaction of with no page numbers
two thermally migrating interstitials, which is 2) F. A. Garner, M. L. Hamilton, G. M. Bond, B.
applied to this model austenitic alloys with very H. Sencer, T. Okita, N. Sekimura, D. L.
few amounts of impurities, the nominal Porter, T. R. Allen and W G, Wolfer, to be
activation energy of the process is given by one published in J. Nucl. Mater. 2002
half of the migration energy of interstitialS 4 In 3) T. Okita, T. Sato, N. Sekimura and F. A. Garner,
this experiment, the migration energy of PRICM-4 2001, in press
interstitial is found to be 1.1 eV, This parameter 4) N. Yoshida, Q. Xu, H. Watanabe, T. Muroga and
is very important to develop models M. Kiritani, J. Nucl. Mater. 191-194 1992) 1114.
incorporating dose rate effects on
microstructural evolution, especially at lower
temperature - 300'C where the light water
reactors are operated.
- 144 -
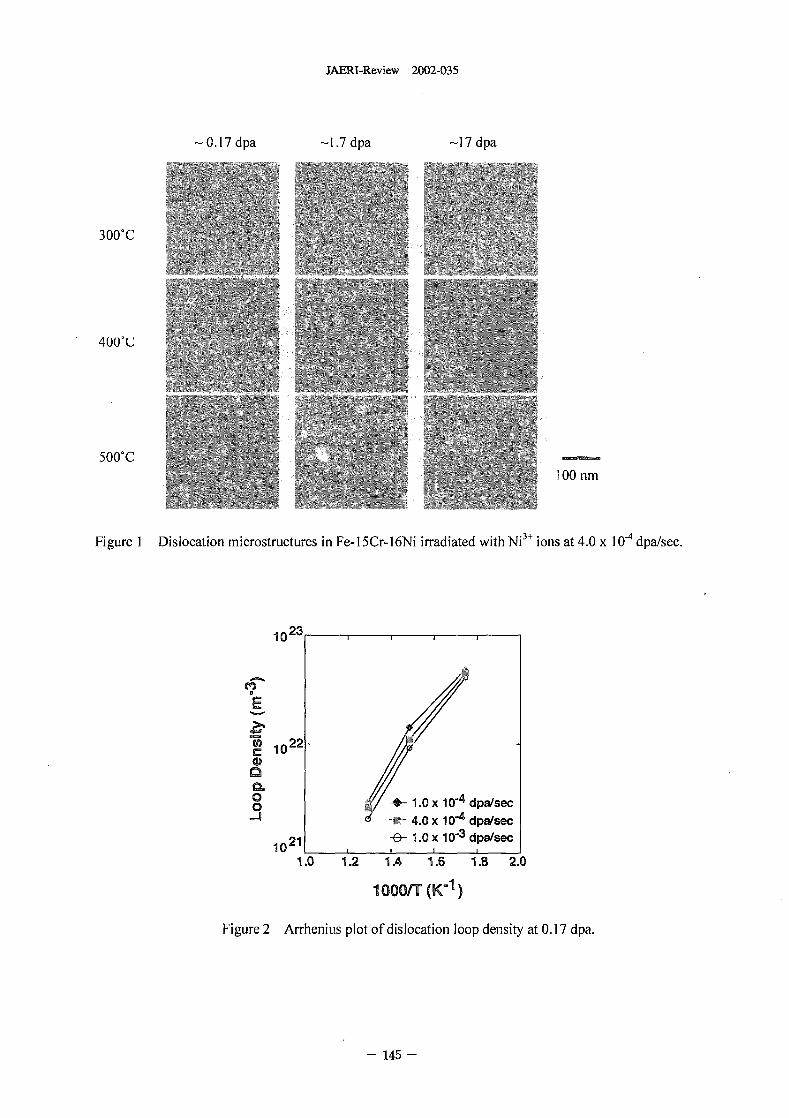
JAERI-Review 2002-035
- 0. 7 dpa -1.7 dpa - 7 dpa
NOT
400'C
500'C
100 nm
Figure I Dislocation microstructures in Fe I 5Cr- l6Ni irradiated with Ni3+ ions at 40 x10-4 dpa/sec.
1 023
22 -10
0 1.0 x 14 dpa/sec0
-m- 40 x 10-4 datsec
i 021 -a- 1.0 x 10⁻³ d parsec
1.0 1.2 1.4 1.6 1.8 2.0
1 OOOIT (K-1
Figure2 ArrheniusplotofdislocationloopdensityatO.17dpa.
145 -
JAERI-Review 2002-035
4.7 Investigation on Irradiation-Induced Hardening of F82H SteelsIrradiated by Dual/Triple Ion Beams
M. Ando*, H. Tanigawa% E. Wakai", T. Sawai**, A. Naito", andS.Jitsukawa**Department of Fusion Engineering Research, JAERIDepartment of Materials Science, JAERI
1. Introduction 2.1 Matepials and preparationOne of the most critical issues in research and The materials used in this study were reduced
development of reduced activation activation ferritic/martensitic steels (F82H;
ferritic/martensitic steels (RAFs) is the effect of Fe-8Cr-2W-0.2V-0.04Ta-O.IC) and 1%
irradiation-produced heavy atomic displacement Ni-doped F82H. The bermeal compositions and
damage, helium and hydrogen o inecbanical heat treatment conditions ere shown in table .
properties, which are simultaneously induced by A bulk of tese steels was cut ito specimens of
14 MeV neutron irradiation. Irradiation the small coupon type. he size of the specimens
hardening and embrittlement occur in RAFs, was 3 6 ,8 mm' and one of te 6 X 0. mm
when they are neutron irradiated at lower sides was irradiated ater polishing by the SiC
temperatures <623 K) 1-2) , but the mechanism of paper up to 4000 and 03 [km alumina powder to
irradiation-induced hardening has not been an electrolytic surface finish.
clearly understood. In addition, the effect of 2.2 Ion radiation
helium on irradiated properties is not sufficiently The ion-beam irradiation experiment was
understood because the helium production rate is carried out at the TIARA facility of JAERL The
different between fusion and fission neutron specimens were irradiated at 540-740 K by 10.53,
environments. Helium generation can be MeV Fe , 1.05 MeV He' and 380 keV H' ions.
approximated by using mixed-spectrum neutron He implantation was performed using aluminum
irradiation of ferritic steels doped with 10B or 58 Ni. foil energy degrader in order to control He
However, the mechanical evaluation of this effect distribution in the depth range of about 05-1.3
is not necessarily simple. Multi-ion irradiation [tm from the specimen surface. The irradiation
method 3 provide a convenient and accurate was performed to 520 dpa at the depth of 1.0 �Lrri
way to simulate this condition, although the and the damage rate was about 1.0 X 10⁻³ dpa/s at
damaged volume is limited to the specimen this depth.
surface. Ultra micro-indentation technique can 2.3 Nficro-indentation hardness
accurately measure the irradiation-induced The irradiated specimens were then
hardening of this small surface volume. indentation-tested at a load range of 10-49 mN
The purpose of this study is to investigate using an UMIS-2000 (CSIRO, Australia) ultra
irradiation-induced hardening due to micro-indentation testing system. The direction
displacement damage in self-ion irradiated F82H of indentation was chosen to be parallel to the ion
steels and the effect of helium and hydrogen on beam axis, or normal to the iradiated surface.
hardening under dual/triple ion beams. 2.4 Nflcrostructure observation
The irradiated specimens were machined into
2.Experimental procedure thin films, with a Hitachi B-2000A focused ion
- 146 -
JAERI-Review 2002-035
beam (FIB) processing instrument with a Figure 2 shows the results of micro-indentation
micro-sampling system. The details of the FIB hardness of F82H steels irradiated up to 20 dpa at
micro-sampling procedure have been explained 640 For F82H steels (Std), hardness of dual
elsewhere 4). The thin films were made so that ion beam (Damage+Helium) irradiated
they included the ion-beam axis. The ion used in specimens tended to be large compared with that
this process was Gallium ion accelerated to 30 of single beam (self ion) irradiated specimens.
keV. The microstructural examination was This result indicated that large amount of helium
carried out using a JEOL JEM-2000FX atoms >300 appmHe) enhanced the irradiation
transmission electron microscope (TEM) hardening. It is considered that this enhancement
operating at 200 W. of irradiation hardening is attributed to the
production of finer interstitial-type clusters and
3. Results moreover many small helium babbles.
3.1 Temperature dependence of irradiation Similarly, Ni-doped 82H caused a larger
hardening hardening than F82H (Std) at 20 dpa.
Micro-indentation tests were performed on Furthermore, it was considered that the
each of F82H steels at loads to penetrate about irradiation hardening increased under dual/triple
400 run. Figure shows the temperature irradiation.
dependence of micro-hardness in each of F82H.
Irradiation hardening was caused for all 4. Conclusions
irradiated specimens. For F82H (Std) a very Irradiation hardening was caused for all
strong irradiation hardening by about 30% arose ion-irradiated 82H specimens. Particularly, a
at irradiation temperature 620 K while weak strong irradiation hardening by about 30% was
irradiation hardening was measured for the caused at irradiation temperature about 620 K.
specimens irradiated at 740 K. This temperature However weak irradiation hardening was
dependence of irradiation hardening agreed measured for the specimen irradiated at 740 K
approximately with that of micro-hardness in It has been indicated tat the evaluation of the
F82H steels irradiated at Du9T Facility5). As a synergistic effect of helium (or hydrogen) on
result of TEM observation, a large amount of fine irradiation hardening requires an irradiation dose,
dislocation loops, dot-like defects and network at least 20 dpa.
dislocations were observed in the ion irradiated
F82H, which caused most hardening at 620 K. References
The major contributors to the irradiation 1) A. Hishinuma, A. Kohyama, R. L. Klueh, D. S.
hardening are likely to be the fine interstitial Gelles, W. Dietz, K. Ehrlich, J. Nucl. Mater.
dislocation loops. 258-263(1998)193-204.
On the other hand, 1% Ni-doped F82H caused 2) K. Shiba, A. Hishinuma, J. Nucl. Mater.
a heavy hardening over 60% at 540 K. This result 283-287(2000)474-477.
is similar to irradiation behavior of 2 Ni-doped 3) A. Kohyarna, Y. Katoh, M. Ando, K. Jimbo,
F82H in HFIR at low irradiation temperature Fusion Engineering and Design
(<573 K). 51-52(2000)789-795.
3.2 Dose dependence of irradiation hardening
(under dual/triple beams)
147
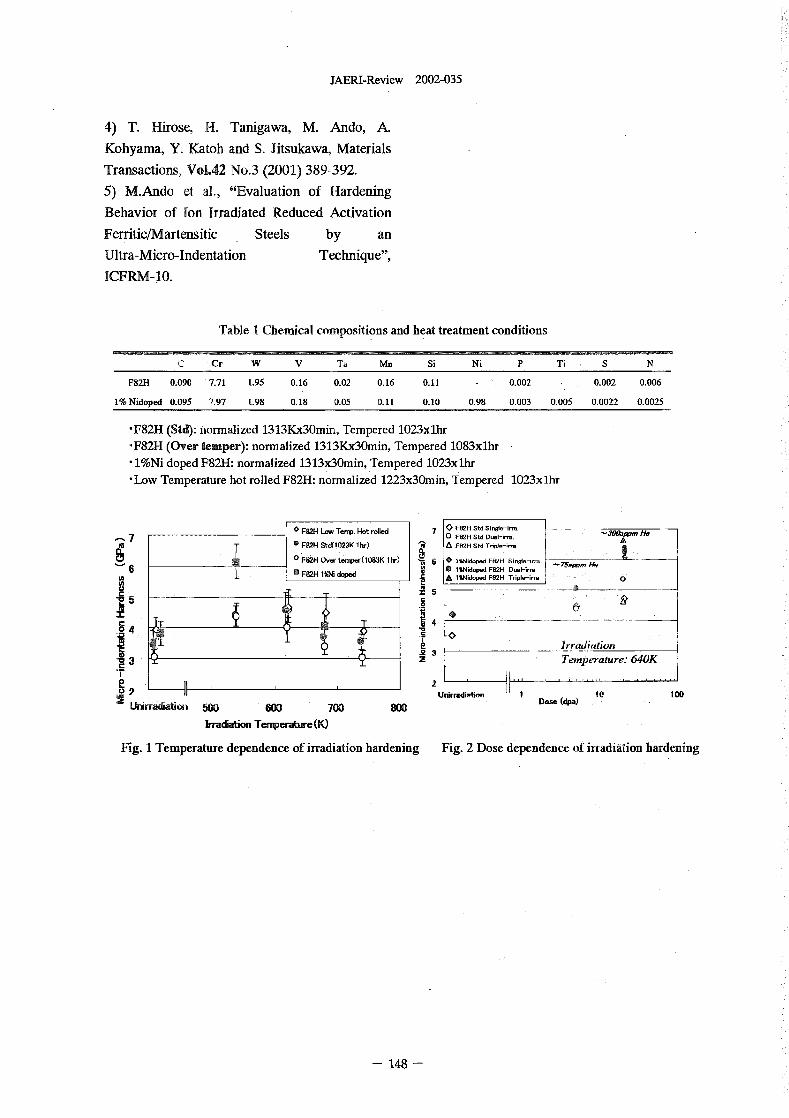
JAERI-Review 2002-035
4) T. Hirose, H. Tanigawa, M. Ando A.
Kohyarna, Y. Katoh and S. Jitsukawa. Materials
Transactions, Vol.42 No.3 2001) 389-392.
5) M.Ando el al., "Evaluation of Hardening
Behavior of Ion Irradiated Reduced Activation
Ferritic/Martensitic Steels by an
Ultra-Micro-Indentation Technique",
ICFRM-10.
Table I Cemical mpositions and heat treatment conditions
C Cr W v Ta Mn Si Ni P Ti S N
F82H 0.090 7.71 1.95 0.16 0.02 0.16 0.11 - 0.002 - 0.002 0.006
1% Nidoped 0095 7.97 1.98 0.18 0.05 0.11 0.10 0.98 0.003 0.005 0.0022 0.0025
-F82H (Std): ormalized 1313K00min, Tempered 1023x1hr-F82H (Over temper): normalized 1313K00inin.. Tempered 1083x1hr -
1%Ni doped F82H: normalized 131300min, Tempered 1023x1hr-Low Temperature hot rolled F82H: normalized 1223x3Omin, Tempered 1023x1hr
F82H Low Temp. Hot rolled 7 F H Std Sing,-i- I-- -- -_ -_
0 F2 -309.jWm He7 82H Std D-1-i-
F82H StK1023K 1h,) - A FR2H SH T6,1-i_
0F82H0.tev.(1083Klh,) 6 I Nid F82H Sing]-i--P-d 826 1%Nid.pd F H D-H-
Em 82H AN doped A Nid.pd F82H Tdpl-i- 0
55 .2
4 .S .0Irradiation
V 33 x Temperature: 640K
T
E 20 9 L-A
1 Urirradiwflon I Dow (dpa) to 100Lkirradation 5W 6W 700 800
IrTackedon TeFwar-atme(K)
Fig. 1 Temperature dependence of irradiation hardening Fig. 2 Dose dependence of iradiation hardening
148 -
JAERI-Review 2002-035
4.8 Effect of Tple Ion Beam Irradiation on MechanicalProperties of High Chromium Austenitic Stainless Steel
T.loka*, M.Futakawa*, Y.Nanjyo*, T.Suzuki* and K.Kiucht*
Department of Nuclear Energy System, JAERl*
1. Introduction were also examined as a reference.The ultra igh bumup(>JOOGWD/t) of The idiation condition was selected
LWR is considered to be an important based on the condition alculated with omputertechnology for establishing nuclear power plants simulation by assuming 10OGwd/t(N40X onas one of te most promising future ei)ergy ABWRS. The dse rate, helium by ( a)system ftom a view point of reducing reaction and hydrogen by (1), p) reaction wereradioactive waste and electrical cost. Cadding simulated by e ion irradiation of 12MeV WI,
materials 'With tile excellent long performance l.lMeV He+ and 380keV H+ at 573Kunder heavy irradiation would be required to corresponding to cladding surface temperature.these developments, The high chromium The He-'- and H ions -were implanted i depthaustenitic stainless steel(25Cr-35N142Ti ranges froill 1.0 to 1.5pm using energyUHP)"' was selected a one of candidates that degraders of alumininn foil. The oncentrationare possible to be made by the present of He+ and H ions in the implanted range wereengineering technologies. It is important to 100-150 appinfie and 1000-1600 appinH,suppress environmental cracking and ductility respectively, The dose was about 30-70dpa inloss on the hivb hrourium aostenitic alloy for the implanted ange.the cladding be, Triple ion beams were used The microindentation test was carried outfor simulating te effect of inradiation on the on the surface of specimens at room temperature.mechanical properties of te candidate aterial, Two types of mdeirters were used for theHowever, the ion irradiated area is limited to the microindentation test, One is the Berkovichvery sallow surface layer (<2[tm in depth) so indenter for measuring te apparent hardness,that the iff adiation damage is distributed around the other i te co 'cal indenter tat as athe thin layer. An indentation technique has been hemispherical apex with radius of I 4m forapplied to examine the ion irradiation effect on deriving the constitutive equ on.the mechanical properties of the thin layer (21, The inverse analysis was carried out using
In tis study, the change in apparent an explicit FEM code, LS-DYNA, whichhardness of the very shallow surface layer of the enables us to roughly analyze a large
iated material was calculated from the deformation accom anying with contactingresults of microijidentation test, The Swift's behavior, In the analysis, the indenter andpower low constitutive of the damaged parts was specimen were treated as axisymmetri to-derived fom the microindentation test combined dimensional bodies to take calculative efficiencywith an inverse aalysis['] using a finite element into account. The Modeled hidenters weremethod (FEM). The material properties of the perfectly rigid. Tile esh size is determined tocandidate material were compared with those of be sufficiently fine to keep accuracy: teType 304SS. minimum element size around the apex
contacting zone was 0, 05 [trn .2. Experimentsl procedure The constitutive equation of te material
The clienrical composition of candidate installed into the model was assumed to be amaterial is shown in Table 1. The tube of simple power-law wich is generally believed to11.3mm i outer diameter, 0.4m i thickness be applicable to ormal metallic materials asand 1000mm in length was produced by follows:incorporating the thermo-mechanical treatment or = Ee or or (1)so-called SAR (gained, gged andrecrystallized) E41 from the candidate material. or = Aeo + O) (2)
Type 304SS tubes which had been used to the E 0 (or A) 11n (ay E a > ay (3)cladding tube of the past commercial WRs y
- 149 -
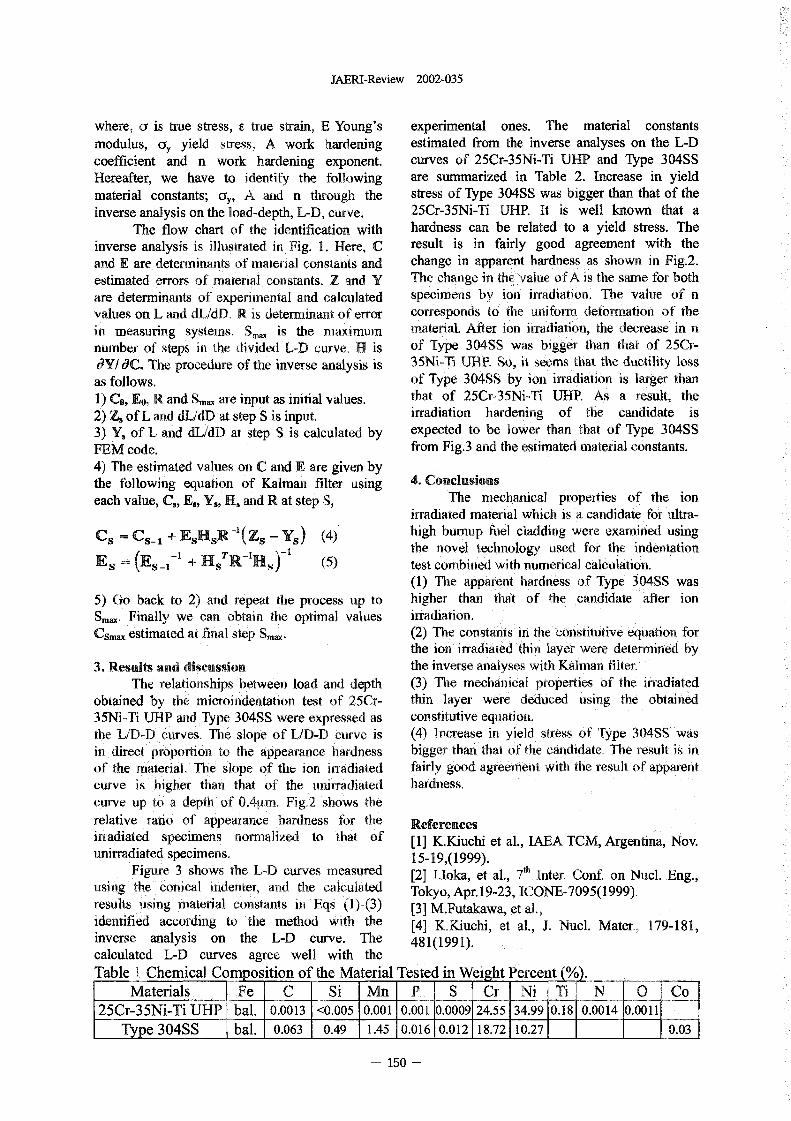
JAERI-Review 2002-035
where, a is true stress, true strain, E Young's experimental ones. The material constants
modulus, cyy yield stress, A work hardening estimated from the inverse analyses on the L-D
coefficient and n work hardening exponent. curves of 25Cr-35Ni-Ti HP and Type 304SS
Hereafter, we have to identify the following are summarized in Table 2 Increase in yield
material constants; cyy A and n through the stress of Type 304SS was bigger than that of the
inverse analysis on the load-depth, L-D, curve. 25Cr-35Ni-Ti UHP. It is well known that aThe flow chart of the identification with hardness can be related to a yield stress. The
inverse analysis is illustrated in Fig. 1. Here, C result is in fairly good agreement with theand E are determinants of material constants and change in apparent ardness as shown i Fig.2.
estimated rrors of material constants. Z and Y The change i the value of A is te ame for both
are determinants of experimental and calculated specimens by adiation. The value of n
values on L and d/dD, R is determinant of eror corresponds to the uniform deformation of te
in measuring systems. S. is the maximum material. After ion irradiation, the decrease in
number of steps in te divided L-D curve. H is of Type 304SS was bigger tan that of 25CY-
dyl ac. The procedure of the inverse analysis is 35Ni-Ti UHP. So, it seems tat the ductility loss
as follows. of Type 304SS by ion irradiation is Jarger tan
1) Co, E, R and S.. are input as initial values. that of 25Cr-35Ni-Ti UHP, As a result, the2) Z, of L and d/dD at step S is input. irradiation hardening of the candidate is
3) Y, of L ad d/dD at step S is calculated by expected to be lower than tbat of Type 304SS
FEM code. from Fig.3 and te estimated material constants.
4) The estimated values on C and are given bythe following equation of Kalman filter using 4. Conclusionseach value, C., s� Ys� H, and R at step S, The mechanical properties of the ion
irradiated material which is a candidate for ultra-
Cs Cs I EHsR -'(Zs ys) (4) high burnup fuel cladding were examined using
T -'Hs)-' the novel enology used for the indentationEs (Es-,-' +Hs R test combined with numerical calculation.
(1) The apparent ardness of Type �04SS was
5) Go back to 2 and repeat te process up to bigher than that of the candidate after ionS.,.. Finally we an obtain the optimal alues irradiation.
Cs.ax estimated at final step S,,,,,. (2) The constants in te constitutive equation forthe ion irradiated tin layer were determined by
3. Results and discussion the inverse analyses with Kalman filter.
The relationships between load and depth (3) The mechanical properties of the irradiated
obtained by te icroindentation test of MO- thin layer were deduced using te oained
35Ni-Ti UHP and Type 304SS were expressed as constitutive equation.
the L/D-D curves, Te slope of LJD-D curve is (4) Increase in yield stress of Type 304SS asin direct proportion to te appearance ardness bigger than tat of the candidate. The result is in
of the material. The slope of the ion iadiated fairly good agreement with the result of apparent
curve i higher than tat of the uniffadiated hardness.
curve up to a depth of 0.41im, Fig.2 sows the
relative atio of appearance hardness for te References
irradiated specimens normalized to that of [1] K.Kiuchi et al., IAEA TCM, Argentina, Nov.unirradiated specimens, 15-19,(1999).
Figure 3 shows the L-D curves measured [21 Joka, et al., 7 Inter. Conf. on Nucl..Eng.,using the conical indenter, and the calculated Tokyo, Apr. 9-23, ICONE-7095(1999)�results using material constants in Eqs (I)-(3) [31 M.Futakawa, et aL,
identified according to the method with te [4] K.Kiuchi, et al., J. Nucl. Mater., 179-181,inverse analysis on the L-D curve. The 481(1991).calculated L-D curves agree well with the
Table I Chemical Compo on of the Material Teste in ight Perce t (0/0).
Materials Fe C I Si I Mn P I S I Cy I Ni I Ti I N I Co
25Cr-3 5Ni-Ti UHP bal. 0.00 13 <0.005 0.001 0.001 0009 24.55134.9910.18 00014 .0011
Type 304SS bal. 0.063 049 145 10.01610.012118.72110.271 F 0.03
- 15 -
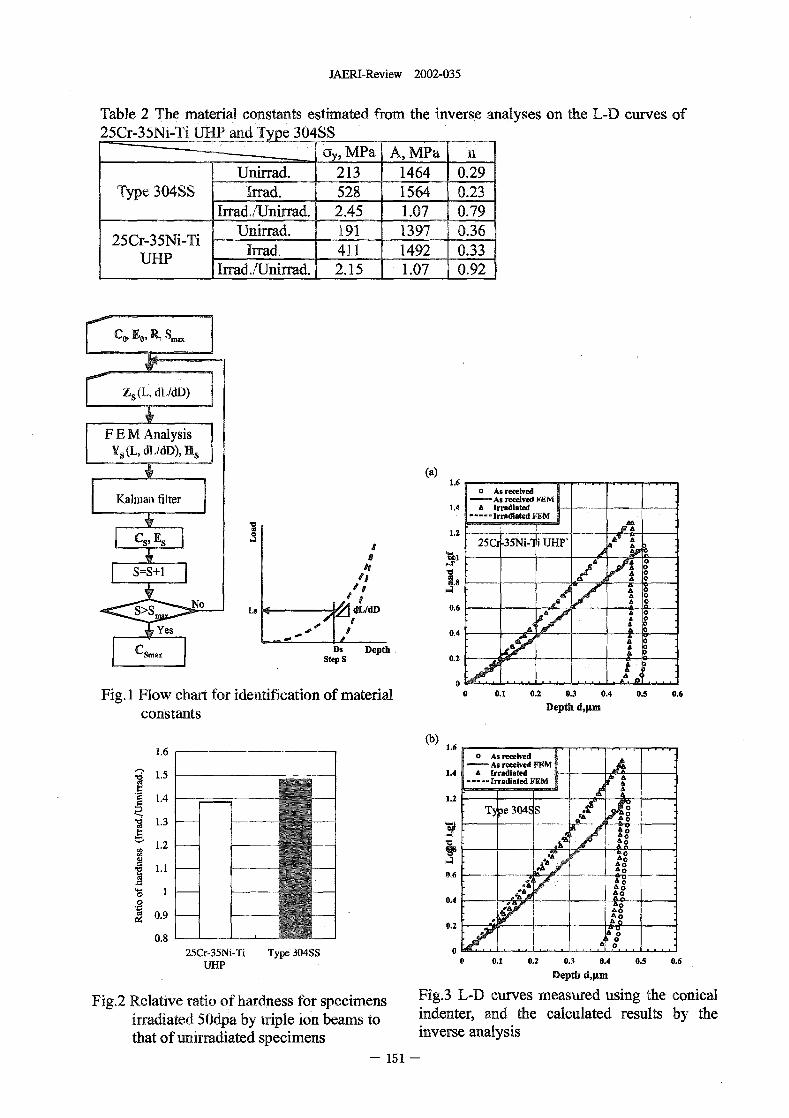
JAERI-Review 2002-035
Table 2 The material constants estimated from the inverse analyses on the L-D curves of25Cr-35Ni-Ti UHP and Type 30 Ss
cyy, MPa A, MPa IIUnirrad. 213 1464 0.29
Type304SS Irrad. 528 1564 0.23Irrad./Unirrad. 2.45 1.07 0.79
25Cr-35Ni-Ti - Unirrad. 191 1397 0.36 -UHP Irrad. 1492 0.33 -
Irrad.Xnirrad. 2.15 I .07 0.92-
C 05 E0, R, S..
Ys(L' AnalysisL, IL M) Hs
(a)1.6 . . . . . . . . . . . .
A. receivedKalman As received Wk
1.4 a irradiated-- irradlatedFUM
Al1.2
.4 OF -A25Cr-35Ni- i BEP' a A
0+ V
> Ls QL/dD 0.6
0A
Ds Depth$max step S 0.2
0 . . . . . . . .Fig. I Flow chart for identification of material 0 0.1 0.2 0.3 0.4 0.5 0.6
constants Depth dam
(b) 1.6
1.6 0 As received
- As received FFM1.5 1.4 A Irradiated a
-.- IrradiatedFEM
1.4 1.2 e7Type 3041, S
1.3 - V
1.2 -
000.6
0AO
0.4'A0
090.2
0.8 1002SCr-35Ni-Ti Type3O4SS 0Lae-
UHP 0 0.1 0.7 0.3 0.4 0.5 0.6
Depth dam
Fig.2 Relative ratio of hardness for specimens Fig.3 L-D curves measured using the conicalirradiated 50dpa by triple ion beams to - indenter, and the calculated results by thethat of unirradiated specimens inverse analysis
151
JAERI-Review 2002-035
4.9 Effect of ion irradiation on mechanical propertyof materials contact with liquid metal
M.Futakawa*,YKurata*",I.Ioka*,SSaito**, A.Naito*, S.Harnada*,andY. Kogawa**Department of Nuclear Energy System, JAERI
Center for proton accelerator facilities, JAERI
1. Introduction austenitic stainless steel, JPCA was
The liquid metals are expected to be examined by using the indentation
used as neutron spallation. targets, i.e. technique that gives information on
mercury for a high intensive neutron source material properties of a small zone
[11 and lead-bismuth for accelerator-driven irradiated with ion beam and influenced by
systems (ADSs) for transmutation of minor mercury immersion. In order to
actinides and long-lived fission products 2]. quantitatively evaluate the material
The compatibility of the structural property, the verse analysis was applied
materials with the liquid metals is one of to the load and depth curves measure by
the crucial issues from the viewpoint of the instrumented indentation machine, The
structural integrity and determination of technique will be applicable to understand
lifetime of components under irradiation the localized corrosion degradation, stress
condition due to proton beam and spOation corrosion cracking, radiation damage etc.,
reaction. Liquid metal embrittlement, LME, from the viewpoint of micro andlor nano
is. the classical problem, which many property changes.
researchers have been reported so far 34].
The LEM occurs with combination among 2. Experimental
the kind of liquid and solid metals, Specimen is a disk of 3mm in diameter
temperature, imposed stress, oxygen with 0.2mm thickness. he electrochemically
contents, etc. and the features and polished specimens were irradiated at a
mechanisms are still open questions. Lately, temperature of 200'C with triple ion beams;i3it has been reported that the fatigue 12MeV N , 750keV He' and 290keV W
strength of certain martensitic steel is and dual ion beams; Ni , He and He+, W.
clearly decreased in the lead-bismuth and The SRIM97 code was osed to compute the
the LME effect on the fatigue is discussed implanted Jon concentration and the
[5]. The material property at the interface displacement dose as a fction of depth
between the liquid ad solid metals under beneath the - specimen Surface. The
irradiation condition should be investigated displaceme" amage in the specimen is
to understand the feature of the mainly attribii(6d to W ion implantation.
compatibility to liquid metal and the LEM. The peak decomposition is around 24m. The
The schematic iagram. of the experiment peak positions of implanted He' and H ions
using TIARA facility to simulate irradiation are controlled so that te effect of implanted
condition is iustrated in Fig.l. In this N13+ ions can be neglected. At the depth of
paper, the LME due to mercury against approximately 1.3pt i the specimen, the
- 152 -
JAERI-Review 2002-035
dose is ca. IO dpa and te Te/dpa and H/dpa the L/D-D curve is corresponding to the
ratios are about 200 and 2000 appm/dpa, apparent hardness. The ifference between
respectively, In case of the dual ion beam the L/D-D curves of the as-received and 100
with H` ad W, the amounts of implanted h immersed ones i clearly recognized- the
ions were equal to those i the triple ion beam slope of the surface layer contacting with
irradiation. The irradiated specimens were the mercury is larger than that of substrate,
immersed into the mercury of 300 cc covered although the slope of the as received
by Ar gas. The temperature of the mercury specimen is almost constant independently
was raised tip to 150 `C and kept to be of the depth. It means that the surface
constant up to certain periods, max. 2000 h. becomes harder by immersing into the
The indentation tests were carried out mercury. The depth at which the slope
before and after the irradiation and changes is defined by te characteristic
immersion tests using the indenter with a depth, dc. The characteristic epth indicates
hemispherical apex with radius of 12 gm the thickness of the surface layer with
and Berkovich indenter. different properties from those of the
substrate. Figure shows te relationship
3. Inverse analysis between the characteristic depth, d, and the
Mechanical property change at the immersion time, t. It is recognized that d,
interface between liquid and solid metals increases with increasing t and the srface
was evaluated by usin g indentation properties was clearly affected by the
technique. The inverse analysis was applied mercury immersion, In general, the depth
to the load and depth curves measured by for hardness measurement hould be chosen
indentation technique in order to to be less than the 1/7 tickness of the
quantitatively evaluate the constitutive measured surface layer to avoid the
equation that defines the relationship influence on the hardness from the
between load and deformation. The inverse substrate 7 i.e. the thickness of the
analysis was carried out sing the FEM surface layer affected by the mercury
model combined with Kalman filter, immersion is 7 times larger than de at least.
described i detail elsewhere [6). The shape That is, the thickness influenced by
of the indenter is spherical because it was mercury is thicker than 35 m after 500 hr
confirmed that the accuracy of identification immersion.
of the constitutive equation using the Figure 4 shows the change of slope
spherical indenter is much better than that due to the mercury immersion and irradiation.
using the conventional Berkovich or Independently of irradiation, the hardness
Bikkers indenters. The formulation of the increases by the mercury immersion. The
constitutive equation is assumed by the hardness of specimens irradiated with (Ni3l,
following Swift power low equation. He', H) and (Ni3', He) is about 2 times
higher than that of as-received one. It seems
4. Results that H' ion enhances the increase of hardness
Figure 2 shows the load/depth and due to mercury immersion. The mercury
depth, L/D-D curve measured by immersion and (Ni3+, He% H) irradiation
Berkovich indenter, in wich the slope of increase the hardness up to 24 time as high as
153 -
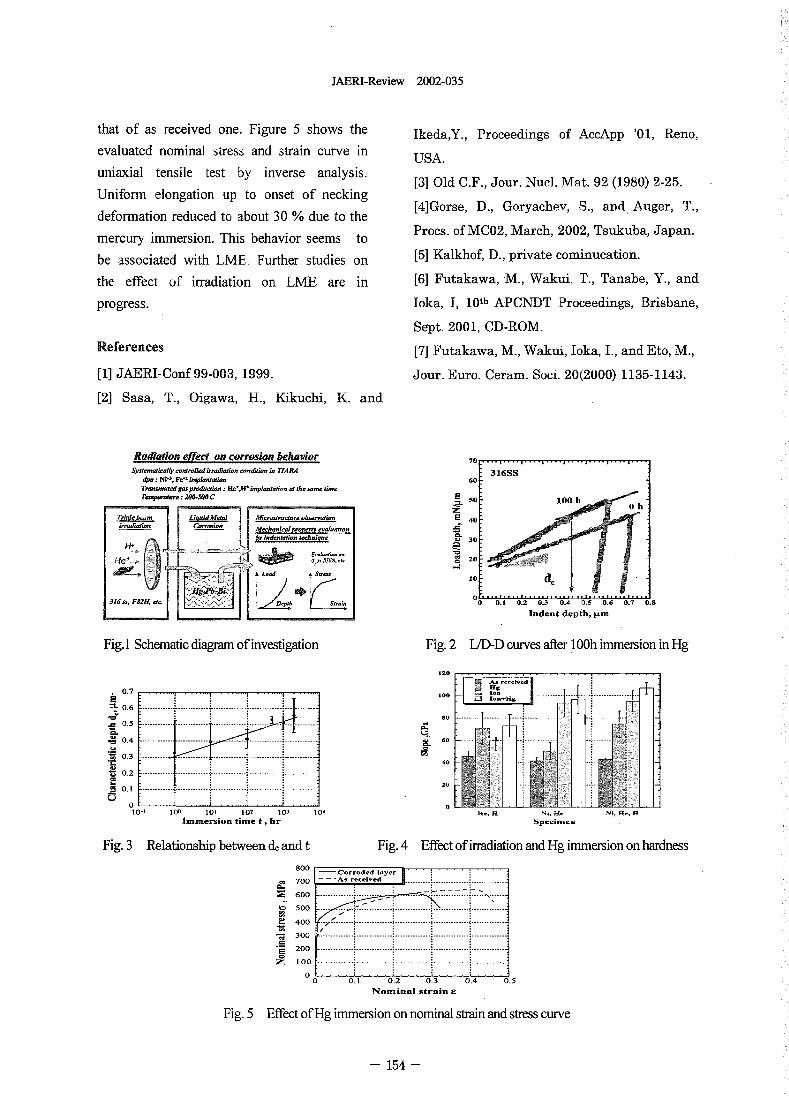
JAERI-Review 2002-035
that of as received one. Figure shows the IkedaY., Proceedings of AccApp '01, Reno,
evaluated nominal stress and strain curve in USA.
uniaxial tensile test by inverse analysis. [3] Old CY, Jour. Nuel. Mat. 92 1980 225.
Uniform elongation up to onset of necking [4]Gorse, D., Goryachev, S., and. Auger, T.,
deformation reduced to about 30 due to the
mercury immersion. This behavior seems to Procs. of MC02, March, 2002, Tsukuba, Japan.
be associated with LME, Further studies on [51 Kalkhof, D., private cominucation.
the effect of irradiation on LME are in [61 Futakawa, M., Wakui, T., Tanabe, Y., and
progress. loka, I, loth APCNDT Proceedings, Brisbane,
Sept. 2001, CD-ROM.
References [71 Futakawa, M., Wakui, Ioka, L, and Eto, M.,
[1] A-ERI-Conf 99-003, 1999. Jour. Euro. Ceram. Soci. 20(2000) 1135-1143.
[2] Sasa, T., Oigawa, H., Kikuchi, K. and
Ra&adon effed an corrosion bhavior 70 . . . . . .
Syste-w-11y -a�lled-dw- -dai.. i. TURA 316SSdp.: W F ipl..wd.. 60T--1&g-p-d.ai-: th- fi-
reww.mre: A&SQ6 C rm so 100 h=L 0 h
Mpk b-. LiggidM&W, -b- i.. 40i .. dwi- C-i- )W�A_;CdPP.M -d-ft-
Ly indenwign 1mh.!qe 30
20
A -d S- 10 der 0 t-316 F82H, Dep S-M 0 0.1 0.2 03 0.4 0.5 06 07 0.8
Indent depth, �Lxn
Fig. I Schematic diagram of investigation Fig. 2 LJD-D curves after I 0h immersion in Hg
120�,d
0.7 100 ...............-.nLILL0.6 ............ . ............. ........
so . ....... ...0.5 ............ -----
Ca0.4 ........ ------- 60
0.3 ----------- .......... -------------40
-Z 0.2 ------------ ------------- ------------- ------------- ------------
200.1 ------------ ------------- ........ ------------- ------------
0 010-1 100 101 102 103 10, Nb H.
Immersion time t hr sp..i-..
Fig. 3 Relationship between d, and t Fig. 4 Effect of iradiation and Hg immersion on hardness
800
700 ... 1-d
600 ............. .. .. . .....
t:, 500 - ----------- --------------
400 .......... I.............. .............. e-------------- ..............
3 0 0 ............ I.............. .............. .............. .............
200 -------------------- --------- -------------- -------------- -------------
100 ............... :-------------- .............. -------------- .............0 0 0.1 0.2 0.3 0.4 0.5
Nominal strain
Fig. 5 Effect of Hg immersion on nominal strain and stress curve
154 -
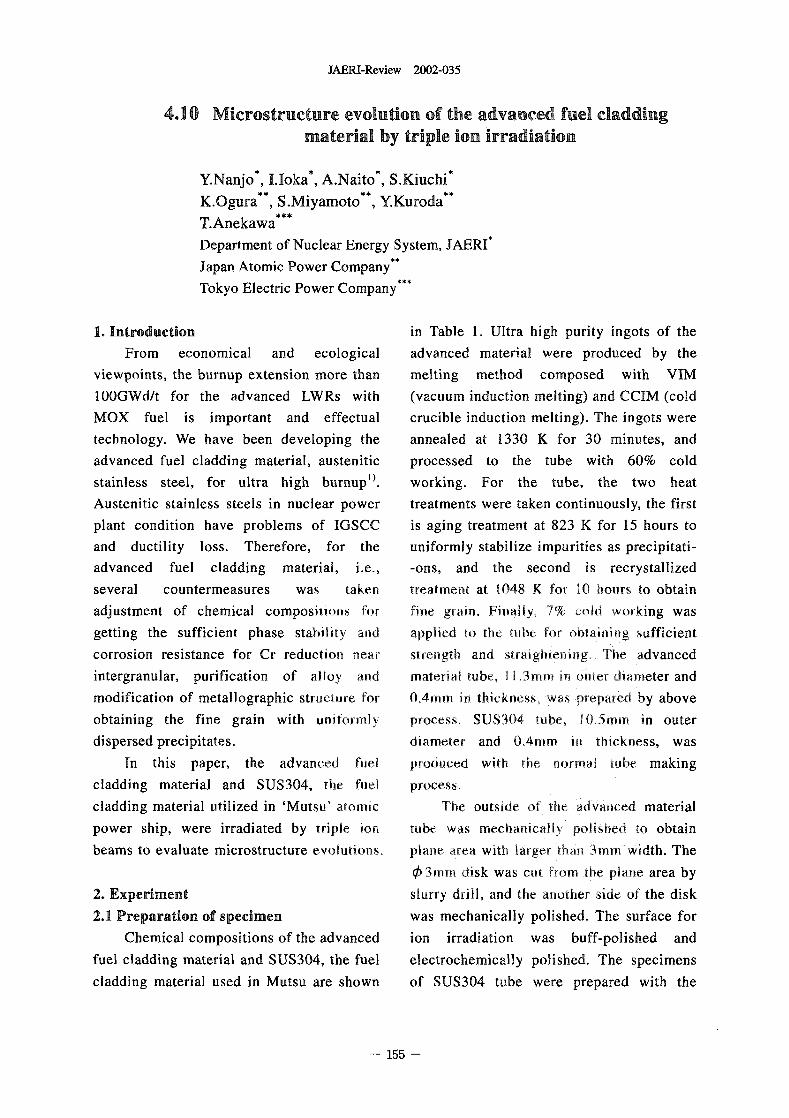
JAERI-Review 2002-035
4.10 Microstructure evolution of the advanced fuel claddingmaterial by triple ion irradiation
Y.Nanjo% .loka*, A.Naito*, S.Kiuchi*K.Ogura**, S.Miyamoto", Y.Kuroda**T.Anekawa***Department of Nuclear Energy System, JAERI*Japan Atomic Power Company"Tokyo Electric Power Conipany***
1. Introduction in Table 1. Ultra high purity ingots of theFrom economical and ecological advanced material were produced by the
viewpoints, the brrnup extension more than melting method composed with VIM
IOOGWd/t for the advanced WRs with (vacuum induction melting) and CCIM (cold
MOX fuel is important and effectual crucible induction melting). The ingots were
technology. We have been developing the annealed at 1330 K for 30 minutes, and
advanced fuel cladding material, austenitic processed to the tube with 60% cold
stainless steel, for ultra high burnup'). working. For the tube, the two heat
Austenitic stainless steels in nuclear power treatments were taken continuously, the first
plant condition have problems of IGSCC is aging treatment at 823 K for 15 hours to
and ductility loss. Therefore, for the uniformly stabilize impurities as precipitati-
advanced fuel cladding material, i.e., -ons, and the second is recrystallized
several countermeasures was taken treatment at, 048 K for 10 hours to obtain
adjustment of chemical compositions for fine grain. Finally 7 cold working was
getting the sufficient phase stability and applied to te tbe for btaining sufficient
corrosion resistance for Cr reduction near strength and straightening. Te advanced
intergranular, purification of alloy and material tube, I I 3turn in outer diameter and
modification of metallographic structure for 04airn in thickness, was prepared by above
obtaining the fine grain with uniformly process, SUS304 tube, 10.5min in outer
dispersed precipitates. diameter and 0.4mm in tickness, was
In this paper, the advanced fuel produced with the normal tube making
cladding material and SUS304, the fel process,
cladding material utilized in Mutsu' atomic The outside of te advanced material
power ship, were irradiated by triple ion tube was mechanically polished to obtain
beams to evaluate microstructure evolutions, plane area with larger than 3nuu width. The
953min disk was ct from the pane area by
2. Experiment slurry di-ill, and the another side of the disk
2.1 Preparation of specimen was mechanically polished. The surface for
Chemical compositions of the advanced ion irradiation was buff-polished and
fuel cladding material and SUS304, the fuel electrochemically polished. The specimens
cladding material used in Mutsu are shown of SUS304 tube were prepared with the
- 15 -
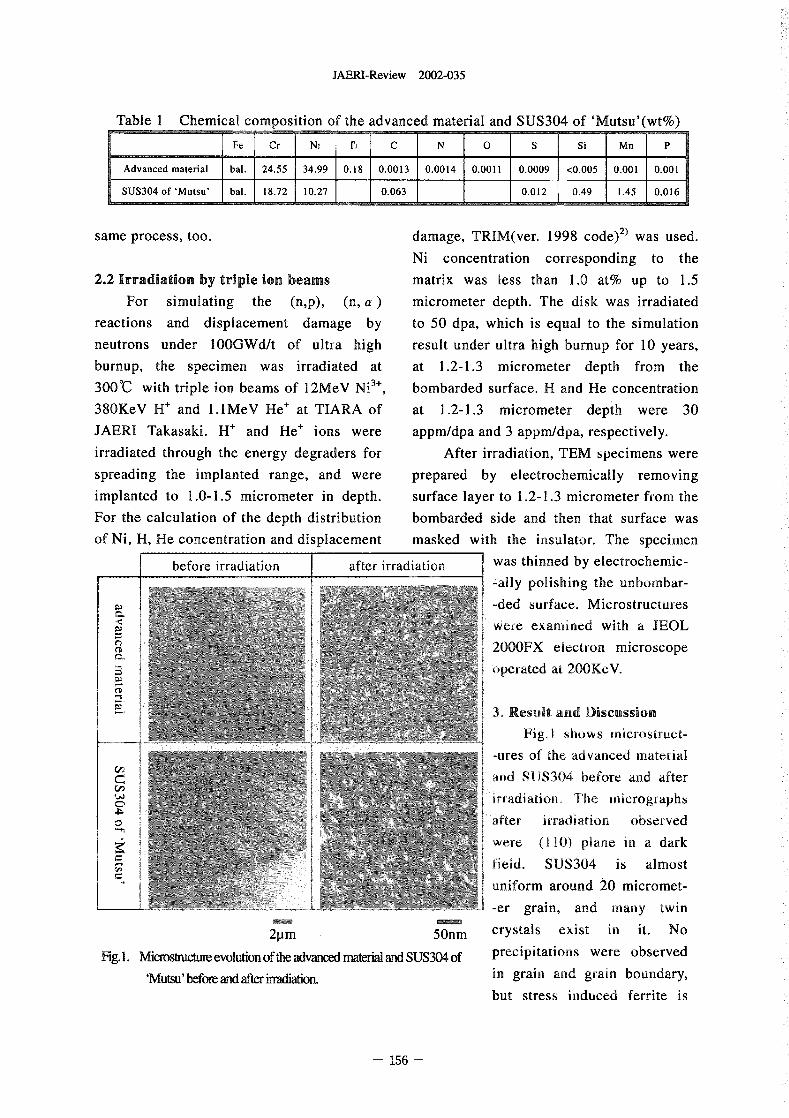
JAERI-Review 2002-035
Table I Chemical composition of the advanced material and SUS304 of Mutsu'(wt%)
Fe I Cr Ni Ti C N 0 S Si Mn P
Advanced material bal 34.99 0.18 0.0013 0.0014 0.0011 0.0009 <0.005 0.001 0.001
SUS304 of 'Mutsu' 10.27 0.063 0.012 0.49 1.45 0.016
same process, too. damage, TRIM(ver. 1998 code)2) was used.
Ni concentration corresponding to the
2.2 Irradiation by triple ion beams matrix was less than 1.0 at% up to 1.5
For simulating the (np), (n a micrometer depth. The disk was irradiated
reactions and displacement damage by to 50 dpa, which is equal to the simulation
neutrons under IOOGWd/t of ultra high result under ultra high burnup for 10 years,
burnup, the specimen was irradiated at at 12-1.3 micrometer depth from the
300 -C with triple ion beams of 12MeV Ni 3+ bombarded surface. H and He concentration
38OKeV H' and LlMeV He' at TIARA of at 12-1.3 micrometer depth were 30
JAERI Takasaki. H' and He' ions were appm/dpa and 3 appm/dpa, respectively.
irradiated through the energy degraders for After irradiation, TEM specimens were
spreading the implanted range, and were prepared by electrochemically removing
implanted to 1.0-1.5 micrometer in depth. surface layer to 12-1.3 micrometer from the
For the calculation of the depth distribution bombarded side and then that surface was
of Ni, H, He concentration and displacement masked with the insulator. The specimen
before irradiation after irradiation was thinned by electrochemic--ally polishing the unbombar-
-ded surface. Microstructures
were examined with a JEOL
2000FX election microscope
operated at 20OKeV.CD
3. Result ad Discussion
Fi I shows microstruct-
-ures of the advanced material
and SILJS304 before and after
irradiation, The micrographs4-
after irradiation observed
were (I 0) plane i a dark
field. SUS304 is almost
uniform around �O micromet-
-er grain, and many twin
2pm 50nm crystals exist in it. No
fig. . Microstructure evolution of the advanced material and SUS304 of precipitations were observed
'Mutsu'before and ater irradiation. in grain and grain boundary,but stress induced ferrite is
- 156 -
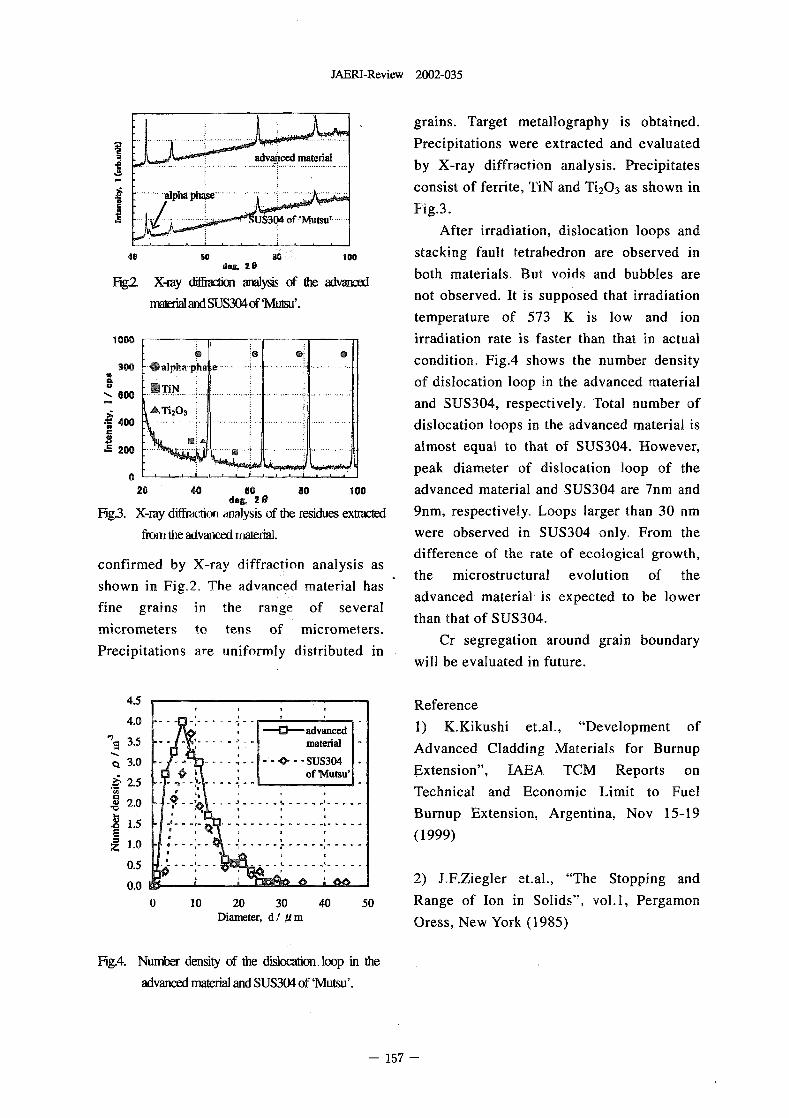
JAERI-Review 2002-035
grains. Target metallography is obtained.
Precipitations were extracted and evaluatedmaterial. ............... by X-ray diffraction analysis. Precipitates
phase" consist of ferrite, TiN and Ti2O3 as shown in
Fig.3.
After irradiation, dislocation loops and
40 so so 100 stacking fault tetrahedron are observed indog. 2 both materials. Bt voids and bubbles are
Fjg.Z X-ray dilliaefim analysis of the advaix)edmaterialandSUS304of Mitsu'. not observed. It is supposed that irradiation
temperature of 573 K is low and ion
1000 irradiation rate is faster than that in actual
......... . condition. Fig.4 shows the number densitygoo ealphW-P ha e-CL0 of dislocation loop in the advanced materialOUN ':0 0 ........... ... .... ..... ............. ..
and SUS304, respectively. Total number ofAr203
400 dislocation loops in the advanced material is
S 200 almost equal to that of SUS304. However,peak diameter of dislocation loop of the
20 40 so so 100 advanced material and SUS304 are 7nm anddog, 28
Fig.3. X-ray diffraction analysis of the residues extracted 9nm, respectively. Loops larger than 30 nin
ftom the advaiwed "erial. were observed in SUS304 only. From the
confirmed by X-ray diffraction analysis as difference of the rate of ecological growth,the microstructural evolution of the
shown in Fig.2. The advanced material has advanced material is expected to be lowerfine grains in the range of several than that of SUS304.micrometers to tens of micrometers.Precipitations are uniformly distributed in Cr segregation around grain boundary
will be evaluated in future.
4.5 Reference4.0
O- advanced 1) K.Kikushi et.al., "Development of3.5 material - Advanced Cladding Materials for Burnup3.0 SUS304 -
of Mutsu' Extension", IAEA TCM Reports on.2� 2.5
Teclinical and Economic Limit to Fuel7,0 ------------
Burnup Extension, Argentina, Nov 15-19-------- ----- (1999)
LO .............
0.5
0.0 2) J.F.Ziegler et.al., "The Stopping and0 10 20 30 40 50 Range of Ion in Solids", vol.1, Pergamon
Diameter, d/ urn Oress, New York 1985)
FigA Number density of the dislocation. loop in the
advanced material and SUS304 of 'Mutsu'.
157 -
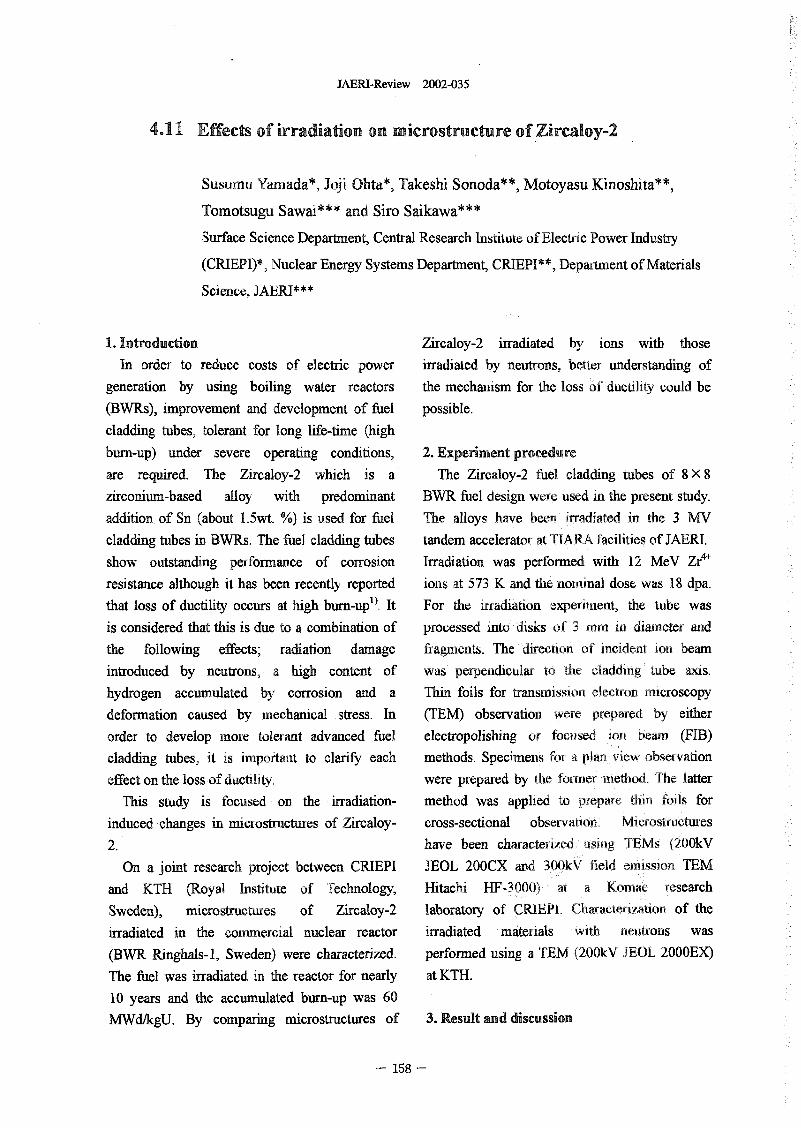
JAERI-Review 2002-035
4.11 Effects of irradiation on microstructure of Zircaloy-2
Susumu Yamada*, J 'i Ohta*, Takeshi Sonoda", Motoyasu Kinoshita"
Tomotsugu Sawai*** and Siro Saikawa***
Surface Science Department, Central Research Institute of Electric Power Industry
(CRIEPI)*, Nuclear Energy Systems Department CRIEPI**, Department of Materials
Science, JAERI***
1. Introduction Zircaloy-2 irradiated by ions with thoseIn order to reduce costs of electric power irradiated by neutrons, better understanding of
generation by using boiling water reactors the mechanism for the loss of ductility could be(BWRs), improvement and development of fuel possible.cladding tubes, tolerant for long life-time (highbum-up) under severe operating conditions, 2. Experiment procedureare required. The Zircaloy-2 which is a The Zircaloy-2 uel cladding tubes of 8 X 8zirconium-based alloy with predominant BWR fuel design were used in the present study-addition of Sn (about 1.5wt. %) is used for fuel The alloys have been irradiated in the 3 Vcladding tubes in BWRs. The fuel cladding tubes tandem accelerator at TIARA facilities of JAERLshow outstanding performance of corrosion Irradiation was performed with 12 MeV Ze'resistance although it has been recently reported ions at 573 K and the ominal dose was 18 dpa.that loss of ductility occurs at high bum-up", it For the irradiation experiment, the tube wasis considered that this is due to a combination of processed into disks of 3 min i diameter andthe following effects; radiation damage fragments. The direction of ncident ion beamintroduced by neutrons, a high content of was perpendicular to the cladding tube axis.hydrogen accumulated by corrosion and a Thin foils for transmission electron microscopydeformation caused by mechanical stress. In (TEM) observation were prepared by eitherorder to develop more tolerant advanced fuel electropolishing or focused ion beam (FIB)cladding tubes, it is impoitant to clarify each methods, Specimens for a plan view observationeffect on the loss of ductility. were prepared by the former method. The latter
This study is focused on the irradiation- method was applied to prepare thin o forinduced changes in microstructures of Zircaloy- cross-sectional observation Microstructures2. have been characterized using TEMs 2kV
On a joint research project between CRIEPI JEOL 200CX and kV field otirission TEMand KTH (Royal nstitute of Technology, Hitachi HF-30001) at a Komae researchSweden), microstructuies of Zircaloy-2 laboratory of CRIEPI, Characterizatiou of theirradiated in the commercial nuclear reactor irradiated materials with neutrons was(BWR Ringhals-1, Sweden) were characterized. performed using a TEM 2OOkV JEOL 2000EX)The fuel was irradiated i the reactor for nearly at KTH.10 years and the accumulated bum-up was 60MWd/kgU. By comparing microstructures of 3. Result and discussion
- 15 -
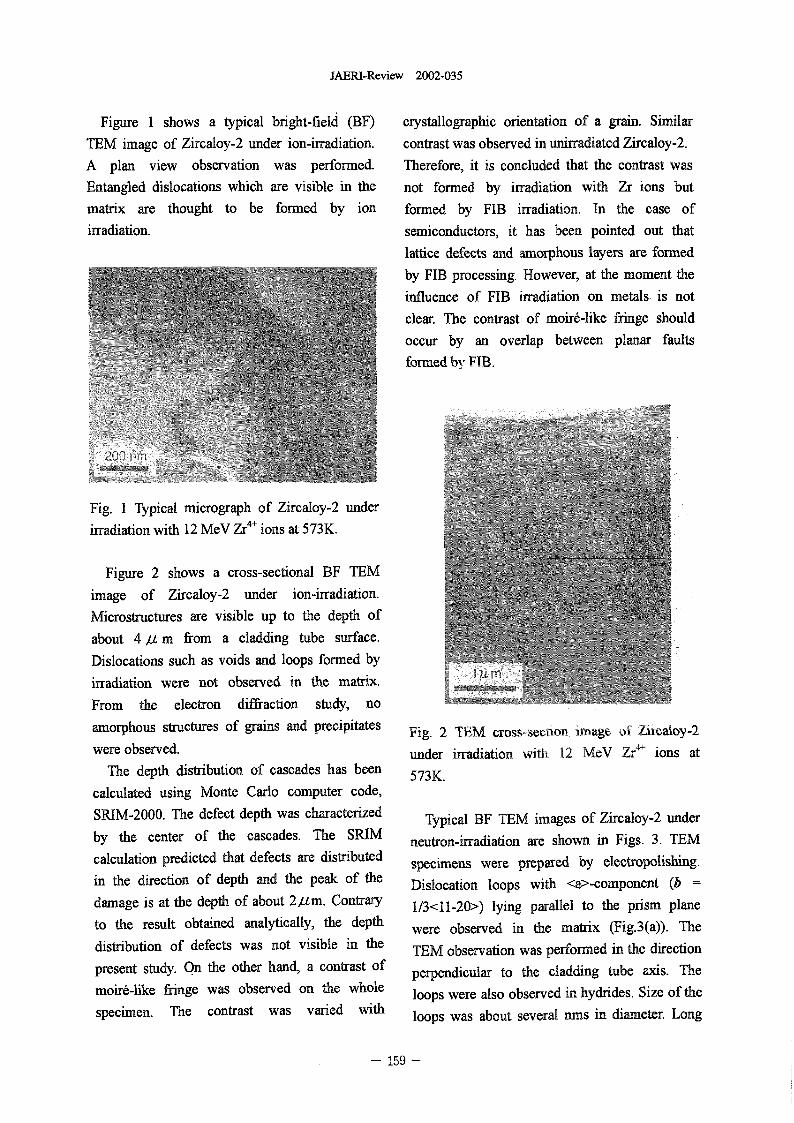
JAERI-Review 2002-035
Figure I shows a typical bright-field (BF) crystallographic oentation of a grain. Similar
TEM image of Zircaloy-2 under ion-irTadiation. contrast was observed in unirradiated Zircaloy-2.
A plan view observation was performed. Therefore, it is concluded that the contrast was
Entangled dislocations which are visible in the not formed by irradiation with Zr ions but
matrix are thought to be formed by ion formed by FIB irradiation. In the case of
irradiation. semiconductors, it has been pointed out that
lattice defects and amorphous layers are formed
by FIB processing. However, at the moment the
influence of FIB irradiation on metals. is not
clear. The contrast of moir6-like fiinge should
occur by an overlap between planar faults
formed by FIB.
Fig. Typical micrograph of Zircaloy-2 under
irradiation with 12 MeV Zr4+ ions at 573K.
Figure 2 shows a cross-sectional BF TEM
image of Zircaloy-2 under ion-irradiation.
Microstructures are visible up to the depth of
about 4 gm from a cladding tube surface.
Dislocations such as voids and loops formed by
irradiation were not observed in the matrix.
From the electron diffraction study, no
amorphous structures of grains and precipitates Fig. 2 TEM cross-section irnage of iycaloy-2
were observed. under irradiation with 12 MeV Zr�"_ ions atThe depth distribution of cascades has been 573K.
calculated using Monte Carlo computer code,
SRIM-2000. The defect depth was characterized Typical BF TEM images of Zircaloy-2 under
by the center of the cascades. The SRIM neutron-irradiation are shown in Figs. 3 TEM
calculation predicted that defects are distributed specimens were prepared by electropolishing.
in the direction of depth and the peak of the Dislocation loops with <a>-component (b =
damage is at the depth of about 29m. Contrary 1/3<11-20>) lying parallel to the prism plane
to the result obtained analytically, the depth were observed in the matrix (ig.3(a)). The
distribution of defects was not visible in the TEM observation was performed in the direction
present study. n the other hand, a contrast of perpendicular to the cladding tube axis. The
moir6-like fiinge was observed on the whole loops were also observed in hydrides. Size of the
specimen. The contrast was varied with loops was about several runs in diameter. Long
-159 -
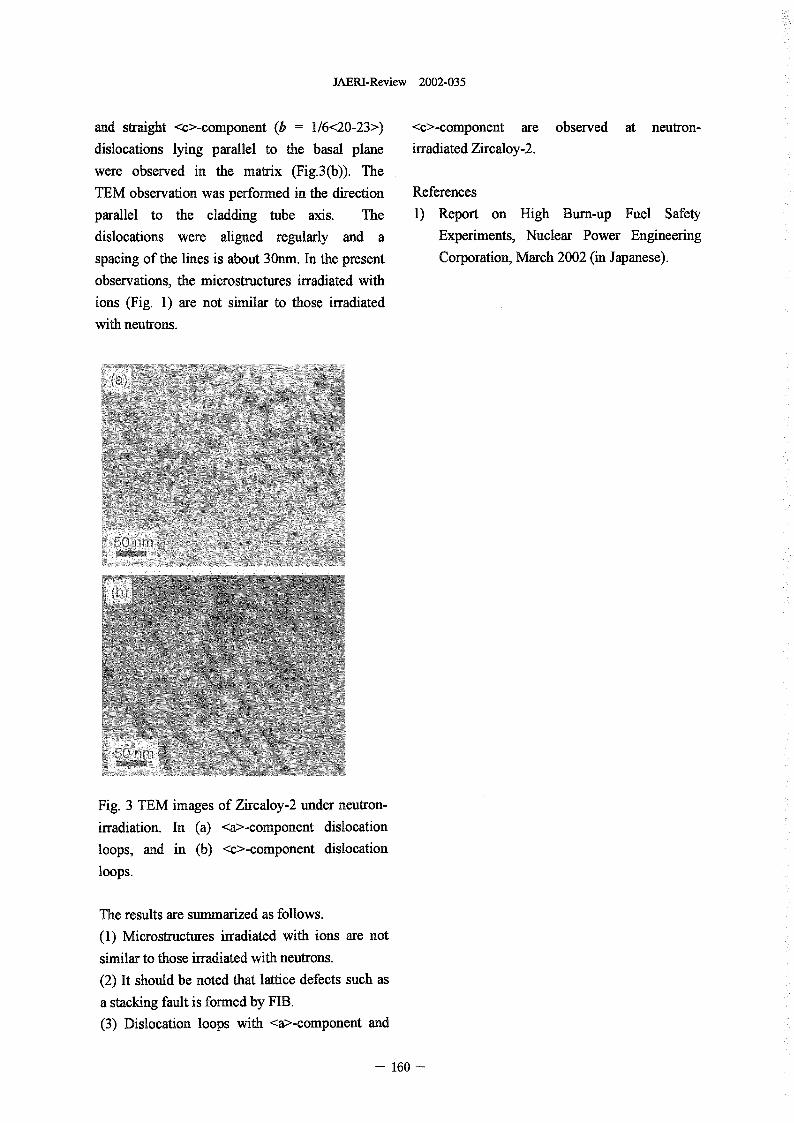
JAERI-Review 2002-035
and straight <c>-component (b = 16<20-23>) <c>-component are observed at neutron-
dislocations lying parallel to the basal plane irradiated Zircaloy-2.
were observed in the matrix (Fig.3(b)). The .
TEM observation was performed in the direction References
parallel to the cladding tube axis. The 1) Report on High Bum-up Fuel Safety
dislocations were aligned regularly and a Experiments, Nuclear Power Engineering
spacing of the lnes is about 30mn. In the present Corporation, March 2002 (in Japanese).
observations, the microstructures irradiated with
ions (Fig. 1) are not similar to those irradiated
with neutrons.
Fig. 3 TEM images of Zircaloy-2 under neutron-
irradiation. In (a) <a,>-component dislocation
loops, and in (b) <c>-component dislocation
loops.
The results are summarized as follows.
(1) Microstructures irradiated with ions are not
similar to those irradiated with neutrons.
(2) It should be noted that lattice defects such as
a stacking fault is formed by FIB.
(3) Dislocation loops with <a>-component and
- 160 -
JAERI-Review 2002-035
4.12 Effects of Initial Grain Boundary Segregation on Radiation-
Induced Segregation in SUS 316L Stainless Steel
F. Kno*, A. Naito** and L Ioka**Toshiba Corporation*Department of Material Science, JAERI**
1. Introduction 2. ExperimentalThe recent mechanistic The specimens examined were
consideration on irradiation assisted sheets of SUS 3161, (similar to Typestress corrosion cracking (IASCC) has 316L SS) stainless steel (10 mm infocused on the role of grain boundary thickness). The chemical composition(GB) segregation. The chromium (Cr) is shown in Table 1. All thedepletion at grain boundary due to specimens were beat treated at 10659Cirradiation is considered to be the most for 77 minutes, followed by water-
important factor because stress cooling. Subsequently, special
corrosion cracking susceptibility of thermal treatment, shown in Fig.1,
thermally sensitized stainless steels is was carried out to enrich Cr around
determined by the degree of Cr the grain boundary using SUS 316L
depletion at grain boundary". rod specimens with 8mm-diameter and
Chromium depletion at grain 12mm-length.
boundaries in stainless steels has been The 3mm-diameter TEM disks were
regarded as a predominant cause for irradiated with 2MeV Ni3l ions at
SCC in LWR components. The 573K up to 3 dpa at Igm depth from
chromium depletion caused by the surface. The damage peak depth
irradiation, namely radiation induced and Ni ion range peak depth were over
segregation (RIS), takes place in 3gm. It is known by analysis that at
contrast to the Cr enrichment caused 1 gm-depth the influence of nickel ion
by thermal processing of alloys. The can be removed by TRIM calculation.
behavior of molybdenum (Mo) is After irradiation, surface layer of the
similar to that of Cr concerning the specimen was removed by
binding property to carbon and RIS . electropolishing b jgm-depth and the
We investigated the irradiation specimen was back-thinned for
characteristic of the SUS 316L SS perforation in HC104 CH3COOH
having initial grain boundary solution.
segregation of Cr and Mo induced by
heat treatment.Table I Chemical composition of specimen
316L C SiL-Lt%) L 0.00:8 b0.0 8 .0 2.61
- 161 -
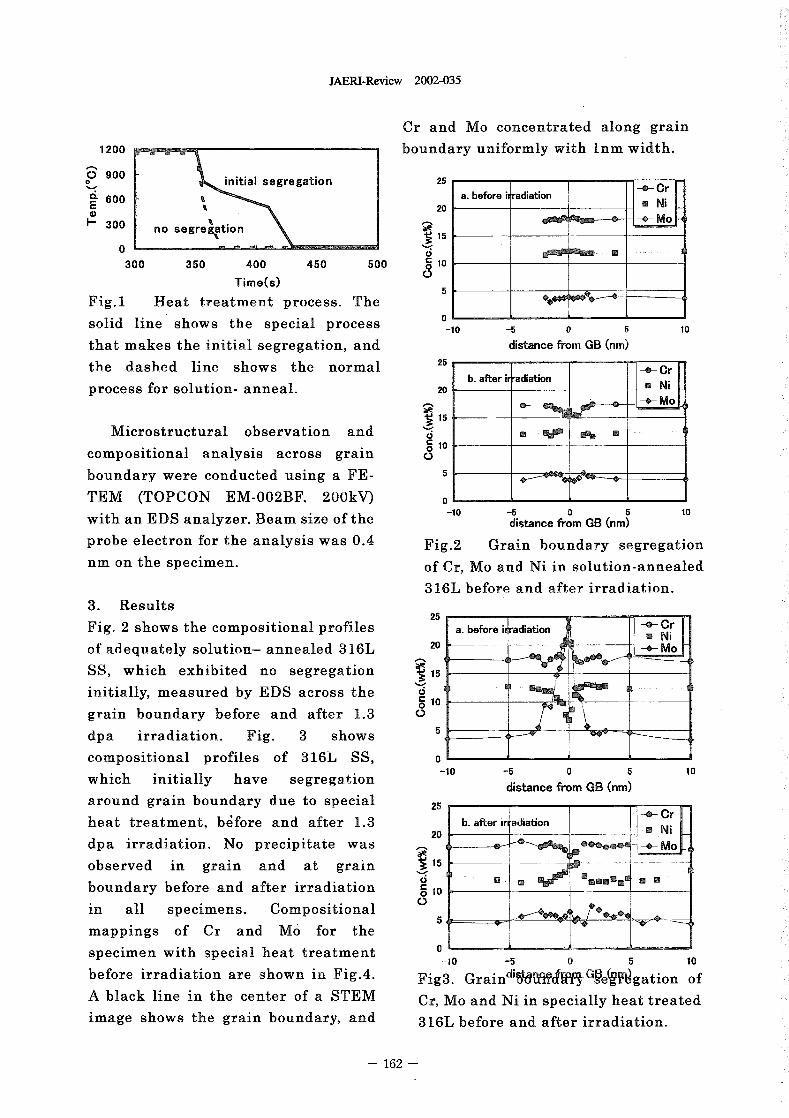
JAERI-Review 2002-035
Cr and Mo concentrated along grain
1200 boundary uniformly with Inm width.
0 9000 initial segregation 2511-� I --e- Cr0- 600 a. before ii radiation
20 Ni
300 MOno segre ation aiR9f 15
0300 350 400 450 500 lo
Time(s)
Fig. 1 Heat treatment process. The
solid line shows te special process 0-10 -5 0 5 10that makes the initial segregation, and distance from GB (nm)
the dashed line shows the normal 25 -a- rb. after irradiation
process for solution- anneal. 20
15IMicrostructural observation and a NWI
lo . ......0compositional analysis across grain 0
boundary were conducted using a FE- 5
TEM (TOPCON EM-002BF, 2kV) 0-10 -5 0 5 10
with an EDS analyzer. Beam size of the distance from GB (nm)
probe electron for the analysis was 04 Fig.2 Grain boundary segregation
nm on the specimen. of Cr, Mo and Ni in solution-annealed
316L before and after irradiation.
3. Results
Fig, 2 shows the compositional profiles 25 a. before irradi CrNi
of adequately solution- annealed 316L 20 MOSS, which exhibited no segregation 15
initially, measured by EDS across ther lo
grain boundary before and after 13 0
dpa irradiation. Fig. 3 shows 5
compositional profiles of 316L SS, 0
which initially have segregation -10 -5 a 5 10distance from GB (nm)
around grain boundary due to special 25 -e- Cr
heat treatment, b4fore and after 13 b. aft d'2G A
dpa irradiation. No precipitate was
observed in grain and at grain 15 . ... ... ...
boundary before and after irradiation 0 10
in all specimens. Compositional5,
mappings of Cr and Mo for the
specimen with special heat treatment 0-10 -5 0 5 10
before irradiation are shown in Fig.4. Fig3. Grain segregation of
A black line in the center of a STEM Cr, Mo and Ni in specially heat treated
image shows the grain boundary, and 316L before and after irradiation.
- 162 -
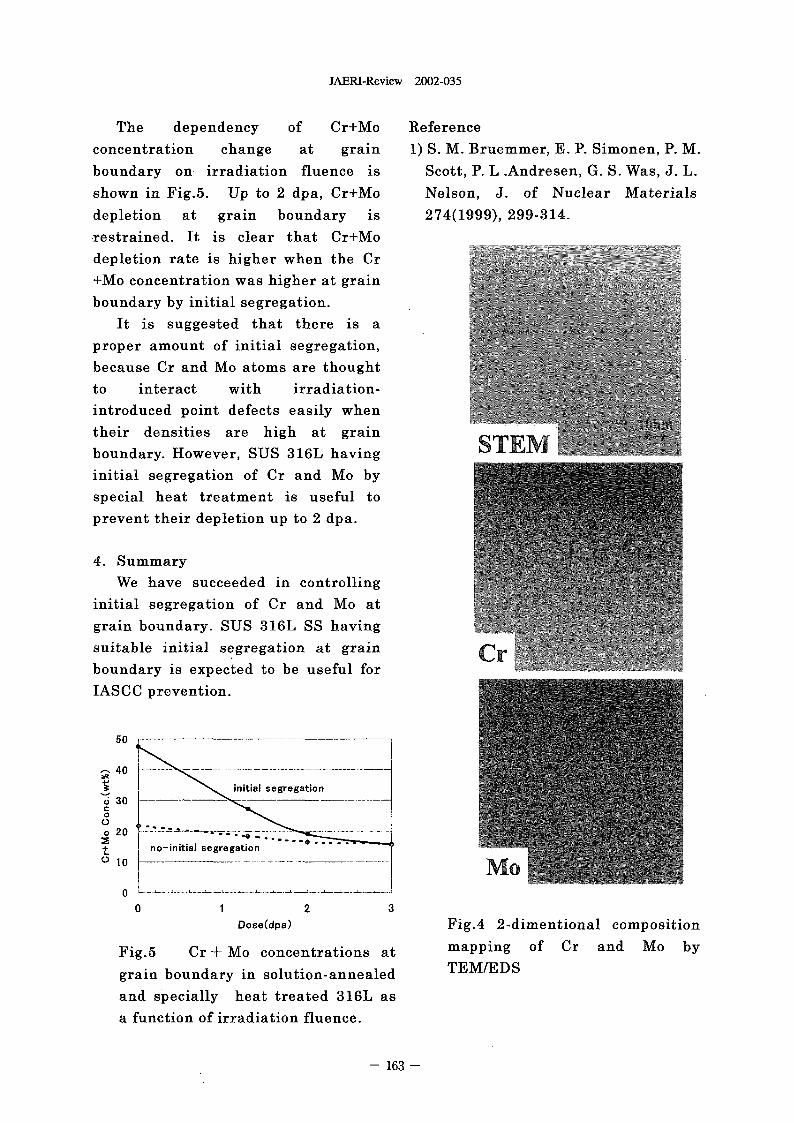
JAERI-Review 2002-035
The dependency of Cr+Mo Reference
concentration change at grain 1) S. M. Bruemmer, E. P. Simonen, P. M.
boundary on irradiation fluence is Scott, P. L Andresen, G. S. Was, J. L.
shown in Fig.5. Up to 2 dpa, Cr+Mo Nelson, J. of Nuclear Materials
depletion at grain boundary is 274(1999), 299-314.
restrained. It is clear that Cr+Mo
depletion rate is higher when the Cr
+Mo concentration was higher at grain
boundary by initial segregation.
It is suggested that there is a
proper amount of initial segregation,
because Cr and Mo atoms are thought
to interact with irradiation-
introduced point defects easily when
their densities are high at grain
boundary. However, SUS 316L having
initial segregation of Cr and Mo by
special heat treatment is useful to
prevent their depletion up to 2 dpa.
4. Summary
We have succeeded in controlling
initial segregation of Cr and Mo at
grain boundary. SUS 316L SS having
suitable initial segregation at grain
boundary is expected to be useful for
IASCC prevention.
50
- 40
initial segregation6 30C0
0 20t no-initial segre
lo
0 ----- -
0 2 3Dose(dpa) Fig.4 2-dimentional composition
Fig.5 Cr + Mo concentrations at mapping of Cr and Mo by
grain boundary in solution-annealed TEM/EDS
and specially heat treated 316L as
a function of irradiation fluence.
163 -
JAERI-Review 2002-035
4.13 Effect of an electric field on the formation process of dislocationloops in He+-irradiated cc-AI203
T. Higuchi*, K. Yasuda*, K. Shiiyama*, M. Kutsuwada*, K. Tanaka*,
C. Kinoshita*, H. Abe**
Department of Applied Quantum Physics and Nuclear Engineering,
Kyushu University*
Nuclear engineering research laboratory, The University of Tokyo**
1. Introduction measuring the electrical conductivity of single
cc-AI203 is one of the candidate aterials for crystals of a-A1203 a higher insulating ability (less
insulators and radiofi-equency windows in thari 10-9 S/m at 800 K with 300 Mm) was obtained
International Thermonuclear Experimental Reactor with the device.
(lTER), and will be exposed to irradiation with a
displacement damage rate of 10-"-10-'dpa/s under 2.2 Specimens and ion-irradiation
applied electric fields ranging from 10 to 1000 Mm. Specimens used in the present study were sngle
The kinetic behavior of radiation-induced defects crystals of c-AI203 (Bicron Ltd.). Thin oil electron
accompanied by the electric charge in ionic crystals transparencies of a-A1203, whose surfaces were
such as x-AI203 is influenced by applied electric parallel to the (I f20) plane, were prepared from
field. In spite of the importance of defect kinetics disk-shaped specimens with 3 mm in diameter and
under electric fields, no investigations on the kinetic 100 �tm in thickness by using dimpling and
behavior of radiation-induced defects have been ion-thinning techniques. He'-ion irradiation was
done. carried o at 760 K with an acceleration voltage of
hi order to understand the kinetics of 100 kV under the electric field of 100 kV/m atid a
radiation-induced defects under electric fields, we fluence of I x 1020 He+/rn�, which induces
have developed a device that enables one to perform displacement damage of 0.5 dpa at the penetration
irradiation at high temperatures with -applied electric depth of 50-200 mu. The post-irradiation
fields. The formation process of dislocation loops in microstructure was observed by a conventional TEM
cc-AI203 under an applied electric field of 100 Mm (JEM-2000EX) at 200 kV Weak-beam dark-field
is shown in the present report (WBDF) technique was used to observe small defect
clusters, typically 1-5 rm in size, by using g
(g=0002) at the 3g Bragg condition.
2. Experimental
2.1 Development of the device
The developed device consists of an alumina 3. Results and Discussion
insulating tube (5 mm in the outer diameter and 40 Fig.1 shows Vv'BDF images of a-A1203
mm in length), around which Pt wire (0. m in irradiated with 100 keV He+ ions at 760 K to a
diameter) is wrapped in a heater coil. The specimen damage level of around 0.5 dpa with and without the
was held inside the tube by using two pieces of inner electric field of I 0 Mm. These iages were taken
alumina insulating tubes. Electric contact was made around areas corresponding to 40, 130 and 230 mu
by using vapor deposited titanium on both edges of in thickness. The dot contasts whose size is 14 nm
the specimen surface. Pt ribbon (I nun in width and are considered to be interstitial-type dislocation loops,
0.05 nun in thickness) was used as an electric wire. based on the previous reports of electron and ion-
The perfonnance of the device was confinned by irradiated a-AI203'). It is seen from fig. I that the
- 164 -
JAERI-Review 2002-035
density of dislocation loops in specimens irradiated conclusion, the electric field increases the surfitce
with the electric field is low compared to that in the sink strength.
specimen imdiated without the electric feld. Fig,2
quarififies the area) density of dslocabo)) loops in
(x-AIQi as a function of specimm thickness, It 4. Summary
reveals that the electric field suppresses the density We bave developed a sample holder that enables
of dislocation loops to be about 1/1 ad 1/2 of tat one to erforly, W-io iadiation at mperatures
without the lectric, field at a thin region 40 nor) and from 300 to 800 K ith the rriaximum. applied
thicker regions (>200 rim), respectivelyz' It has been electric ield of 300 Wrri� The fonnation process of
also found that the electric field ehances the growth dislocation loops as been ivestigated in a-AI203
of loops. The average size of dislocation loops with with the applied electric field Of 100 W/m. '�he
the electric field is I I I A times as large as that density and tliesize of dislocabor) loops in irradiatt-I
,without th eectric field, Fig.3 shows the i-atio of he (X-A12Q� are found to decrease and increase
uum6er of niterstitials included in dislocation loops respectively ai te number ofinterstitials contained
in e spox-ime iradiated with the eectric field to in dislocation loops decreases with the electric field.
that without the ectric field, of The value offis These results lead to a onclusion that the electric
seen to be around 0 I at in regions (50 mail) wid field icreases the strength of surface sinks.
reaches I wound 250 after the Monotonic
increase, idicating the nuinber of interstitials References
contained in dislocation loops to be small in the [1] S.J. Zinkle and GP. Pells, J. Nucl. Mater. 253
specimen irradiated with the electric field, especially (1998) 120-132.
within areas thinner than 250 nm. Most of [2] IC Yasuda, T. Higuchi, K. Shiiyama C.
interstitials at thinner regions are, therefore, Kinoshita, K Tanaka and M. Kutsuwada,
considered to disappear at sur-face sffiks- In submitted to Philos. Mag. Lett.
- 165 -
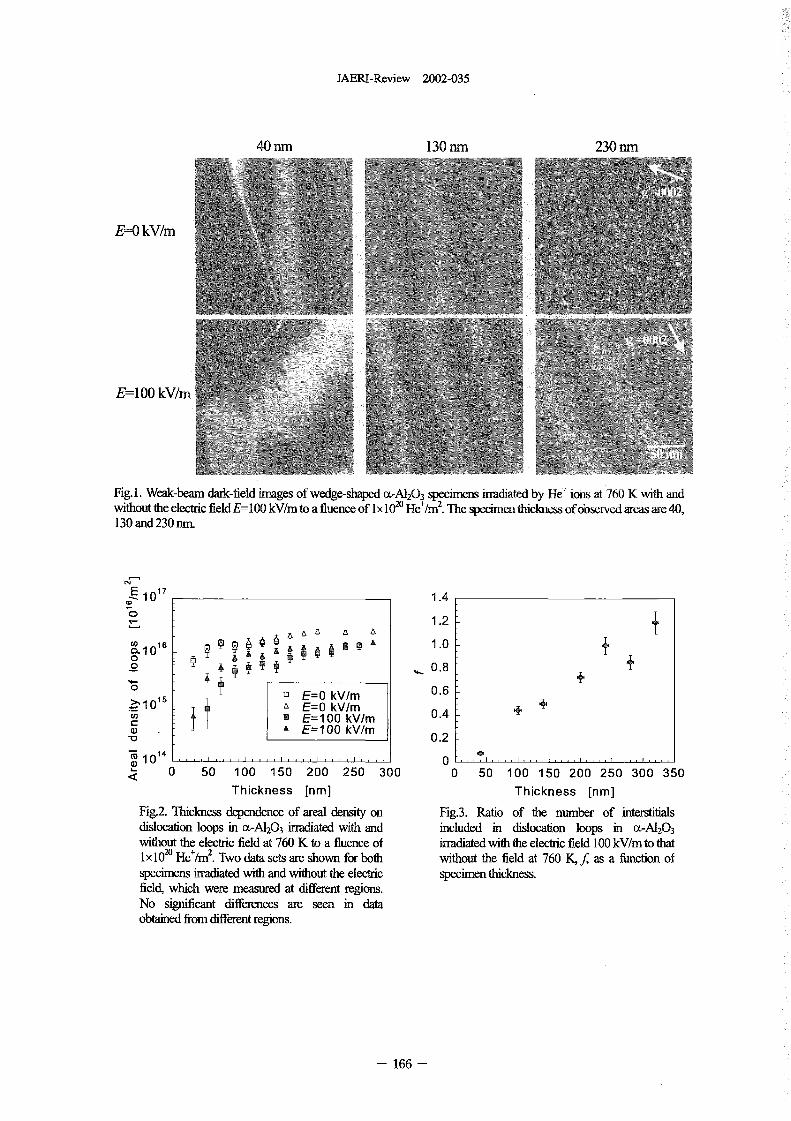
JAERI-Review 2002-035
40 mn 130 run 230 mn
E=O Mm
,Q
E=100 Mm
Fig. I Weak-bearn dark-field images of wedge-shaped a-AI203 specimens iadiated by He' ions at 760 with andwithout the electric field E=l 00 Mm to a fluence of I x 1020 He+/m2. The specimen hickness ofobsefved areas ae 40,130 and 230 nrn.
OF,E 1 0 7 1.4
C) 1.2
6 1.0CL 000 0.8
0 15 E=O kV 0.6Z 1 0 E= kVZ E=100 0.4 +C /M
E=100 /M 0.2-FU 10 14 I I . . I I. . .. I I
00 50 100 150 200 250 300 0 50 100 150 200 250 300 350
Thickness [nm] Thickness [nm]
Fig.2. Thickness dependence of areal density on Fig.3. Ratio of the nurnber of interstitialsdislocation loops in c-AI203 irradiated with and included n islocation loops in oAI203without the electric field at 760 K to a fluence of uradiated with the eectric field 100 Mm to that1XIO 20 He+/rr�. Two data sets are shown for both without the field at 760 K, f, as a function ofspecimens irradiated with and without the electric specimen thickness.field, which were measured at different regions.No significant differences are seen in dataobtained from different regions.
- 166 -
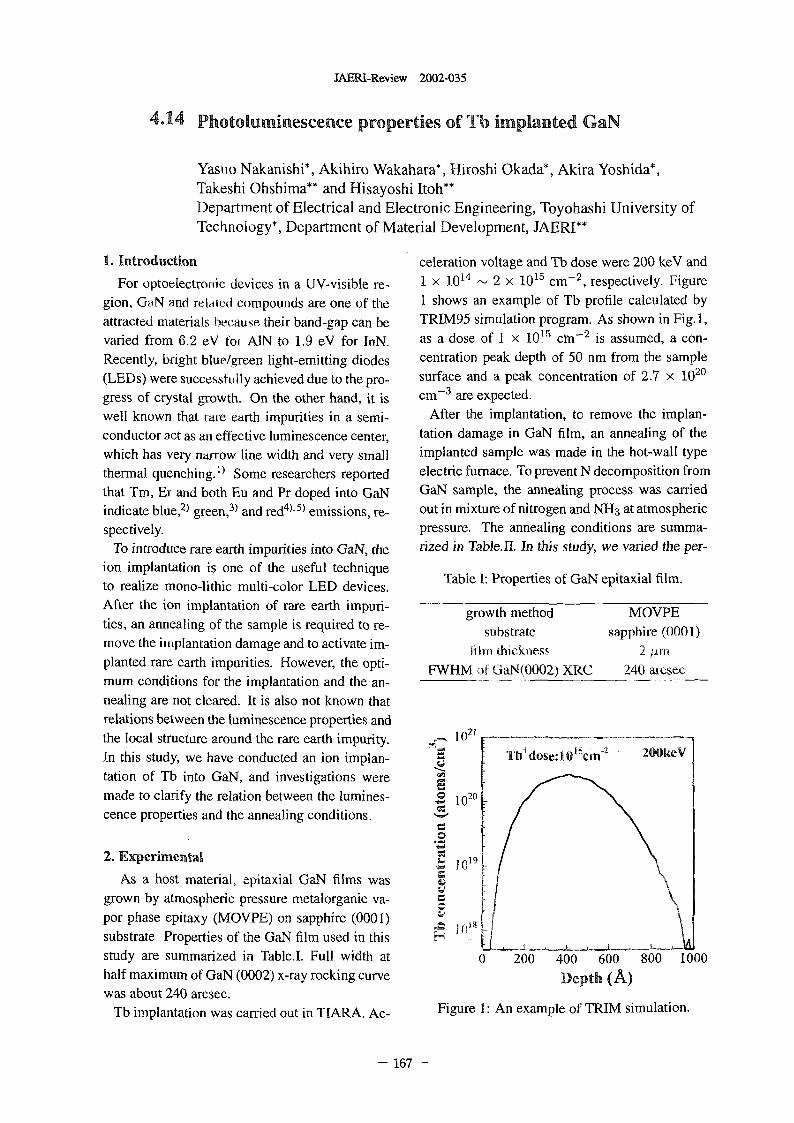
JAERI-Review 2002-035
4.14 Photolumineseence properties of Tb implanted GaN
Yasuo Nakanishi*, Ak1hiro, Wakahara*, Hiroshi Okada*, Akira Yoshida%Takeshi Ohshima** and Hisayoshi Itoh**Department of Electrical and Electronic Engineering, Toyohashi University ofTechnoiogy*, Department of Material Development, JAERI**
1. Introduction celeration voltage and Tb dose were 200 keV andFor optoelectronic devices in a UV-visible re- I X 1 4 - 2 x 10" cm-', respectively. Figure
gion, GaN and Teiated compounds are one of the I shows an example of Tb profile calculated byattracted materials ecause their band-gap can be TRIM95 simulation program. As shown in Fig. 1,varied from 62 eV for AIN to 19 eV for nN. as a dose of I x 101,5 cn - 2 is assumed, a con-Recently, bright bue/�green light-emitting diodes centration peak depth of 50 nm from the sample(LEDs) were successfully achieved due to the pro- surface and a peak concentration of 27 x 1020
gress of crystal growth. On the other hand, it is cm- 3 are expected.well known that rare earth impurities in a semi- After the implantation, to remove the implan-conductor act as a effective luminescence center, tation damage in GaN film, an annealing of thewhich has very narrow line width and very small implanted sample was made in the hot-wall typethermal quenching. 1) Some researchers reported electric furnace. To prevent N decomposition fromthat Tm, Er ad both Eu and Pr doped into GaN GaN sample, the annealing process was carriedindicate blue,2) green, 3 )and red4),5) emissions, re- out in mixture of nitrogen and NH3 at atmosphericspectively. pressure. The annealing conditions are summa-
To introduce rare earth impurities into GaN, the zized in TabJe.11. In this study, we varied the pr-
ion implantation is one of the useful technique Table 1: Properties of GaN epitaxial film.to realize monolithic multi-color LED devices.
After the ion implantation of rare earth impuri- growth method MOVPEties, an annealing of the sample is required to re- substrate sapphire, 0001)move the iplantation damage and to activate im- fib)) hickness 2 gainplanted rare earth impurities. However, the opti- FWHM of Ga.N(0002) XRC 240 afesecmum conditions for the implantation and the an-nealing are not cleared. It is also not known thatrelations between the luminescence properties and
to??the local structure around the rare earth impurity.In this study, we have conducted an ion implan- Tb dose:1015cm-z 200keVtation of Tb into GaN, and investigations weremade to clarify the relation between the lumines- 1020
cence properties and the annealing conditions.
2. Experimental 6 1019
As a host material, epitaxial GaN films wasgrown by atmospheric pressure metalorganic va-
�61por phase epitaxy (MOVPE) on sapphire (0001) Joigsubstrate- Properties of the GaN film used in thisstudy are summarized in Table.l. Full width at 0 200 400 600 800 1000half maximum of GaN 0002) x-ray rocking curve Depth (A)was about 240 arcsec.
Tb implantation was carried out in TARA. Ac- Figure 1: An example of TRIM simulation.
- 167 -
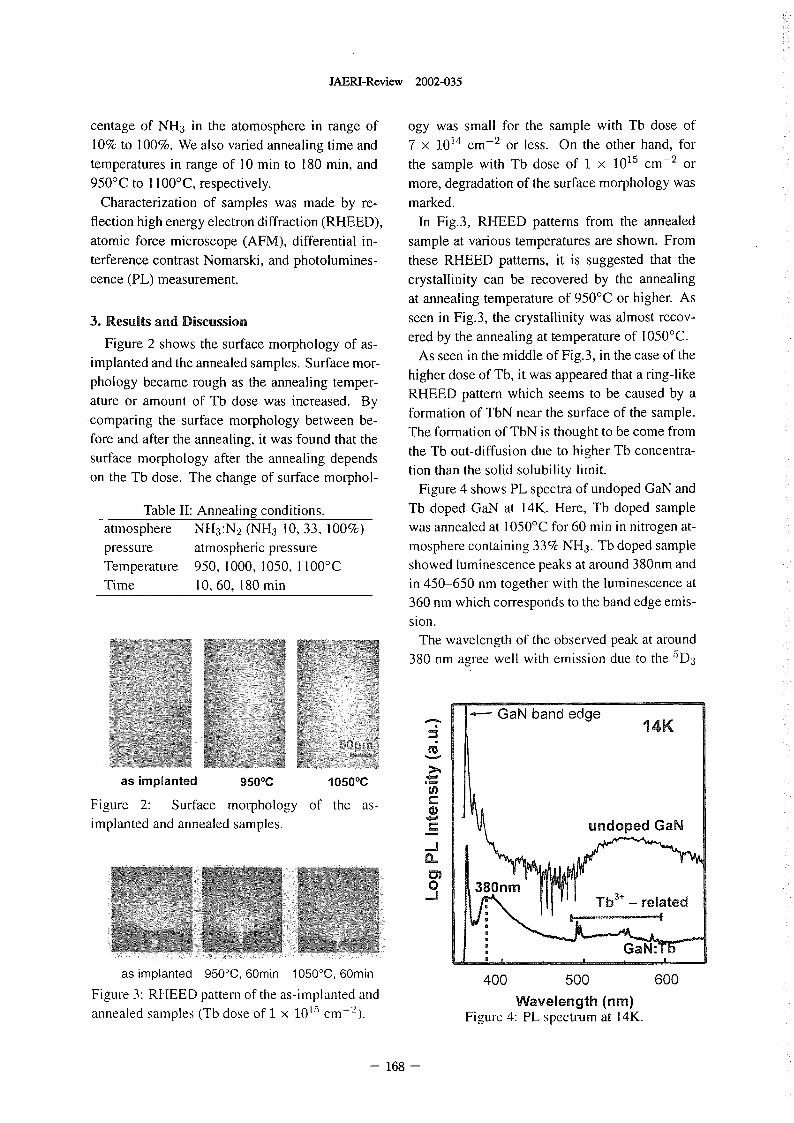
JAERI-Review 2002-035
centage of NH3 in the atomosphere in range of ogy was small for the sample with Tb dose of
IO% to I 0%. We also varied annealing time and 7 x 10¹⁴ CM-2 or less. On the other hand, for
temperatures in range of 10 min to 180 min, and the sample with Tb dose of I X 1015 CM-2 or
950'C to II O'C, respectively. more, degradation of the surface morphology was
Characterization of samples was made by re- marked.
flection high energy electron diffraction (RHEED), In Fig.3, RHEED patterns from the annealed
atomic force microscope (AFM), differential in- sample at various temperatures are shown. From
terference contrast Nomarski, and photolumines- these RHEED patterns, it is suggested that the
cence (PL) measurement. crystallinity can be recovered by the annealing
at annealing temperature of 950'C or higher. As
3. Results and Discussion seen in Fig.3, the crystallinity was almost recov-
Figure 2 shows the surface morphology of as- ered by the annealing at temperature of 1050'C.
implanted and the annealed samples. Surface mor- As seen in the middle of Fig.3, in the case of the
phology became rough as the annealing temper- higher dose of Tb, it was appeared that a ring-like
ature or amount of Tb dose was increased. By RHEED pattern which seems to be caused by a
comparing the surface morphology between be- formation of TbN near the surface of the sample.
fore and after the annealing, it was found that the The formation of TbN is thought to be come from
surface morphology after the annealing depends the Tb out-diffusion due to higher Tb concentra-t, tion than the solid solubility limit.
on the Tb dose. The change of surface morphol- Figure 4 shows PL spectra of undoped GaN and
Table II: Annealing conditions. Tb doped GaN at 14K. Here, Tb doped sample
atmosphere NH3:N2 (NH3 0, 33, 1 00%) was annealed at 1050'C for 60 min in nitrogen at-
pressure atmospheric pressure mosphere containing 33% NH3. Tb doped sample
Temperature 950,1000,1050,1100'C showed luminescence peaks at around 380nm and
Time 10, 60, 180 min in 450-650 nm together with the luminescence at
360 nm which corresponds to the band edge emis-
sion.
The wavelength of the observed peak at around
380 nm auree well with emission de to the 5D3
GaN band edge14K
as implanted 9500C 10500C
Figure 2 Surface morphology of the as-
implanted and annealed samples. C undoped GaN
_j
0 38 nm_j b3 related
as implanted 950'C, 60min 1050'C, 60min 400 500 600
Figure 3 RHEED pattern of the as-implanted ad Wavelength (nm)
annealed samples (Tb dose of I x 1015 CM-2). FiGur 4 PL spectrum at 14K.
- 168 -
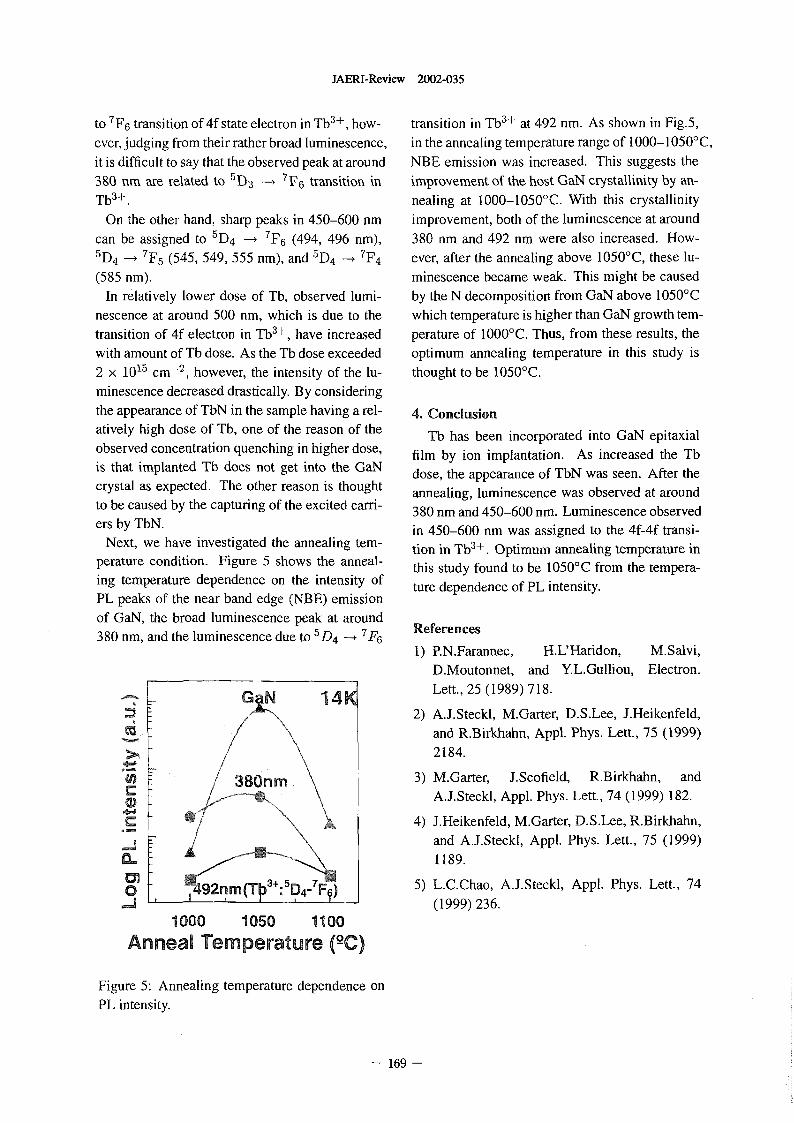
JAERI-Review 2002-035
to 7F6 transition of 4f state electron in Tb3+, how- transition in Tb3+ at 492 nm. As shown in Fig.5,ever, judging from their rather broad luminescence, in the annealing temperature range of 1000-1050'C,it is difficult to say that the observed peak at around NBE emission was increased. This suggests the390 nm a related to 5D3 --- 7F6 transition in improvement of the, host GaN crystaffirMy by an-Tb3+. nealing at 1000-1050'C. With this crystallinity
On the othei- hand, sharp peaks in 450-600 nm improvement, both of the luminescence at aroundcan be assigned to 5D4 T6 494, 496 nm), 380 nm and 492 nm were also increased. How-5D4 , 7F5 545, 549, 555 nm), and 5D4 __+ 7F4 ever, after the annealing above 1050'C, these lu-(585 nm). minescence became weak. This might be caused
In relatively lower dose of Tb, observed lumi- by the N decomposition from GaN above 1050'Cnescence at around 500 nm, which is due to the which temperature is higher than GaN growth tem-
3+transition of 4f electron in Tb , have increased perature of 1000'C. Thus, from these results, thewith amount of Tb dose. As the Tb dose exceeded optimum annealing temperature in this study is2 x 1015 CM-2, however, the intensity of the lu- thought to be 1050'C.minescence decreased drastically. By consideringthe appearance of TbN in the sample having a rel- 4. Conclusion
atively high dose of Tb, one of the reason of the Tb has been incorporated into GaN epitaxialobserved concentration quenching in higher dose, film by ion implantation. As increased the Tbis that implanted Tb does not get into the GaN dose, the appearance of TbN was seen. After thecrystal as expected, The other reason is thought annealing, luminescence was observed at aroundto be caused by the capturing of the excited carri- 380 nm and 450-600 n. Luminescence observeders by TbN. in 450-600 nm was assigned to the 4f-4f transi-
Next, we have investigated the annealing tem- 3+ n annealing temperature intion in Tb . Optimuiperature condition. Figure shows the anneal- this study found to be 1050'C from the tempera-ing temperature dependence on the intensity of ture dependence of PL intensity.PL peaks of the near band edge (NBE) emission
of GaN, the broad luminescence peak at around References380 nm, and the luminescence due to 5D4 ` 7 F6
1) P.N.Farannec, H.L:Haridon, M.Salvi,D.Moutormet, and YL.Gulliou, Electron.
1 N 14K Lett., 25 1989) 718.2) A.J.Steckl, M.Garter, D.S.Lee, J.Heikenfeld,
and R.Birkhahn, Appl. Phys. Lett., 75 1999)
>R 2184.
3) M.Garter, J.Scofield, RBirkhahn, and380nm A.J.Steckl, Appl. Phys. ett., 74 1999) 182.
4) J.Heikenfeld, M.Garter, D.S.Lee, R.Birkhahn,and A.J.Steckl, Appl. Phys. Lett., 75 1999)1189.
5) L.C.Chao, A.J.Stecki, Appl. Phys. Lett., 740 T� D4- F I_J (1999) 236.
1000 1050 1100
Anneal Temperature (2C)
Figure 5: Annealing temperature dependence onPL intensity
169 -
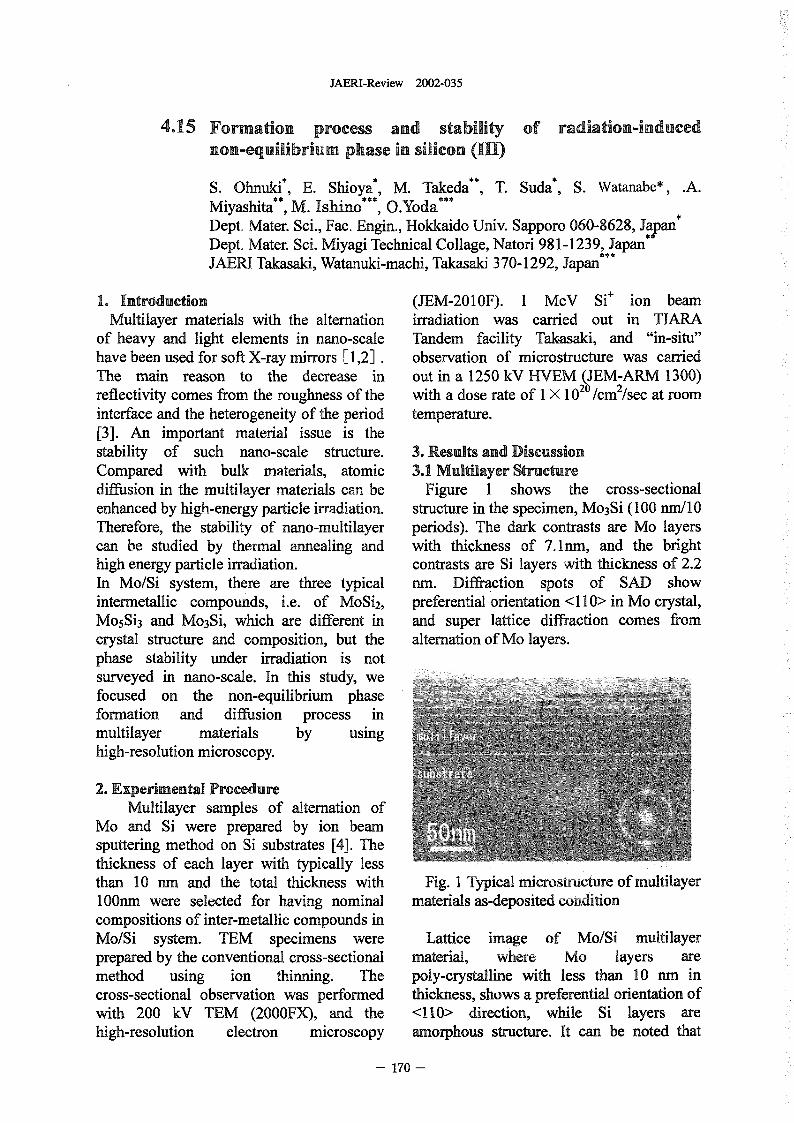
JAERI-Review 2002-035
4.15 Formation process and stability of radiation-inducednon-equilibrium phase in silicon (111)
S. Ohnuki*, E. Shioya*, M. Takeda**, T. Suda*, S. Watanabe*, A.Miyashita", M. Ishino***, .Yoda***Dept. Mater. Sci., Fac. Engin., Hokkaido Univ. Sapporo 060-8628, JyanDept. Mater. Sci. Miyagi Technical Collage, Natori 981-1239, JapanJAERI Takasaki, Watanuki-machi, Takasaki 370-1292, Japan***
1. Introduction (JEM-2010F) I MeV Si+ ion beamMultilayer materials with the alternation irradiation was carried out in TIARA
of heavy and light elements in nano-scale Tandem facility Takasaki, and "in-situ"havebeenusedforsoftX-raymiffors 1,2 . observation of microstructure was carriedThe main reason to the decrease in out in a 1250 kV HVEM (JEM-ARM 1300)reflectivity comes from the roughness of the with a dose rate of I X 1020 /cm2/sec at roominterface and the heterogeneity of the period temperature.[3]. An important material issue is thestability of such nano-scale structure. 3. Results and DiscussionCompared with bulk materials, atomic 3.1 Multilayer Structurediffusion in the multilayer materials can be Figure I shows the cross-sectionalenhanced by high-energy particle irradiation. structure in the specimen, M03Si 100 /10Therefore, the stability of nano-multilayer periods). The dark contrasts are M layerscan be studied by thermal annealing and with thickness of 7.1nin, and the brighthigh energy particle irradiation. contrasts are Si layers with thickness of 22In Mo/Si system, there are three typical nin. Diffraction spots of SAD showintermetallic compounds, i.e. Of MSi2, preferential orientation < 0> in MO crystal,MO5Si3 and MO3Si, which are different in and super lattice diffraction comes fromcrystal structure and composition, but the alternation of MO layers.phase stability under irradiation is notsurveyed in nano-scale. In this study, wefocused on the non-equilibrium phaseformation and diffusion process inmultilayer materials by usinghigh-resolution microscopy.
2. Experimental ProcedureMultilayer samples of alternation of
MO and Si were prepared by ion beamsputtering method on Si substrates 4 Thethickness of each layer with typically lessthan I nin and the total thickness with Fig. I Typical microstructure of multilayer100nin were selected for having nominal materials as-deposited conditioncompositions of inter-metallic compounds inMo/Si system. TEM specimens were Lattice image of Mo/Si multilayerprepared by the conventional cross-sectional material, where MO layers aremethod using ion thinning. The poly-crystalline with less than I nm incross-sectional observation was performed thickness, shows a preferential orientation ofwith 200 kV TEM. 2000FX), and the <110> direction, while Si layers arehigh-resolution electron microscopy amorphous structure. It can be noted that
- 170 -
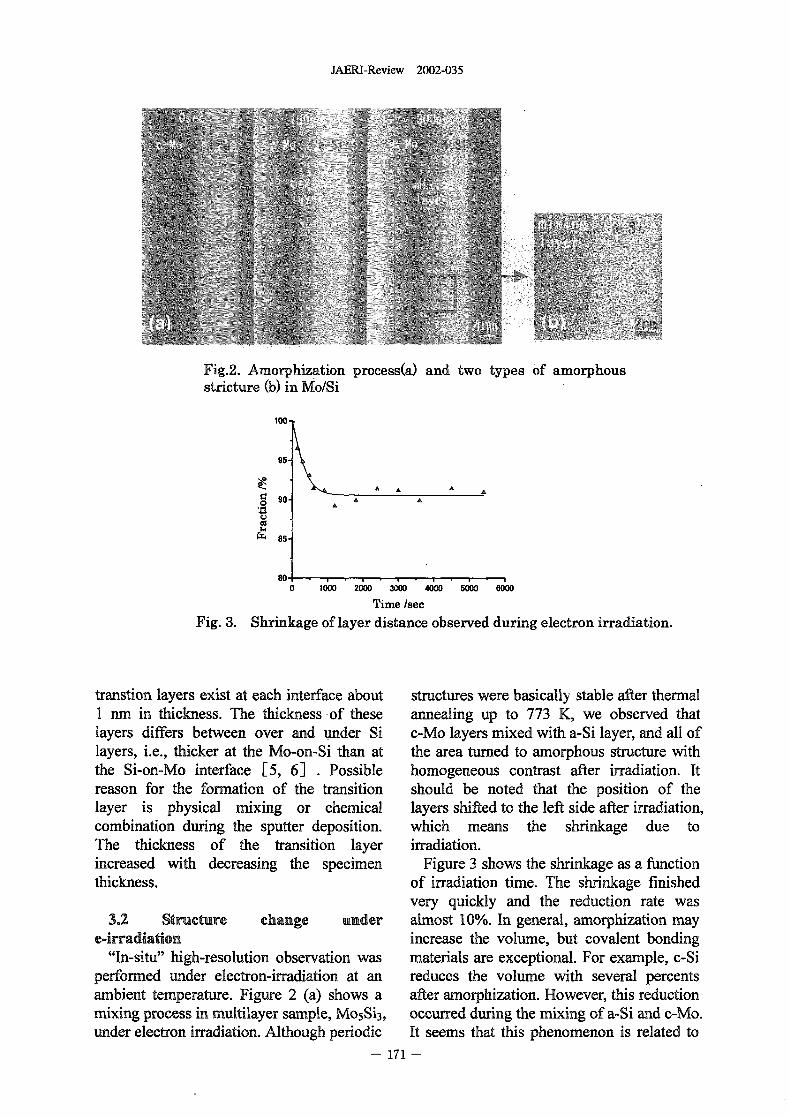
JAERI-Review 2002-035
Fig .2. Amorphization process(a) and two types of amorphousstricture (b) in Mo/Si
95-
0 go-
4�
Cd
85-
800 1000 20DO 3000 46W 5600 60'00
Time /sec
Fig. 3 Shrinkage of layer distance observed during electron irradiation.
transtion layers exist at each interface about structures were basically stable after thermalI m in thickness. The thickness -of these annealing up to 773 K, we observed thatlayers differs between over and under Si c-Mo layers mixed with a-Si layer, and all oflayers, i.e., thicker at the Mo-on-Si than at the area turned to aorphous structure withthe Si-on-Mo interface [5, 61 Possible homogeneous contrast after irradiation. Itreason for the formation of the transition should be noted that the position of thelayer is physical mixing or chemical layers shifted to the left side after irradiation,combination during the sputter deposition. which means the shrinkage due toThe thickness of the transition layer irradiation.increased with decreasing the specimen Figure 3 shows the shrinkage as a ftmctionthickness. of irradiation time. The shrinkage finished
very quickly and the reduction rate was3.2 Structure change under almost 10%. In general, amorphization may
e-irradiation increase the volume, but covalent bonding"In-situ" high-resolution observation was materials are exceptional. For example, c-Si
performed under electron-irradiation at an reduces the volume with several percentsambient temperature. Figure 2 (a) shows a after arnorphization. However, this reductionmixing process in multilayer sample, M05Si3, occurred during the mixing of a-Si and c-Mo.under electron irradiation. Although periodic It seems that this phenomenon is related to
171 -
JAERI-Review 2002-035
the mixing process between the larger size 2. Electron-irradiation enhanced theatom and the smaller size atom, In T/TiC extension of the transition layer, which ismultilayer, the value of the inter-diffusion an amorphous structure with darkcoefficient is higher by many orders of contrast.magnitude than that expected from 3. Extreme shrinkage of 10 % wasextrapolation of bigh temperature bulk data observed during irradiation, which
[7 . means that this process makes anFigure 2b) shows high-resolution image amorphous phase with high density of an
from Fig. 2(a). Two types of amorphous ideal glass structure.layers were observable; with dark contrastand with bright contrast. The mean distance REFERENCESof dots in the dark area looks smaller thanthat in the bright area, which means that the [11 D.M Solina et al.: Thin Solid Film,atomic density in the mixed layer should be 372 2000) 94 103.high comparing with that in bright area of [21 A. M. Baranov: Opticsamorphous Si. Those phenomena under Communications, 167 1999) 23 26.irradiation could be related to the atomic [31 H. Takenaka, T. Kawamura: Journal ofbehavior in the system composed of heavy Electron Spectroscopy and Relatedand light elements. Phenomena, 80 1996) 381-384.
[41 A. Ulyanenkov et al.: Journal of4. Conclusion Applied Physics, 87 2000) 7255-7260.
E 51 T. Morihashi et al.: Applied SurfaceMicrostructure and amorphization of Science, 100/101 1996) 84 -88.
Mo/Si multilayers in nano-scale .were [61 B. Heidemann et al.: Applied Surfaceinvestigated by cross-sectional TEM and Science, 78 1994) 133-140.in-situ observation under [ 71 1. Dahan et al.: Thin Solid Film,electron-irradiation. 377-378 2000) 687 693.1. The multilayer structure was composed
of c-Mo and a-Si in several anometerlevels. The transition layer of amorphousstructure exists at each interface inas-deposited sample.
172 -
JAERI-Review 2002-035
4.16 Effect of Cr-lon Implantation in TiO2:
Realization of mpurity Concentration Gradients
T. Yamaki, T. Surnita, S. Yamamoto, A. Miyashita and H. ItohDepartment of Material Development, JAERI
1. Introduction because of its large bandgap energy > 30 eV).Titanium dioxide (TiO2) has many attractive The effective utilization of visible light, therefore,
characteristics related to various technological is one of the iportant subjects for the increasedapplications. The illumination of TiO 2with light applicability of TiO 2' To this end, transition-metalof suitable eergy, naniely higher than its bandgap doping has been widely performed by manyenergy, gives rise to promotion of electrons from research groups. Wittmer et al .2) reported that Crthe valence to the conduction band, leaving doping in powdered anatase TiO. reduced itspositive holes in the valence band. TiO2 is a typical bandgap, depending on the dopant concentration.n-type semiconductor especially when prepared Among various doping techniques, ionin a reducing environment. This certainly raises implantation enables one to introduce dopants inthe Fermi evel, leading to formation of a space a controlled manner at specific depths. Thus, it ischarge region, i.e., depletion layers in TiO 2' The expected that the depth profile of Cr concentrationsresulting upward band bending of TiO 2 reduces realized by this technique can modify the bandelectron-hole recombinations at the surface, structure of TiO. in the direction perpendicular tothereby enhancing photochemical quantum yields. the surface.The efficiency of this so-called charge carrier In the present study, the ion implantation andseparation is the major determinant in the overall subsequent thermal treatment were performed tophotoinduced processes of TiO 2 and so such prepare Cr-doped TiO 25 in which impuritytransient behavior is the most fundamental concentrations increased from the bulk to theproblem to be solved. We previously presented a surface. The PITCS measurements were thennew method to investigate carrier dynamics in the applied for the first time to examine the spacesurface layer of semiconductors using a pulsed charge layer modified by the impurity doping. Inlaser as an excitation source without metal contacts the Cr-doped layer with visible-lightand an applied bias'). In this method, referred to photoresponses, the separation of the electron-holeas the photoinduced transient charge separation pairs was activated possibly by the resulting(PITCS) measurement, the behavior of the concentration gradient.transient electron-hole pairs is followed by takingtime-resolved curves of their discharges. We can 2. Experimental Sectionestimate te nmber of the carged carriers which TiO 2films were deposited by pulsed laserare photogenerated and then reach the surface, as deposition (PLD o a 0001) a-Al 20 3 substrate.a function of the irradiated photon energy. The details regarding preparation procedures andConsequently, the PITCS signal is considered to instruments were recently reported 3). Frombe a direct probe of charge carrier separation structural analyses by X-ray diffraction, it wasdynamics. found that tis film was epitaxially grown in the
TiO 2in itself makes use of only about % of (100) rutile phase. Ion implantations in the filmsthe solar beams to induce photochemical reactions were carried out at room temperature with 1 50 keV
- 173 -
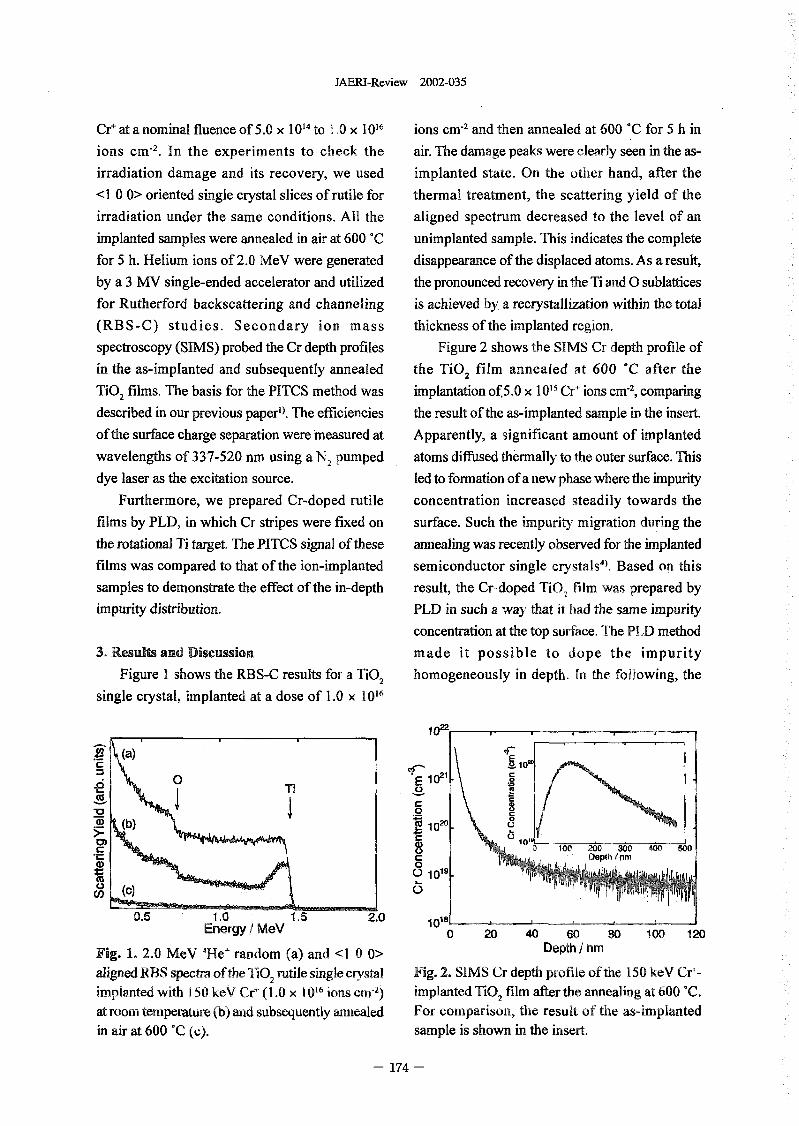
JAERI-Review 2002-035
Ci` at a nominal fluence of 5.0 x 10¹⁴ to I X 1016 ions CM-2 and then annealed at 600 C for h in
ions CM-2. In the experiments to check te air. The damage peaks were clearly seen in the as-
irradiation damage and its recovery, we used implanted state. On the other hand, after the
<1 O> oriented single crystal slices of rutile for thermal treatment, the scattering yield of the
irradiation under the same conditions. All the aligned spectrum decreased to the level of an
implanted samples were annealed in air at 600 C unimplanted sample. This indicates the complete
for h. Helium ions of 2.0 MeV were generated disappearance of the displaced atoms. As a result,
by a 3 MV single-ended accelerator and utilized the pronounced recovery in the Ti and 0 sublattices
for Rutherford backscattering and channeling is achieved by a recrystallization within the total
(RBS-C) studies. Secondary ion mass thickness of the implanted region.
spectroscopy (SIMS) probed the Cr depth profiles Figure 2 shows the SIMS Cr depth profile of
in the as-implanted and subsequently annealed the TiO 2 film annealed at 600 C after the
TiO2 films. Te basis for the PITCS method was implantation of.5.0 x IO' I Cr` ions m-2, comparing
described in our previous paper'). The efficiencies the result of the as-implanted sample in the insert.
of the surface charge separation wereineasured at Apparently, a significant amount of implanted
wavelengths of 337-520 nm using a N 2 pumped atoms diffused thermally to the outer surface. This
dye laser as the excitation source. led to formation of a new phase where the ipurity
Furthermore, we prepared Cr-doped rutile concentration increased steadily towards the
films by PD, in which Cr stripes were fixed on surface. Such the impurity migration during the
the rotationa T target. The PITCS signal of these annealing was recently observed for the implanted
films was compared to that of the ion-implanted semiconductor single crystals'). Based on this
samples to demonstrate the effect of the in-depth result, the Cr-doped TiO 2 film was prepared by
impurity distribution. PLD in such a way that it ad te same impurity
concentration at the top surface. The PLD method
3. Results and Discussion made it possible to dope the impurity
Figure I shows the RBS-C results for a TiO 2 homogeneously in depth, In the following, the
single crystal, implanted at a dose of 1.0 x 10¹⁶
(a)-a 1021
C0 E 102'Tj r
C.0 0
1020 C
0) loW100 200 300 400 500
C Dept6 I nM0
1019
CD (C)
0.5 1'0 1.5 2.0 1018Energy MeV 0 20 40 60 80 100 120
Fig. 1 20 MeV 4He' random (a) and <1 O> Depth I nm
aligned RBS spectra of the TiO 2 rutile single crystal Fig. 2 SIMS Cr depth profile of the 150 keV Cr'-implanted with 150 keV C- (1.0 x 016 ions C,-R-2) implanted TiO 1, film after the annealing at 600 'C.at room temperature (b) and subsequently annealed For comparison, the result of the as-implantedin air at 600 'C (c). sample is shown in the insert.
- 174 -
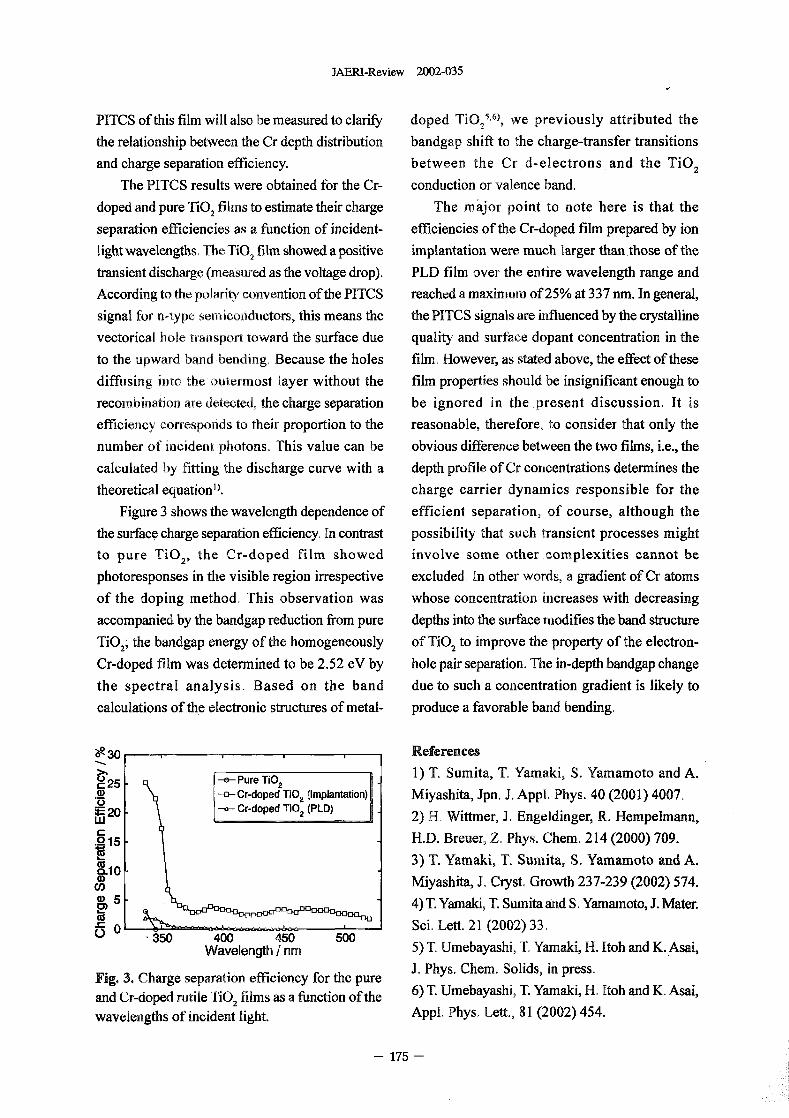
JAERI-Review 2002-035
1,6)PITCS of this film will also be measured to clarify doped TiO2 , we previously attributed the
the relationship between the Cr depth distribution bandgap shift to the charge-transfer transitions
and charge separation efficiency. between the Cr d-electrons and the TiO 2
The PITCS results were obtained for the Cr- conduction or valence band.
doped and pure TiO 2films to estimate their charge The mor point to note here is that the
separation efficiencies as a function of incident- efficiencies of the Cr-doped film prepared by ion
light wavelengths. The TiO 2film showed a positive implantation were much larger than those of the
transient discharge (measured as the voltage drop). PLD film over te entire wavelength range and
According to the polarity convention of the PITCS reached a maximurn of 25% at 337 nin. In general,
signal for n-type emiconductors, this means the the PITCS signals are influenced by the crystalline
vectorical hole transport toward the surface due quality and surface dopant concentration in the
to the upward band beirding, Because the holes film. However, as stated above, the effect of these
diffusing ito the outermost layer without the film properties should be insignificant enough to
recombination are detected, the charge separation be ignored in the present discussion. It is
efficiency corresponds to their proportion to the reasonable, therefore, to consider that only the
number of incident photons, This value can be obvious difference between the two films, i.e., the
calculated by fitting the discharge curve with a depth profile of Cr concentrations determines the
theoretical equation'). charge carrier dynamics responsible for the
Figure 3 shows the wavelength dependence of efficient separation, of course, although the
the surface charge separation efficiency. In contrast possibility that such transient processes might
to pure TiO V the Cr-doped film showed involve some other omplexities cannot be
photoresponses in te visible region iespective excluded. In other words, a gradient of Cr atoms
of the doping method. This observation was whose concentration icreases with decreasing
accompanied by the bandgap reduction from pure depths into the surface modifies the band structure
TiO,; the bandgap energy of the homogeneously of TiO 2 to improve the property of the electron-
Cr-doped film was determined to be 252 eV by hole pair separation. The in-depthbandgap change
the spectral analysis. Based on the band due to such a concentration gradient is likely to
calculations of the electronic structures of metal- produce a favorable band bending.
30 References1) T. Sumita, T. Yamaki, S. Yamamoto and A.
C25 Pure TO2A -Cr-doped TiO. (implantation) Miyashita, Jpn. J. Appl. Phys. 40 2001) 4007.0 - Cr-doped TO 2(PLD)M20. 2) H. Wittmer, J. Engeldinger, R. Hempelmann,C.0-15 H.D. Breuer, Z. Phys. Chem. 214 2000) 709.
3) T. Yamaki, T. Surnita, S. Yamamoto and A.M10 -0 Mi ashita, J. Cryst. Growth 237-239 2002) 574.co y0) - 4) T. Yamaki, T. Sumita and S. Yamamoto, J. Mater.2)
0 350 Sci, Lett. 21 2002) 33.5) T. Umebayashi, T. Yamaki, H. Itoh and K..Asai,
Fig. 3 Charge separation efficiency for the pure J. Phys. Chem. Solids, in press.and Ct-doped rutile TiO 2films as a function of the 6) T. Umebayashi, T. Yamaki, H. toh and K. Asai,
wavelengths of incident light. Appl. Phys. Lett., 81 2002) 454.
- 175 -
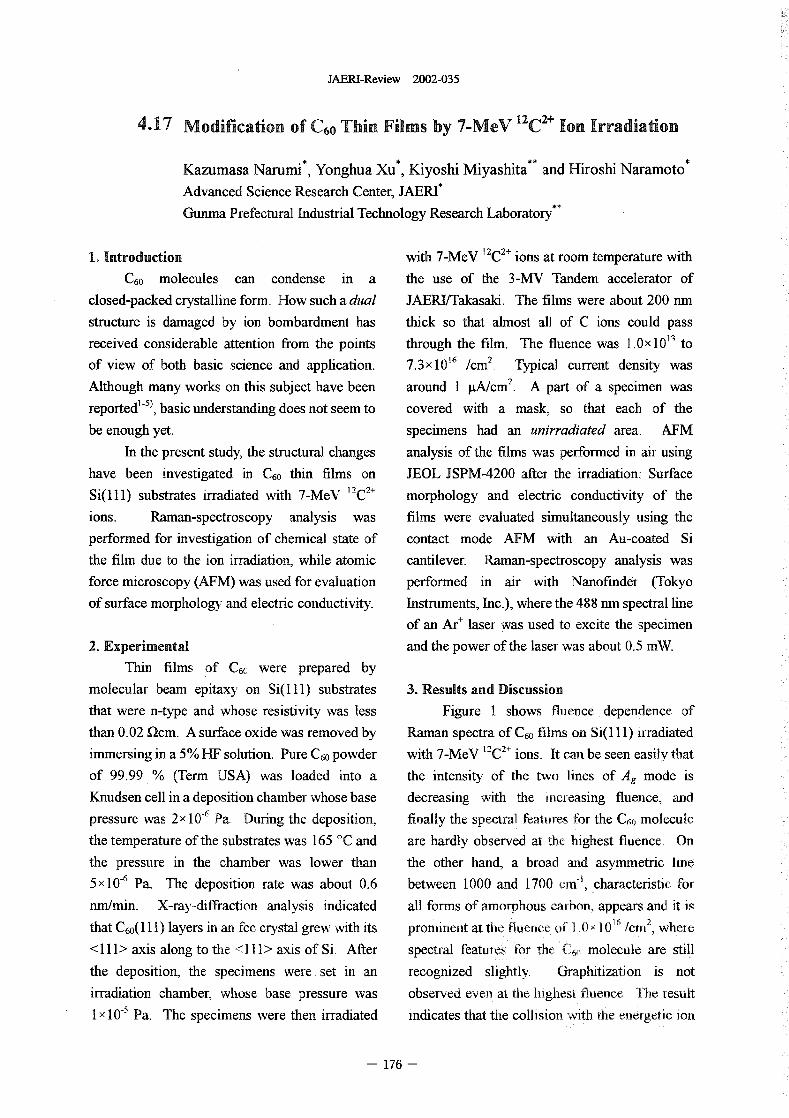
JAERI-Review 2002-035
4.17 Modification Of C60 Thin Films by 7-MeV 12C2+ on Irradiation
Kazumasa Narumi*, Yonghua Xu*, Kiyoshi Miyashita** and Hiroshi Naramoto*
Advanced Science Research Center, AERI*
Gumna Prefectural Industrial Technology Research Laboratory**
1. Introduction with 7-MeV 12C2+ ions at room temperature with
C60 molecules can condense in a the use of the 3-MV Tandem accelerator of
closed-packed crystalline form. How such a dual JAERYrakasaki. The films were about 200 mn
structure is damaged by ton bombardment has thick so that almost all of C 'tons could pass,OX I013 toreceived considerable attention from the points through the film. 'Me fluence was
of view of both basic science and application. 7.3 x IO "' /cm'. Typical current density was
Although many works on this subject have been around I Wcm'. A part of a specimen was
reported'-'), basic understanding does not seem to covered with a mask, so that each of the
be enough yet. specimens had an unirradiated area. AFM
In the present study, the structural changes analysis of the films was performed in air using
have been investigated ' C60 thin films on JEOL JSPM-4200 after the irradiation-, Surface
SO I ) substrates irradiated with 7-MeV 12C21 morphology ad electric conductivity of te
ions. Raman-spectroscopy analysis was films were evaluated simultaneously using the
performed for vestigation of chemical state of contact mode AM with an Au-coated Si
the film due to the on Irradiation, while atomic cantilever. Raman-spectroscopy analysis was
force microscopy (AFM) was used for evaluation performed in air with Nainofindd (Tokyo
of surface morphology and electric conductivity. Instruments, Inc.), where the 488 nin spectral line
of an Ar' laser was used to excite the specimen
2. Experimental and the power of the laser was about 0.5 mW.
Thin films Of C6C were prepared by
molecular beam epitaxy on S(Ill) substrates 3. Results and Discussion
that were n-type and whose resistivity was less Figure I shows fluence dependence of
than 002 92cm. A surface oxide was removed by Raman spectra Of C60 fms on SO 1 1) irradiated12C2+immersing in a % HF solution. Pure C60 powder with 7-MeV ions. It can be seen easi1v that
of 99.99 (Term USA) was loaded into a the intensity of te two lines of Ag mode is
Knudsen cell in a deposition chamber whose base decreasing with the increasing fluence ad
pressure was 2- 10" Pa. Ding the deposition, finally the spectral features for te C6 Mlecule
the temperature of the substrates was 165 'C and are hardly observed at the highest fluence On
the pressure in the chamber was lower than the other hand, a broad and asymmetric line
5 x 10⁻⁶ Pa. The deposition rate was about 06 between 1000 and 1700 crn-', characteristic for
nm/min. X-ray-diffraction analysis indicated all forriis of amorphous arbon', appears and it isthat C60 I ) layers in an fcc crystal grew with its prominent at te fl u erice of L x 1016 /Crul, Where
<111>axisalongtotlie<lll>axisofSI After spectral features for the C60 molecule are still
the deposition, the specimens were set in an recognized slightly, Graphitization is not
irradiation chamber, whose base pressure was observed even at te ighest fance. The resultI X 1-5 Pa. The specimens were then irradiated indicates that the collision with the ergetic 'on
- 176 -
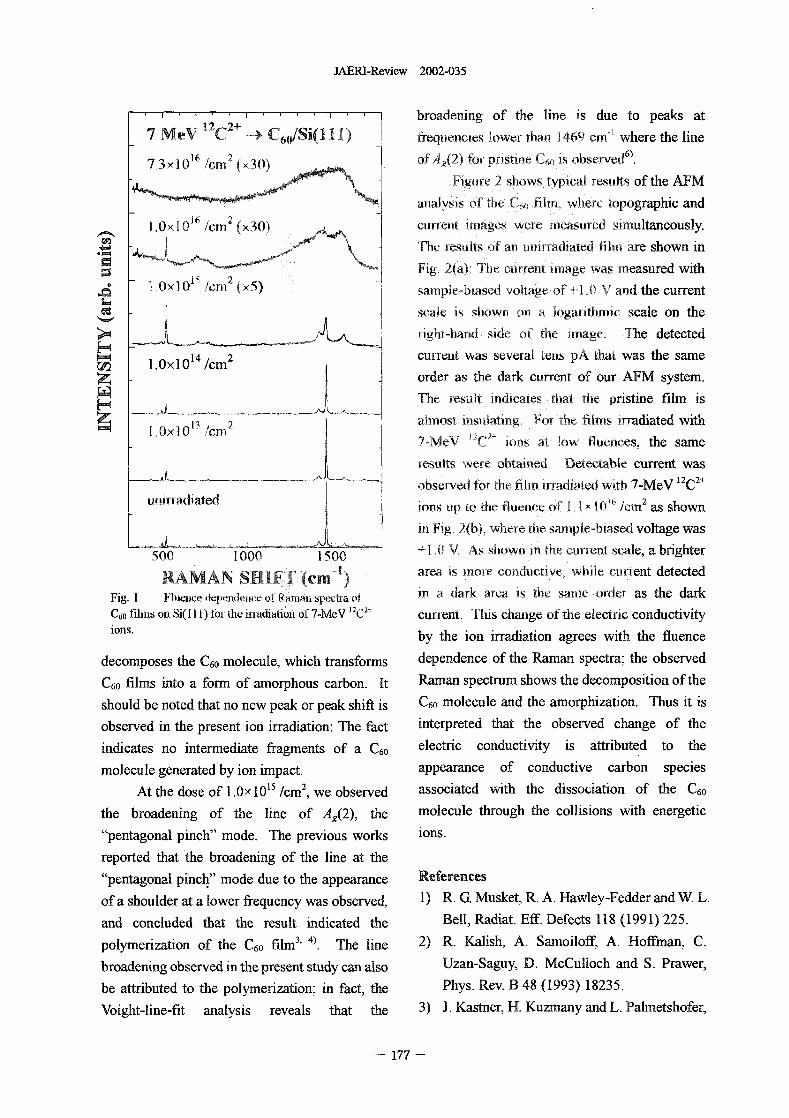
JAERI-Review 2002-035
broadening of the line due to peaks at
7 MeV 12 C2+ C64WR I 1) tirequencles lower tan 1469 ctu-' where the line
16 2 of A,(2) ot pistine C is obsorve&).73 x I /cm (x3O)Figure 2 sows typical results of the AM
analysis of te C6 erfilm. wh topographic and
16 2l.OxlO /cm 00) current unages were easured simultaneouslyThe esults of a unirradiated film are shown in
Fig, (a): Te current image was measured with1'� 2
LOxlO - /cm (x5) sample-biased voltage of +1 �O V ad the current
leg, scale is show o a logarithmic scale on the
>4 right-hand side of the i-nage, Ile detected
14 2 current was several tns pA that was the same(A LOXIO /cm
order as the dark current of our AFM system.The result indicates tat the pstine film is
II 2 abriost insulating, For the fifins irradiated withLOXIO /cnl 7-MeV 2C" ions at low fluences, the same
results were btained, Detectable current wasobserved for te film irradiated with 7-MeV 12c2+
unn-radlated ions tip to the fluence of I X 116 /cm2as shown
In Fig, 2(b), where, the sample-biased voltage was
500 1000 1500 +LOV Assi)ownitithectirrentseale,abrighter-1 area is ore conductive, while current detectedRAMAN SHIFT (cm
Fig. I Fluence dependence of Rainall spectra f in a ark area Is the same order as the darkC60 filin o Si(l I 1) for the iradiation, of 7-MeV 32C21 current. Tins change of the electric conductivityions. by the ion irradiation agrees with the fluence
decomposes the C60 molecule, which transforms dependence of the Raman spectra- the observedC60 films into a form of amorphous carbon. It Raman spectrum shows the decomposition of theshould be noted that no new peak or peak shift is C60 molecule and the arnorphization. Thus it isobserved in the present ion irradiation: The fact interpreted that the observed change of theindicates no intermediate fragments of a C60 electric conductivity is attributed to themolecule generated by ion impact. appearance of conductive carbon species
of 1. 0 X I I /CM2, 'ated h the dissociation of the C60At the dose we observed associ wit
the broadening of the line of Ag(2), the molecule through the collisions with energetic"pentagonal pinch" mode. The previous works ions.reported that the broadening of the line at the"pentagonal pinch" mode due to the appearance Referencesof a shoulder at a lower frequency was observed, 1) R. G. Musket, R. A. Hawley-Fedder and W L.and concluded that the result indicated the Bell, Radiat. Eff. Defects 118 1991) 225.polymerization of the C60 f,11M 4 The line 2) R. Kalish, A. Samoiloff, A. Hoff-man, C.broadening observed in the present study can also Uzan-Saguy, D. McCulloch and S. Prawer,be attributed to the polymerization-, in fact, the Phys. Rev. 48 1993) 18235.
Voight-line-fit analysis reveals that the 3) J. Kastner, H. Kuztnany and L. Palmetshofer,
-177 -
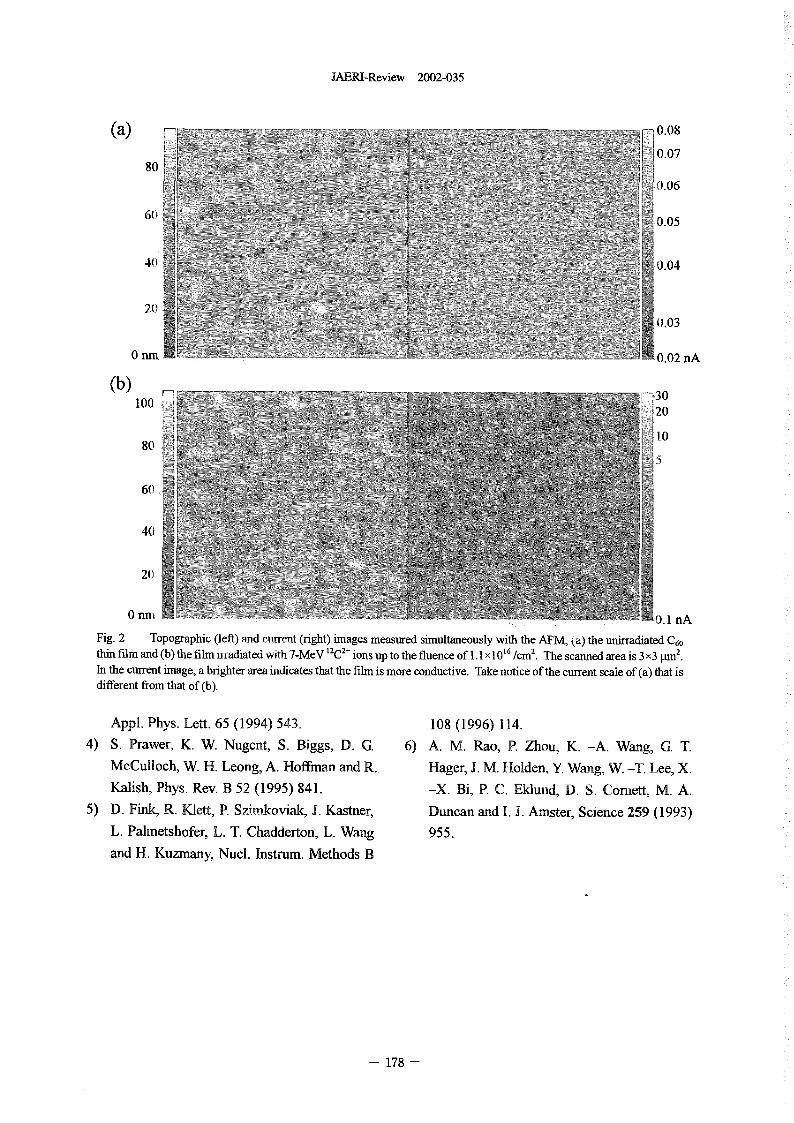
JAERI-Review 2002-035
(a) 0.08
0.0780
0.06
60 0.05
40 0.04
200.03
0 run -0.02 nA
(b) 30
100 20
1080
5
60
40
20
0 nn 10 I nA
Fig. 2 Topographic (left) and crrent (right) images measured simultaneously with the AM- (a) the unirradiated C60
thin film and (b) the fihn iradiated with 7-MeV IIC2+ ions up to the fluence of 1 I X 0 16 /CM2 The scanned area is 3 3 m 2
In the current image, a bighter area indicates that the film is more conductive. Take notice of the current scale of (a) that isdifferent from that of b).
Appl. Phys. Lett. 65 1994) 543. 108 1996) 114.
4) S. Prawer, K. W Nugent, S. Biggs, D. G. 6) A. M. Rao, P. Zhou, K. -A. Wang, G I
McCulloch, W H. Leong, A. Hoff-man and R.. Hager, J. M. Holden. Y. Wang, W -T. Lee, X.
Kalish, Phys. Rev. 52 1995) 841. -X. B, P. C. Eklund, D. S. Cornett, M. A.
5) D. Fink, R. Klett, P. Szlmkoviak, J. Kastner, Duncan and 1. J. Amster, Science 259 1993)
L. Palmetshofer, L. I Chadderton, L. Wang 955.
and H Kuzrnany, Nucl. Instrum. Methods
- 178 -
JAEPd-Review 2002-035
4.18 Ivestigation of the resonant vibration modes of self interstitialatoms in hp metals by low temperature specific heat measurement
M.WatanabeDepartment of Materials Science, JAERI
1017/CM 2 eCtiVeIy2).I.Introduction, at 23K respSome theories') predict the resonant vibration In fcc metals(Cu) and bcc metals(Mo), the peak
modes due to self interstitial atoms in metals, of the specific heat change which originates inwhich have large amplitudes and low the resonance vibration modes below 20K wasfrequencies. These kinds ofmodes for a single found out, as shown in Fig.4, Fig.5 and Fig.6.defect present an important problem for physics This temperature range is lower than the I st stageof lattice defect. The resonant vibration modes of the recovery observed by electrical resistancehave an important influence on properties of measurement etc.phonons. To verify the existence of these modes, In the verification experiment of Zn, the peak ofwe measured the specific heat of the specific heat change which originates in theelectron-irradiated hcp metals(Zn) at low resonance vibration modes below 20K was foundtemperatures. out like Cu and Mo. The specific heat change2.Experimental resulting from the resonance vibration modes ofThe specimens used in this work were Zn single Zn was small after irradiation and was large after
crystals with dimensions of 11.50 X 0.5 mm 3. The 300K annealing. This means that the resonance
irradiations with 2-MeV electrons to the dose of vibration modes after 300K annealing became
1.55 X 10¹⁸/CM 2 at 25K were performed by using large.
a low temperature irradiation facility interfaced to
TIARA 3MV single-ended accelerator. Before 4.Summary
and after irradiation, we measured the specific In the verification experiment of Zn(hcp metals), the
heat of the specimen under the adiabatic peak of the specific heat change which originates in
condition between 5K-45K. resonance vibration modes below 20K was found out
3.Results and discussion like Cu(fcc metals) and Mo(bcc metals).
Fig. I shows the specific heat change in
Zn<OOOI> after irradiation to the dose of 1.55 X Reference
1018/CM 2 at 25K. Fig.2 and Fig.3 show the 1) A.Scholz and Chr.Lehmann,
specific heat change after 60K annealing and Phys.Rev. B6(1972)813.
after 300K annealing in Zn<0001> irradiated to 2) M.Watanabe, TIARA Annual Report 2000,
the dose of 1.55 X IO LS/CM 2 at 25K respectively. p144 2001)
Fig.4 shows the specific heat change in Cu(fcc
metals) after irradiation to the dose of 773 X
1017/CM 2 at 19K and subsequent 60K annealing2).
Fig.5 and Fig.6 show the specific heat change
after irradiation and after. 300K annealing in
Mo(bcc metals) irradiated to the dose of 6.49 X
- 179 -
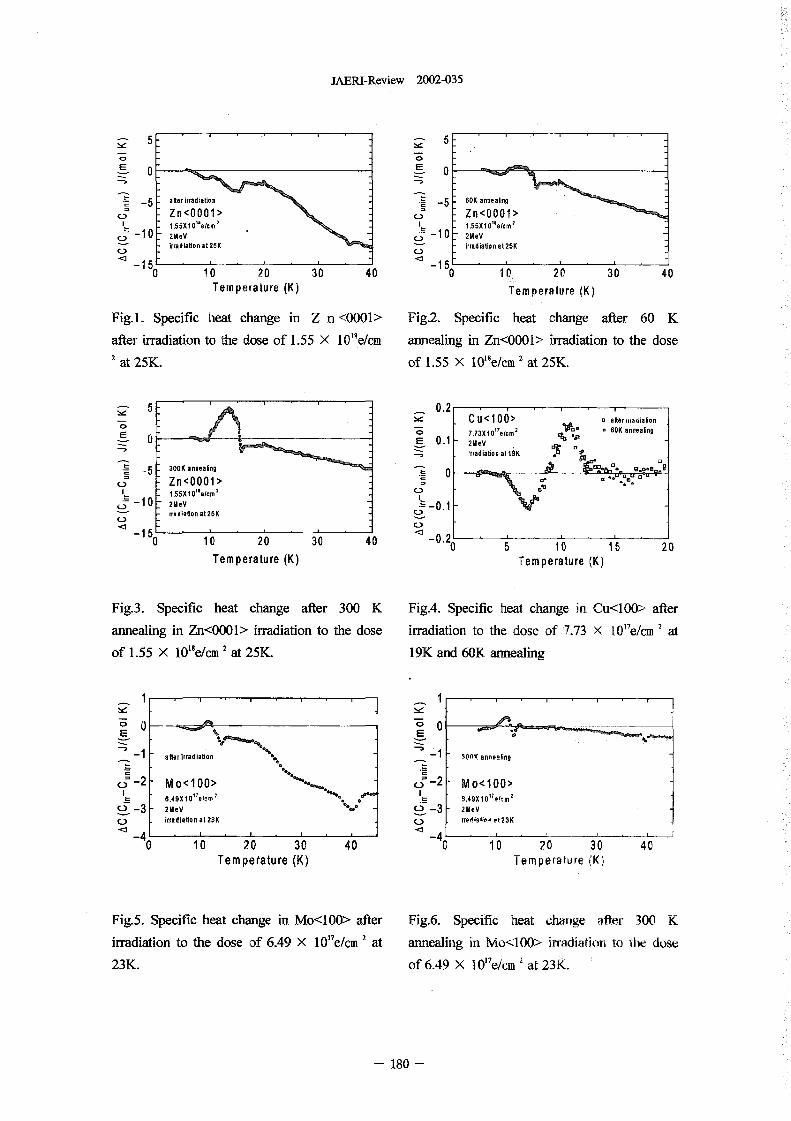
JAERI-Review 2002-035
2 5 - 5
O E 0
-5 after irradiation -5 60K annealing
Zn<0001> Zn<0001>1.55XlO"ekm' 1.55XIO"elcm'
I 0 2MeV 1 0 2MeVirradiation at 25K irradiation at 25K
1 5 1 50 1 0 20 30 40 0 1 0 2 0 30 40
Temperature (K) Temperature (K)
Fig.l. Specific heat change in Z n0001> Fig.2. Specific heat change after 60 K
after irradiation to the dose of 1.55 X 101'e/cm annealing in Zn<0001> irradiation to te dose
2at 25K. of 1.55 X 10"e/CM 2 at 25K.
2 5 - 0.2- - Cu<100> a afterirfailiationQ
O C) 7.73XlO"./..' 60K annealing0 -1 2M d "P
I g ,irradiation at liK
-5 300K annealing
zn<0001> 0C,3
1 0 2MeV I -0.1 Viarradietion at25K
C-),
1 50 1 0 20 30 40 0.20 5 1 0 20
Temperature (K) Temperature (K)
Fig.3. Specific heat change after 300 K Fig.4. Specific heat change in Cu<loo> after
annealing in Zn<0001 iadiation to the dose irradiation to the dose of 7.73 X 10¹⁷e/c 2 at
of 1.55 X 10¹¹e/CM 2 at 25K- 19K and 60K annealing
0 A% 0
% E 0
1 after irrad iation 300K annealing
c; -2 M0<100> c; -2 M0<100>I- 6.49XI O"Wir It= 8.49XI10"elcm
-3 2UeV -3 2MeVirradiation at23K rrediation 9t23K
4 40�O i O 20 30 40 1 0 20 30 40
Temperature (K) Temperature (K)
Fig.5. Specific heat change in Mo<100> after Fig.6. Specific heat change after 300 K
irradiation to the dose of 649 X 1 017 e/CM 2 at annealing in Mo<100> irradiation to tbe dose
23K. of 649 X 10"'ekin at 23K.
- 18 -
JAERI-Review 2002-035
4.19 Hydrogen migration in electron irradiated Pd-based alloys
K. Yamakawa*, Y Cimi** A. wase", I Yano*,N. I"awa**
Department of Electric and Electronic giiieermg,
Faculty of Enguieering, Ehime University*,
Department of Materials Science, JAERI**
1. Introduction method as shown in the previous paper 3,In die previous papers, the diflusivities of Before each elemo iadiation, the specimens
hydrogen isotopes in Pd and Pd based alloys at were slowJy ooled down, fom around 80K, at alow temperatures ave been obtained by constant ate of 0.51(huin below 5K to obtain
measuring the electrical esistivity increase due the structurally odered state of hydrogen atoms.to the ordering of hydrogen isotopes around 50K Then the specimens were irradiated with 0.51-6) In these oxperitnents the disordered MeV electrons from single ended acelerator inhydrogen atonis were produced by quenching the TLkRA branch of JAERLspecimen into liquid helium from the The eergy of electrons was selected as 0.5temperature at which te ydrogen atoms are MeV to prevent trom producing the defects in Pd
structurally in disordered state and the resistivity lattice. The total fluence of each irradiation wasmeasurements were one i liquid helium during - I 2. The temperatures of thethe armeMing, specimens during the irradiation were below 15K.Vada. et al.7) obtained smaller activation energies After the rTadiations the spechimens were(about halves of ours), for hydrogen isotopes in heated-up to higher temperatures at various ratesboth fast cooled and/or electron irradiated and the electrical resistance of the specimensPd-H(D) alloys, comparing with our results of was measured in situ at the temperatures. Thequenched cases. constant heating rates used in the present
In the present experiment, to clarify the experiment were between 0.057K/n-dn and 1.85Kcause of the disagreement between our results /min.and their results, the disordered hydrogen atoms
have been produced by electron irradiation and 3. Experimental Results and Discussionthe specimens have been annealed at a constant It has been already clarified by previousheating rate and the resistance has been investigations 3-") that the electrical resistivity ofmeasured at the same temperature as that they Pd alloys increases by ordering of hydrogenhave measured. The resistance change has been isotopes and decreases by disordering of theanalyzed by the cross-cut method without using isotopes. In the present experiment thethe value of the oder of reaction and the resistance of the Pd based alloys decreases to
assumptions -used by Vajda et al. hydrogen disordering by the electron irradiationand increases due to hydrogen ordering by the
2. Experimental Procedures annealing. Typical resistance curve of the
The Pd based alloy specimens electron iradiated specimen(Pd-lat.%Ag) during(Pd I at. /oFe-H and Pd I at. /oAg-14) were heating-up is shown in Fi I together with a
prepared and hydrogen-charged by the similar heating-up curve for the same specimen after the
- 181
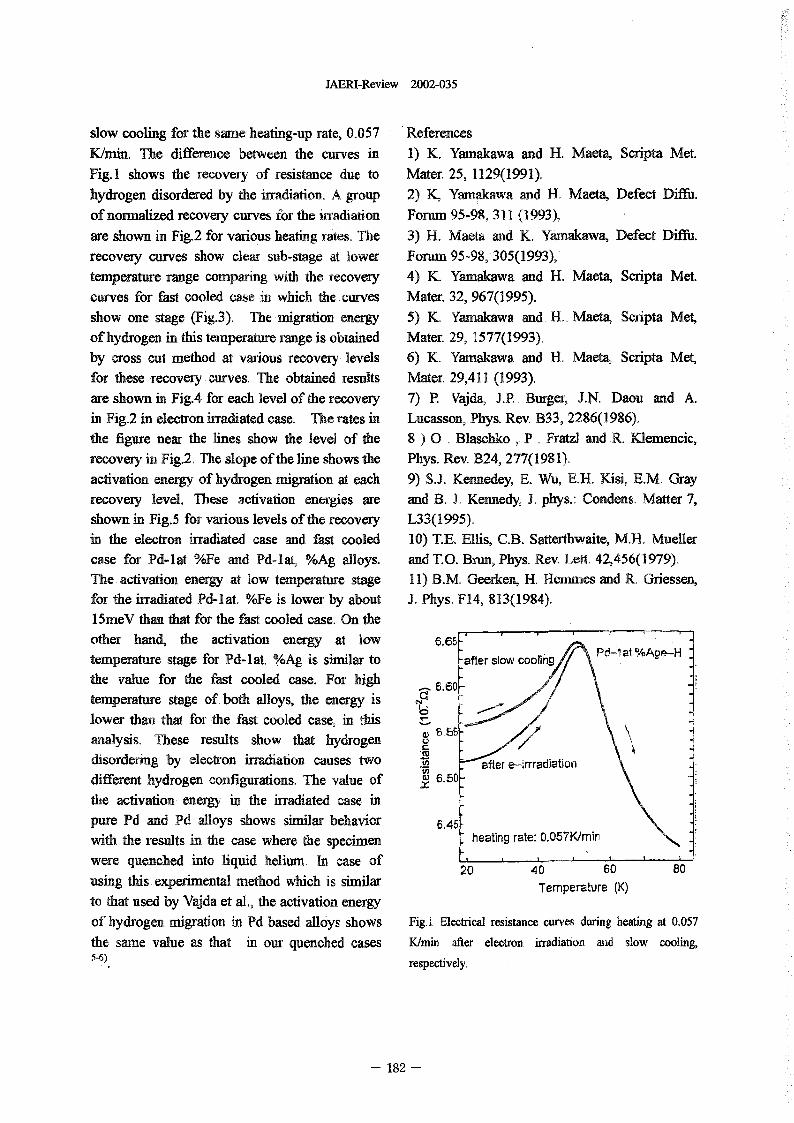
JAERI-Review 2002-035
slow cooling for the same heating-up rate, 0057 References
K/min. The differmce between the curves in 1) K. Yarnakawa and H. Maeta, Scripta, Met.
Fig. I shows the recovery of resistance due to Mater. 25' 1129(1991).hydrogen disordered by die irradiation. A group 2) K, Yamakawa and H. Maeta, Defect Dfu.of normalized recovery curves for the irradiation Forum 95-98, 311 1993),
are shown in Fig.2 for various heating rates, The 3) H. Maeta ad K. Yarnakawa, Defect Diflu.
recovery curves show clear sub-stage at lower Forum 95-98, 305(1993),temperature range comparing with the ecovery 4) K. Yarnakawa and H. Maeta, Scripta Met.
curves for fast cooled case i which the curves Mater. 32, 967(1995).show one stage ig.3). The migration energy 5) K. Yarnakawa and H. Maeta, Scripta Metof hydrogen in this temperature range is obtained Mater. 29, 1577(1993),by cross cut method at various recovery levels 6) K. Yamak-awa and H. Maeta, Scripta Metfor these recovery curves. The obtained results Mater. 29,411 1993).
are shown in Fig.4 for each level of the recovery 7) R Vajda, J.P. Burger, IN Daou and A.in Fig.2 in electron irradiated case. Te rates in Lucasson, Phys. Rev. B33, 2286(1986)�
the figure near the lines show the level of the 8 ) 0 , Blaschko , P . Fratzl and R. Klemencic,recovery in Fig.2, The slope of the line shows the Phys. Rev. B24, 277(198 1),
activation energy of hydrogen migration at each 9) S.J. Kennedey, E. Wu, E.H., Kisi, E.M. Grayrecovery level. These activation energies are and B. J. Kennedy, J. phys.: Condens. Matter 7,shown in Fig.5 for various levels of the recovery L33(1995).in the electron irradiated case and fast cooled 10) T.E. Ellis, C.B. Satterthwaite, M.H. Muellercase for Pd-lat /oFe and Pd-lat, /oAg alloys. and T.O. Brun, Phys. Rev. Lett. 42,456(1979),The activation energy at low temperature stage 11) B.M. eerken, H. Hernmes and R. Griessen,for the irradiated Pd-lat. /oFe is lower by about J� Phy& F14, 813(1984),15meV than that for the fast cooled case. On theother hand, the activation energy at lowtemperature stage for Pd-lat, %Ag is similar to -after slow cooling Pd-Iat,%Ape--H
the value for the fast cooled case. For hightemperature stage of.both alloys, the energy is C9
,Cslower than that for the fast cooled case, in this
a) B, b5 analysis, These results show that hydrogendisordering by electron irradiation causes two Z latun
different hydrogen configurations. The value of x 6.50-
the activation energy i the irradiated case inpure Pd and Pd alloys shows similar behavior 6.45
with the results in the case where the specimen - heating rate: 0.057K/mir
were quenched into liquid helium. In case of L------20 40 60 so
using this experimental method wich is similar Temperature (K)to that used by Vajda et al., the ativation energyof hydrogen migration in Pd based alloys shows Fig.1 Electrical resistance urves during heating at 0057
the sarne value as that in our quenched cases K/min after electron irradiation and slow cooling.5-6) respectively.
182 -
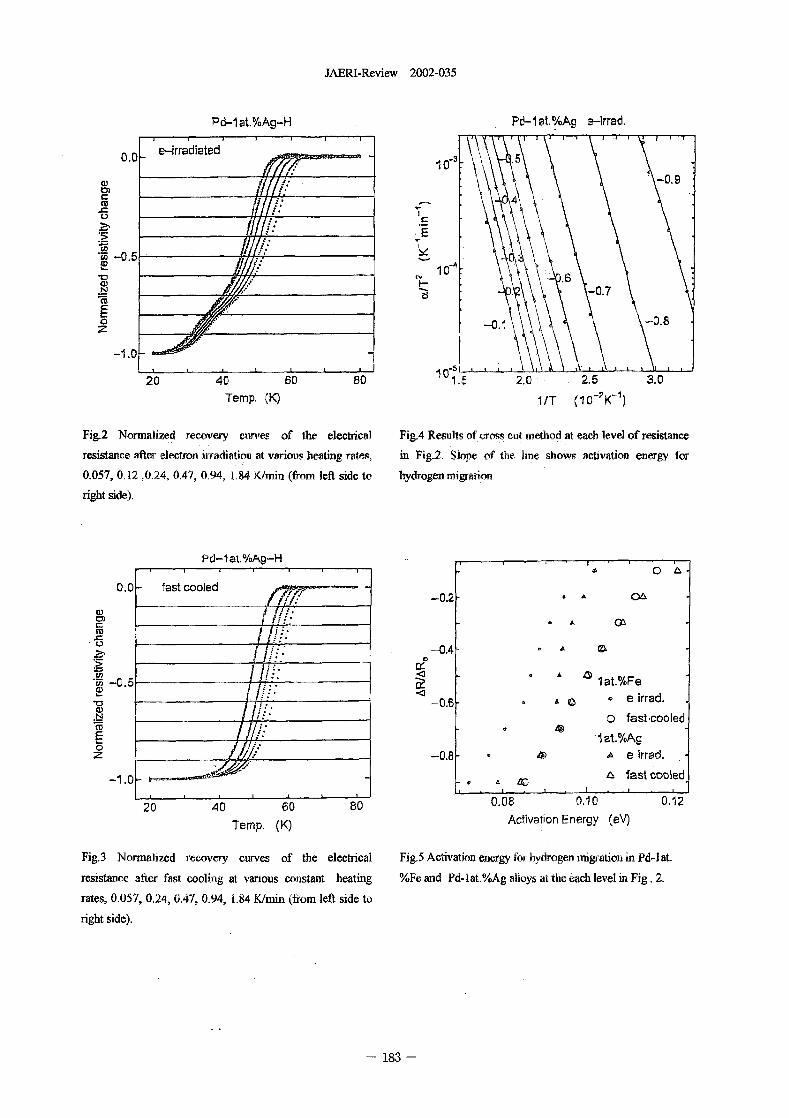
JAERI-Review 2002-035
Pd-lat.%Ag-H Pd-lat.%Ag e-irrad,
e-irr�diated'0.00.9
M
E
6N 0.
E0.8
2 0 40 60 so 1,5 2.0 2.5 3.0
Temp. 1/T (1 0-'K-')
Fig.2 Normalized recovery cumes of the electrical Fig.4 Results of cross out method at ach level of resistance
resistance after electron irradiation at various eating Totes, in Fig.2, Slope of the line shows activation energy for
0.057, O� 12 0,24, 047 094 184 K/min (from left side to hydrogen migration_
right side).
0
0. - fast cooled-0.2 - A 06
U --0.4 - A 06-I
cn Arn -0.5 lat.%Fe
<-0.6 - e irrad.
N 0 fast-cooled
E 'I at.%Ag0z -0.8 A e rrad.
fast cooled
20 40 60 80 0.08 0.10 0.12
Temp. (K) Activation Energy (eV)
Fig.3 Normalized rmovery curves of the electrical Fig.5 ctivation eergy for hydrogen igration in Pd I at.
resistance after fast cooling at various constant heating %Feand Pd-lat.1/oAgalloysaitiieeachle,.,elinFig.2-
rates, 0057 024, 0.47, 094 184 K/rnin from left side to
right side).
183 -
JAERI-Review 2002-035
4.20 Electron Irradiation Effect in Oxygen-Deficient EuBa2CU30y
N. Ishikawa% Y. Chimi% A. Iwase% H. Wakana**, T. Hashimoto",0. Michikarni"Department of Materials Science, JAERI*
Faculty of Engineering, lwate University"
LIntroduction resistivity increase.
In oxide superconductors EuBa2CU30y
(y--7) irradiated with energetic electrons, 2. Experimental Procedure
point defects are created in lattice system A -axis oriented EuBa2CU30y (y--7) thin
and the electrical resistivity increase is film was prepared on MgO substrate, and it
observed with increasing electron fluence. was heated in low oxygen partial pressure.
In the previous study of electrical resistivity The oxygen-deficient EuBa2CU30Y was
change due to irradiation with electrons and expected to have oxygen content of Y=6,
- IMeV ions, it has been found that the since its c-axis lattice parameter was larger
initial slope of electrical resistivity-fluence by 12% than that of EuBa2CU30y (y--7). The
curve is proportional to the energy transfer resistivity at 100K was p,=4.20cm before
through elastic collision. This means that irradiation. The fluence dependence of
the process of defect production due to electrical resistivity was measured by
electron irradiation can be understood as a four-probe method. The specimens were
simple process that is described as elastic irradiated at low-temperature (100K) with
displacements of target atoms') as long as 0.46 and 2.OOMeV eectrons from a MV
EuBa2CU30y &-7) oxide superconductor is single-ended accelerator in TIARA,
concerned. JAERI-Takasaki. tt order to avoid the
However, we do not know what ldnd of possible irradiation effect of the electrode,
parameter deterniines the absolute value of the rectangular-shaped slit was placed on the
electrical resistivity change per unit electron sample, and only the sample was irradiated.
fluence. In order to find a key to solve this In-situ measurement of fluence dependence
problem, we have artificially removed of electrical resistivity at 100K was
oxygen atoms from EuBa2CU30y &-7) by a performed.
thermal treatment, and irradiated the In order to study the thermal stability of
oxygen-deficient FuBa2C1130Y (y--6) iffadiation-induced defects, the irradiated
specimen. Comparison between the sample was annealed up to 300K ad the
resistivity change due to electron irradiation resistivity was measured during the
for EuBa2Cu30y &-7) and that for annealing.
EuBa2Cu3Oy (y--6) shows that there is a
correlation between the resistivity value 3.Results and Discussion
before iadiation and the irradiation-induced Figure shows Ap/p. as a function of
- 184 -
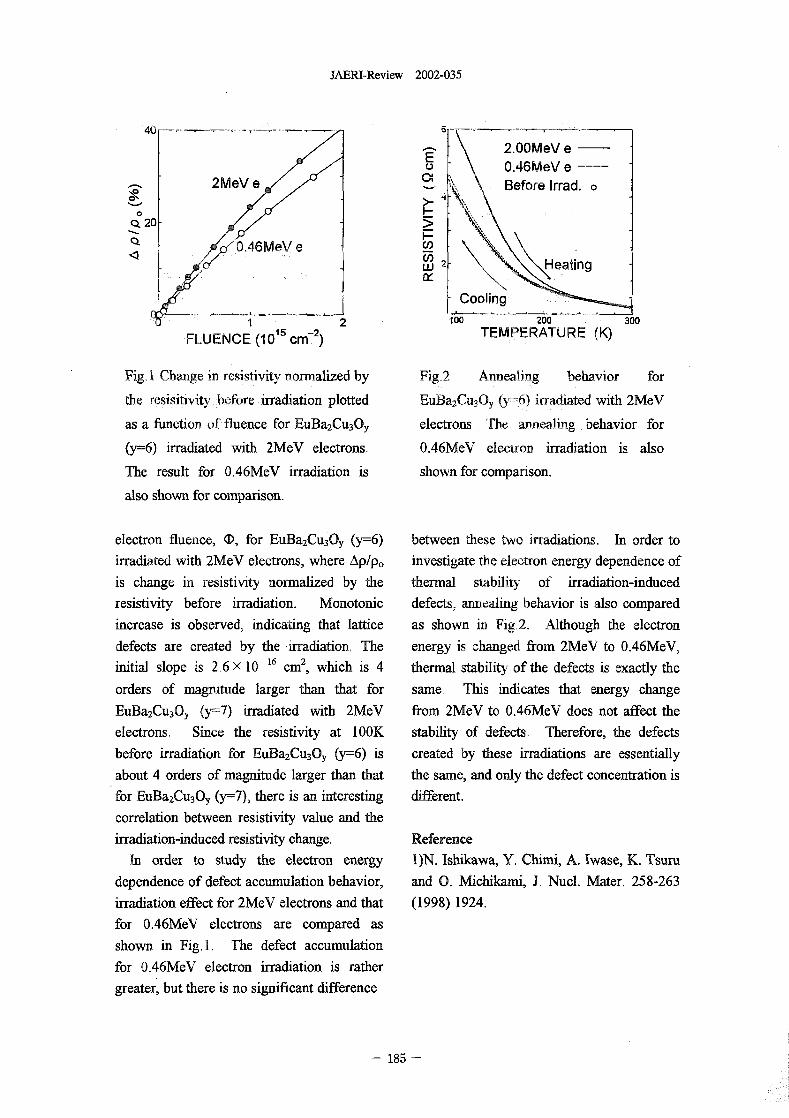
JAERI-Review 2002-035
40
MeVeE0 0.46MeV e
C42Me\ e Before Irrad. o4 -
04QL 20 -
q F-0,46MeV e (1)CO 2W eatingX
- Cooling
100 200 300
FLUENCE 10" crn) TEMPERATURE K)
Fig, I Change in resistivity non-nalized by Fig.2 Annealing behavior for
the resisitivity before irradiation plotted EuBa2CU30, (y--6 iradiated with eV
as a function of fluence for EuBa2CU30Y electrons, The annealing behavior for
(y--6 iadiated with 2MeV electrons. 0.46MeV electron irradiation is also
The result for 0.46MeV irradiation is shown for comparison.
also shown for comparison.
electron fluence, 1), for EuBa2Cu3Oy (y--6) between these two irradiations. In order to
irradiated with 2MeV electrons, where Ap/p,, investigate the electron energy dependence of
is change in resistivity normalized by the thermal stability of irradiation-induced
resistivity before irradiation. Monotonic defects, annealing behavior is also compared
increase is observed, indicating that lattice as shown i Fg,2. lough the electron
defects are created by the iadiation. The energy is changed from 2MeV to 0.46MeV,
initial slope is 2.6X 10 16 cm2, which is 4 thermal stability of the defects is exactly the
orders of magnitude larger than that for same. Ms indicates hat energy change
Eu]Ba2CU30y (y=7) irradiated with 2MeV from 2MeV to 0.46MeV does not affect the
electrons, Since the resistivity at lOOK stability of defects. Therefore, the defects
before irradiation for EuBa2CU30y (y--6) is created by these irradiations are essentially
about 4 orders of magnitude larger thu that the same, and only the defect concentration is
for EuBa2,CU30y (y--7), there is an interesting different.
correlation between resistivity value and the
irradiation-induced resistivity change. Reference
In order to study the electron energy I)N. Ishikawa, Y. Chimi, A. wase, K. Tsuru
dependence of defect accumulation behavior, and 0. Michikami, J, Nucl. Mater. 258-263
irradiation effect for MeV electrons and that (1998) 1924.
for 0.46MeV electrons are compared as
shown in Fig. I The defect accumulation
for 0.46MeV electron irradiation is rather
greater but there is no significant difference
- 185
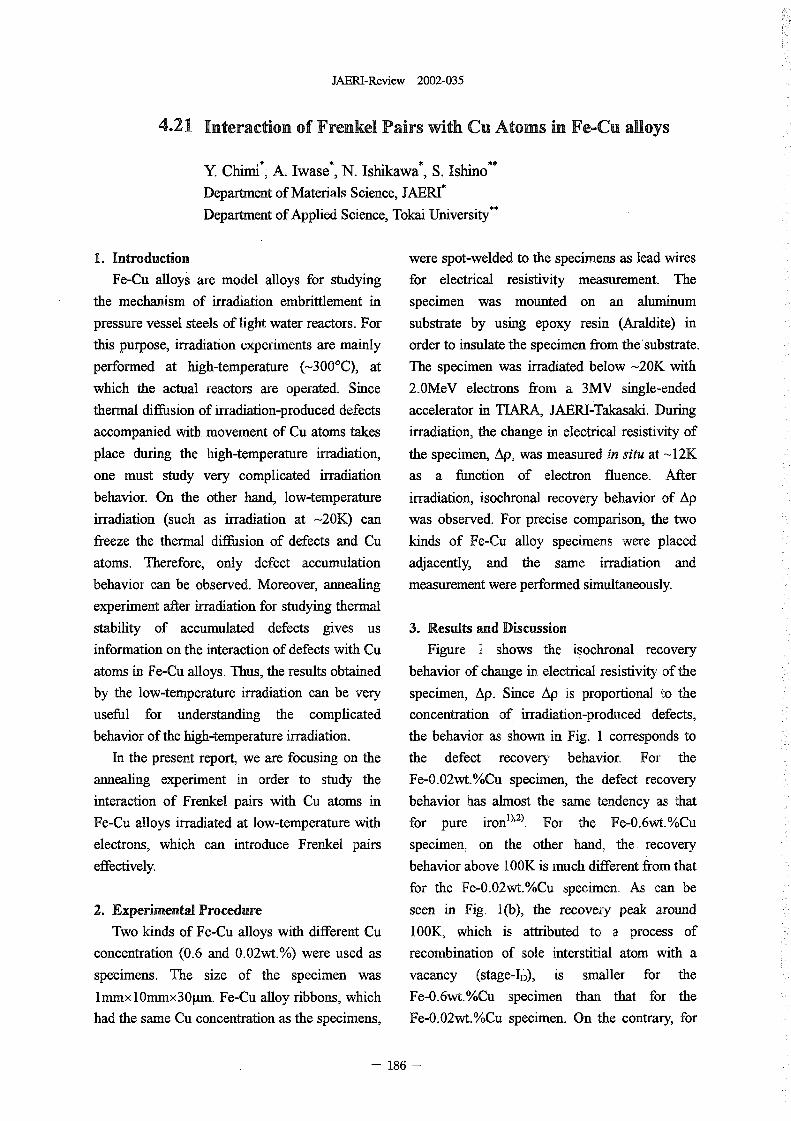
JAERI-Review 2002-035
4.21 Interaction of Frenkel Pairs with Cu Atoms in Fe-Cu aoys
Y Chimi*, A. Iwase*, N. Ishikawa*, S. Ishino**Department of Materials Science, JAERI*
Department of Applied Science, Tokai University"
1. Introduction were spot-welded to the specimens as lead wiresFe-Cu aoys are model alloys for studying for electrical resistivity measurement. The
the mechanism of irradiation embrittlement in specimen was mounted on an aluminumpressure vessel steels of light water reactors. For substrate by using epoxy resin (Araldite inthis purpose, irradiation experiments are mainly order to insulate the specimen from the'substrate.performed at high-temperature (-300'C), at The specimen was irradiated below -20K withwhich the actual eactors are operated. Since 2.OMeV electrons from a 3MV single-endedthermal diffusion of irradiation-produced defects accelerator in TkRA, JAERI- Takasaki. Duringaccompanied with movement of Cu atoms takes irradiation, the change in electrical resistivity Ofplace during the high-temperature irradiation, the specimen, Ap, was measured in situ at -12Kone must study very complicated irradiation as a function of electron fluence. Afterbehavior. On the other hand, low-temperature irradiation, isochronal recovery behavior of Apirradiation (such as iadiation at -20K) can was observed. For precise comparison, the twofreeze the thermal diffusion of defects and Cu kinds of Fe-Cu aoy specimens were placedatoms. Therefore, only defect accumulation adjacently, and the same irradiation andbehavior can be observed. Moreover, annealing measurement were performed simultaneously.
experiment after irradiation for studying thermalstability of accumulated defects gives us 3. Results and Discussioninformation on the interaction of defects with Cu Figure I shows the isochronal recoveryatoms in Fe-Cu alloys. Thus, the results obtained behavior of change in electrical resistivity of theby the low-temperature irradiation can be very specimen, Ap. Since Ap is proportional to theuseful for understanding the complicated concentration of irradiation-produced defects,behavior of the high-temperature irradiation. the behavior as shown in Fig. I corresponds to
In the present repoM we are focusing on the the defect recovery behavior. For theannealing experiment in order to study the Fe-0.02wt.%Cu specimen, the defect recoveryinteraction of Frenkel pairs with Cu atoms in behavior has almost the same tendency as thatFe-Cu alloys irradiated at low-temperature with for pure iron11,21 . For the Fe-0.6wt.%Cuelectrons, which can introduce Frenkel pairs specimen, on the other hand, the recoveryeffectively. behavior above I OOK is much different from that
for the Fe-0.02wt.%Cu specimen, As can be2. Experimental Procedure seen in Fig, lb), the recovery peak around
Two kinds of Fe-Cu alloys with different Cu 100K, which is attributed to a process ofconcentration 0.6 and 0.02wt./o) were used as recombination of sole interstitial atom with aspecimens. he size of the specimen was vacancy (stage-l�), is smaller for thelinnixl0minx30�Lm. Fe-Cu alloy ribbons, which Fe-0.6wt.%Cu specimen than that for thehad the same Cu concentration as the specimens, Fe-0.02wt.%Cu specimen. On the contrary, for
186 -
JAERI-Review 2002-035
. I . . . I . . . . . . . . . . . .
(a) Fe-0.02wt.%Cu
0.02-
CL
Fe-0.6wt.%Cu0- 0.5-.1 a- 0.01 P Fe-0.6wt.%Cu-<
A
Fe-0.02w(%Cu 0
50 100 150 200 0 50 100 150 200
Annealing temperature K Annealing temperature K ]
Fig. 1. Isochronal recovery curves of electrical resistivity. change (a) and their temperature
derivatives (b) for F-0.6wt.%Cu and Fe-0.02wt.%Cu specimens. Apo represents Ap before
annealing.
the Fe-0.6wt.%Cu specimen, the recovery peak
around 140K is larger than that for the
Fe-0.02wt.%Cu specimen. This implies that an
interstitial atom trapped by a Cu atom cannot
move around IOOK and can be dissolved from a
Cu atom around 140K, i.e. that the movement of
interstitial atoms is prevented by Cu atoms.
References
1) S. Takaki, 1. Fuss, H. Kugler, U. Dedek H.
Schultz, Radiat. ff. 79 1983) 87.
2) R Ehrhart, Jung, H. Schultz, H. Ullmaier,
in Atomic Defects in Metals, Landolt-
BOrnstein, Numelcal Data and Functional
Relationships in Science and Technology,
edited by H. Ullmaier (Springer-Verlag,
Berlin, 1991), Group III, vol. 25.
187 -
JAEM-Review 2002-035
4.22 adiation Enhanced Copper Segregation Processes in Pressure
Vessel Steel Model Alloys during Electron IrradiationS. Ishino*, A. wase", Y. Chimi**, N. Ishikawa**, Bagiyono**,
M. Suzuki****, T. Tobita**** and K. Aizawa****Department of Applied Science, Tokai University*
Department of Materials Science, JAERI**Center for Education and Training, Batan, Indonesia***Department of Reactor Safety Research, JAERI
1. Introduction 2.2. Irradiation and Measurements
Mechanism of radiation embrittlement in pressure . The specimens were irradiated at 300K with
vessel steels is one of the ost important subjects in 2MeV electrons from a single end accelerator at
recent years related to plant life extension of a light Takasaki Research Establishment, JAFRI. The
water reactor. Copper has been known to have a irradiation dose was calculated using thestrong effect in the embrittlement phenomena and displacement energy of 24eV for iron"', The
so-called copper-nch precipitates are responsible for electrical resistivity was measured mi-situ by a
embrittlement. However, the exact mechanism of conventional four-probe method at 300K as a
the role of copper has not been fully understood yet. function of irradiation dose. The temperature of theIn the present experiment, the role of radiation- specimens was measured with a platinum resistanceinduced point defects in copper clustering 'M Fe-Cu thermometer simultaneously with the resistivity of
model alloys has been studied by measuring the specimens.
electrical resistivity in-situ during electron irradiation.
The results will be discussed in comparison with 3. Results
similar experiments using heavy ion irradiations. 3.1. Dose dependence of resistivity changeFig.1 shows the dose dependence of resistivity
2. Experimental Procedures change for (a) Fe-0.6wt,%Cu and (b) Fe-2.1. The Specimens 0.02wt.%Cu alloys, Except for an anomalous
The specimens used for electrical resistivity transient behavior at the begintiffig of irradiation, the
measurements were prepared from two kinds of high resistivity decreases steadily widi dose. In Fig.1,
purity Fe-Cu alloys with the copper concentration of results obtained uder hrgh-f,-nerg)� abon ion
0.02 and 06 wt.%, respectively. The final state of irradiations wifli almost the same dose rate as that for
heat treatment was 850'C for 10 minutes followed electron irradiations are also plotted, The rate of
by quenching by gas cooling. The thickness of the change of resistivity is strongly dependent on copper
specimen was 30 icrons. The specimens were concentration. The figure also sbows that electron
mounted on a copper block side-by-side, electrodes irradiation gives higher rate of change than heavy
were spot-welded and then copper lead wires were ions for the same dpa rate. This is probably due to
soldered. The two specimens were connected in the difference in the fraction of freely migrating
series. defects.
- 188 -
JAERI-Review 2002-035
There is a small transient in early stage of 4.2. The role of point defects on copper clust ering
irradiation up to a few micro-dpa for electron At 30OK, vacancies can be mobile because the
irradiation, which is compared with ion irradiation vacancy migration stage (Stage 11) appears around
case of about I micro-dpa. The transient behavior 250K�). The copper clustering process occurs
can be eliminated by a small amount of pre- during irradiation because after irradiation the
irradiation. This is shown in Flo. 2 (a) for resistivity values do not show any change wtli time,
Fe-0.6wt.% Cu and (b) Fe-0.02wt.%Cu alloys. even after leaving, te specimen overnight at 300K.
Therefore, we conclude that the copper clustering
3.2. Effect of dose rate occurs during annilulation of point defects mostly of
Fig.3 shows the effect of dose rate on the resistivity vacancies. Interstitials may contribute to the
change f (a) Fe-0.6 A.%Cu and (b) Fe-0.02 transport of copper, atoms because of the presence of
wt.%Cu lloys. There is a general tendency that for weak interaction sown in sochronal annealing
lower dose rate, lie rate of change of resistivity is curves. The umber of copper atoms removed from
larger. Similar tendency is also observed ion solid solution per- Frenkel pair can be stimated using
irradiation case 3). This is also consistent with the the resistivity contribution of an atomic percent of
generally accepted view that the formation process copper atoms of about 2.5,u cm at.% Cu. The
of opper rich precipitates 111 commercial pressure slope of resistivity change in Fig. I is about 002 it
vessel steels. also depends on dose rate. cm per 50,u dpa implying about IO copper atoms are
removed from solid solution per dpa. This is a very
4. Discussion efficient process indicating that copper atoms are
4.1. The Mechanism of resistivity decrease transported to cluster sites many times by one
In our earlier work, we have confirmed that i both vacancy terstitial pair. Recent computer
alloys irradiated at cryogenic temperatures followed simulation of copper diffusion by vacancy
by annealing up to 3OOK, interaction of interstitials mechanism has also suggested sch a possibility�).
with copper atoms is not very strong and most of the
defects 90%) are annihilated by annealing up to 5. Conclusion
300K. Vacancies in pure alloys may be mobile at 2MeV electron irradiation of Fe-Cu alloys at
around 250K. During irradiation at 30OK, 300K causes copper clustering. The clustering
vacancies can move as well as copper atoms, which efficiency and role of point defects have been
are supposed to be mobile via vacancy mechanism. discussed.
The resistivity decrease may be due to removal of
copper atoms from solid solution. The removed References
copper atoms may form copper clusters or copper 1) G. Lucasson and R. M. Walker, Phys.
precipitates. The initial transient may be due to the Rev. 127(1962) 485.
nucleation process of such csters, The slope of 2) Y Cbimi et al., tese proceedings.
the itial resistivity change in the transient regime is 3) S. shJno et al., JAERT Tandem Annual
too steep to be explained by accumulation of some Report 2001,(JAERI, 2002) to be published
defects. 4) N. Soneda, private communication.
- 189 -
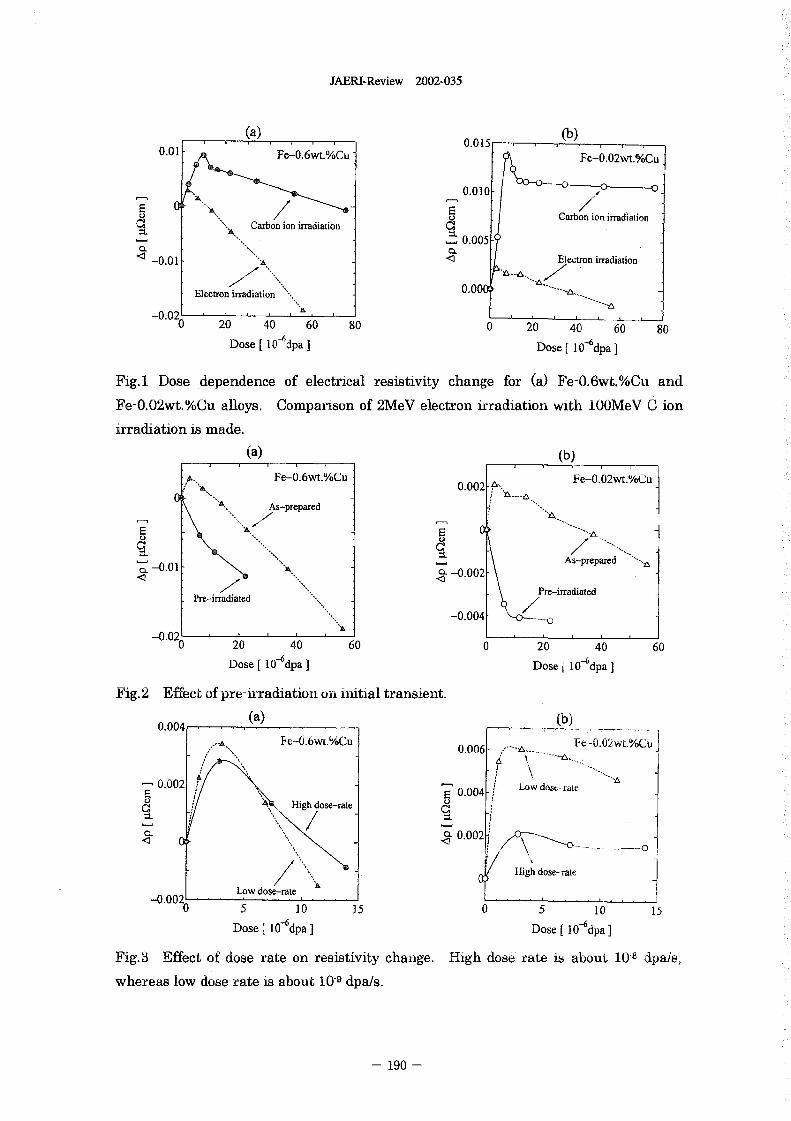
JAERI-Review 2002-035
(a) (b)1 0.0150.01 Fe-0.6wt.%Cu' Fe--0.02,At.%Cu
0.010
E P Carbon ion irra ationC3 Carbon ion irradiation
=L A,0.005
-0.01 'A Electron irradiation
0. 000Electron irradiation
-0.020 40 60 80 0 20 40 60 80
Dose [ 10 -6 dpa ] Dose 10 -6 dpa
Fig.1 Dose dependence of electrical resistivity change for (a) Fe-0.6wt.%Cu and
Fe-0.02wt.%Cu alloys. Comparison of 2MeV electron irradiation with 0OMeV C ion
irradiation is made.
(a) (b)
Fe-0.6wt.%Cu Fe-0.02wt.%Cu0.002
As-prepared 4;
E=L =L
As-prepared-0.01 CL 0.002
Pre-irradiatedPre-irradiated
-0.004
-0.020L20 40 60 0 20 40 60
Dose 10 -6 dpa Dose I edpa
Fig.2 Effect of pre-irradiation on i-Atial transient.
0.004 (a) (b)
Fe-0.6wI.%CU 0.006 --- FeA.02wt.%Cu
0.002 0.004 Low dose-iateHigh dose-rate
=L =L
0.0020 < 0
High dose-rate'ALow dose-rate
-0.00?_0 5 0 5 0 5 1 0 1 5
Dose 10 -6 dpa ] Dose 1076dpa
Fig.3 Effect of dose rate on resistivity change. High dose rate is about 10-8 pa/s,
whereas low dose rate is about 0-9 dpa/s.
- 190
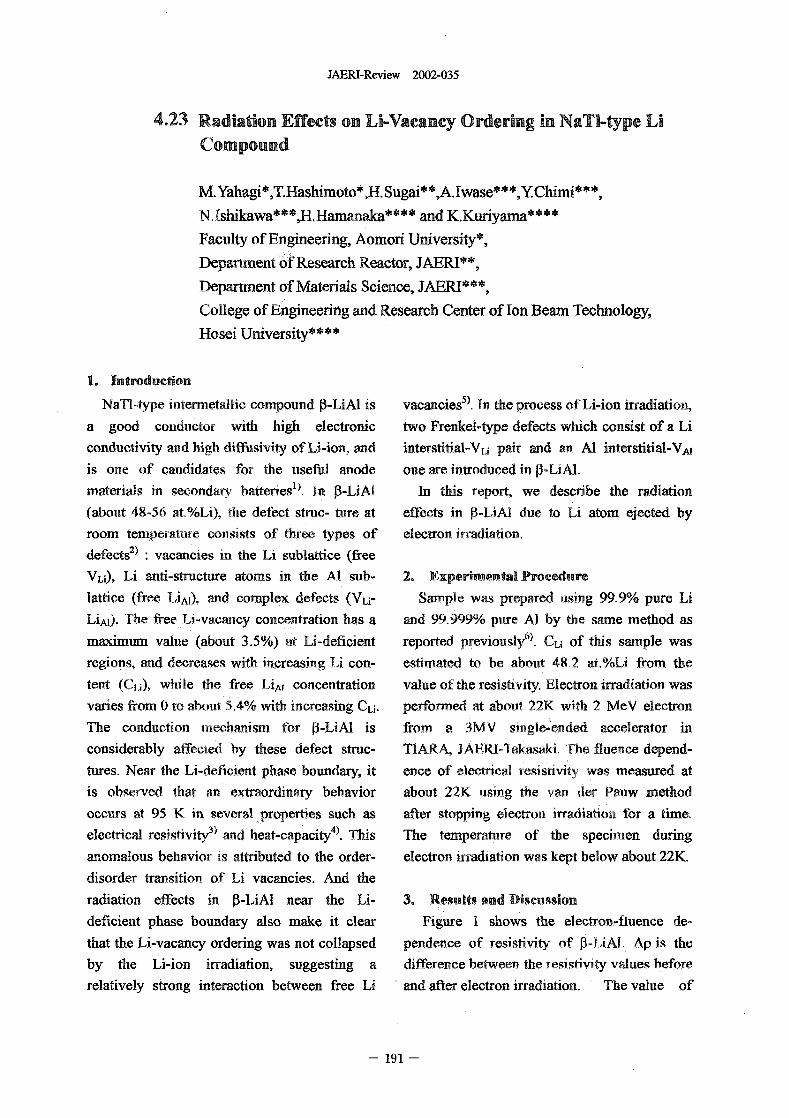
JAM-Review 2002-035
4-23 Radiation Effects on LI-Vacancy Ordering in NaTI-type LiCompound
M.Yahagi*,T.Hashimoto*,H.Sugai**,A.Iwase***,YChimi***,Nlshikawa***,H.Hamanaka**** and K.Kuriyama****Faculty of Engineering, Aomori University*,Department of Research Reactor, JAERI**,Department of Materials Science, JAERI***,College of Engineering and Research Center of Ion Beam Technology,Hosei University""
1. IntroductionNaTl-type intermetallic compound P-LiAl is vacancies�), In the process of Li-ion irradiation,
a good conductor with high electronic two Frenkel-type defects which consist of a Liconductivity and high diffusivity of Li-ion, and interstitial-VU pair and an Al interstitial-VA,is one of candidates for the seful anode one are introduced in P-LiAl.materials in secondary batteries'). In P-LiAl In this report, we describe the radiation(about 48-56 at.%Li), te defect struc- ure at effects in P-LiAl due to Li atom ejected byroom temperature consists of three types of electron it-radiation,defects2) : vacancies in the Li sublattice (freeVL), Li anti-structure atoms in the Al sub- 2. Experimental Procedure
lattice (free LiAl), and complex defects (Wi- Sample was prepared using 99.9% pure Li
LiAl). The free N-vacancy concentration has a and 99.999% pure Al by the same method as
maximum value (about 35%) t Li-deficient reported previOUSly6)- CU Of this sample was
regions, and decreases with icreasing Li con- estimated to be about 48,2 at.0/oLi from the
tent (Cfj), while the free LiAl concentration value of the resistivity. Electron irradiation was
varies from to about 54% with icreasing CLi- performed at about 22K with 2 MV electron
The conduction inechanism for P-LiAl is from a V single-ended accelerator in
considerably affected by these defect struc- TIARA, AERI-Takasaki. The fluence depend-
tures Nar the Li-deficient phase boundary, it ence of electrical 'resistivity was measured at
is observed that an extraordinary behavior about 22K using the van der Pauw method
occurs at 95 K in several properties such as after stopping eectron irradiation for a time,
electrical resj8tiVity3) and heat-capacity4). This The temperature of the specimen during
anomalous behavior is attributed to the order- electron iadiation was kept below about 22K.
disorder transition of Li vacancies. And the
radiation effects in P-LiAl near the Li- 3. Results and Discussion
deficient phase boundary also make it clear Figure I shows the electron-fluence de-
that the Li-vacancy ordering was not collapsed pendence of resistivity of O-LiAl. Ap is the
by the Li-ion irradiation, suggesting a difference between the resistivity values before
relatively srong interaction between free Li and after electron irradiation. The value of
- 191
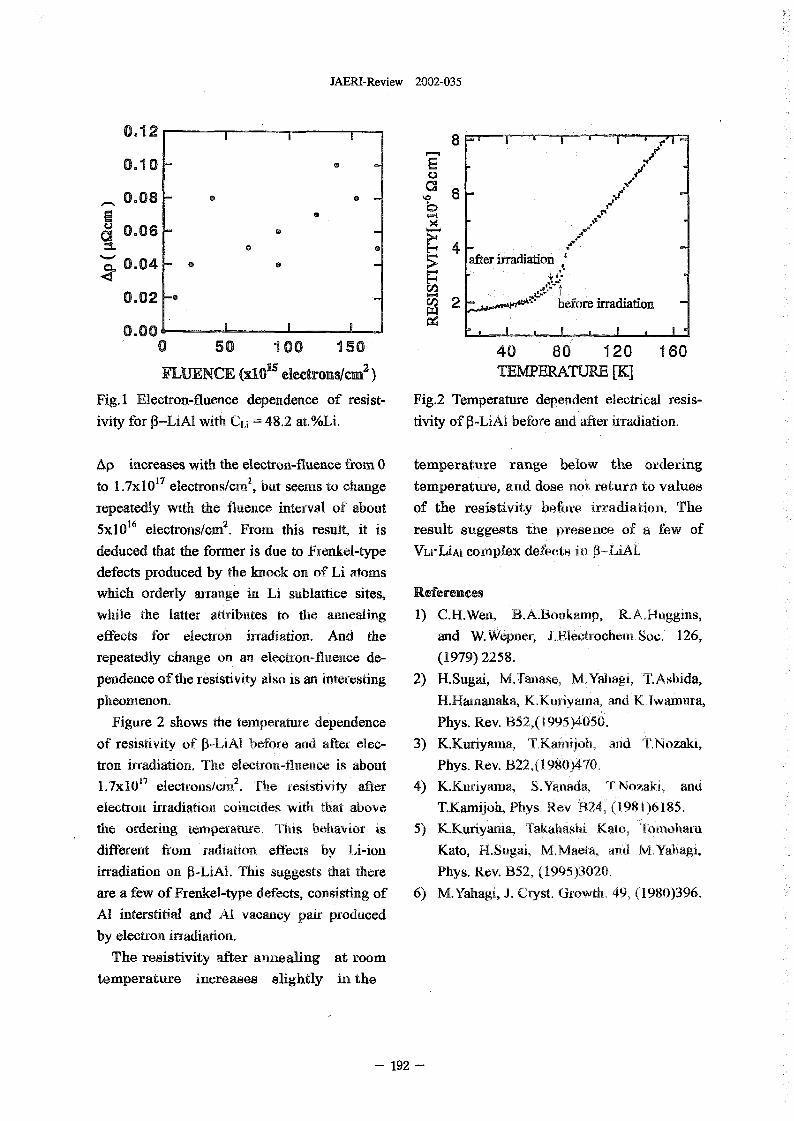
JAERI-Review 2002-035
0.12 T__ 8
0.1 E
0.08
0.06 -Ci
4 irradiCL 0.04 - after ation
0.020 2 before irradiation
0.000 50 100 150 40 80 120 160
FLUENCE xIO" electrons/cm) TENTERATURE [K]
Fig. I Electron-fluence dependence of resist- Fig.2 Temperature dependent electrical resi�-ivity for P-LiAl with C = 48.2 at. %Li. tivity of P-LiAl before ad afte iradiation.
Ap increases with the electron-fluence from temperature range below the orderingto 1.7xl 017 electrons/cux2, but seems to change temperature, ad dose not return to valuesrepeatedly wth the fluence interval of about of the resistivity before rradiation. The5x 1016 electrons/cm�. From this result, it is result suggests the presence of a few ofdeduced that the former is due to Frenkel-type WrLiAicoraplex defects in ft-LiAl.defects produced by the knock on of Li atomswhich orderly arrange in Li sublattice sites, Referenceswhile the latter attributes to te aealing 1) C.H.Wen, B.A.Boukamp, R.A.Huggins,effects for electron irradiation. And the and WWepner, .'NeotrocheinSoc. 126,repeatedly ange on an electron-fluence de- (1979) 2258.
pendence of the resistivity also is an iteresting 2) H.Sugai, M.Tanase, Yahagi, TAshida,
pheoinenon. H.Hainanaka, K.Kuriyama, and K.Iwainura,
Figure 2 shows the tmperature dependence Phys. Rev. 2,(1995)4050.
of resistivity of �-LiAl before d after elec- 3) K.Kuriyama, T.Kaniijoh, and T.Nozaki,
tron iadiation Te electron-flueoce is about Phys. Rev. B22,(1980)470.
1.7x 10¹⁷ electrojis/cm�. The eistivity after 4) K.Kuriyama, S.Yanada, TNozaki, and
electron irradiation oincides with at above T.Kamijoh, Phys, ev, 824, (1981)6185.
the ordering temperature. This behavior is 5) K.Kuriyarua, Takahashi Kato, Tornoliatu
different fiow radiation effects by Li-ion Kato, 14.Sugai, MMaeta, and M.Yahagi,
irradiation on P-LiAl. This suggests that there Phys. Rev. B52, 1995)3020,
are a few of Frenkel-type defects, consisting of 6) M.Yahagi, J. Cyst. Growth, 49, 1980)396.
Al interstitial and Al vacancy pair pduced
by electron irradiation.
The resistivity after annealing at room
temperature increases ghtly in the
192 -
JAERI-Review 2002-035
4.24 Elastic Property of Nanocrystalline Gold after Low-Temperature MeV Electron Irradiation
H. Tanimoto, Y. Koda, T. Yamada, S. Sakai, H. Mizubayashi,N. Ishikawa*, Y. Chimi* and A. wase*Institute of Materials Science, University of Tsuk-oba*Department f Materials Science, JAERl
1. Introduction the p-Au, espectively, The 2MeV electron
When the uhrafine particles are irradiation wa's arried out at 10 by using the
mechanically consolidated, the highly 3MeV single-ended electrostatic accelerator of
disordered grain boundaries (GBs) can be TLA&A, JAERL The anelasticity measurement
formed to accommodate the neighboring wa's performed by the flexural vibrating-reed
ultrafine crystallites� Characteristic properties method, where the eonant frequency, f, and
of the narrocrystalline (n-) metals prepared internal friction, Q", were measured by us ing
through such an athernial process may be the specially designed cry6stat during and after
associated with the disordered GBs as well. as an irradiation.
increased volume fraction of the GB regions').
By the progress in technique, the n-metals with 3. Results and Discussion
the density more than 98 of the bulk density Figure shows the strain amplitude, F,,
have been prepared. Surprisingly, the moduli dependence (SAD) in the Young's modulus
measured for the pore- and contamination-free observed for n-Au before and after irradiation.
ri-inetals are found to be very close to those of It is noted that f2 is proportional to Young's
the conventional polycrystalline (p-) metals, modulus, E, In te range in between 10-6 to 2
suggesting that the local density of the GB x 1074 as shown i Fig. 1, E of n-Au. at 6 K shows
regions in the ii-inetals is not so different from a decrease by about I with increasing
the bulk density2-4). On the other hand, very Not shown here but the internal friction, Q-1,
recently, the interesting anelastic response is shows a slight increase for b ow I x 10-3 .
found for the high-density ii-metals. For n-Au These SADs of E and Q-' are characteristically
specimens prepared by the gas deposition observed for n-Au. After 2MeV electron
method4), the strong anelastic strain due to a irradiation, the unique SADs of n-Au remained
certain GB process can be observed above 200 unchanged.
K5). In order to modify the GB state and its In contrast, a large increase in f was found
effect on the elastic property, anelasticity during the low-temperature irradiation. Figure
measurement was conducted for the high- 2 depicts the ormalized change in f at 6 K
density n-Au irradiated by electron at low- observed during the irradiation, where the
temperature. Frenkel-pair concentration was estimated from
the electron dose. It is known that the
2. Experimental Procedure frequency shows a slight decrease by the
The high-density n-Au specimen was accumulation of the radiation defects (the bulk
prepared by the gas-deposition method4). The effect), and the changing rate per unit Frenkel-
mean grain size and the density of the specimen pair concentration is reported to be about 10 for
used were about 20 nm and more than 99 of the low-temperature electron irradiation of
- 193 -
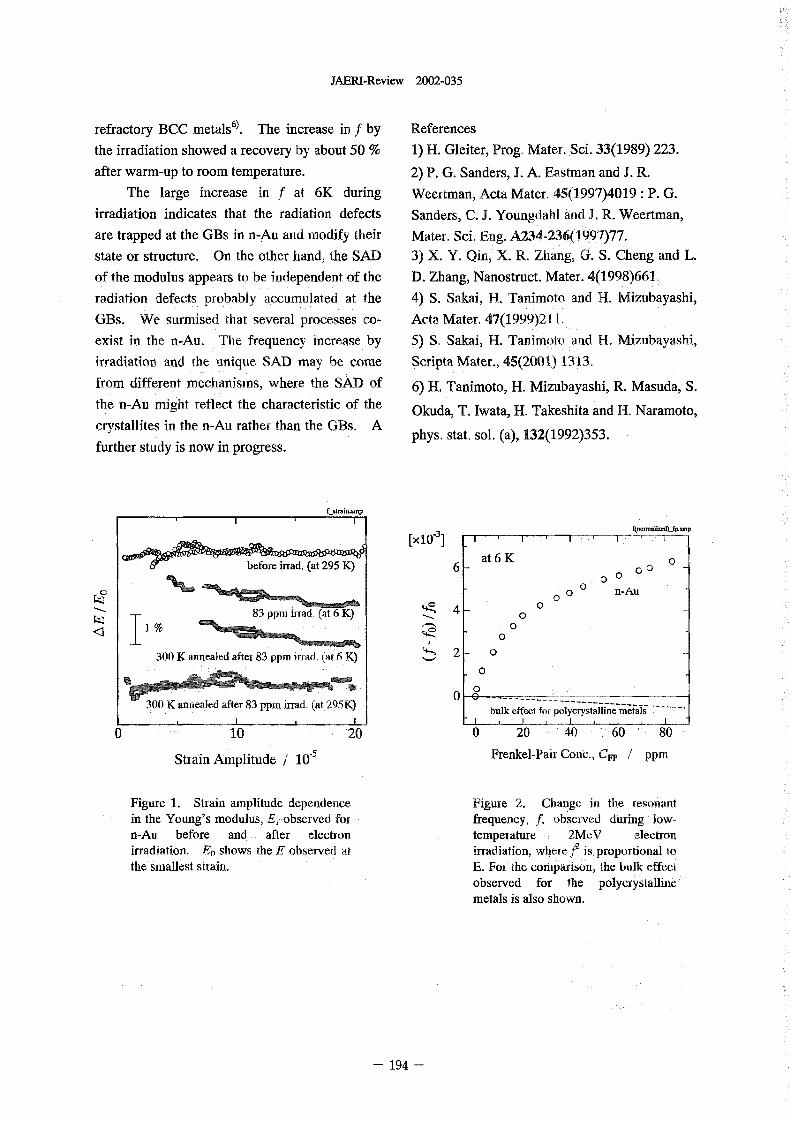
JAERI-Review 2002-035
refractory BCC metals6), The increase in f by References
the irradiation showed a recovery by about 50 % 1) H. Gleiter, Prog. Mater. Sci. 33(1989) 223.
after warm-up to room temperature. 2) P. G. Sanders, J. A. Eastman and J. R.
The large increase in f at 6K during Weertman, Acta Mater, 45(1997)4019: P. G.
irradiation indicates that the radiation defects Sanders, C. J. Youngdahl and J I R. Weertman,
are trapped at the GBs in n-Au and modify their Mater. Sci. Eng, A234-236(1997)77.
state or structure. On the other hand, the SAD 3) X. Y. Qin, X. R. Zhang, G. S. Cheng and L.
of the modulus appears to be independent of the D. Zhang, Nanostruct. Mater 41998)661.
radiation defects probably accumulated at the 4) S. Sakai, H. Tanimoto and H. Mizubayashi,
GBs. We surmised that several processes co- Acta Mater, 47(1999)21 .
exist in the n-Au. The frequency increase by 5) S. Sakai, H. Tanitnoto and H. Mizubayashi,
irradiation and the unique SAD may be come Scripta Mater., 45(2001) 1311
from different mechanisms, where the SAD of 6) H. Tanimoto, H. Mizubayashi, R. Masuda S.
the n-Au might reflect the characteristic of the Okuda, T. Iwata, H. Takeshita and H. Naramoto,
crystallites in the n-Au rather than the Bs A phys. stat, sol. (a), 132(1992)353.
further study is now in progress.
CsUainzMP
qn-.Ji.4_fp.-p[X10-31
6 at 6 K 0
0 0 0161 0 n-Au
4F 4 083 ppm ioad (at 6 K) 0
< % 0 0
2 - 0300 K annealed after 83 pm irfad. (at 6 K)0
VA
0annealed after 83 ppm irrad. (at 295K) affine metals
bulk efi�;t for 0�;;It
0 10 20 0 20 40 60 80
Strain Amplitude J 10-5 Frenkel-Paii Couc�, CH PPM
Figure 1. Sain aplitude dependence Figure 2. Change in the resonantin the Young's modulus,,E, observed for frequency, f, ob�erved during ow-n-Au before and after electron temperature 2MeV electronirradiation, Eo shows the observed at irradiation, wheref is proportional tothe smallest strain. E. For the comparison, the bulk effect
observed for the polycrystallinemetals is also shown.
- 194 -
JAERI-Review 2002-035
4.25 ESR CHARACTERIZATION OF ACTIVATION OFIMPLANTED PHOSPHORUS IONS IN SILICON CARBIDE
J. Isoya', N. Mizuochi', T. Ohshima", A. Ohi", N. MOTishita", H. Itoh**
University of Library and Information Science', Departmnt of Material Development,
JAERI**
1. Introducttion growth, phosphorus acts as a shallow donor'). TO
Silicon carbide (SiQ is a promising improve the doping efficiency by varying the
material for electronic devices of high- conditions of phosphorus ion implantation and
frequency, high-power, high-temperature those of post-implantation annealing,
applications and for those used in a harsh microscopic characterization of implanted
environment. One of key issues for realizing phosphorus ions as well as those of
SiC devices is to establish the technology of the implantation-induced defects is important.
selective area doping. In SiC, due to the Electron spin resonance (ESR) is a powerful tool
difficulty of doping by thermal diffusion, ion of characterizing impurities and defects of low
implantation is a potential method of concentrations by supplying detailed structural
introducing dopant atoms in the device information of atomic level. We have applied
fabrication. In the case of silicon, ion ESR method to elucidate at microscopic level
implantation is successfully used for doping the thermal behaviour of implanted ions and
in LSI technology, since the implants are radiation damages. Both megaelectronvolt 9-21
easily driven to the required site and since MeV) and kiloelectronvolt (340 keV)
the crystallinity is easily recovered by phosphorus ion implantations of 6H-SiC have
annealing. Ion implantation -doping of SiC is been studied.
much more complicated than that of silicon, 2. Experiments
since the amorphization of the implanted layer Samples used were n-6H-SiC crystals
need to be prevented and since some of radiation (Nippon Steel Corp., NA-ND=_10`crn-'). For
damages and secondary defects produced by each of high-energy implantations (implantation
annealing including the implant-defect (vacancy, temperature: 800'C and 1200T) a rectangular
interstitial)-complexes might be stable up to plate 3 mmx10 mrnxi.5 mm) was irradiated
rather high temperatures. Thus, selection of the using a 3 MV tandem accelerator with
implantation conditions and that of the post- phosphorus ions x 1013 CM-2 at each of 9 stages
implantation annealing conditions (annealing of energy between 9 and 21 WV). For the
temperature, -annealing time) are critically implantation of 340 keV phosphorus ions with
important to reduce the radiation damages and to the total dose of 2x10"cm-" at 800'C,
drive the implant into the required attice site. rectangular plates 3 mmx10 mmxO.22 mm)
In addition to nitrogen, which is were used. All implantations were carried
unintentionally incorporated during the crystal out along the [00011 axis.
195 -
JAM-Review 2002-035
The ESR spectra were recorded o a The small isotropic part of the 3'P hyperfine
Bruker ESP300 X-band spectrometer by interaction indicates that the wave function of
using an Oxford Instrument ESR-900 to the unpaired electron is weakly localized on the
control the sample temperature. For ESR phosphorus atom (the spin density on the
measurements of the thick samples, a single phosphorus: 0.015 and 0014 for P. and P,,
plate glued on a high-purity silica-glass rod respectively). These features are expected for
was used. The ESR signal of Cr" in a single isolated phosphorus shallow donors. The P, and
crystal of ruby comounted with the sample Pb spectra were originally observed in 6H-SiC in
was used as the reference of the spin which phosphorus had been introduced by
concentration, The signal intensity was neutron transmutation of Si ),3). In the crystal
estimated by double integration of the first lattice of 6H-SiC, there are three inequivalent
derivative signal, For ESR measurements of sites (a hexagonal site h and two cubic sites k,
the thin samples, 4 slices were stacked into and 2) for each of silicon and carbon. The P,
a sample tube of high-purity silica glass. and Pb spectra were identified to be originating
3. Results and Discussion from the isolated shallow phosphorus donors an
To characterize the electric activation of cubic silicon SitCS4). ESR spectrum from the
phosphorus ions at microscopic level, it is isolated shallow phosphorus donor on hexagonal
critically important to observe the ESR signals silicon site, which is likely to be hidden
from the phosphorus shallow donors in which underneath the strong signals of the nitrogen
the phosphorus atoms are driven into the shallow donors, has not been reported.
required lattice site. In the ESR method, The P, and Pb spectra were not observed
identification of phosphorus related centers, for before the annealing at 1650'C. The amount of
both phosphorus in the shallow donor state and P, and P,, were similar among three samples,
phosphorus involved in paramagnetic defects sample A which was annealed at 1650'C 30
such as phosphorus-vacancy complexes, is min.) after implantation at 1200'C, sample
based on the observation of hyperfine which was annealed at 1650'C 3 in.) after
interaction of 3p nucleus 11/2, natural implantation at 1200'C, and sample C which
abundance 100%). was annealed at 1650'C (30 min.) after
The ESR spectrum of n-6H-SiC which was implantation at 800'C, In samples and C, the
annealed at 1650'C (30 min.) after the ESR signals of phosphorus-vacancy complexes
implantation of the high energy phosphorus ions 2),3) were observed, The ratio of the isolated
at 1200'C is shown in Fig.l. Each of two shallow phosphorus donors (the sum of P, and
spectra labeled P, and Pb consists of two-lines Pb) relative to the amount of the implanted
arising fom 31.p hyperfine structure. The angular phosphorus ions is estimated to be -0.01. It is
dependence of the line positions of P, and P, is likely that most of the phosphorus ions
shown in Fig.2. The ESR parameters obtained implanted are captured by defects which are not
are listed in Table 1. For both P. and Pb, the ESR-active.
anisotropy of the hyperfine splitting is small. The Pa and Pb spectra in our samples were
196 -
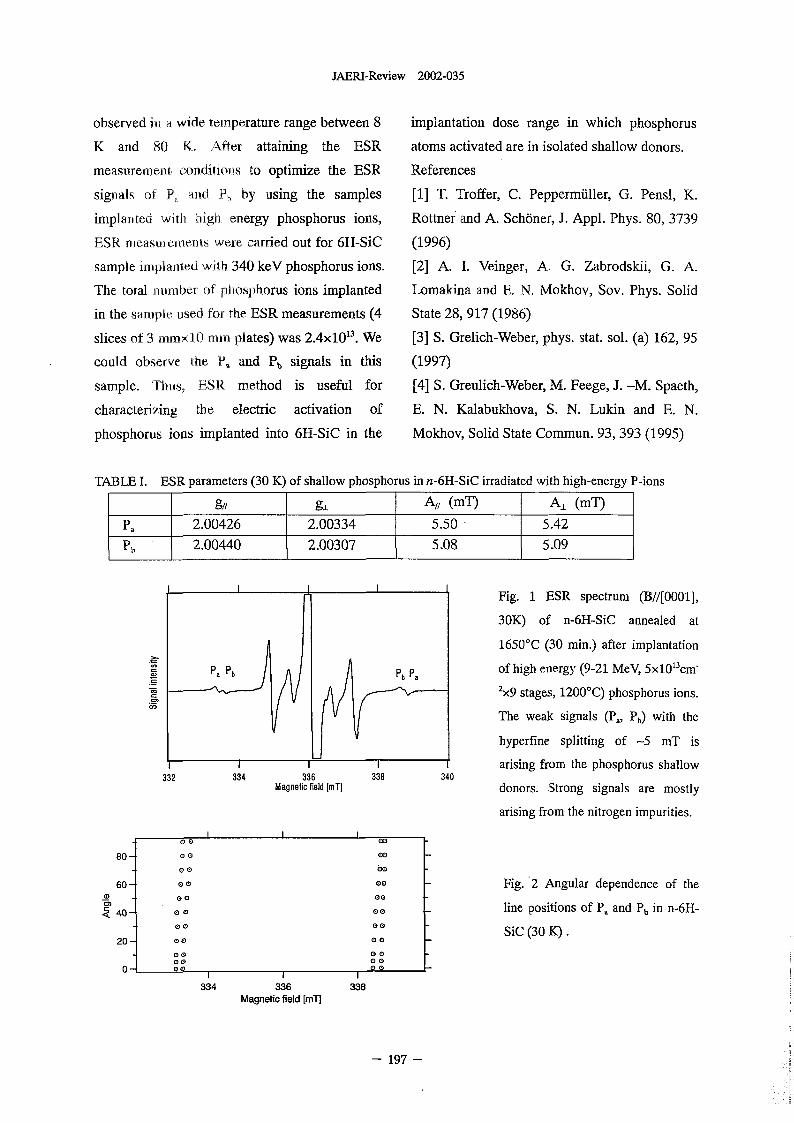
JAERI-Review 2002-035
observed in a wide temperature range between implantation dose range in which phosphorus
K and 80 K� After attaining the ESR atoms activated are in isolated shallow donors.
measurement, onditions to optimize the ESR References
signals of P a P by using the samples [1] T. Troffer, C. Peppermfiller, G. Pensl K.
implanted with high energy phosphorus ions, Rottner'and A. Sch6ner, J. Appl. Phys. 80, 3739
ESR leaSUreMeDtS were carried out for 611-SiC (1996)
sample iplanted with 340 keV phosphorus ions. [2] A. 1. Veinger A G. Zabrodskii, G. A.
The total Sir of posphorus ions implanted Lomakina and E N. Nokhov, Sov. Phys. Solid
in the ampl ued for the ESR measurements 4 State 28, 917 1986)
slices of 3 mrnxlO into plates) was 2.4xlO". We [3] S. Grelich-Weber, phys. stat. sol. (a) 162 95
could observe the P., and Pb signals in ts (1997)
sample. Thus, ESR method is useful for [4] S. Greulich-Weber, M. Feege, J. -M. Spaeth,
characterizing the electric activation of E. N. Kalabukhova, S. N. Lukin and E. N.
phosphorus ions implanted into 6H-SiC in the Mokhov, Solid State Commun. 93, 393 1995)
TABLE 1. ESR parameters 30 K) of shallow phosphorus in n-6H-SiC irradiated with high-energy P-ions
g// 91 A# (mT) A, (mT)
pi, 2�0_0426 2.00334 5.50 5.42
PI, 2.00440 2.00307 5.08 5.09
Fig. ESR spectrum (BH[0001],
30K) of n-6H-SiC annealed at
1650'C 30 min.) after implantation2.-
P, Pb of high energy 9-21 MeV, 5x 10¹³CM-
2x9 stages, 1200'C) phosphorus ions.
The weak signals (P,,, N with the
hyperfine splitting of -5 mT is
I arising from the phosphorus shallow332 334 336 338 340
Magnetic field mT] donors. Strong signals are mostly
arising from the nitrogen impurities.
- 0080- 00 co
- 00 60
60- 0 ) 00 Fig. 2 Angular dependence of thea) - 0 0 00
40- 0 00 line positions of P. and P, in n-6H-
0 0 00 SiC 30 K).20 - 00 00
00 0 000 00
0-- 00
334 336 338
Magnetic field [mll
- 197

This is a blank page.
JAERI-Review 2002-035
5. Material Analysis
5.1 Fast Difftision of Defect Clusters Copper under rradiation with 10-keV
Carbon Ions ........................................................ 201
H. Abe and N. Sekimura
5.2 In-situ Observation of Growth Processes of Transition Metal Nitri'de
Thin Films by Nitrogen-implantation ..................................... 203
Y. Kasukabe, Y. Fujino, S. Saito, Y. Yamada and H. Abe
5.3 Preparation of Epitaxial Anatase T102 Fms by Pulsed Laser Deposition .......... 206
S. Yamamoto, T. Sumita, T. Yamaki, A. Miyashita, H. Itoh and H. Naramoto
5.4 Fabrication of Titanium Dioxide Nanoparticles on Sapphire .................... 208
Y. Choi, S. Yamamoto, H. Abe and H. Itoh
5.5 Development of High Perforinance Buffer Materials
-Sorption Mechanism of Europiurn. by Smectite . .......................... 211
T. Ohnuki, N. Kozai, S. Yamamoto, K. Narumi, H. Nararnoto and H. Isobe
5.6 Electron Emission from Solids by Fast Cluster Impact ........................ 214
H. Kudo, W. Iwazaki, T. Suguri, Y. Saitoh, S.Yamarnoto, K. Narumi and
H. Naramoto
5.7 Improvement Surface Roughness of Nitrogen-implanted Glassy
Carbon by Hydrogen Dopi 11 ......................................... 217
K. Takahiro, R. Ookawa, K. Kawatsura, S. Nagata, S. Yamamoto, K.Narumi and
H. Naramoto
5.8 In-situ Analysis on Adsorption and Desorption of Atoms at Liquid-solid Interface by
Use of Rutherford Backscattenng Spectroscopy ............................. 220
J. Yuhara, H. Suzuki, K. Soda, K. Morita, S. Yamamoto, K. Narumi,
H. Naramoto and K. Saito
5.9 Percolation of Liquid Indium. through Porous Media Compos ofNi and C60 ......................................................... 222
H. Naramoto, J. Vacik, K. Narumi, K. Miyashita and Y. Homna
5.10 AFM Observation of Nano-sized SiC Dots Prepared by Ion Beam
Deposition Method .................................................. 225
Y. Xu, K. Naruri, K. Miyashita and H. Naramoto
5.11 Encapsulated Structure in C-C60 System ................................. 228
V. Lavrentiev, H. Naramoto, K. Narumi, S. Yamamoto, H. Abe and K. Myasita
5.12 Structure and Optical Properties of Go Implanted with Carbon Ions .............. 231
P. Wei, Y. Xu, S. Nagata, K. Narunu and H. Naramoto
5.13 Study of Improvement of Ion Irradiation I'd Using a Slow Positron Beam ......... 234
H. Abe, H. Uchida, Y. Azuma, A. Uedono Z. Q. Chen and H. Itoh
5.14 Anomalous Chemical Bond Formation Polycarbonate by Cluster Impact ........ 237
K. Hirata, Y. Saitoh, K. Narumi, Y. Kobayashi and K. Arakawa
199
JAERI-Review 2002-035
5.15 Evaluation of Three.13knensional Microstructures on Silica Glass Fabricated by
Ion Microbeam .............................. i...................... 240
H. Nshikawa, T. Souno, M. Hatton', Y. Ohki, T. Yamaguchi, E. Watanabe,
M. Oikawa, T. Kamiya, K. Arakawa and M. Fjimaki
5.16 Uptake of Heavy Metals by Synthetic Mica and Apatite ....................... 243
N. Kozai, T. Olinuki, S. Komameni, T. Kamiya, T. Sakai, S. Oikawa and T. Sato
200 -
JAM-Review 2002-035
5.1 Fast Diffusion of Defect Clusters in Copper under
Irradiation with 100-keV Carbon Ions
Hiroaki Abe and Naoto Sekimura*
Nuclear Engineering Research Laboratory, University of Tokyo,
Shirakata Shirane 222, Tokai, Naka, baraki 319-1188, Japan
Department of Quantum Engineering and Systems Science, University of
Tokyo, Hongo, 73-1, Bunkyo, Tokyo 113-8656, Japan
1. Introduction
Irradiation with ions and 2. Experimental Procedure
neutrons produces bunches of atomic Well-annealed copper disks were
displacements in materials, so-called electrochemically perforated to achieve
displacement cascades. Recent -studies electron-transparent thin foils. They
with molecular dynamics (MD) were, then, irradiated with 100 keV
simulations predicted punching of tiny carbon ions at temperatures from 570 to
interstitial-type dislocation loops at the 1070 K in an electron microscope
periphery of displacement cascade interfaced, with an ion accelerator.
regions in iron and copper. Their Microstructural. evolution was
activation energies of diffusion were simultaneously observed and
estimated less than 0.1 eV Transmission videotaped.
electron microscopic (TEM) observations
were done after irradiations but no clear 3. Results and Discussion
evidence has been derived yet, probably Tiny defect clusters (less than 0
because they are active only under nm in size) were formed by ion
irradiation. Therefore, neither their irradiation, whose accumulation rate
lifetime nor impurity effect is clarified. correlated with irradiation time.
The purpose of this study is to report Majority of them were vacancy- type
first experimental evidence of such clusters including stacking fault
highly-mobile defect clusters by in-situ tetrahedra. Continuous irradiation
TEM observations under ion irradiation annihilated them with lifetime ranging
and to clarify the defect-impurity from 0. 1 to 3 s. In addition to such
interactions. clusters, we observed highly-mobile
- 201 -
JAERI-Review 2002-035
clusters only during irradiation, which
.are, compared with MD simulations,
presumably interstitial dislocation loops
consisting of crowdions
one-dimensionally diffusing along the
crowdion direction. Interesting to note is
that they moved back-and-forth because
of surface mirror effect, well-known in
dislocations close to surface. The clusters
occasionally disappeared when they
absorb enough vacancies.
TRIM calculations indicated
roughly 20 O less of irradiated ions
remained in the samples. As increasing
ion fluence, we observed decrease in
evolution rate of defect clusters both
vacancy- and interstitial-type, longer
lifetime of te clusters, and lower
mobility of the interstitial loops. Unless
carbon is one of interstitial-type
impurities in copper, it may substitute or
strongly-bonded with vacancies
resulting retardation of diffusion of
vacancies and even mobile clusters.
202 -
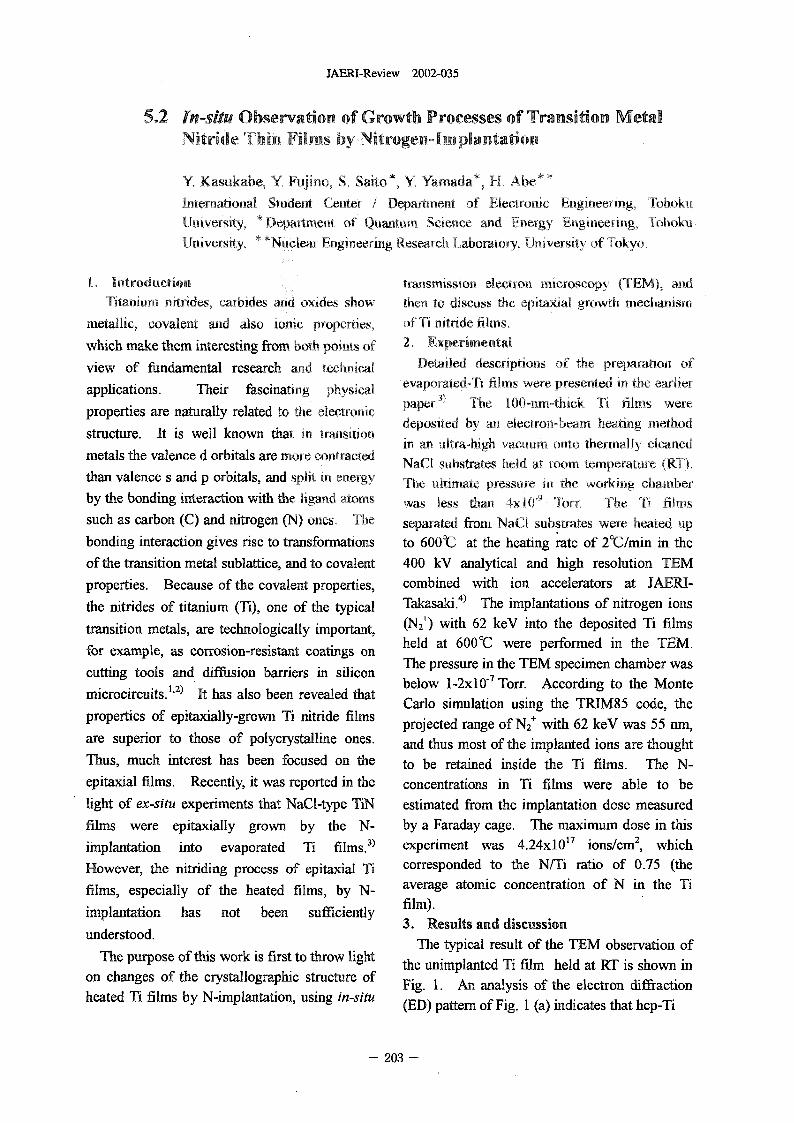
JAERI-Review 2002-035
5.2 n-situ Observation of Growth Processes of Transition MetalNitride Thin Films by Nitrogen-Implantation
Y. asukabe Y Fujino, S Sito*, Y, Yamada*, 1-1,, Abe`
International Student Cter Department of Nectronic Engineering, TohokitUniversity, Department of Quantum Snce and Eno-rgy Engineering, TohokuUniversity, 'Nuclear Engineering Research Laboratory, Uiversity of Tokyo,
t. Introduction transmission electron microscopy T) adTitanium mtrides. carbides and oxides show then to discuss the opitaxial rowth mechanism
metallic, covalent ad also Ionic properties, of Ti nitride films.
which make them interesting from both points of 2. Experimental
view of fundamental research and technical Detailed descriptions of the preparatio of
applications. Their fascinating physical evaporated-Ti films were pesented it) the earlier
properties are naturally related to the eectronic paper.3) The 100-imi-thick Ti films weredeposited y a oloctroo-beam heating method
structure. It is well known that in transition in an ultra-high vacuum oto thermally cleaned
metals the valence d orbitals are move contracted NaCt sbstrates held at oom temperature (RT).
than valence s and p orbitals, and split in eDergy The ultimate pressure i the working camber
by the bonding interaction with the ligand atoms was less tan 410-9 Torr. The Ti films
such as carbon (C) and nitrogen (N) ones, Te separated from NaCt substrates were heated tip
bonding interaction gives rise to transformations to 600-C at the heating rate of 2C/min in the
of the transition metal sublattice, and to covalent 400 kV analytical and high resolution TEM
properties. Because of the covalent properties, combined with ion accelerators at JAERI-
the nitrides of titanium (Ti), one of the typical Takasaki .4) The implantations of nitrogen ions
transition metals, are technologically important, (N2') with 62 keV into the deposited Ti films
for example, as corrosion-resistant coatings on held at 6009C were performed in the TEM.
cutting tools and diff-usion barriers in silicon The pressure in the TEM specimen chamber was1.2 below 1-2xlO -7 Torr. According to the Monte
microcircuits. It has also been revealed that Carlo simulation using the TRIM85 code, the
properties of epitaxially-grown Ti nitride films projected range of N2' with 62 keV was 5 rn,are superior to those of polycrystalline ones. and thus Most Of the implanted ions are thought
Thus, much interest has been focused on the to be retained inside the Ti films. The N-
epitaxial films. Recently, it was reported in the concentrations in Ti films were able to be
light of ex-situ experiments that NaCl-type TiN estimated from the implantation dose measured
films were epitaxially grown by the N- by a Faraday cage. The maximum dose thisimplantation into evaporated Ti films.') experiment was 4.24x 10¹⁷ ionS/CM2, which
However, the nitriding process of epitaxial Ti corresponded to the N/Ti ratio of 075 (the
films, especially of the heated films, by N- average atomic concentration of N in the Tifilm).
implantation has not been sufficiently 3. Results and discussion
understood. The typical result of the TEM observation of
The purpose of this work is first to throw light the unimplanted Ti film held at RT is shown inon changes of the crystallographic structure of Fig. 1. An analysis of the electron diffractionheated Ti films by N-Implantation, using in-situ (ED) pattern of Fig. I (a) indicates that hp-Ti
203 -
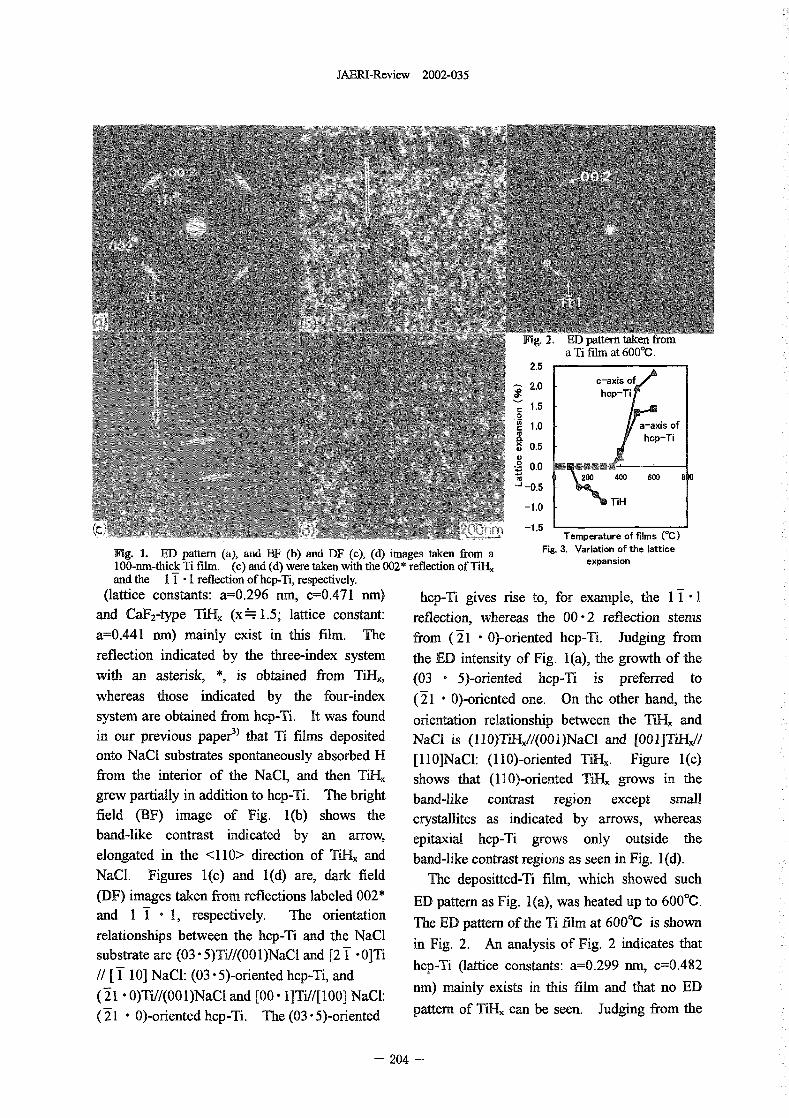
JAERI-Review 2002-035
a Ti at 6000C.2.5
2.0 --Zi ofh Ti1.5
.2sof
M hcp-Ti0.5
0.0200 400 60'0 8
-0.5
-1.0 TH
Temperature of films )Mg. 1. ED pattern (a), ad B (b) and D (c), (d) images taken from a Fig. 3 Variation of the lattice100-mn-thickTifilm. (c)and(d)weretakenwiththeOO2*reflectionofTiH,, expansionand the I T I reflection of hp-Ti, respectively.
(lattice constants: a0.296 nm, c=0.471 nm) hcp-Ti gives rise to, for example, the I Iand CaF2-type TiHx (x--'. 1.5; lattice constant: reflection, whereas the 00 - 2 reflection stemsa--0.441 nm) mainly exist in this film. The from ( 21 0oriented hp-Ti. Judging from
reflection indicated by the three-index system the ED intensity of Fig. I(a), the growth of thewith an asterisk, *, is obtained from TiHx, (03 5)-oriented hcp-Ti is preferred to
whereas those indicated by the four-index (21 0oriented one. On the other hand, the
system are obtained from hp-Ti. It was found orientation relationship between the TiHx andin our previous paper') that Ti films deposited NaCl is 110)TiH,,//(OOI)NaCl and [OOI]TiH,,//onto NaCl substrates spontaneously absorbed H [110]NaCl: 110)-oriented TiH.. Figure I(c)from the interior of the NaCl, and then TiHx shows that 110)-oriented TiHx grows in the
grew partially in addition to hp-Ti. The bright band-like contrast region except smallfield (BF) image of Fig. Ib) shows the crystallites as indicated by arrows, whereasband-like contrast indicated by an arrow, epitaxial hcp-Ti grows only outside the
elongated in the <110> direction of TiHx and band-like contrast regions as seen in Fig. I d).NaCl. Figures I(c) and l(d) are, dark field The depositted-Ti film, which showed such
(DF) images taken from reflections labeled 002* ED pattern as Fig. I (a), was heated up to 6OO'C.and I 1, respectively. The orientation The ED pattern of the Ti film at 6OO'C is shown
relationships between the hp-Ti and the NaCl in Fig. 2 An analysis of Fig. 2 indicates thatsubstrate are 03 -5)Ti//(00 I)NaCl and 2 - i hcp-Ti (lattice constants: a0.299 mn, c=0.482
H IO] NaCl: 03 5)-oriented hp-Ti, and nm) mainly exists in this film and that no ED
( 21 - )Tif/(00 I)NaCl and [00 I Ti// I 00] NaCl: pattern of TiHx can be seen. Judging from the( 21 0oriented hcp-Ti. The 03 5)-oriented
_204 -
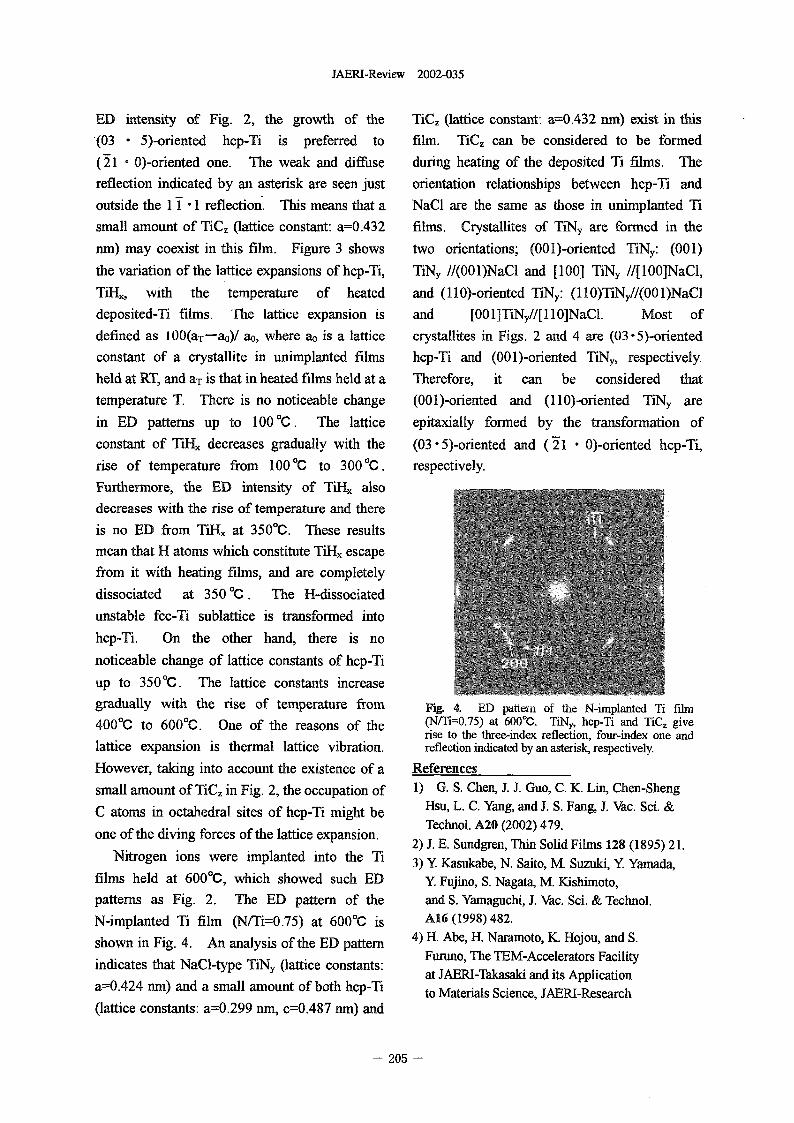
JAERI-Review 2002-035
ED intensity of Fig. 2 the growth of the TiC, (lattice constant: 0.432 m) exist in this
(03 - 5)-oriented hcp-Ti is preferred to film. TiC. can be considered to be formed
(D 0-oriented one. The weak and diff-use during heating of the deposited Ti films. The
reflection indicated by an asterisk are seen just orientation relationships between hp-Ti and
outside the I - I reflection. This means that a NaCl are the same as those in unimplanted Ti
small amount of TiC,. (lattice constant: a0.432 films. Crystallites of TiNy are formed in the
nm) may coexist in this film. Figure 3 shows two orientations; 001)-oriented TiNy: (001)
the variation of the lattice expansions of hcp-Ti, TiNy H(OOI)NaCl and [100] TiNy H[100]NaCl,
TiHx, with the temperature of heated and 110)-oriented TiNy: 110)TiNy//(OOI)NaCl
deposited-Ti films. The lattice expansion is and [00lJTiNyH[ll0JNaCl. Most of
defined as 100(aT-ao)/ ao, where ao is a lattice crystallites in Figs. 2 and 4 are (03-5)-oriented
constant of a crystallite in unimplanted films hcp-Ti and 001)-oriented TiNy. respectively.
held at RT, and aT is that in heated films held at a Therefore, it can be considered that
temperature T. There is no noticeable change (001)-oriented and (110)-oriented TiNy are
in ED patterns up to 100'C. The lattice epitaxially formed by the transformation of
constant of H,, decreases gradually with the (03 - 5)-oriented and 21 0oriented hcp-Ti,
rise of temperature from 1000C to 3000C. respectively.
Furthermore, the ED intensity of TiH,, also
decreases with the rise of temperature and there
is no ED from TiH. at 350'C. These results
mean that H atoms which constitute TiH. escape
from it with heating films, and are completely
dissociated at 350'C. The H-dissociated
unstable fcc-Ti sublattice is transformed into
hep-Ti. On the other hand, there is no
noticeable change of lattice constants of hp-Ti
up to 350'C. The lattice constants increase
gradually with the rise of temperature ftom Fig 4 ED pattern of the N-implanted Ti film4000C to 6000C. One of the reasons of the (N/Ti=0.75) at 6009C. TiNy, hcp-Ti and TiC, give
rise to the three-index reflection, four-index one andlattice expansion is thermal lattice vibration. reflection indicated by an asterisk, respectively.
However, taking into account the existence of a Referencessmall amount of TiC, in Fig. 2 the occupation of 1) G. S. Chen, J. J. Guo, C. K. Liri, Chen-Sheng
Hsu, L. C. Yang, and J. S. Fang, J. Vac. Sci. &C atoms in octahedral sites of hp-Ti might be Technol. A20 2002) 479.
one of the diving forces of the lattice expansion. 2) J. E. Sundgren, Thin Solid Films 128 1895 2 .
Nitrogen ions were implanted into the Ti 3) Y Kasukabe, N. Saito, M. Suzuki, Y Yamada,films held at 600'C, which showed such ED Y Fujino, S. Nagata, M. Kishirnoto,patterns as Fig. 2 The ED pattern of the and S. Yamaguchi, J. Vac. Sci. & Technol.
N-implanted Ti film (N/Ti--0.75) at 6000C is A16 1998) 482.shown in Fig. 4 An analysis of the ED pattern 4) H. Abe, H. Naramoto, K. Hojou, and S.
indicates that NaCl-type TiNy (lattice constants: Funino, The TEM-Accelerators Facility
a=0.424 nm) and a small amount of both hp-Ti at JAERI-Takasaki and its Applicationto Materials Science, JAERI-Research
(lattice constants: a0.299 nin, c=0.487 mn) and
- 205 -
JAERI-Review 2002-035
5.3 Preparation of Epitaxial Anatase T102FHms by PulsedLaser Deposition
S. Yamainoto, T. Surnita, T. Yainaki, A. Miyashita, H. Itoh, H. Naramoto*Department of Material Development, JAERIAdvanced Science Research Center, JAERI*
1. Introduction measurements using a high-resolutionTitanium dioxide (TiO2) photocatalyst has diffractometer (X'Pert-MRD, Philips). The
attracted much interest from the viewpoints of RBS/channeling analysis using 3 MVbasic science and applications. Thus, the single-stage-accelerator was employed tosynthesis -of high quality epitaxial TiO2 has characterize the epitaxial films.
been required to understand the transportationprocess of photo-activated electrons and holes 3. Results and Discussionin the surface layer. In the present study, we Fig. 1 shows the typical 020 x-rayperformed the growth of TiO2 films with diffraction patterns from the TiO2 film on theanatase structure by pulsed laser deposition (a) LaA103 (001), (b) LSAT (001), (c) SrTiO3(PLD) ith an A excimer laser under the (001) substrates, respectively. The films werecontrolled 0 atmosphere, Te effects of grown at 566'C and the film thickness wassubstrate and substrate temperature on film about 200 rm. In Fig 1. (a) to (c), only thequality were discussed. reflections from the anatase TiO2 004) and
(008) are observed without any reflection from2. Experimental the substrate, which indicates that the only
By considering the crystal tructure and the anatase TiO2 (00 1) films were epitaxially grownlattice misfit between 2 ad single crystal on the (00 1) plane of LaA103, LSAT, SrTiO3
substrates. For the substrate with differentsubstrate, we used a LaAlO3 (001). LSAT (01), orientations such as SrTiO3(1 10), LaA103 (110)
SrTiO3 (001) for aatase-TiO2. The PLD was substrate, the epitaxial anatase TiO2films wereused the ArF excimer laser (wavelength: 193 not grown. These films were polycrystalline andnm, pulse duration: 15 ns, repetitionrate: 10 Hz) were mixed with the anatase and ratile
with an incident angle of 45'. The average laser structures. The in-plane orientations of epitaxialenergy density was 150 mJ/cm2. The laser was films were examined through the pole figurefocused onto a titanium (purity: 99.99%) target measurement. Anatase TO2 (001) films on therotated continuously. Oxygen gas was flowed LaA103 (001), LSAT (001) and SrTiO3 (001)
into the growth chamber through a mass flowmeter to achieve the pressure about 6 X 10⁻³ have the fourfold symmetry and they matchTorr. The substrates temperature was changed well along their[ 001 analm and [100] ,�btr�,,
from 349 to 608'C. The crystallographic in-plane direction with small lattice isfit,
relationships between TiO2films and substrates 0 13 for LaA103, 214 for LSAT and
were determined by x-ray diffraction 3.06 %, for SrTiO3, respectively.
- 206 -
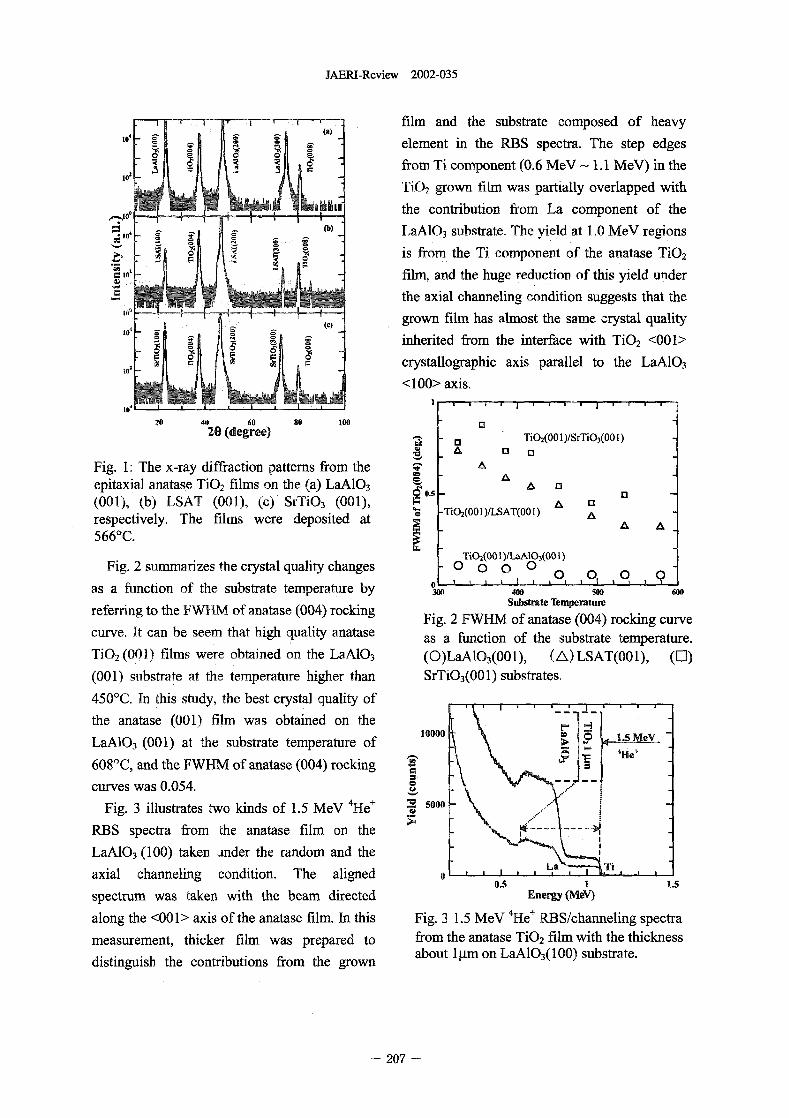
JAERI-Review 2002-035
film and the substrate composed of heavy
element in the RBS spectra. The step edges0
from Ti component 0.6 MeV - 11 MeV) in the
T102 grown film was partially overlapped with
the contribution from La component of the
(b) LaA103 substrate, The yield at 1.0 MeV regions
is ftorn the Ti component of the anatase TiO2F
film, and the huge reduction of this yield under
the axial channeling condition suggests that the
le) grown film has almost the same crystal quality
inherited from the interface with TiO2 001>
crystallographic axis parallel to the LaA103102 <100> axis.
WAR 1 ---- r ---- I
20 40 60 80 100
20 (degree) - TiO2(00 1/SrTiO3(00 1)
Q
Fig. 1: The x-ray diffraction patterns from the q AC, Aepitaxial aatase TiO2 films on the (a) LaA103 S A 13.4 0.5 (001), b) LSAT (001), () SrTiO3 (001), P 13
respectively. The films were deposited at 0 -�2kVVA)/LSAT(O I)
5660C.MAO 1)/LaAI03(001)
Fig. 2 summarizes the crystal quality changes 0 0 0 0 0 0 I 00 --- L --- L___L --- , I
as a function of the substrate temperature by 3W 4W SW W
referring to the FVv'HM of anatase 004) rocking Substrate Temperature
curve. It can be seem that high quality aatase Fig. 2 FWHM of anatase 004) rocking curveas a function of the substrate temperature.
TiO2 (001) films were obtained on the LaA103 (O)LaAI03(001), (A)LSAT(OOI), (0)(001) substrate at the tmperature higher than SMOA001) substrates,
450'C. In this study, the best crystal quality of
the anatase (001) film was obtained on the10000
LaA103 (001) at the substrate temperature of >lie,
608-C, and the FVVRM of anatase 004) rocking
curves was 0054.4 + LO 5000Fig. 3 illustrates two kinds of 1.5 MeV He CD
RBS spectra from the anatase film on the --- ----- >11
LaA103 (100) taken under the random and the
axial channeling condition. The aligned0.5 is
spectrum was taken with the beam directed Energy (Mev)
along the <00 I> axis of the anatase film. In this Fig. 3 1.5 MeV 4 He+ RBS/channeling spectra
measurement, thicker film was prepared to from the anatase Ti02film with the thicknessdistinguish the contributions from the grown about I gm on LaA103(100) substrate.
207 -
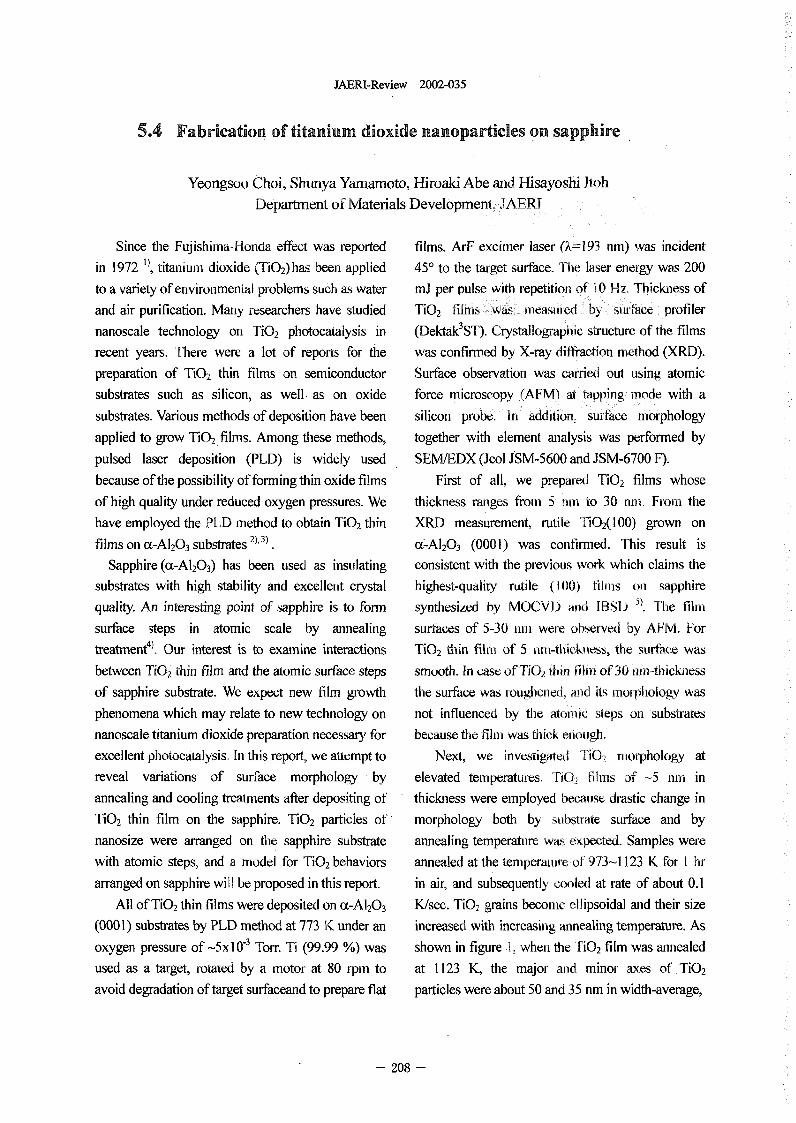
JAERI-Review 2002-035
5.4 Fabrication of titanium dioxide nanoparticles on sapphire
Yeongsoo Choi, Shiinya Yamamoto, Hiroaki Abe and Hisayoshi RohDepartment of Materials Development, JAERT
Since the Fujishima-Honda effect was reported films. ArF excimer laser (�,=193 nm) was incidentin 1972 1), titanium dioxide (TiO2)has been applied 451 to the target surface. Te laser energy was 200to a variety of environmental problems such as water mJ per pulse with repetition of IO Hz. Th ickness ofand air purification. Many researchers have studied TiO2 fms - as measured by surface profilernanoscale technology o T2 photocatalysis in (Dektak3ST). Crystallographic structure of the filmsrecent years. There were a lot of reports for the was confinned by X-ray diffraction method (XRD).preparation of 2 thin films on semiconductor Surface observation was carried out using atomic
substrates such as silicon, as well as on oxide force microscopy (AFM) at tapping, mode with a
substrates. Various methods of deposition have been silicon probe. In addition., surface morphology
applied to grow TiO2 films. Among these methods, together with element analysis was performed by
pulsed laser deposition (PLD) is widely used SEM/EDX Jeol J SM-5600 and JSM-6700 F).
because of the possibility of forming thin oxide films First of all, we prepared 2 films whose
of high quality under reduced oxygen pressures. We thickness ranges fom 5 nin to 30 nrn. Fom the
have employed the PLD rnethod to obtain O2 thin XRD measurement, rutile T2(100) grown on
films o aA1203 substrate 23). a-A]203 (0001) was confirmed. This result is
Sapphire(cc-AI203) has been used as insulating consistent with the previous work which claims the
substrates with high stability and excellent cystal highest-quality ruble (100) films o sapphire
quality. An interesting point of apphire is to form synthesized by MOCVD a BSD 5). Te film
surface steps in atomic scale by annealing surfaces of 530 rn were observed by AFM. For
treatmene). Out interest is to examine interactions TiO2 tin film of nni-thickriess, the srface was
between 2 thin film and the atomic surface steps smooth. In case of TiO tin folm of 30 n[r)-thickness
of sapphire substrate. We expect new film growth the surface was oughened ad its orphology was
phenomena which may relate to new technology on not influenced by bie aomic steps o substrates
nanoscale titanium dioxide preparation necessary for because te fm was thick eough.
excellent photocatalysis, In this report, we attempt to Next, we investigated � orphology at
reveal variations of surface morphology by elevated temperatures, TiO, films of -5 nn in
annealing and cooling treatments after depositing of thickness were employed beouse drastic change in
TiO2 thin film on the sapphire. TiO2 particles of morphology both by sstrate surface and by
nanosize were arranged on te sapphire substrate annealing temperature was expected. Samples were
with atomic steps, and a model for O2 behaviors annealed at the temperature of 973-1123 K for I r
arranged on sapphire will be proposed in this report. in air, and subsequently cooled at rate of about 0.1
All of TiO2 thin films were deposited on cc-AI203 K/sec. TO2 grains become ellipsoidal and their size
(000 I) substrates by PLD method at 773 K under an increased with increasing annealing temperature. As
oxygen pressure of -5x 03 Torr. Ti 99.99 %) was shown in figure I. when the TiO2 film was anealed
used as a target, rotated by a otors at 80 rprn to at 1123 K, the major and minor axes of TiO2
avoid degradation of target surfaceand to prepare flat particles were about 50 and 35 nm in width-average,
208 -
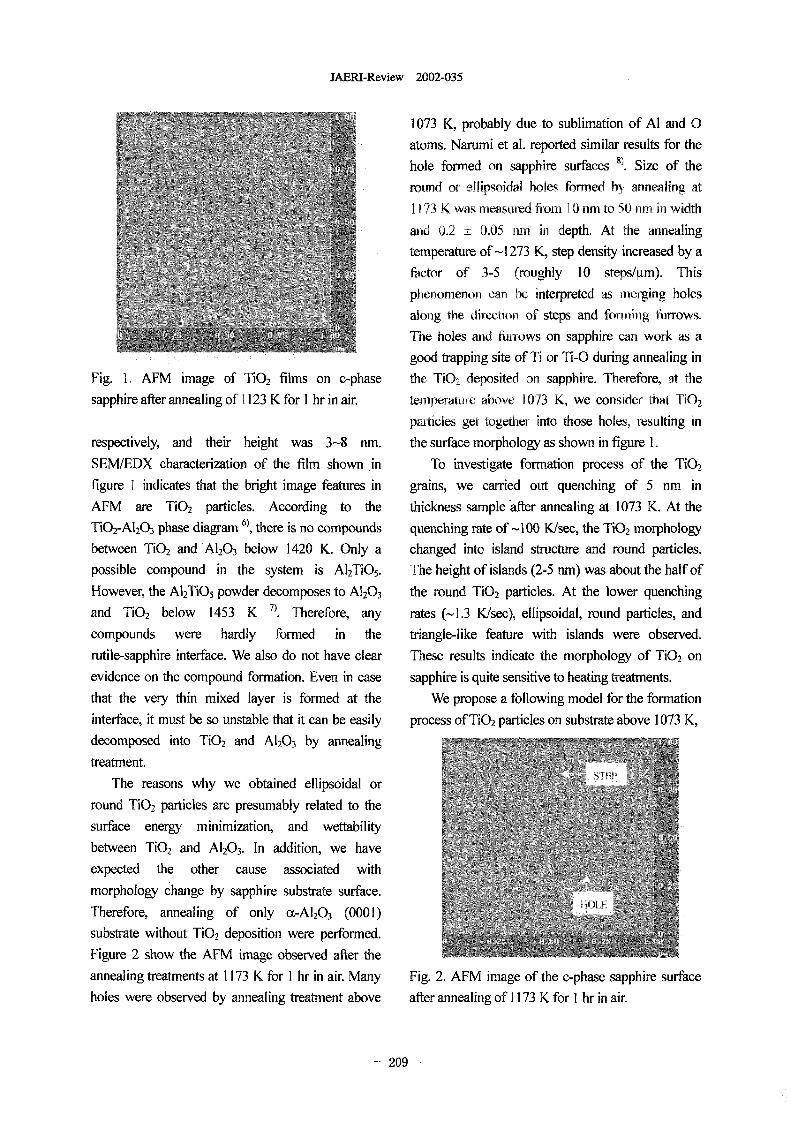
JAERI-Review 2002-035
1073 K probably due to sublimation of Al and
atoms. Narumi et al. reported similar results for the
hole formed on sapphire surfaces 8. Size of the
round or llipsoidal holes formed by annealing at
I 73 K was ineasured frorn I nm to 50 orn in width
and 02 ± 0.05 ivii iii depth. At the annealing
temperature of - 273 K step density increased by a
factor of 35 roughly 10 steps/4m). This
phenomenon can be interpreted as rnerging holes
along the directiovi of steps and forrnii)g fiirrows.
The holes ad ftwrows on sapphire can work as a
good trapping site of Ti or Ti-O during annealing in
Fig. . AFM image of 2 films on c-phase the TiO,, deposited on sapphire. herefore, at the
sapphireafterannealingof 1123Kforl hrinair. temperalure above 1073 K we consider that TiO2
particles get together into those holes, resulting in
respectively, and their height was 38 nm. the surface morphology as shown in figure .
SEM/EDX characterization of the film shown in To investigate formation process of the TiO2
figure I indicates that the bright image features in grains, we carried out quenching of nm in
AFM are TiO2 particles. According to the thickness sampleafter annealing at 1073 K. At the6)TiO2-A1203 phase diagram , there is no compounds quenching rate of -I 00 K/sec, the TiO2 morphology
between TiO2 and'A1203 below 1420 K. Only a changed into island structure and round particles.
possible compound in the system is A12TiO5- The height of islands 2-5 nm) was about the half of
However, the A12TiO5 powder decomposes to A1203 the round TiO2 particles. At the lower quenching
and TiO2 below 1453 K 7). Therefore, any rates (-1.3 K/sec), ellipsoidal, round particles, and
compounds were hardly formed in the triangle-like feature with islands were observed.
rutile-sapphire interface. We also do not have clear These results indicate the morphology of O on
evidence on the compound formation. Even in case sapphire is quite sensitive to heating treatments.
that the very thin mixed layer is formed at the We propose a following model for the formation
interface, it must be so unstable that it can be easily process of TiO2 particles on substrate above 1073 K,
decomposed into TiO2 and A1203 by annealingtreatment.
The reasons why we obtained ellipsoidal or
round TiO-, particles are presumably related to the
surface energy minimization, and wettability
between TiO2 and A1203- In addition, we have
expected the other cause associated with
morphology change by sapphire substrate surface.
Therefore, annealing of only a-Al2Q3 (0001)
substrate without TiO2 deposition were performed.
Figure 2 show the AFM image observed after the
annealing treatments at II 73 K for I hr in air. Many Fig. 2 AFM image of the c-phase sapphire surface
holes were observed by annealing treatment above after annealing of II 73 K for I hr in air.
- 209 -
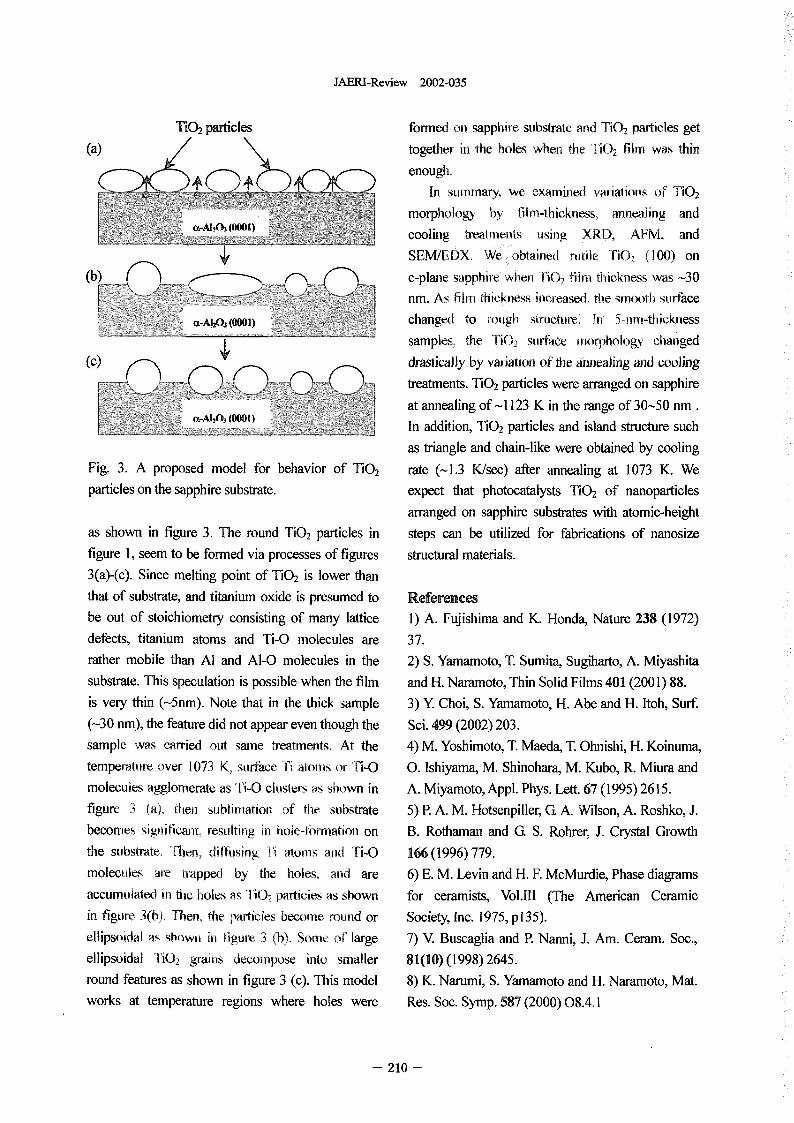
JAERI-Review 2002-035
TiO2 particles formed on sapphire substrate and TiO2 particles get
(a) togethe i the holes when the 2 film was thin
enough.
In summary, we emined variations of 2
morphology by film-thickness, annealing andaA]703 (0001) coolina treatments using XRD, AFM, and
SEM/FDX. We obtained Futile TiO, (100 on
c-plane sapphire When 2 fil tckness was 30
nm. As film thickness increased, the mooth srface
changed to rougli structure, In 5-rim-thicknesssamples, the -, srface orpholog cnged
drasticahy by variance) of he aimeafing and cooling
treatments. TiO2 particles were arranged on sapphire
at annealing of - 123 K in the range of 30-50 nm .
In addition, TiO2 particles and island structure such
as triangle and chain-like were obtained by cooling
Fig. 3 A proposed model for behavior of 2 rate (-1.3 K/sec) after annealing at 1073 K. We
particles on the sapphire substrate. expect that photocatalysts TiO2 of nanoparticles
arranged on sapphire substrates with atomic-height
as shown in figure 3 The round TiO2 particles in steps can be utilized for fabrications of nanosize
figure 1, seem to be formed via processes of figures structural materials.
3(a)-(c). Since melting point of TiO2 is lower than
that of substrate, and titanium oxide is presumed to References
be out of stoichiometry consisting of many lattice 1) A. Fujishima and K. Honda, Nature 238 1972)
defects, titanium atoms and Ti-O molecules are 37.
rather mobile than Al and A-O molecules in the 2) S. Yamamoto, T. Sumita, Sugiharto, A. Miyashita
substrate. This speculation is possible when the film and H. Naramoto, Thin Solid Films 401 2001) 88.
is very thin -5nm). Note that in the thick sample 3) Y. Choi, S. Yamamoto, H. Abe and H. ltoh, Surf.
(-30 ntn), the feature did not appear even though the Sei. 499 2002) 203.
sample was carried out same tatments. At the 4) M. Yoshimoto, T. Maeda, T. Ohnishi, H. Koinurna,
temperature over 1073 K, srface Ti atouns or Ti-O 0. Ishiyama, M. Shinohara, M. Kubo, R. Miura and
molecules agglomerate as Ti- csters as shown in A. Miyamoto, Appl. Phys. Lett. 67 1995) 2615.
figure 3 (a), ten sblimation of te sbstrate 5) P. A. M. Hotsenpiller, Q A. Wilson, A. Roshko J.
becomes sgnificant, resulting i hole-fon-nation on B. Rothaman and C! S. Rohrer, J. Crystal Growth
the sbstrate. Then, dffiasing Ti atorns ami ri-o 166(1996)779.
molecules are trapped by the holes, a are 6) E. M. Levin and H. F. McMurdie, Phase diagrams
accumulated in the oles as 110, particles as shown for ceramists, Vol.111 (The American Ceramic
in figure 3(h). Ttien, the parti6es become round or Society, nc. 1975, p 35).
ellipsoidal as show i figur 3 (b), Some of large 7) V. Buscaglia and P. Nanni, J. Am. Ceram. Soc.,
ellipsoidal 'riO2 grains decompose ito smaller 81(10) 1998) 2645.
round features as shown in figure 3 (e). This model 8) K. Narurni, S. Yamamoto and H. Naramoto, Mat.
works at temperature regions where holes were Res. Soc. Symp. 587 2000) 08.4.1
210 -
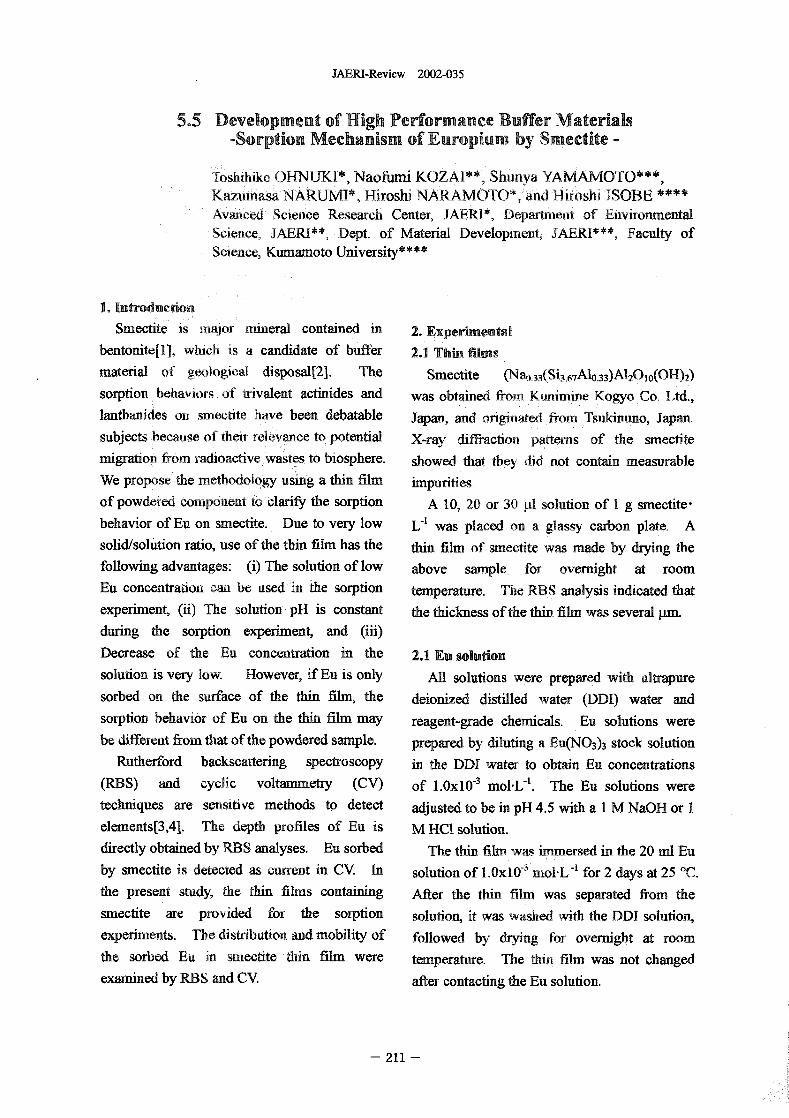
JAERI-Review 2002-035
5.5 Development of High Performance Buffer Materials-Sorption Mechanism of Europium by Smectite -
Toshihiko OHNUKI*, Naofumi KOZAI**, Shu"ya YAMAMOTO***,KazurnasaNARUMP, Hiroshi NARAMOTO*, and iroshi ISOBE ****Avanced Sence Research Center, JFRl*l Department of EnvironmentalScience, JAERI**, Dept. of Material Development, JAERI***, Faculty ofScience, Kumamoto University""
1. Introduction
Smectite is ajor ineral contained in 2. Experimental
bentonite[l], which is a candidate of buffer 2.1 Thin films
material of geological disposal[2]. The Smectite (NBO.33(Sil,67AI0.33)AI20lo(OH)?
sorption behaviors of trivalent actinides and was obtained fom Kunimine Kogyo Co. Ltd.,
lanthanides o smectite have been debatable Japan, and originated forn Tsukinuno, Japan.
subjects because of their relevance to potential X-ray iffyactio perns of the smectite
migration from radioactive wastes to biosphere. showed that they did not contain measurable
We propose� the methodology using a thin film impurities.
of powdered component to clarify the sorption A 10, 20 or 30 gl solution of I g smectite-
behavior of En on smectite.. Due to very low L-1 was placed on a glassy carbon plate. A
solid/solution ratio, use of the thin film has the thin film of smectite was made by drying the
following advantages: (i) The solution of low above sample for overnight at room
En concentration owi be used in he sorption temperature. 'Die RBS analysis indicated that
experiment, (ii) The solution pH is constant the thickness of the thin film was several PM.
during the sorption experiment, and (iii)
Decrease of the E concentration in the 2.1 Eu solution
solution is very low. However, if En is only All solutions were prepared with ultrapure
sorbed on the surface of the thin film, the deionized distilled water (DDI) water and
sorption, behavior of E on the thin filin may reagent-grade chemicals. Eu solutions were
be different from that of the powdered sample. prepared by diluting a u(N03)3 stock solution
Rutherford backscattering, spectroscopy in the DDI water to obtain Eu concentrations
(RBS) and cyclic voltammetry (CV) of I.OxIO-3 mol-L-1. The E solutions were
techniques are sensitive methods to detect adjusted to be in pH 45 with a I M NaOH or I
elements[3,41. The depth profiles of Eu is M HC1 solution.
directly obtained by RBS analyses. Eu sorbed The thin film was immersed in the 20 ml u
by smectite is detected as urrent in CV In solution of I.OxIO-3 mol-L - for 2 days at 25 'C.
the present study, the thin fihus containing After the thin film was separated ftom the
smectite are provided for the sorption solution, it was washed with the DDI solution,
experiments. The distribution and mobility Of followed by drying for overnight at room
the sorbed Eu in smectite thin film were temperature. The tin film was not changed
examined by RBS and CV. after contacting the E solution.
211 -
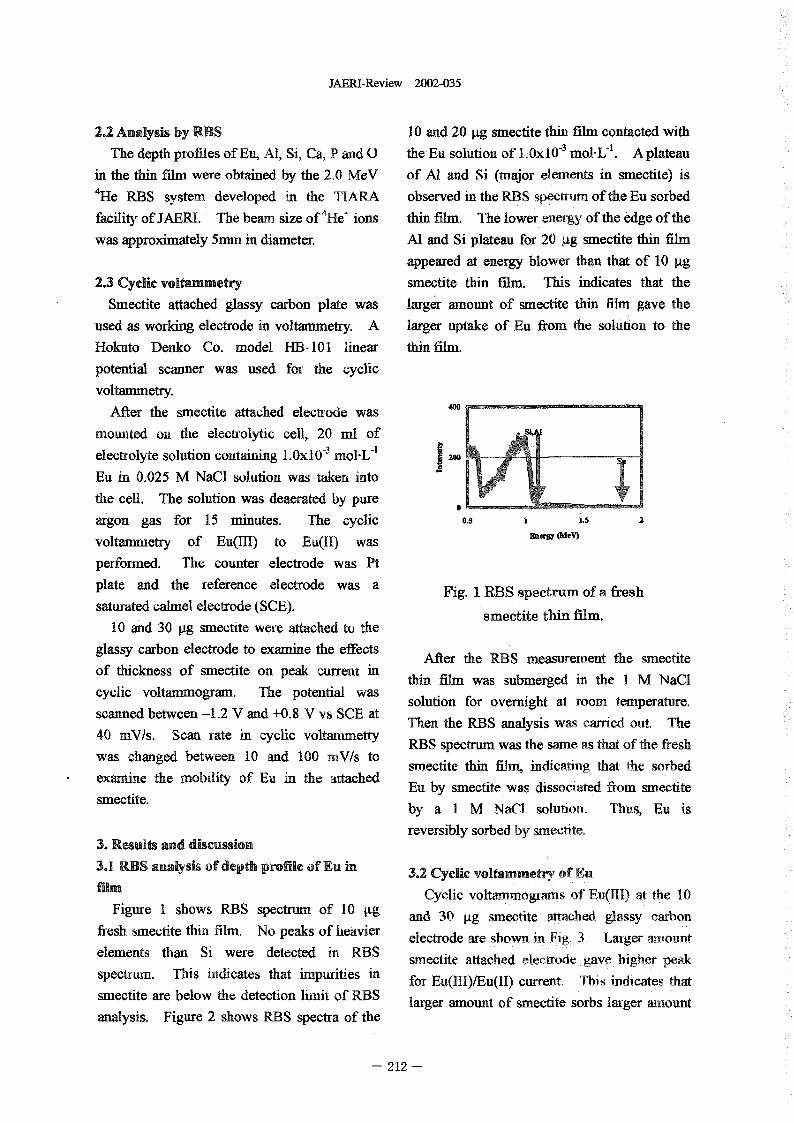
JAERI-Review 2002-035
2.2 Analysis by RBS 10 and 20 gg smectite thin filin contacted with
The depth pofiles of Eu, Al, Si, Ca, P and 0 theEusolutionofl.OxIO-3mol-L-1. Aplateau
in the thin fm were obtained by the 20 eV of Al and Si (major elements in smectite is
4He RBS system developed in the TIARA observed in the RBS spectra of the Eu sorbed
facility of JAERI. Te beam size Of4 He' ions thin film. The ower energy of the edge of the
was approximately 5nim in diameter. Al and Si plateau for 20 4g smectite thin film
appeared at energy blower than that of 10 gg
2.3 Cyclic voltammetry smectite thin film. This indicates that the
Smectite attached glassy carbon plate was larger amount of smectite thin film gave the
used as working electrode in voltammetry A larger uptake of Eu from the solution to the
Hokuto Denko Co. model HB-101 linear thin film.
potential scanner was used for the yclic
voltammetry.40After the smectite attached electrode was
mounted on the electrolytic e 20 ml of
electrolyte solution containing .OxIO-3 mol-L71 200
Eu in 0025 M NaCl solution was taken into
the cell. The solution was deaerated by pure
ar gon gas for 15 minutes. The cyclicvoltanimetry of Eu(III) to Eu(1l) was icnaw (Mev)
performed. The counter electrode was Pt
plate and the reference electrode was a Fig. RBS spectrum of a fresh
saturated calmel electrode (SCE). smectite thin film.10 and 30 pg smectite were attached to the
glassy carbon electrode to examine the effects After the RBS measurement the smectite
of thickness of smectite on peak current in thin film. was submerged in the I M NaCI
cyclic voltammogram. The potential was solution for overnight at oom temperature.
scanned between 1.2 V and 0.8 V vs SCE at Then the RBS analysis was carried out. The
40 m.V1s. Scan rate in cyclic voltammetry RBS spectrum was the same as that of the fresh
was changed between 10 and 100 mV/s to smectite thin film, indicating that the sorbed
examine the mobility of Eu in the attached Eu by smectite was dissociated from sniectite
smectite. by a I M NaCl solution. Thus, Eu is
reversibly sorbed by smeotite,3. Results and discussion
3.1 RBS analysis of depth profile of Eu in 3.2 Cyclic voltanimetry of Eu
film Cyclic voltammograms of Fu(III) at the 0
Figure I shows RBS spectrum of 10 ILg and 30 jig smectite attacbed glassy carbon
fresh smectite thin film. No peaks of heavier electrode are shown in Fi 3 Larger amount
elements than Si were detected in RBS smectite attached eectrode gave higher peak
spectrum. This idicates that impurities in for Eu(lll)/Eu(II) current. This indicates that
smectite are below the detection limit of RBS larger amount of smectite sorbs larger arnountanalysis. Figure 2 shows RBS spectra of the
- 212 -
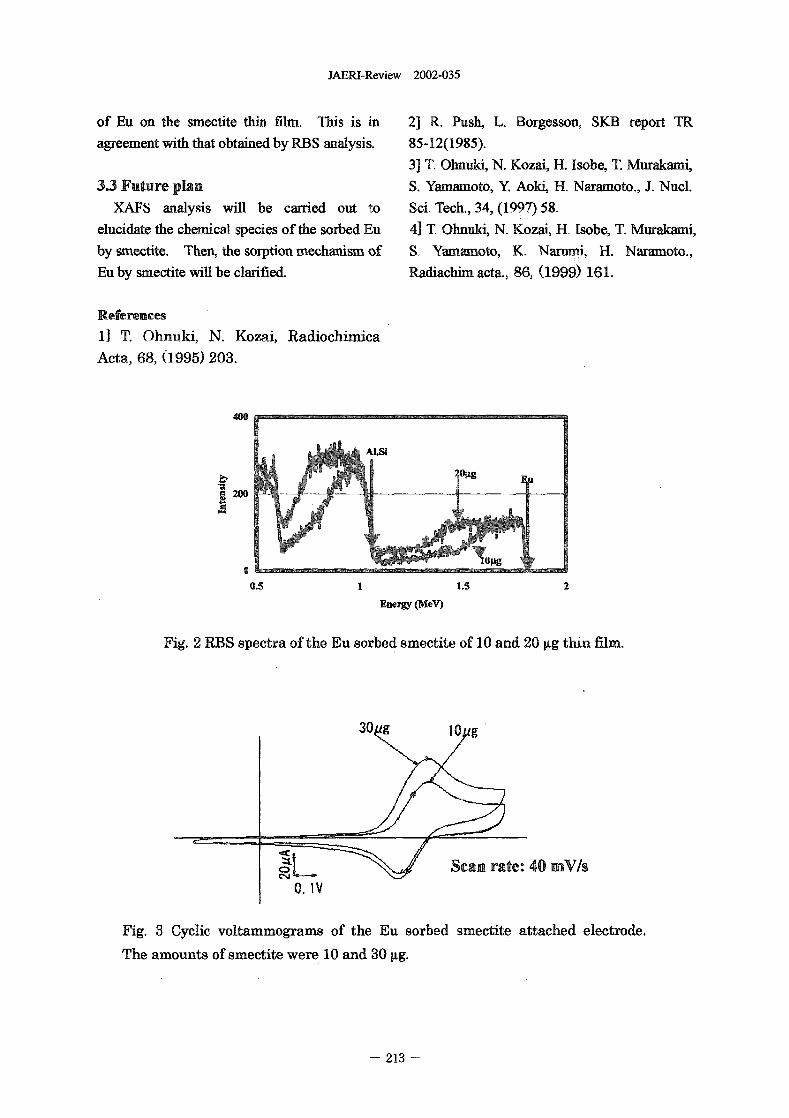
JAERI-Review 2002-035
of Eu on the smectite thin film. This is in 2] R. Push, L. Borgesson, SKB report TR
agreement with that obtained by RBS analysis. 85-12(1985).
3 T Ohnuld, N. Kozai, H. Isobe, T. Murakami,
3.3 Future plan S. Yamamoto, Y. Aoki� H. Naramoto., J. Nucl.
XAFS analysis w be carried out to Sci. Tech., 34, 1997) 58.
elucidate the chemical species of the sorbed Eu 4 T Ohnuki, N. Kozai, H. lsobe, T. Murakami,
by smectite. Then, the sorption mechanism of S. Yamamoto, K. Narumi, H. Naramoto.,
Eu by smectite will be clarified. Radiachim. acta., 86, 1999) 16 1.
References
11 T. Ohnuki, N. Kozai, Radiochimica
Acta, 68, 1995) 203.
400
Si
2099V
200
00.5 1.5 2
Encra (MeV)
Fig. 2 BS spectra of the Eu sorbed smectite of 10 and 20 ILg thin film.
30 10 g
ZLC> Scan rate: 40 V/s"L0 IVFig. 3 Cyclic voltammograms of the Eu sorbed smectite attached electrode.
The amounts ofigmectite were 10 and 30 ftg.
213 -
JAERI-Review 2002-035
5.6 Electron Emission from Solids by Fast Cluster Impact
H. Kudo*, W. Iwazaki T. Suguri', Y. Saitoh", S. Yarnamoto"', K. Narumi**,*,
and H. Nararnoto""
Institute of Applied Physics, Univ. of Tsukuba*
Advanced Radiation Technology Center, JAERl*'
Department of Material Development, JAERI**'
Advanced Science Research Center, JAERI
1. Introduction not only knowledge about the atornic and
Interaction of a fast cluster bearn with solids electronic processes of the cluster impact
includes correlated impacts (so-called vicinage phenomena, but also an insight into the related
effects), in other words, physical Processes that effects resulting from energetic cluster-solid
are caracteristic of the projectile with internal interactions. Such basic approach will also be of
atomic structure. This causes radiation effects practical importance for future material
different from those induced by impact of a processing by cluster impact. In tis article,
single ion or a small molecule. Actually, fast recent progress in the studies and preliminary
cluster ions in the MeV/atoni velocity range give results are reported.
rise to nonlinear radiation effects on solid targets
with respect to the number of cluster atoms n. 1-7) 2. Experiment
Such nonlinearity has far been observed The experiments have been carried out using
for energy loss (stopping power), L.2) sputtering 3 the cluster beam line at the TIARA tandem4,5) 6)lattice damage, secondary ion emission, ad accelerators) The electron energy spectra have
total electron emission yield (corresponding to been measured at a backward angle of 135'
the emission urrent).7) It is table that the total relative to the beam direction. The equal-
electron emission yield per atom depends less velocity beams of Ci'and C', as well as of Au
linearly on n. This is in contrast to the and A118', were used in the experiments.
radiation effects accompanying atomic The beam current was not so stable that the
displacements, i.e., sputtering or lattice damage, energy analysis by a retarding potential method
for which independence is stronger than linear. was unsuccessful. We have therefore modified
The aim of the present study is to investigate the parallel-plate electron spectrometer of the
the cluster effect in the ion-induced electron double deflection type, peviously used for
emission. Key information for the cluster-solid ion-induced spectroscopy of keV electrons. For
interactions will be included in the electron yield measurements of the low-energy electrons, the
possibly at energies lower than 50 eV, which length of the electron orbit in the analyzing
should reflect soft interactions of the cluster as a electrostatic field of the spectrometer has been
whole, rat-her than of the constituent atoms, with reduced to 20 mm so as to treglect the ifluence
target atoms. A better understanding of the of an external magnetic fieid in the
cluster-induced electron emission would provide environments. To icrease te electron counting
- 214 -
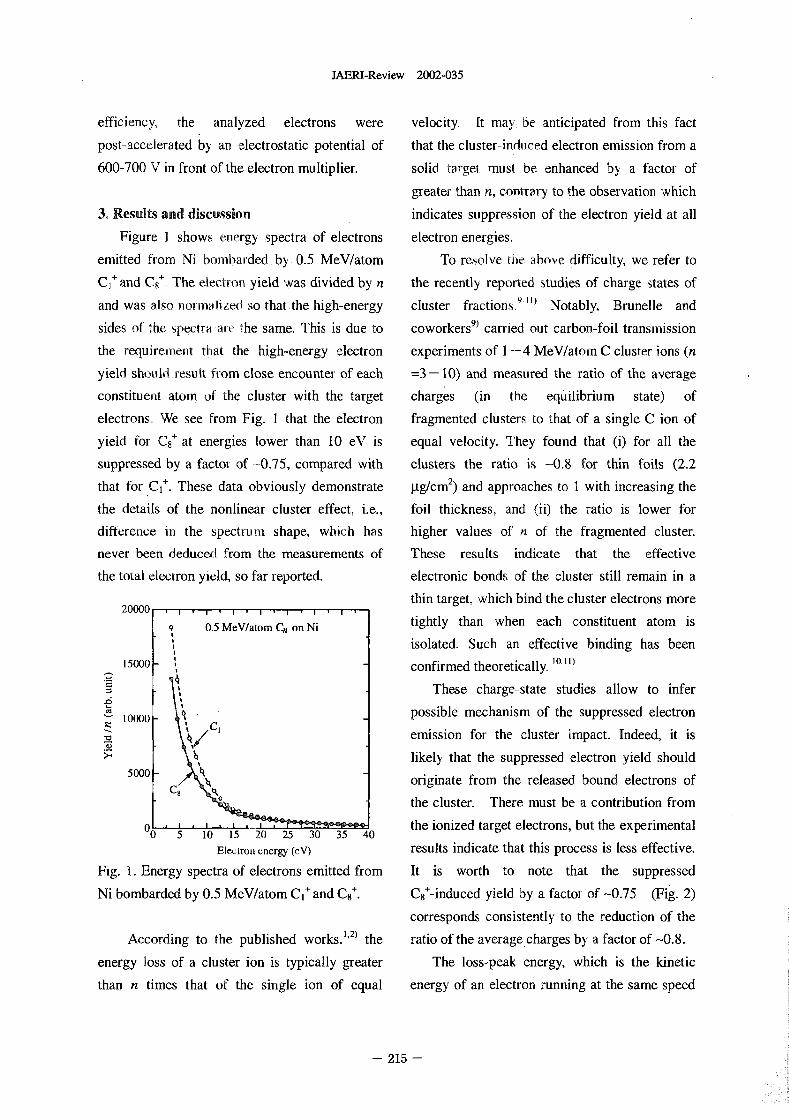
JAERI-Review 2002-035
efficiency, the analyzed electrons were velocity. ft may be anticipated from this fact
post-accelerated by an electrostatic potential of that the cluster-induced electron emission from a
600-700 V in front of the electron multiplier. solid target must be enhanced by a facto of
greater than n, contrary to the observation which
3. Results and discussion indicates sppression of the electron yield at all
Figure I shows eergy spectra of electrons electron energies.
emitted from Ni bombarded by 0.5 MeV/atorn To resolve te above difficulty, we refer to
Cj' and C8'. The electrori yield was divided by n the recently reported studies of charge states of
and was also normalized so that the high-energy cluster fractional-") Notably, Brunelle and
sides of the spectra are the same. This is due to coworkers9) carried out carbon-foil transmission
the requirement ta( the high-energy electron experiments of 4 MeV/atoni C cluster ions n
yield should result from close encounter of each =3 - IO) and masured the ratio of the average
constituent atom of the cluster with the target charges (in the equilibrium state) of
electrons. We see from Fig. I that the electron fragmented clusters to that of a single C ion of
yield for C8' at energies lower than 10 eV is equal velocity. They found that (i) for all the
suppressed by a factor of 0.75, compared with clusters the ratio is -0.8 for thin foils 22
that for Cl'. These data obviously demonstrate gg/CM2 ) and approaches to I with increasing the
the details of the nonlinear cluster effect, i.e., foil thickness., and (ii) the ratio is lower for
difference i the spectrum shape, wich has higher values of of the fragmented cluster.
never been deduced from the measurements of These results indicate that the effective
the total electron yield, so far reported. electronic bonds of the cluster still remain in a
20000 thin target, which bind the cluster electrons more
tightly than when each constituent atom isq 0.5 MeV/atorn Cn on Ni
isolated. Such an effective binding has been
1500 - confirmed theoretically.
These charge-state studies allow to infer
10000 C, possible mechanism of the suppressed electronemission for the cluster impact. Indeed, it is
likely that the suppressed electron yield should500 -
C, originate from the released bound electrons of
the cluster. There must be a contribution from
OOL -5 ILO 115 20 25 30 35 40 the ionized target electrons, but the experimental
Electron energy (V) results indicate that this process is less effective.
Fig. 1. Energy spectra of electrons emitted from It is worth to note that the suppressed
Ni bombarded by 0.5 MeV/atorn C 'and C8'. C8'-induced yield by a factor of 0.75 (Fig. 2)
corresponds consistently to the reduction of the
According to the published works. 1,2) the ratio of the average charges by a factor of 0.8.
energy loss of a cluster ion is typically greater The loss-peak energy, which is the kinetic
than n times that of the single ion of equal energy of an electron running at the same speed
- 215 -
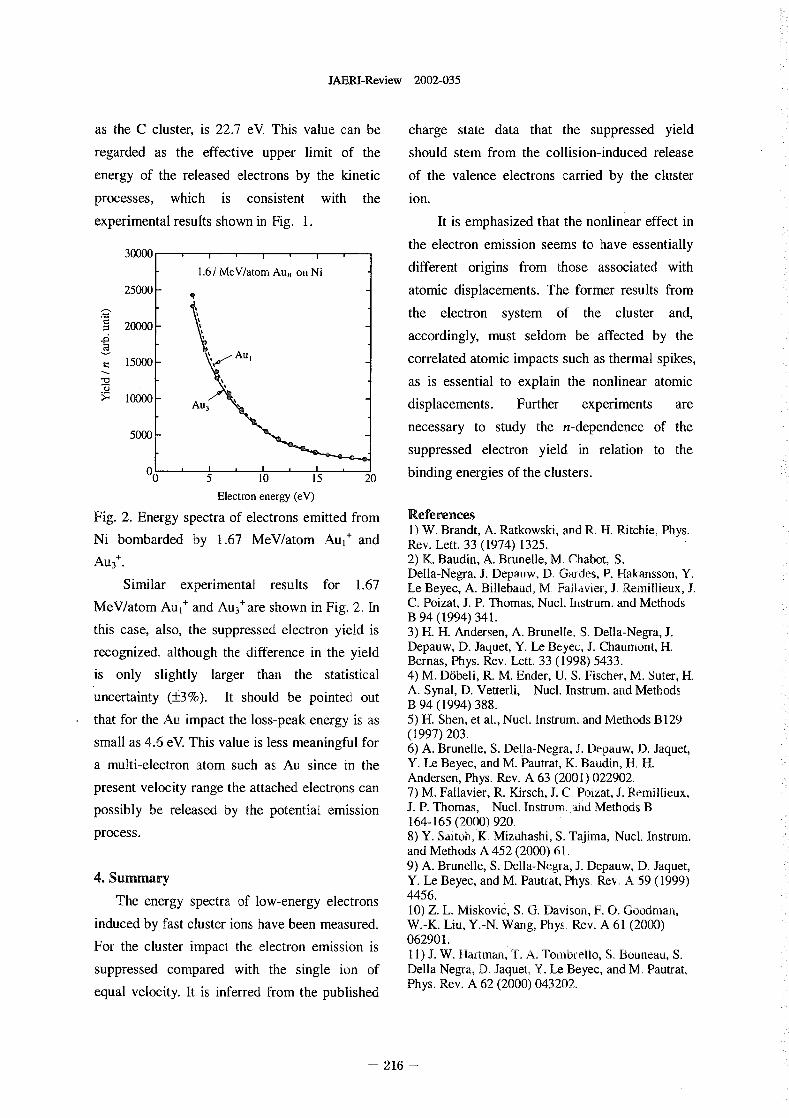
JAERI-Review 2002-035
as the C cluster, is 22.7 eV This value can be charge state data that the suppressed yield
regarded as the effective upper limit of the should stem from the collision-induced release
energy of the released electrons by the kinetic of the valence electrons carried by the cluster
processes, which is consistent with the ion.
experimental results shown in Fig. 1. It is emphasized that the nonlinear effect in
30000 I the electron emission seems to have essentially
1.67 MeV/atom Au,, o Ni different origins from those associated with
25000 - atomic displacements. The former results from
the electron system of the cluster and,
20000 - accordingly, must seldom be affected by the
Au, correlated atomic impacts such as thermal spikes,1500 -
as is essential to explain the nonlinear atomic
>1 10000 AU3 displacements. Further experiments are
5000 necessary to study the n-dependence of the
suppressed electron yield in relation to the
0 binding energies of the clusters.0 5 10 15 20
Electron energy (eV)
Fig. 2 Energy spectra of electrons emitted from References1) W. Brandt, A. Ratkowski, and R. H. Ritchie, Pys.
Ni bombarded by 167 MeV/atom Au,' and Rev. Lett. 33 1974) 1325.
AU3+- 2) K. Baudin, A. Brunelle, M, Chabot, S.Della-Nega, J. Depatjw, D. Gardes, P. akansson Y.
Similar experimental results for 1.67 Le Beyec, A. Billebaud, M. Fallavier, J, Remillieux J.
MeV/atom Au I' and AU3'are shown in Fig. 2 In C. Poizat, J. P. Thomas, Nucl. Instrurn. and MethodsB 94 1994) 341.
this case, also, the suppressed electron yield is 3) H. H. Andersen, A. Brunelle, S. Deila-Negra J.
recognized, although the difference in the yield Depauw, D. Jaquet, Y. Le Beyee, J. Chaumont, H.Bernas, Phys. Rev. Lett. 33 1998) 5433.
is only slightly larger than the statistical 4) M. D6beli, R. M. Ender, U. S. Fischer, M. Suter, H.A. Synal, D. Vetterli, Nucl. Instrum. and Methods
uncertainty ±3%). It should be pointed out B 94 1994) 388.
that for the Au impact the loss-peak energy is as 5) H. Shen, et al., Nucl. Instrum. and Methods B129
small as 46 eV This value is less meaningful for (1997) 203.6) A. Brunelle, S. Della-Negra, J. Depauw, D. Jaquet,
a multi-electron atom such as Au since in the Y. Le Beyec, and M. Oautrat, K. Baudin, H. H.Andersen, Phys. Rev. A 63 2001) 022902.
present velocity range the attached electrons can 7) M. Fallavier, R. Kirsch, J. C. Poizat, J. Remillieux,
possibly be released by the potential emission J. P. Thomas, Nucl. Instrum ad Methods 164-165 2000) 920,
process. 8) Y. Saitob 'K, Mizuhashi, S. Tajima, Nucl. Instrum.and Methods A 452 2000) 61.9) A. Brunelle, S. Della-Negf a, J. Depauw, D. Jaquet,
4. Summary Y. Le Beyec, and M. Pautrat, Phys, Rev, A 59 1999)
The energy spectra of low-energy electrons 4456.10) Z. L. Miskovic, S. G. Davison, F. 0. Goodman,
induced by fast cluster ions have been measured. W.-K. Liu, Y.-N. Wang, Phys. Rev. A 61 2000)
For the cluster impact the electron emission is 062901.1 1) J. W. Hartman, T. A. Tombuello, S. Bouneau S.
suppressed compared with the single ion of Della Negra, D, Jaquet, Y. Le Beyec, and M_Pautrat,
equal velocity. It is inferred from the published Phys. Rev. A 62 2000) 043202.
- 216 -
JAERI-Review 2002-035
5.7 Improvement in Surface Rougbness of Nitrogen-ImplantedGlassy Carbon by Hydrogen Doping 1
K. Takahiro*, R. Ookawa', K. Kawatsura, S. Nagata-, S. Yamamoto",
K. Narurni"', H. Naramoto"Department of Chemistry and Materials Technology, Kyoto In, titute o
Technology*, Institute for Materials Research, Tohoku Ukliversily",DepartmentofMaterialDevelopmenlJAF-Rr*', AdvancedScienceRe-
search Center, JAERI****
1. Introduction ions to a dose of 6 I 0 " D/crril, correspondi n g toIon-implanted glassy carbon (GQ exhibits vari- the D concentration of approximately 30 at, %. The
ous structural changes depending on damage ac- iiii-doped and the -doped GC were simulta-cumulated in the layer 1-3) up to a dose
At damage neously unpianted with ,00 keV 2+
levels up to 02 displacements per atom (dpa), the of 12x 1" N/cm'at temperatures below I 0 'C.structure displays a reduction in the average gra- A vacuum during N iplantation was better thanphitic crystalline size. At damage levels between 2xJO-5 Pa. The projected ranges of 1.0 keV D 2+ and0.2 and 3 dpa, the iplanted layer begins to trans- 100 keV N 2+ were calculated by the TRIM codeform into an amorphous state. During amorphiza- to be 90 nm and 120 tim, respectively, assumingtion approximately 15 % of the graphitic bonds are the density of GC to be 20 g/CM3. Surface mor-converted into diamond-like bonds, increasing in phology of the ion-implanted GC was observed bydensity from 1.5 to 22 glcm�. Furthermore, in case means of scanning electron microscopy (SEM).of N-implanted GC, the density of the N-implanted Depth distributions of D and H atoms were mea-layer is reduced and surface roughening occurs at sured by elastic recoil detection (ERD) analysishigher damage levels'). Although the mechanism using a 28 MeV4He2+ beam. Depth distributionsof surface rughening is not well understood, it is of N atoms were measured by the ion backscatter-indicated that chemical processes are responsible ing spectrometry (BS) using a 3.5 MeV4He2+ beam.for it. It is of great importance to study iradiation- X-ray photoelectron spectroscopy (XPS) by Mg Kaenhanced surface roughness of GC because it is excitation hv--1253,6 V) was used to analyzenecessary to have knowledge of wear properties, chemical bonding of the ion-implanted layer.and adhesion to biological cell/tissue for medical Raman spectroscopy using an argon-ion laser withapplications such as heart valves and other pros- excitation wavelength of 514.5 um was also ap-thetic devices. plied to the samples to characterize the ion-im-
In the course of the study on surface roughen- planted layers.ing of N-implanted GC, we have found that thesurface roughness depends on a vacuum during im- 3. Results and discussionplantation. The N implantation in the better vacuum Figure I (a) shows the SEM micrograph takenproduces the rougher surface. Characterization of from the as-polished GC. Collapsed micro-poresthe N-implanted GC reveals that a significant of ~3 gm size and many polishing scratches canamount of hydrogen atoms exists in the implanted be seen. Figure I (b) is the photograph taken fromlayer when implanted in the poor vacuum. There- the un-doped GC after implantation with 100 keVfore, the hydrogen incorporation may play an im- N2+ to a dose of 4xlO" N+1cM2 . This dose is -20portant role to prevent surface roughening. In the times as high as the dose at which the N-implantedpresent work, we study the effect of hydrogen in- layer is amorphized. The amorphization will becorporation on surface roughening induced by N confirmed later by Raman spectroscopy. Remark-implantation. For this purpose, hydrogen atoms are able surface roughening, which originates in pol-doped by ion implantation prior to N implanta- ishing scratches, occurs after N implantation tot' 4xl0l" N/CM2ion. . The polished surface may be
strained, especially along polishing scratches. It is2. Experimental procedures considered that this strain roughens the surface af-
The glassy carbon (GC-30 grade) plates used ter N implantation. Above this dose, however, en-were supplied from Tokai Carbon. They were cut hancement in roughness was not observed. For theinto 10.5xO. I CM3 and were polished to mirror D-doped GC samples, surface roughening due tosurface using I gm diamond slurry on a cloth lap. N implantation was not recognized at 4x 10¹⁷ N+1The GC samples were implanted with 10 keV D,+ CM2 as shown in Fig. I c). The smooth surface
- 217 -
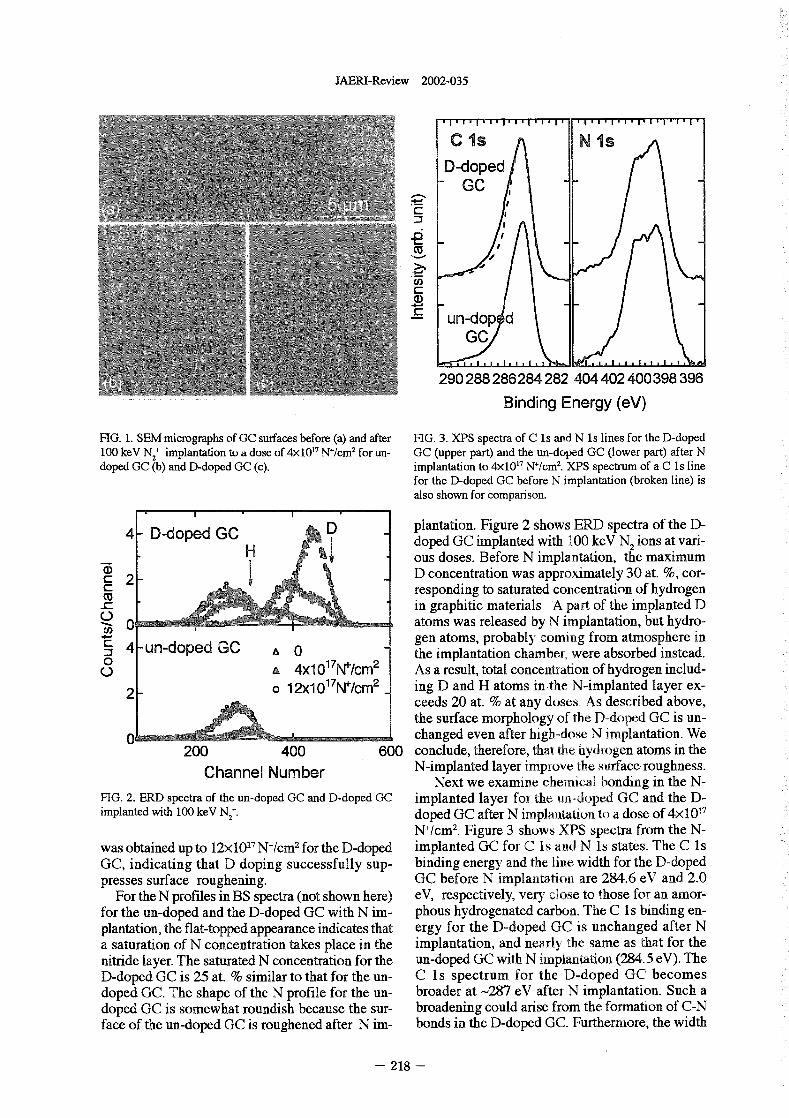
JAERI-Review 2002-035
CIS N Is
D-dopedGC
M
C:a)un-dop
GC
290 288 286284 282 404 402 400 398 396
Binding Energy (eV)
FIG. 1. SEM micrographs of GC surfaces before (a) and after FIG. 3 XPS spectra of C s and N s lines for the D-doped100 keV N2' implantation to a dose of 4xIO11 N+/CM2 for n- GC (upper part) and the un-doped GC (lower part) after Ndoped GC (b) and D-doped GC (c). implantation to 410" W/cml. XPS spectrum of a C Is line
for the D-doped GC before N implantation (broken line) isalso shown for comparison.
4 - D-doped GC D plantation. Figure 2 shows ERD spectra of the D-H doped GC implanted with 100 keV N2 ions at vari-
ous doses. Before N implantation, the maximumD concentration was approximately 30 at. %, cor-2 -responding to saturated coiwentration of hydrogenM
__ in graphitic materials. A part of the implanted DO 0 atoms was released by N implantation, but hydro-
gen atoms, probably coming from atmosphere in3S 4 - un-doped GC 0 the implantation chamber were absorbed instead.0 017NF/CM2O 4X1 As a result, total concentration of hydrogen includ-
2 0 12X,017W/CM2 ing D and H atoms in-the N-implanted layer ex-ceeds 20 at. % at any doses, As described above,the surface morphology of the D-doped GC is un-
0 changed even after high-dose N implantation. We200 400 600 conclude, therefore, that the hydrogen atoms in the
Channel Number N-implanted layer improve te surface. roughness.Next we examine chemical bonding in the N-
FIG. 2 ERD spectra of the un-doped GC and D-doped GC implanted layer foi- the on-doped GC and the D-implanted with 100 keV N 2 doped GC after N implantation to a dose of 4xlO"
N+/CM2. Figure 3 shows XPS spectra from the N-was obtained up to 12x 10" N+/cm1 for the D-doped implanted GC for C Is and N s states. The C sGC, indicating that D doping successfully sup- binding energy and the line width for the D-dopedpresses surface roughening. GC before N mplantation are 284.6 eV and 20
For the N profiles in BS spectra (not shown here) eV, respectively, very close to those fr an anior-for the un-doped and the D-doped GC with N im- phous hydrogenated carbon. The C Is binding en-plantation, the flat-topped appearance indicates that ergy for the D-doped GC is unchanged after Na saturation of N concentration takes place in the implantation, and nearly te same as that for thenitride layer. The saturated N concentration for the un-doped GC with N implantation 284.5 eV). TheD-doped GC is 25 at. sirmilar to that for the un- C Is spectrum for the D-doped, GC becomesdoped GC. The shape of the N profile for the un- broader at -287 eV after N implantation. Such adoped GC is somewhat roundish because the sur- broadening could anise from the formation of C-Nface of the un-doped GC is roughened after N im- bonds in the D-doped GC. Furthermore, the width
- 218 -
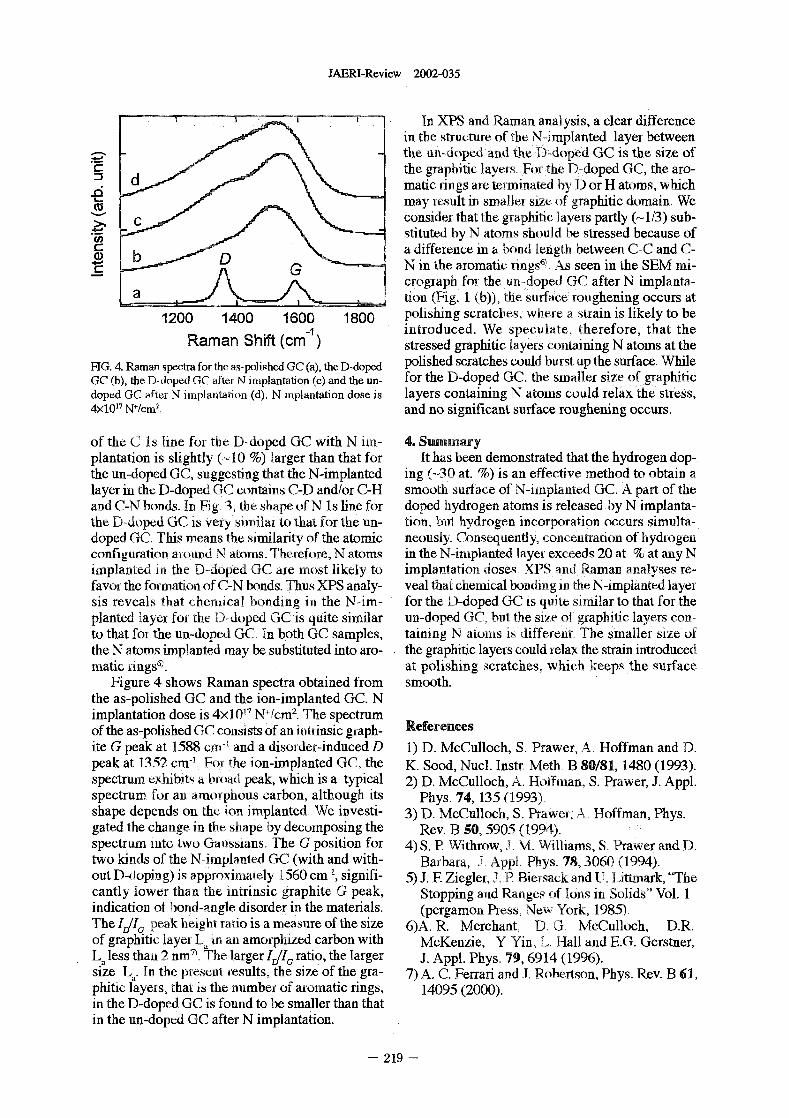
JAERI-Review 2002-035
In XPS and Raman analysis, a clear differencein te structure of the N-implanted layer betweenthe un-doped ad the D-doped GC is the size ofthe graphitic layers For the D-doped GQ the aro-
d matic rings are terminated by D or H atoms, whichmay result i smaller size of graphitic domain, We
C consider that the graphitic layers partly (-1/3 sb-stituted by N atoms should be stressed because of
C a difference in a bond length between C-C and C-b N in the aromatic Ylrrgs'�. As seen in the SEM mi-
GcTograph fo te un-dope G after N imp] a nta-
a tion (Fig. I (b)), the surface roughening occurs at
1200 1400 1600 1800 polishing scratches, where a strain is likely to beintroduced. We speculate, therefore, that the
Raman Shift (cm-') stressed graphitic layers containing N atoms at theFIG. 4 Raman spectra for the as-polighed GC (a), the D-doped polished scratches could burst up the surface. WhileGC (b), the, D-doped GC after N implantafion () and the un- for the D-doped GC, the smaller size of graphiticdoped GC after N implantation (d). N mplantation dose is layers containing N atoms could relax the stress,4X10" W/cm'. and no significant surface roughening occurs.
of the C Is line for te D-doped GC with N im- 4. Summaryplantation is slightly (-10 %) larger than that for It has been demonstrated that the hydrogen dop-the un-doped GC, suggesting that the N-implanted ing 30 at. %) is an effective method to obtain alayer in the D-doped C contains C-D and/or C-H smooth surface of N-implanted GC A part of theand C-T\T bonds. ID Fig. 3 te sape of N Is line for doped hydrogen atoms is released by N implanta-the D-doped GC is very similar to that for the n- tion, birt hydrogen incorporation ocurs simulta-doped OC, This means te similarity of the atomic neously. Consequently, concentration of hydrogenconfiguration aound N atoms. Therefore, N atoms in the N-impianted layer exceeds 20 at. % at any Nimplanted in the D-doped GC afe most likely to implantation doses, XPS and ama aalyses re-favor the formation of C-N bonds. Thus XPS analy- veal that chemical bonding it) the N-implanted layersis reveals that chernical bonding i the N-im- for the D-doped GC is quite similar to that for theplanted layer for the D-doped OC is quite similar un-doped OC, but the size of graphitic aVeTS Cn-to that for the un-doped GC. In both GC samples, taining N atoms is different, Te saller size ofthe N atoms implanted may be substituted into aro- the graphitic layers could relax the strain introducedmatic rings6�. at polishing scratches, which keeps the srface
Figure 4 shows Raman spectra obtained from smooth.the as-polished GC and the ion-implanted GC. Nimplantation dose 4 I 01' T\T+ JCM2 The spectrumof the as-polished GC consists of an intrinsic graph- Referencesite G peak at 1588 cm-1 and a dsoftler-induced D 1) D. McCulloch, S. Pawer, A, Hoffman and D.peak at 1352 cm-'. For the ion-implanted GC, the K. Sood, Nucl. Instr Meth, B 80/81, 1480 1993).spectrum exhibits a broad peak, which is a typical 2) D. McCulloch, A. Hoffman, S. Pawer, J. Appl.spectrum for an amorphous carbon, although its Phys. 74,135 (1993)-shape depends on the, ion implanted, We iDvesti- 3) D. McCulloch, S. Prawer, A. Hoffman, Phys.gated the change in te shape by decomposing the Rev. 0, 5905 1994).spectrum into two Gaussians, The G position for 4) S. P Withrow, J, M Williams, S, Prawer and D-two kinds of the N-Implanted GC (with and wth- Barbara, J. Appl� Phy& 78,3060 1994).out D-doping) is approximately 1560 cm-', signifi- 5) J. F. Ziegler, J, Blersack and U Lttirrark "Thecantly lower than the itrinsic graphite G peak, Stopping ad Ranges of rules in Solids" Vol. Iindication of bond-angle disorder in the materials. (pergamon Ress, New York, 1985).The IDIIG peak height atio is a measure of the size 6)A. R. Merchant, D, G. McCulloch, D.R.of graphitic. layer La in an amorphized carbon with McKenzie, Y Yin, L. all and E.G. Gerstner,L less than 2 nM71, The larger 1,1I, ratio, the larger J. Appl. Phys. 79,6914 1996).S.aize In the present results, the size of the gra- 7) A. C. Ferrari and J. Robertson, Phys. Rev. 6,
phitle layers, that is the umber of aromatic rings, 14095 2000).in the D-doped GC is found to be smaller than thatin the un-doped GC after N implantation..
- 219 -
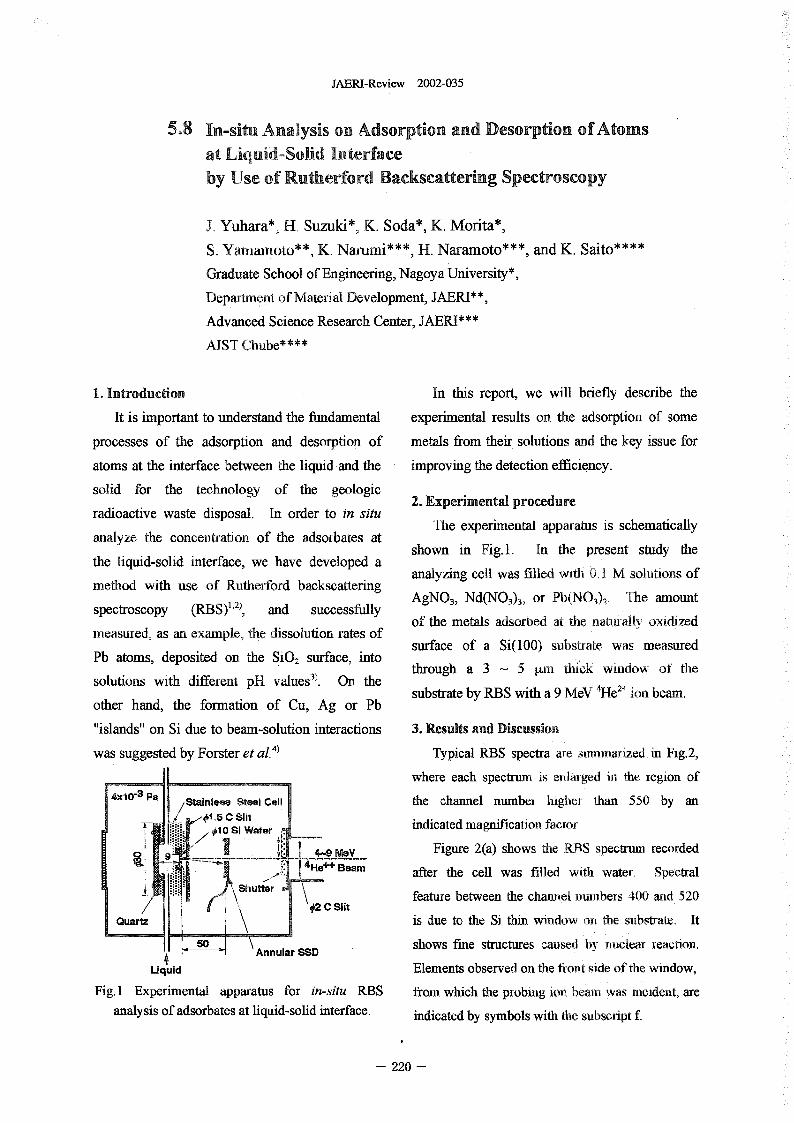
JAEPd-Review 2002-035
5.8 In-situ Analysis on Adsorption and Desorption of Atomsat Liquid-Solid Interfaceby Use of Rutherford Backscattering Spectroscopy
J. Yuhara*, H. Suzuki*, K. Soda*, K. Morita*,S. Yarriamoto", K. Narumi***, H. Naramoto***, and K. Saito****Graduate School of Engineering, Nagoya University*,Department of Material Development, JAERI**,Advanced Science Research Center, JAERI***ATST Chube****
1, Introduction In this report, we will briefly describe theIt is important to understand the fimdamental experimental results on the adsorption of some
processes of the adsorption and desorption of metals from their. solutions and the key issue foratoms at the interface between the liquid and the improving the detection efficiency.
solid for the technology of the geologic 2. Experimental procedureradioactive waste disposal. In order to in situ The experimental apparatus is schematicallyanalyze the concentration of the adsorbates at shown in Fig.1, In the present study thethe liquid-solid interface, we have developed a analyzing cell was fed with 0 I Ml solutions ofmethod with use of Rtherford backscattering AgNO3, Nd(NO3)3, or Pb(NO3),. The amountspectroscopy (RBS)"). and successfully
of the metals adsorbed at the natirrally odizedmeasured, as an example, te dissolution rates of surface of a Si(100) substrate was measuredPh atoms, deposited on the SIO, surface, into
through a 3 - [tra thick window f te
solutions with different pH valueS3). On te substrate by RBS with a 9 MeV 'He" ion beam.
other hand, the formation of Cu, Ag or Pb
islands" on Si due to beam-solution interactions 3. Results and Discussion
was suggested by Forster et al.') Typical RBS spectra are summarized in Fig.2,
where each spectruni is enlarged in the egion of
4XIO-3 Pa Stainless Steel Coll the channel number hgher than 550 by an01.5 C slit
4,10 Si indicated magnification factor.
Figure 2a) shows te RBS spectruin recorded4-9 MoV
4He++ Beam after the cell was filled with water, Spectral
feature between the channel nuiribers 400 and 520#2 C Slit
Quartz is due to the Si thin window on te substrate. It
shows fine structures caused by nuclear reaction.Annular SSD
Liquid Elements observed on the front side of the window,
Fig. I Experimental apparatus for in-situ RBS from which the probing ion beaju was incident, are
analysis of adsorbates at liquid-solid interface. indicated by symbols with the subscript f.
- 220 -
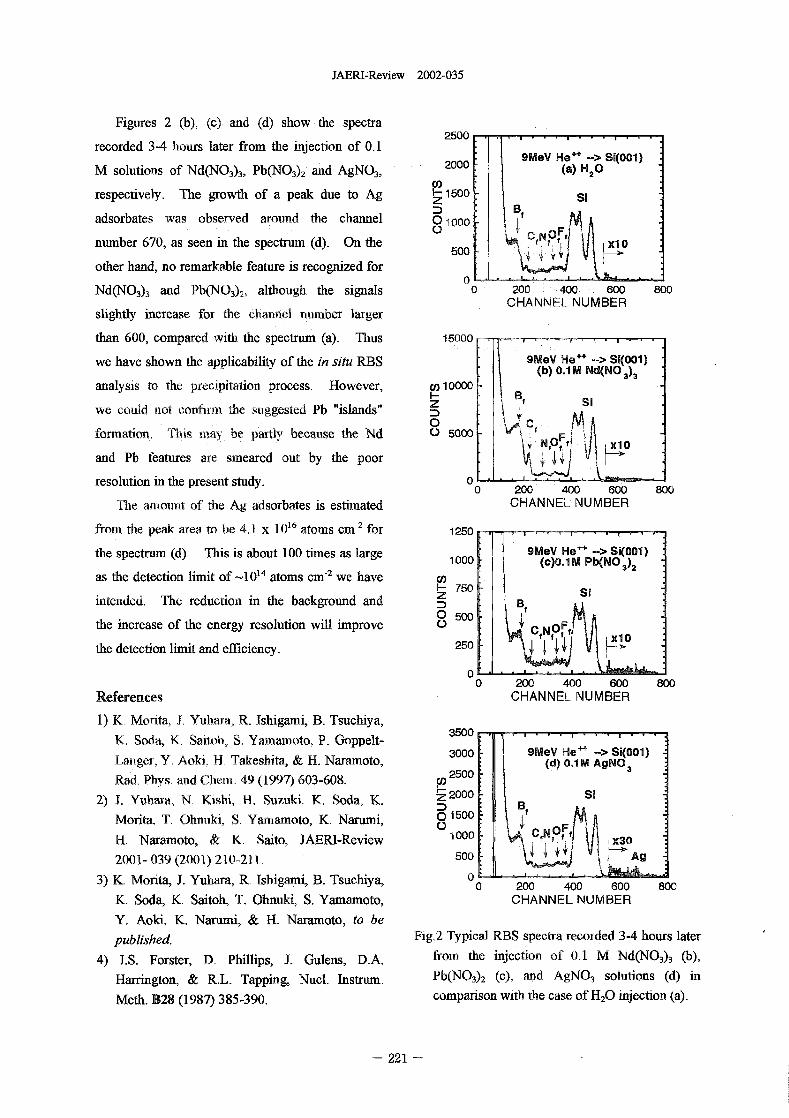
JAERI-:Review 2002-035
Figures 2 (b), (c) and d show the spectra2500 . . . . . . . . . . . . . .
recorded 34 ours later from the injection of 0.19MeV He++ S)
2000M solutions of Nd(NO3)3, Pb(NO3)2 ad AgNO3, (a) H20U)
respectively. The growth of a peak due to Ag k- 1500- SiZD Bf
adsorbates was observed around the cannel 01000C.) � C NOF
number 670, as seen in the spectrum (d). On the X10
other hand, no remarkable feature is recognized for 5000
Nd(NO3), and Pb(NO3)2, although the signals 0 200 400 600 800CHANNEL NUMBER
slightly increase for the dialiDel number larger
than 600, compared with the spectrum (a). Thus 15000 - -
we have shown the applicability of the in situ RBS 9mev He++ --> SI(001)(b) .1101 Nd(NO 3)3
analysis to the precipitation process. However, a) 1 0000-Bf SiZwe could not confirm the sggested Pb "islands"
0formation. This ay be partly because the Nd 05000
N X10fand Pb features are seared out by the poor
resolution in the present study. 00 200 400 600 800
'Me aount of the Ag adsorbates is estimated CHANNEL NUMBER
from the peak area to be 4 I X 1016 atoms CM-2 for 1250 - -
the spectrum (d). This is about 100 times as large 9mev He"'+ --> SI(001)1000 (c)OAM Pb(NO
-2 3)2as the detection limit of -10" atoms CM we have W750 -
Z Siintended. he reduction in the background and -1 B
0500the increase of the energy resolution will iprove
the detection limit and efficiency. 250
00 200 400 600 800
References CHANNEL NUMBER
1 K Morita, J. hara, R. Ishigami, B. Tsuchiya,
K. Soda, K. Saitob, S. Yamamoto. P. Goppelt- 35003000 9MeV He++ SI(001)
Langer, Y. Aoki. H- Takeshita, & H. Naramoto, (d) A M AgNO2500 3Rad. Phys ad Chem, 49 1997) 603-608.
2) . Yuhara, N. Kishi, H Szuki, K. Soda, K. Z 2000 SiD B
Morita, T. Ohnuki, S. Yamamoto, K. Narumi, 0150001000 CfNOFH. Naramoto, & K, Saito, JAERI-Review f x3O
500 Ag2001- 039 001) 210-21 .
3) K. Morita, J. YuhaTa, R. Ishigami, B. Tsuchiya, 00 200 400 600 800
K. Soda, K. Saitoh, T. Ohnuki, S. Yamamoto, CHANNEL NUMBER
Y. Aoki, K. Nammi, & H. Naramoto be
published. Fig, Ty, pical RBS spectra recorded 34 hours later
4) J.S. Forster, D. Phillips, J. Gulens, D.A. from the injection of 0.1 M Nd(NO3)3 (b),
Harrington, & R.L. Tapping, Nucl. Instrum.. Pb(NO3)2 (c), and AgNO sutions (d in
Meth. B28 1987) 385-390. comparison with the case of H20 iection (a).
- 221 -
JAERI-Review 2002-035
5.9 Percolation of Liquid Indium through Porous Media
Composing of Ni and C60
Hiroshi Naramoto, Jiri Vacik*, Kazurnasa Narumi, Kiyoshi Miyashita+,and Yoshikazu Honma"
Advanced Science Research Center, Japan Atomic Energy Research InstituteNuclear Physics Institute, Rez near Prague, Czech Republic*Gunma Prefecture Industrial Technology Research Laboratory+NTT Basic Research Laboratory'
1. Introduction purity. The chemical state of the prepared filmsThe mixtures between immiscible elements was characterized by micro-Raman
and the super-saturated substances are spectrometer equipped with a AFM stagesusceptible for energetic disturbances, ad the (Nano-finder) ad X-ray diffractorneter. In thespontaneous structure evolution can be realized in-situ observations with scanning electronreflecting on the nature of the applied microscope (SEM) and optical microscope, ainfluences. Especially, the highly organized comparison was made on te percolationstructures formed through the competition behaviors of liquid indium in between pristinebetween the agglomeration and the chemical and ion-irradiated areas. specially for thereactions in the mixture of transition metal SEM observation at high temperatures aelements (Ni, Co) and C60 have attracted much specially designed UHV-SFM was used wichinterest as nano-functional materials 1-3'. The was developed in NTT Basic Researchstructures obtained cannot be controlled easily, Laboratory.and it is important to explore te limitedcondition through the i-situ observations. In 3. Results and Discussionthe present study, the percolation of liquid The co-deposited films at room temperatureindium in meso-porous medium te mixture of are granular and meso-porous with the basicNi and C60 are reported based on the in-situ str"cture of Ni fine particles coated by carbonobservations at high temperatures with allotropes. Te meso-porous structure can bescanning electron microscope (SEM) and realized more easily with the ireasingoptical microscope (OM). fraction Of C60 molecules ad it is interesting
to control the interface properties of2. Experimentals meso-pores trough te conversion of carbon
The mixed and/or layered films between Ni allotropes by the eergetic ion bombardments.and C60 were prepared on MgO(100) at room A small chip of solid ii)dium with 99.9999%temperature under 10-8 Torr by operating two purity was placed on the pristine area of thedifferent evaporation sources independently. meso-porous films ad te in-silu observationThe deposition rate Of C60 was controled by of surface was performed with the low heatingchanging the temperature of Knudsen cell but fate (-5K/rnin). Even if after melting at 431K,the rate for nickel was ot controlled because liquid indium kept the round sape up tonickel was evaporated by electron around 670K with oly slight expansion. Butbombardment. The source aterials for C60 and after approaching to 670K, the drastic changeNi are relatively high quality with 99.99 was observed. The liquid indium started to
- 222 -
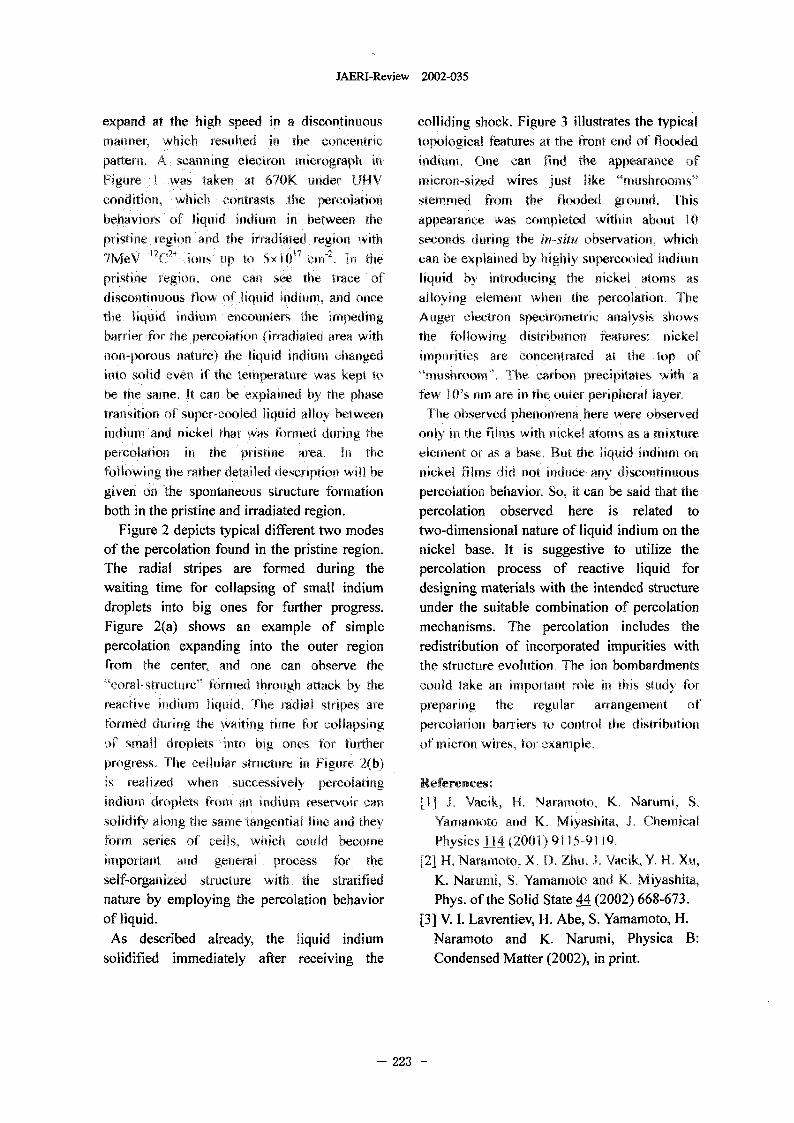
JAERI-Review 2002-035
expand at te high speed in a discontinuous colliding sock. Figure 3 illustrates te typica Imariners which resulted in t concentric topological features at the front ed of floodedpattent A sanning eectron icrograph in indium. Oe can find the appearance ofFigure I was taken at 670K uder U4V micron-sized wires Just like mushrooms"condition, which contrasts the percolation sternmed from the flooded ground. Thisbehaviors of liquid hidium in between the appearance was ompleted within about pristine region and the iadiated region with seconds ring the i-sin oservation wich
17 2,WeV "C'_' ios up to 5XIO 'in In the can be explained by ighly spercooled indimir
pristine region, one a see the trace of liquid by introducing the ikel ator"s asdiscontinuous flow of liquid idmin, and once alloying element wen the percolation. Tethe liquid indium encounters tile impeding Auger electron spectrometric analysis showsbarrier for the percolation (irradiated area, with tile following distribution features ilnonporous nature te liquid indium anged impurities are oentrated at the top ofinto solid even if tile temperature was kept to I'mushroom" Te carbon ecipitates it abe the same. It an be explained by te pase few I O's mrr are in the oter peripheral layer.transition of supercooled liquid alloy between Tile oserved penomena ere were observedindium and ickel that was formed during the only in te films with ickel atoms as a mixturepercolation in the pristine area, In the element or as a base. But te liquid indium onfollowing the rather detailed escription will be nickel films did ot induce any discontinuousgive o the spontaneous structure formation percolation behavior. So, it can be said that teboth in the pristine and iradiated region. percolation observed here is related to
Figure 2 depicts typical different two modes two-dimensional nature of liquid indiurn on theof the percolation found in the pristine region. nickel base. It is suggestive to utilize theThe radial stripes are formed during the percolation process of reactive liquid forwaiting time for collapsing of small indiurn designing materials with the intended structuredroplets into big ones for further progress. under the suitable combination of percolationFigure 2(a) shows an example of simple mechanisms. The percolation includes thepercolation expanding into the outer region redistribution of incorporated impurities withfrom the center, and one can observe the the structure evolution. The ion bombardments"coral-structure" formed through attack by the could take an important role in this study for
reactive indium liquid, The adial stripes are preparing tile regular arrangement offormed ring the waiting time for ollapsing percolation barriers to control the distributionof sall droplets ito big ones for fordier of micron wires, or examplesprogress. The eellular sucture in Fgure 2(b)is realized en sccessively percolating References.indirim droplets fom an indium reservoir can [11 J. acik 4 Nararnoto, K. Narumi S.solidify along te same tangential i a tey Yamarnoto ad K. Miyashita, J. Chemicalfortu series of cells, wich could becorne Physics 14 2001) 911 591 9.important ad general process for the [21 H. Narar"oto, X D. Zhu J Welk, H Xu,self-organized structure with te stratified K. Narumi, S. Yamamoto and K. Miyashita,nature by employing the percolation behavior Phys. of the Solid State 44 2002) 668-673.of liquid. [3] V. 1. Lavrentiev, H. Abe, S. Yamamoto, H.
As described already, the liquid indiurn Naramoto and K. Narumi, Physica B:solidified immediately after receiving the Condensed Matter 2002), in print.
- 223 -
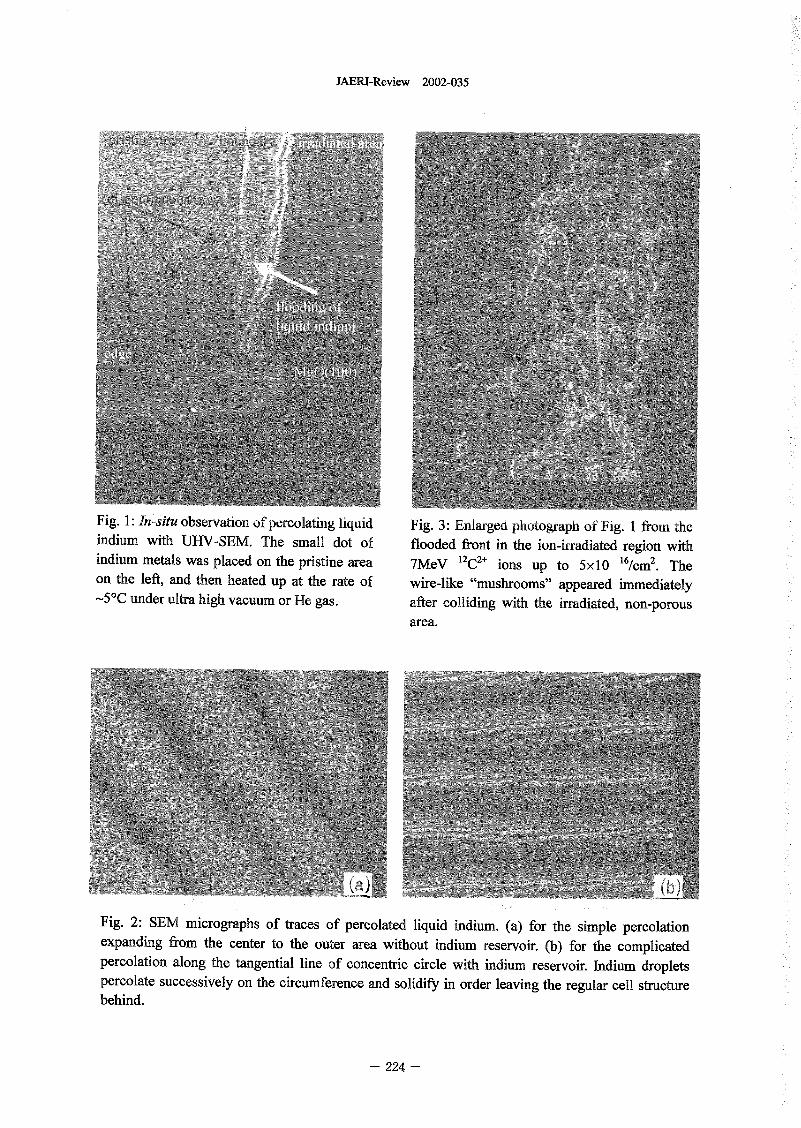
JAERI-Review 2002-035
Fig. 1: -In-situ observation of percolating liquid Fig. 3 Enlarged photograph of Fig. I from theindium with HV-SEM. The small dot of flooded front in the ion-irradiated region withindium metals was placed on the pristine area 7MeV 12C2+ ions up to 5 x 1 0 "/crn2. Theon the left, and then heated up at the rate of wire-like "mushrooms" appeared immediately-5'C under ultra high vacuum or He gas. after colliding with the irradiated, non-porous
area.
Fig. 2 SEM micrographs of traces of percolated liquid indium. (a) for the simple percolationexpanding from the center to the outer area without indium reservoir. (b) for the complicatedpercolation along the tangential line of concentric circle with indium reservoir. Indium dropletspercolate successively on the circumference and solidify in order leaving the regular cell structurebehind.
- 224 -
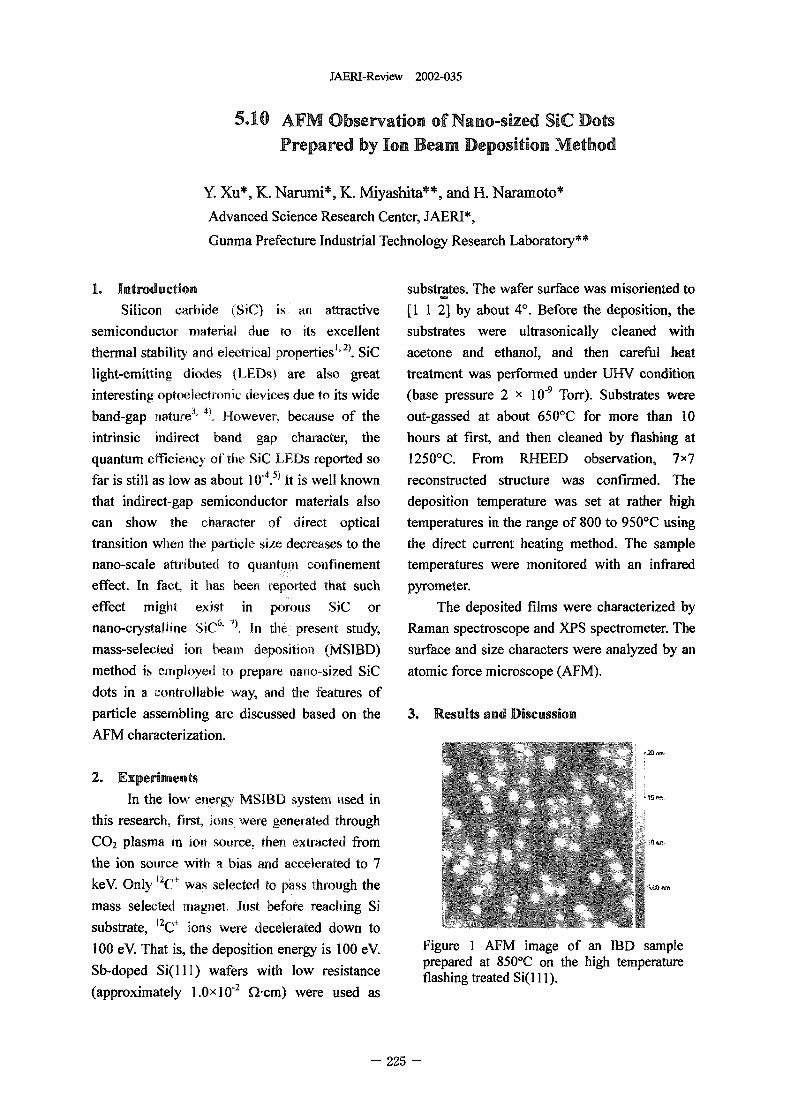
JAERI-Review 2002-035
5.10 AFM Observation of Nano-sized SiC DotsPrepared by Ion Beam Deposition Method
Y. Xu*, K. Narumi*, K. Miyashita", and H. Naramoto*Advanced Science Research Center, JAERI*,Gumna Prefecture Industrial Technology Research Laboratory"
1. Introduction substrates. The wafer surface was misoriented toSilicon carbide S is an attractive I 2 by about 4. Before the deposition, the
semiconductor material due to its excellent substrates were ultrasonically cleaned withthermal stability and electrical properties i 2. sic acetone and ethanol, and then careful heatlight-emitting diodes EDs) are also great treatment was performed under UHV conditioninteresting optoelectronic devices due to its wide (base pressure 2 x 10⁻⁹ Torr). Substrates wereband-gap nature 3 4 However, because of the out-gassed at about 650'C for more than intrinsic indirect ad gap character, the hours at first, and then cleaned by flashing atquantum efficiency of the Sic LEDs reported so 1250'C. From RHEED observation, 7x7far is still as low as about 104.1) It is well known reconstructed structure was confirmed. Thethat indirect-gap semiconductor materials also deposition temperature was set at rather highcan show the haracter of direct optical temperatures in the range of 800 to 950'C usingtransition wen te particle size decreases to the the direct current heating method. The samplenano-scale attributed to quanturn confinement temperatures were monitored with an infraredeffect. In fact, it as been reported that such pyrometer.effect might exist in porous Sic or The deposited films were characterized bynano-crystalline SiC6 7 In te present study, Ramanspectroscope and XPS spectrometer. Themass-selected ion beani deposition (MSIBD) surface and size characters were analyzed by anmethod is employed to prepare nano-sized Sic atomic force microscope (AFM).dots in a controllable way, and te features ofparticle assembling are discussed based on the 3. Results and DiscussionAFM characterization.
20
2. ExperimentsIn the low energy MSIBD system used in
this research, first, ions were generated throughC02 plasma in ion source, then extracted from INthe ion source with a bias and accelerated to 7keV. Only 12C+ was selected to pass through themass selected magnet. Jst before reaching Sisubstrate, 12C-1 ions were decelerated down toI 0 eV. That is, the deposition energy is I 0 eV. Figure I AFM image of an 1131) sampleSb-doped Si(III) wafers with low resistance prepared at 850'C on the high temperature
I.OX 1-2 flashing treated Si( I ).(approximately 0-cm) were used as
- 225 -
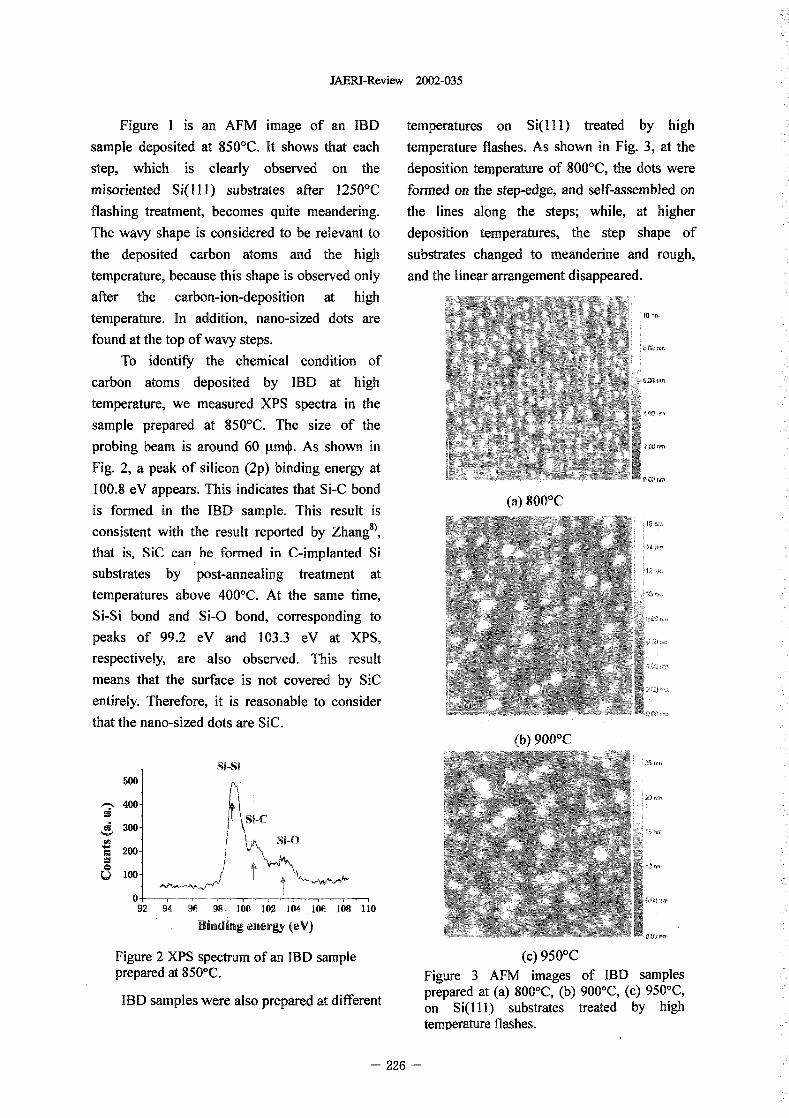
JAERI-Review 2002-035
Figure I is an AFM image of an 1131) temperatures on Si(Ill) treated by high
sample deposited at 850'C. It shows that each temperature flashes. As shown in Fig. 3 at the
step, which is clearly observed on the deposition temperature of 800'C, the dots were
misoriented Si(l1l) substrates after 12501C formed on the step-edge, and self-assembled on
flashing treatment, becomes quite meandering. the lines along the steps; while, at higher
The wavy shape is considered to be relevant to deposition temperatures, the step shape of
the deposited carbon atoms and the high substrates changed to meanderine and rough,
temperature, because this shape is observed only and the linear arrangement disappeared.
after the carbon-ion-deposition at high
temperature. In addition, nano-sized dots are 10
found at the top of wavy steps.
To identify the chemical condition of
carbon atoms deposited by 1131) at high �5 W".'.
temperature, we measured XPS spectra in the
sample prepared at 850'C. The size of the
probing beam is around 60 �tm�. As shown in
Fig. 2 a peak of silicon (2p) binding energy at
100.8 eV appears. This indicates that Si-C bond (a) O'Cis formed in the 11313 sample. This result is
consistent with the result reported by Zhang8),
that is, SiC can be.formed in C-implanted Si
substrates by post-annealing treatment at
temperatures above 4000C. At the same time,
Si-Si bond and Si-O bond, corresponding toM
peaks of 99.2 eV and 103.3 eV at XPS,
respectively, are also observed. This result
means that the surface is not covered by SiC
entirely. Therefore, it is reasonable to consider
that the nano-sized dots are SiC.(b) 900-C
Si-Si5D -
,-%, 400-
3D -SR-0 ila'
200
100
O+_ W92 94 98 100 102 104 0C 0 110
Binding energy (eV)
Figure 2 XPS spectrum of an 11313 sample (c) 950-Cprepared at 850'C. Figure 3 AFM images of 11313 samples
11313 samples were also prepared at different prepared at (a) 8000C, (b) 9000C, (c) 950'C,on Si( I 1) substrates treated by hightemperature flashes.
- 226 -
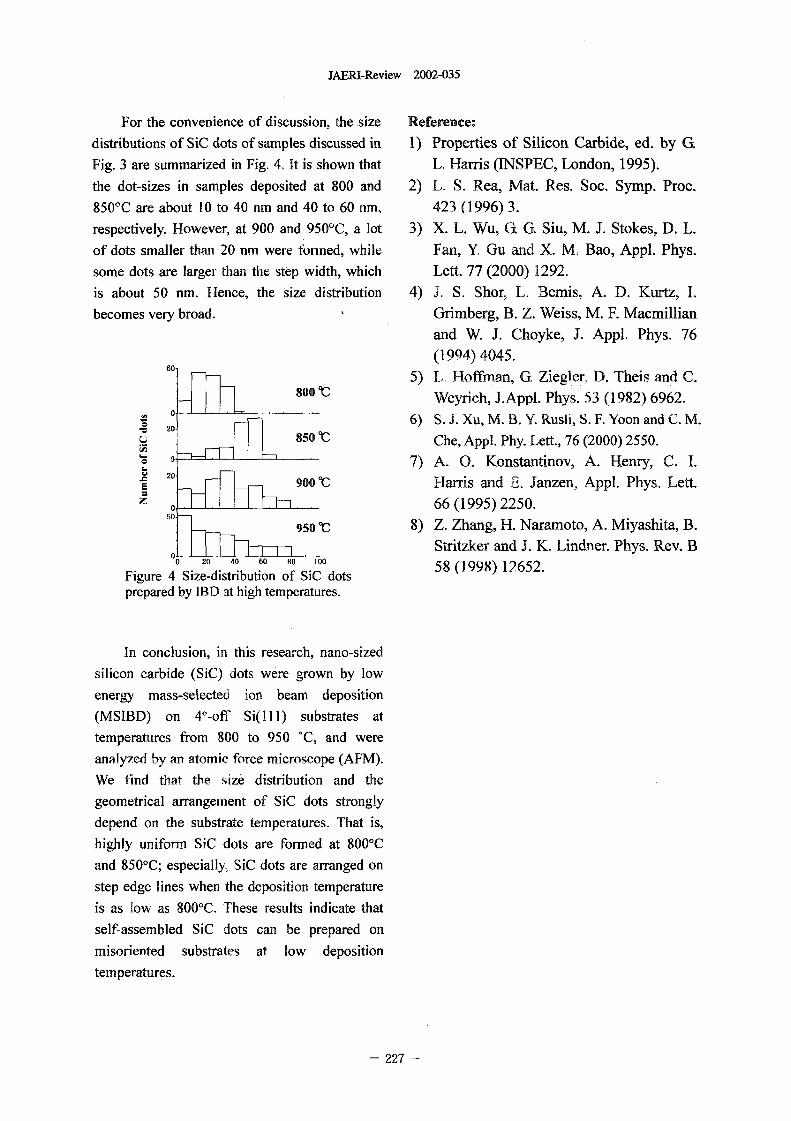
JAERI-Review 2002-035
For the convenience of discussion, thesize Reference:
distributions of SiC dots of samples discussed in 1) Properties of Silicon Carbide, ed. by G
Fig. 3 are summarized in Fig. 4 It is shown that L, Harris (INSPEC, London, 1995).
the dot-sizes in samples deposited at 800 and 2) L. S. Rea, Mat. Res. Soe. Symp. Proc.
850'C are about 10 to 40 nm and 40 to 60 nm, 423(1996)3.
respectively. However, at 900 and 950'C a lot 3) X. L. Wu, . G. Siu, M. J. Stokes, D. L.
of dots smaller than 20 nm were formed, while Fan, Y Gu and X. M. Bao, Appl. Phys.
some dots are larger than te step width, which Lett. 77 2000) 1292.
is about 50 nm. Hence, the size distribution 4) J. S. Shor, L. Bemis, A. D. Kurtz, I.
becomes very broad. Grimberg, B. Z. Weiss, M. F. Macmillian
and W. J. Choyke, J. Appl. Phys 76
(1994)4045.60 5) L. Hoffman, G. Ziegler, D. Theis and C.
800 C Weyrich, J.Appl. Phys. 53 1982) 6962.0 -
6) S. J. Xu, M. B. Y. Rush, S. F. Yoon and C. M.20
850 CC Che, Appl. Phy. Lett., 76 2000) 2550.0 7) A. 0. Konstantinov, A. Henry, C.
20
E Harris and E. Janzen, Appl. Phys. Lett.Z 0 9-00 Oc 66(1995)2250.
so 95OcC 8) Z. Zhang, H. Naramoto, A. Miyashita B.
0 Stritzker and J. K. Lindner. Phys. Rev. B0 20 40 60 80 100 58(1998)12652.
Figure 4 Size-distribution of SiC dotsprepared by ID at high temperatures.
In conclusion, in this research, nano-sized
silicon carbide (SiQ dots were grown by low
energy mass-selected ion beam deposition
(MSIBD) on 4off Si(]]]) substrates at
temperatures from 800 to 950 'C, and were
analy7ed by an atomic force microscope (AFNI).
We find that the size distribution and the
geometrical arrangement of SiC dots strongly
depend on the substrate temperatures. That is,
highly uniform SiC dots are formed at 8000C
and 850OC; especially, SiC dots are arranged on
step edge lines when the deposition temperature
is as ow as 8000C. These results indicate that
self-assembled SiC dots can be prepared on
misoriented substrates at low deposition
temperatures.
227 -
JAERI-Review 2002-035
5.11 Encapsulated Structure in CO-C60 System
V. Lavrentiev*, H. Naramoto% K. Narurni% S. Yamamoto**,
H. Abe*** and K, Miyashita****
Advanced Science Research Center, JAERI*,
Department of Materials Development, JAERT**,
Nuclear Eng. Research Laboratory, The University of Tokyo*'*,
Gunina Pref. Industrial Tech. Research Laboratory""
1. Introduction a result of simultaneous deposition
The assemblies of small ferromagnetic (co-deposition) of the components under
particles separated by non-magnetic 10-5 Pa. Co-deposition was executed using
material attract a great interest because of two different crucibles in the same vacuum
unique opportunity to get a system with chamber by eectron bombardment onto
extraordinary magnetic properties [1]. cobalt 99.9 mass. Co) and thermal
During several last years this idea has been sublimation Of C60 99.9 mass. C60). The
successftilly developed in Co-C system temperature of (0001) c-AI203 substrate
under the desire to create promising was varied in the range from 25'C (room
material for application in high-density temperature) to 400'C. To study the
recording media. Thus, a formation of mixture films by transmission electron
Co-C compositions by arc-discharge and microscopy (TEM) co-deposition has been
sputtering techniques based on also performed on (001) NaCl at room
immiscibility of the mixed components temperature. For TM experiments film
yields an encapsulated structure as Co thickness was varied from I to I 0 nrn.
nano-particles covered by graphitic layers The deposition parameters were chose so
[2-8]. Here we report a realization of as to achieve a Co:C atomic composition of
encapsulation in CO-C60 system during 2:1 in the ixture. As referred samples the
deposition of thin films with mixed pure Co and C60 fms were additionally
composition. Good quality (smoothness, prepared under the same experimental
adhesion) and reproducibility of the conditions.
realized films imply promising method
available for practice. 2.2 Experimental Techniques
The surface morphology of deposited
2. Experimental Procedures films was studied by atomic force
2.1 Thin film preparation microscopy (AFM) using JSPM-4200
Mixed CO+C60 films were grown up to scanning probe microscope. The phase and
200 rm in thickness on (0001) a-AI203 as structure analysis were made by electron
228 -
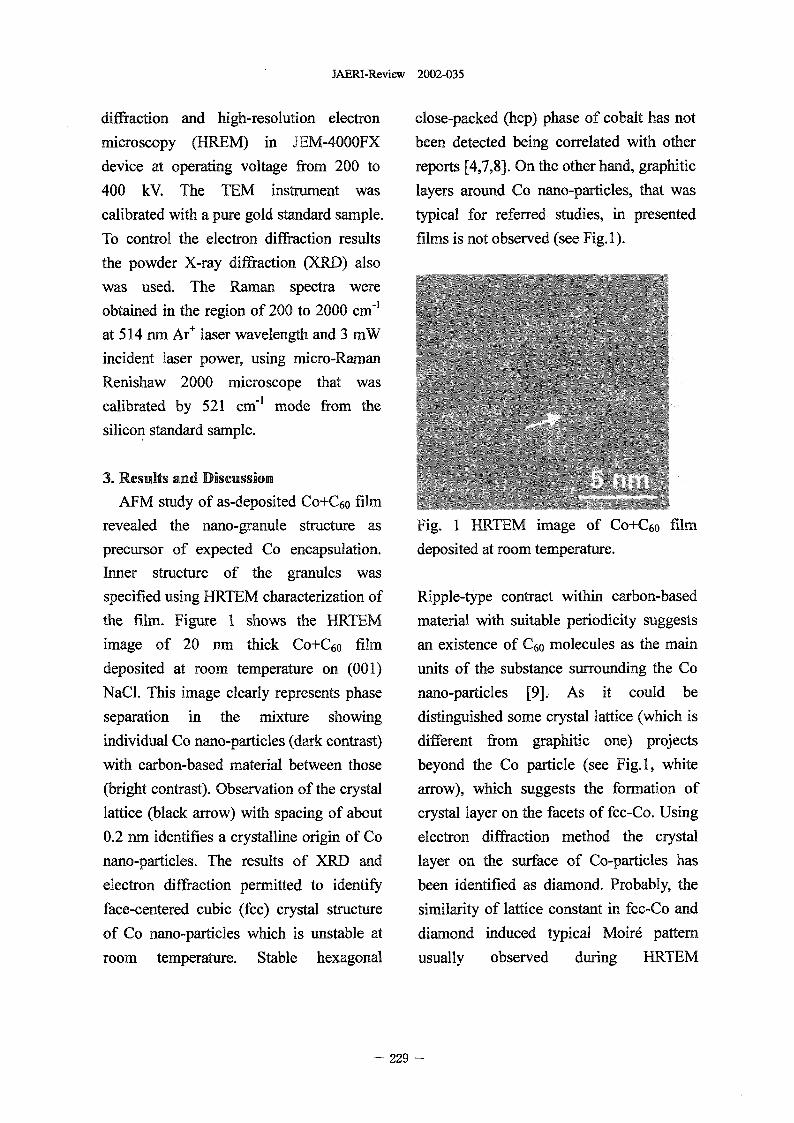
JAERI-Review 2002-035
diffraction and high-resolution electron close-packed (hcp) phase of cobalt has not
microscopy (HREM) in JEM-4000FX been detected being correlated with other
device at operating voltage from 200 to reports 4,7,8]. On the other hand, graphitic
400 W. The TEM instrument was layers around Co nano-particles, that was
calibrated with a pure gold standard sample. typical for referred studies, in presented
To control the electron diffraction results films is not observed (see Fig. ).
the powder X-ray diffraction XRD) also
was used. The Raman spectra were
obtained in the region of 200 to 2000 cm-,
at 514 nm Ar+ laser wavelength and 3 mW
incident laser power, using micro-Raman
Renishaw 2000 microscope that was
calibrated by 521 cm-1 mode from the
silicon standard sample.
3. Results and Discussion
AFM study of as-deposited CO+C60 fm
revealed the nano-granule structure as Fig. I HRTEM image Of CO+C60 fm
precursor of expected Co encapsulation. deposited at room temperature.
Inner structure of the granules was
specified using HRTEM characterization of Ripple-type contract within carbon-based
the film. Figure I shows the HRTEM material with suitable periodicity suggests
image of 20 nni thick CO+C60 filM an existence Of C60 molecules as the main
deposited at room temperature on (001) units of the substance surrounding the Co
NaCl. This image clearly represents phase nano-particles [9].. As it could be
separation in the mixture showing distinguished some crystal lattice (which is
individual Co nano-particles (dark contrast) different from graphitic one) projects
with carbon-based material between those beyond the Co particle (see Fig.1, white
(bright contrast). Observation of the crystal arrow), which suggests the formation of
lattice (black arrow) with spacing of about crystal layer on the facets of fcc-Co. Using
0.2 nm identifies a crystalline origin of Co electron diffraction method the crystal
nano-particles. The results of XRD and layer on the surface of Co-particles has
electron diffraction permitted to identify been identified as diamond. Probably, the
face-centered cubic (fcc) crystal structure similarity of lattice constant in fcc-Co and
of Co nano-particles which is unstable at diamond induced typical Moir6 pattern
room temperature. Stable hexagonal usually observed during HRTEM
- 229 -
JAERI-Review 2002-035
experiments. Negligible effect in Raman References
spectrum (small peak at 1328 cm-') reflects 1. Ch. Kittel, Phys. Rev. 70 (1946)
the limited formation of diamond on the 965-971.
facets of fcc-Co crystals, which could 2. V. P. Dravid, J. J. Host, M. H. Teng B.
occur as the epitaxial nucleation of Elliott, J. Hwang, D. L. Johnson, T. .
diamond under sufficient concentration of Mason, J. R. Weertman, Nature 374
carbon sp 3 sites and suitable value of local (1995) 602.
stresses [10,111, Remarkably, after 3. T. Hayashi, S. Hirono, M. Toinita S.
annealing even at 300'C strong Raman Urnemura, Nature 381 1996) 772-774.
peak arises at 1320 cm" suggesting the 4. J. Jiao, S. Serap1lin, X. Wang, J. C.
nucleation of damond on uncovered Co Withers, J Appl. Phys. 80 (1996)
crystals facets. According to Raman 103-108.
spectrum the carbon-based material 5. J. J. Delaunay, T. Nayashi, M. Tomita S.
between Co crystals includes mostly C60 Hirono J Appl. Phys. 82 (1997)
molecules distorted by the interaction with 2200-2208.
cobalt. The interaction destroys some 6. J. Rao, S. Seraphin J Appl. Phys. 83,
amount Of C60 molecules resulting in (1998) 2442-2448.
growth of carbon nano-structures by sp 3 7. J. M. Bonard, S. Seraphin, J. E.
and sp 2sites 11,12]. Intensity of Raman Wegrowe, J. Rao, A. Chatelain, Chem.
component corresponding to the destroyed Phys. Lett. 343 2001) 251-257.
C60 drastically increases with the 8. J. J. Host, J. A. Block, K. Parvin, V. P.
deposition temperature. This dependence Dravid, J. L. Alpers, T. Sezen R.
reflects the important role of thermal LaDuca J Appl. Phys. 83 (1998)
activation for efficiency of chemical 793-801.
interaction between Co atoms and C60 9. D. Kogura, S. Hameroff, J. Withers, R.
molecules. Analysis Of C60 Raman modes Loutfy, M. Sundareshan. Fullerene C6o.
shows that depending on the deposition Elsevier, Amsterdam, 1993.
temperature the chemical interaction can 10. V. Lavrentiev, H. Abe, S. Yamamoto H.
form CO-C60 complexes with the different Naramoto, K. Narumi, Molecular
structures. Since these complexes build the crystals and liquid crystals (in press).
carbon-based material between Co I 1. V. Lavrentiev, H. Abe, S. Yamamoto, H.
nano-crystals suitable thermal conditions Narainoto, and K. Narumi, Surface and
during CO+C60 mixture film preparation Interface Analysis (in press).
promises a set of potential materials with 12. V. Lavrentiev, H. Abe, S. Yamamoto, H.
different electronic properties. Naramoto, and K. Narumi, Physica B:
Condensed Matter (in press).
- 230 -
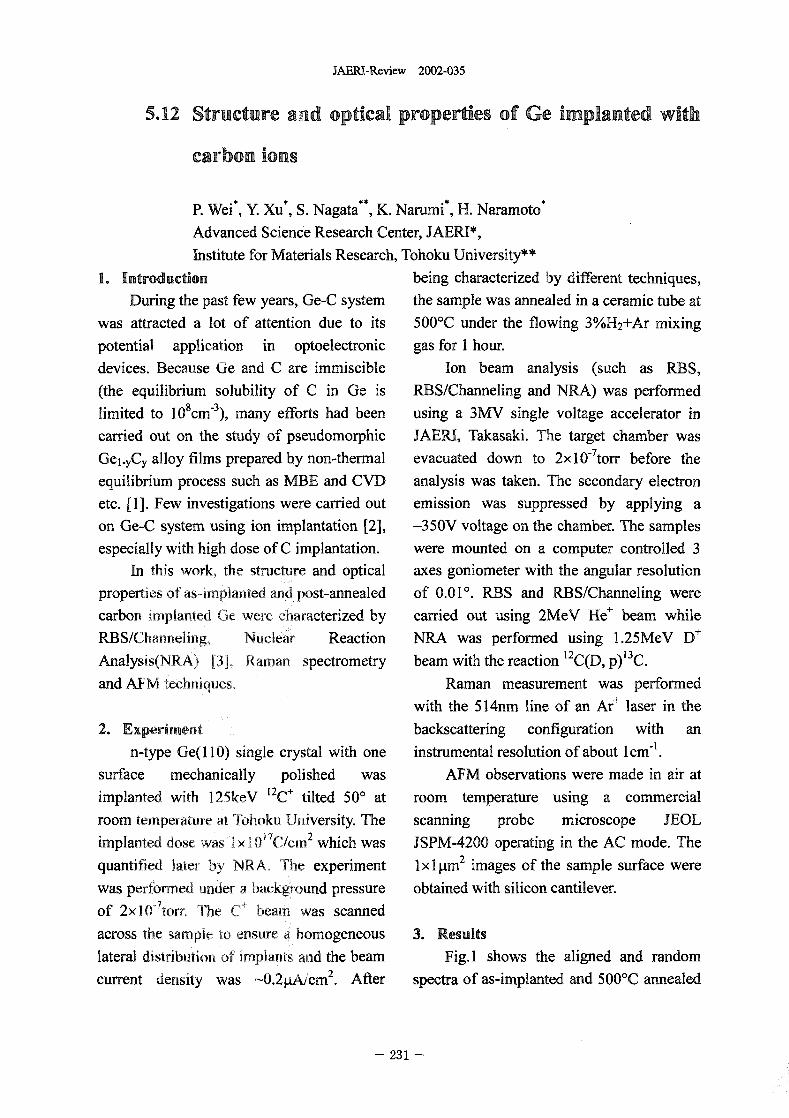
JAERI-Review 2002-035
5.12 Structure and optical properties of Ge mplanted with
carbon ions
P. Wei*, Y. Xu*, S. Nagata**, K. Narumi*, H. Naramoto*
Advanced Science Research Center, JAERI*,
Institute for Materials Research, Tohoku University"
1. Introduction being characterized by different techniques,During the past few years, Ge-C system the sample was annealed in a ceramic tube at
was attracted a lot of attention due to its 500'C under the flowing 3%H2+Ar mixing
potential application in optoelectronic gas for I hour.
devices. Because Ge and C are immiscible Ion beam analysis (such as RBS,
(the equilibrium solubility of C in Ge is RBS/Channeling and NRA) was performedlimited to 108CM-3), many efforts had been using a MV single voltage accelerator in
carried out on the study of pseudomorphic JAERI, Takasaki. The target chamber wasGel-yCy alloy films prepared by non-thermal evacuated down to 2x,0-7 torr before the
equilibrium process such as MBE and CVD analysis was taken. The secondary electronetc. [1]. Few investigations were carried out emission was suppressed by applying a
on Ge-C. system using ion implantation 2], -350V voltage on the chamber. The samples
especially with high dose of C implantation. were mounted on a computer controlled 3In tis work, the structure and optical axes goniometer with the angular resolution
properties of as-implanted and post-annealed of 0.01'. RBS and RBS/Channeling were
carbon implanted Ge were characterized by carried out using 2MeV He+ beam whileRBS/Channeling, Nuclear Reaction NRA was performed using 1.25MeV D+
Analysts(NRA 3 Raman spectrometry beam with the reaction 12 C(D, p) 13.
and AFM techniques, Raman measurement was performed
with the 514nm line of an Ar+ laser in the
2. Experionent backscattering configuration with an
n-type Ge(110) single crystal with one instrumental resolution of about I cm-
surface mechanically polished was AFM observations were made in air at
implanted with 125keV 12C+ tilted 500 at room temperature using a commercial
room temperature at Tohoku Uiversity. The scanning probe microscope JEOLimplanted dose was I x 1017C/el,"2 which was JSPM-4200 operating in the AC mode. The
quantified later by NRA. Te experiment lXlPm 2 images of the sample surface were
was performed under a background ressure obtained with silicon cantilever.
of 2x I 07torr, The C"' beam was scanned
across the sample to ensure a homogeneous 3. Results
lateral distribution of implants and the beam Fig.1 shows the aligned and random
current density was -0.2pAicm. 2. After spectra of as-implanted and 500'C annealed
- 231 -
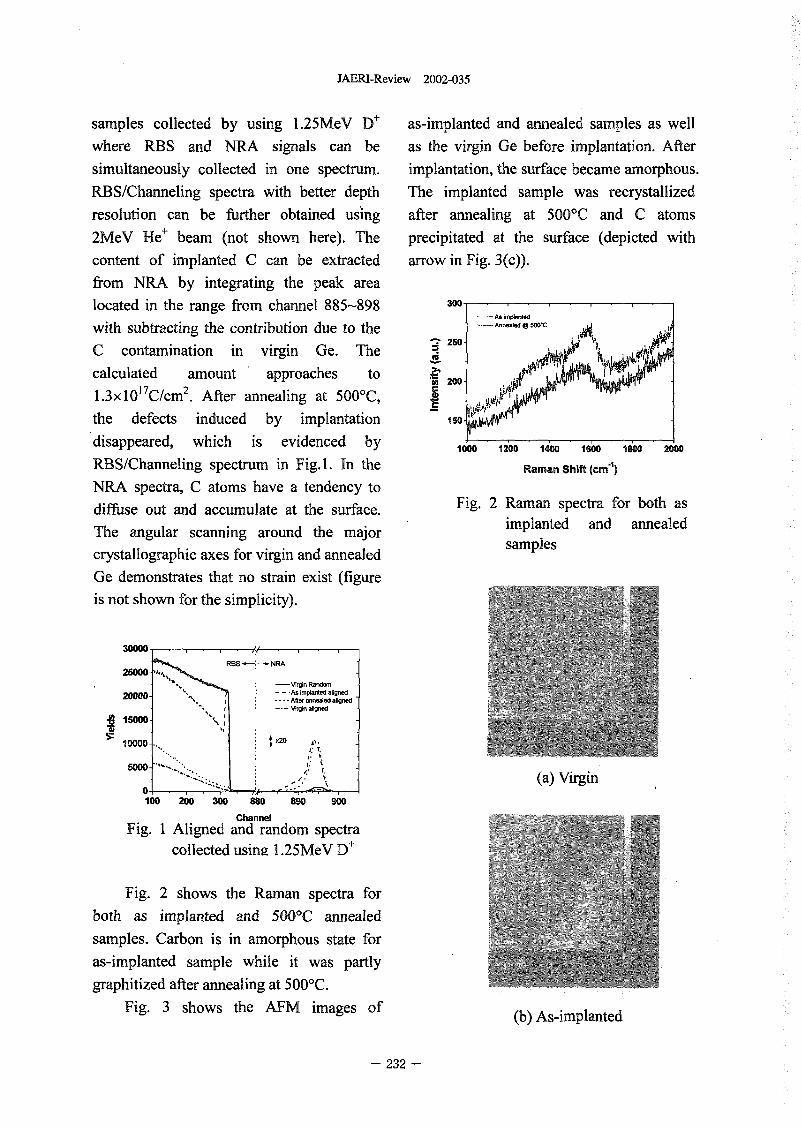
JAERI-Review 2002-035
samples collected by using 1.25MeV D as-implanted and annealed samples as well
where RBS and NRA signals can be as the virgin Ge before implantation. After
simultaneously collected in one spectrum. implantation, the surface became amorphous.
RBS/Channeling spectra with better depth The implanted sample was recrystallized
resolution can be further obtained us ing after annealing at 500'C and C atoms
2MeV He+ beam (not shown here). The precipitated at the surface (depicted with
content of implanted C can be extracted arrow in Fig. 3(c)).
from NRA by integrating the peak area
located in the range fTom channel 885-898 300--A' nPI-ted
with subtracting the contribution due to the ------ A..O.W 5WC
-':' 250-C contamination in virgin Ge. The R
calculated amount approaches to 'Vi 200-1.3x 10¹¹C/CM2 . After annealing at 500T, C
the defects induced by implantation 150PI.
disappeared, which is evidenced by 1000 liOU 140 400 160 2M
RBS/Channeling spectrum in Fig.l. In the Raman Shift (CM4)
NRA spectra, C atoms have a tendency todiff-use out and accumulate at the surface. Fig. 2 Raman spectra for both as
implanted and annealedThe angular scanning around the major samplescrystallographic axes for virgin and annealed
Ge demonstrates that no strain exist (figure
is not shown for the simplicity).
30W -RBS NRA
26WO -Mr& Random
20WO- -As mparted aUgned.... After annealed aligned
Wgin akjed
16WO_
10000- )aO
(a) Virgino4-100 2W 360 NO 890 960
ChannelFig. I Aligned and random spectra
collected usin2 1.25MeV D+
Fig. 2 shows the Raman spectra for
both as implanted and 500'C annealed
samples. Carbon is in amorphous state for
as-implanted sample while it was partly
graphitized after annealing at 5001C.
Fig. 3 shows the AFM images of (b) As-implanted
-232 -
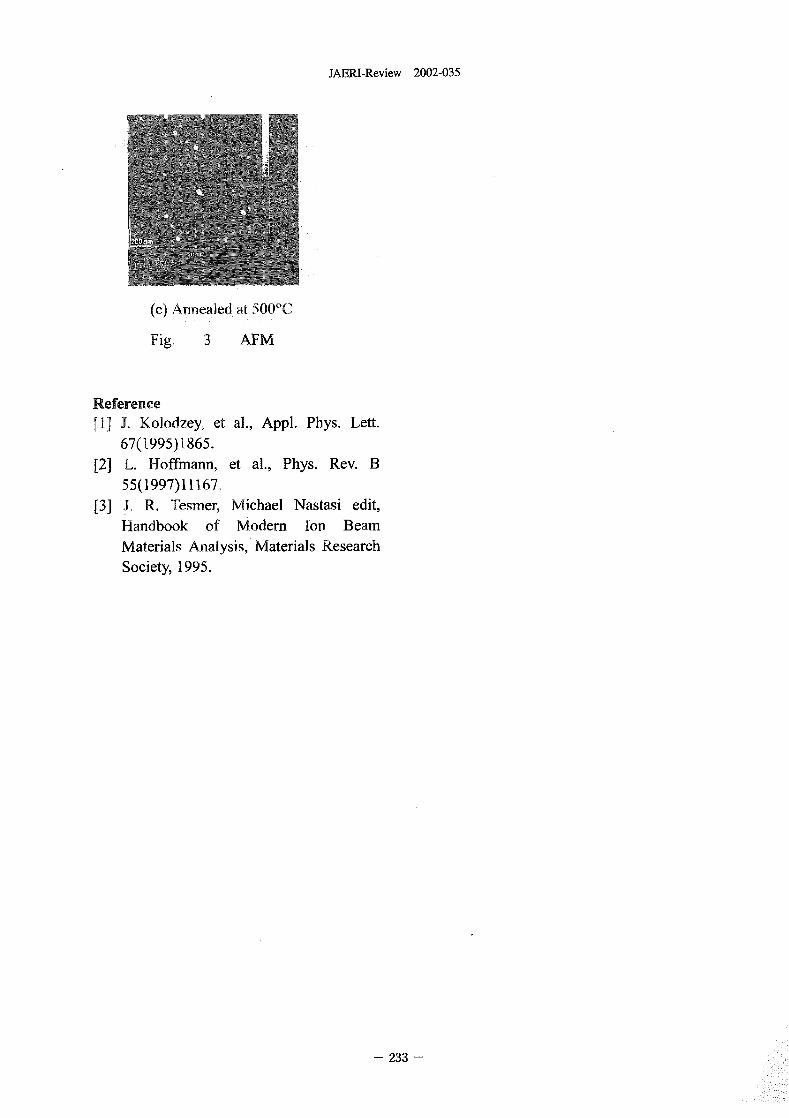
JAERI-Review 2002-035
(c) Annealed at 500'C
Fi& 3 AFM
Reference[1] J. Kolodzey, et al., Appl. Phys. Lett.
67(1995)1865.[2] L. Hoffmann, et al., Phys. Rev.
55(1997)II16T[3] J� R. Tesmer, Michael Nastasi edit,
Handbook of Modem Ion Beam
Materials Analysis, Materials Research
Society, 1995.
233 -
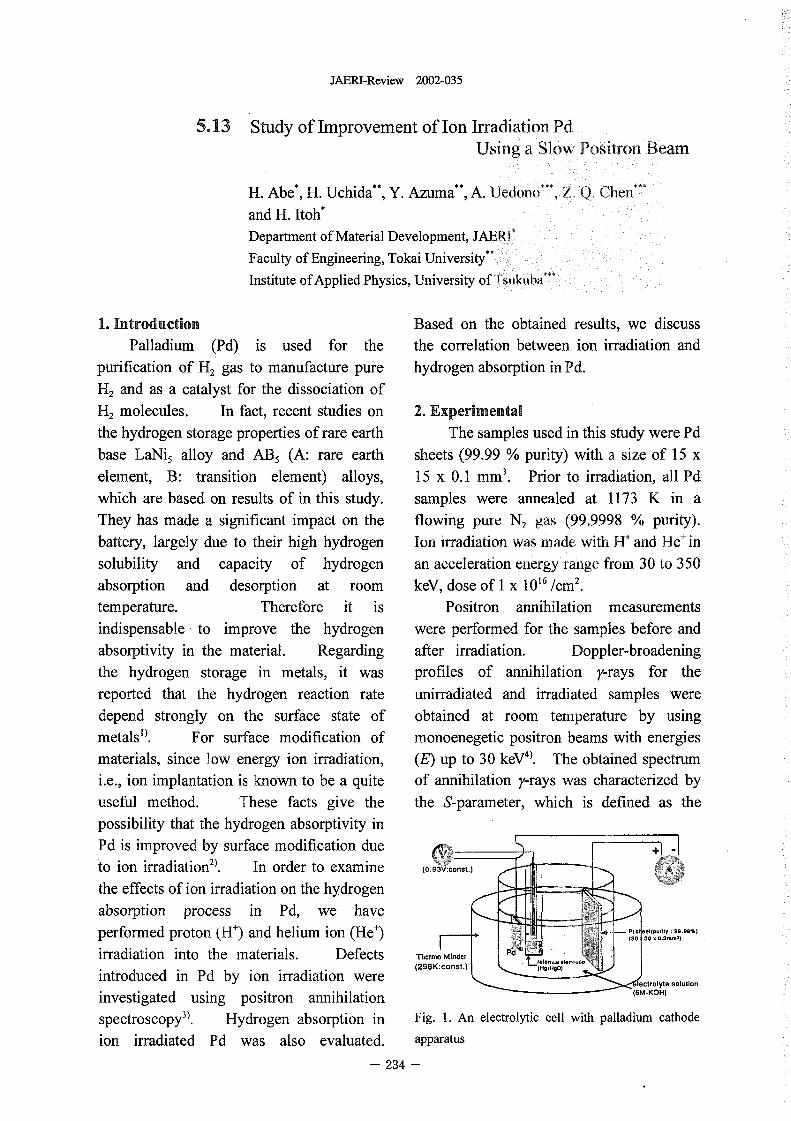
JAERI-Review 2002-035
5.13 Study of Improvement of Ion Irradiation PdUsing a Slow Positron Beam
H. Abe*, H. Uchida**, Y. Azuma**, A. Uedono***, Z 6 Chen"'
and H. Itoh*Department of Material Development, JAERt'Faculty of Engineering, Tokai University"Institute of Applied Physics, University of Tsukuba
1. Introduction Based on the obtained results, we discussPalladium (Pd) is used for the the correlation between ion irradiation and
purification of H, gas to manufacture pure hydrogen absorption in Pd.H2 and as a catalyst for the dissociation of1-12molecules. In fact, recent studies on 2. Experimentalthe hydrogen storage properties of rare earth The samples used in this study were Pdbase LaNi, alloy and AB, (A: rare earth sheets 99.99 purity) with a size of 15 xelement, B: transition element) alloys, 15 x 0 I mm'. Prior to irradiation, all Pdwhich are based on results of in this study. samples were annealed at 1173 K in aThey has made a significant impact on the flowing pure N gas 99.9998 purity).battery, largely due to their high hydrogen Ion irradiation was ade with Wand He'insolubility and capacity of hydrogen an acceleration energy range from 30 to 350absorption and desorption at room keV, dose of I x 10" /cm'.temperature. Therefore it is Positron annihilation measurementsindispensable to improve the hydrogen were performed for the samples before andabsorptivity in the material. Regarding after irradiation. Doppler-broadeningthe hydrogen storage in metals, it was profiles of annihilation y-rays for thereported that the hydrogen reaction rate unirradiated and irradiated samples weredepend strongly on the surface state of obtained at room temperature by usingmetals'). For surface modification of monoenegetic positron beams with energiesmaterials, since low energy ion irradiation, (E) up to 30 keV'). The obtained spectrumi.e., ion implantation is known to be a quite of annihilation y-rays was characterized byuseful method. These facts give the the S-parameter, which is defined as thepossibility that the hydrogen absorptivity inPd is improved by surface modification dueto ion irradiation'). In order to examine (0.93V:canst.)
the effects of ion irradiation on the hydrogenabsorption process in Pd, we have
PI.I.W(P.,11y: 99.98%)performed proton (H') and helium ion (He') F_ (30 30.3..-)
irradiation into the materials. Defects Thenno Minder
introduced in Pd by ion irradiation were (298K:const.)solution
investigated using positron annihilationspectroscopy'). Hydrogen absorption in Fig. 1. An electrolytic cell with palladium cathode
ion irradiated Pd was also evaluated. apparatus
- 234 -
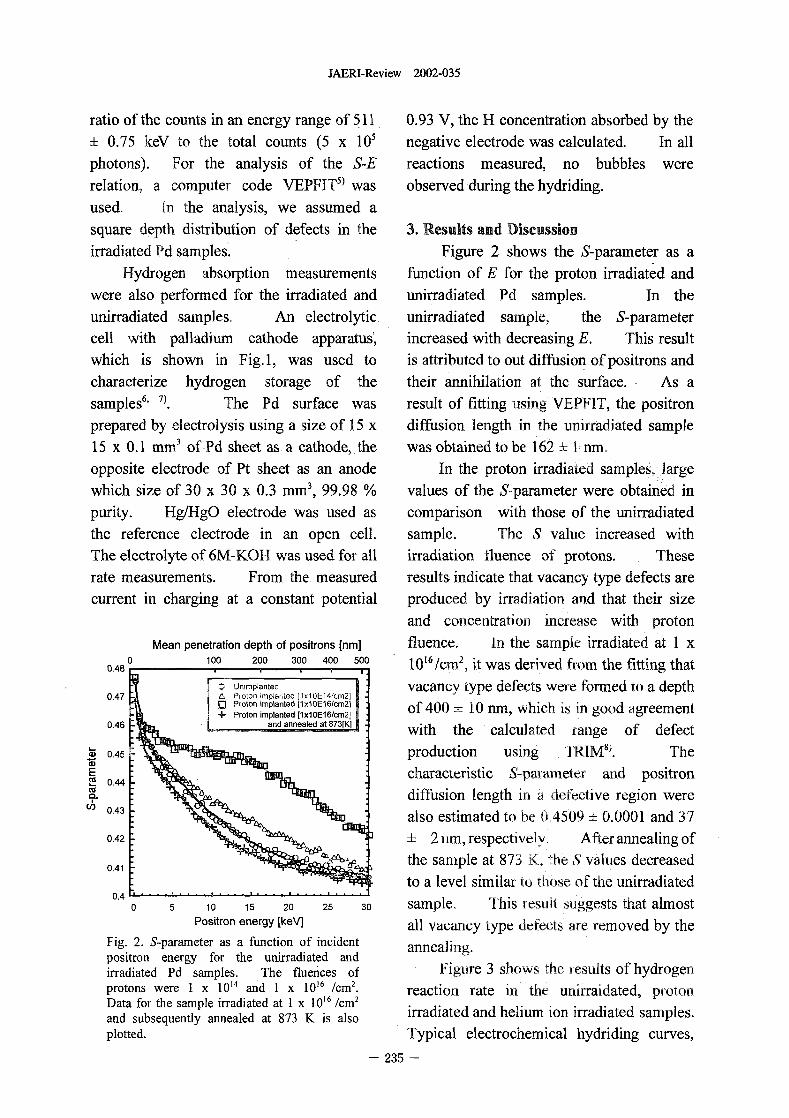
JAERI-Review 2002-035
ratio of the counts in an energy range of 511 0.93 V, the H concentration absorbed by the0.75 keV to the total counts (5 x 10' negative electrode was calculated. In all
photons). For the analysis of the S-E reactions measured, no bubbles wererelation, a computer code VEPFIV) was observed during the hydriding.
used. tn the analysis, we assumed asquare depth distribution of defects in the 3. Results and Discussion
irradiated Pd samples' Figure 2 shows the S-parameter as aHydrogen absorption measurements ftmction of E for the proton irradiated and
were also performed for the irradiated and unirradiated Pd samples. In theunirradiated samples. An electrolytic unirradiated sample, the S-parametercell with palladium cathode apparatus, increased with decreasing E. This resultwhich is shown in Fig. 1, was used to is attributed to out diffusion of positrons andcharacterize hydrogen storage of the their annihilation at the s urface. As asamples', ). The Pd surface was result of fitting sing VEPFIT, the positronprepared by electrolysis using a size of 15 x diffusion length in te unirradiated sample15 x 01 mm' of d sheet as a cathode, the was obtained to be 162 I nin,opposite electrode of Pt sheet as an anode In the proton irradiated samples, largewhich size of 30 x 30 x 03 MM3, 99.98 values of the S-pararneter were obtained in
purity. Hg/HgO electrode was used as comparison with those of the unirradiatedthe reference electrode in an open cell. sample. The value increased withThe electrolyte of 6M-KOH was used for all irradiation luence of protons. Theserate measurements. From the measured results indicate that vacancy type defects arecurrent in charging at a constant potential produced by irradiation and that their size
and concentration increase with proton
Mean penetration depth of positrons [nm] fluence. In the sample irradiated at I x0 100 200 300 400 500
0.48 IO " /cm', it was derived froin the fitting that0 Unimplanted vacancy type defects were formed to a depth
0.47 L Pioton iplanted [1xl0L14!crn2jEl Proton implanted [1x10E16/cm2j of 400 10 nm, which is in good agreement+ Proton implanted [1x10E16/cm2j
0.46 and annealed at 873[K] with the calculated range of defect
0.45 production using TRIM,). TheE characteristic S-paranieter and positronW" 0.44C9 diffusion length i a defective region were
0.43 also estimated to be 04509 0.0001 and 37
0.42 3 ± 2 im, respectively. After annealing of
0.41 1 the sample at 873 K, the values decreasedto a level similar to d1OSe Of te unirradiated
0.4 0 5 1 0 1 5 20 25 30 sample, This result s gests tat almostPositron energy [keV] all vacancy type efects are removed by the
Fig. 2. S-parameter as a function of incident annealing.positron energy for the unirradiated andirradiated Pd samples. The fluences of FigLjre 3 shows the results of hydrogenprotons were I x 10" and I x 1016 /CM2. reaction rate i te unirraidated, poton
Data for the sample irradiated at I x 10" /cm' irradiated and helium ion irradiated samples.and subsequently annealed at 873 K is alsoplotted. Typical electrochemical hydriding curves,
- 235 -
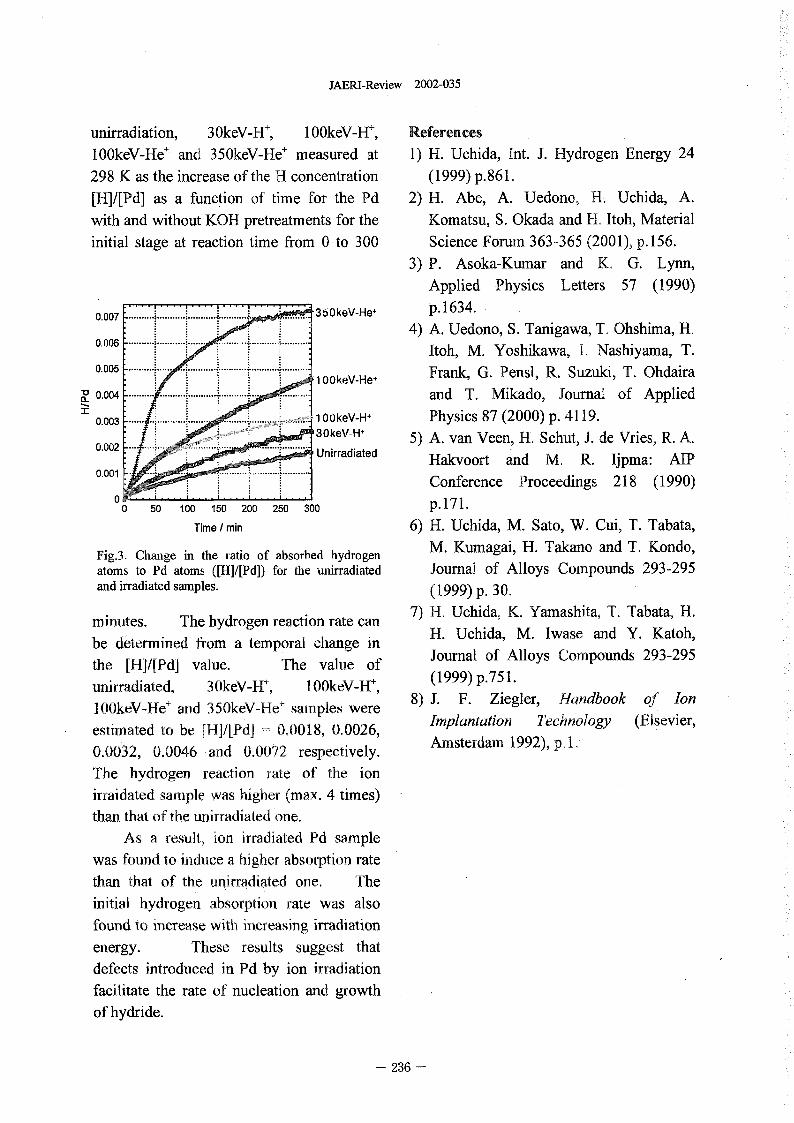
JAERI-Review 2002-035
unirradiation, 3 OkeV-H I 00keV-H References
100keV-He' and 350keV-He+ measured at 1) H. Uchida, Int. J. Hydrogen Energy 24298 K as the increase of the H concentration (1999) p.861.[H]/[Pd] as a function of time for the Pd 2) H. Abe, A. Uedono, H. Uchida, A.with and without KOH pretreatments for the Komatsu, S. Okada and H Itoh, Materialinitial stage at reaction time from to 300 Science Forum 363-365 2001), p.156.
3) P. Asoka-Kumar and K. G. Lynn,Applied Physics Letters 57 1990)
.... p.1634�0.007 ........... ........... ........... .......... 350keV-He+
4) A. Uedono, S. Tanigawa, T. Ohshima H.0.006 ........... ........ ........... ..........
Itoh, M. Yoshikawa, 1. Nashiyama T.0.005 ........... ........... ...................... Frank, G. Pensl, R. Suzuki, T. Ohdaira1 00keV-He+0.004 ........ and T. Mikado, Journal of Applied
0.003 1 00keV-H+ Physics 87 2000) p. 4119..... .. .... . 30keV-H4
0.002 5) A. van Veen, H. Schut, J. de Vries, R. A.Unirradiated Hakvoort and M. R. jprna: AIP
0.001 ....................Conference Proceedings 218 1990)
0 50 100 150 200 250 300 p 17 .Time min 6) H. Uchida, M. Sato, W. Cui, T. Tabata,
Fig.3. Change in the f atio of absorbed hydrogen M. Kumagai, H. Takano and T. Kondo,atoms to Pd atoms ([H]/[Pd]) for the unirradiated Journal of Alloys Compounds 293-295and irradiated samples. (1999) p. 30�
minutes. The hydrogen reaction rate can 7) 1-1. Uchida, K. Yamashita, T. Tabata H.
be determined from a temporal change in H. Uchida, M. Iwase and Y. Katoh,the [H]/(Pd] value. The value of Journal of Alloys Compounds 293-295
+ (I 999) p. 75 .unirradiated, 30keV-H-, 100keV-H,8) J. F. Ziegler, Handbook of Ion
100keV-He+ and 350keV-He' samples were Implantation Technology (Elsevier,estimated to be [14]/[Pd] = 0,0018, 00026, Amsterdam 1992), p I0.0032, 00046 and 00072 respectively.The hydrogen reaction rate of the ionirraidated sample was higher (max. 4 times)than that of the unirradiated one.
As a result, ion irradiated Pd samplewas found to induce a higher absorption ratethan that of the unirradiated one, Theinitial hydrogen absorption rate was alsofound to crease with increasing irradiationenergy. These results suggest thatdefects introduced in Pd by ion irradiationfacilitate the rate of nucleation and growthof hydride.
236 -
JAERI-Review 2002-035
5.14 Anomalous chemical bond formation in polycarbonate by cluster impact
K.,Hirata'. Y. Saitob", K. Nanimi"', Y. Kobayashi', and K. Arakawa"
National Institute of Advanced Industrial Science and Technology (AIST), Tsukuba, lbaraki
305-8565,Japan*
Advanced Radiation Technology Center, JAERL Takasaki, Gurnma 370-1292, Japan-
Advanced Science Research Center, JAERI, Takasaki, Guiuma 370-1292, Japan-
1. Introduction of the sample srface. All measurements were
Incident ions passing through a matter are carried out on a Bio-Rad FTE-40 spectrometer at a
slowed dow b electronic and nuclear interaction resolution of 4 m71 emploving a 45' cut ZnSe
with target aoms, For ion irradiation of a polymer, internal reflection element, 128 scans were
its chemical structure is inevitably changed by the collected and te signals were averaged to reduce
interaction T effect of cluster ion irradiation is spectral noise.
different from flat of single ion irradiation in local
energy deposition density because the constituent 3. Results and dscussion
atoms originating from the same cluster ATR-FTER spectra for unirradiated and 0 19
simultaneously impact on a very small egion. MeWatorn-C,_�'(n=1, 8)-irradiated PC are shown in
Therefore, cluster ion iadiation of a polymer is Fig. 1. The spectra ae nonnahzed to the intensity
expected to provide unique chemical modification. of the 1504 cm-' band (due to aromatic C-Q, which
In this paper, we present results of FTIR is little affected by ion irradiation 3). Characteristic
measurements for single-ion and cluster-ion changes in Fig. I are: (a) formation of the broad band
irradiated polycarbonate (PC). The measurements between 2500 and 3650 cm-', with a peak around
were carried out to study chemical modification by 3420 cm-', for the irradiated samples, (b)
the irradiations enhancement in the intensity at 2930 c-1 for the
C8+-irradiated sample. The boad band (a) mainly
2. Experimental corresponds to hydroxyl OH species and the peak at
Various single ions (B', C', Si+, and Cu+ ions at 2930 cm-' (b) is assigned to CH2 stretching mode.
energies between 019 MeV and 2255 MeV) and The spectra for irradiated PC around the
cluster ions (0. l9MeV/at0M-C4', C6+ and Cg+, wavenumber region, were the characteristic changes
0.3MeV/atOM-C4+ and C6+) were irradiated on (a) and .(b) were observed, consist of te several band
amorphous polycarbonate (PC) films with a thickness contributions. We paid attention to three major
of 100 g n and a density of 12 g/CM3. Cluster ion peaks due to OH, CH, asynitnetric stretching and
irradiation was carried out at JAERI/TakaSaki 2 CRI asymmetric stretching and evaluated these peak
Attenuated total reflectance (ATR) Fourier intensities, Iff, IcH,� cH3, by the following way; I
transform infrared (Fr-IR) spectroscopy was the broad OH intensity IoH was determined as the
employed to sensitively detect chemical modification
- 237 -
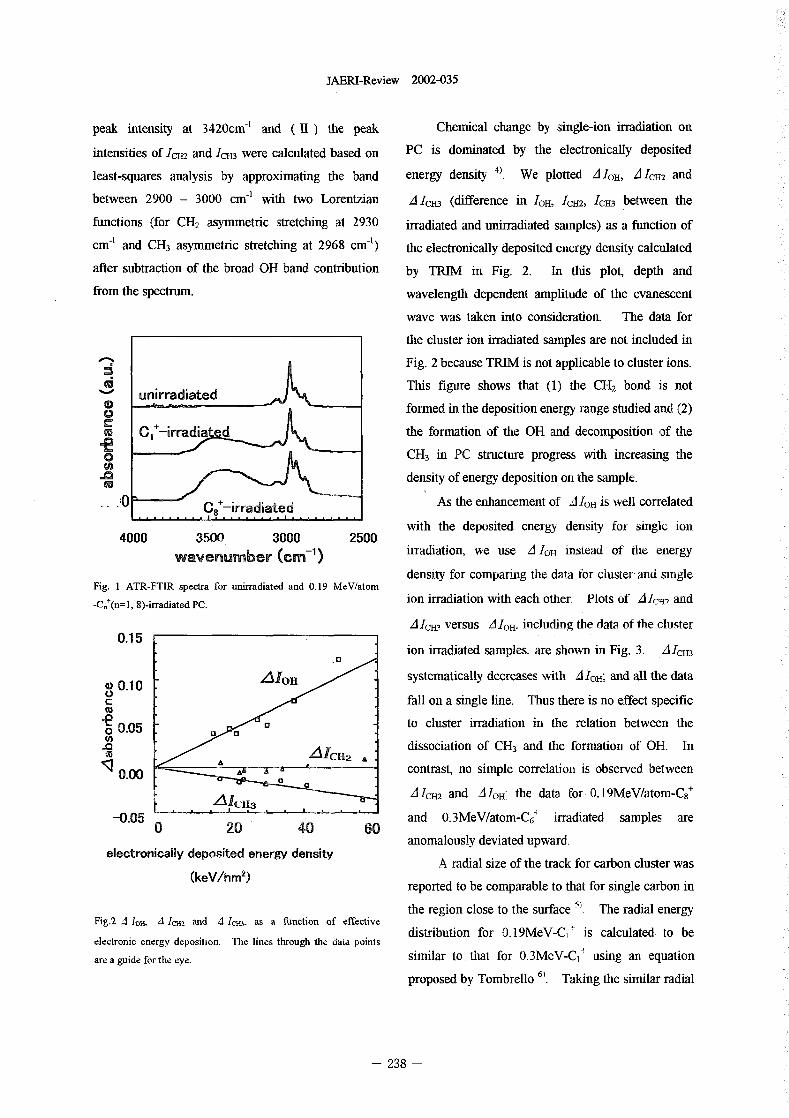
JAERI-Review 2002-035
peak intensity at 3420crW' and ( U ) the peak Chemical change by single-ion irradiation on
intensities of IcH2 and IcH3 were calculated based on PC is dominated by the electronically depositedenergy density A IcH2 and
least-squares analysis by approximating the band . We plotted A 10H,
between 2900 - 3000 cm-' with two Lorentzian A cH3 (difference in IOH, IcH2, cH3 between the
functions (for CH2 asymmetric stretching al 2930 irradiated and unin-adiated samples) as a function of
cm-1 and CH3 asyrnmetric stretching at 2968 cm-') the electronically deposited eergy density calculated
after subtraction of the broad OH band contribution by TRIM in Fig. 2 In this plot depth and
from the spectrum. wavelength dependent aplitude of the evanescent
wave was taken into consideration. The data for
the cluster ion irradiated samples are not included in
Fig. 2 because TRIM is not applicable to cluster ions.
U1111-radiated This figure shows that (1) the .CH2 bond is not
formed in the deposition energy range studied and 2)
M Cl'-irra the formation of te OH and decomposition of the-E0 CH3 in PC structure progress with increasing theto
.0 density of energy deposition o [lie sample.
As the ehancement of 10H is well correlated0 -irradiated
with the deposited energy density for single ion4000 3500 3000 2500
wavenumber (cm-') irradiation, we use A OH instead of te eergy
density for comparing the data for cluster ad singleFig. I ATR-FTIR spectra for unirradiated and 019 MeV/atom
-C.'(n=1, 8)-irradiated PC. ion irradiation with each other. Plots of A R2 and
Alclilversus IOHincitidingtbedataofthecltister0.15
ion irradiated samples- are sown in Fig. 3 A IcH3
AIOH systematically decreases with A IOH; and all the data0.10
fall on a single line. Thus there is no effect specific
_e to cluster irradiation in the relation between the0 005Cn
Ir dissociation of CH3 and the formation of' OH, In'61CIJ2 ,
0.00 0 contrast, no simple correlation is observed between
AICH2 and I,,H. the data for 0.19MeV/atom-C8+A]c-0.05 - and 0.3MeV/at0M-C6_' irradiated samples are
0 20 40 60anomalously deviated upward.
electronically deposited energy density A radial size of the track for carbon cluster was
(keVtnM2) reported to be comparable to that for single carbon in
the region close to the surface ;, The radial energyFig.2 A IOH, A cH2 and A H3, as a function of effective distribution for O.M eV-C�` is calculated to beelectronic energy deposition. The lines through the data points
are a guide for the eve. similar to thal for 0.3MeV-C,4 using an equation1 6proposed by Tombrel Taking the similar radial
238 -
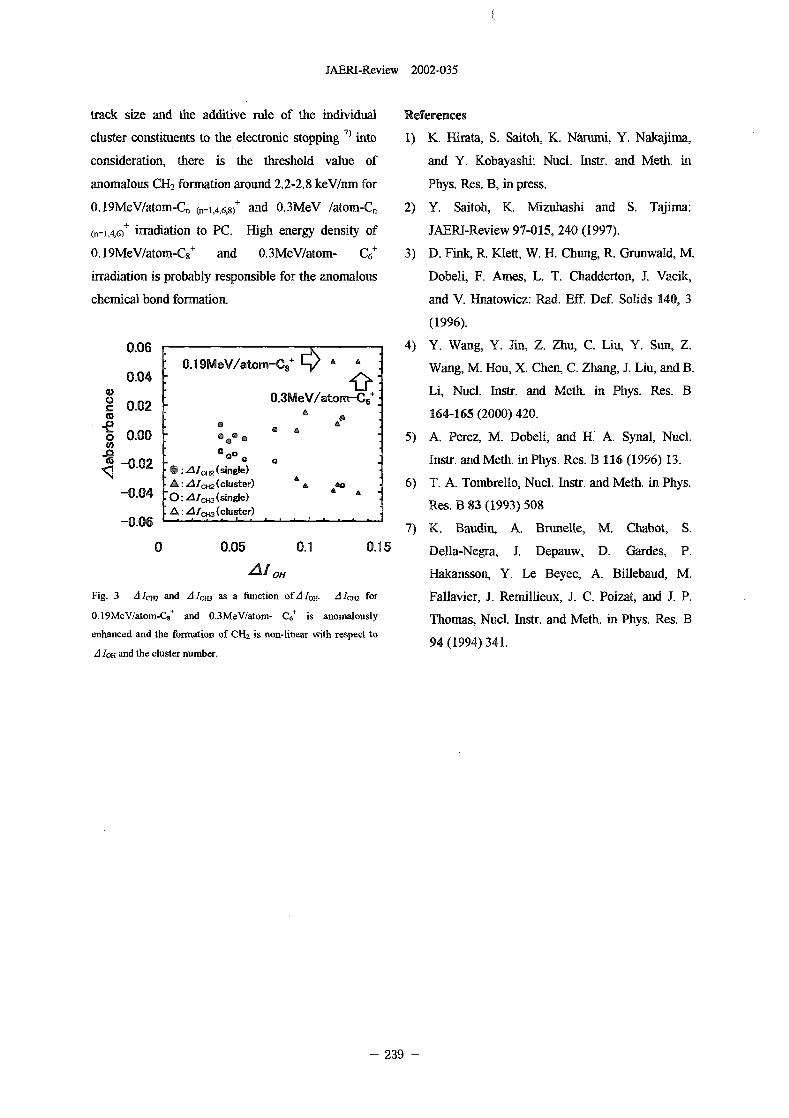
JAERI-Review 2002-035
track size and the additive rule of the individual References
cluster constituents to the electronic stopping into 1) K. 1irata, S. Saitoh, K. Narumi, Y. Nakajima,
consideration, there is the threshold value of and Y. Kobayashi: Nucl. Instr. and Meth in
anomalous CH2 forl-nation around 22-2.8 keV/nm for Phys. Res. B, in press.
0.19MeV/atoM-Cn (n=1,1,6,8)+ and 0.3MeV /atom-Q, 2) Y. Saitoh, K. Mizubashi and S. Tajima:
(n=1,4,6)+ irradiation to PC. ligh nergy density of JAERI-Review 97-015, 240 1997).
0. 19MeV/atom-Cg+ and 0.3MeV/atoni- C6+ 3 D. Fink, R. Klett, W. H. Chung, R. Gnmwald, M.
irradiation is probably responsible for the anomalous Dobeli, F. Ames, L. T. Chadderton, J. Vacik,
chemical bond foliation. and V. Hnatowicz: Rad. Eff. Def Solids 140 3
(1996).
0.06 4) Y. Wang, Y. Jin, Z. hu, C. Liu, Y. Sun, Z.
0.19MeWatom-Cg' Wang, M. Hou, X. Chen, C. Zhang, J. Liu, and B.0.04
0.3MeV/ataM-C6- Li, Nucl. Instr. and Meth. in Phys. Res. B0.02 164-165 2000) 420.
-e0 0.00 coo I 5) A. Perez, M. Dobeli, and H. A. Synal, Nucl.
0 Instr. and Meth. in Phys. Res. B 116 1996) 13.-0.02 0:,61,M(single)
A:A/_,2(cluster) 6) T. A. Tombrello, Nucl. Instr. and Meth. in Phys.--0-04 O:AIGHg(single) Res. B 83 1993) 508
luster)-0.06 7) K. Baudin, A. Brunelle, M. Chabot, S.
0 0.05 0.1 0.15 Della-Negra, J. Depauw,. D. Gardes P.
Al OH Hakansson, Y. Le Beyec, A. Billebaud M.
Fig. 3 A IcH2 and A H3 as a function of A IH. A IcH2 for Fallavier, J. Remillieux, J. C. Poizat, and J. P.
0.19MeV/atom-Cg' and 0.3MeV/atom- C6' is anomalously Thomas, Nucl. Instr. and Meth. in Phys. Res. B
enhanced and the formation of CH,2 is non-linear with respect to 94 1994) 341.
Id IOH and the cluster number.
239
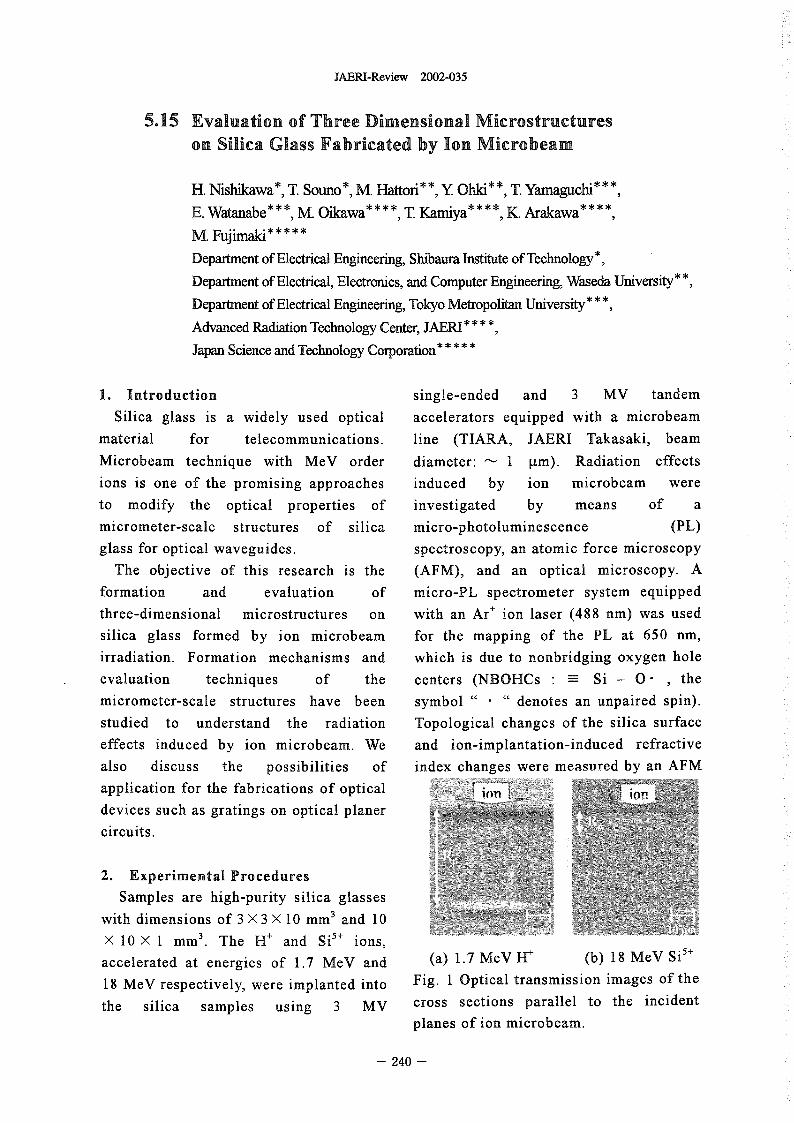
AERI-Review 2002-035
5.15 Evaluation of Three Dimensional Microstructureson Silica Glass Fabricated by Ion Microbeam
H. Nishikawa*, T. Souno*, M. Hattori", Y Ohld**, T. Yamaguchi***,
E. Watanabe* M. Oikawa* T. Kamiya* K. Arakawa*
M. Fujimaki * *
Department of Electrical Engineering, Shibaura Institute of Technology*,
Department of Electrical, Electronics, and Computer Engineering, Wascda University*
Department of Electrical Engineering, Tokyo Metropolitan University***,
Advanced Radiation Technology Center, JAERI
Japan Science and Technology Corporation*
1. Introduction single-ended and 3 MV tandemSilica glass is a widely used optical accelerators equipped with a microbeam
material for telecommunications. line (TIARA, JAERI Takasaki, beamMicrobeam technique with MeV order diameter: - I Rm). Radiation effectsions is one of the promising approaches induced by ion m1crobearn wereto modify the optical properties of investigated by means of amicrometer-scale structures of silica micro-photoluminescence (PL)
glass for optical waveguides. spectroscopy, an atomic force microscopyThe objective of this research is the (AFM), and an optical microscopy. A
formation and evaluation of micro-PL spectrometer system equippedthree-dimensional microstructures on with an Ar' ion laser 488 nm) was usedsilica glass formed by ion microbeam for the mapping of the PL at 650 nm,irradiation. Formation mechanisms and which is due to nonbridging oxygen holeevaluation techniques of the centers (NBOHCs _ Si - themicrometer-scale structures have been symbol denotes an unpaired spin).studied to understand the radiation Topological changes of the silica surfaceeffects induced by ion microbeam. We and ion-implantation-induced refractivealso discuss the possibilities of index changes were measured by an AFMapplication for the fabrications of opticaldevices such as gratings on optical planercircuits.
2. Experimental ProceduresSamples are high-purity silica glasses
MM3with dimensions of 3 X 3 X 10 and 0X 10 I mm'. The H' and Si" ions,accelerated at energies of 17 MeV and (a) 17 MeV H+ (b) 18 MeV SI'+18 MeV respectively, were implanted into Fig. Optical transmission images of thethe silica samples using 3 MV cross sections parallel to the incident
planes of ion microbeam.
- 240 -
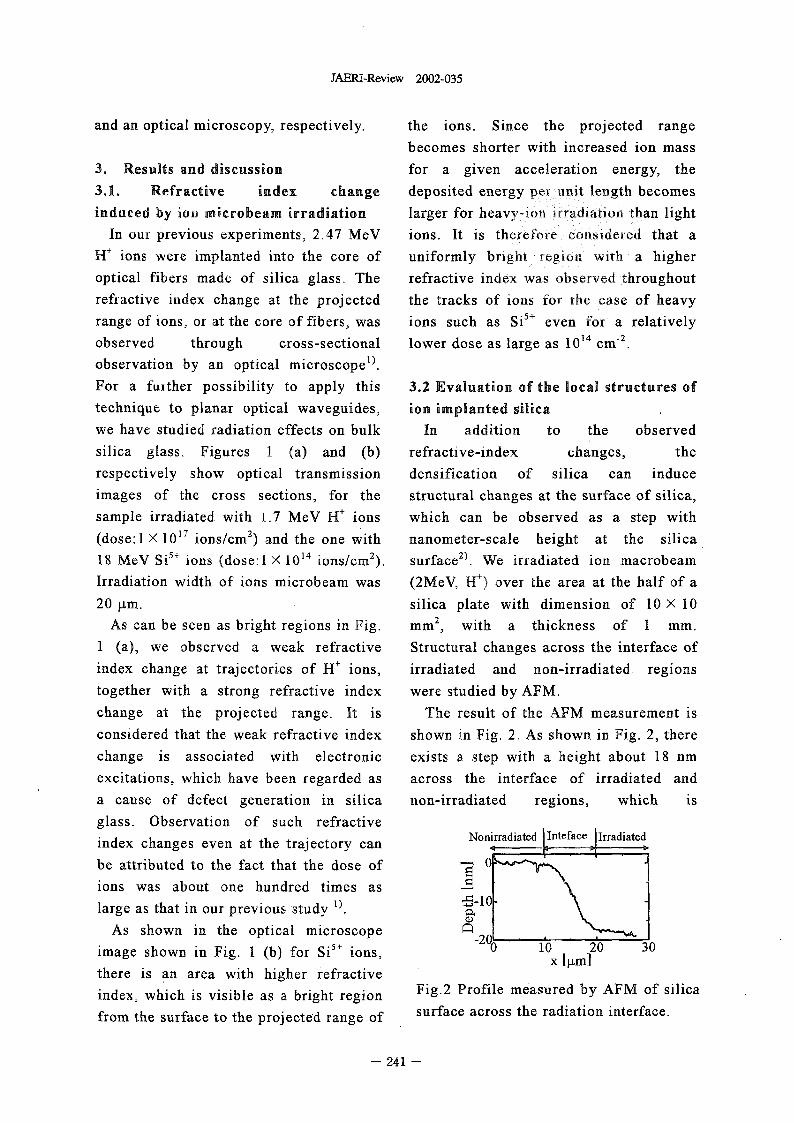
JAERI-Review 2002-035
and an optical microscopy, respectively. the ions. Since the projected range
becomes shorter with increased ion mass
3. Results and discussion for a given acceleration energy, the
3.1. Refractive index change deposited energy per unit length becomes
induced by ion microbeam irradiation larger for heavy-ion irradiation than light
In our revious experiments, 247 MeV ions. It is therefore considered that a
H+ ions were implanted into the core of uniformly bright region with a higher
optical fibers made of silica glass, The refractive index was observed throughout
refractive index change at the projected the tracks of ions for the case of heavy
range of ions, or at the core of fibers, was ions such as Si'+ even for a relatively
observed through cross-sectional lower dose as large as 1014 M-2.
observation by an optical microscope').
For a further possibility to apply this 3.2 Evaluation of the local structures of
technique to planar optical waveguides, ion implanted silica
we have studied radiation effects on bulk In addition to the observed
silica glass, Figures I (a) and (b) refractive-index changes, the
respectively show optical transmission densification of silica can induce
images of the cross sections, for the structural changes at the surface of silica,
sample irradiated with 17 MeV H ions which can be observed as a step with
(dose I X 1017 ions/CM2 ) and the one with nanometer-scale height at the silicaIg MeV Si5-1 1014 nS/CM2). 2).ions (dose: X I surface We irradiated ion macrobeam
Irradiation width of ions microbeam was (2MeV, H) over the area at the half of a
20 �tm. silica plate with dimension of 10 X 102As can be seen as bright regions in Fig. mm, with a thickness of 1 mm.
I (a), we observed a weak refractive Structural changes across the interface of
index change at trajectories of H+ ions, irradiated and non-irradiated regions
together with a strong refractive index were studied by AFM.
change at the projected range. It is The result of the AFM measurement is
consi'dered that the weak refractive index shown in Fig. 2 As shown Fig. 2 there
change is associated with electronic exists a step with a height about 18 nm
excitations, which have been regarded as across the interface of irradiated and
a cause of defect generation in silica non-irradiated regions, which is
glass. Observation of such refractive Noniffadiated IInteface Irradiatedindex changes even at the trajectory can
be attributed to the fact that the dose of 0
ions was about one hundred times as
large as that in our previous study
As shown in the optical microscope ��_20i5 - 0 10 20 30image shown in Fig. I (b) for ions, X [Sam]
there is an area with higher refractiveFig.2 Profile measured by AFM of silicaindex, which is visible as a bright region
from the surface to the pr Jected range of surface across the radiation interface.Oi
- 241 -
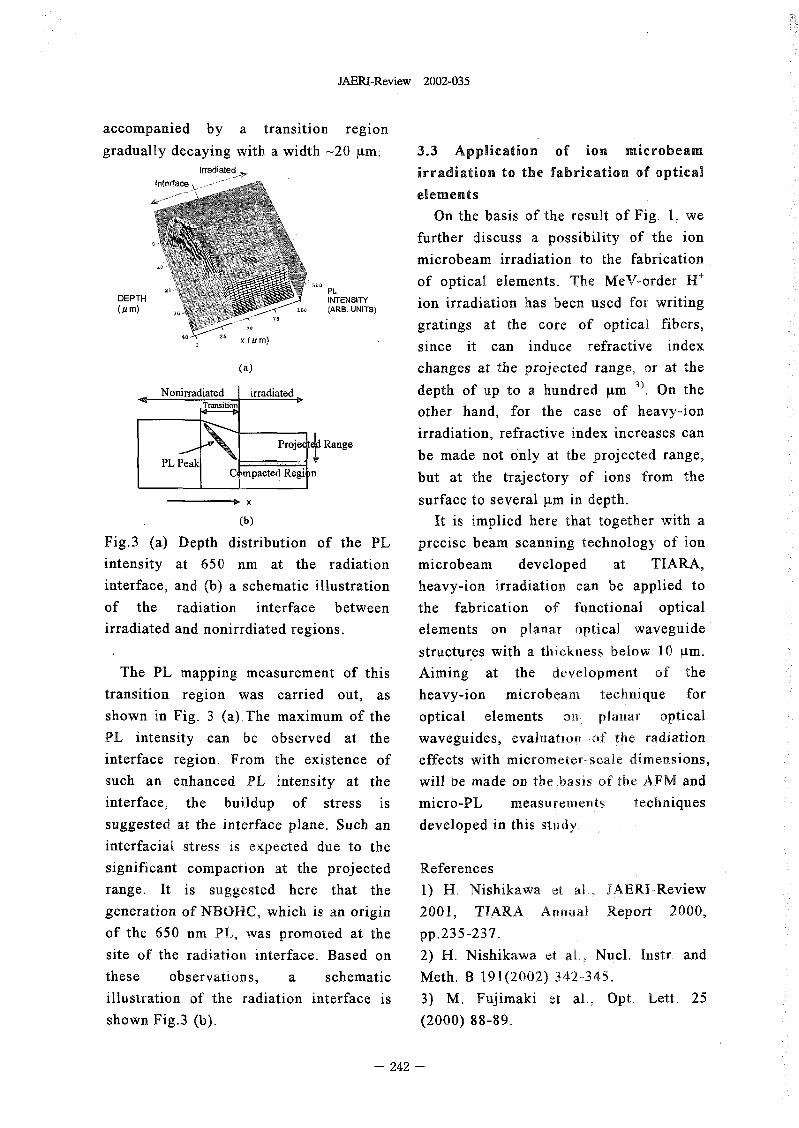
JAERI-Review 2002-035
accompanied by a transition region
gradually decaying with a width 20 4m. 3.3 Application of ion microbeam
In irradiation to the fabrication of opticalelements
On the basis of the result of Fig. 1 we
further discuss a possibility of the ion
microbeam irradiation to the fabrication
of optical elements. The MeV-order H'PL
DEPTH INTENSITY ion irradiation has been used for writing('U M) CARB. UNITS)
75
lu gratings at the core of optical fibers,40 )((a M) since it can induce refractive index
(a) changes at the projected range, o at the3
Nonirradiated irradiated depth of up to a hundred RM ). On theTramition other hand, for the case of heavy-ion
Project Range irradiation, refractive index increases can
PL Pe be made not only at te projected range,C, )mpacted Regi) but at the trajectory of ions from the
----------- - -lb. surface to several Rm in depth.(b) It is implied here that together with a
Fig.3 (a) Depth distribution of the PL precise beam scanning technology of ion
intensity at 650 nm at the radiation microbeam developed at TIARA,
interface, and (b) a schematic illustration heavy-ion irradiation can be applied to
of the radiation interface between the fabrication of functional optical
irradiated and nonirrdiated regions. elements on planar optical waveguide
structures with a thickness below 10 4m.
The PL mapping measurement of this Aiming at the development of the
transition region was carried out, as heavy-Ion microbeam technique for
shown in Fig. 3 (a).The maximum of the optical elements on planar optical
PL intensity can be observed at the waveguides, evaluation of the radiation
interface region. From the existence of effects with micrometer-scale dimensions,
such an enhanced PL intensity at the will be made on the basis of the AFM and
interface. the buildup of stress is micro-PL measurements techniques
suggested at the interface plane. Such an developed in this studv-
interfacial stress is xpected due to the
significant compaction at the projected References
range. It is sggested here that the 1) H. Nishikawa e-t al., JAERI-Review
generation of NBOHC, which is an origin 2001, TIARA Annual Report 2000,
of the 650 n PL, was promoted at the pp.235-237.
site of the radiation interface. Based on 2) H. Nishikawa et al�. Nucl. Instir. and
these observations, a schematic Meth. B 191(2002) 342-345.
illustration of the radiation interface is 3) M. Fujimaki et al., Opt. Lett. 25
shown Fig.3 (b). (2000) 88-89.
- 242 -
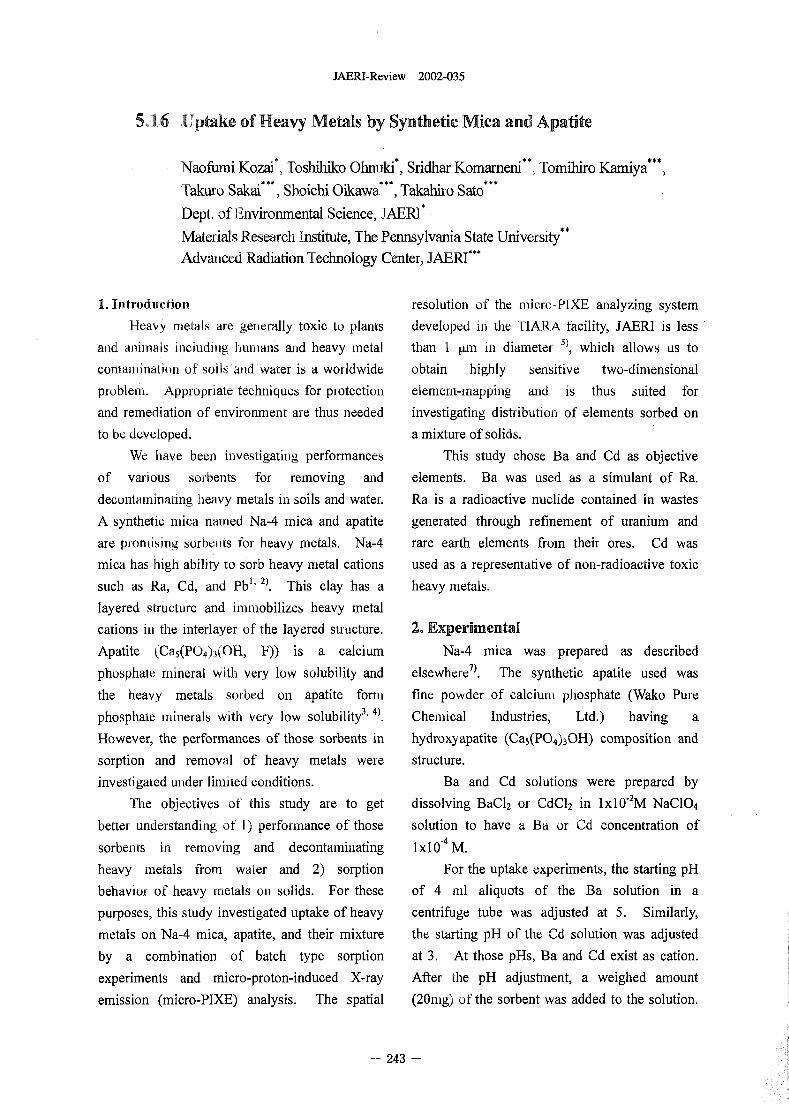
JAERI-Review 2002-035
5.16 Uptake of Heavy Metals by Synthetic Mica and Apatite
Naofurni Kozai' Toshihiko Ohnuki*, Sridhar Kornarneni *, Tornihiro Karniya***,Takuro Sakai***, Shoichi Oikawa"**, Takahiro Sato***Dept. of Environmental Science, JAERI*Materials Research Institute, The Pennsylvania State University"Advanced Radiation Technology Center, JAERI ***
1. Introduction resolution of the micro-PIXE analyzing system
Heavy etals are generally toxic to plants developed i the TIARA facility, JAERI is lessand animals i than I [tin i diameter
ncluding hurriatis and heavy etal which allows us to
contamination of soils and water is a worldwide obtain highly sensitive two-dimensional
problem. Appropriate techniques for protection element-inapping and is thus suited for
and remediation of environment are thus needed investigating distribution of elements sorbed on
to be developed. a mixture of solids.
We have been ivestigating performances This study chose Ba and Cd as objective
of various sorbents for removing and elements. Ba was used as a simulant of Ra.
decontaminating havy metals in soils and water. Ra is a radioactive nuclide contained in wastes
A synthetic mica named Na-4 mica and apatite generated through refinement of uranium and
are promising sorbents for heavy metals. Na-4 rare earth elements from their ores. Cd was
mica has high ability to sorb heavy metal cations used as a representative of non-radioactive toxic
such as Ra, Cd, and Pbl 2 This clay has a heavy metals.
layered structure and immobilizes heavy metal
cations in te interlayer of the layered structure. 2. ExperimentalApatite (Ca5(PO4)3(OH, F)) is a calcium Na-4 mica was prepared as described
phosphate mneral ith very low solubility and elsewhere 7). The synthetic apatite used was
the heavy metals sot-bed o apatite form fine powder of calcium phosphate (Wako Pure
phosphate minerals with very low solubility" ). Chemical Industries, Ltd.) having a
However, the performances of those sorbents in hydroxyapatite (Ca5(PO4)30H) composition and
sorption and removal of heavy metals were structure.
investigated under limited conditions. Ba and Cd solutions were prepared by
The objectives of this study are to get dissolving BaC12 or CdC12 in IXIO-2 M NaC104
better understanding of 1) performance of those solution to have a Ba or Cd concentration of
sorbents in removing and decontaminating I xi 0-, M.
heavy etals from water and 2 sorption For the uptake experiments, the starting pH
behavior of heavy etals on sids. For these of 4 nl aliquots of the Ba solution in a
purposes, this study investigated uptake of heavy centrifuge tube was adjusted at 5. Similarly,
metals on Na-4 mica, apatite, and their mixture the starting pH of te Cd solution was adjusted
by a combination of batch type sorption at 3 At those pHs, Ba and Cd exist as cation.
experiments and micro-proton-induced X-ray After the pH adjustment, a weighed amount
emission (micro-PIXE) analysis. The spatial (20mg) of the sorbent was added to the solution,
- 243 -
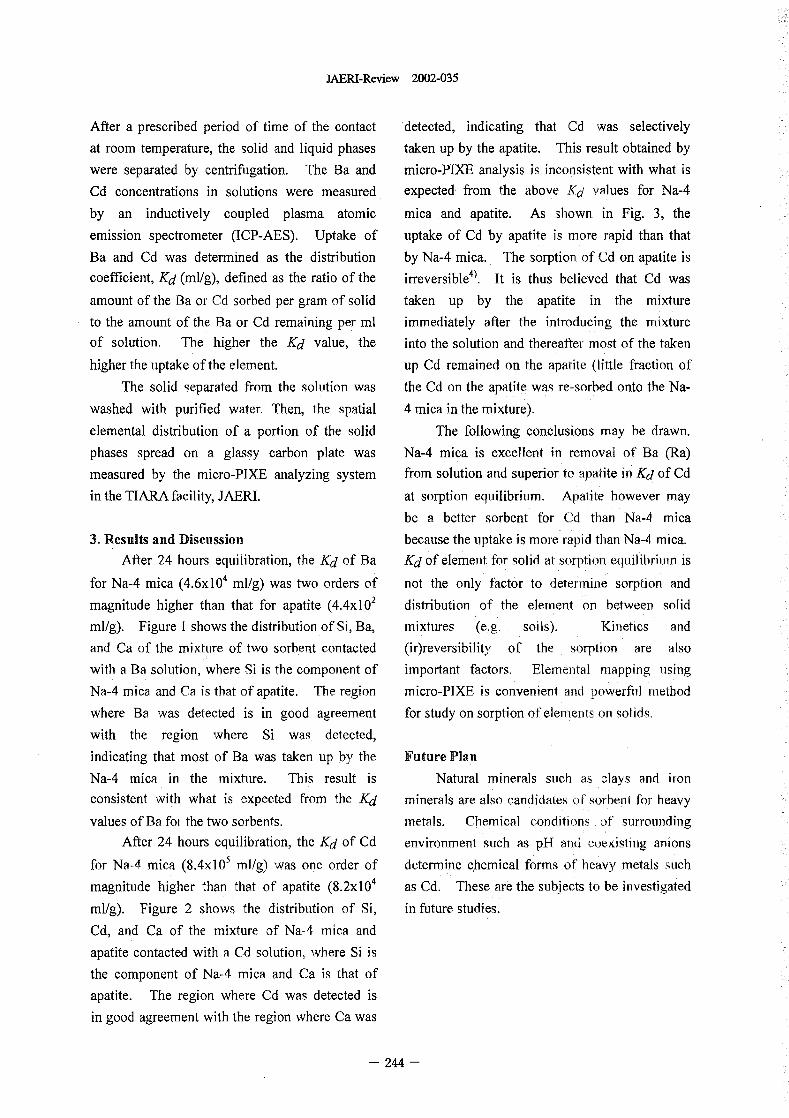
JAERI-Review 2002-035
After a prescribed period of time of the contact detected, indicating that Cd was selectively
at room temperature, the solid and liquid phases taken up by the apatite. This result obtained by
were separated by centrifugation. The Ba and micro-PIXE analysis is inconsistent with what is
Cd concentrations in solutions were measured expected from the above K values for Na-4
by an inductively coupled plasma atomic mica and apatite. As shown in Fig. 3 the
emission spectrometer (ICP-AES). Uptake of uptake of Cd by apatite is more rapid than that
Ba and Cd was determined as the distribution by Na-4 mica. The sorption of Cd on apatite is
coefficient, Kd (ml/g), defined as the ratio of the irreversible 4). It is thus believed that Cd was
amount of the Ba or d sorbed per gram of solid taken up by the apatite in the mixture
to the amount of the Ba or Cd remaining per ml immediately after the introducing the mixture
of solution. The higher te Kd value, the into the solution and thereafter most of the taken
higher the uptake of te element. up Cd remained on the apatite (little fraction of
The solid separated from te solution was the Cd on the apatite was re-sorbed onto the Na-
washed with purified water, Then, the spatial 4 mica in the mixture).
elemental distribution of a portion of the solid The following conclusions may be drawn.
phases spread on a glassy carbon plate was Na-4 mica is excellent in removal of Ba (Ra)
measured by the micro-PIXE analyzing system from solution ad superior to apatite in Kd of Cd
in the TIARA facility, JAERL at sorption equilibrium. Apatite owever may
be a better sorbent for Cd than Na-4 mica
3. Results and Discussion because the uptake is more rapid tan Na-4 mica.
After 24 hours equilibration, the Kd of Ba Kd of element for solid at sorption equilibrium is
for Na-4 mica (4.6x 10⁴ ml/g) was two orders of not the only factor to determine sorption and
magnitude higher than that for apatite (4.4xl 02 distribution of the element on between solid
ml/g). Figure I shows the distribution of Si, Ba, mixtures (e.g, soils). Kinetics and
and Ca of the mixture of two sorbent contacted (ir)reversibility of the sorption are also
with a Ba solution, where Si is the component of important factors. Elemental mapping sing
Na-4 mica and Ca is tat of apatite. The region micro-PIXE is convenient and powerful ethod
where Ba was detected is in good agreement for study on sorption of elements on solids,
with the region where Si was detected,
indicating that most of Ba was taken up by the Future Plan
Na-4 mica in the mixture. This result is Natural minerals such as clays and iron
consistent with what is expected from the Kd minerals are also candidates of sorbent for heavy
values of Ba or the two sorbents. metals. Chemical conditions of surrounding
After 24 hours equilibration, the Kd of Cd environment sch as pH and coexisting anions
for Na-4 mica (8.4x]05 ml/g) was one order of determine chemical forms of eavy metals sch
magnitude higher than that of apatite (8.2xl 04 as Cd. These are the sub�jects to be ivestigated
ml/g). Figure 2 shows the distribution of Si, in future studies.
Cd, and Ca of the mixture of Na-4 mica and
apatite contacted with a Cd solution, where Si is
the component of Na-4 mica and Ca is that of
apatite. The region where Cd was detected is
in good agreement with the region where Ca was
244 -
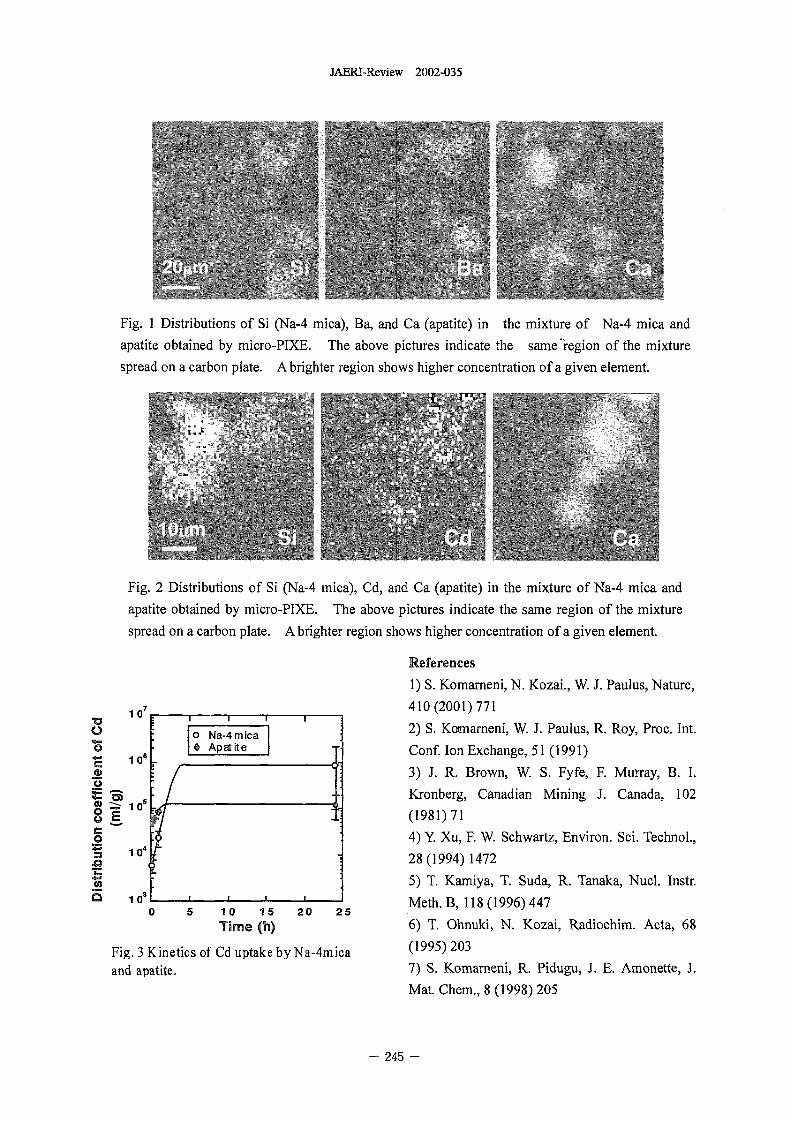
JAERI-Review 2002-035
Fig I Distributions of Si (Na-4 mica), Ba, and Ca (apatite) in the mixture of Na-4 mica and
apatite obtained by micro-PIXE. The above pictures indicate the same-region of the mixture
spread on a carbon plate. A brighter region shows higher concentration of a given element.
Fig. 2 Distributions of Si (Na-4 mica), Cd, and Ca (apatite) in the mixture of Na-4 mica and
apatite obtained by micro-PIXE. The above pictures indicate the same region of the mixture
spread on a carbon plate. A brighter region shows higher concentration of a given element.
References
1) S. Kornarneni, N. Kozai., W. J. Paulus, Nature,
1 7 410(2001)771
0 Na-4mica 2) S. Koirnarneni, W. J. Paulus, R. Roy, Proc. Int.0 6 0 ApEdite Conf. Ion Exchange, 51 1991)
10R 3) J. R. Brown, W. S. Fyfe, F. Murray, B. I.
s Kronberg, Canadian Mining J. Canada, 102I '
(1981 71
0 4) Y. Xu, F. W. Schwartz, Environ. Sci. Technol.,04
28(1994)1472
5) T. Kamiya, T. Suda, R. Tanaka, Nucl. Instr.2 10 3 Meth. B, II 1996) 4470 5 10 1 -5 20 25
Time (h) 6) T. Ohnuki, N. Kozai, Radiochim. Acta 68
Fig. 3 Kinetics of Cd uptake by Na4mica (1995)203and apatite. 7) S. Komarneni, R. Pidugu, J. E. Amonette J.
Mat. Chem., 1998) 205
- 245 -

This is a blank page.
JAERI-Review 2002-035
6. Nuclear Science and RI Production
6.1 13 -y' Id in Proton-irradiated Water for Different Mate 'als of
a Target Chamber ................................................... 249
N. S. shioka, S. Watanabe, T. Ito, C. Mzuniwa, S. Matsuhashi and T.Sekine
6.2 Dose Effects of the Production Yield of Endohedral 133 Xe-fullerene by
Ion Implantation .................................................... 251
S. Watanabe, N. S. Ishioka, H. Shimomura, H. Muramatsu and T. Sekine
247 -

This ]is a blank page.
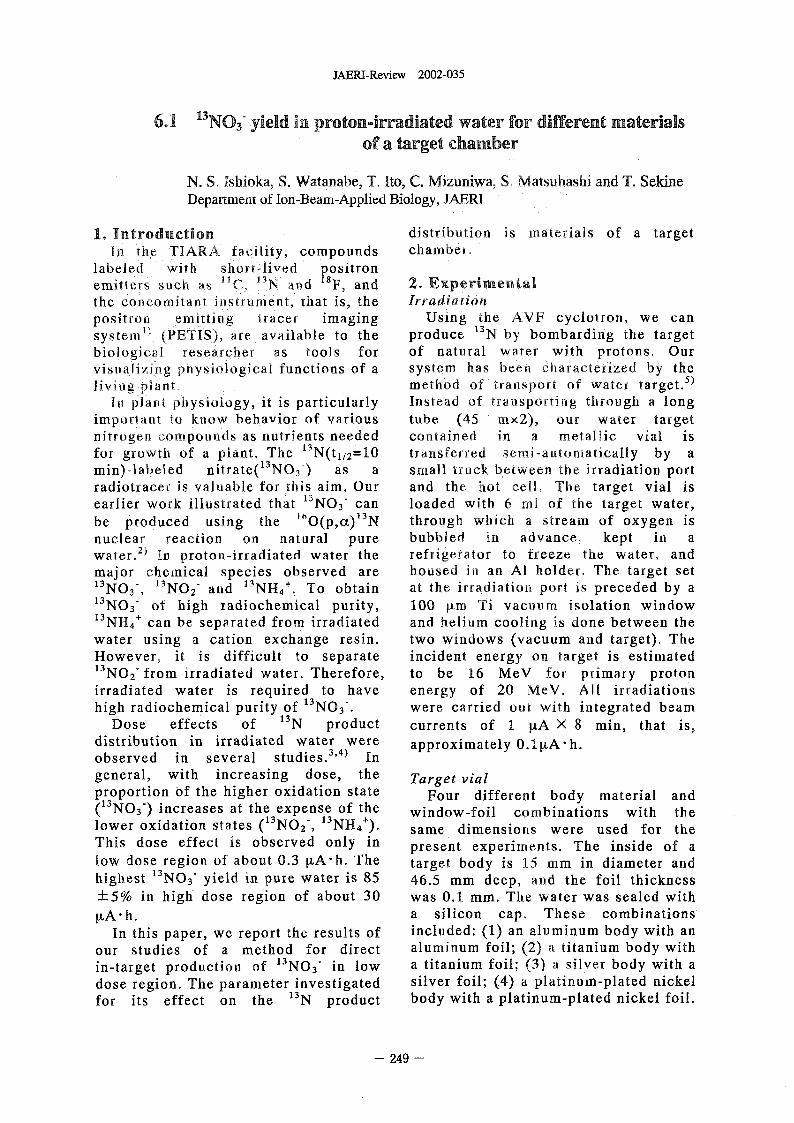
JAEM-Review 2002-035
6.1 13NO,3'yield in proton-irradiated water for different materialsof a target chamber
N. S. Ishioka, S. Watanabe, T. Ito, C. Mizuiriwa, S. Matsubashi and T. SekineDepartment of on-Beam-Applied Biology, JAFRI
1. Introduction distribution is materials of a targetin the TIARA facility, compounds chamber.
labeled with short-lived positronemitters such as "C, "N and 8F, and 2. Experimentalthe concomitant instrument, that is, the IrradiationPositron emitting tracer imaging Using the AVF cyclotron, we cansysteful) (PETIS), are available to the produce 3N y bombarding the targetbiological researcher as tools for of natural water with protons, Ourvisualizing physiological functions of a system has been Characterized by the
5living plaflt� method of transport of water target.In plant physiology, it is particularly Instead of transporting trough a long
important to know behavior of various tube (45 m. x 2), our water targetnitrogen compounds as nutrients needed contained in a metallic vial isfor growth of a plant. The N(t112=10 transferred semi-automatically by amin)-labeied nitrate( 3 N03-) as a small truck between the irradiation portradiotracef is valuable for tis aim. Our and the hot cell. The target vial isearlier work illustrated tha. t 13 N03- can loaded wit 6 ml of the target water,be produced using the 'pct)"N through wich a stream of oxygen isnuclear reaction on natural pure bubbled in advance, kept in awater.2) In proton-irradiated water the refrigerator to freeze the water, andmajor chemical species observed are housed in an Al older. The target set13 N03-, NO2 ad 13 NH4'. To obtain at the, irradiation port is preceded by a13 N03- of high radiochemical purity, 100 �tm Ti vacuum isolation window13 NH4' can be separated from irradiated and helium cooling is done between tewater using a cation exchange resin. two windows (vacuum and target). TheHowever, it is difficult to separate incident energy on target is estimated13 N02 fom irradiated water. Therefore, to be 16 MeV for primary protonirradiated water is required to have energy of 20 MeV. All irradiationshigh radiochemical purity of 13 N03-- were carried out with integrated beam
Dose effects of 13N product currents of �LA X 8 min, that is,distribution in irradiated water were approximately ARA-h.observed in several studies.3,4) Ingeneral, with increasing dose, the Target vialproportion of the higher oxidation state Four different body material and(13 N03-) increases at the expense of the window-foil combinations with thelower oxidation states 13 N02-, 13 NH4+)- same dimensions were used for teThis dose effect is observed only in present experiments. The inside of alow dose region of about 03 [tA- h. The target body is 15 mm in diameter andhighest 13 N03- yield in pure water is 85 46.5 mm deep, nd the foil thickness±5% in higif dose region of about 30 was 0.1 mm. Te water was sealed withRA h. a silicon cap. These combinations
In this paper, we report the results of included: (1) an aluminum body with anour studies of a method for direct aluminum foil; 2) a titanium body within-target production of 13 N03- in lw a titanium foil; 3 a silver body with adose region. The parameter investigated silver foil; 4 a platinum-plated nickelfor its effect on the 13 N product body with a platinum-plated nickel foil.
249 -
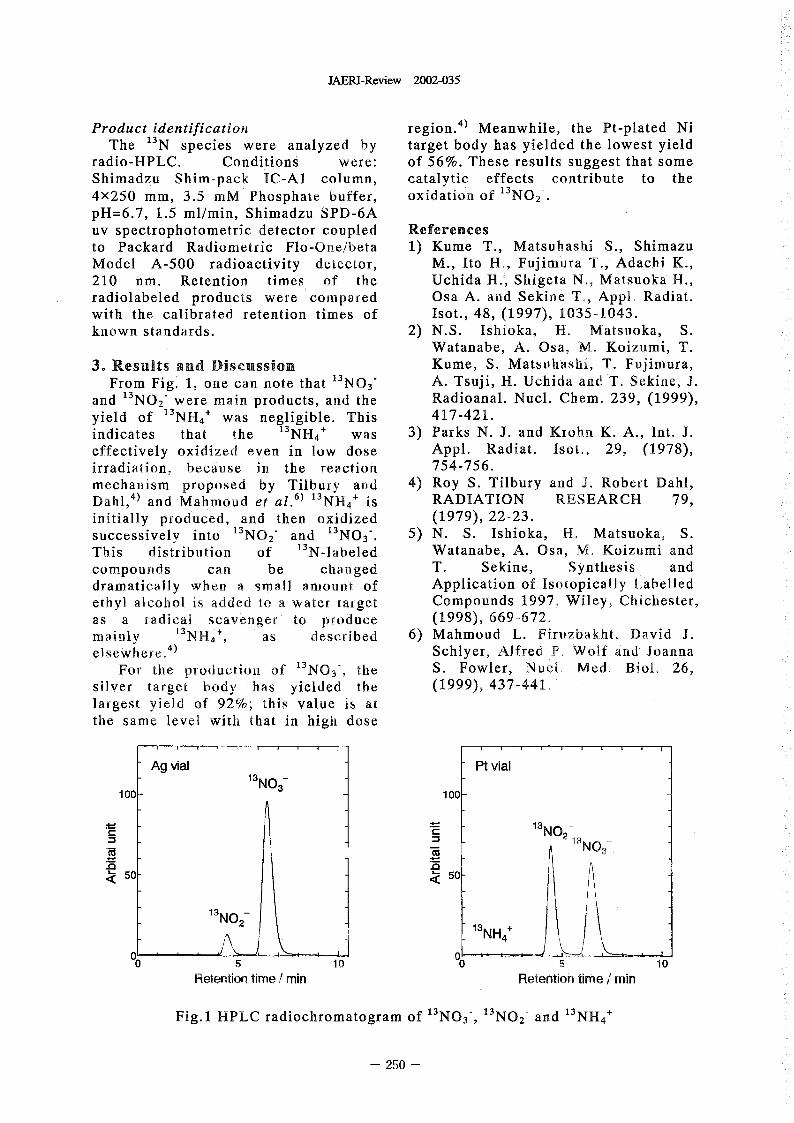
JAERI-Review 2002-035
Product identification 4) Meanwhile, the Pt-plated NiThe 13 N species were analyzed by target body has yielded the lowest yield
radio-HPLC. Conditions were: of 56%. These results suggest that some
Shimadzu Shim-pack IC-Al column, catalytic effects contribute to the
4x250 mm, 35 mM Phosphate buffer, oxidation of13 NO2_.
PH=6.7, 1.5 ml/min, Shimadzu SPD-6A
uv spectropbotometric detector coupled Referencesto Packard Radiornetric Flo-One/beta 1) Kume T., Matsuhashi S., Shimazu
Model A500 radioactivity detector, M., Ito H., Fujimura T., Adachi K.,
210 nm. Retention times of the Uchida H., Shigeta N., Matsuoka H.,radiolabeled products were compared Osa A. and Sekine T., Appl. Radiat.
with the calibrated retention times of Isot., 48, 1997), 1035-1043.
known standards. 2) N.S. Ishioka, H. Matsuoka, S.Watanabe, A. Osa, M. Koizurni T.
3. Results and Discussion Kume, S. Matsuhashi, T. Fujimura,
From Fig. 1, one can note that 13 N03- A. Tsuji, H. Uchida and T. Sekine J.
and 13 N02- were main products, and the Radioanal. Nucl. Chem. 239, 1999),
yield of 13 NH4' was negligible. This 417-421.indicates that the 13 NH4+ was 3) Parks N. J. and Krohn K. A., Int J.
effectively oxidized even in low dose Appl. Radiat. Isot., 29, 1978),
irradiation, because in the reaction 754-756.mechanism proposed by Tilbury and 4) Roy S. Tilbury ad J. Robert Dahl,Da hl'4) and Mabrnoud et al .6) 3 NH4 i RADIATION RESEARCH 79,
initially poduced, and then oxidized (1979), 22-23.successively into 13 N02- and 13 N03-- 5) N. S. Ishioka, H. Matsuoka S.
This distribution of 13 N-labeled Watanabe, A. Osa, M, Koizumi and
compounds can be changed T. Sekine, Synthesis I anddramatically when a small aount of Application of Isotopically Labelled
ethyl alcohol is added to a water target Compounds 1997, Wiley, Chichester,
as a radical scavenger to produce (1998),669-672.mainly 13 N144+, as described 6) Mahmoud L. Firuzbakht, David J.elsewhe re14) Schlyer, Alfred P. Wolf and Joanna
For the productio 11 of 3 N03-, the S. Fowler, Nuct Med. Biol, 26,
silver target body has yielded the (1999), 437-441.
largest yield of 92%; this value is atthe same level with that in high dose
Ag vial Pt vial13 NO
100 - 3 100 -
A_ A_ 13NO,
13NOco 3
5 - 50 -
13N02-
13 NH 4
5 10 0) 5 10
Retention time I min Retention time I min
Fig.1 HPLC radiochromatogram of13 N03-, 13 N02- and 13 NH4+
- 250 -
JAERI-Review 2002-035
6.2 Dose Effects of the Production Yield of Endohedral1,33 Xe-Fullerene by Ion Implantation
S. Watanabe*, N. S- Ishloka* H Shirnomura" , B, Mtjramatsu**, T. Sekine*Department of lon-Beam-Applied Biology, AERI*, Faculty of Education, ShinsyuUniversity
1. Introduction o-dicblorobenzene. The solution was filtered
The endoliedral radiolsotope-fullerene has been through a uillipore titter to remove insoluble
produced by us' arc-discbarge or materials. The filtrate was analyzed by high
nuclear-yeaction-i-ecoil processes. Products by tese performance liquid chromatography HPL w a
methods are mixtures of difterent species of Cosinosil Buckyprep colunin. Eution was done
fidleienes with different ecapsulated radioisotopes. with o-diphlorobenzerie at a flow rate of I m/min,
However, considering that the endoliedral The concentration of fullerene in the effluent was
radiolsotope-fullerene has a possibility of being new continuously monitored by a UV detector. The
radiopharmaccuticals a product containing one effluent aer UV measurement was ollected
13IXespecies of endohedral fullerene in high purity is glass vials each for I mn util 20 MI ad the
desired. We have recently reported a poduction radioactivity in each via] was measured y y-ray
method to resolve this problem, confirming that by spectrometry
ion iplantation mdoliedral 133Xe-ftfflerene can be
produced [11, To achieve more efficient production 3. Results and Discussion
of endohedral 133Xe-fullerene, conditions of the ion 13'Xe dose was obtained from the 133Xe
implantation, especially 011 dose, In to be studied. radioactivity implanted into a target with correction
hi the present paper, we describe dose dependence for its decay during a period of measurement
on the reduction yield of endoliedral storage and iadiation. Because aXe beam spotp113 132Xel_l+Xe-fitflerene from C6o and C7o targets 'in area ions are considered to be u'riplanted
together With 111X 4 ins, the nmber of antedconnection with amorphization of fullerene e impl
132XeW molecules. ions was estimated ftom the observed beam
Current of 132X ions and the 3XeH'/133X -1e i e
2. Experimental [I] radioactivity ratio. The resulting 132XeH dose found
Fullerene targets for ion uinplantation were made to be one tenth of the 133 Xe dose is included into the
by vacuum evaporation of C60 or Co on N foils. 133 Xe dose in the following discussion.
linplantation of 133,Xe ions into the targets was Figure I shows elutiori Curves Of 33 Xe and C6o
113carried out with an isotope separator 2 at obtained from the C6o sample bombarded with Xe
acceleration energies of 38 keV Doses were in the tons at a dose of 2.OxIO'2 cryf, , The strong
12 to IX Io 4 CM-2. 13rage of WO After ion implantation, correlation observed between the C60 and 3Xe
the fullerene part on the target was dissolved peaks corroborates the foliation of "Ne�C6o.
- 251 -
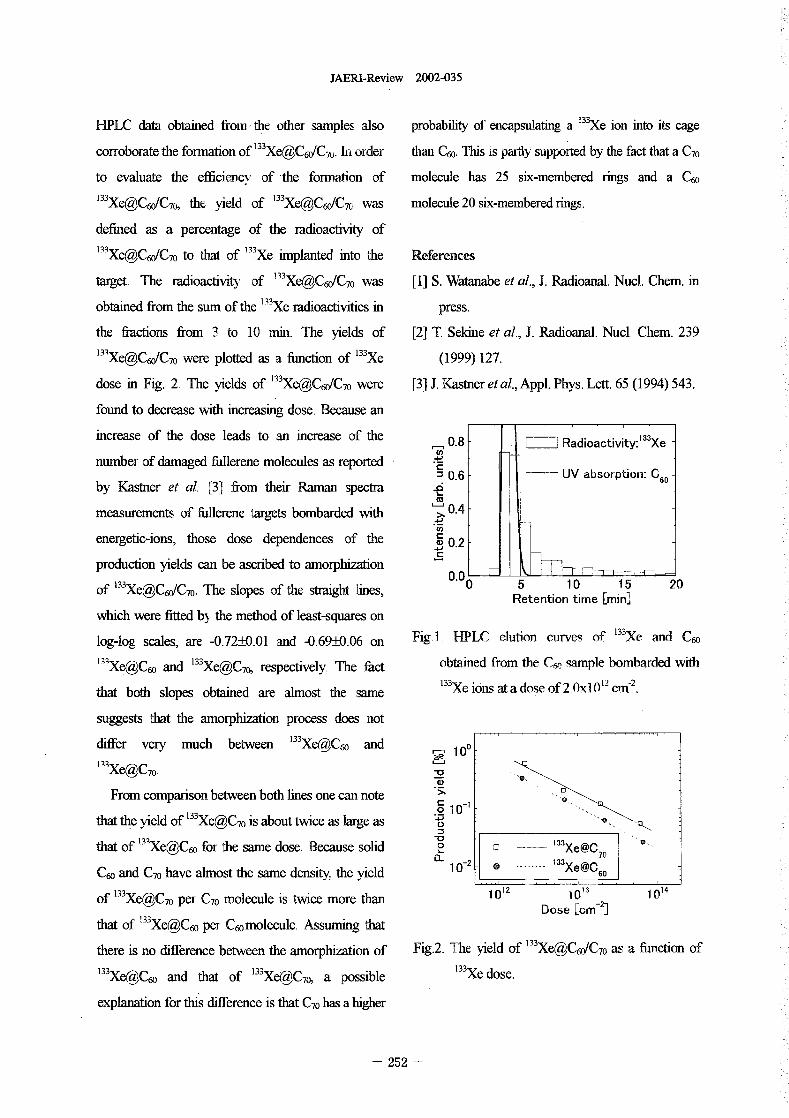
JAERI-Review 2002-035
1HPLC data obtained from the other samples also probability of encapsulating a Ne ion to its cage
corroborate the formation Of I"Xe�C60IC7(1- hi order than C60. This is partly supported by the fact that a o
to evaluate the efficiency of the formation of molecule has 25 six-membered rings and a C6o
113 Xe�C6o/C7(� te yield of 133Xe�C,5G/C7o was molecule 20 six-membered rings.
defined as a percentage of the radioactivity of133Xe�C60/C70 to dot of 133Xe anplanted into the References
target. The radioactivity of 133Xe�C60/C70 Was [I] S. Watanabe et al., J. Radioanal. Nucl. Chem. n
obtained from the sum of the 113 Xe radioactivities ' press.the fractions from 3 to 10 Mmi. The Ids of
yie [2] T Seldne et al., J. Radioanal. Nucl. Chem. 239
13'Xe�C60/C70 were plotted as a function of Xe (1999) 127.dose F 2 The ields of 33
i g Xe�C,5o/C7o were [3] J. Kastner et al., Appl. Phys. Lett. 65 1994) 543.
found to decrease with increasin g dose. Because an
increase of the dose leads to an 'crease of the 133- 0.8. Radioactivity: Xeco
number of damaged fullerene molecules as reported :EC UV absorption: C 60= 06 -
by Kastner et al. 3 from their Raman spectra
measurements of fullerene targets bombarded with 0.4
energetic-ions, those dose dependences of the 0.2
production yields can be ascribed to amorphization0.0
of 113 Xe�C60/C70. The slopes of the straight lines, 0 5 0 1 5 20Retention time [min]
which were fitted by the method of least-squares on
log-log scales, are 072+-0.01 and 069+-0.06 on Fig, , HLC elution curves of 133Xe and Cro
133xe�cr with,0 and 133 Xe�C7o, respectively The ffict obtained ftom te C6n sample bombarded
did both slopes otained are almost the same 133Xe ions at a dose of 2, Ox 012 ern�.
suggests that the amorphization process does not133differ very much between Xe�C6o and 100
133 Xe�C7o.
From comparison between both lines one can noteof 13 .2 lo-,that te yield 'Xe�C70 is about twice as large as 4U
0 13that of Xe�C6o for the same dose. Be-cause solid I- - I Xe�Ca_ 02 33 70
C6o and Co have almost te same density. the yield Xe�C 60
of 133 Xe�C70 per C70 molecule is twice more thari i o2 1013 i o14
Dose [cm-21
that of 33 Xe�C60 per CrOmolecule. Ass thattiming
there is no difference between the amorphization of Fig.2. The yield of 113 Xe�C6o/C70 as a unction of133Xe�C60 that of 133Xe�C 133Xeand 7o a possible dose.
explanation for this difference is that C70 has a higher
252 -
JAERI-Review 2002-035
7. Microbeam Application
7.1 Development of a High-energy Heavy Ion Mcrobeam &
SIIA& toll Hit System ................................................ 255
T, Kamlva. M. Okawa, W_ Yokota, Y Kobayashi and T. Funayama
7.2 Simultaneous Mapping of Fluoride Both In the'rooth and 'M the Dental Material
Filled i a Cavity of the Tooth rising PGE ................................ 258
H, Yamamoto, Y. Iwanu, S, Fbisu, N4, Nomachi, Y. Sugaya, K. Yasuda,
T. Kanilva, T. Sakai and N4, Okawa
7.3 Development of In-air Micro-PIXE Analysis System ........................ 261
A. anaka, K. Ishii, Y. Komori, S. Matsuyama, H. Yamazaki, K. Kubota,
H. Fukuda, T. Kamiya, T. Satoh, T. Sakai, M. Okawa, K. Arakawa and
M. Saidoh
7.4 Pirellimmiary Study on Quantitative Elemental Analysis for Environmental
Samples Using Micro-PIXE .......................................... 264
N4. Kasahara, C.-J. Ma, Y. noguchi, T. Kamlya, T. Sakai, M. Oikawa and
T. Sato
7.5 Application of In-air Micro-PIXE Analysis System to the Study of Metabolic
Function in the Cell .................................................. 267
K. Kubota, H. Fukuda, K. Ishii, A. Tanaka, S. Matsuyama, H. Yamazaki,
T. Kamiya, T. Satoh, T. SakaiM. Okawa, K. Arakawa and M. Saidoh
7.6 Development of a Large-solid-angle Multi-element Detection System for
High-sensitivity Micro-PLXE Analysis .................................... 270
T. Satoh, T. Kamiya, T.Sakai, M. Okawa, K. Ishii, S. Matsuyama and
H. Yamazaki
7.7 Analysis of Arsenic Around an Arsenic Mine by V-PLXE ...................... 273
T hauki, F. Sakamoto, N. Kozai, M. Samadfam, T. Karmya, T. Sakai
S. Oikawa and T. Sato
253 -

This is a blank page.
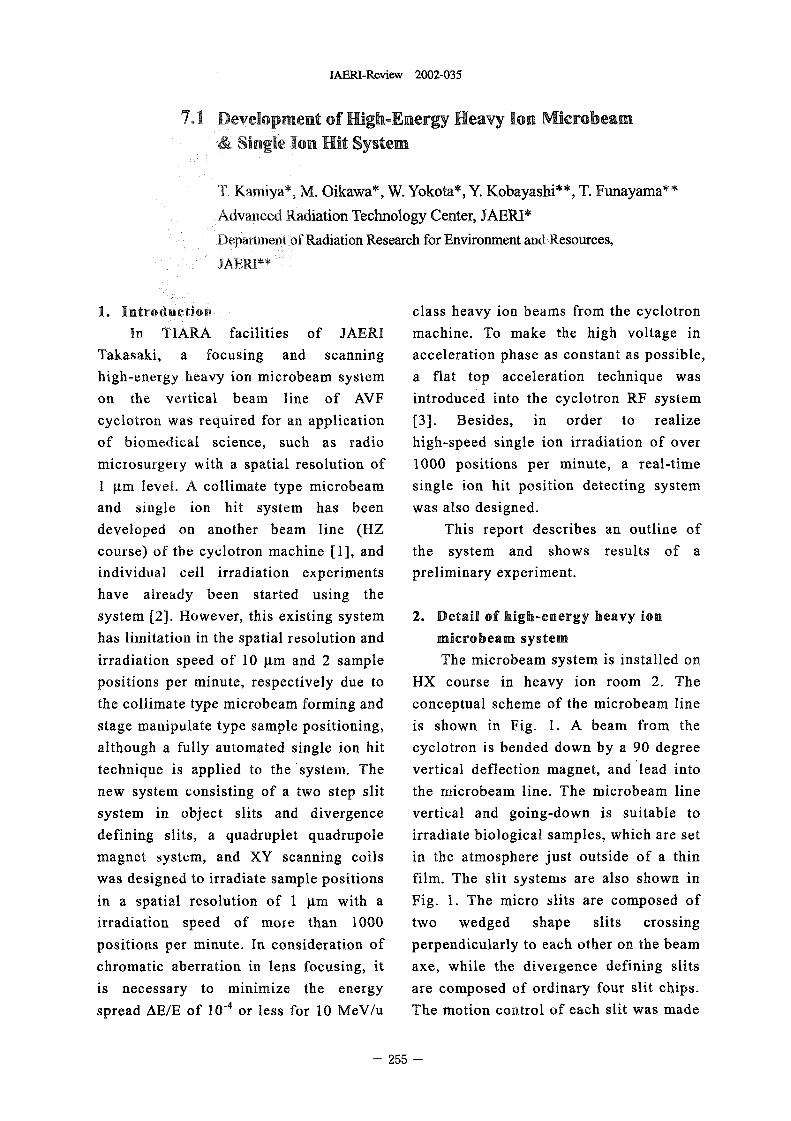
JAERI-Review 2002-035
7.1 Development of High-Energy Heavy Ion Microbeam& Single Ion Hit System
T. Kamiva*� M. Oikawa*, W. Yokota*, Y. Kobayashi**, T. Funayarna"
Advanced Radiation Technology Center, JAERl*
DepartrDei*of Radiation Research for Environment and Resources,
JAERI**
1. Introduction class heavy ion beams from the cyclotron
In TIARA facilities of JAERI machine. To make the high voltage in
Takasaki, a focusing and scanning acceleration phase as constant as possible,
high-energy.heavy ion microbeam system a flat top acceleration technique was
on the vertical beam line of "F introduced into the cyclotron RF system
cyclotron was required for an application [3]. Besides, in order to realize
of biomedical science, such as radio high-speed single ion irradiation of over
microsurgery with a spatial resolution of 1000 positions per minute, a real-time
I Km level. A collimate type microbearn. single ion hit position detecting system
and single ion hit system has been was also designed.
developed on another beam line (HZ This report describes an outline of
course) of the cyclotron machine [1], and the system and shows results of a
individual cell irradiation experiments preliminary experiment.
have already been started using the
system 2). However, this existing system 2. Detail of high-energy heavy ion
has limitation in the spatial resolution and microbeam system
irradiation speed of 10 gm and 2 sample The microbeam system is installed on
positions per minute, respectively due to HX course in heavy ion room 2 The
the collimate type microbeam forming and conceptual scheme of the microbeam line
stage manipulate type sample positioning, is shown in Fig. I A beam from the
although a fully automated single ion hit cyclotron is bended down by a 90 degree
technique is applied to the 'system. The vertical deflection magnet, and lead into
new system consisting of a two step slit the microbeam line. The microbeam line
system in object slits and divergence vertical and going-down is suitable to
defining slits, a quadruplet quadrupole irradiate biological samples, which are set
magnet system, and XY scanning coils in the atmosphere just outside of a thin
was designed to irradiate sample positions film. The slit systems are also shown in
in a spatial resolution of I m with a Fig. 1. The micro slits are composed of
irradiation speed of more than 1000 two wedged shape slits crossing
positions per minute. In consideration of perpendicularly to each other on the beam
chromatic aberration in lens focusing, it axe, while the divergence defining slits
is necessary to minimize the energy are composed of ordinary four slit chips.
spread AE/E of 10-4 or less for 10 MeV/u The motion control of each slit was made
- 255 -
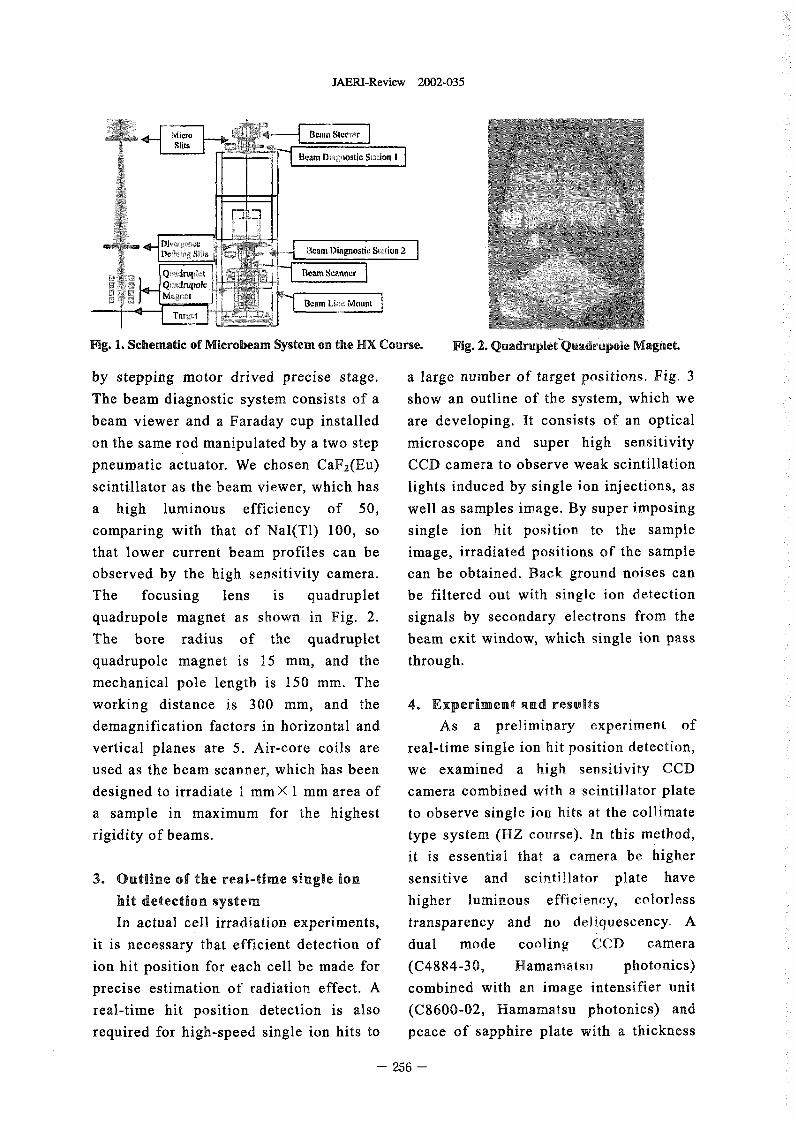
JAERI-Review 2002-035
Beam Diagnostic
r
7 Acani Diagnost
Magnet --------------- ILin BUM L MOM
Fig. 1. Schematic of Microbeam System on the HX Course. Fig. 2 Quadruplet Quadrupole Magnet.
by stepping motor drived precise stage. a large number of target positions. Fig, 3
The beam diagnostic system consists of a show an outline of te system, which we
beam viewer and a Faraday cup installed are developing. It consists of an optical
on the same rod manipulated by a two step microscope and super high sensitivity
pneumatic actuator. We chosen CaF2(Eu) CCD camera to observe weak scintillation
scintillator as the beam viewer, which has lights induced by single ion injections, as
a high luminous efficiency of 50, well as samples image. By super imposing
comparing with that of NaI(Tl) 100, so single ion hit position to the sample
that lower current beam profiles can be image, irradiated positions of the sample
observed by the high seDSitiVity camera. can be obtained. Back ground noises can
The focusing lens is quadruplet be filtered out with single ion detection
quadrupole magnet as shown in Fig. 2 signals by secondary electrons from the
The bore radius of the quadruplet beam exit window, which single ion pass
quadrupole magnet is 15 mm, and the through.
mechanical pole length is 150 mm. The
working distance is 300 mm, and the 4. Experiment and results
dernagnification factors in horizontal and As a preliminary experiment of
vertical planes are 5. Air-core coils are real-time single ion hit position detection,
used as the beam scanner, which has been we examined a igh sensitivity CCD
designed to irradiate I mm X I mm area of camera combined with a scintillator plate
a sample in maximum for the highest to observe single ion hits at the collimate
rigidity of beams. type system (HZ course). In this method,
it is essential that a camera be higher
3. Outline of the real-time single ion sensitive and scintillator plate have
hit detection system higher luminous efficiency, colorless
In actual cell irradiation experiments, transparency and no deliquescency A
it is necessary that efficient detection of dual mode cooling CCD camera
ion hit position for each cell be made for (C4884-30, Hamamatsu photonics)
precise estimation of radiation effect. A combined with an image intensifier unit
real-time hit position detection is also (C8600-02, Hamamatsu photonics) and
required for high-speed single ion hits to peace of sapphire plate with a thickness
256 -
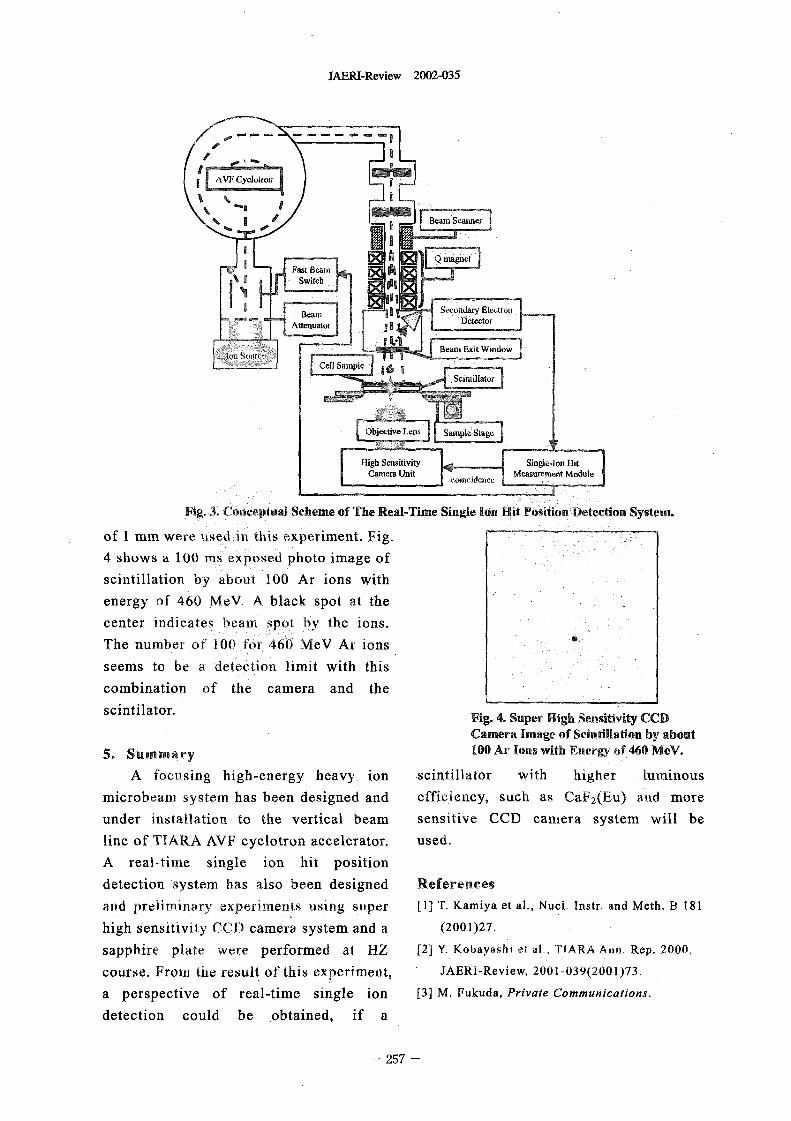
JAERI-Review 2002-035
0041#
eani c
Q inagnetFast Bea
Switcb
A
8 itC
Scintill
Objective LenS Sta
ens v e- onCamem Unit N4casurement
Fig. 1 Conceptual Scheme of The Real-Time Single Ion Hit Position Detection System.
of I mm were used in tis experiment. Fig.
4 shows a 100 Ms exposed photo image of
scintillation by about 100 Ar ions with
energy of 460 MeV A black spot at the
center indicates beam spot by the ions.
The number of I 0 for 460 MeV Ar ions
seems to be a detection, limit with this
combination the camera and the
scintilator.Fig. 4 Super High Sensitivity CCDCamera Image of Scintillation by about
5. Summary 100 Ar Ions with Energy of 460 MeV.
A focusing high-energy heavy ion scintillator with higher luminous
microbearn system has been designed and efficiency, such as CaF2(Eu) ad more
under installation to the vertical beam sensitive CCD camera system will be
line of TIARA AVF cyclotron accelerator. used.
A real-time single ion hit position
detection system has also been designed References
and preliminary experiments using sper [11 T. Kamiya et al., Nucl. Instr. and Meth. B 181
high sensitivity CCD camera system and a (2001)27.
sapphire plate were performed at HZ [2] Y. Kobayashi ot aL, TIARA An, Rep. 2000,
course. From the result of this experiment, JAERI-Review, 2001-039(2001)73.
a perspective of real-time single ion [3] M. Fukuda, Private Communications.
detection could be obtained, if a
257 -
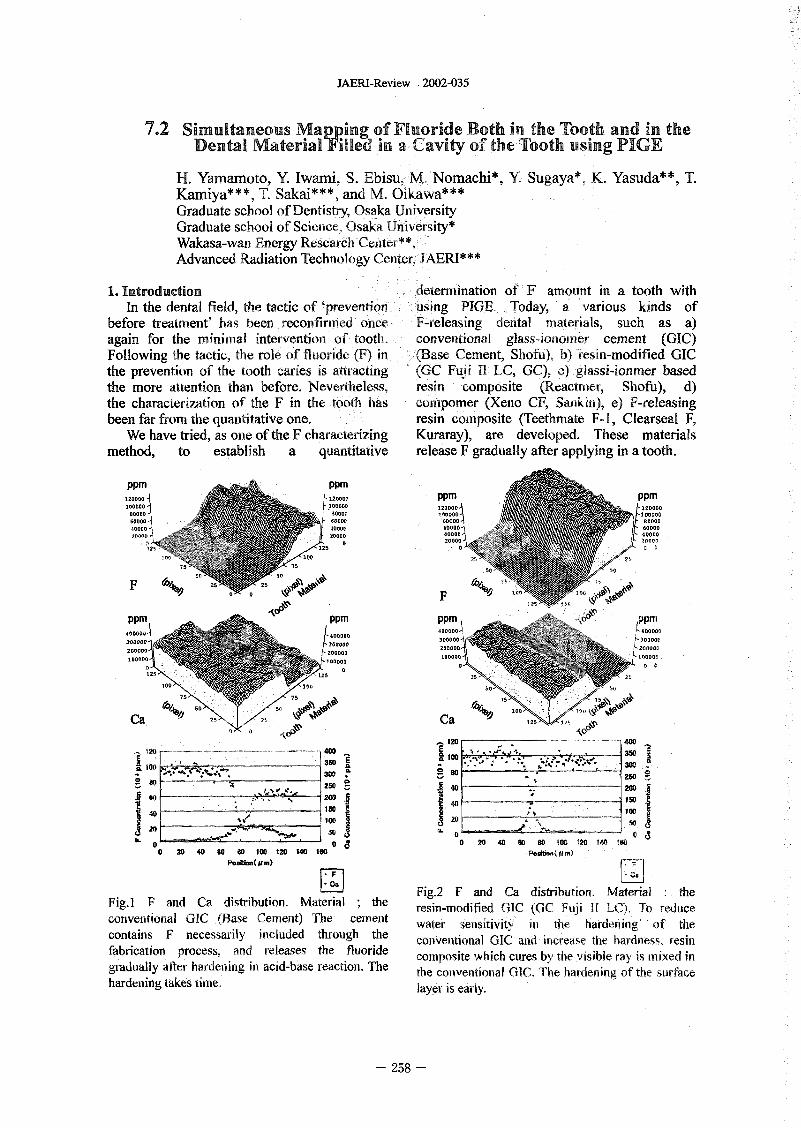
JAERI-Review 2002-035
7.2 Simultaneous Map f Fluoride Both in the Tooth and in theDental Material illed in a Cavity of the Tooth using PIGE
H. Yamamoto, Y. Iwami, S. Ebisu, M. Nomachi* Y Sugaya*, K. Yasuda" T.Kamiya* * *, T. Sakai* * *, and M. Oikawa* * *Graduate school of Dentistry. Osaka UniversityGraduate school of Science, Osaka University*Wakasa-wan Energy Researc Cnter**Advanced Radiation Technology Center,'JAERI***
1. Introduction determination of F amount in a tooth withIn the dental field, the tactic of 'prevention using PIGE. Today, a various kinds of
before treatment' has been reconfirmed once F-releasing dental materials, such as a)again for the minimal intervention of tooth. conventional glass-ionomer cement (GIC)Following the tactic, the role of fuoride (F) in (Base Cement, Shofu), ) resin-modified GICthe prevention of the tooth caries is attractin (GC F 'i 11 LC, GQ, c) gassi-ionmer basedthe more attention than before. Nevertheless, resin composite (Reactriter, Shofu), d)the characterization of the F in the tooth has compomer Xeno C, Sankin), e) F-releasingbeen far rom the quantitative one. resin composite (Teethmate F-1, Clearseal ,
We have tried, as one of the F characterizing Kuraray), are developed. These materialsmethod, to establish a quantitative release F gradually after applying in a tooth.
PPM PPM120000 120DOO PPM PPM
100000 100000 111110 120000coo 3000C 20000060000 60000 00000 8000040000 40000 60000� 60000
20.0 20000 .0- 400000 ?0000
1 5 0 0 0
10 90
F 6/1 50 NN '5
,be F 10
PPM PPM PPM PPM10011, 411110 � 1.0.01
'.0.00 1-30000C
20000 200000 Z00000
100000 100000 "00060 0 0
125 5 25
Ca Ca
- 120 4W120 4W E - , 3Woa.-Icelog 350 3W
31 25000 250 50 200
40 -------------------- 15D40 ' S too
10D 2D20 so 0 1 140 1 0
0 0 0 20 40 80 80 100 so0 2D 40 50 80 100 120 140 100 podtv"(Pm)
POOR 0(m) L;1P� Fig.2 F and Ca distribution. Material the
Fig.1 F and Ca distribution. Material the resin-modified GIC (GC Fuji It LQ� To reduceconventional GIC (Base Cement) The cement water sensitivity in the hardening of thecontains F necessarily iuded through the conventional GIC and increase the hardness, resinfabrication process, and releases the fluoride composite hich cures by the visible ray is mixed ingradually after ardening i acid-base reaction. The the conventional GJC. The hardening of the surfacehardening takes time. layer is early.
- 258 -
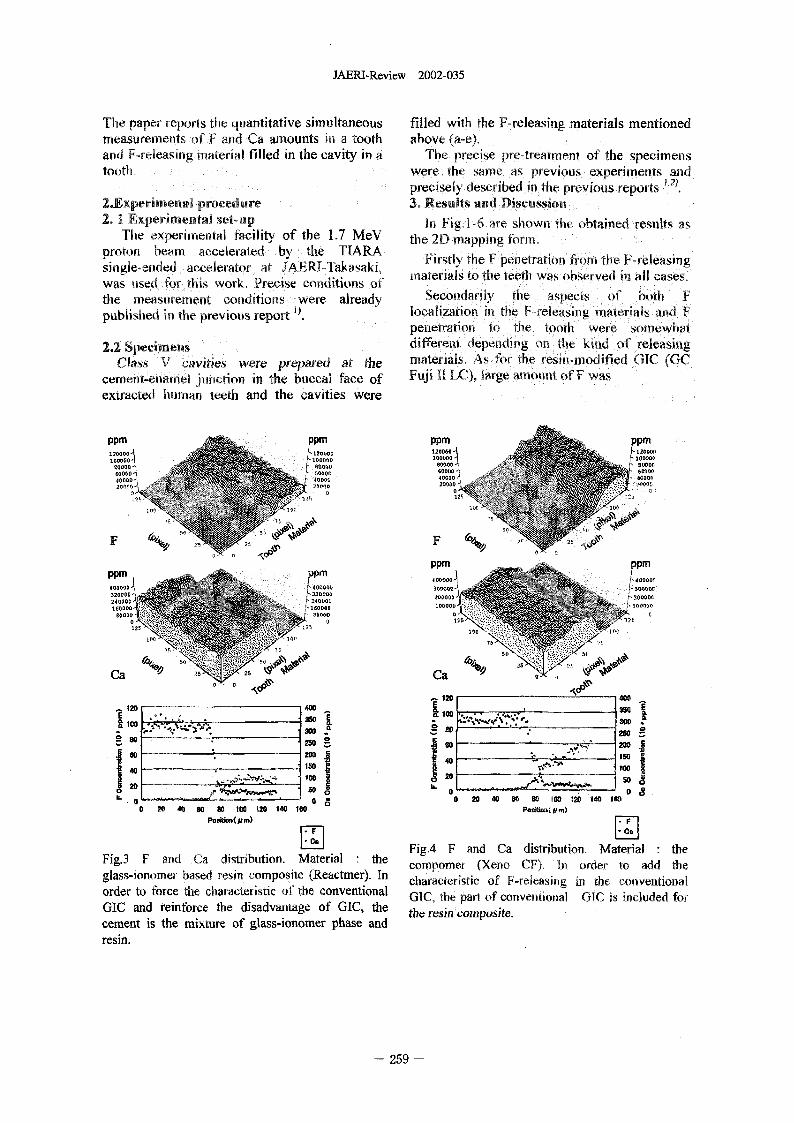
JAERI-Review 2002-035
The paper eports the quantitative simultaneous filled with the F7releasiruz materials mentionedmeasurements of F ad Ca aluounts i a tooth above (a-e).and F-releasing material filled in the cavity in a The precise pretreatment of the specimenstooth. were the same as previous experiments and
precisely described in te previous reports2.Experimenal procedure 3. Results and Discussion
2. 1 Experimental set-up In Fig3-6 are sown the obtained results asThe experimental facility of e 17 MeV the 2 mapping form.
proton beam accelerated by� the TIARA Firstly te F enetration from te -releasingsingle-ended accelerator at JAERT,-Takasaki, materials to the teeth was observe i all oases.was used for is work, Precise (conditions oftile Measurement onditions were already Secondarily the aspects of both Fpublished in the previous report localization in he F-releasilig materials and F
penetration to the tth were somewhat
2.2 Speci as different depending o the kind of releasing,deClass cavities were prepared at the materials. As for te resin-l-flodified 01C (OC
cer"ent-enarnel junction in te buccal face of Fuji 11 LC), large aount of F was
extracted hurnan teeth and the cavities were
PPM PPM Win PPMMow
'loll 9ooovwooo 'oow
...... 200ODC
2oooo12
NMR
5o 16 FF
PPM PPMPPM PPM duoooc...... t'Oooob :11.11 ol
320ODC muvo2406DE- NowMM MOOD �1 WOO
Muo 1000D 0 o
Ca Ca
12D 4W12D 4W
3W E 3DOIOD
W 40 ISO15040 00'00 ZD - 30
2D 50 E Io 0 00- - 0 0 20 40 00 W 1W 120 140 150
0 40 00 W 100 120 pbsitwn(pm)Poewm(mm)
FF
FigA F and Ca distribution. Material theFig.3 F and Ca distribution. Material the compomer (Xeno CF)� In order to add teglass-ionomer based resin composite (Reactmer). In characteristic of Freleasing in the conventioiralorder to force te characteristic of the conventional GIC, the part of conveirtional GIC is icluded forGIC and reinforce te disadvantage of GIC, the the esin composite.cement is the mixture of glass-ionomer phase andresin.
- 259 -
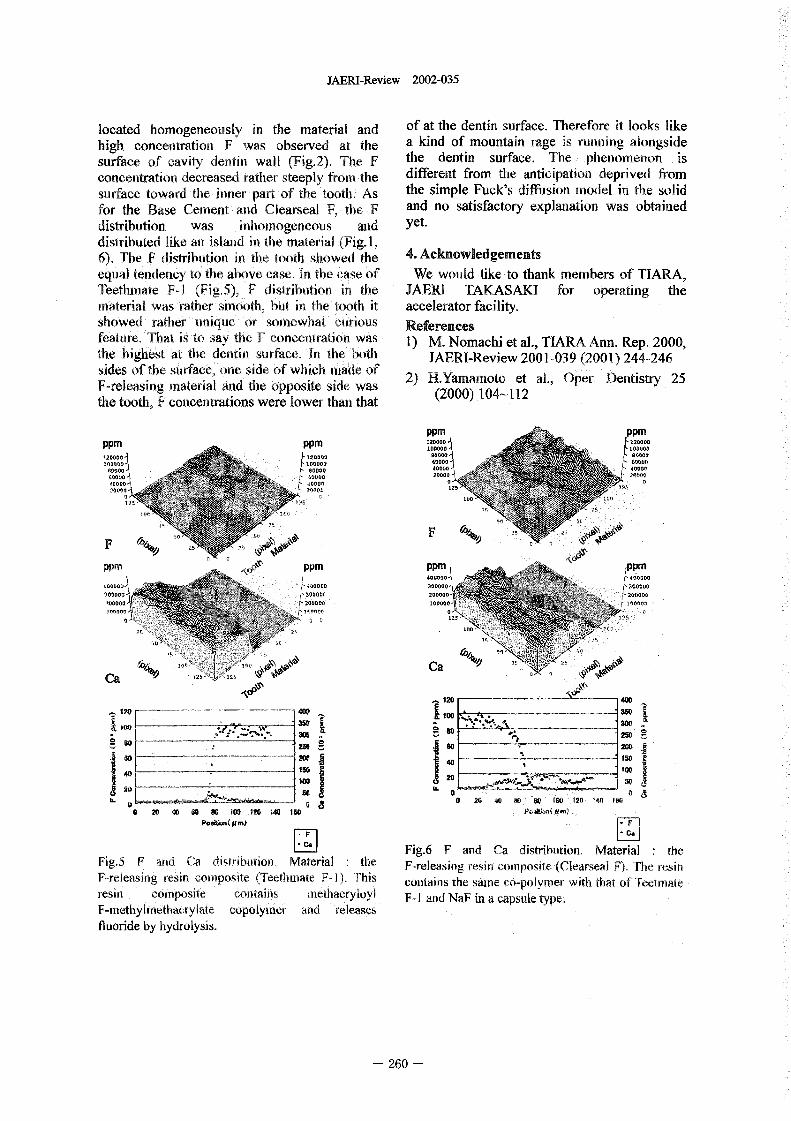
JAERI-Review 2002-035
located homogeneously in the material and of at te dentin surface. Therefore it looks likehigh concentration F was observed at te a kind of mountain rage is nning alongsidesurface of avity entin wall (ig.2). The F the dentin surface. Te phenomenon isconcentration decreased rather steeply frorn the different from the anticipation deprived fromsurface toward the inner part of the 4ooth. As the simple Fuck's diffusion model in te solidfor the Base Cement and Clearseal the F and no satisfactory explanation was obtaineddistribution was inhomogeneous and yet.distributed like a island in te material (Fig.1,6). The F distributio i te tooth showed e 4. Acknowledgementsequal tendency to the above case. In the case of We would like to thank members of TIARA,Teethinate F-1 (ig.5) F distributio i te JAERI TAKASAKI for operating thematerial was rather smooth, but in the tooth it accelerator facility,showed rther unique or somewhat curious Referencesfeatum That i to say the F concentration was 1) M. Nomachi et aL, TIARA Ann. Rep. 2000,the highest at te dentin surface. In the both JAERI-Review 2001-039 2001) 244-246sides of te surface, one side of which ade of 2) H.Yamamoto et al., Oper. Dentistry 25F-releasing material and the opposite side was (2000) 104-112the tooth, F concentrations were lower than that
PPM PPM120000 �22000D
PPM PPM
.. O 11�%0�1.%O 60000RGOOO 40000
4000020M
"O" 60000 00
7 15 F
F b, - \Nwc�
PPM PPM PPM IPPM
200OD(,'"011 ......
�20
(A'>, 10 Ca IMCa
MO100
80
so M so 2W
M 2W ISO
40 --- I% ,00
JOB $0U. 0 x U U 2o w V 0
0 20 40 6D 90 100 120 140 1W
Fig.6 F and Ca distribution, aterial theFig.5 F and Ca distribution, Material the F-releasing resin omposite (learseal F). Te resinF-releasing resin composite (Teethmate F-1). Tbis contains the same co-polymer with that of Teetruateresin composite Contains methacryloyl F I ad NaF in a capsule type.F-mefitylinethaerylate copolymer ad releasesfluoride by hydrolysis.
- 260 -

JAERI-Review 2002-035
7.3 Development of In-Air Micro-PIXE Analysis System
A.Tanaka, K.Ishil. YKomorl, S.Matsuyama, H.Yamazaki, K.Kubota*, H.Fukuda*,
T.Kam' a**, T.Satoh**, T.Sakal**, M.Oikawa**, K.Arakawa**,M.Saidoh**
Department of Quantum Science and Energy Engineering, Tohoku Univ.
Institute of Development, Aging and Cancer, Tohoku Univ.*
Advanced Radiation Technology Center, JAERI**
1. Introduction
Accelerating heavy-charged particles like PIXE Camera.
protons or oL particles by an accelerator at In a micro-PIXE aalysis, Volatile elements
several MeV and radiating a sample, we can not detected because samples are usually
observe characteristic x-rays of elements irradiated in the vacuum and the volatile
contained in the sample. Since the cross elements evaporate, his is senous in the
sections of characteristic x-rays are very large case of biomedical samples tat contain
(10OOb-10000b), we an use these x-rays to some important volatile elements. To
analyze trace elements, This method is called analyze biomedical raw samples, we
PIXE (Particle Induced X-ray Emission) developed a micro-PIXE analysis system in
analysis inethod and all elements except for which the target is set up air and be
the light olements hydrogen -oxygen) can be cooled by helium gas. We call this system
simultaneously detected with high sensitivity. In-Air Micro-PIXE. The target cooling
Therefore PIXE is widely applied to medicine, reduces the damage to target samples from
biology, egineering, enviromnental science, beam heating. When te biological sample is
archeology ad so on. Moreover, focusing the irradiated in vacuum, it shrinks due to beam
beam spot within 1tm, then scanning the heating, its shape is deformed and the
surface of the sample and recording the beam correct distribution of elements can not be
position when the characteristic x-ray is obtained). These poblems are resolved by
detected we obtain the spatial distribution of the In-Air micro-PIXE Camera').
elements in the sample. We are now The measurement of the spatial distribution
developing a nucro-PIXE system at the of elements in a cell is one of the most useful
Division of Takasaki Ion Accelerators for applications. Target preparation techniques of
Advanced Radiation Application (TIARA) in cellular samples for te In-Air Micro-PIXE
JAER1 -). Since this system takes pictures of Camera are under development. Up to the
elemental distributions, we call it a Micro- present, we established the technique for single
261 -
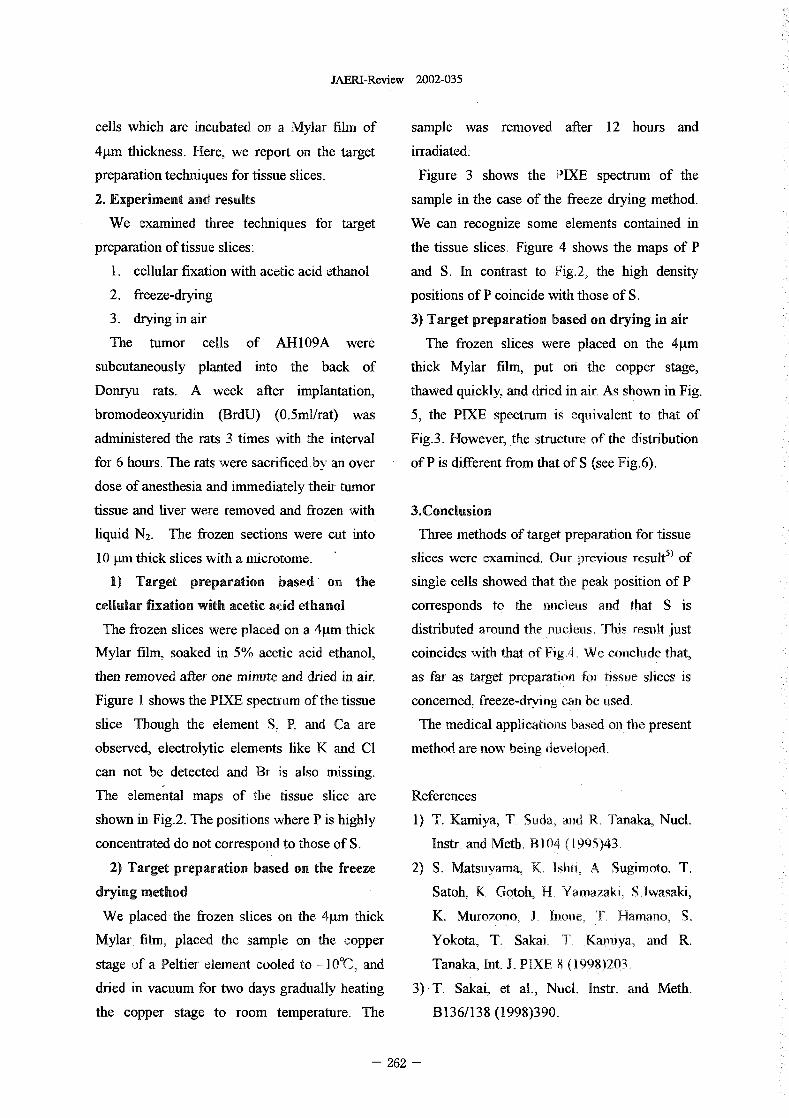
JAERI-Review 2002-035
cells which are incubated on a Mylar film of sample was removed after 12 hours and
4�trn thickness. Here, we report on the target irradiated:
preparation techniques for tissue slices. Figure 3 shows the PIXE spectrum of the
2. Experiment and results sample in the case of the freeze drying method.
We examined tree techniques for target We can recognize some elements contained in
preparation of tissue slices the tissue slices� Figure 4 shows the maps of P
1. cellular fixation with acetic acid ethanol and S. In contrast to Fig.2, the high density
2. freeze-drying positions of P coincide with tose of S.
3. drying in air 3) Target preparation based on drying in air
The tumor cells of AH109A were The frozen slices were placed on the 4lLm
subcutaneously planted into the back of thick Mylar film, put o the copper stage,
Donryu rats. A week after implantation, thawed quickly, and dried in air. As shown in Fig.
bromodeoxyuridin (BrdU) (0.5ml/rat) was 5, the PXF spectrum i quivalent to that of
administered the rats 3 times with the interval Fig.3. Howeverthe structure of the dstribution
for 6 hours, The rats were sacrificed by an over of P is different from that of S (see Fig. 6).
dose of anesthesia and immediately their tumor
tissue and liver were removed and frozen with 3.Conclusion
liquid N2. The frozen sections were cut into Three methods of target preparation for tissue
IO m thick slices with a nucrotome. slices were examined. Or previous result 5) of
1) Target preparation based on the single cells showed tat te peak position of P
cellular fixation with acetic acid ethanol corresponds to the nuclous and tat S is
The frozen slices were placed on a l.Lm thick distributed around the nucleus, This result Just
Mylar film- soaked in 5% acetic acid ethanol, coincides with that of Fig,4, We conclude tat,
then removed after one inute and dried in air. as far as target peparation for tsu sces is
Figure I shows the PLXE spectrum of te tissue concerned, freeze-drying oan be sed.
slice. Though the element S. R and Ca are The medical applications based on the present
observed, electrolytic elements like K and C method are now being developed,
can not be detected and By is also missing.
The elemental maps of the tissue slice are References
shown in Fig.2. The positions where P is highly 1) T. Kamiya T Suda, ad R. Tanaka, Nucl.
concentrated do not correspond to those of S. Instr. and Meth B04 (1995)43.
2) Target preparation based on the freeze 2) S. Matsuvarna K Ishii, A. Sugimoto, T.
drying method Satoh. K. Gotoh, H, Yamazakt, .Iwasaki,
We placed the frozen slices on the 4grn thick K. Murozono J oue, T. Marnano S.
Mylar film. placed the sample on the opper Yokota, T, Sakai. T. Kam'va, and R.
stage of a Peltier element cooled to -109C , and Tanaka, Int. J. PIXE (1,998)203,
dried in vacuum for two days gradually heating 3 -T. Sakai, et al., N ucl. nstr. ad Meth.
the copper stage to room temperature. The B136/138 1998)390.
- 262 -
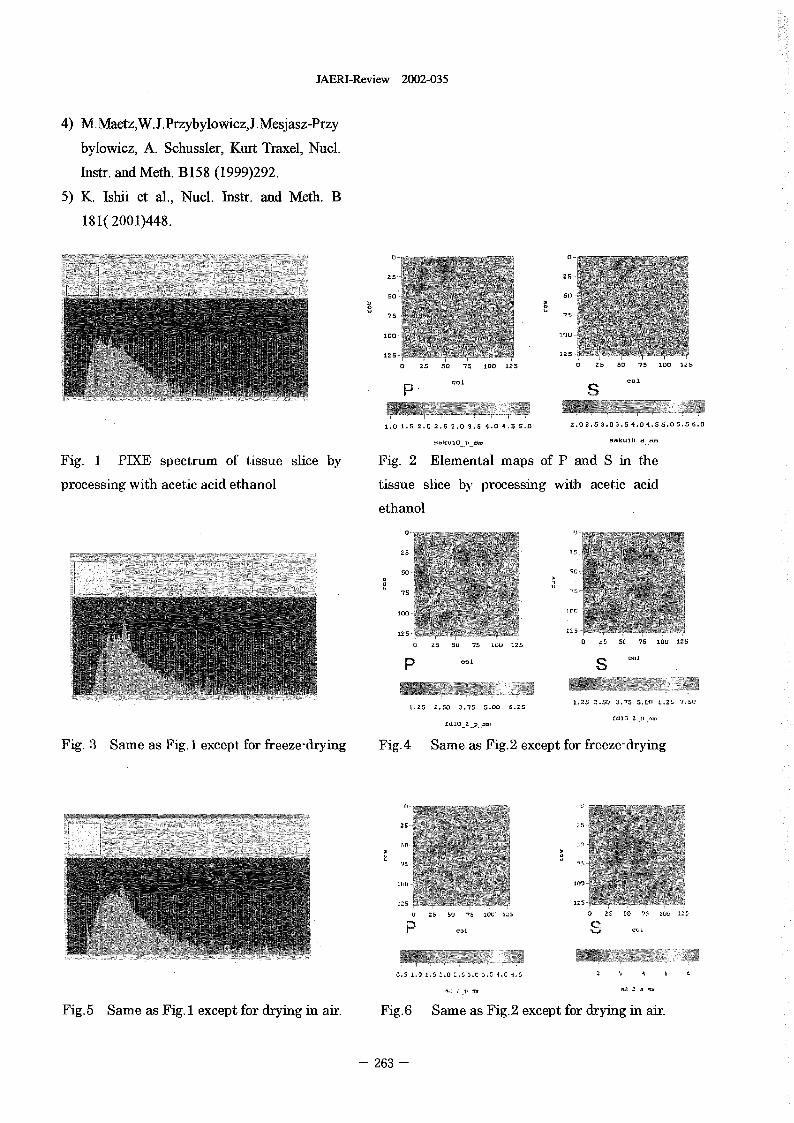
JAERI-Review 2002-035
4) M.MaetzW.J.Przybylowiez,J.Mesjasz-Przy
bylowicz, A. Schussler, Kurt Traxel, Nucl.
Instr. and Meth. B158 1999)292.
5) K. Ishii et al., Nucl. Instr. and Meth. B
181(2001)448.
2 5
so so
75
,nu
125
25 so 7& 100 Z D 25 SD 75 10 1
C.1
P
1.0 I. 20 25 .0 .5 40 45 .0 Z.OZ.5 3.00.54.04.S5.05.5 .0
-k.10p..
Fig. I PIXE spectrum of tissue se by Fig. 2 Elemental maps of P and in the
processing with acetic acid ethanol tissue slice by processing with acetic acid
ethanol
02S
so SO
75
100 00
12 5 125-
0 2 5 Su 75 Wu 125 0 ;�s 51 75 lou 1�s
P .. L
Z;v
1.25 2.50 5.00 6.25
[,1202fd1 Z p
Fig. Same as Fig. I except for freeze-drying Fig.4 Same as Fig.2 except for freeze-drying
25
5
7!,
125
t' 25 SU 1� 2�5 D 2Z M 1� Wt�
P
.2 2
Fig.5 SameasFig.lexceptfordryinginair. Fig.6 Same as Fig.2 except for drying in air.
263 -
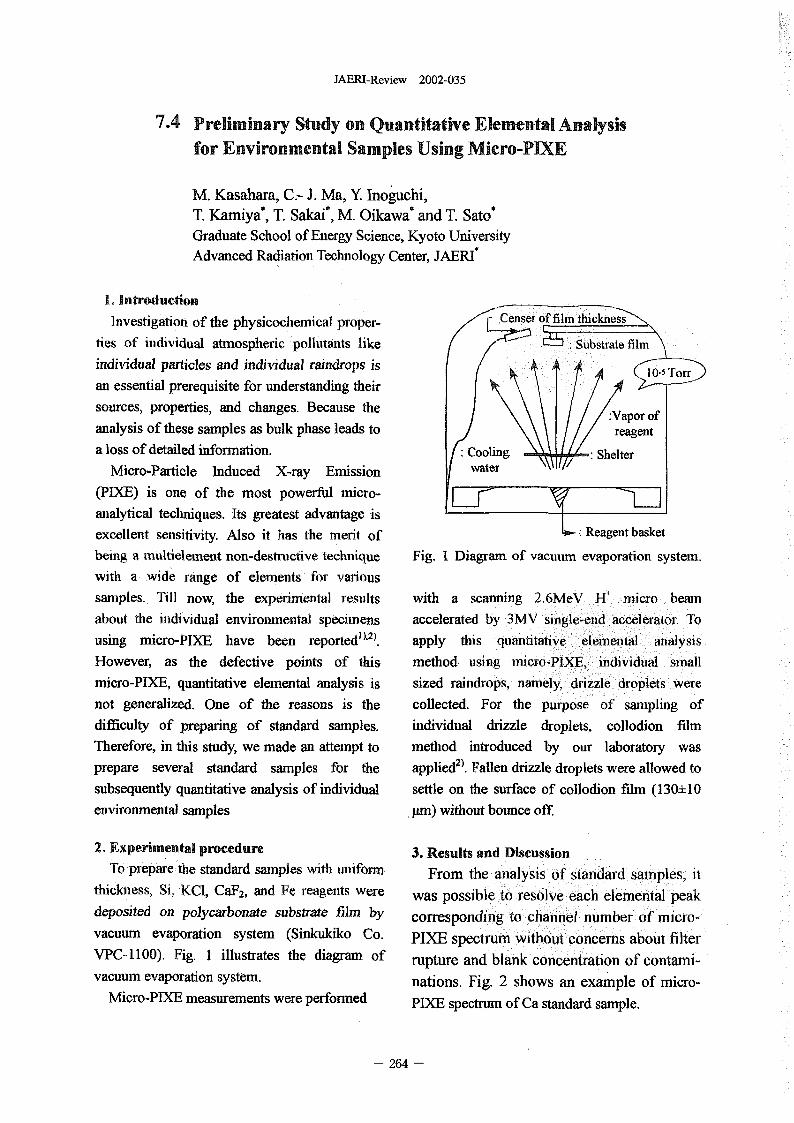
JABRI-Review 2002-035
7.4 Preliminary Study on Quantitative Elemental Analysisfor Environmental Samples Using Micro-PIXE
M. Kasahara, C- J. Ma, Y Iojuchi,T. Kamiya', T. Sakai', M. Oikawa* and T. Sato*Graduate School of Energy Science, Kyoto UniversityAdvanced Radiation Technology Center, JAERf
1. IntroductionInvestigation of the physicochemical proper- 0 f,
ties of individual atmospheric pollutants like i Substrate filinindividual particles and individual raindrops is
-5 Torran essential prerequisite for understanding theirsources, properties, and changes. Because the Napor ofanalysis of these samples as bulk phase leads to reagenta loss of detailed iformation. ling Shelter
Micro-Particle Induced X-ray Emission
(PIXE) is one of the most powerful icro-
analytical techniques. Its greatest advantage isexcellent sensitivity. Also it has the mrit of L.-Reagent basket
being a nultielement non-destructive tecitnique Fig. I Diagram of vacuum evaporation system.
with a wide ange of elements for various
samples. Till now, the experimental results with a scanning 2.6MeV J4" micro bearn
about the individual environmental specimens accelerated by 3MV sgle-end aelerator To12)using micro-PIXE have been reported' apply this quantitative elemental analysis
However, as the defective points of this method. using inicto-PIXE, individual smallmicro-PIXE, quantitative elemental analysis is sized raindrops, namely, drizzle Barriers were
not generalized. One of the reasons is the collected. For the purpose of sampling of
difficulty of preparing of standard samples. individual drizzle droplets, collodion fdm
Therefore, in this study, we made an attempt to method introduced by our laboratory was
prepare several standard samples for the applie&�. Fallen drizzle droplets were allowed to
subsequently quantitative analysis of individual settle on the surface of collodion flrn 130±10environmental samples Wn) without bounce off.
2. Experimental procedure 3. Results and Discussion
To prepare te standard samples with uniform From the analysis of standard, samples itthickness, Si, KC1, CaF2, and Fe reagents were was possible to resolve each elemental peak
deposited on polycarbonate substrate film by correspondents,, to channel humber of micro-
vacuum evaporation system (Sinkukiko Co, PIXE spectrum without concerns about filter
VPC-1100). Fig. I illustrates the diagram of rupture and blank concentration of contami-
vacuum evaporation svstem. nations. Fig. 2 shows an example of micro-
Micro-PIXE measurements were performed PIXE spectrum of Ca standard sample.
- 264 -
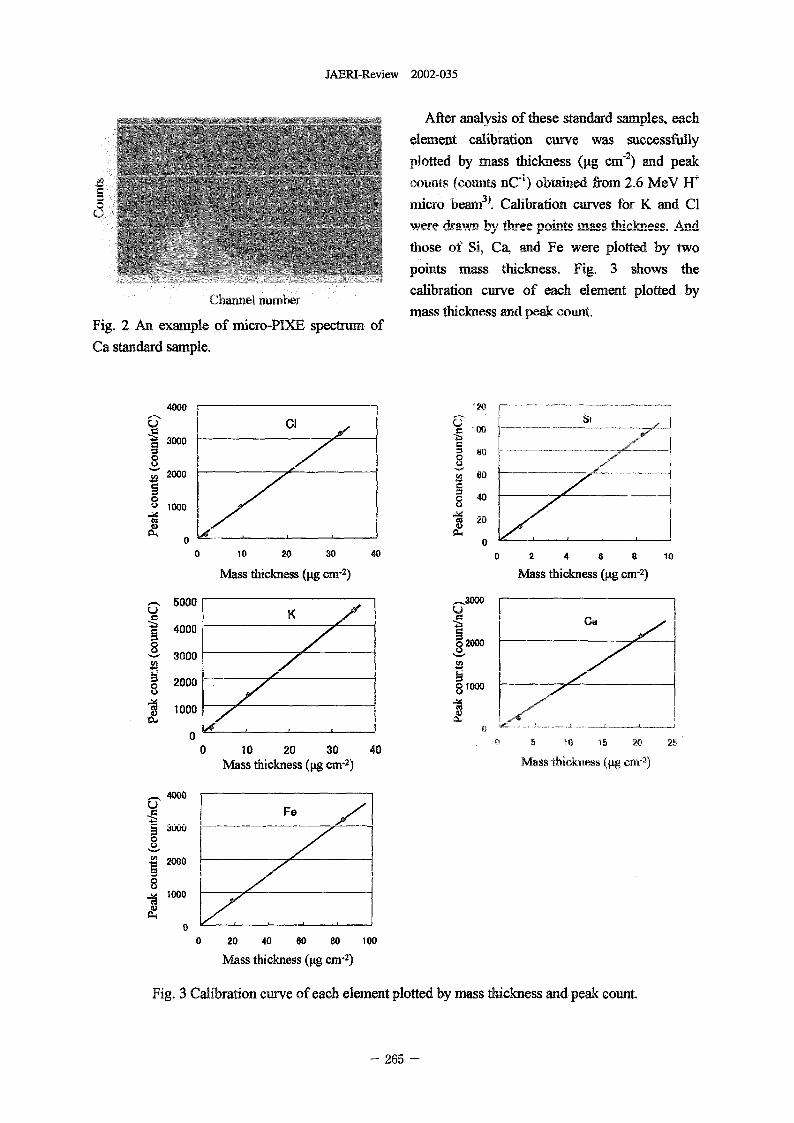
JAERI-Review 2002-035
After analysis of these standard samples, each
element calib ration curve was successfully
plotted by mass thickness (pg cm-2) and peak
counts (counts nC-) obtained from 26 MeV
InIcro beam3). Calibration curves for K and CI.e ftrn bar thr,-,- n%;n*c mage f;f-",-ce Al.Y -- -- r
those of Si, Ca, and Fe were plotted by two
points mass thickness. Fig. 3 shows the
Channel number calibration curve of each element plotted bymass thickness and peak count,
Fig. 2 An example of nicro-PIXE specturn of
Ca standard sample.
4000 f Q
100
3000
2000 60
0 401000
Ca zu0 V 4 00 1 0 20 30 40 0 2 4 6 a I 0
Mass thickness gg cm-2) Mass thickness (gg m-2)
5000 _30DDK U i
4000 Ca
3000 VW
2000 0 1000
1000is
0 10 20 30 40 5 20 26
Mass thickness (pg CM-2) Mass tbickliess (Vg cni-2)
4MFe
0
2000
1000
0 20 40 60 80 100
Mass thickness (pg cm-2)
Fig. 3 Calibration curve of each element plotted by mass thickness and peak count.
- 265 -
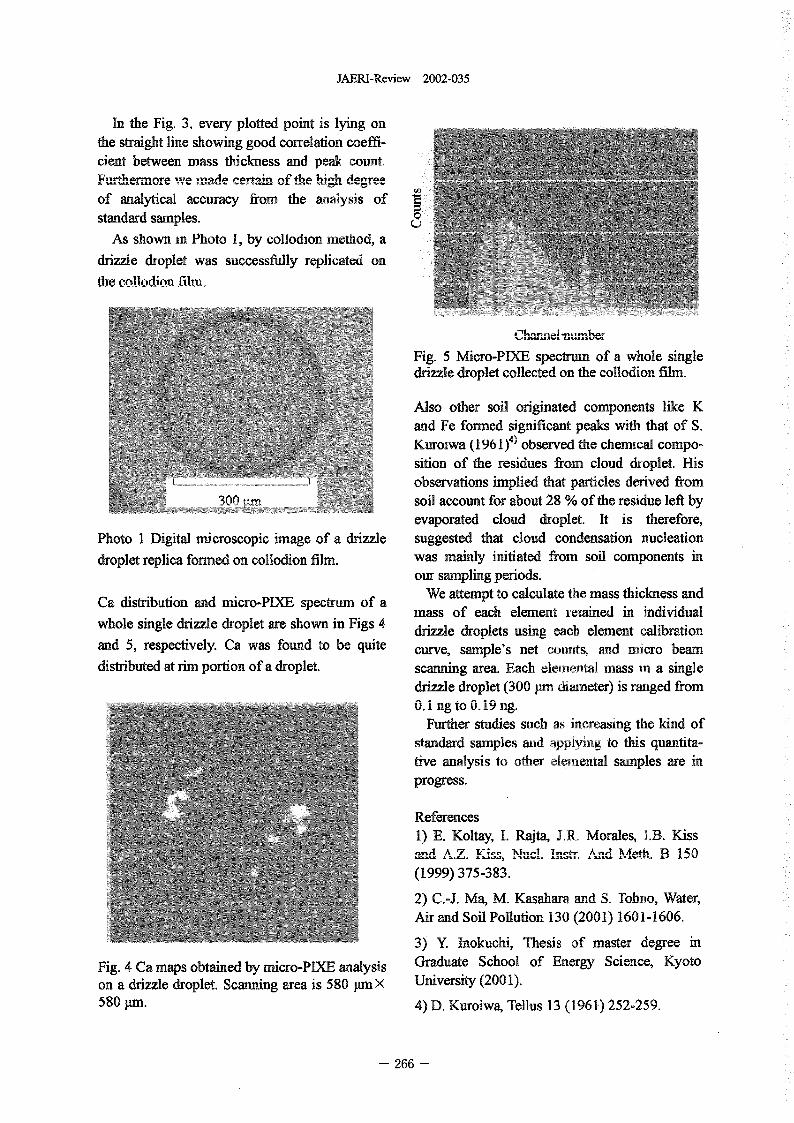
JAERI-Review 2002-035
In the Fig. 3 every plotted point is ling onthe straight line showing good correlation coeffi-cient between mass thickness and peak count.Flirthhermore lare made cort-ain ^-f nhe hirgh
of analytical accuracy from the aalysis ofstandard samples.
As shown in Photo 1, by collodion method, a
drizzle droplet was successfidly replicated onLive, 111-TTI.-
Fig. 5 Micro-PIXE spectrum of a whole singledrizzle droplet collected on the collodion film.
Also other soil originated components like Kand Fe formed significant peaks with that of S.Kuroiwa (1961f observed the chemical compo-sition of the residues from cloud droplet. Hisobservations implied that particles derived from
30 soil account for about 28 % of the residue left byevaporated cloud droplet. It is therefore,
Photo I Digital microscopic image of a drizzle suggested that cloud condensation nucleationdroplet replica formed on collodion film. was mainly initiated frorn soil components
our sampling periods.
Ca distribution and micro-PLXE spectrum. of a We attempt to calculate the mass thickness andmass of each element retained in individual
whole single drizzle droplet are shown in Figs 4 drizzle droplets using each element calibrationand 5, respectively. Ca was found to be quite curve, sample's net counts, and micro beamdistributed at rim portion of a droplet. scanning area. Each elemental mass in a single
drizzle droplet 300 pm diameter) is ranged from0 I ng to . 9 ng.
Further studies such as increasing the kind ofstandard samples and applying to this quantita-tive analysis to other emental samples are inprogress.
References1) E. Koltay, 1. Rafta, J.R. Morales, LB. Kiss.- A A 7 V- M- - A-A WjF.+k n rA
(1999) 375-383.
2) C.-J. Ma, M. Kasahara and S. Tohno, Water,Air and Soil Pollution 130 2001) 1601-1606.
3) Y. Inokuchi, Thesis of master degree in
Fig. 4 Ca maps obtained by micro-PLNE analysis Graduate School of Energy Science, Kyotoon a drizzle droplet. Scanning area is 580 pm. X University 200 1).580 Wn. 4) D. Kuroiwa, Tellus 13 1961) 252-259.
266 -
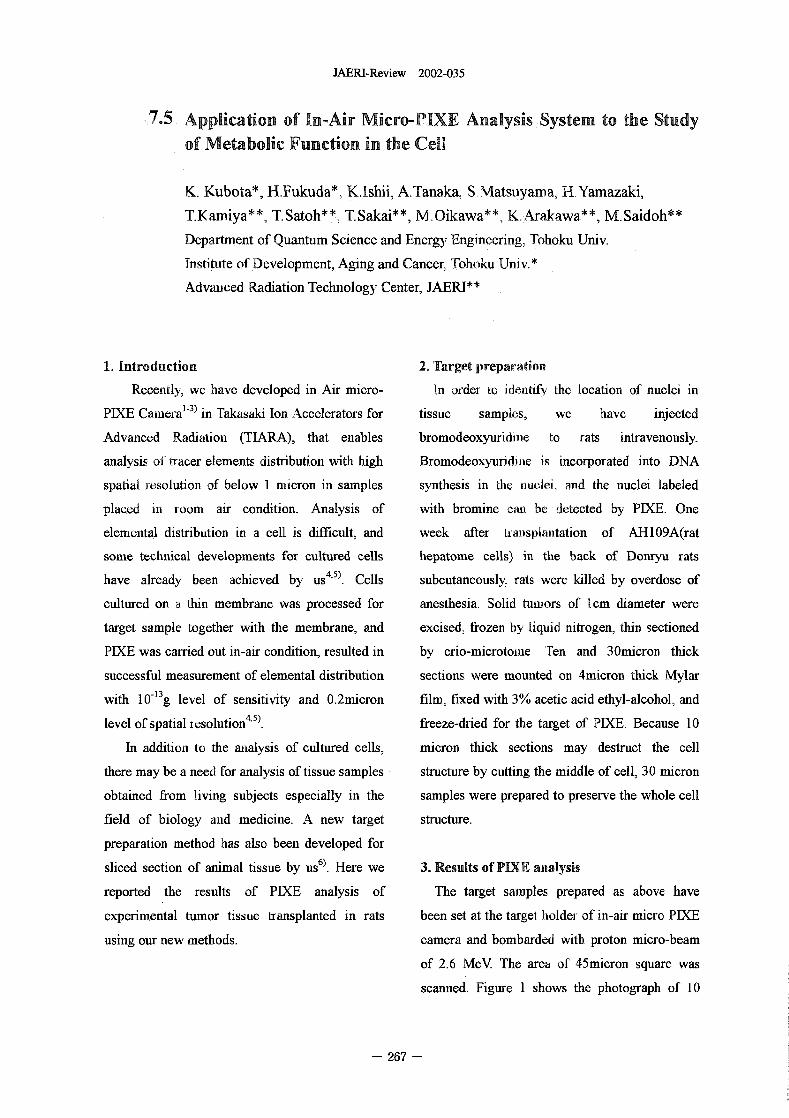
JAERI-Review 2002-035
7.5 Application of In-Air Micro-PIXE Analysis System to the Studyof Metabolic Function in the Cell
K. Kubota*, H.Fukuda*, K.1shii, A.Tanaka, SMatsiryama, HYarnazaki,
T.Kamiya", T.Satoh**, T.Sakai**, M.Oikawa**, KArakawa**, M.Saidoh**
Department of Quantum Science and Energy Engineering, Tohoku mv.
Institute of Development, Aging and Cancer, Tohoku UnJv.*
Advanced Radiation Technology Center, JAERI**
1. Introduction 2. Target preparation
Recently, we have developed in Air mcro- In order to dentify the location of nuclei in
1-3)PIXE Camera in Takasaki Ion Accelerators for tissue samples, we have injected
Advanced Radiation (TIARA), that enables bromodeoxyuridroe to rats intravenously.
analysis of tracer elements dstribution with high Bromodeoxyuriditic is incorporated into DNA
spatial resolution of below I icron in samples synthesis in te uclei, and the nuclei labeled
placed in room air condition. Analysis of with bromine c be detected by PIXE. One
elemental distribution 'n a cell is difficult, and week after traosplantation of AH109A(rat
some technical developments for cultured cells hepatome cells) in te back of Donryu rats
have already been achieved by us4-'). Cells subcutaneously rats were killed by overdose of
cultured on a in membrane was processed for anesthesia. Solid tumors of lcm diameter were
target sample together with the membrane, and excised. fi7ozen by liquid nitrogen, thin sectioned
PIXE was carried out in-air condition, resulted in by crio-microtome- Ten and 30micron thick
successful measurement of elemental distribution sections were mounted on 4micron thick Mylar10-13g nu film, fixed with 3 acetic acid ethyl-alcohol. and
w th level of sensitivity and 02 'cron
level of spatial resolution 4,5). freeze-dried for the target of PIXE. Because 0
In addition to the aalysis of cultured cells, micron thick sections may destruct the cell
there may be a need for analysis of tissue samples structure by cutting the middle of cell, 30 micron
obtained from living subjects especially in the samples were prepared to preserve the whole cell
field of biology ad medicine. A new target structure.
preparation method has also been developed for
sliced section of animal tissue by us 6) . Here we 3. Results of PIXE aalysis
reported the results of PIXE analysis of The target samples prepared as above have
experimen tal tumor tissue transplanted in rats been set at the target older of in-air micro PIXE
using our new methods. camera and bombarded wth proton micro-beam
of 26 MeV The area of 45micron square was
scanned Figure I shows the photograph of I
- 267 -
JAERI-Review 2002-035
micron section after irradiation observed by A little of bromine distribution was observed
phase-contrast Microscope. We distinguished the in the area of nuclei in this experiment In
cellular region from the empty region by tis cultured cell, bromine will be transferred to the
figure. In the characteristic X-ray spectrum, the cell directly from the medium through the cell
elements P, S, Cl, Ca, K and Br were identified. membrane, while in the tumor tissue in vivo, the
Figure 2 shows the elemental maps for these delivery of bromine to cancer cell depends on the
elements, where the cellular regions recognized blood flow to the tumor and on the micro
by Fig.1 are surrounded with the blue line. circulation within the tumor tissue. In addition,
Distribution of phosphorus was localized both in the growth fraction of in vivo tmor tissue seems
10 and 30 �Lrn sections. Other elements were to be lower than that of cells vitro. That will
distributed surrounding the high concentration affects the incorporation rate of bromodeoxy-
area of phosphorus. The counts of both zc and undine into the tissue. As the results of these
bromine were too low to form any specific factors, the amount of bromine detected seems to
localization within the tissue. There is a tendency become small. A little but definite counts of
that higher concentration of bromine was bromine were recorded, it suggested that if we
observed in the same area of high phosphorus can use a large field of view X-ray detector that
concentration. The samples of 30 micron were has the sensitivity of 10 times higher than that of
cracked during the ion bombardment. the current system, we can analyze the specific
localization of various metal compounds within
4. Discussion tissue samples. That may open a new possibility
In this experiment, clear images of the cell of PIXE analysis for biological samples,
as seen in previous single cell experiments were especially for tissue localization study of metal
not observed. We considered for this reason that compound given in vivo.
the cell structure was destructed by cutting the
mlddle of cell because of 10 [tm thickness. In this References1) T. Ka iya, T. Suda. and R. Tanaka, Nucl.
expe ment, therefore, 30 �Lrn section samples Du
were also prepared to preserve the whole cell Instr. and Meth. B104 1995)43.
structure. However, the results of 30 �Lrn sections 2) S. Matsuyama, K Ishii'. A. Sugimoto, T.
were the same as 10 4 sections. We observed Satoh, K. Gotoll, H_ Yarriazaki.. S.Iwasaki K.
10 �tm sections after beam irradiation by a Murozono, J. Inoue, T Hamano, S. Yokota, T.
phase-contrast microscope (see Fig.1). As the Sakai, T. Kamlya, and R, Tanaka. hit, J.
results, the areas of elements distribution were PIXE 8 1998)203.
corresponded to the area of viable cancer cells. 3) T.Sak-al, et al., Nucl. Instr. and Meth.
When we used the elements distribution image of B136/138 1998)390.
single cells as the reference, te localized 4) A. Sugimoto, K. Ihii. S. Matsuyama, T.
distribution of phosphorus was considered to Satoh, et al. International Journal of
delineate the shape of nuclei of individual cancer PIXE,, 151 1999).
cells. 5) K.Ishli, A.Suglmoto, A.Tanaka, T.Satoh,
- 268 -
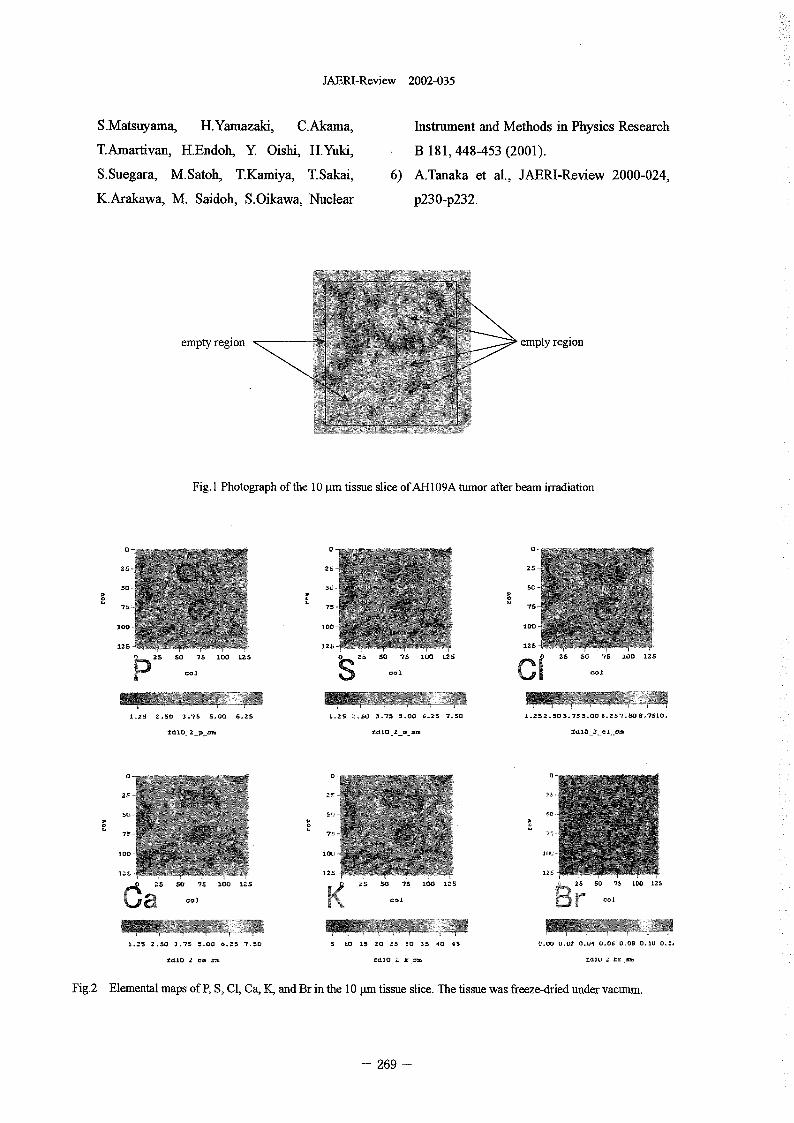
JA-ERI-Review 2002-035
S.Matsuyama, H.Yamazaki, C.Akama, Instrument and Methods in Physics Research
T.Amartivan, H.Endoh, Y Oishi, H.Yuki, B 181, 448-453 2001).
S.Suegara, M.Satoh, T.Kamiya, T.Sakal, 6) A.Tanaka et al., JAERI-Review 2000-024,
K.Arakawa, M. Saidoh, S.Oikawa. Nuclear p230-p232.
empty region empty region
Fig. I Photograph of the I �tm tissue slice of AH109A tumor ater beam irradiation
026 2S
so Su SC
75 75 75
2 OO 100 IDO
12S 12B 125
n 2 60 IS 200 125 0 2 6 50 ?S IUO L25 2S Su 5 10 1Sr% P%P --I I)
MWERMPME MWEPERWAM1.25 2.50 3.7s S.00 6.Z5 L.25 Z_$U 3.75 5.00 6.25 7.50 1.252.503.755.00 .25I.S08,7510.
IdIO_ Zp_a.
0 0 n
2S 2
.10
7r
100 I OC
2 5 so ?S 100 US ZS so., 7S 100 I's 2S so 75 100 125
a rMWIENEW 3w
I.-IS 2.50 3.7S 5.00 6.25 7.50 5 IC) IS 20 ZS BO 35 40 45 L%0 . .0 . 0.0 OU -4
IdIO .. � fd1 L X .. %*1U - L -
Fig.2 ElementalmapsofPSC1,CaKandBrinthelopmtissuesiiee.Thetissuewasfreeze-driedundervacuum.
- 269 -
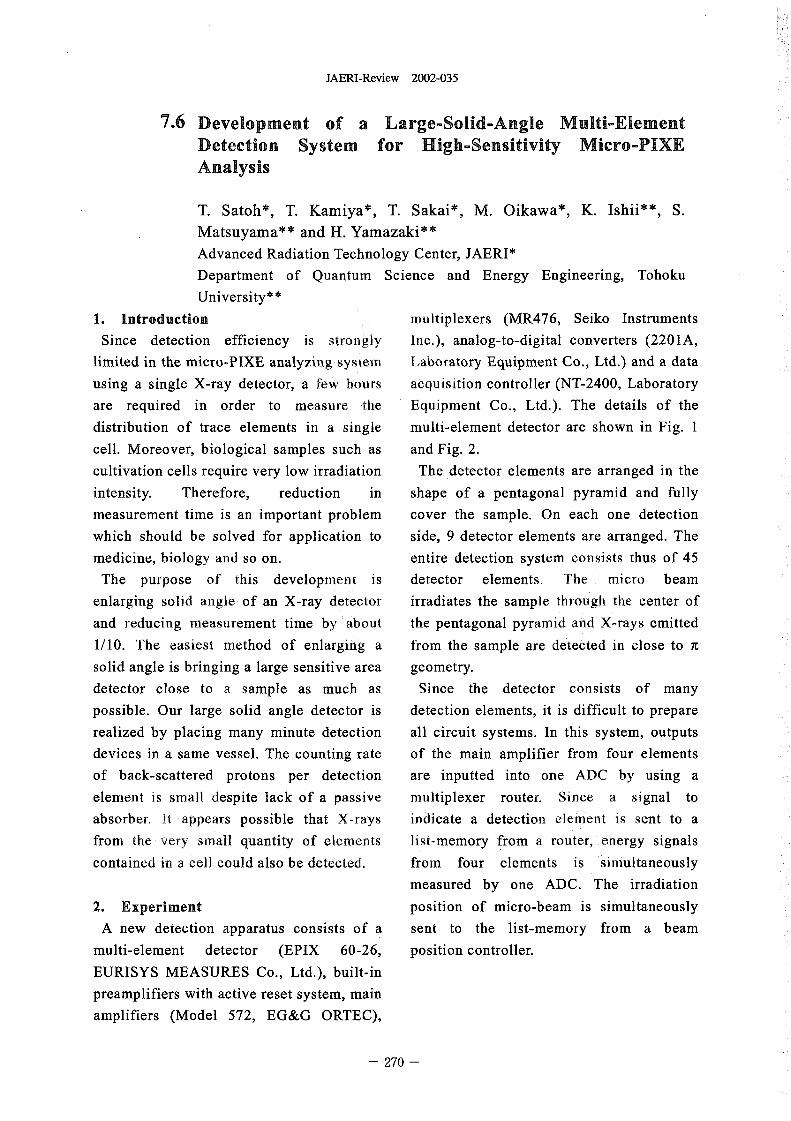
JAERI-Review 2002-035
7.6 Development of a Large-Solid-Angle Multi-ElementDetection System for High-Sensitivity Micro-PIXEAnalysis
T. Satoh*, T. Kamiya*, T. Sakai*, M. Oikawa*, K. Ishii**, S.Matsuyama** and H. Yamazaki**Advanced Radiation Technology Center, JAERI*Department of Quantum Science and Energy Engineering, TohokuUniversity* *
1. Introduction multiplexers (MR476, Seiko InstrumentsSince detection efficiency is strongly Inc.), analog-to-digital converters (2201A,
limited in the micro-PIXE analyzing system Laboratory Equipment Co., Ltd.) and a datausing a single X-ray detector, a few hours acquisition controller (NT-2400, Laboratoryare required in order to measure the Equipment Co., Ltd.). The details of thedistribution of trace elements in a single multi-element detector are shown in Fig. cell. Moreover, biological samples such as and Fig. 2.cultivation cells require very low irradiation The.detector elements are arranged in theintensity. Therefore, reduction in shape of a pentagonal pyramid and fullymeasurement time is an important problem cover the sample. On each one detectionwhich should be solved for application to side, 9 detector elements are arranged. Themedicine, biology and so on. entire detection system consists thus of 45
The purpose of this development is detector elements. The micro beamenlarging solid angle of an X-ray detector irradiates the sample through the center ofand reducing measurement time by about the pentagonal pyramid ad X-rays emitted1/10. The easiest method of enlarging a from the sample are detected in close to solid angle is bringing a large sensitive area geometry.detector close to a sample as much as Since the detector consists of manypossible. Our large solid angle detector is detection elements, it is difficult to preparerealized by placing many minute detection all circuit systems. In this system, outputsdevices in a same vessel. The counting rate of the main amplifier from four elementsof back-scattered protons per detection are inputted into one ADC by using aelement is small despite lack of a passive multiplexer router. Since a signal toabsorber, It appears possible that X-rays indicate a detection element is sent to afrom the very small quantity of elements list-memory from a router, energy signalscontained in a cell could also be detected. from four elements is simultaneously
measured by one ADC. The irradiation2. Experiment position of micro-beam is simultaneouslyA new detection apparatus consists of a sent to the list-memory from a beam
multi-element detector (EPIX 60-26, position controller.EURISYS MEASURES Co., Ltd.), built-inpreamplifiers with active reset system, mainamplifiers (Model 572, EG&G ORTEC),
- 270 -
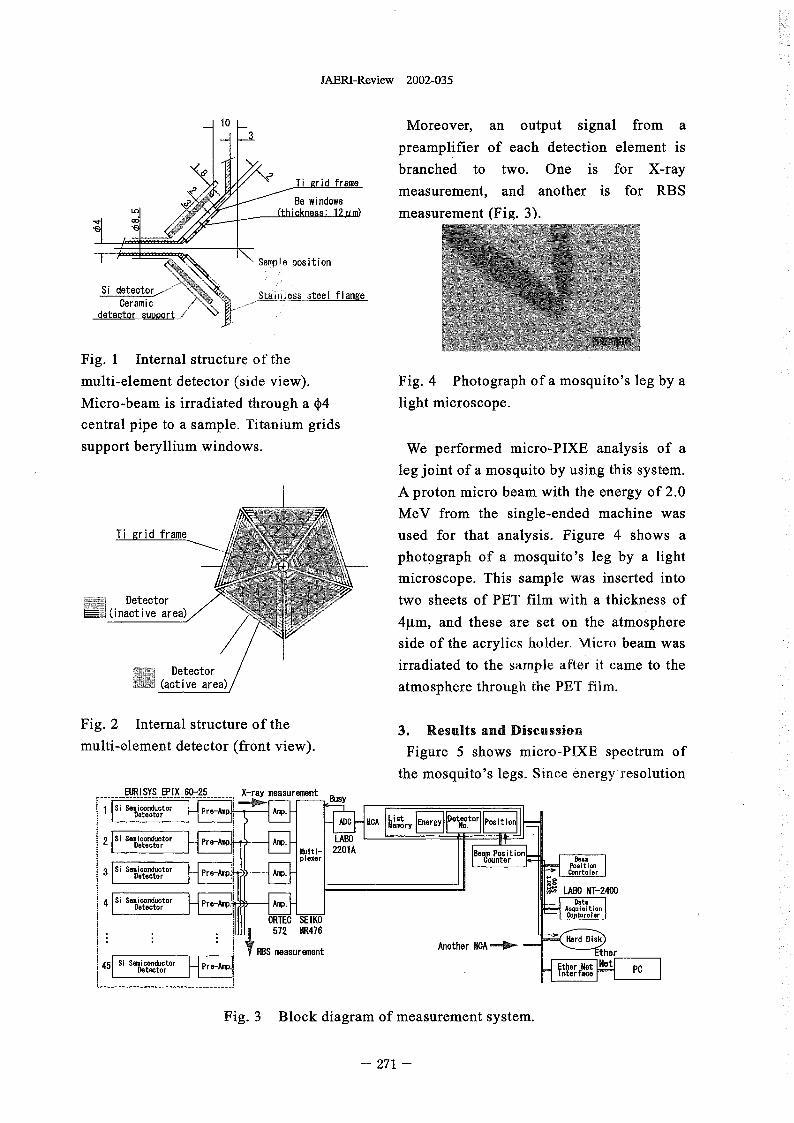
JAERI-Review 2002-035
Moreover, an output signal from a3
preamplifier of each detection element is
branched to two. One is for X-rayid frame
measurement, and another is for RBSows
(thickness: 12um measurement (Fig. 3.
Samp I Pos i t i on
detec �i� Stainless steel flangeCeramic
Fig. I Internal structure of the
multi-element detector (side view). Fig. 4 Photograph of a mosquito's leg by a
Micro-beam is irradiated through a 4 light microscope.
central pipe to a sample. Titanium grids
support beryllium windows. We performed micro-PIXE analysis of a
leg joint of a mosquito by using this system.
A proton micro beam with the energy of 20
MeV from the single-ended machine was
Ti grid frame used for that analysis. Figure 4 shows a
photograph of a mosquito's leg by a light
microscope. This sample was inserted into
Detector two sheets of PET film with a thickness of0 nact i ve
4gm, and these are set on the atmosphere
side of the acrylics holder. Micro beam was
Detector irradiated to the sample after it came to the(active are atmosphere through the PET film.
Fig. 2 Internal structure of the 3. Results and Discussion
multi-element detector (front view). Figure shows micro-PIXE spectrum of
the mosquito's legs. Since energy resolution------- EUR1-SYS- -EP-1 X -60-25 -------- X-ray measurement Busy
Si SemiconductorDetector L r
M Watry 0
2 LAImulti- 2201A 0 tonplexer
Si SemiconductDetector or Pre-kv �SoZnritto,m
LABO NT-2400Si Smiconductor4 Detector
ORTEC SEIKO Contoro or
572 MR476Hard Disk
Another MCARBS measurement er
Si Semiconductor45 Detector i
i------------------ -------------------
Fig. 3 Block diagram of measurement system.
- 271 -
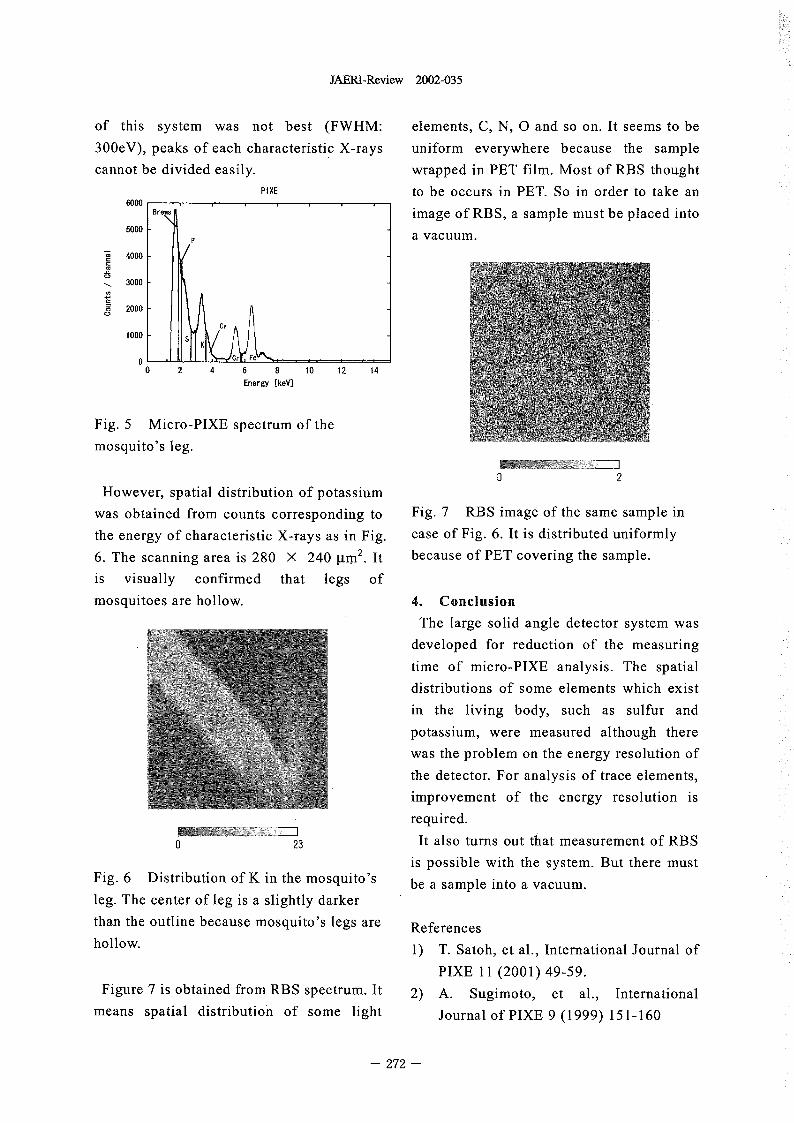
AERI-Review 2002-035
of this system was not best (FWHM: elements, C, N, 0 and so on. It seems to be
3OOeV), peaks of each characteristic X-rays uniform everywhere because the sample
cannot be divided easily. wrapped in PET film. Most of RBS thought
PIXE to be occurs in PET. So in order to take an6000
Br image of RBS a sample must be placed into5000 a vacuum.4000
3000
2000
1000
00 2 4 6 8 10 2 14
Energy [keV1
Fig. 5 Mcro-PIXE spectrum of the
mosquito's leg.
0 2However, spatial distribution of potassium
was obtained from counts corresponding to Fig. 7 RBS image of the same sample in
the energy of characteristic X-rays as in Fig. case of Fig. 6 It is distributed uniformly
6. The scanning area is 280 X 240 gm2. It because of PET covering the sample.
is visually confirmed that legs of
mosquitoes are hollow. 4. Conclusion
The large solid angle detector system was
developed for reduction of the measuring
time of mcro-PIXE analysis. The spatial
distributions of some elements which exist
in the livin body, such as sulfur and
potassium, were measured although there
was the problem on the energy resolution of
the detector. For analysis of trace elements,
improvement of the energy resolution is
required.WOMEN-0 23 It also turns out that measurement of RBS
is possible with the system. But there mustFig. 6 Distribution of K in the mosquito's be a sample into a vacuum.leg. The center of leg is a slightly darker
than the outline because mosquito's legs are References
hollow. 1) T. Satoh, et al., International Journal of
PIXE 11 2001) 49-59.Figure 7 is obtained from RBS spectrum. It 2) A. Sugimoto, et al., International
means spatial distribution of some light Journal of PIXE 9 1999) 151-160
- 272 -
JAERI-Review 2002-035
7.7 Analysis of Arsenic Around an Arsenic Mine by It-PM
T. Ohnuki*, F. Sakamoto**, N. Kozai***, M. Samadfam***,
T. mniyO***, T. Sakai****, S. Oikawa**** and T. Sato****
Advanced Science Research Center, JAERI*, Department of Research Reactor,
JAF-Rl**, Department of Environmental Science, JAERI***, Advanced Radiation
Technology Center, J AERT * * * *
1. Introduction [t-PIXE analyzing system was develope on
The momtonng for chemically hazardous the TIARA facility for chermcal analysis with a
elements is iportant to protect the threat of sub-micron level spatial resolutions). Thus,
the human health. Usually the concentrations mapping of hazardous elements of ppm level is
of hazardous elements are measured in soils, available by g-PIXE.
rocks, plants, and groundwater and surface Arsenic is a poison and one of the hazardous
waterl). Especially biornat and lower plants elements known to be carcinogenic to mn').
of lichens and mosses are used because of their We have applied the gPIXE technique to
ability to accumulate hazardous elements. So monitor As in biomat formed in As mine water,
far the concentrations of hazardous elements in and in the lower plants of lichen and mosses
the lower plants have not been measured around an abandoned As mine.
directly. One may dissolve the biomat andlower plants using appropriate methods to 2. Site and samples
provide for the measurements using induced Abandoned As mine is located in
coupled plasma mass spectroscopy (ICP-MS) Gunma-prefecture, Japan. The entrance of
and induced coupled plasma atomic emission the mine was closed by concrete wall. Three
microscopy (ICP-AEM). However, the foliose lichens were sampled from the rock at
dissolving process is complicated and time approximately 1.5 m from the closed entrance.
consumable, and the information of the Two mosses were collected firom the different
chemical fonns is lost during the dissolving positions. One was collected from the rock
process. where the lichen was collected from� and the
Particle induced X-ray emission (PDM) is other was from the concrete wall at
one of the possible methods detecting elements apprOXIMately 3 m. downstream from the mine
in the level of ppm2). If we use probe beams water discharge position. The moss on the
of gm order or less in diameter, hazardous concrete wall was collected at the surface
elements as well as other elements distribution water level. The biomat was sampled in the
in a lower plant sample can be determined with surface water at 03 m downstream from the
such spatial resolution. A light ion mine water discharge position.
microbeam system3� with the spatial resolution As references, moss and lichen were
of less than I gm was constructed on a beam sampled on rocks at distance of to 10 m. from
line of 3 V single-ended accelerator in the the closed entrance, They are called the
TIARA facility at Japan Atomic Energy reference moss and ichen in the present paper.
Research nstitute JAERI). And the in-air The concentration of As in the mine water
273 -
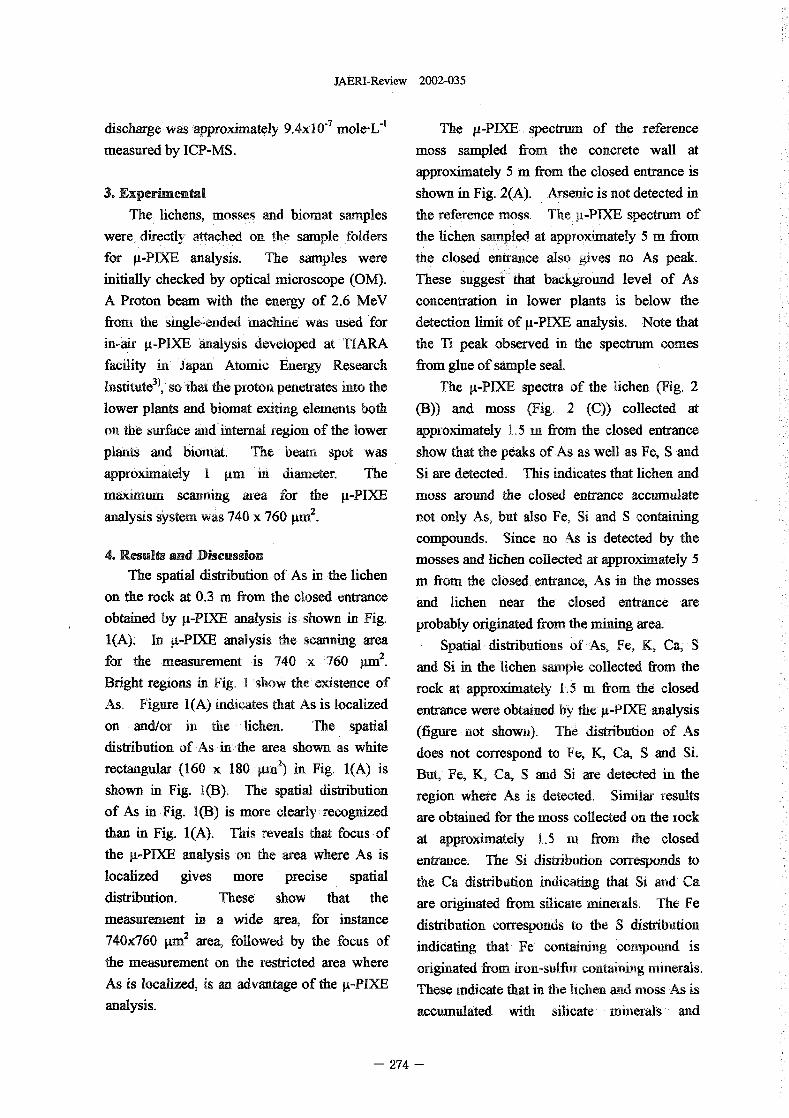
JAERI-Review 2002-035
discharge was -approximately 9.4x 1 0-7 mole-L-' The pPIXE spectrum of the reference
measured by ICP-MS. moss sampled from the concrete wall atapproximately 5 rn from the closed entrance is
3. Experimental shown in Fig. 2A). Arsenic is not detected in
The lichens, mosses and biomat samples the reference moss. The PIXE spectrum of
were directly attached on the sample folders the lichen sampled at approximately m from
for p-PLXE analysis. The samples were the closed entrance also gives no As peak.
initially checked by optical microscope (OM). These suggest that background level of As
A Proton beam with the energy of 26 MeV concentration in lower plants is below the
from the single-ended machine was used for detection limit of R-PDCE analysis. Note that
in-air pPIXE analysis developed at TIARA the Ti peak observed in the spectrum comes
facility 'in Japan Atomic Energy Research from glue of sample seal.
Institute), so tat the proton penetrates into the The gPIXE pectra of the lichen (Fig. 2
lower plants and biomat exiting elements both (B)) and moss (Fig. 2 (Q) collected at
on the surface and internal region of the lower approximately 1.5 n from the closed entrance
plants and bonlat. The beam spot was show that the paks of As as well as Fe, and
approximately I �Lm. in diameter. The Si are detected. This indicates that lichen and
maximum scanning area for the gPIXE moss around the closed entrance accumulate
analysis system was 740 x 760 lim�. not only As, but also Fe, Si and containing
compounds. Since no As is detected by the4. Results and Discussion mosses and lichen collected at approximately
The spatial distribution of As in the lichen rn ftom the closed entrance, As in the mosses
on the rock at 03 in from the closed entrance and lichen near the closed entrance are
obtained by pPIXE analysis is shown in Fig. probably originated from the mining area.
l(A). In g-PDCE analysis the scanning area Spatial distributions of As, Fe, K, Ca,
for the measurement is 740 x 760 R2- and Si in the lichen sample collected from the
Bright regions in Fi& I sow the existence of rock at approximately L5 m from the closed
As. Figure I (A) indicates that As is localized entrance were obtained by the p-PD(E analysis
on and/or in the lichen. The. spatial (figure not shown). The distribution of As
distribution, of As in the area shown as white does not correspond to Fe, K, Ca, and Si.
rectangular 160 x 180 ym) in Fig. l(A) is But, Fe, K, Ca, and Si are detected in the
shown in Fig. (B). The spatial distribution region where As is detected� Similar results
of As in Fig. I(B) is more clearly recognized are obtained for the moss collected on the ock
than in Fig. (A). This reveals that focus of at approximately 15 m from the closed
the gPIXE analysis on the area where As is entrance. The Si distribution orresponds to
localized gives more precise spatial the Ca distribution indicating that Si and Ca
distribution. These show that the are originated from silicate minerals. The Fe
measurement in a wide area, for instance distribution orresponds to the distribution
740060 gm� area, followed by the focus of indicating that Fe containing compound is
the measurement on the restricted area where originated Korn iron-sulfur containing minerals.
As is localized is an advantage of the 4-PDCE These indicate that in the lichen and moss As is
analysis. accumulated with silicate minerals and
- 274 -
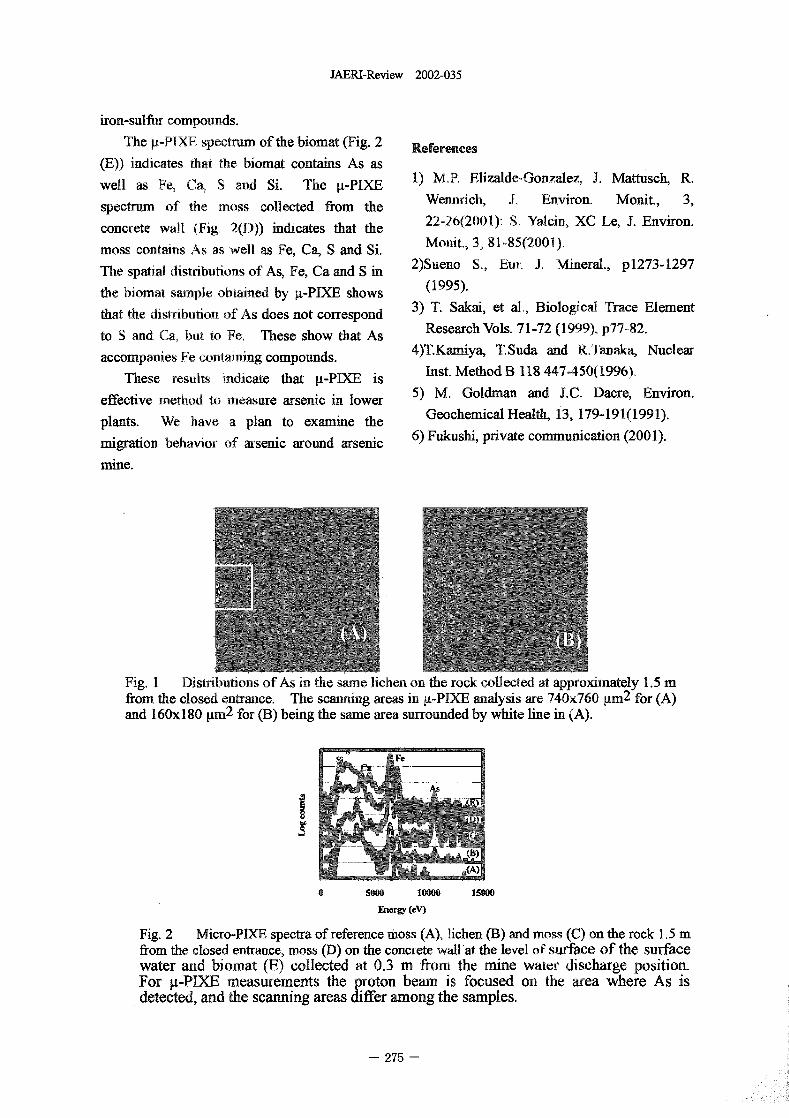
JAERI-Review 2002-035
iron-sulfur compounds.
The V-PIXF spectrum of the biomat (Fig. 2 References
(E)) indicates that the biomat contains As aswell as Fe, Ca, ad Si. The [L-PIXE 1) M.P. Eizalde-Gonzalez, J. Mattusch R.
spectrum of the moss collected from the Werutrich, J, Environ. Monit., 3,
concrete wall (Fig. 2(D)) indicates that the 22-26(2001): S. Yalcm, XC Le, J. Environ.
moss contains As as well as Fe, Ca, S and Si. Monit. 3 81-85(2001)�
The spatial distributions of As, Fe, Ca and S in 2)Sueno S,, Eur. J. Mineral., p1273-1297
the biornat sample obtained by gPENE shows (1995).that the distribution of As does not correspond 3) T. Sakai, et al., Biological Trace Element
to S and Ca, but to Fe, These show that As Research Vols. 71-72 1999), p77-82.4)T.Kamiya, T.Suda and R.Tanaka, Nuclearaccompanies Fe containing compounds.
These esults indicate that gP= is Inst. Method B 118 447-450(1996).
effective method to measure arsenic in lower 5) M. Goldman and J.C. Dacre, Environ.
plants. We have a plan to examine the Geochemical Health, 13, 179-191(199 1).
migration behavior of arsenic around arsenic 6) Fukushi, private communication 2001).
mine.
Fig. I Distributions of As i the same lichen on therock ollected at approximately 1.5 mfrom the closed entrance. The scanning areas in PIXE analysis are 740060 um2 for (A)and 160x 1 80 gm2 for (B) being the same area surrounded by white line in (A).
0 Sao loan 15M
Energy (eV)
Fig. 2 Micro-PDM spectra of reference moss (A), ichen (B) and moss (C) on the rock 1.5 nfrom the closed entrance, moss (D) on the concrete wall'at the level of surface of the surfacewater and bioniat (E) collected at 03 m from the mine water discharge position.For g-PDM measurements the proton beam is focused on the area where As isdetected, and the scanning areas differ among the samples.
275 -

This is a blank page.
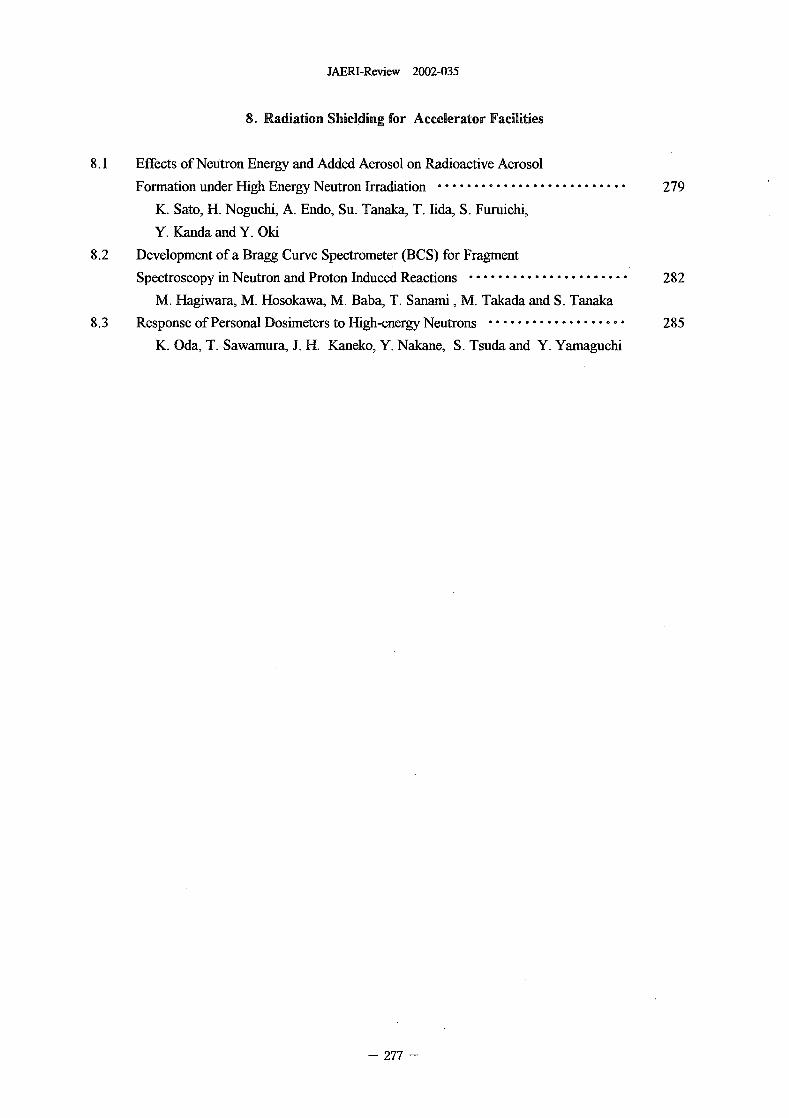
JAERI-Review 2002-035
8. Radiation Shielding for Accelerator Facilities
8.1 Effects of Neutron Energy and Added Aerosol on Radioactive Aerosol
Formation under High Energy Neutron Irradiation .......................... 279
K. Sato, H. Noguchi, A. Endo, Su. Tanaka, T. lida, S. Furuichi,
Y. Kanda and Y. Oki
8.2 Development of a Bragg Curve Spectrometer (BCS) for Fragment
Spectroscopy Neutron and Proton Induced Reactions ....................... 282
M. Hagiwara, M. Hosokawa, M. Baba, T. Sanami, M. Takada and S. Tanaka
8.3 Response of Personal Dosimeters to High-energy Neutrons ................... 285
K. Oda, T. Sawarnura, J. H. Kaneko, Y. Nakane, S. Tsuda and Y. Yamaguchi
277 -

This is a blank page.
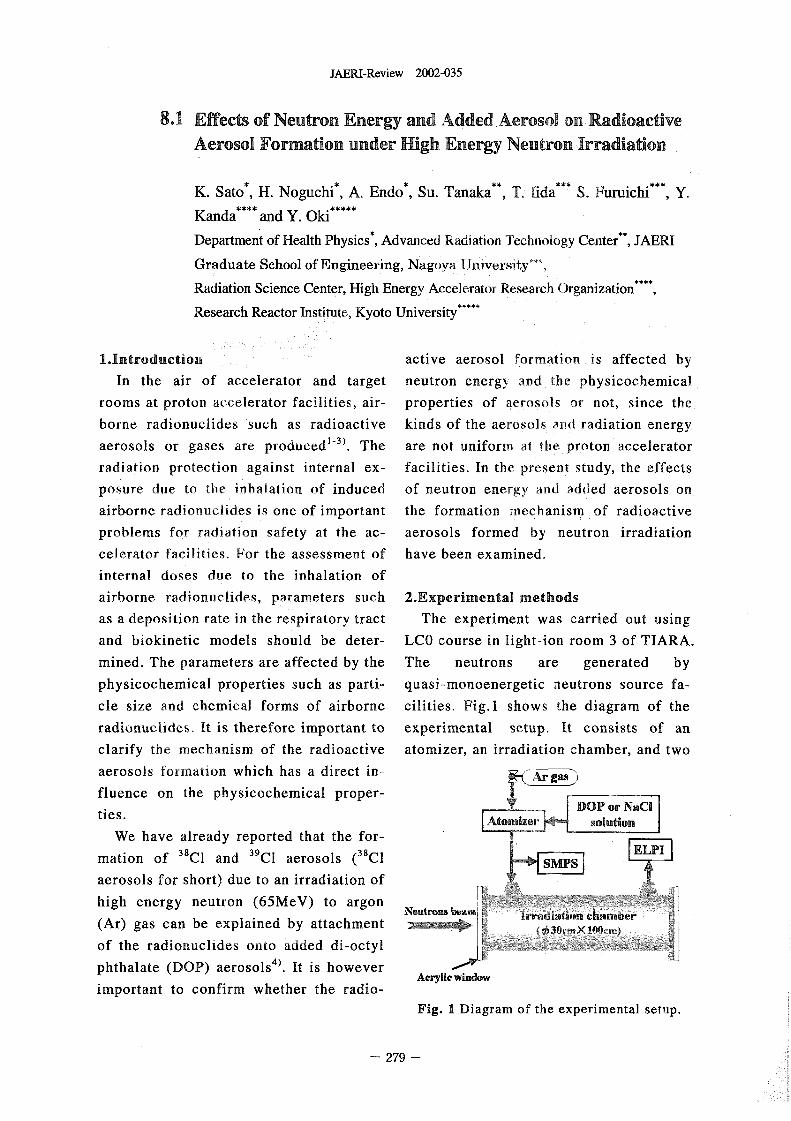
JAERI-Review 2002-035
8.1 Effects of Neutron Energy and Added Aerosol on RadioactiveAerosol Formation under 1igh Energy Neutron Irradiation
K. S ato H. Noguchi*, A. Endo*, Su. Tanaka**, T. fida" S. uiruichi*** Y.
Kanda**** and Y. Oki*****
Department of Health Physics*, Advanced Radiation Technology Center", JAERI
Graduate School of Engineering, Nagoya Univers Y
Radiation Science Center, High Energy Acceierator Research rganization
Research Reactor Institute, Kyoto University *****
I.Introduction active aerosol formation is affected byIn the air of accelerator and target neutron energy and the physicochemical
rooms at proton accelerator facilities, air- properties of aerosols or not, since theborne radionuclides such as radioactive kinds of the aerosols and radiation energyaerosols or gases are produced' -3 ). The are not uniform at te proton acceleratorradiation protection against internal ex- facilities. In the present study, the effectsposure due to the inhalation of induced of neutron energy ad added aerosols onairborne radionuclides is one of important the formation echanism of radioactiveproblems for radiation safety at te ac- aerosols formed by neutron irradiationcelerator facilities. For the assessment of have been examined.
internal doses due to the inhalation of
airborne radionuclides, parameters such 2.Experimental methods
as a deposition rate in the respiratory tract The experiment was carried out using
and biokinetic models should be deter- LCO course in light-ion room 3 of TIARA.
mined. The parameters are affected by the The neutrons are generated by
physicochemical properties such as parti- quasi-monoenergetic neutrons source fa-
cle size and chemical forms of airborne cilities. Fig.1 shows the diagram of the
radionuclides. It is therefore important to experimental setup. It consists of an
clarify the mechanism of the radioactive atomizer, an irradiation chamber, and two
aerosols formation which has a direct in-
fluence on the physicochemical proper-
ties. DOP or NaClsolutionWe have already reported that the for-
mation of 38C I and 39C I aerosols (38CI S
aerosols for short) due to an irradiation of
high energy neutron (65MeV) to argon RompNeutrons beam
(Ar) gas can be explained by attachment MMMMOO-
of the radionuclides onto added di-octyl
phthalate (DOP) aero SOIS4 ). It is howeverAcrylic window
important to confirm whether the radio-
Fig. I Diagram of the experimental setup.
279 -
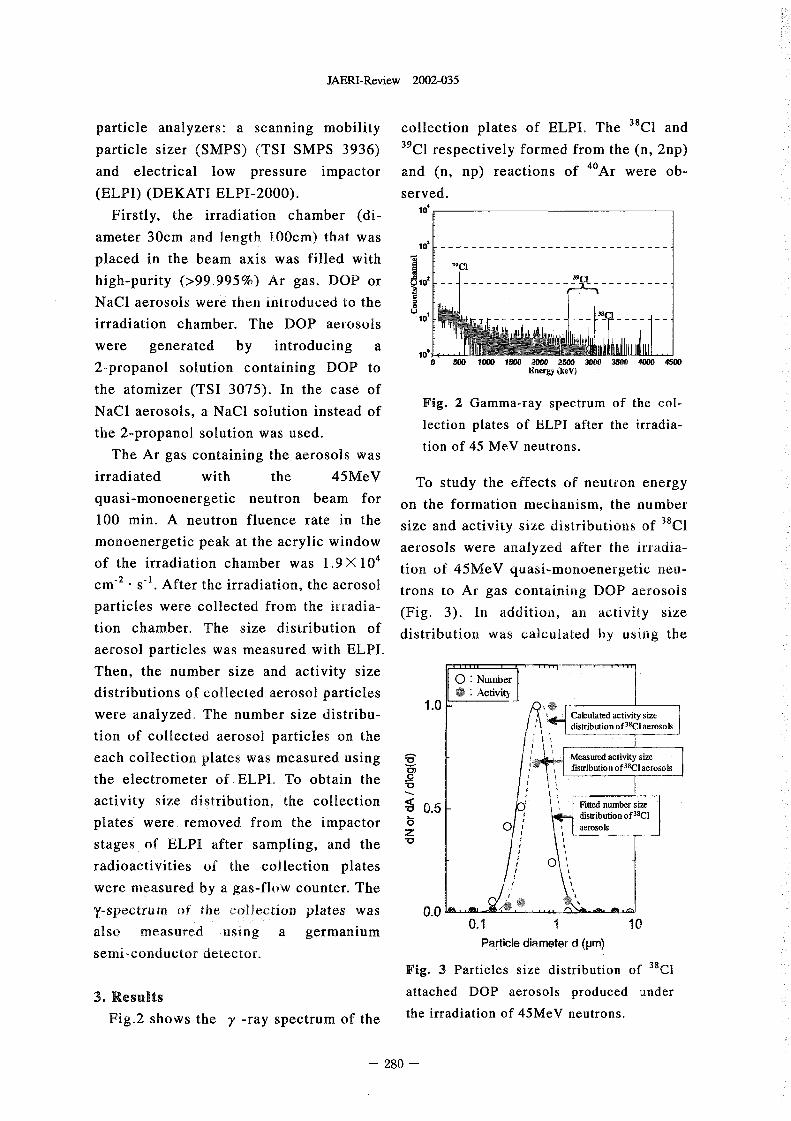
JAERI-Review 2002-035
particle analyzers: a scanning mobility collection plates of ELPI. The 38CI and
particle sizer (SMPS) (TSI SMPS 3936) 39C I respectively formed from the (n, 2np)
and electrical low pressure impactor and (n, np) reactions of Ar were ob-
(ELPI) (DEKATI ELPI-2000). served.
Firstly, the irradiation chamber di-
ameter 30cm and length 100cm) tat was ----------------------------placed in the beam axis was filled with -:I. 39CI
high-purity >99.995%) Ar gas. DOP or 10 ---------- DO ---------
NaCl aerosols were then introduced to the 910' 38irradiation chamber. The DOP aerosols
were generated by introducing a0 5W 1OW 15N MM 25W WOO 3 4W2-propanol solution containing DOP to Energy keV)
the atomizer (TSI 3075). In the case ofNaCl aerosols, a NaCl solution instead of Fig. 2 Gamma-ray spectrum of the col-
the 2-propanol solution was used. lection plates of ELPI after the irradia-
The Ar gas containing the aerosols was tion of 45 MeV neutrons.
irradiated with the 45MeV To study the effects of neutron energy
quasi-monoenergetic neutron beam for on the formation echanism, the number
100 min. A neutron fluence rate in the size and activity size distributions of 38CI
monoenergetic peak at the acrylic window aerosols were analyzed after the irradia-
of the irradiation chamber was 1. 9X 10⁴ tion of 45MeV quasi-monoenergetic neu-2
cm . s After the irradiation, the aerosol trons to Air gas containing DOP aerosols
particles were collected from the irradia- (Fig. 3 In addition, an activity size
tion chamber. The size distribution of distribution was calculated by using theaerosol particles was measured with ELPI.
Then, the number size and activity sizeNuinber
distributions of collected aerosol particles 1.0 Activity
were analyzed, The number size distribu- L Calculated activity size
tion of collected aerosol particles on the d.Anbutioof"ClacrosAT_each collection plates was measured using ta Measured activity size
6 distribution f3BClaerosols
the electrometer of ELPI. To obtain the 0
activity size distribution, the collection < nurn
'a 0.5 distribution f38Clplates were removed frorn the impactor Z5 0 aerosols
Z
stages of ELPI after sampling, and the
radioactivities of the collection plates
were measured by a gas-flow counter. The
Y-spectru") of tbe coflection plates was 0.0also measured using a germanium 0.1 I 10
semi-conductor detector. Particle diameter d (pm)Fig. 3 Particles size distribution of 38C,
3. Results attached DOP aerosols produced under
Fig.2 shows the -ray spectrum of the the irradiation of 45MeV neutrons.
280 -
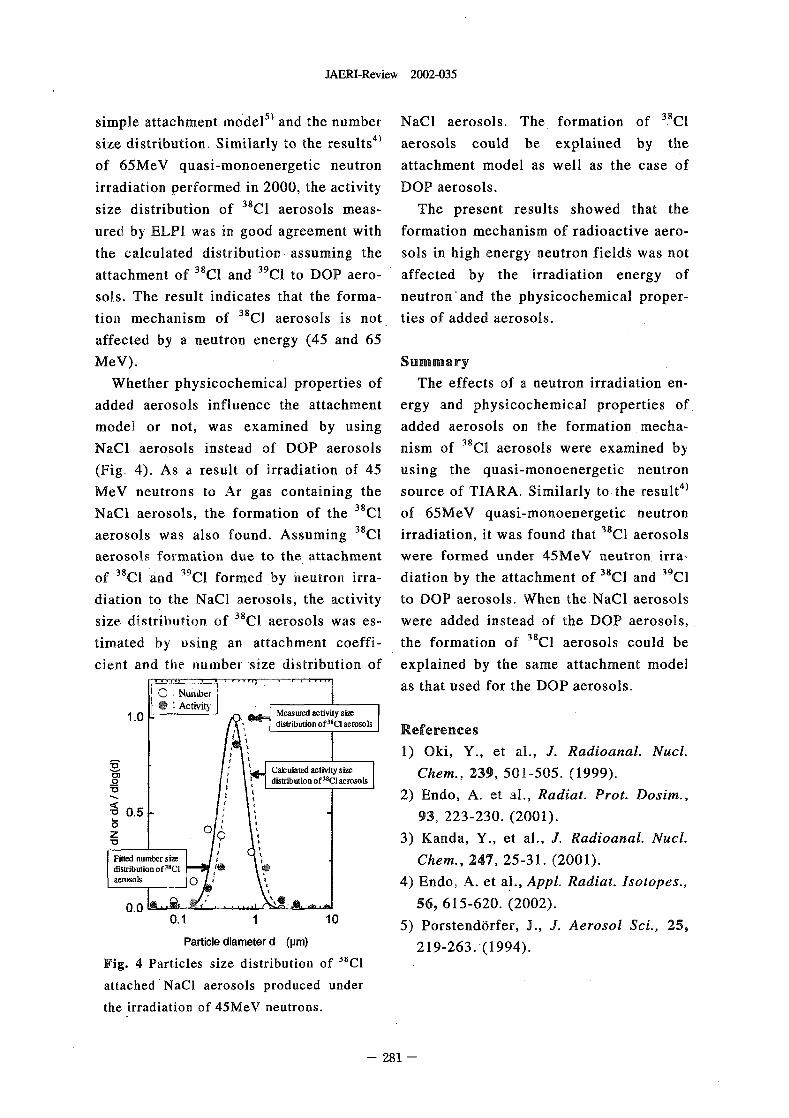
JAERT-Review 2002-035
simple attachment model5l and the number NaCl aerosols, The formation of 3 I
size distribution, Similarly to the resu ItS4) aerosols could be explained by the
of 65MeV quasi-monoenergetic neutron attachment model as well as the case of
irradiation performed in 2000, the activity DOP aerosols.
size distribution of 3CI aerosols meas- The present results showed that the
ured by ELPI was in good agreement with formation mechanism of radioactive aero-
the calculated distribution assuming the sols in high energy neutron fields was not
attachment of 3CI and 39CI to DOP aero- affected by the irradiation energy of
sols. The result indicates that the forma- neutron'and the physicochemical proper-
tion mechanism of 38C l aerosols is not ties of added aerosols.
affected by a neutron energy 45 and 65
MeV). Summary
Whether physicochemical properties of The effects of a neutron irradiation en-
added aerosols influence the attachment ergy and physicochemical properties of
model or not, was examined by using added aerosols on the formation mecha-
NaC1 aerosols instead of DOP aerosols nism of 8CI aerosols were examined by
(Fig. 4 As a result of irradiation of 45 using the quasi-monoenergetic neutron
MeV neutrons to Ar gas containing the source of TIARA. Similarly to the reSUlt4)
NaC1 aerosols, the formation of the 38CI of 65MeV quasi-monoenergetic neutron
aerosols was also found. Assurnin g 38CI irradiation, it was found that 38 C1 aerosols
aerosols formation due to the attachment were formed under 45MeV neutron irra-of 8CI and 39CI formed by neutron irra- diation by the attachment of 38C I and 39CI
diation to the NaC1 aerosols, the activity to DOP aerosols. When the NaCl aerosolsof 38Csize distribution I aerosols was es- were added instead of the DOP aerosols,
of 38timated by using an attachment coeffi- the formation Cl aerosols could be
cient and the number size distribution of explained by the same attachment model
as that used for the DOP aerosols.C) Nu.
1.0 aCtiVity SiM
nol,380aerosols References
I 1) Oki, Y., et al., J. Radioanal. Nucl.acti ty size
VI Chem., 239, 501-505. 1999).nof". aerosols
2) Endo, A. et al., Radiat. Prot. Dosim.,0.5 - 93, 223-230. 2001).0
Z 0 3) Kanda, Y., et al., J. Radioanal. Nucl.Fined nu ber size Chem., 247, 25-31. 2001).distrib.ion o"Claerosols 0 4) Endo, A. et al., Appl. Radiat. Isotopes.,
0.0 56, 615-620. (�2002).0A 1 10 5) Porstend6rfer, J., J. Aerosol Sci., 25,
Particle diameter d (pm) 219-263.-(1994).
Fig. Particles size distribution of "Cl
attached NaC1 aerosols produced under
the -irradiation of 45MeV neutrons.
- 281 -
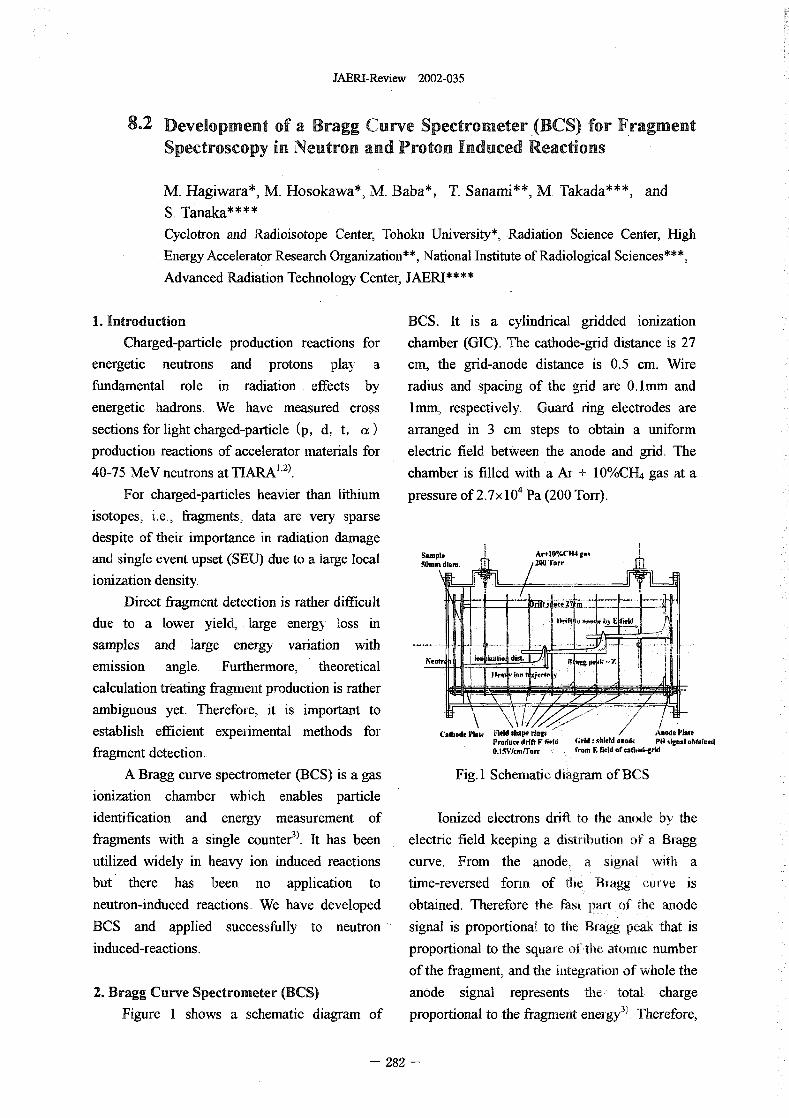
JAERI-Review 2002-035
8.2 Development of a Bragg Curve Spectrometer (BCS) for FragmentSpectroscopy in Neutron and Proton Induced Reactions
M. Hagiwara*, M. Hosokawa* 5 M. Baba*, T Sanarni", M, Takada***, andS, Tanaka****Cyclotron and Radioisotope Center, Tohoku University*. Radiation Science Center, High
Energy Accelerator Research Organization", National Institute of Radiological Sciences***,
Advanced Radiation Technology Center, JAERI
1. Introduction BCS. It is a cylindrical gridded ionization
Charged-particle production reactions f6r chamber (GIC). The cathode-gri'd distance is 27
energetic neutrons and protons play a cm, the grid-anode distance is 0.5 cm. Wire
fundamental role in radiation effects by radius and spacing of the grid are 0 I mm and
energetic hadrons. We have measured cross Imm, respectively. Guard ring electrodes are
sections for light charged-particle (p, d, t a arranged in 3 cm steps to obtain a uniform
production reactions of accelerator materials for electric field between the anode and gd. The1,2)40-75 MeV neutrons at TIARA chamber is filled with a Ai /oCH4 gas at a
For charged-particles heavier than lithium pressure of 2.7x 10⁴ Pa 200 Torr).
isotopes, i.e,, fragments, data are very sparse
despite of their importance in radiation damageSample Ar+.IOCH4 gasand single event upset (SEU) due to a large local Minot 200'rarr
ionization density.
Direct fragment detection is rather difficult
due to a lower yield, large energy loss in Drift �q 0w e by E
samples and large energy variation with6a lua6ol di
emission angle. Furthermore, theoretical
calculation teating fragment poduction is rather
ambiguous yet. Therefore, it is important to
establish efficient experimental methods for Cathode I laic S pe Anode PlateProdum drift F field Crild: shield anode P" signal obtained
fiagment etection. 0.15Wernfroff from E ield of cathod-grid
A Bragg curve spectrometer (BCS) is a gas Fig. I Schematic diagram of BCS
ionization chamber wh enables particle
identification and energy measurement of Ionized electrons drift to the anode bv the
fragments with a single counter'). It has been electric field keeping a dstribution of a Bragg
utilized widely in heavy ion induced reactions curve. From the anode. a signal with a
but there has been no application to time-reversed form of t Bagg urve is
neutron-induced reactions. We have developed obtained. Therefore the fast part of the airode
BCS and applied successfully to neutron signal is proportional to te Bragg peak that is
induced-reactions. proportional to the square of te atomic number
of the fragment, and te integration of whole the
2. Bragg Curve Spectrometer (BCS) anode signal represents te total charge
Figure I shows a schematic diagram of proportional to the fagment enei gY3)� Therefore,
282 -
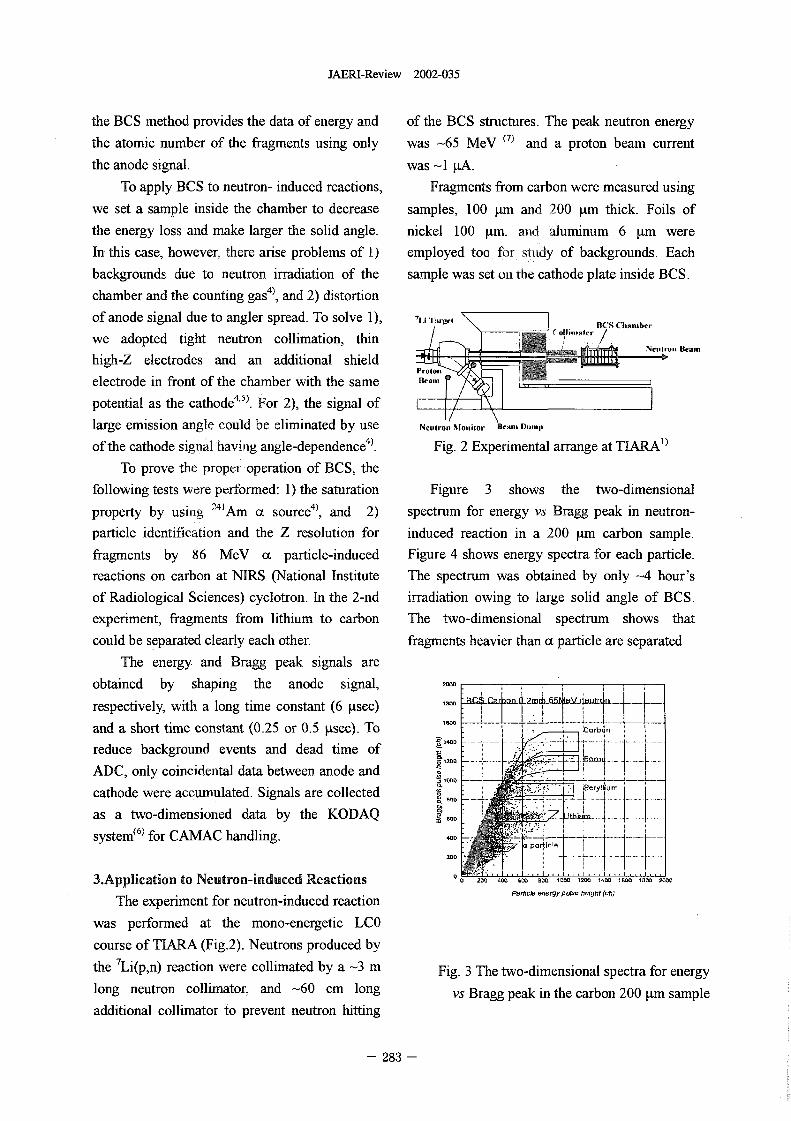
JAERI-Review 2002-035
the BCS method provides the data of energy and of the BCS structures. The peak neutron energy
the atomic number of the fragments using only was 65 MeV () and a proton beam current
the anode signal. was -I �A.
To apply BCS to neutron- induced reactions, Fragments from carbon were measured using
we set a sample inside the chamber to decrease samples, 100 tm a 200 �Lrn thick. Foils of
the energy loss and make larger the solid angle. nickel 100 �tm. ad auminum 6 �tm were
In this case, however, there anise problems of 1) employed too for study of backgrounds. Each
backgrounds due to neutron irradiation of the sample was set o the cathode plate inside BCS.4)chamber and the counting gas and 2 distortion
of anode signal due to angler spread. To solve 1), 71 HCS Chanlhes-
we adopted tight neutron collimation, thin ('011imNew'On Beans
high-Z electrodes and an additional shield
electrode 'n front of the chamber with the same4,5)potential as the cathode For 2 the signal of
large emission angle could be liminated by use Neutron Monitor Beans Dump
C 4)of the cathode sgnal having angle-dependen e Fig. 2 Experimental arrange at TLkRA')
To prove the proper operation of BCS, the
following tests wre performed: 1) the saturation Figure 3 shows the two-dimensional
property by using 24 'Am a source), and 2) spectrum for energy vs Bragg peak in neutron-
particle identification and the Z resolution for induced reaction in a 200 Rm carbon sample.
fragments by 86 MeV cc particle-induced Figure 4 shows energy spectra for each particle.
reactions on carbon at NIRS (National Institute The spectrum was obtained by only 4 hour's
of Radiological Sciences) cyclotron. In the 2-nd irradiation owing to large solid angle of BCS.
experiment, fragments from lithium to carbon The two-dimensional spectrum shows that
could be separated clearly each other. fragments heavier than x particle are separated
The energy and Bragg peak signals are
obtained by shaping the anode signal, 2000
IMODrespectively, with a long time constant 6 tsec)Iwoand a short time constant 0.25 or 0.5 �tsec). To orbn
a140Oreduce background events and dead time of
ADC, only coincidental data between anode andjBerylk cathode were accumulated. S' nals are collected19 ROD
as a two-dimensioned data by the KODAQ
systern(6) for CAAIAC handling. 40D
MO
3.Application to Neutron-induced Reactions a 200 400 600 BOO 1000 200 "DO 1 1BOO 2000
The experiment for neutron-induced reaction Pdtck ewg Pa.. aght (0)
was performed at the mono-energetic LCO
course of TURA (Fig.2). Neutrons produced by
the 7Li(pn) reaction were collimated by a 3 in Fig. 3 The two-dimensional spectra for energy
long neutron collimator, and 60 cm long vs Bragg peak in the carbon 200 m sampleadditional collimator o prevent neutron hitting
283 -
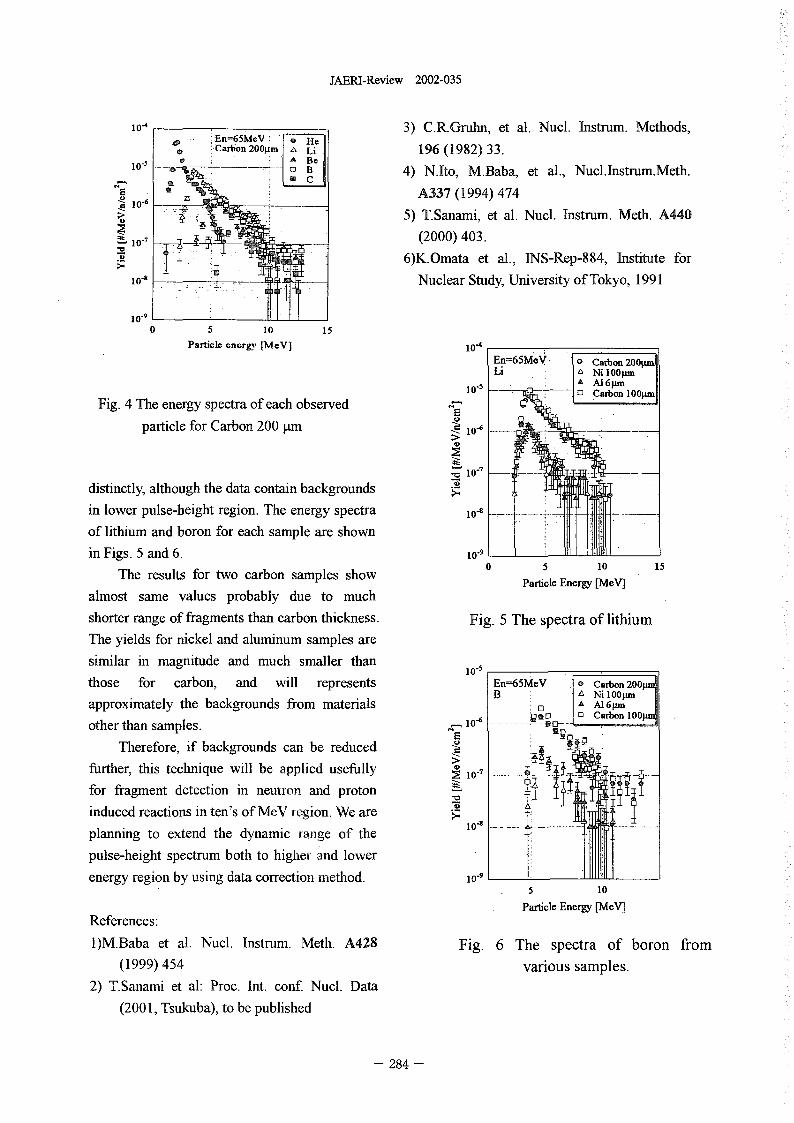
JAERI-Review 2002-035
104 3) C.R.Gruhn, et al. Nucl. Instrurn. Methods,En=65 e-Carbor�2eVOg. 196(1982)33.
lo-, lb 4) N.1to, M.Baba, et al., Nucl.Instnim.Meth.
A337(1994)47410-6
5) T.Sanaml, et al. Nucl. Instrum. Meth. A440
10-7 (2000)403.
6)K.Omata et al., INS-Rep-884, Institute for
Nuclear Study, Unliversity of Tokyo, 1991
10.9
0 5 10 15
Particle energy [McV] lo,
En=65MeV C=b.n200pjNi 10pmA16pm
lo-, 7 1:1 Carbon 100
Fig. 4 The energy spectra of each observed
particle for Carbon 200 Rm 10-6
lo-,
distinctly, although the data contain backgrounds
in lower pulse-height region. The energy spectra lo,
of lithium and boron for each sample are shown
in Figs. and 6.
The results for two carbon samples show 0 5 10 15
almost same values probably due to much Particle Energy [MeV]
shorter range of fragments than carbon thickness. Fig. The spectra of lithium
The yields for uckel and aluminum samples are
similar in magnitude and much smaller than
those for carbon, and will represents En=65MeV 0 Carbon 20OPMB L Ni I OOpm
approximately the backgrounds from materials 13 PM1) 0 Carbon 100pm
other than samples. 10-6
Therefore, if backgrounds can be reduced>
further, this technique will be applied usefully .710for fragment detection in neutron and proton
induced reactions in ten's of MeV region. We arelo,
planning to extend the dynamic range of the
pulse-height spectrum both to hgher and lower
energy region by using data correction method. 10-95 10
Parlicle Energy [MeV]
References:
I)M.Baba et al. Nucl. Instrum. Meth. A428 Fig. 6 The spectra of boron from
(1999) 454 various samples.
2) T.Sanarru et al: Proc. Int. conf. Nucl. Data
(200 1, Tsukuba), to be published
284 -
JAM-Review 2002-035
8.3 Response of Personal Dosimeters to High-Energy Neutrons
K. Oda*, T. Sawarnura", J. H. Kaneko**, Y. Nakane***,
S. Tsuda**** and Y. Yamaguchi****
Department of Nuclear Engineering, Kobe University of Mercantile Marine*,
Department of Quantum Energy Engineering, Hokkaido University",
Center for Neutron Science, JAERI***, Department of Health Physics, JAERI****
1. Introduction in neutron facilities have, in general, less
In recent years, accelerated proton beam and sensitivity to high-energy neutrons than that to
neutron beam have been widely utilized for a neutrons lower than 14MeV because of a rapid
variety of up-to-date applications to material decrease in the cross sections for neutron
science, environment science, life science, interactions. The use of them without any
medical cancer therapy, etc. A great number of corrections would lead a serious underestimate
accelerator facilities for high-energy, intense of the radiation dose and dose rate. Thus, our
proton beam have already been in steady research members started to develop advanced
operation, and are in construction or planning in techniques for enhancement of absolute detector
many countries; in Japan a collaborative project sensitivity, and for an appropriate correction.
of JAERI and KEK is now in progress. Such a These studies require a well-defined and clean
proton beam eventually generates high-energy neutron source, such as TIARA facility.
neutrons in slowing down or stopping in a In this report, we state a few typical
material. These high-energy neutrons are hard to experimental results with BD and PNTD
be detected, because the efficiency of existing performed as a special project research between
monitors and dosimeters becomes lower. Hence, Japanese universities and JAERL
it is very important to monitor them correctly in
other words, to establish a countermeasure, for a 2. Response of plastic track detectors
radiation protection purpose. In an early study in 1990's for development
The detectors in actual radiation protection of dose-equivalent response track detector for
dosimetry use are divided into two groups; the thermal to D-T neutrons, we fally proposed a
area monitors and survey-meters belong to one combination of mildly boron-doped CR-39
group of active detectors, and the other is plastic detector with a two-layer radiator
personal dosimeters, which are sub-divided into consisting of polyethylene and deuterized hydro-
real-time type and accumulation type according carbon (CD2)". In order to extend the neutron
to the length of measurement time period. For energy to be applied, it is indispensable both to
X- or y-rays, for instance, a pocket-type enhance the intrinsic sensitivity of PNTD and to
semiconductor detector and a glass dosimeter select radiator material suitable for higher
(Radio-photo-luminescence) are commonly used energy neutrons.
as two sets of personal dosimeter, respectively. An experiment has been carried out to
For neutrons with an energy lower than 14MeV, investigate the relative sensitivity of three
bubble detector (BD) and plastic nuclear track candidate PWDS2'1�. One is a pure CR-39 of
detector (PNTD) replace them, respectively. which trade name is "BARYOTRAK". Second
The existing monitors and dosimeters used is called "TD-l", which is a CR-39 containing a
285 -
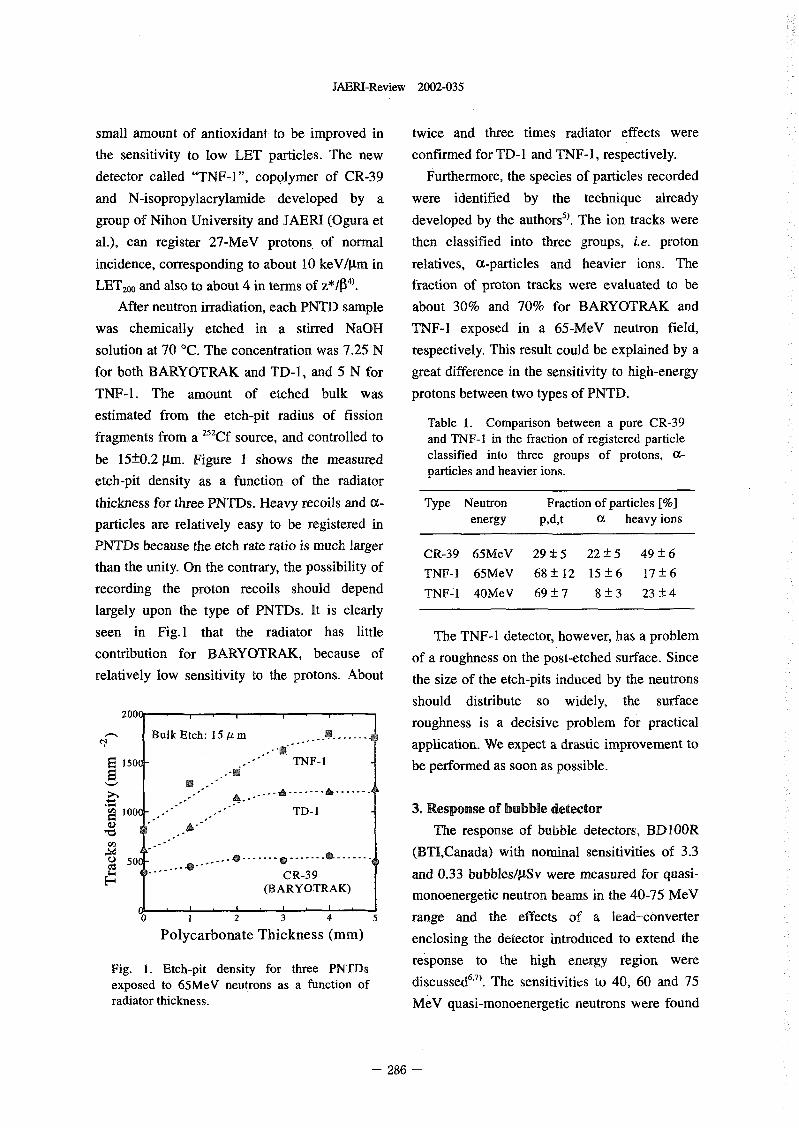
JAERI-Review 2002-035
small amount of antioxidant to be improved in twice and three times radiator effects were
the sensitivity to low LET particles. The new confirmed for TD I and TNF- 1, respectively.
detector called "TNF-1", copolymer of CR-39 Furthermore, the species of particles recorded
and N-isopropylacrylamide developed by a were identified by the technique already
group of Nihon University and JAERI (Ogura et developed by the authors5l. The ion tracks were
al.), can register 27-MeV protons. of normal then classified into three roups, ie. proton
incidence, corresponding to about 10 keV/gm in relatives, Xparticles and heavier ions. TheLET2(,o and also to about 4 in terms Of Z*/P41. fraction of proton tracks were evaluated to be
After neutron irradiation, each PNTD sample about 30% and 70% for BARYOTRAK and
was chemically etched in a stirred NaOH TNF-l exposed in a 65-MeV neutron field,
solution at 70 'C. The concentration was 725 N respectively. This result could be explained by a
for both BARYOTRAK and TD-1, and N for great difference in the sensitivity to high-energy
TNF-1. The amount of etched bulk was protons between two typesof PNTD.
estimated from the etch-pit radius of fission Table 1. Comparison between a pure CR-39fragments fro a 'Cf source, and controlled to and TNF-1 in the fraction of registered particlebe 15±0.2 gm. Figure I shows the measured classified into three groups of protons, Or-etch-pit density as a function of the radiator particles and heavier ions.
thickness for three PNTDs. Heavy recoils and a- Type Neutron Fraction of particlesparticles are relatively easy to be registered in energy pdt ot heavyions
PNTDs because the etch rate ratio is much larger CR-39 65MeV 29 ± 22 ± 49 ± 6
than the unity. On the contrary, the possibility of TNF-1 65MeV 68 ± 12 15 ± 6 17 ± 6
recording the proton recoils should depend TNF_'1 4OMeV 69 ± 7 8 ± 3 23 ± 4largely upon the type of PNTDs. It is clearly
seen in Fig.1 that the radiator has little The TNF I detector, however, has a problem
contribution for BARYOTRAK, because of of a roughness on the post-etched surface. Since
relatively low sensitivity to the protons. About the size of the etch-pits induced by the neutrons
should distribute so widely, the surface2000 roughness is a decisive problem for practical
Bulk Etch: 15 g rn .......C� application. We expect a drastic improvement to
150 - TNF be performed as soon as possible.Is .4
A.
GO 100(_ TD-1 3. Response of bubble detectorThe response of bubble detectors, BDIOOR
ada) with nominal sensitivities of 3350W ........ ------- 0 ------- OL ------- (BTICan
CR-39 and 033 bubbles/gSv were measured for quasi-(BARYOTRAK) monoenergetic neutron beams in the 40-75 MeV
_0 2 3 4 5 range and the effects of a lead--converterPolycarbonate Thickness (mm) enclosing the detector introduced to extend the
Fig. 1. Etch-pit density for three PNTDs response to the high energy region wereexposed to 65MeV neutrons as a function of discussed 6.7'. The sensitivities to 40, 60 and 75radiator thickness. MeV quasi-morloenergetic neutrons were found
- 286 -
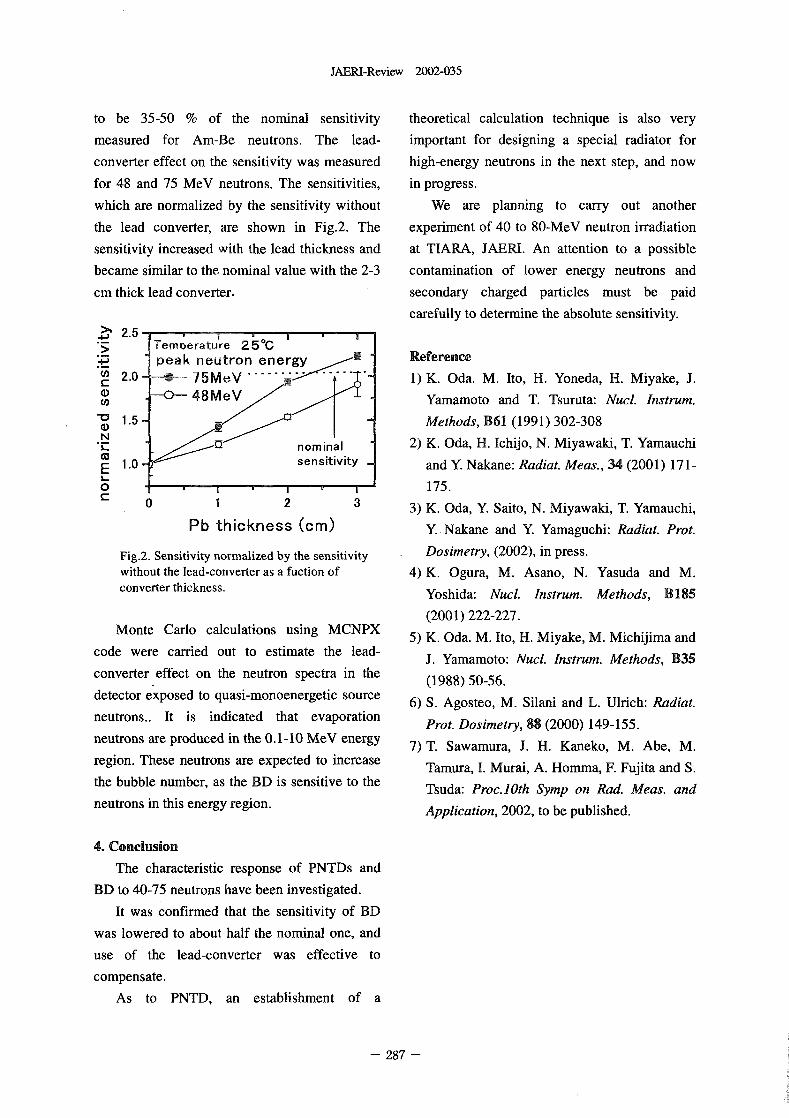
JAERI-Review 2002-035
to be 35-50 of the nominal sensitivity theoretical calculation technique is also very
measured for Am-Be neutrons. The lead- important for designing a special radiator for
converter effect on the sensitivity was measured high-energy neutrons in the next step, and now
for 48 and 75 MeV neutrons, The sensitivities, in progress.
which are normalized by the sensitivity without We are planning to carry out another
the lead converter, are shown in Fig.2. The experiment of 40 to 80-MeV neutron iadiation
sensitivity increased with the lead thickness and at TIARA, JAERL An attention to a possible
became similar to the nominal value with the 23 contamination of lower energy neutrons and
cm thick lead converter. secondary charged particles must be paid
carefully to determine the absolute sensitivity.
+j>1 2.5 -.5 Temperature 2b-c
'.P peak neutron energy Reference2.0 75MeV .... 1) K. Oda. M. Ito, H. Yoneda, H. Miyake, J.
M 48MeV Yamamoto and T. Tsuruta: Nucl. Instrum.
-0 1. - Methods, B61 1991) 302-308CD14
nominal 2) K. Oda, H. chijo, N. Miyawaki, T. Yamauchi1.0 J sensitivityE and Y. Nakane: Radiat. Meas., 34 2001) 171-
L- -o 175.
0 1 2 3 3) K. Oda, Y. Saito, N. Miyawaki, T. Yamauchi,Pb thickness (cm) Y. Nakane and Y. Yamaguchi: Radiat. Prot.
Fig.2. Sensitivity normalized by the sensitivity Dosimetry, 2002), in press.
without the lead-converter as a fuction of 4) K. Ogura, M. Asano, N. Yasuda and M.converter thickness. Yoshida: Nucl. Instrum. Methods, B185
(2001) 222-227.Monte Carlo calculations using MCNPX 5) K. Oda. M. Ito, H. Miyake, M. Michijima and
code were carried out to estimate the lead- J. Yamamoto: Nucl. Instrum. Methods, B35
converter .effect on the neutron spectra in the (1988) 50-56.
detector exposed to quasi-monoenergetic source 6) S. Agosteo, M. Silani and L. Ulrich: Radiat.
neutrons.. It is indicated that evaporation Prot. Dosimetry, 88 2000) 149-155.
neutrons are produced in the 0 I -I 0 MeV energy 7) T. Sawamura, J. H. Kaneko, M. Abe, M.
region. These neutrons are expected to increase Tamura, I. Murai, A. Homma, F. Fujita and S.
the bubble number, as the BD is sensitive to the Tsuda: Proc.10th Symp on Rad. Meas. and
neutrons in this energy region. Application, 2002, to be published.
4. Conclusion
The characteristic response of PNTDs and
BD to 40-75 neutrons have been investigated.
It was confirmed that the sensitivity of BD
was lowered to about half the nominal one, and
use of the lead-converter was effective to
compensate.
As to PNTD, an establishment of a
- 287 -

This is a blank page.
JAERI-Review 2002-035
9. Accelerator Technology,/TIARA General
9.1 Measurement of Secondary Charged Particles with MeV Energy
Cluster Ion Iradiation ................................................ 291
Y. Saitoh and Y. Nakajima
9.2 Study of Secondary Ion Emission Processes from Solid Targets
Bombarded by MeV Energy Cluster Ions ................................. 294
H. Shibata, A. Itoh, T. Majmia, Y. Saitoh, Y. Nakaj'u'na and K. Narurm
9.3 Development of a Magnetic Field Monitoring System for the JAERI
AVF Cyclotron ..................................................... 296
S. Okumura, W. Yokota, K. Arakawa, Y. Nakamura, T. Nara, T. Agematsu,
1. Ishibon', S. Kurashima, M. Fukuda, T. Ishimoto and T. Nakajina
9.4 Development of the Flat-top Resonator for the JAERI AVF Cyclotron ........... 298
S. Kurashima, M. Fukuda, N. Myawaki, Y. Nakamura, T. Nara, T. Agematsu,
1. Ishibon', W. Yokota, S. Okumura and K. Arakawa
9.5 Present Status of JAERI AVF Cyclotron System ............................ 300
Y. Nakamura, T. Nara, T. Agematsu, 1. Ishibon', S. Kurashima, W. Yokota,
M. Fukuda, S. Okumura, N. Myawaki, K. Arakawa, K. Akaiwa, To. Yoshida,
S. Ishiro, A. MatsumuraY. Arakawa, Tu. Yoshida, S. Kanou, A. hara. and
K. Takano
9.6 The Number of Operations for Auxiliary Safety Devices ................. 303
Y. Nakamura and Y. Arakawa
9.7 Modification of the Vacuum System for AVF Cyclotron ....................... 305
1. Ishibo', Y. Nakamura, T. Nara, T. Agematsu, S. Kurashima, W. Yokota,
M. Fukuda, S. Okumura and N. Miyawaki
9.8 Energy Stabilization of TIARA 3MV Single-ended Accelerator ................ 308
T. Sakai and S. Uno
9.9 Increase of a Negative Heavy Ion Source for the MV Tandem Accelerator ...... 311
K. Mizuhashi, A. Chiba, A. Santoso, S. Tajima
9.10 Development of Image Analysis Type Emittance Monitor ..................... 312
A. Ciba, Y. Ishii and S. Tajinia
9.11 Improvement of the Injection Electrode System for Forming a Submicron
Ion Beam .......................................................... 314
Y. Ishii, A. Isoya and K. Arakawa
289 -

This is a blank page.
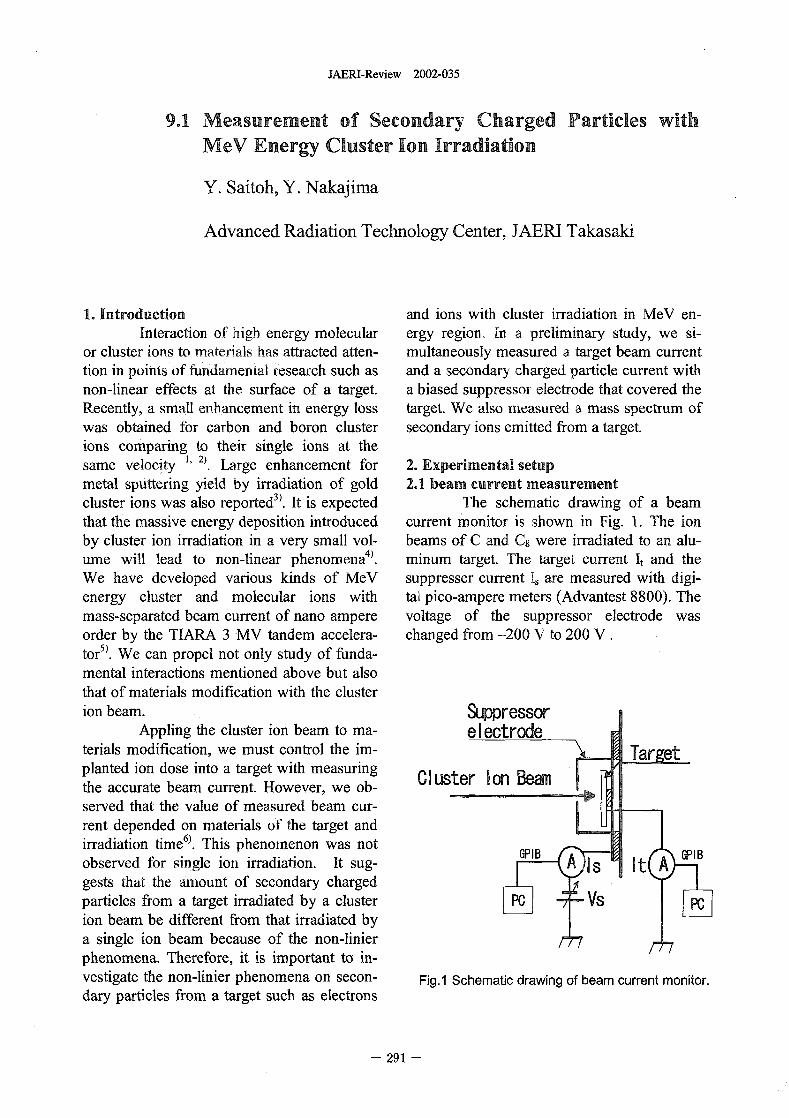
JAERI-Review 2002-035
9.1 Measurement of Secondary Charged Particles withMeV Energy Cluster Ion Irradiation
Y. Saitok Y. Nakajima
Advanced Radiation Technology Center, JAERI Takasaki
1. Introduction and ions with cluster irradiation in MeV en-Interaction of high energy molecular ergy region. In a preliminary study, we si-
or cluster ions to materials as attracted atten- multaneously measured a target beam currenttion in points of fundamental research such as and a secondary charged particle current withnon-linear effects at the surface of a target. a biased suppressor electrode that covered theRecently, a small enhancement in energy loss target. We also measured a mass spectrum ofwas obtained for carbon and boron cluster secondary ions emitted from a target.ions comparing to their single ions at thesame velocity 1 2 Large enhancement for 2'. Experimental setupmetal sputtering yield by irradiation of gold 2.1 beam current measurement
3 cluster ions was also reported It is expected The schematic drawing of a beamthat the massive energy deposition introduced current 'monitor is shown in Fig. 1. The ionby cluster ion irradiation in a very small vol- beams of C and C8 were irradiated to an alu-ume will lead to non-linear phenornena�). minum target. The target current It and theWe have developed various kinds of MeV suppresser current 1, are measured with digi-energy cluster and molecular ions with tal pico-ampere meters (Advantest 8800). Themass-separated beam current of nano ampere voltage of the suppressor electrode wasorder by the TIARA 3 MV tandem accelera- changed from 200 V to 200 V.tor5). We can propel not only study of funda-mental interactions mentioned above but alsothat of materials modification with the clusterion beam. Suppressor
Appling the cluster ion beam to ma- electrodeterials modification, we must control the im- Targetplanted ion dose into a target with measuring Cluster Ion Bewthe accurate beam current. However, we ob-served that the value of measured beam cur-rent depended on materials of the target andirradiation time 6). This phenomenon was notobserved for single ion irradiation. It sug- GPIB Is It GPIBgests that the aount of secondary chargedparticles from a target irradiated by a cluster Vsion beam be different from that irradiated bya single ion beam because of the non-linier /77 r 7phenomena. Therefore, it is important to in-vestigate the non-linier phenomena on secon- Fig.1 Schematic drawing of beam current monitor.dary particles from a target such as electrons
- 291 -
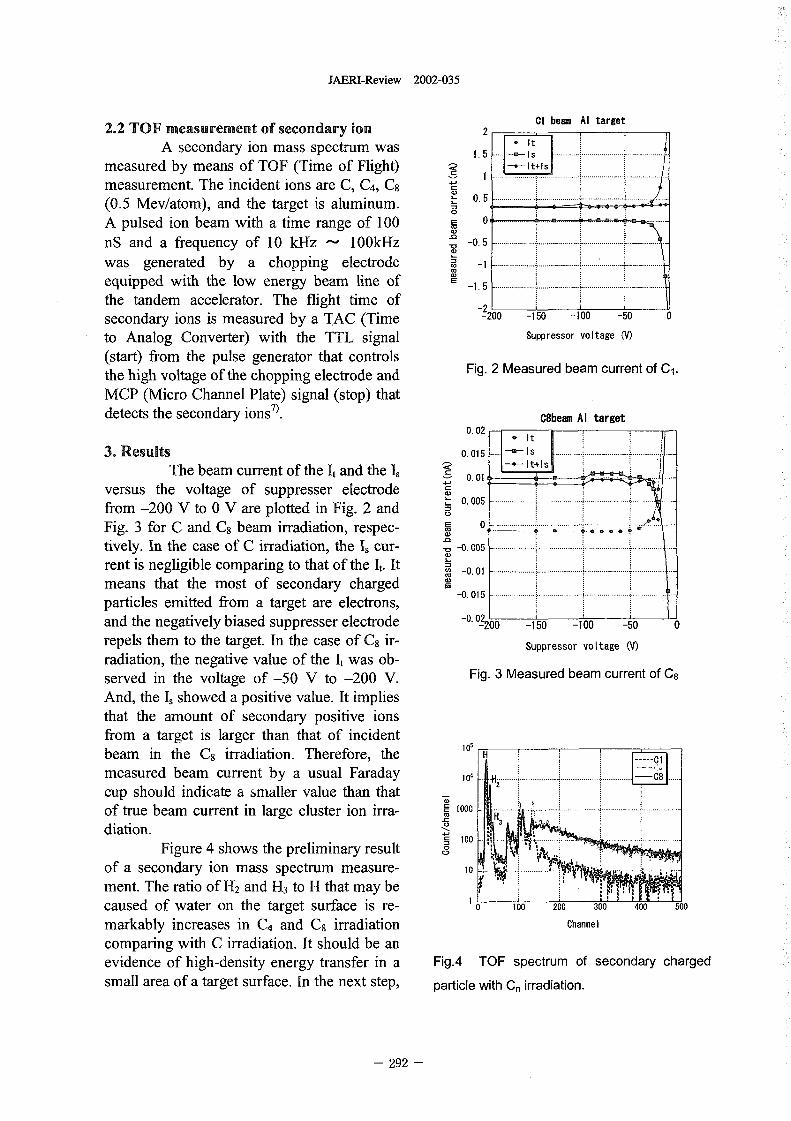
JAERI-Review 2002-035
2.2 TOF measurement of secondary ion 2 GI beam !Al target
A secondary ion mass spectrum was 1. ........... ..................... ..................measured by means of TOF (Time of Flight) +1. . ......... . .. ..... ..................... ..................
41measurement. The incident ions are C, C4, C8(0.5 Mev/atom), and the target is aluminum. 0 5......... ......... ........... .... .. .. .. .. .....
A pulsed ion beam with a time range of I 0 0. .................. .M.- IN . ........ .nS and a frequency of 10 kHz - lOOkHz 0.5 .................... ...................... ... ................ . .......
w as generated by a chopping electrode .................... ........................................... .................equipped with the low energy beam line of E .................... ..................... ..................... . .................the tandem accelerator. The flight time of
-2secondary ions is measured by a TAC (Time 200 -150 -100 -50 0
to Analog Converter) with the TTL signal Suppressor voltage V)
(start) from the pulse generator that controls Fig. 2 Measured beam current of C1.the high voltage of the chopping electrode andMCP (Micro Channel Plate) signal (stop) thatdetects the secondary ions'). Ube= Al target
0. 02 -It
3 . R esults 0.015 - Is ............. ..................... .........It-+IsThe beam current of the 1, and the , 0.01
versus the voltage of suppresser electrode0.005 . ... ........
from 200 V to V are plotted in Fig. 2 andE 0 .............................. ....... ..........................Fig. 3 for C and C8 beam irradiation, respec-
tively. In the case of C irradiation, the Is cur- -0. 005 ................. ... ...... ................ ..................... ............
rent is negligible com paring to that of the 1,. it -0.01 ..................... ; ........................................... ...........(Dmeans that the most of secondary charged
-0.015particles emitted from a target are electrons,
-0.and the negatively biased suppresser electrode �'200 -1'50 -I00 50 0repels them to the target. In the case Of C8 ir- Suppressor voltage V)radiation, the negative value of the 1, was ob-served in the voltage of 50 V to -200 V. Fig. 3 Measured beam current of 8And, the 1, showed a positive value. It impliesthat the amount of secondary positive ionsfrom a target is larger than that of incident lo,beam in the CS irradiation. Therefore, the H
measured beam current by a usual Faraday W ........................ .................... ...... = Cg
cup should indicate a smaller value than thatof true beam current in large cluster ion irra- 1000 .. ... ...... .......... ..... .......... ... ..-
diation. 100 - .... ......... ....Figure 4 shows the preliminary result C_>
of a secondary ion mass spectrum measure- 10ment. The ratio of H2 and H3 to H that may becaused of water on the target surface is re- 0 100 200 300 400 500
markably increases in C4 and Cg irradiation Channel
comparing with C irradiation. It should be anevidence of high-density energy transfer in a Fig.4 TOF spectrum of secondary charged
small area of a target surface. In the next step, particle with Cn irradiation.
- 292 -
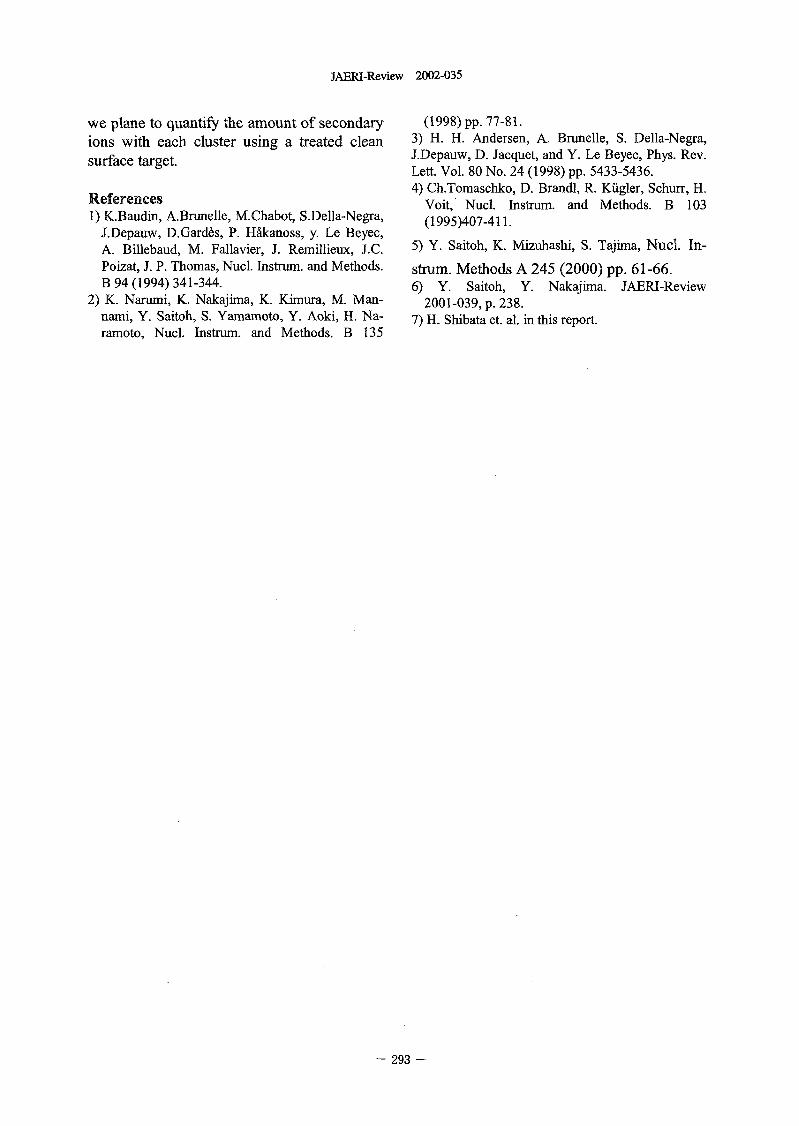
JAERI-Review 2002-035
we plane to quantify the amount of secondary (I 999) pp. 77-8 .ions with each cluster using a treated clean 3) H. H. Andersen, A, Brunelle, S. Della-Negra,surface target. J.Depauw, D. Jacquet, and Y. Le Beyec, Phys. Rev.
Lett. Vol. 80 No. 24 1998) pp. 5433-5436.
References 4) Ch.Tomaschko, D. Brandl, R. Klgler, Schurr H.1) K.Baudin, A.Brunelle, M.Chabot, S.Della-Negra, Voit, Nucl. Instr=. and Methods. 103
J.Depauw, D.Gard&s, P. H5kanoss, y. Le Beyec, (1995)407-411.A. Billebaud, M. Fallavier, J. Remillieux, J.C. 5) Y. Saitoh, K. Mizubashi, S. Tajima, Nucl. In-Poizat, J. P. Thomas, Nucl. Instrurn. and Methods. strum. Methods A 245 2000) pp. 61-66.B 94 1994) 341-344. 6) Y. Saitoh, Y. Nakajima. JAERI-Review
2) K. Narumi, K. Nakajima, K. Kimura, M. Man- 2001-039, p. 239.nami, Y. Saitoh, S. Yamamoto, Y. Aoki, H. Na- 7) H. Shibata et. al. in this report.ramoto, Nucl. Instrurn. and Methods. 135
293 -
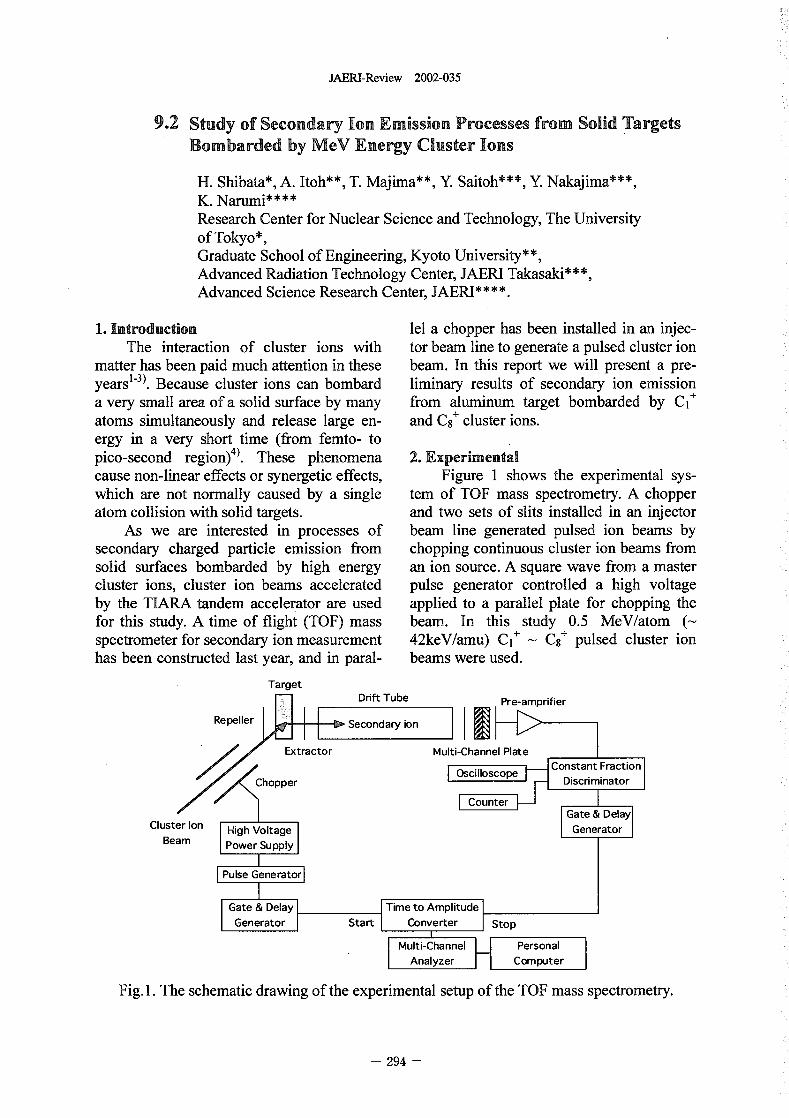
JAERI-Review 2002-035
9.2 Study of Secondary Ion Emission Processes from Solid TargetsBombarded by MeV Energy Cluster Ions
H. Shibata*, A. Itoh**, T. Majima", Y. Saitoh***, Y. Nakajima***,K. Narumi****Research Center for Nuclear Science and Technology, The Universityof Tokyo*,Graduate School of Engineering, Kyoto University",Advanced Radiation Technology Center, JAERI Takasaki***,Advanced Science Research Center, JAERI****.
1. Introduction lei a chopper has been installed in an injec-The interaction of cluster ions with tor beam line to generate a pulsed cluster ion
matter has been paid much attention in these beam. In this report we will present a pre-years'-3). Because cluster ions can bombard liminary results of secondary ion emissiona very small area of a solid surface by many from aluminum target bombarded by C+atoms simultaneously and release large en- and C8+ cluster ions.ergy in a very short time (from femto topicosecond regionf. These phenomena 2. Experimentalcause non-linear effects or synergetic effects, Figure shows the experimental sys-which are not normally caused by a single tem of TOF mass spectrometry. A chopperatom collision with solid targets. and two sets of slits installed in an injector
As we are interested in processes of beam line generated pulsed ion beams bysecondary charged particle emission from chopping continuous cluster ion beams fromsolid surfaces bombarded by high energy an ion source. A square wave from a mastercluster ions, cluster ion beams accelerated pulse generator controlled a high voltageby the TIARA tandem accelerator are used applied to a parallel plate for chopping thefor this study. A time of flight (TOF) mass beam. In this study 0.5 MeV/atorn (-spectrometer for secondary ion measurement 42keV/amu) Cl - C8+ pulsed cluster ionhas been constructed last year, and in paral- beams were used.
TargetDrift Tube Pre-amprifier
Repeller Secondary ion I I
tractor Multi-Ch iel PI eonstant Fraction
Chopper iscriminator
Gate & DelayClusterlon 9 tage Generator
Beam Power Supply
enerator
eay ime to Amplitudea Co nve rte r Stop
Multi-Channel PersonalAnalyzer -H Computer]
Fig. . The schematic drawing of the experimental setup of the TOF mass spectrometry.
- 294 -
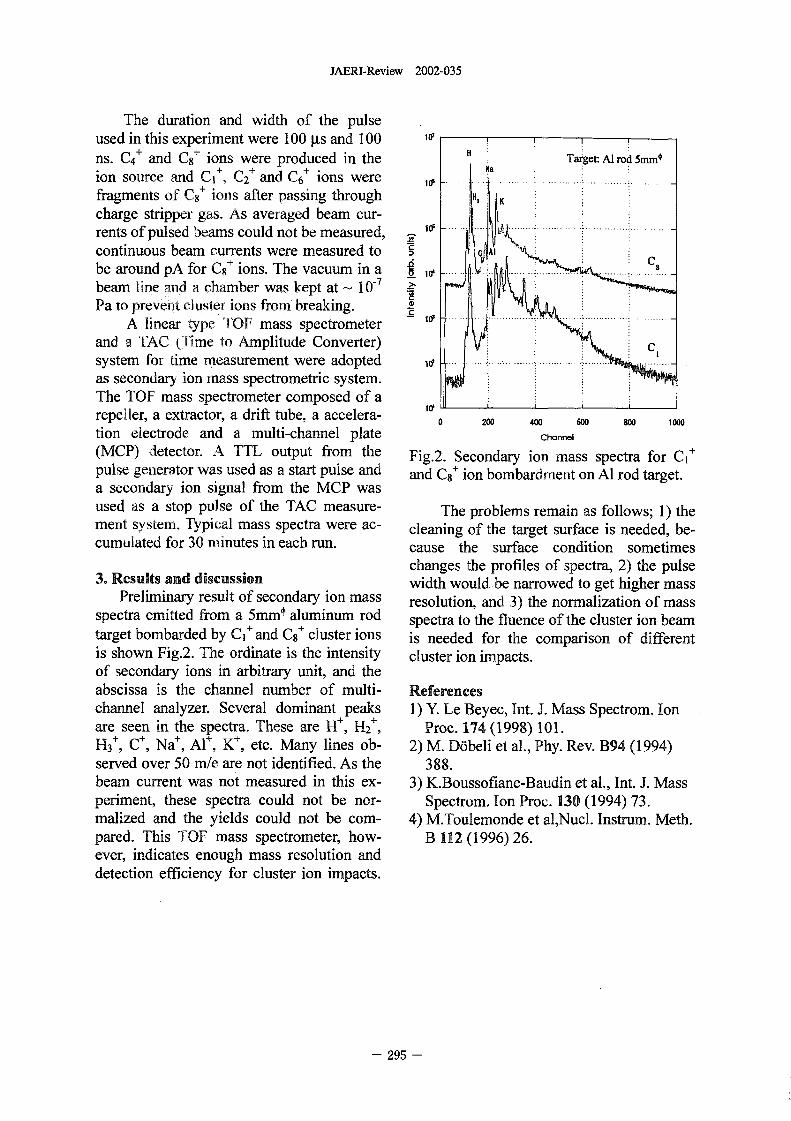
JAERI-Review 2002-035
The duration and width of the pulseused in this experiment were I 0 gs and I 0 10,
Hns. C4+ and C8+ ions were produced in the Target: Al rod 5mm�iaion source and Cj+, C2+ and C6+ ions were Os - ...r r
. ... .... ........ ........
fragments f 8+ ions after passing through K
charge stripper gas. As averaged beam cur-.................. .... .... ... ........rents of pulsed beams could not be measured, q
Ccontinuous beam currents were measured to Albe around pA for C8+ ions. The vacuum in a C8
-7 . .... .. ........ . .. ........at_ 0beam line and a chamber was kept
Pa to prevent cluster ions from breaking... ................ ... .. .......
A linear type TOF mass spectrometerand a TAC (Time to Amplitude Converter) Csystem for time measurement were adopted .. ...... ..... ......... ........as secondary ion mass spectrometric system.The TOF mass spectrometer composed of arepeller a extractor, a drift tube. a accelera-
0 200 4W 6W 8W 1000tion electrode and a multi-channel plate Chanml
(MCP) detector. A TTL output from the Fig.2. Secondary ion mass spectra for C+pulse generator was used as a start pulse and and C8+ ion bombardment on Al rod target.a secondary ion signal from the MCP wasused as a stop pulse of the TAC measure- The problems remain as follows; 1) theMeDt system. Typical mass spectra were ac- cleaning of the target surface is needed, be-cumulated for 30 minutes in each run. cause the surface condition sometimes
3. Results and discussion changes the profiles of spectra, 2 the pulsewidth would be narrowed to get higher mass
Preliminary result of secondary ion mass resolution, and 3 the normalization of massspectra emitted from a nim� aluminum rod spectra to the fluence of the cluster ion beamtarget bombarded by C I+ and C8+ cluster ions is needed for the comparison of differentis shown Fig.2. The ordinate is the intensity cluster ion impacts.of secondary ions in arbitrary unit, and theabscissa is the channel number of multi- Referenceschannel analyzer. Several dominant peaks 1) Y. Le Beyec, Int. J. Mass Spectrorn. Ionare seen in the spectra. These are H, H2+, Proc. 174 1998) 101.H3+, C, Na+, Al-', K, etc. Many lines ob- 2) M. D6beli et al., Phy. Rev. B94 1994)served over 50 m/e are not identified. As the 388.beam current was not measured in this ex- 3) K.Boussofiane-Baudin et al., Int. J. Massperiment, these spectra could not be nor- Spectrom. Ion Proc. 130 1994) 73.malized and the yields could not be com- 4) M.Toulemonde et alNucl. Instrurn. Meth.pared. This TOF mass spectrometer, how- B 112 1996) 26.ever, indicates enough mass resolution anddetection efficiency for cluster ion impacts.
295 -
JAERI-Review 2002-035
9.3 Development of a Magnetic Field Monitoring Systemfor the JAERI AVF Cyclotron
S. Okumura*, W. Yokota*, K. Arakawa*, Y. Nakamura*, T. Nara*. T.Agematsu*
1. Ishiborl*, S. Kurashima*, M. Fukuda*, T. Ishimoto**, T. Nakaj'lma***,
Advanced Radiation Technology Center, JAERI
Department of Material Development, JAERI**
Echo Electronics Co.,Ltd.***
1. Introduction and an oscillation circuit, was installed on the
In the JAERI AVF cyclotron, unstable surface of the lower earth plate in between dee
phenomena, such as beam intensity decrease, electrodes in vacuum. chamber. The signal cable
were observed after starting up the cyclotron or runs between the dee electrode and the dummy
changing an excitation level of the magnet. The dee and reaches the feed-through connector. Themagnetic field correction of dB/B = I X 10-4 NMR signal is fed into the head aplifier and
every tenth hours was needed over a few days. the magnetic field is evaluated from the
We found that an increase in temperature of the resonance frequency.
iron body of the magnet induced the unstable Although the magnetic field of the cyclotronphenomena 1-2). Stabilization of the iron body has a complex distribution: the radial change for
temperature was achieved by precise the isochronous acceleration and the azimuthal
temperature control of the cooling water for change for beam focusing, a homogeneousthermal isolation plates installed between the magnetic field, dB/B < I X 10-4 CM1 is
iron body. and a main Coil3). The beam intensity required for the precise easurement with the
was stabilized within 10 % decrease in 50 NMR magnetometer. The optimum position ofhourS4-5). The stability of the magnetic field the NMR probe, where the magnetic field in the
seems to be in the order of 1-5, while the proton sample is the most homogeneous
accuracy of the magnetic field measurement was distribution, was searched by shiffing the probe,
not so good for harsh environments in the but the NMR signal level was not enough Tocyclotron. obtain enough homogeneity of the magnetic
While mcrobeams using the 3 NW tandem field at the probe, a pair of correction coils wasand the single-ended accelerators are widely applied. The correction coils were designed to
used, higher beam energy for mcrobearns are compensate the field gradient (zIOG/cm) alongrequired for biomedical applications. one direction. Each coil, I mm thick, was
Collimated beams using the cyclotron are fabricated with polyimide copper wire of 03
applied but the beam size is around several pm. mm diameter and epoxy resin (Torr Seal) so as
A microbearn production system by focusing, to use in narrow vacuum space. The NMR probe
therefore, has been constructed. Reduction of was sandwiched with the orrection coils and
the energy spread of the beam, from dE/E � 1-5 the direction of the compensation was optimized
X 10-3 to 2 X 10⁻⁴, is required to achieve the by rotating the correction coils.In an NMR magnetometer nornially used,
microbeam. production. We are developing the the signal cable from the probe runs through lowflat-top acceleration for this reason. High stablemagnetic field, dB/B < 2.OX 10-5, is needed for electromagnetic noise environments. In case of
the flat-top acceleration. the cyclotron, the signal cable is exposed by RFand high magnetic field, because the probe is
mounted in the acceleration area to measure the
2. NMR Magnetic Field Monitoring System true magnetic field. A weak NMR signal,We have developed a nuclear magnetic especially in case of the cyclotron, is disturbed
resonance (NMR) magnetometer with an by these electromagnetic fields.
accuracy of the order of I X 10-6 to measure the To eliminate the effect of the R, whichheats the signal cable of the NMR and disturbs
stability of the cyclotron magnetic field 2T) the NMR signal seriously, the cable was
with a large gradient. specially manufactured with the followingThe NMR probe, including a proton sainple
- 296 -
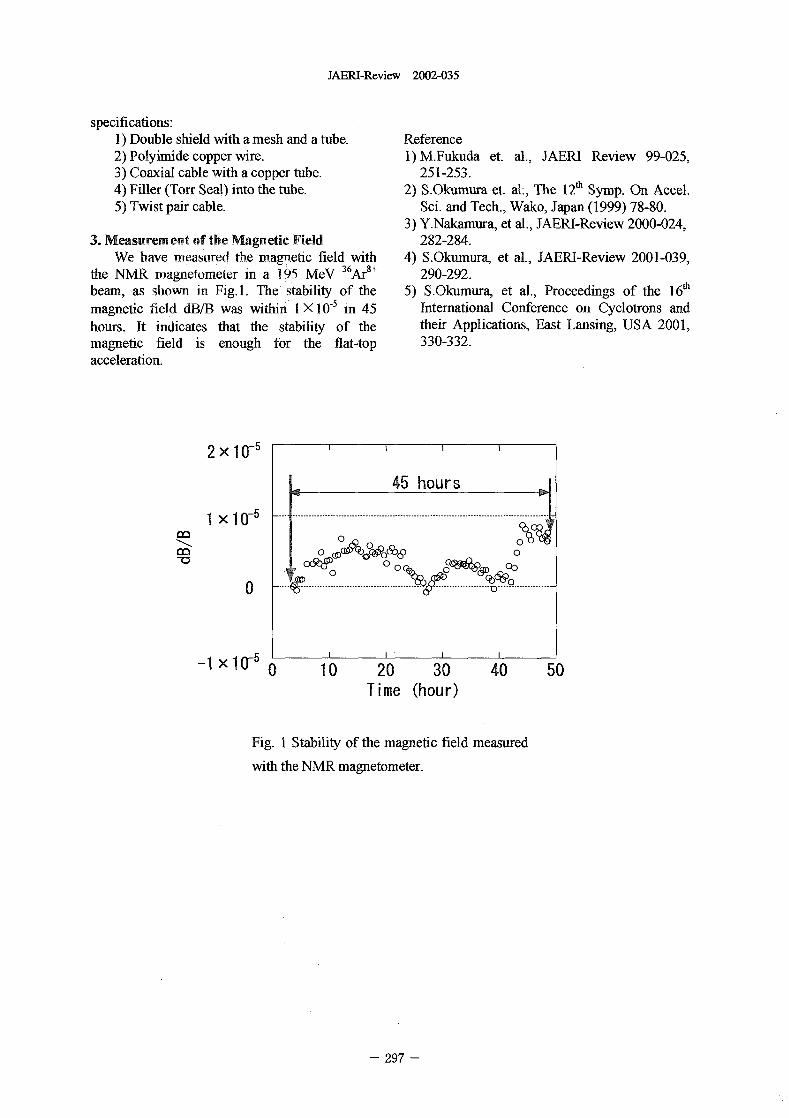
JAERI-Review 2002-035
specifications:1) Double shield with a mesh and a tube. Reference2) Polyimide copper wire. 1) M.Fukuda et. al., JAERI Review 99-025,3) Coaxial cable with a copper tube. 251-253.4) Filler (Torr Seal) into the tube. 2) S.Okumura et. al.-, The 12'h Symp. On Accel.5) Twist pair cable. Sci. and Tech., Wako, Japan 1999) 78-80.
3) Y.Nakamura, et al., JAERI-Review 2000-024,3. Measurement of the Magnetic Field 282-284.
We ave measured te agnetic field with 4) S.Okurnura, et al., JAERI-Review 2001-039,the NMR magnetometer in a 195 MeV 36Ar8+ 290-292.beam, as sown in Fig. . he stability of the 5) S.Okumura, et al., Proceedings of the 16'hmagnetic field dB/B was within I XI 0-' in 45 International Conference on Cyclotrons andhours. It indicates that the stability of the their Applications, East Lansing, USA 2001,magnetic field is enough for the flat-top 330-332.acceleration.
2 1G_'
45 hours
I X I a -, ---- ---------------------------------------------------------------------------------------------- I -FM 0 00__1 0M 0 0
06�& 000 0T 'k&OC 1%dwo0 ___"? ............................................ W -------------------- O -------------------
-I XIG-1 , I I �0_0 10 20 3� 50Time (hour)
Fig. I Stability of the magnetic field measured
with the NMR magnetometer.
297 -
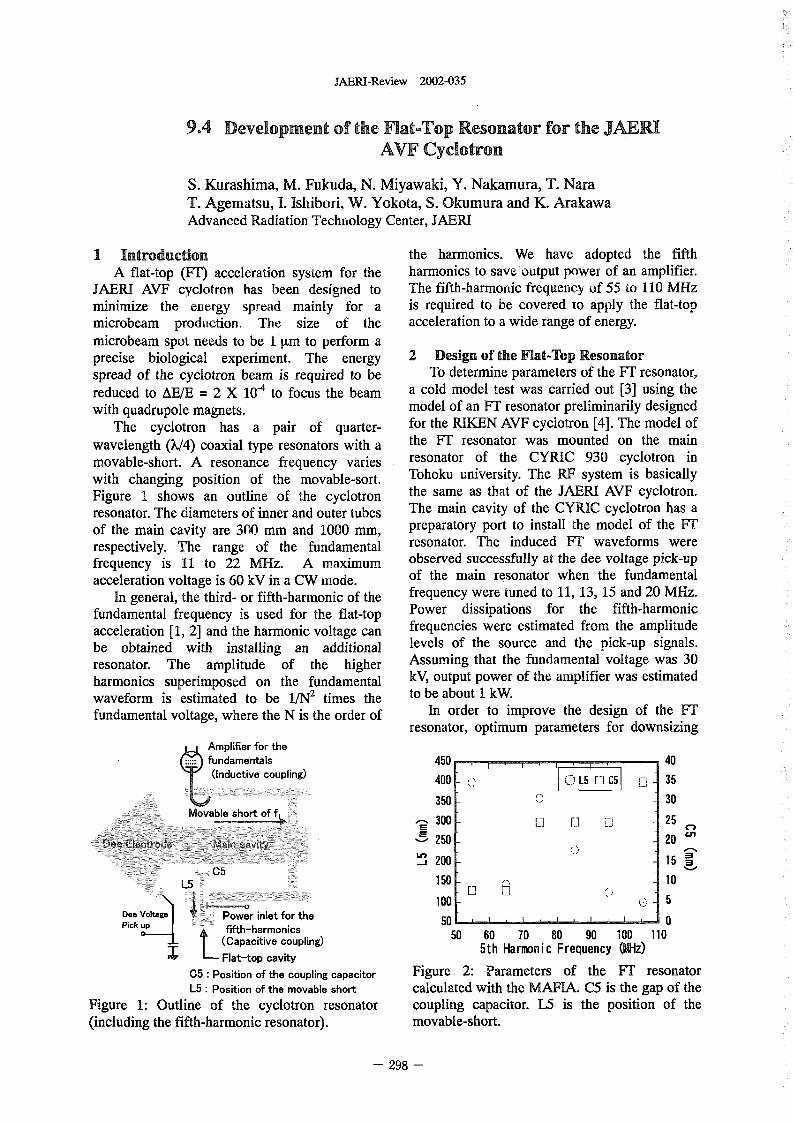
JAERI-Review 2002-035
9.4 Development of the Flat-Top Resonator for the JAERIAVF Cyclotron
S. Kurashima, M. Fukuda, N. Miyawaki, Y. Nakamura, T. NaraT. Agernatsu, 1. Ishibori, W. Yokota, S. Okumura and K. ArakawaAdvanced Radiation Technology Center, JAERI
I Introduction the harmonics. We have adopted the fifthA flat-top I) acceleration system for the harmonics to save output power of an amplifier.
JAERI AVF cyclotron has been designed to The fifth-harmonic frequency of 55 to 110 MHzminimize the energy spread mainly for a is required to be covered to apply the flat-topmicrobeam production, Te size of the acceleration to a wide range of energy.microbearn. spot needs to be I to perform aprecise biological experiment. The energy 2 Design of the Flat-Top Resonatorspread of the cyclotron beam is required to be To determine parameters of the FT resonator,reduced to AE/E = 2 X 10⁻⁴ to focus the beam a cold model test was carried out 3] using thewith quadrupole magnets. model of an FT resonator preliminarily designed
The cyclotron has a pair of quarter- for the RIKEN AVF cyclotron 4]. The model ofwavelength (X/4) coaxial type resonators with a the FT resonator was mounted on the mainmovable-short. A resonance frequency varies resonator of the CYRIC 930 cyclotron inwith changing position of the movable-sort. Tohoku university. The R system is basicallyFigure shows an outline of the cyclotron the same as that of the JAERI AVF cyclotron.resonator. The diameters of inner and outer tubes The main cavity of the CYRIC cyclotron has aof the main cavity are 300 mm and 1000 mm, preparatory port to install the model of the FT
respectively. The range of the fundamental resonator. The induced FT waveforms werefrequency is 11 to 22 MHz. A maximum observed successfully at the dee voltage pick-upacceleration voltage is 60 kV in a CW mode. of the main resonator when the fundamental
In general, the third- or fifth-harmonic of the frequency were tuned to 11, 13, 15 and 20 MHz.fundamental frequency is used for the flat-top Power dissipations for the fifth-harmonicacceleration [1 2 and the harmonic voltage can frequencies were estimated from the amplitudebe obtained with installing an additional levels of the source and the pick-up signals.resonator. The amplitude of the higher Assuming that the fndamental voltage was 30harmonics superimposed on the fundamental W, output power of the aplifier was estimatedwaveform is estimated to be 1N 2 times the to be about kW.fundamental voltage, where the N is the order of In order to improve the design of the F
resonator, optimum parameters for downsizing1-1 Amplifier for the
fundamentals 450 40
(Inductive coupling) 400 35
350 30ble sho
300 11 El E-1 25E- C')
250 20
200 15wr 05
L5 15 - 10
100 5Doe Power inlet for the 0Pick fifth-harmonics 50
(Capacitive coupling) 50 60 70 80 90 100 110Flat-top cavity 5th Harmonic Frequency (MHz)
C5 Position of the coupling capacitor Figure 2 Parameters of the FT resonatorL5 Position of the movable short calculated with the MAFIA. C5 is the gap of the
Figure 1: Outline of the cyclotron resonator coupling capacitor. L5 is the position of the(including the fifth-harmonic resonator). movable-short.
- 298 -
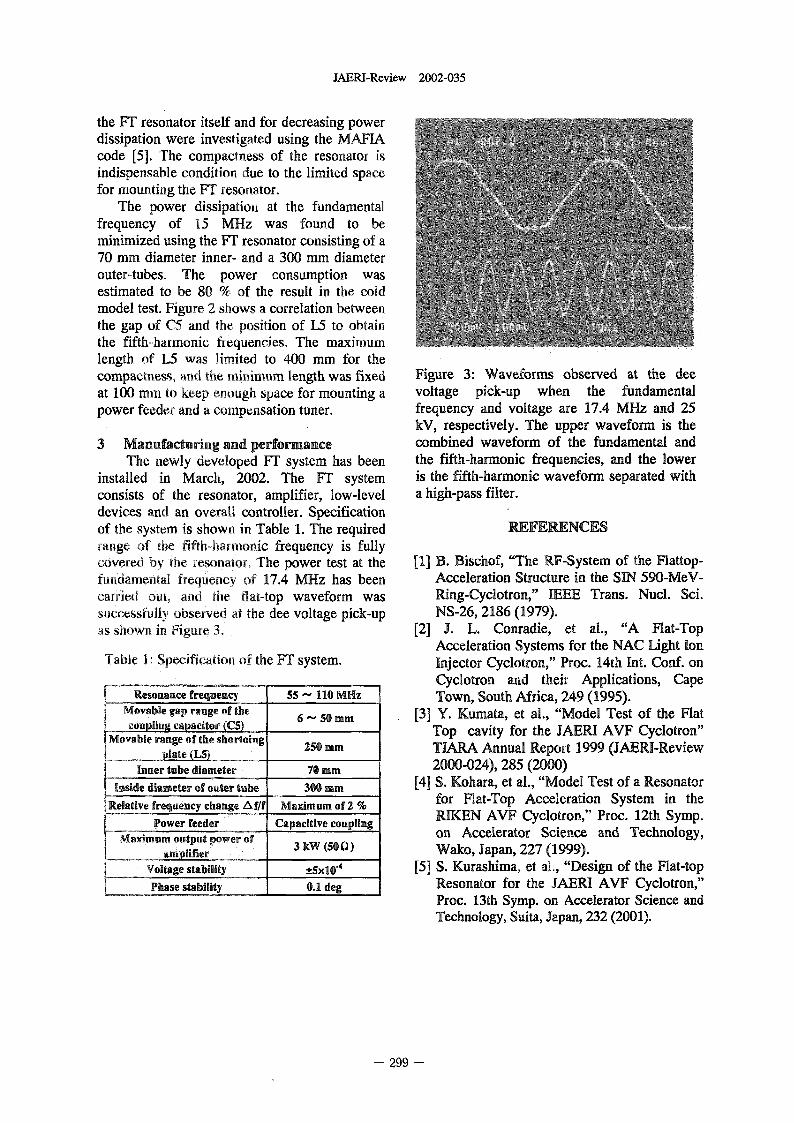
JAERI-Review 2002-035
the FT resonator itself and for decreasing powerdissipation were investigated using the MAFIAcode [5]. The compactness of the resonato isindispensable condition due to the limited spacefor mounting the FT resonator.
The power dissipation at the fundamentalfrequency of 15 MHz was found to beminimized using the FI` resonator consisting of a70 mm diameter inner- and a 300 mm diameterouter-tubes. The power consumption wasestimated to be 80 % of the result in the coldmodel test. Figure 2 shows a correlation betweenthe gap of C5 and the position of L5 to obtainthe fifth-harmonic frequencies, The maximumlength of L5 was limited to 400 mm for thecompactness, and the inimum length was fixed Figure 3 Waveforms observed at the deeat 10 m to keep enough space for mounting a voltage pick-up when the ndamentalpower feeder and a compensation tuner. frequency and voltage are 17.4 MHz and 25
W, respectively. The upper waveform is the3 Manufacturitig and performance combined waveform of the fundamental and
The newly developed FT system has been the fifth-harmonic frequencies, and the lowerinstalled in March, 2002. The Fl' system is the fifth-harmonic waveform separated withconsists of the resonator, amplifier, low-level a high-pass filter.devices and an overall controller. Specificationof the system is shown in Table 1. The required REFERENCESrange of the fifth-harmonic frequency is fullycovered by the resonator, The power test at the [1] B. Bischof, "The R-System of the Flattop-fundamental frequoucy of 17.4 MHz has been Acce eration Structure in t I e -carried out, and the flat-top waveform was Ring-Cyclotron," IEEE Trans. Nucl. Sci.successfully observed at the dee voltage pick-up NS-26, 2186 1979).as shown in Figure 3 [2] J. L. Conradie, et al., "A Flat-Top
Acceleration Systems for the NAC Light IonTable 1: Specification of the FT system. Injector Cyclotron," Proc. 14th Int. Conf on
Cyclotron and their Applications, CapeResonance frequency 55 110 MHz Town, South Africa, 249 1995).
Movable gap range of the 6 - 50 mm [3] Y. Kurnata, et al., "Model Test of the FlatTop cavity for the JAERI AVF Cyclotron"
Movable range of the skortoing 250 mm TLAJRA Annual Report 1999 JAERI-Review
Inner tube diameter 70 mm 2000-024), 285 2000)[41 S. Kohara, et al., "Model Test of a ResonatorInside diameter of outer inbe 300 mm
for Flat-Top Acceleration System in theRelative frequency change AM Maximum of 2 RIKEN AVF Cyclotron," Proc. 12th Symp.
Power feeder Capacitive couplingon Accelerator Science and Technology,
output power of 3 kW (50 0) Wako, Japan, 227 1999).
Voltage stability ±5xlo-" [5] S. Kurashima, et al., "Design of the Flat-topPhase stability f 0.1 deg Resonator for the JAERI AVF Cyclotron,"
Proc. 13th Symp. on Accelerator Science andTechnology, Suita, Japan, 232 2001).
299 -
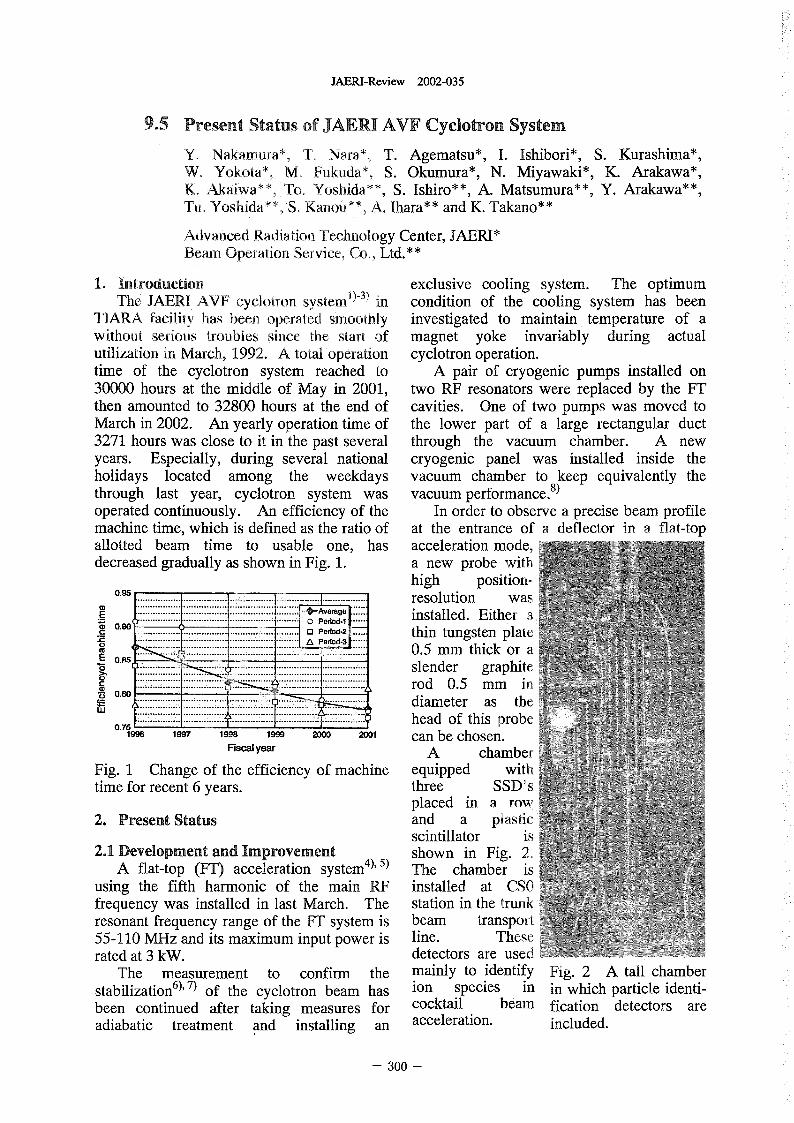
JAERI-Review 2002-035
9.5 Present Status of JAERT AVF Cyclotron System
Y. Nkamura*, T. Nara*, T. Agematsu*, 1. Ishibori*, S. Kurashima*,W. Yokota*, M. Fukuda*, S. Okumura*, N. Miyawaki*, K. Arakawa*,K. Akaiwa**, To. Yoshida**, S. Ishiro**, A. Matsumura**, Y. Arakawa**,Tu, Yoshida * * S Kanol I ', A. Ihara * * and K. Takano
AdvancedRadiation Technology Center, AERI*Beam Operation Service, Co,, Ltd.**
1. Introduction I)-3) exclusive cooling system. The optimumThe JAERI AVF cyclotron system in condition of the cooling system has been
TtARA facility has been operated smoothly investigated to maintain temperature of awithout serious troubles since the start of magnet yoke invariably during actualutilization in March, 1992. A total operation cyclotron operation.time of the cyclotron system reached to A pair of cryogenic pumps installed on30000 hours at the middle of May in 2001, two RF resonators were replaced by the FTthen amounted to 32800 hours at the end of cavities. One of two pumps was moved toMarch in 2002. An yearly operation time of the lower part of a large rectangular duct3271 hours was close to it in the past several through te vacuum chamber. A newyears. Especially, during several national cryogenic panel was istalled inside theholidays located among the weekdays vacuum chamber to keep equivalently thethrough last year, cyclotron system was vacuum performance. 8)
operated continuously. An efficiency of the In order to observe a precise beam profilemachine time, which is defined as the ratio of at the entrance of a deflector in a flat-topallotted beam time to usable one, has acceleration mode,decreased gradually as shown in Fig. 1. a new probe with
high position-0.95 .4 .............. ............... ........... -- ........ resolution w asa) ................. ................. .....
E ................. ................. ............... ................. .............. installed. E ither a0 0.90 ...............-... ........... ...........- .... thin tungsten late............. ............... v. ................. p.... ................. ......... .............. ...... ..... 0.5 mm thick or a
0.8s ................. .................. slender graphite.......... 1� .... ................................ .......... I......
C .............. .................. rod 0.5 m m in0.80 ........... . .... . . ..........
..... . diameter as the.... .. . ..... ... ................... . hea0.75 .. ..... .......... ........... 1".. d of this probe
19% 1997 1998 19M 2000 2DO1 can be chosen.Fiscal year A chamber
Fig. Change of the efficiency of machine equipped with
time for recent 6 years. three SSD'splaced in a row
2. Present Status and a plasticscintillator is
2.1 Development and Improvement 4),5 shown in Fig. 2.A flat-top (I) acceleration system The chamber is
using the fifth harmonic of the main RF installed at CSO
frequency was installed in last March. The station in the trunk
resonant frequency range of the FT system is beam transport
55-110 MHz and its maximum input power is line. These
rated at 3 kW. detectors are used
The measurement to confirm the mainly to identify Fig. 2 A tall chamber
stabilization 6),7) of the cyclotron beam has ion species in in which particle identi-
been continued after taking measures for cocktail beam fication detectors are
adiabatic treatment and installing an acceleration. included.
300 -
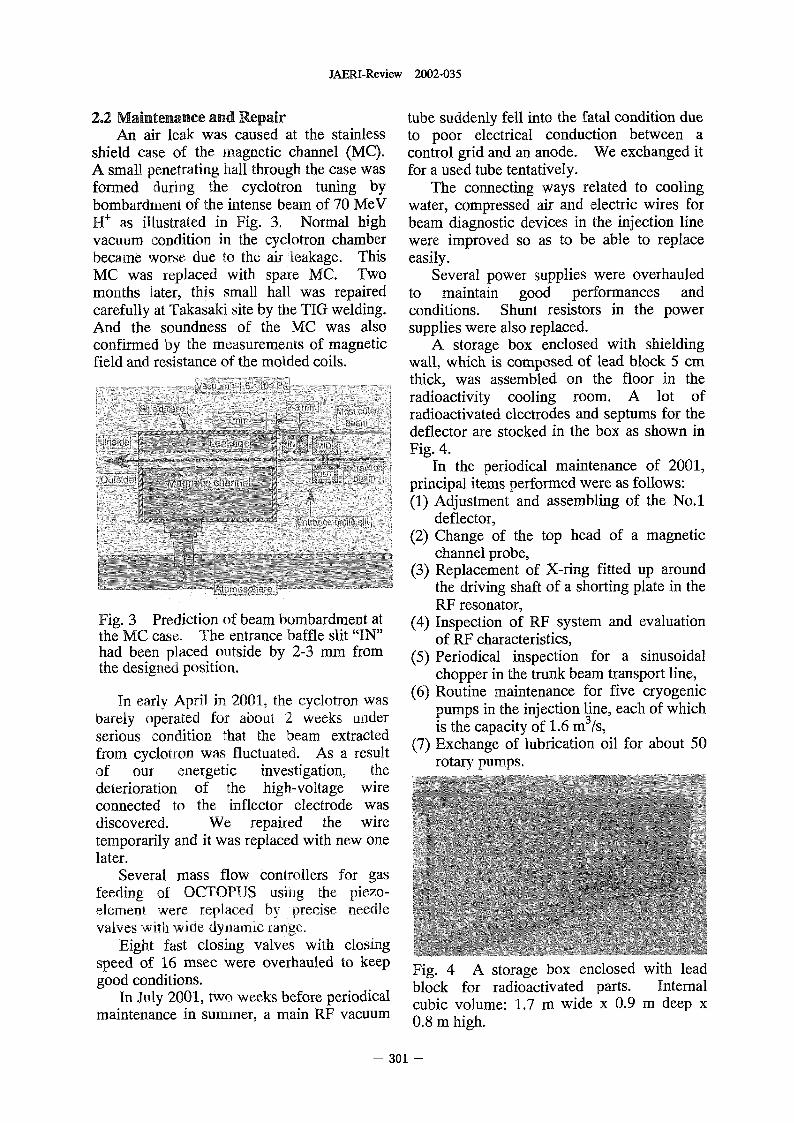
JAERI-Review 2002-035
2.2 Maintenance and Repair tube suddenly fell into the fatal condition dueAn air leak was caused at the stainless to poor electrical conduction between a
shield case of the magnetic channel (MC). control grid and an anode. We exchanged itA small penetrating hall through the case was for a used tube tentatively.formed during the cyclotron tuning by The connecting ways related to coolingbombardment of the intense beam of 70 MeV water, compressed air and electric wires forH' as illustrated in Fig. 3 Normal high beam diagnostic devices in the injection linevacuum ondition in the cyclotron chamber were improved so as to be able to replacebecame worse due to the air leakage. This easily.MC was replaced with spare MC. Two Several power supplies were overhauledmonths Jater, this small hall was repaired to maintain good performances andcarefully at Takasaki site by the TIG welding. conditions. Shunt resistors in the powerAnd the soundness of the MC was also supplies were also replaced.confirmed by the measurements of magnetic A storage box enclosed with shieldingfield and resistance of the molded coils. wall, which s composed of lead block cm
thick, was assembled on the floor in theradioactivity cooling room. A lot ofradioactivated electrodes and septurns for thedeflector are stocked in the box as shown inFig. 4.
In the periodical maintenance of 2001,principal items performed were as follows:(1) Adjustment and assembling of the No.1
deflector,(2) Change of the top head of a magnetic
channelprobe,(3) Replacement of X-ring fitted up around
the driving shaft of a shorting plate in theRF resonator,
Fig. 3 Prediction of beam mbardment at (4) Inspection of RF system and evaluationthe MC case, The entrance baffle slit "IN" of RF characteristics,had been placed outside by 23 mm from (5) Periodical inspection for a sinusoidalthe designed position. chopper in the trunk beam transport line,
In early April in 2001, te cyclotron was (6) Routine maintenance for five cryogenicpumps in the injection line, each of which
barely operated for about 2 weeks der is the capacity of 1.6 rn3/s,serious condition that the beam extracted (7) Exchange of lubrication oil for about 0from cyclotron was fluctuated. As a result rotary pumps.of our energetic investigation, thedeterioration of the high-voltage wireconnected to te inflector electrode wasdiscovered. We repaired the wiretemporarily and it was replaced with new onelater.
Several nass flow controllers for gasfeeding of OCTOPUS using the piezo-�,Iefnent Were TOPJaCed by precise needlevalves with wide dyDamic range.
Eight fast closing valves with closingspeed of 16 msec were overhauled to keep Fig, 4 A storage box enclosed with leadgood conditions. block for radioactivated parts. Internal
In July 2001, two weeks before periodical cubic volume: 17 rn wide x 09 m deep xmaintenance in summer a main RF vacuum 0.8 m high.
- 301 -
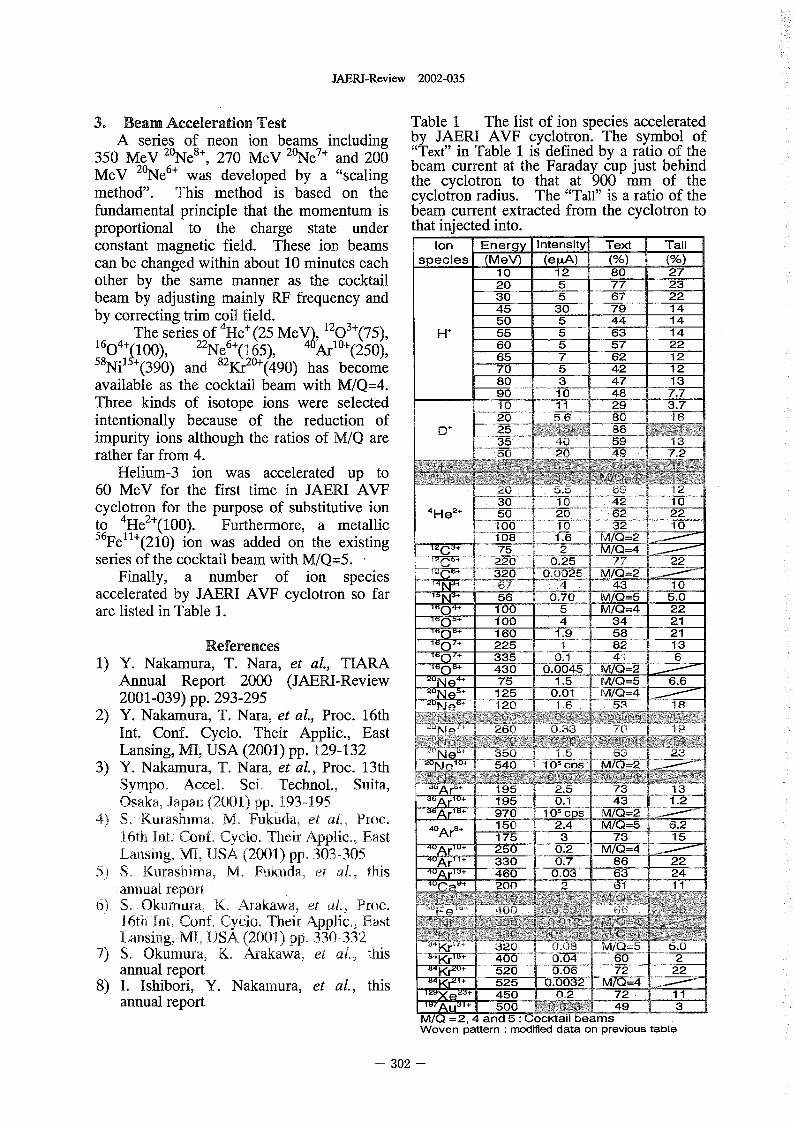
JAERI-Review 2002-035
3. Beam Acceleration Test Table The list of ion species acceleratedA series of neon ion beams including by JAERI AVF cyclotron. The symbol of
350 MeV 2Ne'-'- 270 MeV 2Ne 7' and 200 " Text" in Table is defined by a ratio of theMeV 2Ne 6+ wa's developed by a "scaling beam current at the Faraday cup just behind
the cyclotron to that at 900 mm of themethod". This method is based on the cyclotron radius. The "Tall" is a ratio of thefundamental principle that the momentum is beam current extracted from the cyclotron to
proportional to the charge state under that injected into.
constant magnetic field. These ion beams Ion Energy Intensity Text Tallcan be changed within about 10 minutes each species (MeV) (el.A) M (%)
10 12 80 27other by the same manner as the cocktail 20 5 77 23beam by adjusting mainly RF frequency and 30 5 67 22
45 30 79 14by correcting trim coil field. 50 5 44 1 4
The series of 4 He+ 25 MeV�, 120 3+ (75), H' 55 5 7�3- 1416 4 22 6+ 4 60 5 57 22
0 j100), Ne 65), Arlo+(250),58 d 82Kr2O, 65 7 62 12
Nil (390) an (490) has become 70 5 42 12available as the cocktail beam with M/Q=4. 80 3 47 13
1 90 10 48 7.7Three kinds of isotope ions were selected 10 11 3.7intentionally because of the reduction of ID+ 20 6.6 16
impurity ions although the ratios of M/Q are 35 0rather far from 4.
Helium-3 ion was accelerated up to
60 MeV for the first time in JAERI AVF 20 .15
cyclotron for the purpose of substitutive ion 4 2+ 304 2+ He 22
to He (100). Furthermore, a metallic 32 105'Fe 11+ (210) ion was added on the existing 108 1.6 M =2
75 2 M/Q=4series of the cocktail beam with M/Q=5. 220 0.25 77 22
20 010025Finally, a number of ion species _M/C)=27 43 10
accelerated by JAERI AVF cyclotron so far 56 -M-/O=5 5.0are listed in Table 1. 16o4. 100 5 M/Q=4 22
-76-0�1 100 4 -34 217,60 �, 160 -- 1.9 58 - 21
References 225 1 82 --- 13335
1) Y. Nakamura, T. Nara, et aL, TLARA -160 8+ 4 3 6 - '-O. 00 4 �5- !O =-.YAnnual Report 2000 (JAERI-Review "Ne- 75 1 1.5 =5 6.6
5 O.Oi M/0=42001-039) pp. 293-295
2) Y. Nakamura, T. Nara, et aL, Proc. 16th '10 IInt. Conf. Cyclo. Their Applic., East 260 (�331 70 1.9
Lansing, MI, USA 2001) pp. 129-132 Ne' 35 6 33) Y. Nakamura, T. Nara, et aL, Proc. 13th 54 105 r- 2
Sympo, Accel. Si. Technol., Strita, 196 2.5 '73 luOsaka, Japan (200J) pp� 193495 r 195 0.1 _!13
0 105 M/0=24) S. Kufashima M Fukuda, et ai., P10C. 8+ 0 M/U=5-- -6.24OAr
16th Intl CoDf, Cyclo. Their Applic., East 175 �73 15Lansin MI, USA 2001) pp. 303-305 250 0.2-- M7U=-4-9 330 0.7 86 22
5) S. Kurashima, M. Fukuda, et al,, this r + 460 0.03 63 24annual report -- TOO �2 61 1 1
6) S. Okumura, K. Arakawa, et W Proc.16th Int, Conf. Cyclo, Thtir AppJic,, EastLansing, N41, JSA 2001) pp. 330-332
7) S Okumura ' K. A-takawa, et aL, this 2annual report 84 Kr2O+ 520 72
8) 1. Ishibori, Y. Nakamura, et aL, this K 525 0.0129 XQ 23+ 450 0, 1 1
annual report 1&7Au31+ 3M/0 =2,4 and :Woven pattern modified data on previous table
- 302 -
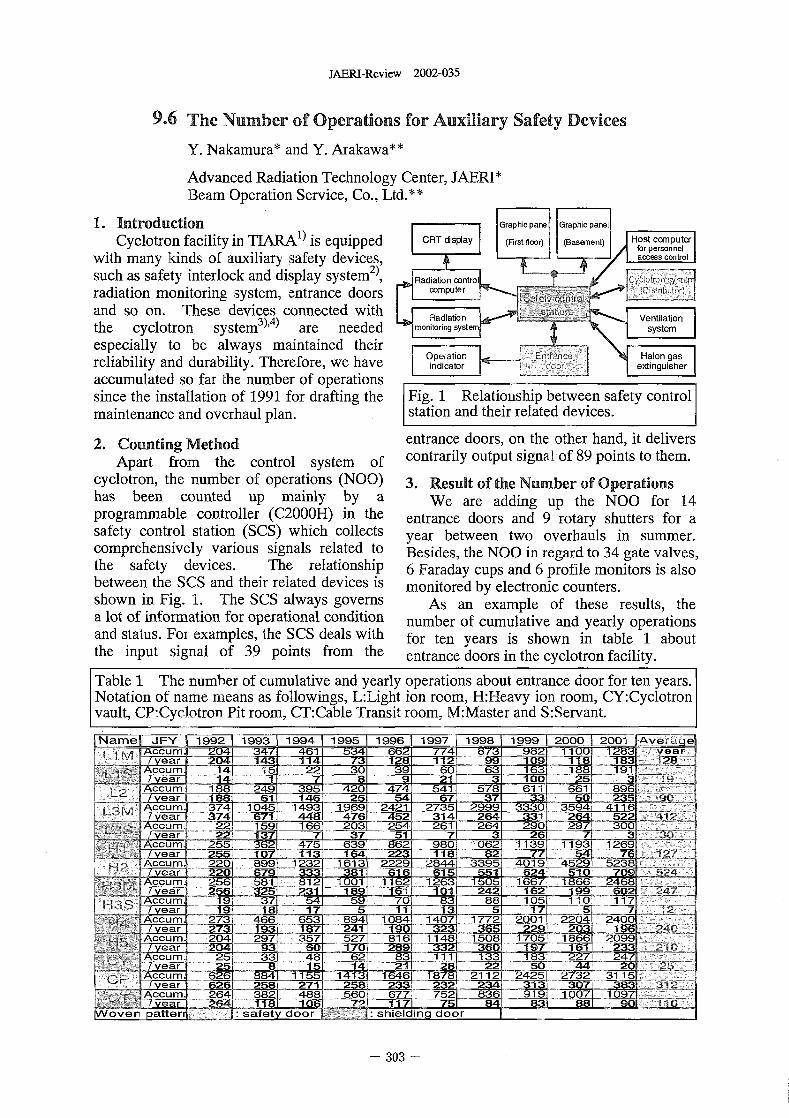
JAERI-Review 2002-035
9.6 The Number of Operations for Auxiliary Safety Devices
Y. Nakamura* and Y. Arakawa**
Advanced Radiation Technology Center, JAERI*Beam Operation Service, Co., Ltd.**
1. Introduction Graphc pane rap c pane
Cyclotron facility in TLARA') is equipped CRT dsplay (First floor) (Basement) Host cmputerforpersonnel
with many kinds of auxiliary safety devices, access control2)such as safety interlock and display system con ro Cyclotron 9to
corn rradiation monitoring system, entrance doors 49 and so on. These devices connected with
3),4) Ventilationthe cyclotron system are needed system-E�E
especially to be always maintained theirreliability and durability. Therefore, we haveaccumulated so far the number of operationssince the installation of 1991 for drafting the g I Relationship between safety controlmaintenance and overhaul plan. station and their related devices.
2. Counting Method entrance doors, on the other hand, it deliversApart from the control system of contrarily output signal of 89 points to them.
cyclotron, the number of operations (NOO) 3. Result of the umber of Operationshas been counted up mainly by a We are adding up the NOO for 14programmable controller (C2000H) in the entrance doors and 9 rotary shutters for asafety control station (SCS) which collects year between two overhauls in summer.comprehensively various signals related to Besides, the NOO in regard to 34 gate valves,the safety devices. The relationship 6 Faraday cups and 6 profile monitors is alsobetween the SCS and their related devices is monitored by electronic counters.shown in Fig. 1. The SCS always governs As an example of these results, thea lot of information for operational condition number of cumulative and yearly operationsand status. For examples, the SCS deals with for ten years is shown in table aboutthe input signal of 39 points from the entrance doors in the cyclotron facility.
Table I The number of cumulative and yearly operations about entrance door for ten years.Notation of name eans as followings, L:Light ion room, H:Heavy ion oom, CY:Cyclotronvault, CP:Cyc1otron Pit room, CT:Cable Transit room, M:Master and S:Servant.NaTel AFY 19 19-6 1 i 998 00 I 200i--
_I 1992 1993 1994 99 I ACCUM. 2U4 Z347 4(dl b34 66 bf3 &b2l TTOU
-1=04 - - -- i-f4 73 1 1 1 10914 5 22 30 39 60 63 �l 63 l-8 �l 9 1
4CEea:r' -M== �7 �ff ---- 9 --- 2f 3 -TUO--cu� 188 _249 395 420 474-- 54 --578 1 661 896�ear 14 �2 67��
54 37374 1045 1493 1969 2421 2�73� 3330 3594 4116
�� 67T 264331-26 22374 --- A�L8 476 452 3141
�12 159 166 203 254 26 264 290 297 300::�=3 7 51 7 -7
362 475 639 862 980 l06ff--F-39---T--3 -l26U17 �11 :�=2� 77-- 4---7-Q
220 899 1232 1613 2229 2844 3395 4019 4529---5238-L__22 1 1 24 -lQ 70:::
256 81 812 1001 67 1866 2468.9 1505
�56 -� . ..... . .19 37 54 59 70--83 88
TJ -- f7 ---- 9 -- 7273 466 653 894 1084 1407 -F772--:��001 2204-
229,_ _ 203204 297 357 527 816 1148 1508 1705 1866 2099
9 I --6 U -i -70 332 ---- 390 --- j-97 --- :3325 33 48 62 ill 133 1 227 24725 ==
626 8 2112 24 732 31152 -:71 =2aff 2:�� 2L:Mn -XL7 --- a0364 2 -- 488 ---- 560 67V- �752- 836- 1 007 ---- l 097
- 1 Q __-72 1 1 U--7- 84 88 90ii��: sa ety do�����
- 303
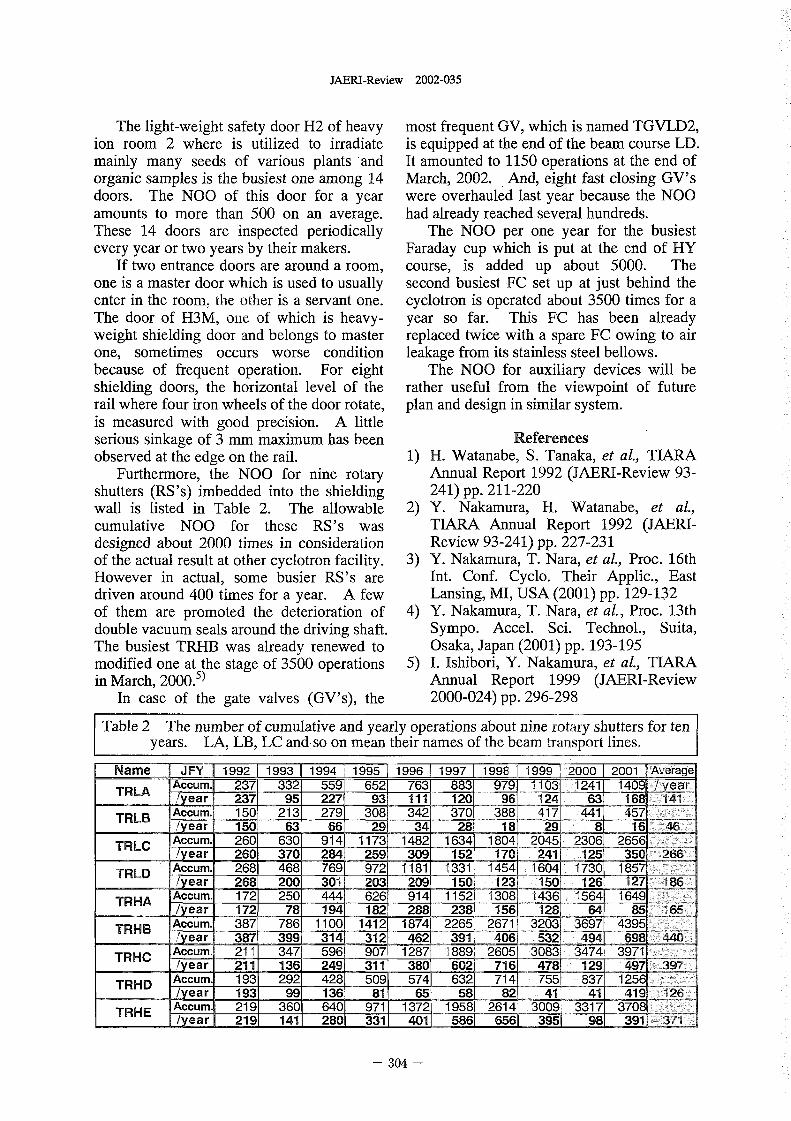
JAERI-Review 2002-035
The light-weight safety door H2 of heavy most frequent GV, which is named TGVLD2,ion room 2 where is utilized to irradiate is equipped at the end of the beam course LD.mainly many seeds of various plants and It amounted to 1150 operations at the end oforganic samples is the busiest one among 14 March, 2002. And, eight fast closing GV'sdoors. The NOO of this door for a year were overhauled last year because the NOOamounts to more than 500 on an average. had already reached several hundreds.These 14 doors are inspected periodically The NOO per one year for the busiestevery year or two years by their makers. Faraday cup which is put at the end of HY
If two entrance doors are around a room, course, is added up about 5000. Theone is a master door which is used to usually second busiest FC set up at just behind theenter in the room. the other is a servant one. cyclotron is operated about 3500 times for aThe door of H3M, one of which is heavy- year so far. This FC has been alreadyweight shielding door and belongs to master replaced twice with a spare FC owing to airone, sometimes occurs worse condition leakage from its stainless steel bellows.because of frequent operation. For eight The NOO for auxiliary devices will beshielding doors, the horizontal level of the rather useful from the viewpoint of futurerail where four iron wheels of the door rotate, plan and design in similar system.is measured with good precision. A littleserious sinkage of 3 mm maximum has been Referencesobserved at the edge on the rail. 1) H. Watanabe, S. Tanaka, et a TARA
Furthermore, the NOO for nine rotary Annual Report 1992 JAERI-Review 93-shutters (RS's) imbedded into the shielding 241) pp. 211-220wall is listed in Table 2 The allowable 2) Y. Nakamura, H. Watanabe, et a,cumulative NOO for these RS's was TIARA Annual Report 1992 (JAERI-designed about 2000 times in consideration Review 93-241) pp. 227-231of the actual result at other cyclotron facility. 3) Y. Nakamura, T. Nara, et a, Proc. 16thHowever in actual, some busier RS's are Int. Conf. Cyclo. Their Applic., Eastdriven around 400 times for a year. A few Lansing, MI, USA 2001) pp. 129-132of them are promoted the deterioration of 4) Y. Nakamura, T. Nara, et aL, Proc. 13thdouble vacuum seals around the driving shaft. Sympo. Accel. Sci. Technol., Suita,The busiest TRHB was already renewed to Osaka, Japan 2001) pp. 193-195modified one at the stage of 3500 operations 5) 1. Ishibori, Y. Nakamura, et a TARA
5) -Reviewin March, 2000. Annual Report 1999 (JAERIIn case of the gate valves (GV's), the 2000-024) pp. 296-298
Table 2 The number of cumulative and yearly operations about nine rot ry shutters for tenyears. LALBLCand-soonmeantheirnamesofthebeamtransportlines,
Name JFY _jq92 ] 1993 1994 199E Mer'ageTRLA Accurn. 237 332 559 652 763 883 979 1103 1241 1409 Ejgtp�L
/year 237 95 227 93 Ill 120 96 124 63 168 J41150 213 279 308 342 370 388 417 441 457TRLB
/year 150 63 66 '29 34 28 18 29 8 16 46CUM. -- i634260 630 914 1482 2656 a 1173 __M45TRLC /year. 260 370 284 259 309 152 170 241 125 350 t266TRLD Accum.1 268 468 769 1 1331 1454 1604 1730 1857
/year 2 200 301 209 f 50 �l 2d �1 50�' 126 127250 444 14 _T 52 -1308 �143E _T564 1649
- ---- /year 172 78 194 1821 288 238 156 128 6.4 85TRHB Accum. 387 786, 1106 ____T874 2265 2671 3203 3697 4395
Near 387 3991 314 312 406 532 494 698WC _U M. 211 347-- 596 907 3083-§474TRHC 1year 211 136 249 311 380 602 129 497
TRHD Accum. 193 292 429 505 574 632 714 755 837 125/year, 193 99 136, 81, 651 581 41 41
TRHE I Accurn-1 2J9 360 6401 9711 1 2614 370J tyear 1 219, 141, 2801 3311 65 98 39ILLLELJ
- 304 -
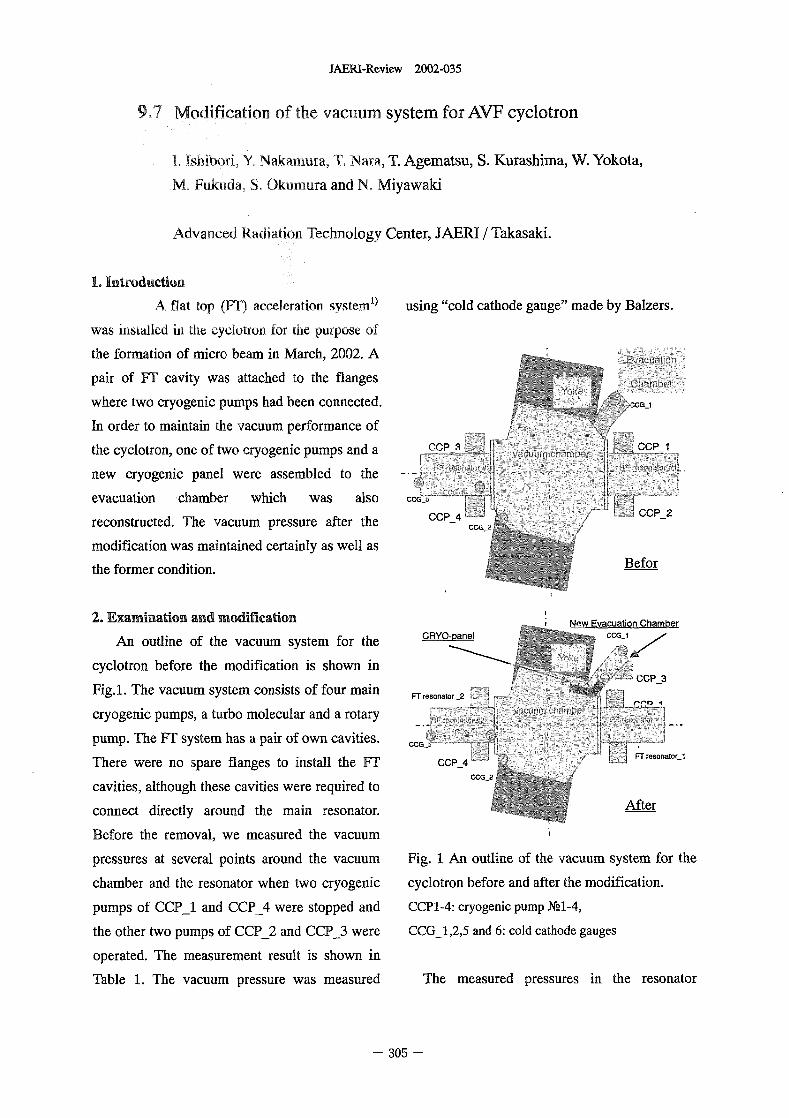
JAERI-Review 2002-035
9.7 Modification of the vacuum system for AVF cyclotron
1. shibori, Y Nakamura, T. Nara, T. Agematsu, S. Kurashima, W. Yokota,
M, Fukuda, S. kuniura and N. Miyawaki
Advanced Radiation Technology Center, JAERI / Takasaki.
1. Introduction
A flat top (F1r) acceleration system') using "cold cathode gauge" made by Balzers.
was insWled in the yclotron for te purpose of
the formation of micro beam in March, 2002 A
pair of FT cavity was attached to the flanges
where two cryogenic pumps had been connected.
In order to maintain the vacuum performance of
the cyclotron, one of two cryogenic pumps and a
new cryogenic panel were assembled to the
evacuation chamber which was alsoreconstructed. The vacuum pressure after the CCP-4 CCP-2CC.Q
modification was maintained certainly as we as
the former condition. Befor
2. Examination and modification mber
An outline of the vacuum system for the CRYO-pane[
cyclotron before the modification is shown inP-3
Fig.l. The vacuum system consists of four main
cryogenic pumps, a turbo molecular and a rotary
pump. The FT system has a pair of own cavities.
There were no spare flanges to install the FT CCP 4CCG
cavities, although these cavities were required to
connect directly around the main resonator. After
Before the removal, we measured the vacuum
pressures at several points around the vacuum Fig. I An outline of the vacuum system for the
chamber and the resonator when two cryogenic cyclotron before and after the modification.
pumps of CCP-1 and CCP-4 were stopped and CCP1-4: cryogenic pump X21-4,
the other two pumps of CCP-2 and CCP-3 were CCG-1,2,5 and 6 cold cathode gauges
operated. The measurement result is shown in
Table 1. The vacuum pressure was measured The measured pressures in the resonator
- 305 -
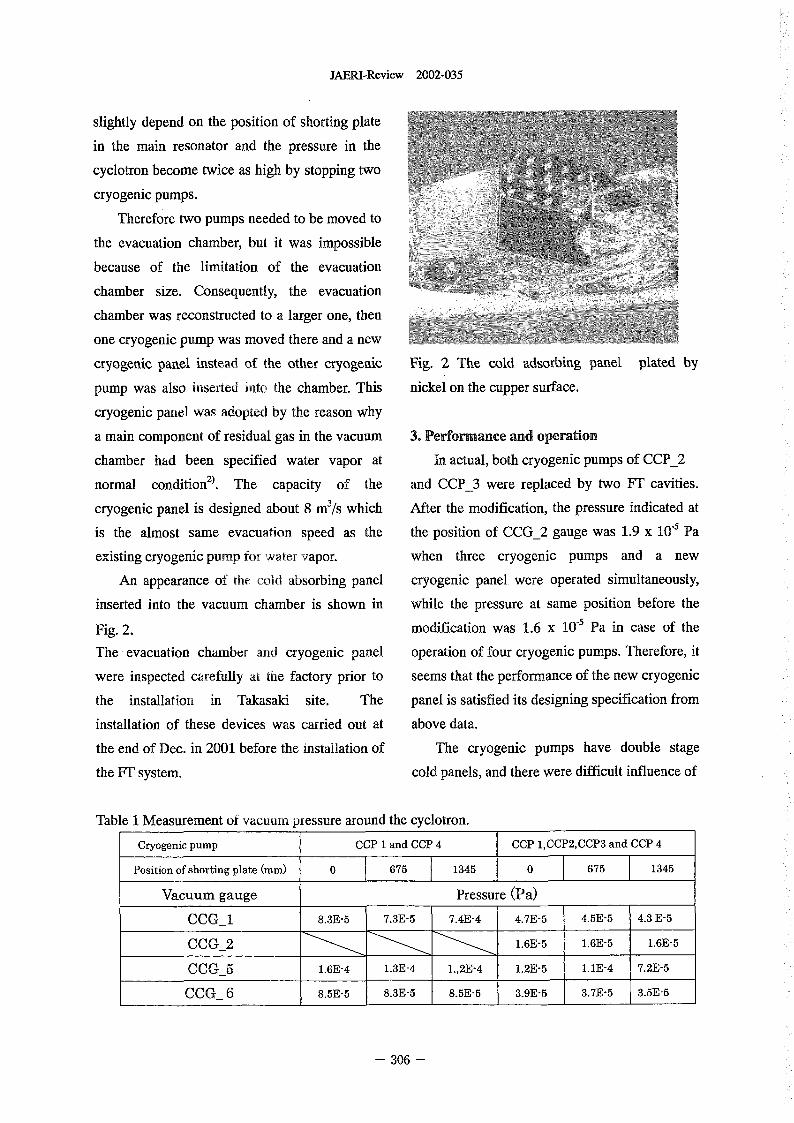
JAERI-Review 2002-035
slightly depend on the position of shorting plate
in the main resonator and the pressure in the
cyclotron become twice as high by stopping two
cryogenic pumps.
Therefore two pumps needed to be moved to
the evacuation chamber, but it was impossible
because of the limitation of the evacuation
chamber size. Consequently, the evacuation
chamber was reconstructed to a larger one, then
one cryogenic pump was moved there and a new
cryogenic panel instead of the other cryogenic Fig. 2 The cold adsorbing panel plated by
pump was also inserted into the chamber. This nickel on the cupper surface.
cryogenic panel was adopted by the reason why
a main component of residual gas in the vacuum 3. Performance and operation
chamber had been specified water vapor at In actual, both cryogenic pumps of CCP-2
normal conditions. The capacity of the and CCP-3 were replaced by two FF cavities.
cryogenic panel is designed about rn�/s which After the modification, the pressure indicated at
is the almost same evacuation speed as the the position of CCG-2 gauge was 1.9 X 1-5 Pa
existing cryogenic pump for, water vapor. when three cryogenic pumps and a new
An appearance of the cold absorbing panel cryogenic panel were operated simultaneously,
inserted into the vacuum chamber is shown in while the pressure at same position before the
Fig. 2 modification was 16 x 10-5 Pa in case of the
The evacuation chamber ad cryogenic panel operation of four cryogenic pumps. Therefore, it
were inspected carefully at tire factory prior to seems that the performance of the new cryogenic
the installation in Takasaki site. The panel is satisfied its designing specification from
installation of these devices was carried out at above data.
the end of Dec. in 2001 before the installation of The cryogenic pumps have double stage
the FT system. cold panels, and there were difficult influence of
Table Measurement of vacuum pressure around the cyclotron.
Cryogenic pump CCP I and CCP 4 CCP JCCP2,CCP3 and CCP 4-- 7345 45
-- T-75 675 13Position of shorting plate (mm) 0 0
Vacuum gauge Pressure (Pa)
CCG-I 8.3E-5 7.3E-5 7AE-4 4.7E-5 4.5E-5 4.3 E-5
CCG-2 1.6E-5 1.6E-5 1.6E-5
CCG-5 1.6E-4 UE-4 I.,2E-4 1.2E-5 UE-4 7.2E-5
CCG- 6 8-5E-5 8-3E-,5 8.5E-5 I 3.9E-5 3.7E-5 3.5E-5
306 -
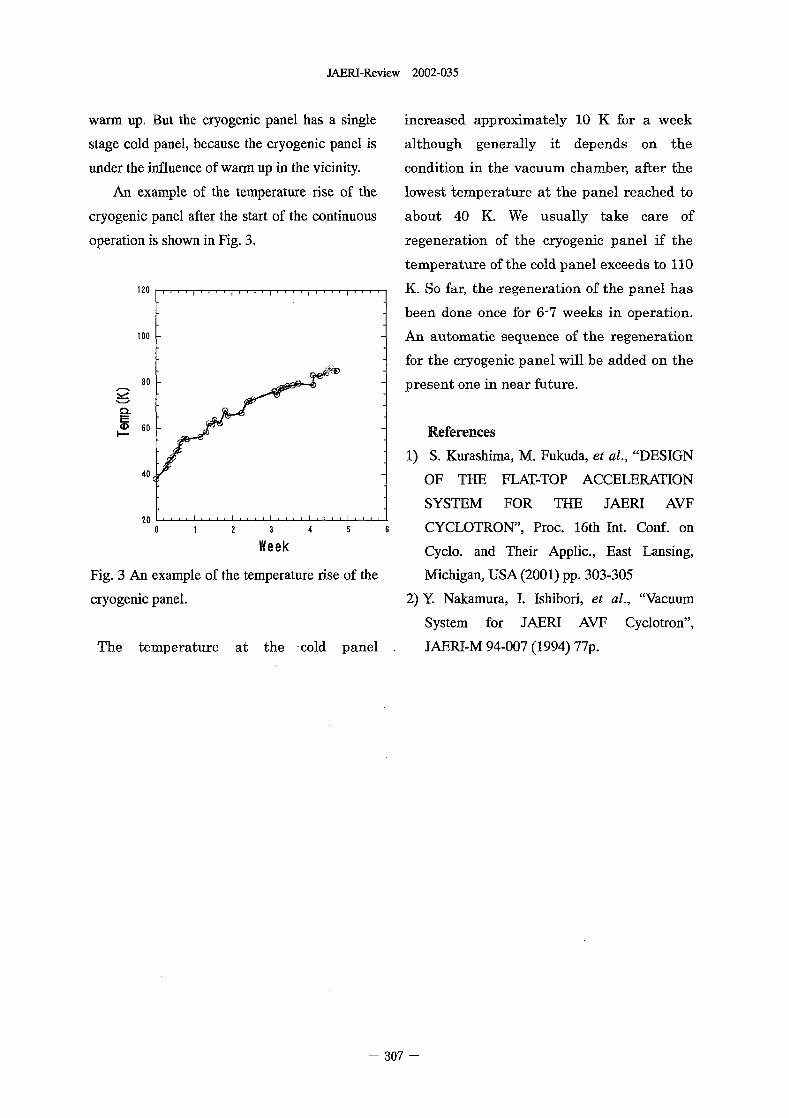
JAERI-Review 2002-035
warm up. But the cryogenic panel has a single increased approximately 0 K for a week
stage cold panel, because the cryogenic panel is although generally it depends on the
under the influence of warm up in the vicinity. condition in the vacuum chamber, after the
An example of the temperature rise of the lowest emperature at the panel reached to
cryogenic panel after the start of the continuous about 40 K. We usually take care of
operation is shown in Fig. 3 regeneration of the cryogenic panel if the
temperature of the cold panel exceeds to 110
120 K. So far, the regeneration of the panel has
been done once for 67 weeks in operation.
100 Am automatic sequence of the regeneration
for the cryogenic panel will be added on the
80 present one in near future.
CLE
60 References
1) S. Kurashima, M. Fukuda, et al., "DESIGN40 OF THE FLAT-TOP ACCELERATION
SYSTEM FOR THE JAERI AVF
20 . . . . . . . . L CYCLOTRON", Proc. 16th Int. Conf on
Week Cyclo. and Their Applic., East Lansing,
Fig. 3 An example of the temperature rise of the Michigan, USA 2001) pp. 303-305
cryogenic panel. 2) Y. Nakamura, 1. shibori, et al., "Vacuum
System for JAERI AVF Cyclotron",
The temperature at the cold panel JAFRI-M 94-007 1994) 77p.
307 -
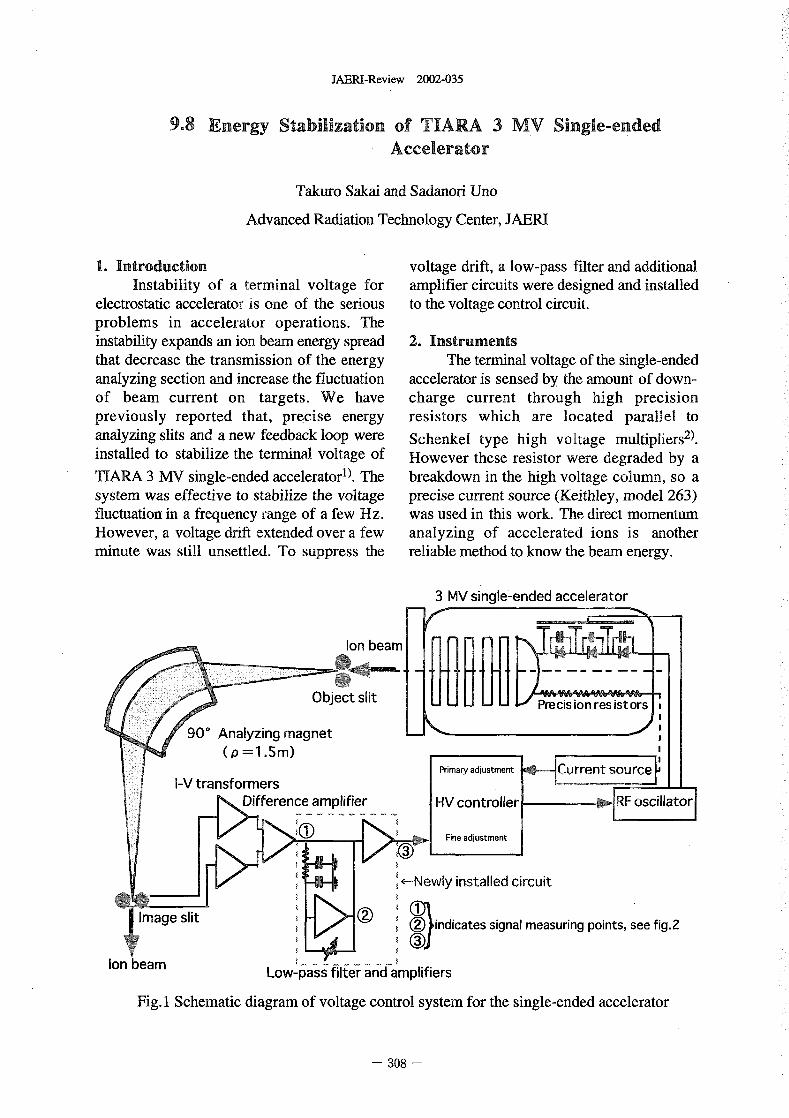
JAERI-Review 2002-035
9.8 Energy Stabilization of TIARA 3 MV Single-endedAccelerator
Takuro Sakai and Sadanori Uno
Advanced Radiation Technology Center, AERI
1. Introduction voltage drift, a low-pass filter and additionalInstability of a terminal voltage for amplifier circuits were designed and installed
electrostatic accelerator is one of the serious to the voltage control circuit.problems in accelerator operations. Theinstability expands an ion beam energy spread 2. Instrumentsthat decrease the transmission of the energy The terminal voltage of the single-endedanalyzing section and increase the fluctuation accelerator is sensed by the amount of down-of beam current on targets. We have charge current through high precisionpreviously reported that, precise energy resistors which are located parallel toanalyzing slits and a new feedback loop were Schenkel type high voltage multiplierS2).installed to stabilize the terminal voltage Of However these resistor were degraded by aTIARA 3 MV single-ended accelerators. The breakdown in the high voltage column, so asystem was effective to stabilize the voltage precise current source (Keithley, model 263)fluctuation in a frequency range of a few Hz. was used in this work. The direct momentumHowever, a voltage drift extended.over a few analyzing of accelerated ions is anotherminute was still unsettled. To suppress the reliable method to know the beam energy.
3 MV single-ended accelerator
Ion beam
Object slit Precisionresistors
900 Analyzing magnet(,o =11.5m)
Primary adjustment Current sourceI-V transformers
ifference amplifier HV controller RIF oscillate- - - - - - - - - -
Fine adjustment
---Newly installed circuit
Image slit(2) indicates signal measuring points, see fig.2
Ion beam -- - - - - - - -- -Low-pass filter and amplifiers
Fig. I Schematic diagram of voltage control system for the single-ended accelerator
- 308 -
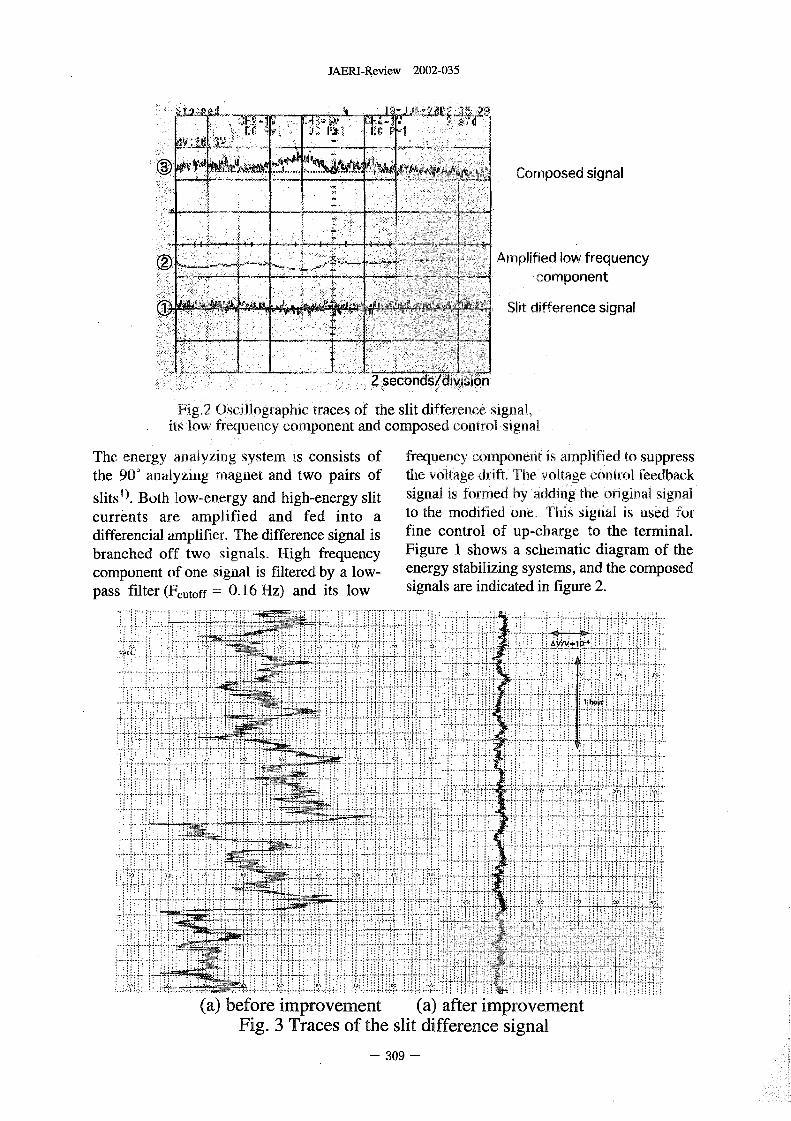
JAERI-Review 2002-035
U
ID Composed signal
Amplified low frequencycomponent
Slit difference signal
7T777
seconds/di sj) on
FigI2 O'Scillographic traces of the slit difference signal,its low fequency omponent and composed control signal
The energy analyzing SStefl i consists of frequency omponeDt is aplified to suppressthe 90' analyzing agnet and two pairs of the ltage drift, Te voltage control feedbackslits'). Both low-energy and high-energy slit signal is formed by adding te original signalcurrents are amplified and fed into a to the modified one Ts signal is used fordifferencial amplifier. The difference signal is fine control of up-charge to the terminal.branched off two signals. High frequency Figure shows a schematic diagram of thecomponent of one signal is filtered by a low- energy stabilizing systems, and the composedpass filter (Fcutoff 0 16 Hz) and its low signals are indicated in figure 2.
........... i.� -is-IJ.. ...........
...... .... ...... .. ... ......... .... ..... ............
..... .. .kiiIJ I . .....
T-� I
i! it
.......... i �4
tit
.... . .... ......
(a) before improvement (a) after improvementFig. 3 Traces of the slit difference signal
309 -
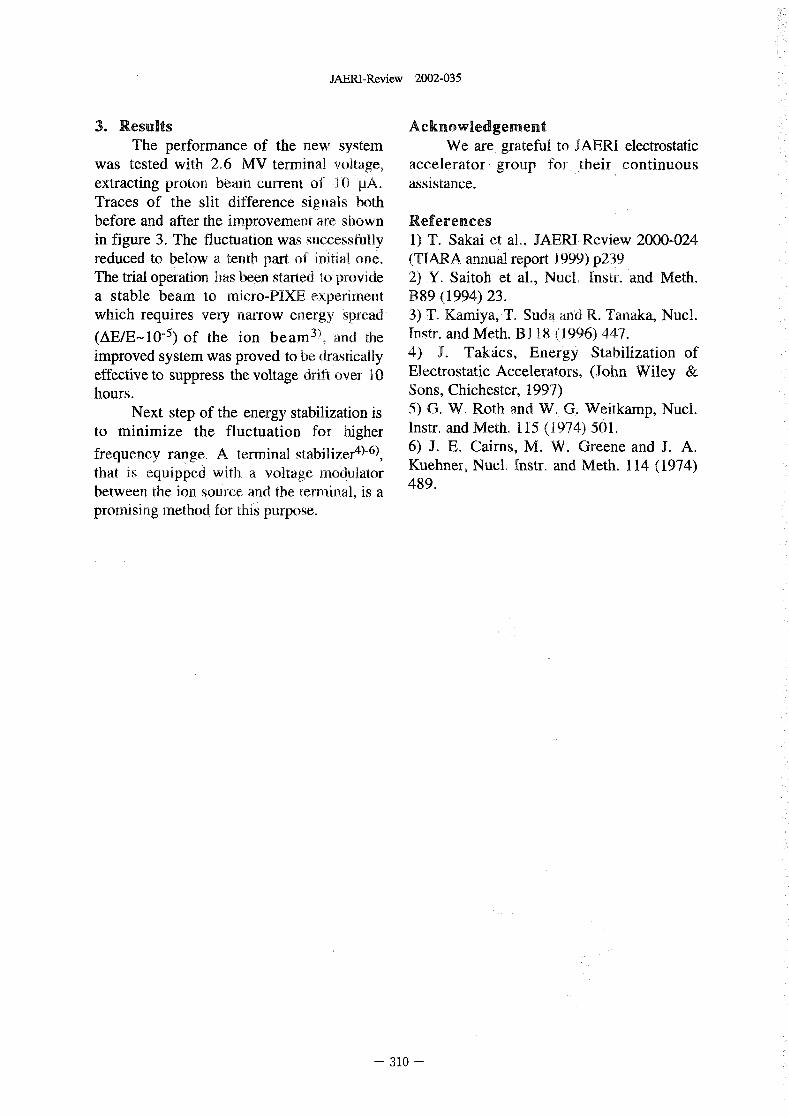
JAERI-Review 2002-035
3. Results AcknowledgementThe performance of the new system We are grateful to JAERI electrostatic
was tested with 26 MV terminal voltage, accelerator group for their continuousextracting proton beaj-n current of 10 pA. assistance.Traces of the slit difference signals bothbefore and after the improvement are shown Referencesin figure 3 The fluctuation was successfully 1) T. Sakai et al., JAERI-Review 2000-024reduced to below a tenth part of initial one. (TIARA annual report 999) p239The trial operation as been started to provide 2) Y. Saitob et al., Nucl. Instf. and Meth.a stable beam to injero-PIXE experiment B89 1994) 23.which requires very arrow ener y sead 3) T, Kamiya, T. Suda ad R. Tanaka, Nucl.(AE/E-10-5) of the ion beaM3), and the Instr. ad Meth. 1 (I 996) 447.
improved system was proved to be drastically 4) J. Takdcs, Energy Stabilization of
effective to suppress the voltage drift over IO Electrostatic Accelerators, John Wiley
hours. Sons, Chichester, 1997)
Next step of the energy stabilization is 5) G. W Roth and W G. Weitkamp, Nucl.
to minimize the fluctuation for higher Instr. and Meth. 115 1974) 501.
frequency range, A terminal stabilizer4)-6), 6) J. E. Cairns, M. W. Greene and J. A.
that is equi ed wit a voltage modulator Kuehner, Nucl. Instr, and Meth. 114 1974)Ipp 489.
betwee te ion source and the terminal, is a
promising method for this purpose.
310 -
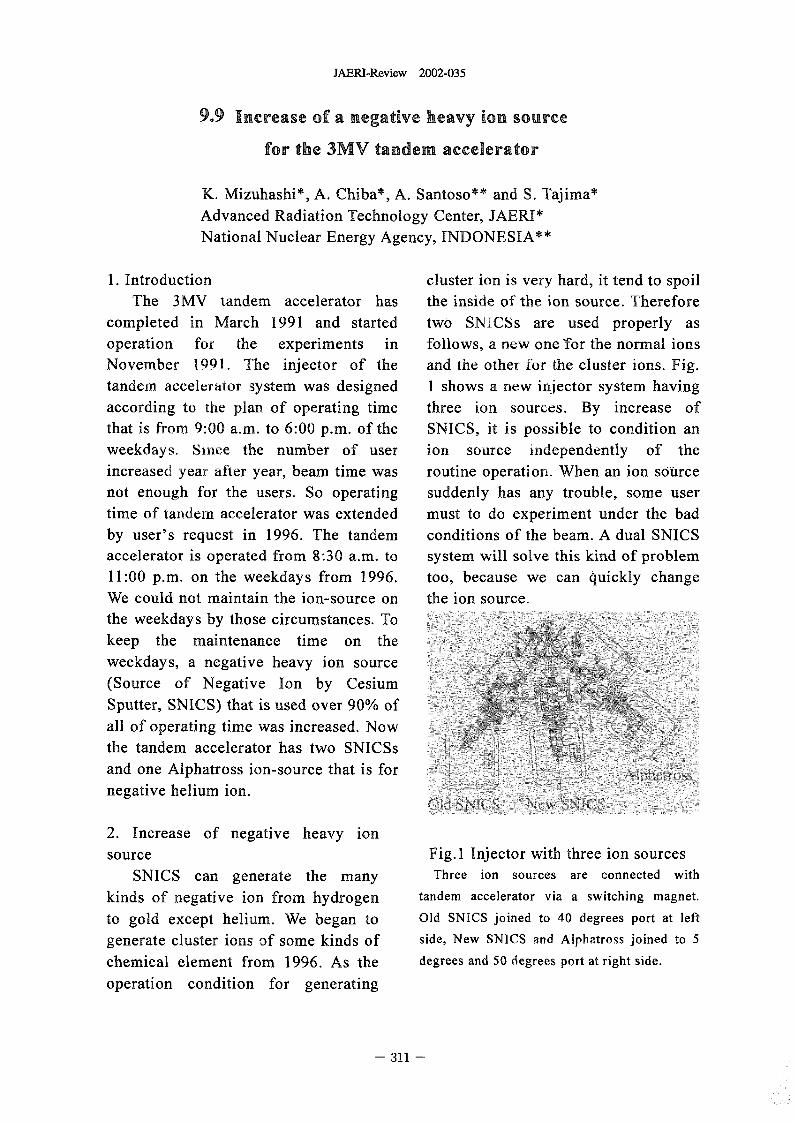
JAERI-Review 2002-035
9.9 increase of a negative heavy ion source
for the 3MV tandem accelerator
K. Mizuhashi*, A. Chiba*, A. Santoso** and S. Tajima*Advanced Radiation Technology Center, JAERI*National Nuclear Energy Agency, INDONESIA"
1. Introduction cluster ion is very hard, it tend to spoilThe 3MV tandem accelerator has the inside of the ion source. Therefore
completed in March 1991 and started two SNICSs are used properly asoperation for the experiments in follows, a new one Tor the normal ionsNovember 1991. The injector of the and the other for the cluster ions. Fig.tandem accelerator system was designed I shows a new injector system havingaccording to te plan of operating time three ion sources. By increase ofthat is from 900 a.m. to 600 p.m. of the SNICS, it is possible to condition anweekdays. Since the number of user ion source independently of theincreased year after year, beam time was routine operation. When an ion sbiircenot enough for the users. So operating suddenly has any trouble, some usertime of tandem accelerator was extended must to do experiment under the badby user's request in 1996. The tandem conditions of the beam. A dual SNICSaccelerator is operated from 830 a.m. to system will solve this kind of problem11:00 p.m. on the weekdays from 1996. too, because we can -quickly changeWe could not maintain the ion-source on the ion source.the weekdays by those circumstances. Tokeep the maintenance time on theweekdays, a negative heavy ion source(Source of Negative Ion by CesiumSputter, SNICS) that is used over 90 ofall of operating time was increased. Nowthe tandem accelerator has two SNICSsand one Alphatross ion-source that is fornegative helium ion.
2. Increase of negative heavy ionsource Fig.1 Injector with three ion sources
SNICS can generate the many Three ion sources are connected with
kinds of negative ion from hydrogen tandem accelerator via a switching magnet.
to gold except helium. We began to Old SNICS joined to 40 degrees port at left
generate cluster ions of some kinds of side, New SNICS and Alphatross joined to
chemical element from 1996. As the degrees and 50 degrees port at right side.
operation condition for generating
- 311 -
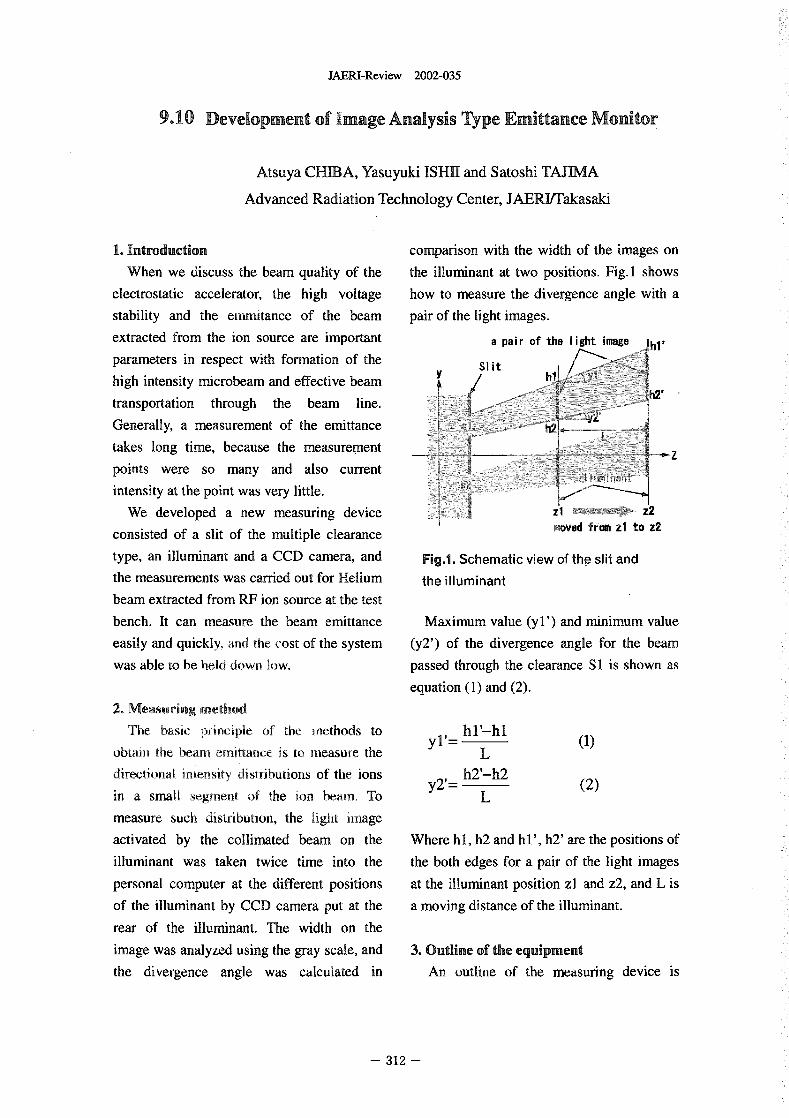
JAERI-Review 2002-035
9.10 Development of Image Analysis T�ype Emittance Monitor
Atsuya CHIBA, Yasuyuki ISHII and Satoshi TAJIN4A
Advanced Radiation Technology Center, JAERYFakasaki
1. Introduction comparison with the width of the images onWhen we discuss the beam quality of the the illuminant at two positions. Fig.1 shows
electrostatic accelerator, the high voltage how to measure the divergence angle with astability and the eimitance of the beam pair of the light images.
extracted from the ion source are important a pair of the light image hl'
parameters in respect with formation of thehigh intensity microbeam and effective beam
transportation through the beam line.Generally, a measurement of the emittancetakes long time, because the measurement Zpoints were so many and also currentintensity at the point was very little.
We developed a new measuring deviceconsisted of a slit of the multiple clearance moved fom z1 to 2
type, an illuminant and a CCD camera, and Fig.l. Schematic view of the slit and
the measurements was carried out for Helium the illurninant
beam extracted from R ion source at the test
bench. It can measure the beam emittance Maximum value yl') and minimum value
easily and quickly, and the cost of the system (y2') of the divergence angle for the beam
was able to be held down low. passed through the clearance SI is shown as
equation (1) and 2).
2. Measuring method
The basic principle of te methods to YI hl'-hl (1)
obtain the eath emittance is to measure the L
directional itensity distributions of te ions h2'-h2y2 (2)
in a small sgment of the ion beam, To L
measure such istribution, the light image
activated by the collimated beam on the Where It 1, h2 and h F, h2' are the positions of
illuminant was taken twice time into the the both edges for a pair of the light images
personal computer at the different positions at the illuminant position zI and z2, and L is
of the illuminant by CCD camera put at the a moving distance of the illuminant.
rear of the illun-dnant. The width on the
image was analyzed using the gray scale, and 3. Outline of the equipment
the divergence angle was calculated in An outline of the measuring device is
- 312 -
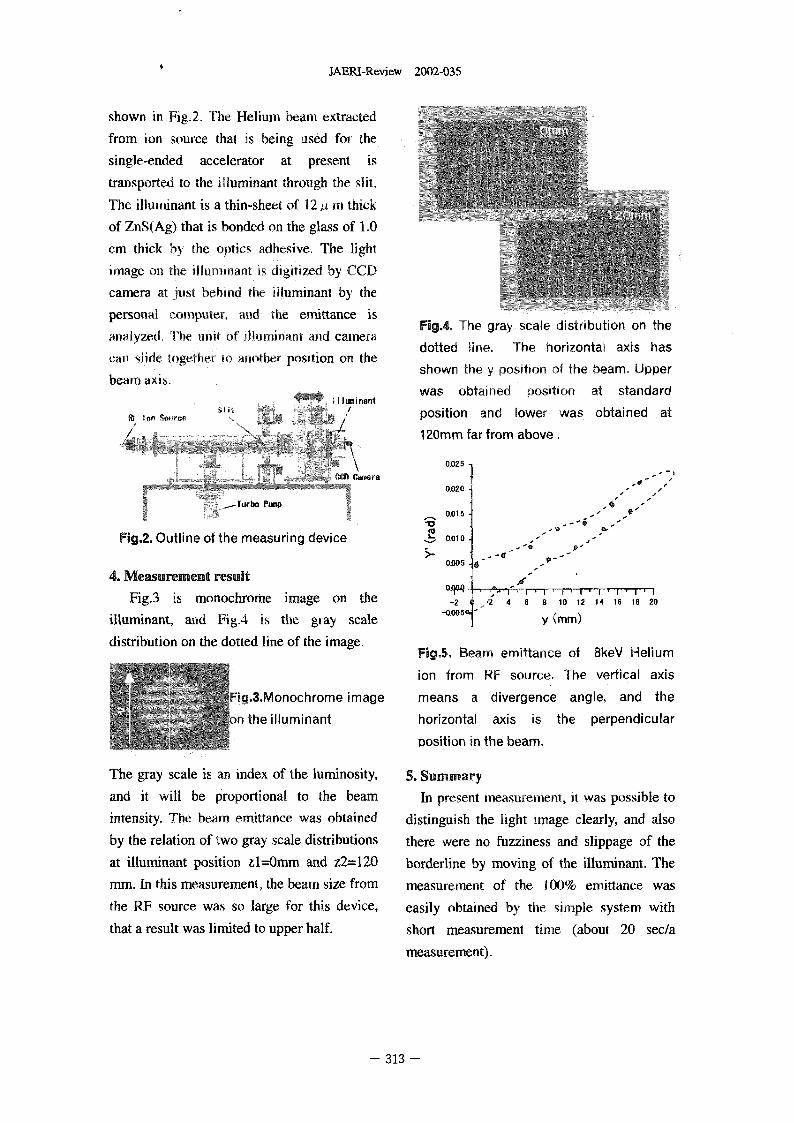
JAERI-Review 2002-035
shown in Fig.2, The Helium beam extracted
from ion source that is being used for te
single-ended accelerator at present is
transported to the illuminant through the slit.
The 11im'U'riant is a thin-sheet of 12,4 thick
of ZS(Ag) that is bonded on the glass of 1.0
cm thick by te optics adhesive. Te light
image on the illummarit is digitized by CCDD
camera at just behind te 111urninant by the
personal computer, and the ernittance is Fig.4. The gray scale distribution on theanalyzed. Te unit of illurninant nd cameracan slide together to another position on the dotted line. The horizontal axis has
beam axis. shown the y position of the beam. UpperI I minant was obtained position at standard
SiFd Ion &)fare#,, position and lower was obtained at120mm far from above.
0.025-Camera 'or
0.020
rbo P0.015-
Fig.2. Outline of the measuring device -2 0010
O.GO5
4. Measurement result0.904-
Fig.3 is monochrome image on the -2 12 4 6 8 10 12 14 16 1 20-0.005-1- '
illuminant, and Fig.4 is the gray scale I Y (mm)
distribution on the dotted line of the image. Fig.5, Beam ernittance of 8keV Helium
ion from RIF source, The vertical axis
ig.3-Monochrome image means a divergence angle, and the
the illuminant horizontal axis is the perpendicular
Dosition in the beam.
The gray scale is an index of te luminosity, 5. Summary
and it will be proportional to the beam In present measurement, it was possible to
intensity. Te beam en-tittance was obtained distinguish the light image clearly, and also
by the relation of two gray scale distributions there were no fuzziness and slippage of the
at illuminant position zl=Omm and z2--120 borderline by moving of the illuminant. The
mm. In this measurement, the beam size from measurement of the 00% entittance was
the RF source was so large for this device, easily obtained by the simple system with
that a result was lin-fited to upper half. short measurement time (about 20 sec/a
measurement).
- 313 -
JAERI-Review 2002-035
9.11 Improvement of the injection electrode systemfOf Torming a submicron ion beam
Yasuyuki Ishii, Akira Isoya and Kazuo ArakawaAdvanced Radiation Technology Center
I Introduction duced to break through this difficulties. The
method was the one extracting ion beam from the
The S01111cron ion bearn system has been neighborhood of the small single anode hole with-
developed to roduce a sveral tens keV H2 out using plasma beams in te ion source (hereafter
with 0.1 ttm width. The system consists of the anode extraction method). Although the beam di-
duoplasmatron-type ion source [I], the acceleration vergence angle sing the anode, extraction ethod
lens system 21 and the subruicron beam masure- was not expected to be reduced in the efflagnifi-
inent ystem 3 The beam width was produced cation rate of more than the plasma beam method,
about 0.5 Am when the system was developed. The the object point width could be shorter than that of
beam width was gradually reduced by improving plasma beam method at the st acceleration lens.
various parts. Especially the smaller beam width Thereby beam spot width was considered to re-
was formed by reducing the beam divergence an- duced within 02 AIR wldth A aode with a
gle iected in the acceleration lens system. So 0.2mino bole tapered at the Pierce angle was intro-
far, about 30 keV H2 beam with 028 /tm width duced by performing this inethod in the ion source.
has been formed using the system 4). The beam The experimental results of the characteristics of
width was, however, about 25 times larger than ion beam generation were represented in this re-
that of the beam trajectory calculations. In ad- port. The results show that die divergence angle
dition, the beam focused by the acceleration lens was reduced in about 3 x 10-- 3 rad, which is about 5system (hereafter beam spot) was fluctuated within times shorter than the previous injection divergence
about 04 pm per 20 min. Since the movement of angle. This ion beam generation method could lead
the beam spot was slow, it was considered to be us to form the 0 I gm beam width.
negligible in order to measure the beam width.
The beam width difference between the calcu-
lated and the formed beam width was considered to 2 Ion beam generation systemlie in the distinction of the beam divergence angle
injected in the acceleration ens system because of The schematic'diagrams 4 the bmicron lon
the usage of the ion beara generation method from beam system with the aode of a 0.2mmo ole ta-
the unstable plasma beam te ion source (here- pered at the Pierce angle and te enlarged illostra.-
after plasma beam method), The method was used tion of its anode were sown in Fig� I and Fig.
to generate the ion beam with the reduction of the I (A), respectively. The aode was made of Cu
beam divergence angel and the about I W eV beam as te non-magnetic and thermal conductive na-
with the small beam energy spread within 2 eV. terial, Te distance etwee te anode and te e-
The plasma beam was extracted in the high vacuum traction electrode was sortened from over mm
space of about 6 x 1-4 Pa on the basis of employ- of the previous setting condition to about mm
ing the non-magnetic aode to reduce the collision in order to make the electric field stfength� The
of ion-ne"trai gas and/or reunion. Some electrodes plasma sheath was generated in the neighborhood
were introduced between the anode ad the extrac- of anode hole by applying over 300 V to the extrac-
tion electrode or the plasma beam was actively di- tion electrode. The divergence angle of the beam
verged in that sawe space to stabilize the plasma was reduced by the 0.2n)MO hole of the extrac-
beam. These efforts could not, however, improve tion electrode. The parallel acceleration electrode
on the beam divergence angle. was placed down stream of the extraction electrode
The other beam extraction method was intro- to reduce the divergence angle moire. Finally, the
- 314 -
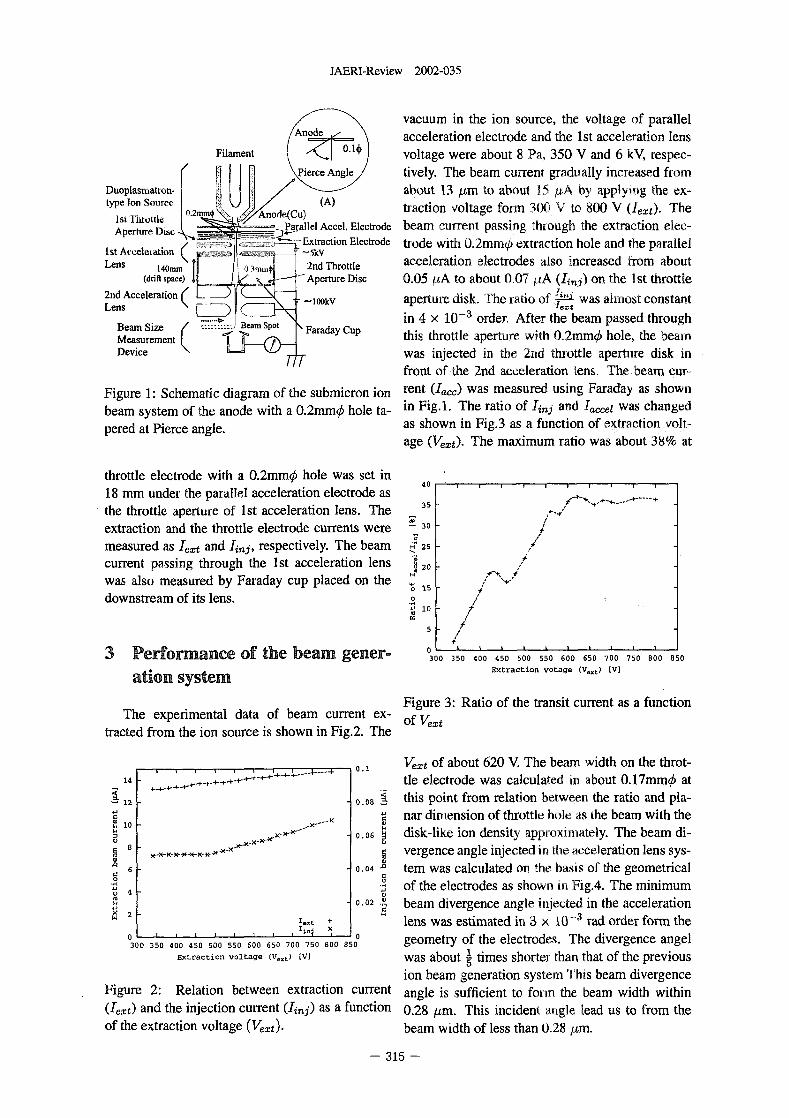
JAERI-Review 2002-035
vacuum in the ion source, the voltage of parallel0 acceleration electrode and the Ist acceleration lens
Filament voltage were about Pa, 350 V and 6 , respec-
tively. The beam current gradually increased from
Duoplasmatton- about 13 Am to about 15 uA by applying the ex-type Ton Source 0.2 (A) traction voltage form 300 V to 80 V The
IstThrottie (CU) el Accel. Electrode beam current passing through the extraction elec-Aperture DISC traction Electrode trode with 0.2mi-no extraction hole and the parallel
Ist Acceleration -5kV acceleration electrodes also increased from aboutLens 140mm 0.3mm 2nd Throttle
(drift space) Aperture Disc 0.05 tA to about 007 ttA (Ijj) on the I st throttle2nd Acceleration I In' was almost constantLens IOOkV aperture disk. The ratio of �!-�
in 4 x 10⁻³ order. After the beam passed throughBeam Size Faraday CupMeasurement this throttle aperture with 0.2mmo hole, the beamDevice T) T was injected in the 2nd throttle aperture disk in
front of the 2nd acceleration lens. The beam cur-Figure 1: Schematic diagram of the submicron ion rent was measured using Faraday as shownbeam system of the anode with a 0.2mmo hole ta- in Fig.l. The ratio of I,j and ,,,l was changedpered at Pierce angle. as shown in Fig.3 as a function of extraction volt-
age (Ve.,t). The maximum ratio was about 38 at
throttle electrode with a 0.2mmo hole was set in18 mm under the parallel acceleration electrode as 40
35 -the throttle aperture of st acceleration lens. Theextraction and the throttle electrode currents were W 30 -
measured as 1,.,t and Ij, respectively. The beam 9' 25 -
current passing through the Ist acceleration lens 20
was also measured by Faraday cup placed on thedownstream of its lens. 0 lo -
5 -
03 Performance of the beam gener- 3 0 0 350 400 450 500 550 600 650 700 750 00 850
ation system Extraction votage (V-t) [v]
Figure 3 Ratio of the transit current as a functionThe experimental data of beam current ex- of V_
tracted from the ion source is shown in Fig.2. The e�t
0.1 V,.,t of about 620 V The beam width on the throt-14 tle electrode was calculated i about 0.17mm at12 - 0.08 this point from relation between the ratio and pla-
r nar dimension of throttle hole as the beam with the10 - X
0.06 disk-like ion density approximately. The beam di-8 - U
.. x_ x__X. _x_x. vergence angle injected in te acceleration lens sysW 0
6 - 0 04 A tem was calculated on the basis of the geometrical0 0r
of the electrodes as shown i Fig.4. The minimumU 4 -0.02 beam divergence angle injected in the acceleration
2 + lens was estimated in x 1-3 rad order form the0 0 geometry of the electrodes. The ivergence angel300 350 400 450 500 550 600 650 700 750 800 850
Extraction voltage (V,,t) (V] was about times shorter than that of the previousion beam generation system This beam divergence
Figure 2 Relation between extraction current angle is sufficient to form the beam width within(1,,t) and the injection current Ui,,j) as a function 0.28 um. This incident angle lead us to from theof the extraction voltage K.O. beam width of less than 028 m.
- 315 -
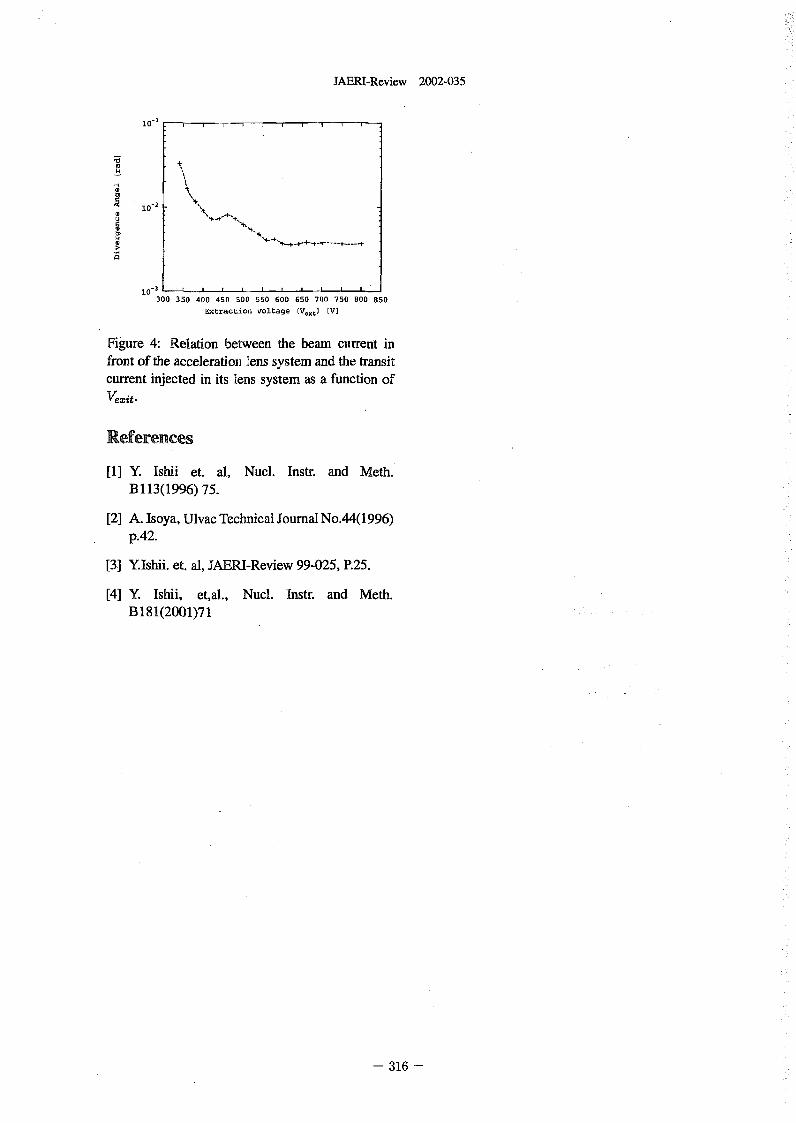
JAERT-Review 2002-035
lo-,
U
10-2
U
10300 350 400 450 500 550 600 650 700 750 00 850
Extraction voltage V_,) (VI
Figure 4 Relation between the beam current infront of the acceleration lens system and the transitcurrent injected in its lens system as a function of
References
[1] Y. Ishii et. al, Nucl. Instr. and Meth.B 13(1996) 75.
[2] A. Isoya, Ulvac Technical Journal No.44(1996)p.42.
[31 Ylshii. et. al, JAERI-Review 99-025, P.25.
[41 Y. Ishii, etal., Nucl. Instr. and Meth.B 181(2001)71
316 -
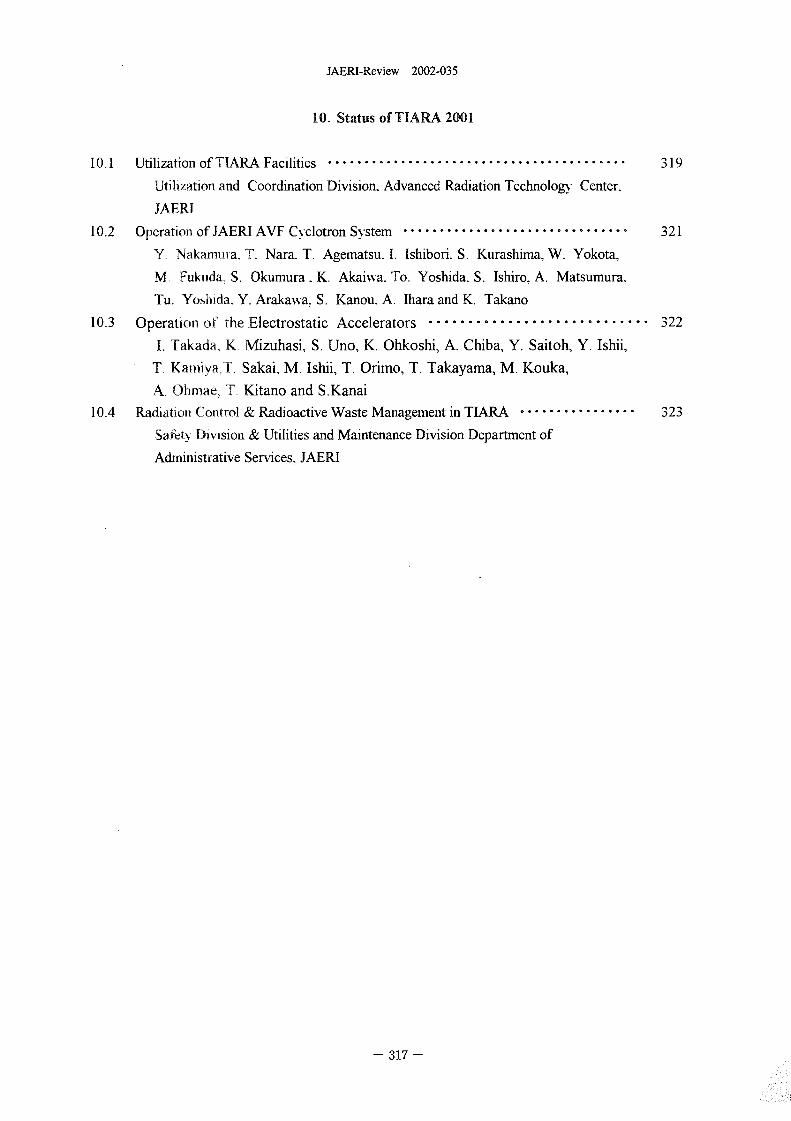
JAERI-Review 2002-035
10. Status of TIARA 2001
10.1 Utilization of TIARA Facilities ......................................... 319
Utilization and Coordination Division. Advanced Radiation Technology Center,
JAERT
10.2 Operation of JAERI AVF Cyclotron Systern ............................... 321
Y, Nakamura. T. Nara. T. Agematsu. 1. Ishibon'. S. Kurashima, W. Yokota.
M. Fuknda. S. Okumura. K. AkaIN--a. To. Yoshida. S. Ishiro. A. Matsumura,
Tu. Yoshida. Y. ArakaNva. S. Kanou. A. Ihara and K. Takano
10.3 Operation of the Electrostatic Accelerators ............................ 322
1. Takada, K. Mizuhasi, S. Uno, K. Ohkoshi, A. Chiba, Y. Saitoh, Y. Ishii,
T. Karnlyaj. Sakai, M. Ishii, T. Orimo, T. Takayama, M. Kouka,
A hnnae, T. Kitano and S.Kanai
10.4 Radiation Control Radioactive Waste Management in TARA ................ 32)
Safetv Division Utilities and Maintenance Division Department of
Administrative Services. JAERI
317 -

This is a blank page.
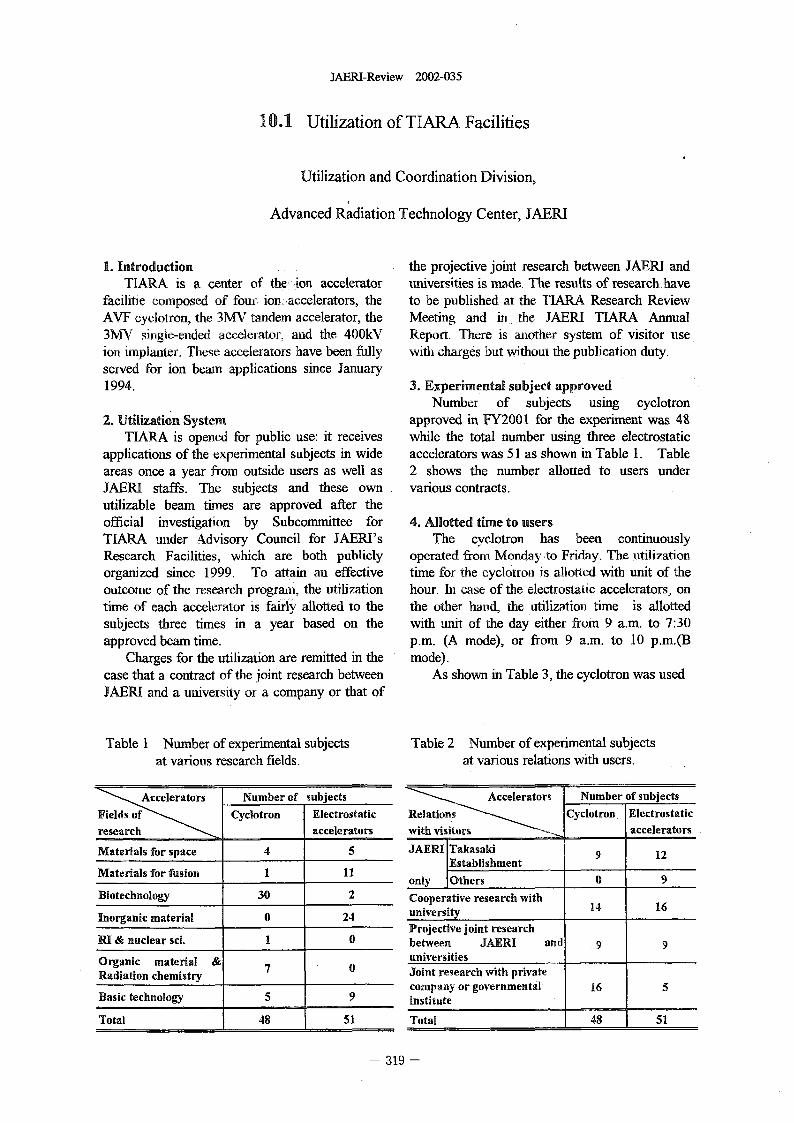
JAERI-Review 2002-035
1-0.1 Utilization of TTARA Facilities
Utilization and Coordination Division,
Advanced Radiation Technology Center, JAERI
1. Introduction the projective joint research between JAERI andTIARA is a center of the ion accelerator universities is made. The results of research have
facilitle composed of four ion accelerators, the to be published at the TARA Research ReviewAVF cyclotron, te 3MV tandem accelerator, the Meeting and i the JAERI TIARA Annual3W single-ended accelerator, and the OkV Report. There is aother system of visitor useion mplanter. These accelerators have been fully with charges but without the publication duty.served for ion bearn applications since January1994. 3. Experimental subject approved
Number of subjects using cyclotron2. Utilization System approved in Y2001 for the experiment was 48
TIARA is opened for public use: it receives while the total number using three electrostaticapplications of the experimental subjects in wide accelerators was 51 as shown in Table 1. Tableareas once a year from outside users as well as 2 shows the number allotted to users underJAERI staffs. The subjects and these own various contracts.utilizable beam times are approved after theofficial investigation by Subcommittee for 4. Allotted time to usersTIARA under Advisory Council for JAERI's The cyclotron has been continuouslyResearch Facilities, which are both publicly operated from Monday to Friday. The tilizationorganized since 1999. To attain an effective time for the cyclotron is allotted with unit of theoutcome of the research program, the utilization hour. hi case of the electrostatic accelerators, ontime of each accelerator is fairly allotted to the the oher hand, the tilization time is allottedsubjects three times in a year based on the with unit of the day either from 9 a.m. to 730approved beam time. p.m. (A mode), or from 9 a.m. to 10 p.m.(B
Charges for the utilization are remitted in te mode).case that a contract of the joint research between As shown in Table 3 the cyclotron was usedJAERI and a university or a company or that of
Table I Number of experimental subjects Table 2 Number of experimental subjectsat various research fields. at various relations with users.
Accelerators Number of subjects Accelerators Number of subjectsields o Cyclotron Electrostatic Cyclotron Electrostatic
research accelerators with visitors accelerators
Materials for space 4 5 JAERI Takasaki 9 12Establishment
Materials for fusion I 11 only Others 0 9
Biotechnology 30 2 Cooperative research with 14 16Inorganic material 0 24 university
Projective joint researchRI & nuclear sci. I 0 between JAERI and 9 9Organic material universitiesRadiation chemistry 7 0 Joint research with private
company or governmental 16 5Basic technology 5 9 institute
Total 48 51 Total 48 51
319
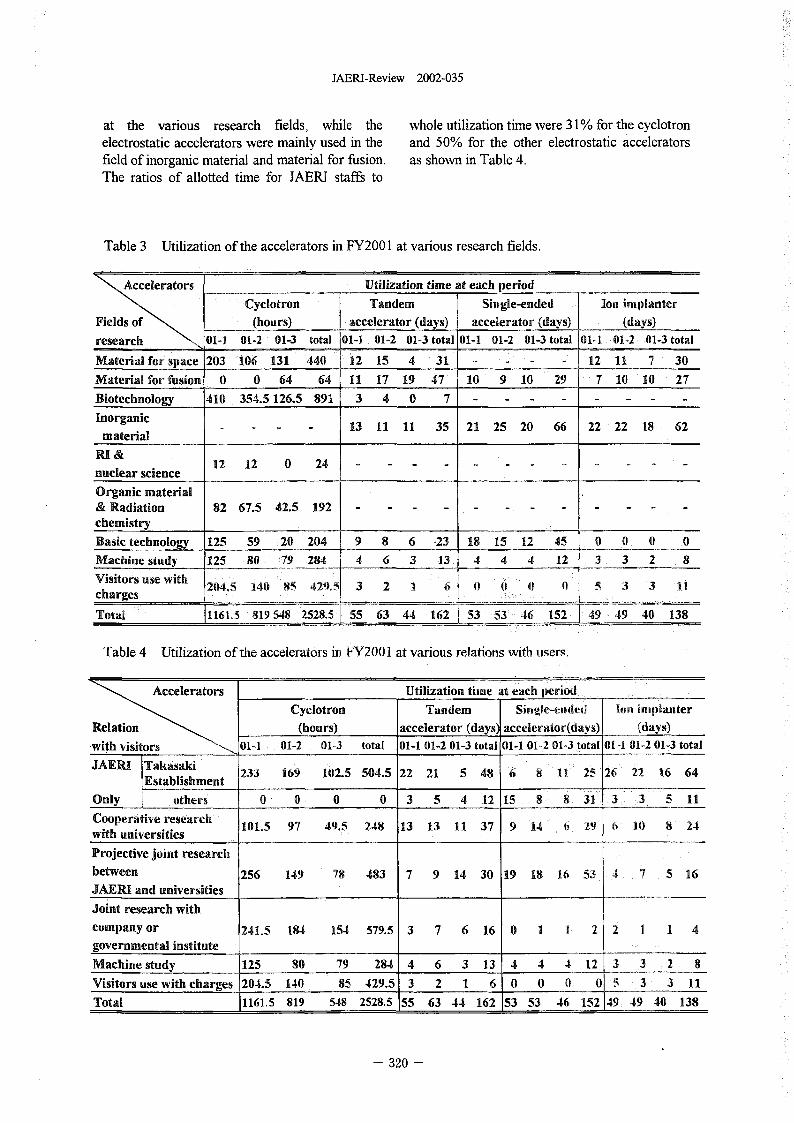
JAERI-Review 2002-035
at the various research fields, while the whole utilization time were 3 % for the cvclotron
electrostatic accelerators were mainiv used in the and 50% for the other electrostatic accelerators
field of inorganic material and material for fusion. as shown in Table 4.
The ratios of allotted time for JAERI staffs to
Table 3 Utilization of the accelerators in Y2001 at various research fields.
tors Utilization time at each eriod
Cyclotron Tandem Single-ended Ion iplanter
(hours) accelerator (days) accelerator, (days) (days)
research 01.1 12 01-3 total 01-1 01-2 01-3 total 01-1 01-2 01-3 total 01-1 01-2 01-3 total
Material for sace 203 106 131 440 12 15 4 31 - - - - 12 11 7 30
Material for fusion 0 0 64 64 11 17 19 47 10 9 10 29 7 10 10 27
Biotechnology 410 354.5 126.5 891 3 4 0 7 - - - - - - - -
Inorganic - - - - 13 11 11 35 21 25 20 66 22 22 18 62material
RI &nuclear science 12 12 0 24 - - - - - - - - - - - -
Organic material& Radiation 82 67.5 42.5 192 - - - - - - - - - - - -
chemistry
Basic technology 125 59 20 204 9 8 6 23 18 15 12 45 0 0 0 0
Machine study 125 So 79 284 4 6 3 13 4 4 4 12 3 3 2 8
Visitors use with 704.5 140 85, 49,5 3 2 1 6 I) 0 0 5 3 3 11charges
Total 1161,5 819 549 2528.5 55 63 44 162 53 53 46 152 49 49 40 138
Table 4 Utilization of the accelerators in FY2001 at various relations with sers,
celerators Utilization thne each eriod
Cyclotron Tandem Single-ended Ion implanter
(hours) accelerator (days) accelerator(days) (days)
-with visitors 01-1 01-2 01-3 total 01-1 01-2 01-3 total 01-1 01-2 01-3 total 01-1 01-2 01-3 total
JAERI Takasaki 233 169 102.5 504.5 22 21 5 48 6 8 11 2S 26 12 16 64Establishment
Only others 0 0 0 0 3 5 4 12 15 8 8 31 3 3 5 11
Cooperative research101.5 97 49.5 248 13 13 11 37 9 14 6 29 6 10 8 24
with universities
Projective joint research
between 256 149 78 483 7 9 14 30 19 18 16 53 4 7 5 16JAERI and universities
Joint research with
company or 241.5 184 154 579.5 3 7 6 16 0 1 1 2 2 1 1 4governmental institute
Machine study 125 80 79 784 4 6 3 13 4 4 4 12 3 3 2 8
Visitors use with charges 204.5 140 85 429.5 3 2 1 6 0 0 0 5 3 3 11
Total 1161.5 819 548 2528.5 55 63 44 162 53 53 46 152 49 49 40 138
- 320 -
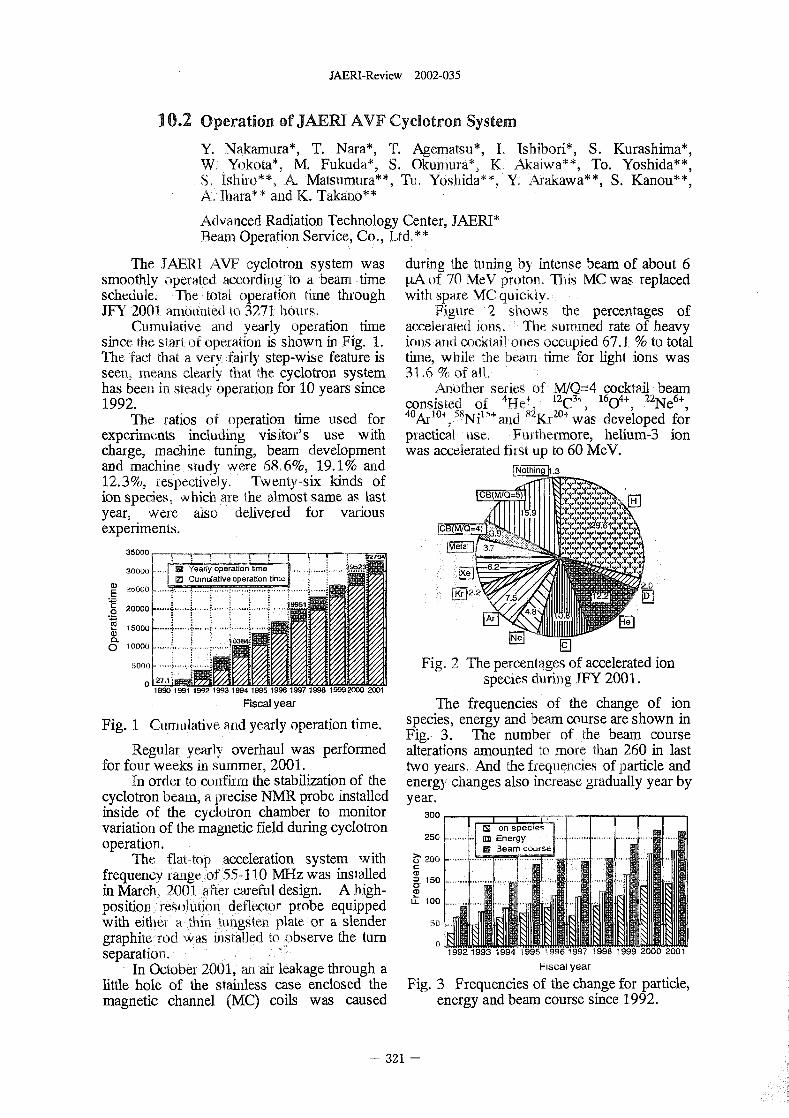
JAERI-Review 2002-035
10.2 Operation of JAERI AVF Cyclotron System
Y. Nakamura*, T. Nara*, T. Agematsu* I Ishibori*, S. Kurashima*,WI Yokota*, M. Fukuda*, S. Okumura*, K. Akalwa**, To. Yoshida**,S, lqhiro** A Matsumura", Tu. Yoshida", Y. Arakawa**, S. Kanou**,A. Iara* * and K. Takano* *
Advanced Radiation Technology Center, JAERIIBeam Operation Service, Co,, Ltd.**
The JAERI AVF cyclotron system was during the tuning by intense beam of about 6smoothly operated according to a beam time [tA of 70 MeV proton, This MC was replacedschedule, The total operation ffine through with spare MC quicklyJFY 2001 amounted to 3271 hurs. Figure 2 shows the percentages of
C"mulativ a yearly operation time accelerated ions, The smmed rate of heavysince the start of operation is shown in Fig. 1. ions and cocktail ones occupied 67,1 to totalThe fact that a very fairly step-wise feature is tirne wile te beam time for light ions wasseen, means clearly that the cyclotron system 31�6 of alt.has beer i teady operation for 10 years since Another series of MIQ=4 cocktail beam1992. 1 consisted of 4He + 12c3+ 16o4+ 22 Ne6+,
The, ratios of operation time used for 40AFJO+, 58Ni'5+ and 8Ki-204 was developed forexperiments including visitor's use with practical use. Furthermore, helium-3 ioncharge, achine tuning, beam development was accelerated first up to 60 MeV.and achine study were 66%, 19.1% and .312.3%, respectively. Twtnty-six kinds ofion species, which are the amost same as lastyear, were also delivered for variousexperiments. =4)
35000
30000 ...
CD 25000 DE20000 ...... .......
Co 150DU ....... ...... ......CL0 10000
5000 Fig. 2 Te percentages of accelerated iono L'-'., species during JFY 2001.
1990 1991 1992 1993 1994 1995 1996 1997 M 1999 2000 2001Fiscal year The frequencies of the change of ion
Fig. I Cumulative and yearly peration time. species, energy and beam course are shown inFig. 3 The number of the beam course
Regular yearly overhaul was performed alterations amounted to ore than 260 in lastfor four weeks in summer, 2001. two years, And the fequencies of particle and
In order to confiiin the stabilization of the energy changes also increase gradually year bycyclotron beam, a precise NMR probe installed year.inside of the cyclotron chamber to monitor 300variation of the magnetic field during cyclotron M Ion spec es
250 UM Energy ....operation. 0 Beam cuufse ............. .. ...... ........ .. ...The flat-tot) acceleration system with MO
frequency range of 55-110 MHz was installed a) 150 . ....... ...in March, 2001 after careful design. A igh- ')position resolution deflector probe equipped Lt 100with either a thin tungsten plate or a slender 5(graphite rod was 'installed to observe the turnseparation. 1 1992 1993 1994 1995 1996 1997 1990 1999 2000 2001
. In October 2001 a air leakage through a Fiscal yearlittle hole of the stainless case enclosed the Fig. 3 Frequencies of the change for particle,magnetic channel (MC) coils was caused energy and beam course since 1992.
- 321 -
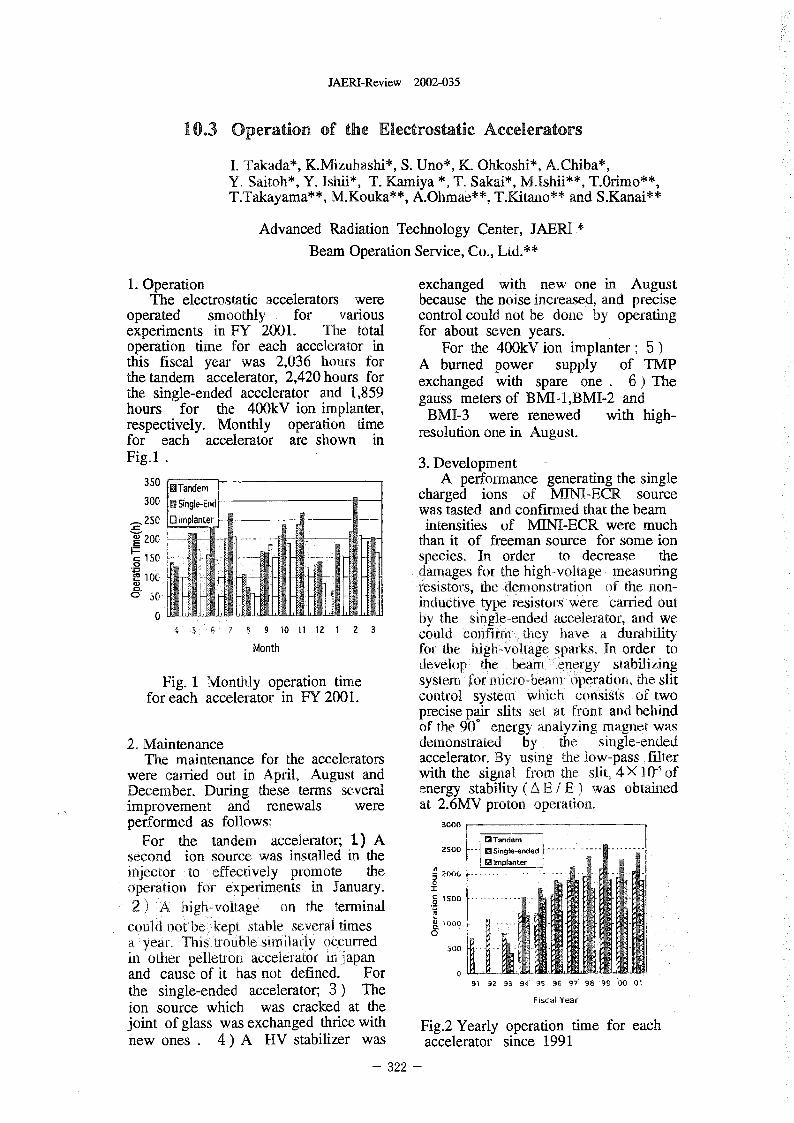
JAERI-Review 2002-035
10.3 Operation of the Electrostatic Accelerators
1. Takada*, K.Mizubashi*, S. Uno*, K. Ohkosbi*, A.Chiba*'Y� Saitoh*, Y. Ishii*, T. Kamiya *, T. Sakai*, M.Ishii**, T.Orimo**,T.Takayama**, M.Kouka**, A.Ohmae**, T.Kitaiio** and S.Kanai**
Advanced Radiation Technology Center, JAERI
Beam Operation Service, Co., Ld.**
1. Operation exchanged with new one in AugustThe electrostatic accelerators were because the noise increased, and precise
operated smoothly for various control could not be done by operatingexperiments in FY 2001. The total for about seven years.operation time for each accelerator in For the OkV ion implanter; this fiscal year was 2036 hours for A burned power supply of TMPthetandern accelerator, 2,420hours for exchanged with spare one 6 Thethe single-ended accelerator and 1859 gau .ss meters of BMI- 1,BMI-2 andhours for the kV ion implanter, BMI-3 were renewed with high-respectively. Monthly operation time resolution one in August.for each accelerator are shown inFig. 3. Development
350 IlTandern A performance generating the single300 5 Single-End charged ions of MNI-ECR source250 0 Implanter was tasted and confirmed tat the beam
intensities of MINI-ECR were muchE 200 -- than it of freeman source for some ionF-
150 species, In order to decrease theCo 10 damages for the high-voltage measuring0- resistors, the demonstration of the non
C� inductive type esistors were carried out
0 4 7 0 11 12 2 3 by te single-ended accelerator, and wecould onfi they have a durability
Month for the high-voltage sparks. In order todevelop the beam - �eflergy stabilizing
Fig. I Monthly operation time systeln formiero-bearn operationtheslitforeach accelerator in FY2001. control system which consists of two
precisepair slits set at front andbehindof the 90' energy analyzing magnet was
2. Maintenance demonstrated by the single-endedThe maintenance for the accelerators accelerator. By using te low-pass filter
were carried out in April, August and with the signal from te slit, X 10-'ofDecember. During these terms several energy tability( A I E ) was obtainedimprovement and renewals were at 2.6MV proton operation.performed as follows; 3000
For the tandem accelerator; 1 A Tandmm ------------ ........
n'in"'e-endedesecond ion source was installed in the 0 Implanter _J
i 'ector to effectively promote the A� 2000 ----------Di 0operatio f experiments in January. X-I Soo.22 A higli-voltage on the ten-ninal
100couldnotbe kept stable severaltimes CXa year. Thistroublesifflilarly occurred 0in other pelletr6ri accelerator aijapanand cause of it has not defined. For 0the single-ended accelerator; 3 The 91 92 93 9 95 .96 97 98 99 OC 01
ion source which was cracked at the Fiscal Yearjoint of glass was exchanged thrice with Fig.2 Yearly operation time for eachnew ones 4 A HV stabilizer was accelerator since 1991
- 322 -
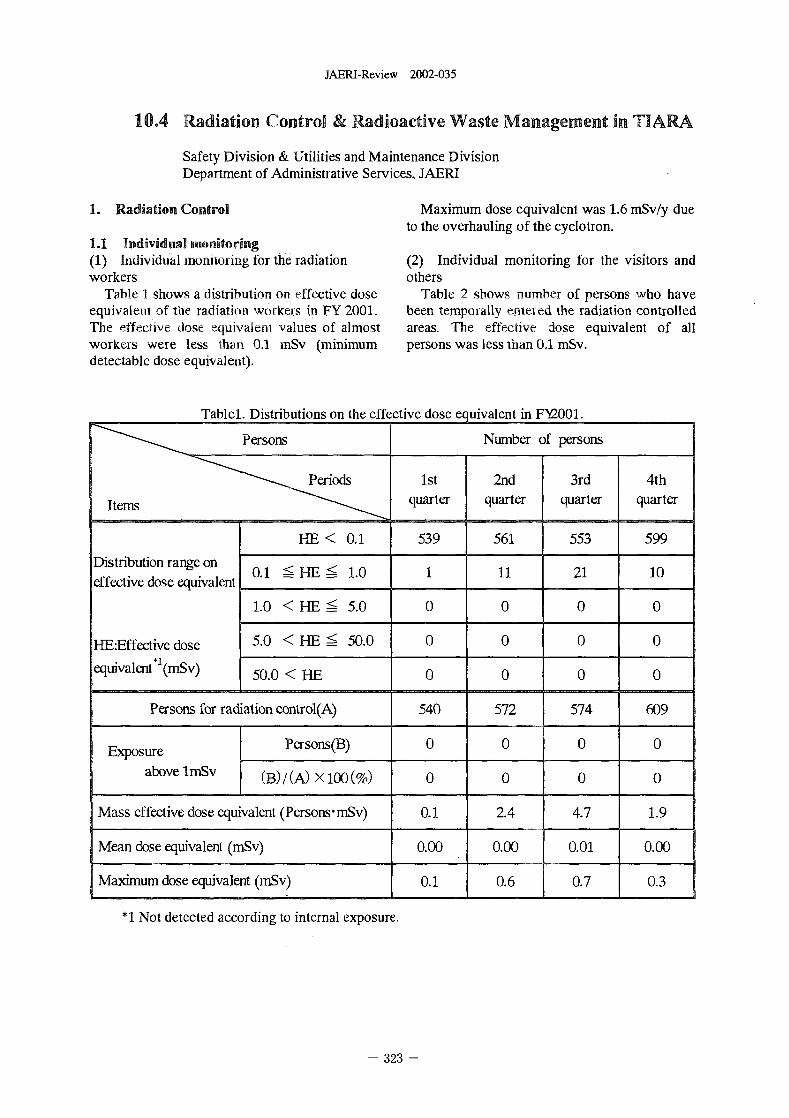
JAERI-Review 2002-035
10.4 adiation Control Radioactive Waste Management in TIARA
Safety Division Utilities and Maintenance DivisionDepartment of Administrative Services., JAERI
1. Radiation Control Maximum dose equivalent was 16 mSv/y dueto the overhauling of the cyclotron.
1.1 Individual monitoring(1) Individual monitoring for the radiation (2) Individual monitoring for the visitors andworkers others
Table I shows a distribution on effective dose Table 2 shows number of persons who haveequivalent Of the radiation workers in FY 2001. been temporally tnteved the radiation controlledThe effective (lose equivalent values of almost areas. The effective dose equivalent of allworkers were less than 0.1 mSv (minimum persons was less than 0.1 mSv.detectable dose equivalent).
Tablel. Distributions on the effective dose equivalent in F)2001.
Number of persons
P .ods 1st 2nd 3rd 4th
Items quarter quarter quarter quarter
HE < 0. 1 539 561 553 599
Distribution range on 0. 1 <- HE 1.0 1 1 1 21 10effective dose equivalent
1.0 < HE 5.0 0 0 0 0
HE:Effective dose 5.0 < HE 50.0 0 0 0 0
eqWvalent*'(mSv) 50. < HE 0 0 0 0
Persons for radiation control(A) 540 572 574 609
Exposure Persons(B) 0 0 0 0
above 1mSv (B) (A) X 100 W 0 0 0 0
Mass effective dose equivalent (Persons-mSv) 0.1 2.4 4.7 1.9
Mean dose euivalent (mSv) 0.00 0.00 0.01 0.00
Maximum dose equivalent (mSv) 0.1 1 0.6 1 0.7 0.3 1
*1 Not detected according to internal exposure.
- 323 -
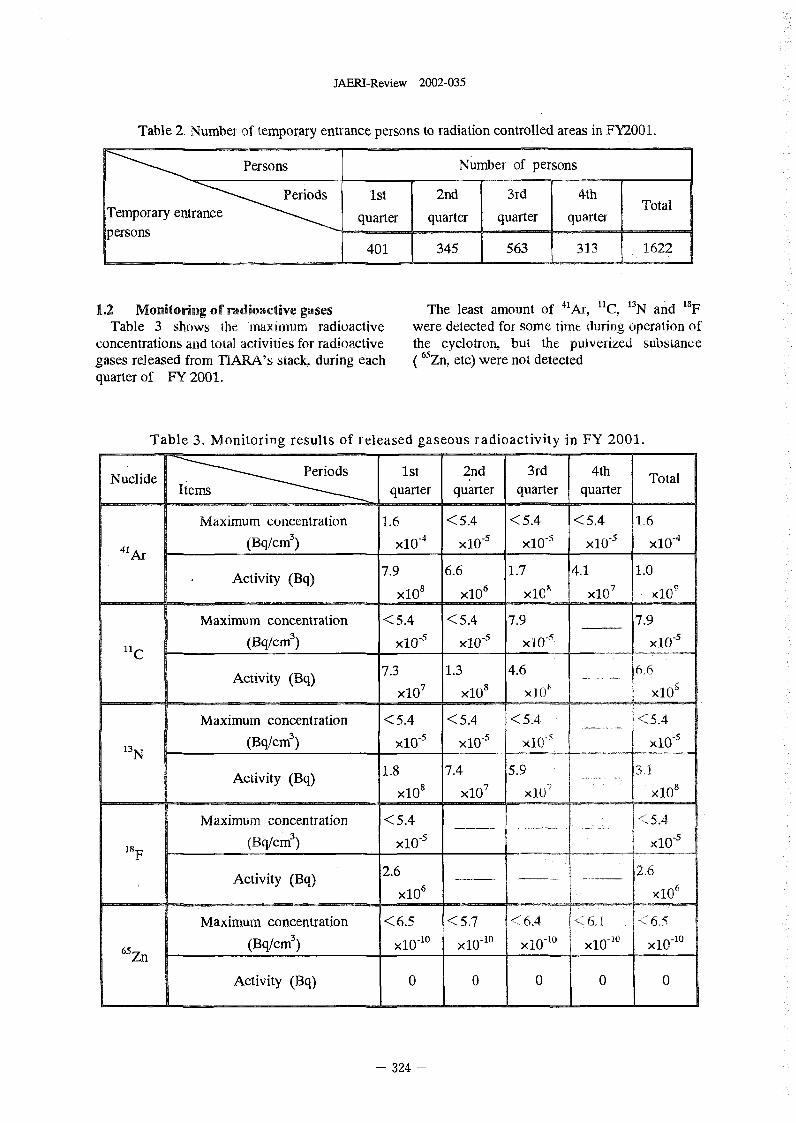
JAERI-Review 2002-035
Table 2 Number of temporary entrance persons to radiation controlled areas in FY2001,
Persons Number of persons
Periods Ist 2nd 3rd 4thorary entrance Totalquarter quarter quarter quarter
persons401 345 563 313 1622
1.2 Monitoring or radioactive gases The least amount of "Ai-, "C. N and 1FTable 3 sows the aximum radioactive were detected fof some tirne during operation of
concentrations ad total activities for radioactive the cyclotron, but the pulverized substancegases released from DARA's stack. during each 65 Zn, etc) were not detectedquarter of Y 2001.
Table 3 Monitoring results of released gaseous radioactivity in FY 2001.
1st 2nd 3rd 4thNuclide Totalquarter quarter quarter quarter
Maximum concentration 1.6 < 54 < 54 < 54 1�6
(Bq/crn�) X10-, X10-5 X10-1 X10-5 X10⁻⁴
41 Ar I7.9 6.6 1.7 4.1 1.0
Activity (Bq) X10 8 X106 x1c, X10 7 X10 9
Maximum concentration < 54 < 54 7.9 7.9(Bq /CM3) X10-1 X10-5 X10--', X10-5
C - ......
Activity (Bq) 7.3 1.3 4.6 6�6X107 X10, X10h X10 8
Maximum concentration < 54 < 54 < 5.4 < 54
(Bqfcm�) Xio-, X10-5 xio--� XIO-513N
Activity (Bq) 1.8 7.4 5.9 �IX10 X10, X10 X10
Maximum concentration < 54 < 545 5(Bq/crr�) X10, X10-
F2.6 2,6Activity (Bq) 6
X10 X10
Maximum concentration < 65 < 57 < 64 < 6 < 65
65 (Bq/Cm 3) X10-10 X10-10 X10 -10 X10-10 X10-10
Zn
Activity (Bq) 0 0 0 0 0
324 -
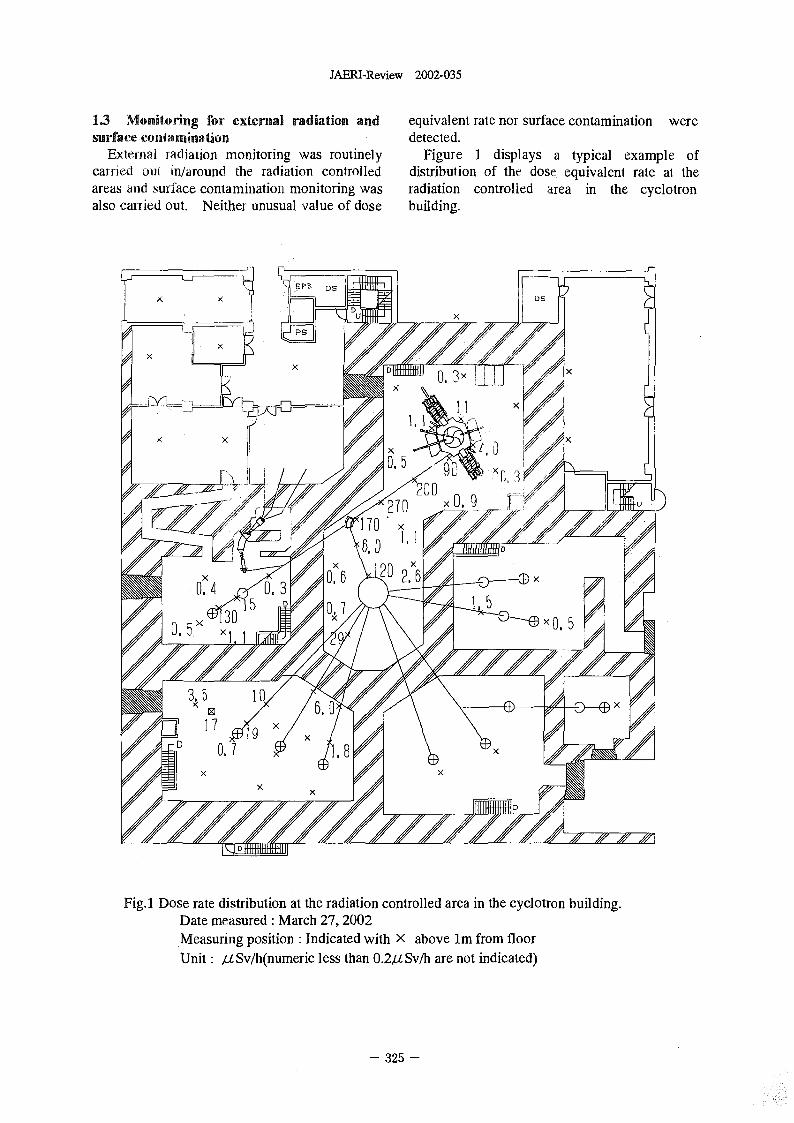
JAERI-Review 2002-035
1.3 Monitoring for external radiation and equivalent rate nor surface contamination weresurface contamination detected.
External adiation monitoring was routinely Figure displays a typical example ofcarried out in/around the radiation controlled distribution of the dose equivalent rate at theareas ad surface contamination monitoring was radiation controlled area in the cyclotronalso carried out. Neither unusual value of dose building.
DS
X
X
X XX
X
X X X X
XG3
D
X D. 2 XD. 4X 0 7 0 5
0. Xi. I
3 5X 1917 X
D D. 7 XX X 111MR
X X
FM D
Fig.1 Dose rate distribution at the radiation controlled area in the cyclotron building.Date measured March 27, 2002Measuring position Indic ated with X above 1m from floorUnit AtSv/h(numeric less than 0.2gSv/h are not indicated)
325 -
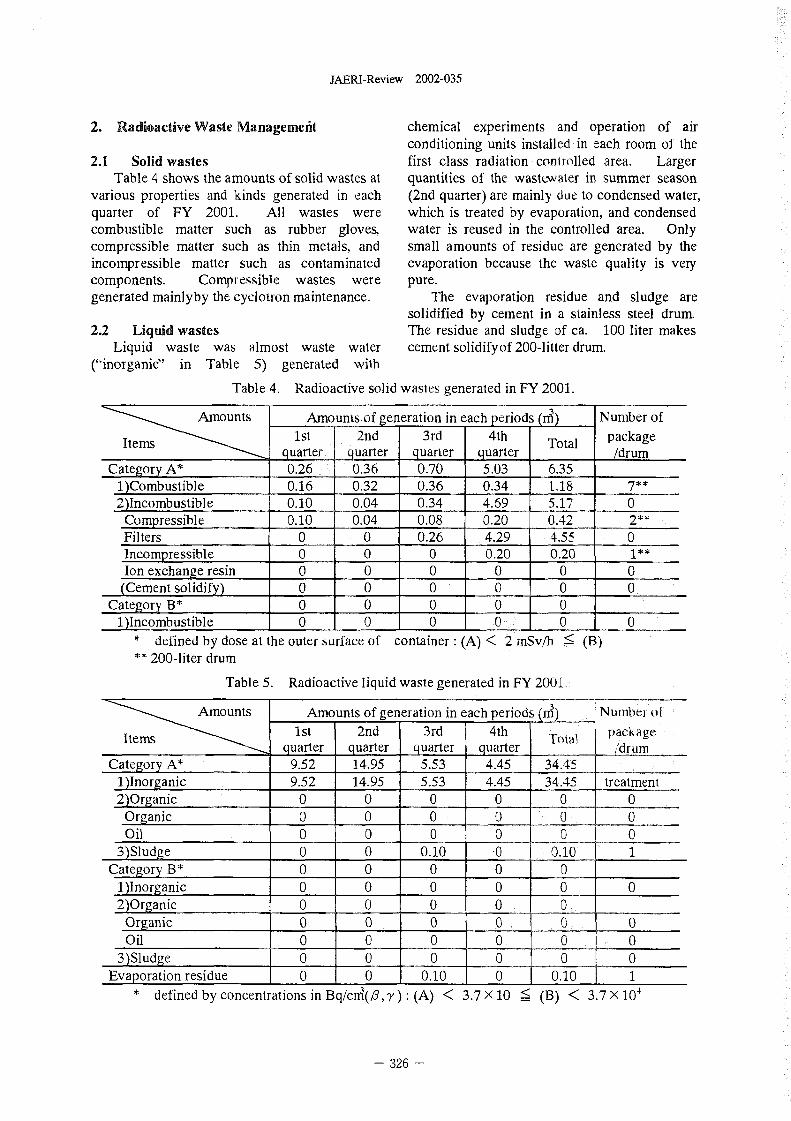
JAERI-Review 2002-035
2. Radioactive Waste Managemefit chemical experiments and operation of airconditioning units installed in each room of the
2.1 Solid wastes first class radiation controlled area. LargerTable 4 shows the amounts of solid wastes at quantities of the wastewater in summer season
various properties and kinds generated in each (2nd quarter) are mainly due to condensed water,quarter of FY 2001. All wastes were which is treated by evaporation, and condensedcombustible matter such as rubber gloves., water is reused in the controlled area. Onlycompressible matter such as thin metals.. and small amounts of residue are generated by theincompressible matter such as contaminated evaporation because the waste quality is verycomponents. Compressible wastes were pure.generated mainlyby the cyclotron maintenance. The evaporation residue and sludge are
solidified by cement in a stainless steel drum.2.2 Liqtdd wastes The residue and sludge of ca. 100 liter makes
Liquid waste was almost waste water cement solidifyof 200-litter drum.("inOTganic7l in Table 5) generated with
Table 4 Radioactive solid wastes generated in FY 2001.
3Amounts of ge eration in ach period M) Number of1st 2nd 3rd 4th tal package
quarter ___q�arter quarter quarter /drumCategory A* 0.26 0.36 0.70 5.03 6.35
1)Combustible 0.16 0.36 0.34 118 7**2)lncombustible 0.10 0.04 0.34 4.69 5.17 0
Compressible 0.10 0.04 0.08 0.20 0.42 2**Filters 0 0 26- 4.29 4.5K- 0Incompressible 0 0 0 0.20 0.20 1**Ion exchange resin 0 0 0 -0 0 0
(Cement solidity) 0 0 0 0 0 0Category B* 0 0 0 - 0
I)Incombustible 0 0 0 0defined by dose at the outer surface of container (A) < 2 nSv/b <- (B)
200-liter drum
Table 5. Radioactive liquid waste generated in FY 2001.
Amounts Amounts of generation in each period Number of
Items 1st 2nd 3rd 4th Total packagequarter quarter __q�arter quarter /drum
Category Al 9.52 14.95 5.53 4.45 34.451)lnorganic 9.52 14-95 5.53 4.45 34.45 treatment2)Organic 0 0 0 0 0 0
Organic 0 0 0 0 0 0Oil 0 0 0 0 0 0
3)Sludge 0 0 0.10 .0 0.10 1Category B* 0 0 0 0 0 1
I)InoManic 0 0 0 0 0 02)Organic 0 0 0 0
Organic 0 0 0 0 0 0Oil 0 0 0 0 0 0
3)Sludge 0 0 0 0 0 0Evaporation residue 0 0 0.10 0 0.10 1
defined by concentrations in Bq/cm'(,6 7): (A) < 37 10 <- (B < 37 X 104
- 326 -

JAERI-Review 2002-035
Appendix
Appendix 1. List of Publication ......................................... 329
ALI PublicationsinJoumal ........................................ 329
Al.2 Publications in Proceeding ...................................... '46
Appendix 2 Type of Research Collaboration ............................... 358
Appendix 3 Organization and Personnel of TIARA .......................... 360
327 -

This is a blank page.
JAERI-Review 2002-035
Appendix 1. LIST OF PUBLICATION
A-1.1 Publications inJounial
11.101 Solid Sta te Phenomena Vols. 78-79 2001) pp.
J.S.Laird, I Hirao H Mod S. Onoda, T Kamiya, 39S-400.
H. Itok T SCS 12001
Development of a new data ollection system
and chamber for microbeam and laser 11J05
investigations of single event phenomena, T. Olishima, H. Itoh M. Yoshikawa,
Nuclear Instruments and Methods in Physics Enhancement of Electrical Activation of
Research B 181 2001) 87-94. Aluminum Acceptors in 6H-SiC by
T SCS 12001 Co-implantation of Carbon Ions,
Materials Science Forum Vols. 353-356 2001)
11J02 575-578.
H. MorL T. Hirao, JS. Laird, S. Onoda, T Kamiya, I SCS 12003
H. Itok T Okamoto, Y KoizurnL
Investigation of single-event charge collection 11J06
from angled ion strikes. T Ohshinia, H. ItolL M. Yoshikawa,
Nuclear Instruments and Methods bi Physics Effect of gamma-ray irradiation on the
Research B 181 2001) 340-343. characteristics of 6H silicon carbide
T SCS 12001 metal-oxide-semiconductor field effect transistor
with hydrogen-annealed gate oxide,
11J03 J. Appl. Phys 90 2001) 3038-3041.
J.S.Laird, T Hirao, H. Mod S. Onoda, H. Itok I SCS 12003
A System for Ultra-Fast Transient Ion and Pulsed
Laser Current Microscopies as a Function of 11J07
Temperaturq T Olishima, A Uedono, H. Abe, Z. Q. Chen, H.
Solid State Phenomena Vols. 78-79 2001) pp. Itoh. M. Yoshikawa, K. Abe, 0. Eryu K
401-406. Nakashinia,
T SCS 12001 Positron Annihilation Study of Vacancy-Type
Defects in Silicon Carbide Co-Implanted. with
11J04 Aluminum and Carbon Ions,
T Hirao. J.S. Laird. H. Mori� S. Onoda, H. Itok Physica B 308-310 2001) 652-655.
The Investigation of Charge Transport Properties I SCS 12003
of SOI Sen-dconductor Devices Using a Heavy Ion
Microbeam, 11J08
329 -
JAERI-Review 2002-035
A, hL T. Ohshima, M. YoshikawaKKLee, M.
Iwami, H. Itok 11J12
Post-ImplantationAnnealing Effects on the S. Kitamura, M. Inoue.. N. Shilazono and A
Surface Morphology and Electrical Characteristics Tanaka,
of 6H-SiC Implanted with Aluminum, Relationships among Nicotiam species revealed
Materials Science Forum 389-393 2002) by the 5S rDNA spacer sequence and fluorescence
831-834. in situ hybridization,
I SCS 12003 TheorAppl. Genet. 103,678-686(2001).
0 BIT 11006
11JO9
T Olishima. K K Lee, A Ohi� M. Yoshikawa, H. IIJ13
Itok K Hamada, M. Inoue, A Tanaka and H.
Gamma-Ray Irradiation Effects on the Electrical Watanabe,
Characteristics of 6H-SiC MOSFETs with Potato virus Y-resistance in the progeny of haploid
Annealed Gate-Oxide., mutants obtained by the culture of Nicotiana
Materials Science Forum 389-393 (2002) tabacum. L. anthers exposed to ion beams
1093-1096. Plant Biotechnology 18, 251-257(2001).
I SCS 12003 C BIT 11006
11J10 11J14
K K Lee, I Ohshima, H. ItolL Y Nomura, M. Hatashita and M. Ioue�
Radiation Response of p.-Channel 6H-SiC Production of self-compatible
MOSFETs Fabricated Using Pyrogenic buckwheat by ion exposure,
Conditions., FAGOPYRUM (2002) in press.
Materials Science Forum 389-393 (2002) C BIT 11006
1097-1100.
1 SCS 12003 11J15
Y Hase, M. Yamaguchi� M. Inoue and A Tanaka,
Hill Reduction of surval and induction of chromosome
K Shiniono, N. Shikazono. M. Inoue, A Tanaka aberrations in tobacco irradiated by carbon ions
and H. Watanabe, with different LEI's,
Effect of fractionated exposure to carbon ions on Int. J. Radiat. Biol. 2002) in press.
the frequency of chromosome C BIT 11006
aberrations in tobacco root cells
Radiat. Environ. Biophys. 40,221-225(2001). 11J16
C BIT 11006 M. Inoue,
- 330 -
JAERI-Review 2002-035
Biological actions of ion beams (2002)-
- Biotechnological approach and utilization, C BIT 11018
Radiation & Industries 92,30-35 2001).
0 BIT 01009,02017 11J21
T. Yoneyama, H.YKini, H.Morikawa and H. S.
11J17 Srivastava,
M.Takahashi� Y SasakL S. Ida and H. Morikawa, Metabolism and detoxification of nitrogen dioxide
Enrichment of nitrite reductase gene improves the and ammonia in plants,
ability of Arabidopsis thaliana plants to assimilate In Air Pollution and Biotechnology in Plants ed.
nitrogen dioxide� by K. Oomasa et al.,
Plant Physiol., 126(2): 731-741 200 1). Springer-Verlag, pp. 221-234 2002).
C BIT 11018 C BIT 11018
HJ18 11J22
K. Shimizu, M. TakahashL N. Goshima, S. Y Kawamura, K. Fukunaga A Urnehara M.
KawakamL K. Irifune and H. Morikawa, Takahashi and H. Morikawa,
Presence of an SAR-like sequence in junction Selection of Rhododendron mucronatum plants
regions between an introduced transgene and that ave a gh capacity for nitrogen dioxide
genornic DNA of cultured tobacco cells: its effect uptake,
on transformation frequency Acta Bioiechnolqgica, 22:113 120 2002).
PlantJournal, 26(4):375-384(2001). C BIT 11018
C BIT 11018
11J23
IIJ19 H. Morikawa, M. Takahashi and Y Kawamura.
H. Morikawa and M. Takahashi� Metabolism of nitrogen dioxide in
Remediation of Soil, Water and Air by Naturally plants-Assimilation, dissimilation and novel
Occurring andTransgenic Plants, metabolites,
Gwnnia FL-IdSymposia, 39:81-101 2001). Physiology and Molecular Biology of Plants. 8(1)
C BrF 11018 19-29 2002).
C BIT 1101 8
11J20
H. Morikawa, M.Takahashi and GArimura. 1IJ24
Manipulation of genes for nitrogen metabolism in A. Sakamoto, M. Ueda & H. Mor&a%�
plants. Arabidopsis glutathione-dependent formaldehyde
In Air Pollution and Biotechnology in Plants. Ed dehydrogenase is an S-nitrosoglutathione
by K. Oomasa et al-Springer-Verlag, pp. 383-401 reductase,
331 -
JAERI-Review 2002-035
FEBSLett. 515:20-24 2002). 11J29
C BIT 11018 S. Wada, Y Kobayashi T Funayarna and K
Yamamoto,
IIJ25 Detection of DNA damage in the individual cells
K Kondo, M. Takahashi and H Morikawa, induced by heavy ion microbearn irradiation with
Regeneration and transformation of a roadside tree the comet assay
PittosporumtobiraA J. Radiation Research, 42,449(2001).
Plant Biotechnol., 19(2) 135-139 2002).
C BIT 11018 C BIT 11025
11J26 11J30
M. Maekawa A Tanaka, N. Shikazono and Y T Kawachi� C. NisNo H Fujikake, A L. Salwa,
Hase� N. Ohtake, K Sueyoshi� TOhyama, N. S. Ishioka,
Somatic reversion induced by ion beam irradiation S Watanabe, A Osa, T. Sekine, S. Matsuhashim T.
in stable yellow leaf mutant of rice, Ito, C Mizuniwa T Kurne, S. Hashimoto H.
Rice Genetics Nensletter 18: 36-39(2001). Uchida, and A.Tsuji
C BIT 11021 A Effects of anion channel Blockers on xylem
nitrate transport in barley seedlings
11J27 Soil ScL PlantNutri, 48,271-277(2002).
Y KobayasK T Funayarna, M. Taguchi� S. Wada, C BIT 11030
M. Tanaka, T. Kamiya, W Yokota, H. Watanabe
and K. Yamamoto, 11J31
Cell Irradiation System with a Single or Precise N. Bughio, H. Nakanishi� S. Kiyomiya S.
Numbers of Heavy Ions using a Collimated Heavy Matsuhashi� N. S. Ishioka, S. Watanbe, H. Uchida,
Ion Microbeam at TIARA JAERI Takasakj A Tsqji A Osa T Kume, S. Hashimoto, I
J. Radiation Research, 42,449(2001). Sekine, and S. MorL
C BIT 11025 Real-time [llqmethionine translocation in barley
in rlation to mugineic acid phytosiderophore
11J28 biosynthesis.,
T Funayama, Y Kobayashi� M. Taguchi, S. Wada, Planta, 213,708-715(2001).
M. Tanaka and K Yamamoto, C BIT 11031
Irradiation of Collimated Heavy Ion Beams on
Individual Cells, 11J32
J Radiation Research, 42,449(2001). S. Kiyon-iiya, H. Nakanisbi� H. Uchida, A Tsuj S.
C BIT 11025 Nishiyama, H. 1�ukda, N. S. Ishioka, S. Watanabe,
A Osa, C. Mizuniwa, S. Matsuhashi, S.
- 332 -
JAERI-Review 2002-035
Hashimoto, T. Sekine, and S. MorL C RCO 11037
Light activates 2150 low in rice - Detailed
monitoring using a positron-ernitting tracer 11J36
imaging system (PEIIS� S. Takahashi M. Yoshida, M. Asano T Tanaka,
PhysiologiaPlantarwn 113.359-367(2001). and T Nakagawa,
C BIT 11031 Effect of heavy-ion irradiation on the gas
permeability of poly(ethylene terephthalate)
11J33 (PEI') membranes
T M. Nakanishi, TanoL M. Yokota, S. Ueoka, J. Appl. Polym Sci., 82,206-216(2001).
N. S. shioka, S. Watanabe, A Osa. T. Sekine, C RCO 11037
Tho T Mizuniwa, S. Matsuhashi S. Hashimoto,
H. Uchida and A Tsuji., 11J37
'8F'Used as Tcer to Study Water Uptake and J. LL Yasunari Maekawa, Tetsuya Namald,
Transport Imaging ot a Cowpea Masaru Yoshida,
J.Radioanal. and Nucl. Chent. 249(2). 503-507 Chemical Modification of a Poly(ethylene
(2001). terephthalate) Surface by Selective Alkylation of
C BIT 11033 Acid Salts,
Macmnwl. Chem Phys., in press(2002).
11J34 C RCO 11 038
J. Furukawa, H. Yokota. Tanoi� S. Ueoka S.
MatsuhashL N. S.Ishioka. S. Watanabe, H. Uchida, 11J38
A TsujL T Ito, T Mizuniwa, A Osa, T Sekine. S. S. Seki, Y MatsuL Y Yoshida, S. Tagav.-a. J.R-
Hashimoto and T. M. Nakanishi Koe, M. Fujiki.
Vanadium Uptake Manner and an Effect of Dynamics of Cherge Carriers on
Vanadium Treatment on 18F-Labeled Water Poly[bis(p-alkylphenyl)sflanels by Electron Beam
Movement in a Cowpea Plant by Positron Pulse Radiolysis,
Emitting Tracer Imaging System (PETIS) J. Phys. Chem. B 106 2002) 6849-6852.
JRadioanaL and NucL Chem. 249(2). 495-498 C RCO 11039
(2001).
C BIT 11033 1IJ39
Y Matsui S. Seki. and S. Tagav,-a.
11J35 Direct Observation of Intramolecular Energy
K Ogura. M. Asano, N. Yasuda and M. Yoshida, Migration in s-conjugated Polymer by
Properties of TN-1 track etch detector, Fernto-second Laser Flash Photolysis
NucL u7str and Meth. In Phys. Res. 185 Chem Phys. Len 357 2002) 346-350.
222-227(2001). C RCO 11039
- 333 -
JAERI-Review 2002-035
Radiation Effects on Branching Polysflane�
11J40 Radiat. Phys. Chem 60 2001) 461466.
EC. Grozema, L.D.A. Siebbeles, J.M. Warman, S. C RCO 11039
Seki, S. Tagawa, and U. Scherf,
Hole Conduction along Molecular Wkes: 1IJ45
s-Bonded Silicon versus p-Bond-Conjugated S. Seld, Y KunimL K Nishida, Y Yoshida, and S.
Carbon, Tagawa,
Adv Mater 14 2002) 228-231. Electronic State of Radical Anions on
C RCO 11039 Poly(methyl-n-propylsflane) Studied by Low
Temperature Pulse Radiolysis.,
1IJ41 J. Phys. Chem. B 105 2001) 900-904.
S. SekL S. TsujL Y Matui� and S. Tagawa, C RCO 11039
Dynamics of Silylenes in Polysilylenes with
Structural Defects by Excimer Laser Flash 1IJ46
Photolysis, S. SU Y Yoshida, and S. Tagawa,
Chem Lett 2001) 1208-1209. Charged Radicals of Polysilane Derivatives
C RCO 11039 Studied by Pulse Radiolysis,
Radiat. Phys. Chem 60 2001) 411-415.
1IJ42 C RCO 11039
S. Se" K Maeda, S. Tagawa, H. Kudoh, M.
Sugimoto, Y Morita, and H. Shibata, 11J47
Formation of Quantum Wires along Ion Projectiles S. Seki, Y Kunimt K Nishida, K Aramaki, and S.
in Si Backbone Polymers., Tagawa,
Adv Mater 13 2001) 1663-1665. Optical Properties of Pyrrolyl-substituted
C RCO 11039 Polysilanes,
J OrganonzeL Chen L 611 2000) 62-68.
1IJ43 C RCO 11039
Y Yoshida. Y Mizutani T Kozawa. A SaeU S.
Seki S. Tagawa. and K Ushida, 1IJ48
Development of Laser-synchronized Picosecond Y KunimL S. Seld. M. Tashiro, and S. Tagawa,
Pulse Radiolysis System, Free Volume in Poly(n-alkylphenylsfiane) Probed
Radiat. Phys. Chem 60 2001) 313-318. by Positron Annihilation,
C RCO 11039 J. Photopolym Sci TechnoL 13 2000) 723-726.
C RCO 11039
1 U44
K Maeda, S. Seki, S. Tagawa, and H. Shibata, IIJ49
- 334 -
JAERI-Review 2002-035
S. Seki� Y SakuraL K Maeda, Y Kunimi� and S. J. Nud Maier., 2002) in press.
Tagawa, C NM 11005
Studies on the Negative Resist Material Based on
Polysilanes for EB and X-ray Lithography 11J54
Jpn. J. Appl. Phys. 39 2000) 4225-4230. E WakaL K Furuya, M. Sato, K Oka, N. Tanaka
C RCO 11039 Ohnuki, Y Kato, E Takada and T SawA
Effect of helium on ductile-brittle transition
HJ50 behavior in reduced-activation 8Cr-2W
M. Taguchi M. Moriyania, H. Namba, and H. martensitic stee;
Hiratsuka, J. Nucl. Maier., accepted
Yield of acridine Gradical produced by irradiation C NM 11005
with energetic heavy iom
Radiat. Phys. Chem., 64,115 122(2002). 11J55
C RCO 11040 E. Waka T Sawaj ANaito and S. Jitsukawa,
Microstrucutural development and swelling
11J51 behavior of 82H steel irradiated by dual ion
H. Koizurni, M. Taguch Y KobayashL and T beam&
Ichikawa, J. Electron Microscope, 51(2002)S239.
Crossliking of polyimethylsfioxane in heavy ion TS NM 12010
tracks.
Nucl, Instr And Meth. B 179 2001) 530-535. 11.156
C ROD 11041 T. SawaL E Wakai� A Naito and S. Jitsukawa
Swellmg behavior of TIGwelded F82H IEA heat,
11J52 J. Nud Maier, 2002) in press.
T.Hirose, H.Tanigawa, M.Ando, AKohyama, TSI NM 12010
Katoh and M. Narui�
Radiationeffectsonlow cyclefatigueproperties 11J57
ofreducedactivation ferritic/martensificsteels, E Waka T SawA K Furuya A Naito, S.
J. Nucl. Maier., 2002) in press. Yamashita, S. Ohnuki S. Yamamoto H.
C NM 11005 Naramoto, T. Auga and S. Jitsukawa.
Effect of Triple Ion Beams in Ferritic/Martensific
11.153 Steel on Swelling Behavior,
H. Tanigawa, T. Hirose., M.AndoSJistukawa. J. Nucl. Maier., 2002) in press.
Y Katoh and A Kohyarna, TSI NM 12010
Microstructural analysis of mechanical-tested
reduced activation ferrific/niartenstic steels, 1IJ58
335 -
JAERI-Review 2002-035
E. WakaL T. SawaL M. Ando, T. Aruga, K Oka, S. K Morishita, T Diaz de la Rubia E Alonso N.
Ohnuki S. Yamamoto, H. Naramoto, FL Tanigawa. Sekimura and N. Yoshida,
K Kikuchi and S. Jitsukawa.. AMolecular Dynamics Simulation Study of Small
Swelling behavior of F82H steel irradiated by Cluster Formation and Migration in Metals
triple/dual ion beam Jow-nal of Nuclear Materials 283-287 2000)
J. Nucl. Mater., 2002). accepted pp.753-757.
TSI NM 12010 TSI IOM 12009
11J59 11J63
1. Mukouda and Y Shimornura, T Okita. N. Sekimura T Satoh F A Garner and
AnmIfflation of Interstitial Atoms to Dislocations L R Greenwood
in Neutron-irradiated Cu. and Ni at High The Primary Origin of Dose Rate Effects on
Temperature, Microstructural Evolution of Austenitic Aoys
Materials Science Engineering- A309-310. during Neutron Iradiation
(2001)190-197. to be published inJow-nal offuclear Materials.
T I S IOM 12008 TSI IOM 12009
11J60 1IJ64
N. Sekimura, S. Yonamine, T. IwaL Y Ar A T Satok N. Sekimura and T. Okita,
Naito, Y Miwa and S. Hamada. Effects of Solid Tnsmutation and Helium on
Synergistic Effects of Hydrogen and Helium on Microstructural Evolution in Neutron-kradiated
Microstructural Evolution in Vanadium Alloys by Vanadium,
Triple Ion Beam Irradiation to be published inJow-nal offuclear Materials.
Journal of Nuclear Materials 283-287 2000) TSI IOM 12009
pp.224-228.
TSI IOM 12009 11J65
T Kamada. Y Wakasugi T Okita. Y Arai and N.
11J61 Sekimura,
T Okita, T. Karnada and N. Sekimura, Irradiation Hardaning in Ferritic Steels under
Effects of Dose Rate on Microstructural Evolution Heavy Ion Irradiation by Sall Indentation
and Swelling under Neutron Irradiation to be published inJow-nal offuclear Materials.
Jow-nal of Nuclear Materials 283-287 2000) TSI IOM 12009
pp.220-223.
TSI IOM 12009 IIJ66
F. A Garner, M, L. Hamilton. B. H. Sencer T.
11J62 Okita, N. Sekimura, D. L. Porter, T R. Aen and
- 336 -
JAERI-Review 2002-035
W G Wolfer,
The Surprisingly Large Muence of Displacement 11J71
Rate on the Swelling of Pure Metals. Fe-based H. -S. Lee, H. Okada, A Wakahara, A Yoshida, T
FCC and BCC Alloys, and Vanadium Alloys, Ohshima, H. Itoh, S. Kawakita, M. ImaizumL and
to be published inJournal ofNuclear Materials. S. Matsuda,
TSI IOM 12009 Effect of proton irradiation on electrical properties
of CuInSe2 thin films,
11J67Solar energy materials & solar cells in press.
F Kano, A Naito and 1. loka,I SCS 12004
Effects of Initial Grain Boundary Segregation on
Radiation-Induced Segregation in Stainless Steels, IIJ72
J of Nucl. Mat. To be published. T Yaniaki� T Sumita. S. Yamamoto,
T IOM 12016Formation of O2-xFx Compounds in Fluorine
lrrwlanted=�,
11368 J. Mater ScL Leu., 21 2002) 33.
K Yasuda, C. Kinoshita and S. Matsumura,ISO IOM 12025
Effects of SimWtaneous Displacive and Ionizing
Radiation in Ionic and Covalent Crystals,11J73
Defect and Diffusion in Ceramics 2002) p53 -74. S. Yamamoto, T. Surnita, T. Yarnaki A Miyashita,
I 10M 12020H. Nararnoto,
Characterization of Epitaxial TiO- Flms Prepared
11J69by Pulsed Laser Deposition,
K Yasuda, T. Higuchi K Shiiyama, C. Kinosita,J. Cryst. Growth, 237-239(2002) 569.
K Tanaka and M. Kutsuwada,ISO IOM 12025
Effects of electric field on the aggregation of point
defects in ion-irradiated a A1,03, IlJ74
subn-dtted to Philos. Mag. Lett. T YamaU T Sumita. S. Yamamoto, A Miyashita,
I IOM 12020 Preparation of Epitaxial TiO Fms by PD for
PhotocatalystApplications.,
11J70 J. Cryst. Growth, 237-239(2002) 574.
* Nakanishi, A Wakahara, H. Okada, A.Yoshida,ISO IOM 12025
* Ohshima, and H. Itoh.
Effect of 3MeV electron irradiation on IIJ75
photoluminescence properties ofEu-doped GaNT Umebayashi� T Yamaki� H. Itok K Asai
submitted to Appl. Phys. Lett.Band-Gap Narrowing of Titanium Dioxide by
I SCS 12004 Sulfur Doping,
- 337 -
JAERI-Review 2002-035
APPI Phys. LetL. 81 2002) 454. Preparation of Highly Active 2 Photocatalyst
ISO IOM 12025 Fflnis by Controlling the Oxygen Pressure,
Appl. Surf Sci, in press.
11J76 ISO IOM 12025
T Umebayashi T YamaU H. Itoh, K AsaL
Analysis of Electronic Structures of 3d Transition 11J81
Metal-Doped TiO, Based on Band Calculations. K Narurni and H. Naramoto,
J Phys. Chem. Solids, in press. Modification of C60 Thin Films by Ion Irradiaion
ISO IOM 12025 Sudke and Coatings Technology 158-159C
(2002) 363-366.
11M T IOKMAN, 12030
I Surnita, T.YaniakL S.Yamamoto, A Miyasita,
Photo-Induced Surface Charge Separation of 1IJ82
Highly Oriented TiO, Anatase and Rutile Thin Y ChimL K Adachi A Iwase, N. shikawa, K
Films, Yamakawa.
Appl. Surf Sc�, in press. Thenrial relaxation of hydrogen disorering in
ISO IOM 12025 Pd-H system irradiated with high energy particles,
J. Alloys and Comounds 330-332 2002) 187.
11J78 S IOM 12032
T. Sumita, T.YamaU S.Yamamoto, A Miyasita.
Photo-Induced Surface Carge Separation in 1IJ83
Cr-Implanted TiO, Thin Film, Y ChimL A Iwase, N. Ishikawa T Kambara.
Thin SolidFilhis, in press. Defect production induced by electronic excitation
ISO IOM 12025 in iron.
Nucl. Insh-um Methods 193 2002) 248.
11J79 S IOM 12034
R. Shinohara, I Yamaki S. Yamamoto, H. Itoh. K
Asat IIJ84
High-Quality Epitaxial TiO, Films Grown on S. Ishino,
-A1,O, Substrates by Purlsed Laser Deposition, Historical Survey of the Study of Radiation
J. Mater Sci. Left., in press. Damage Mechanisms of Reactor Pressure Vessel
ISO IOM 12025 Steels,
Kinzolat (Metals Technologies) 71(2001) 719
iiiso (inJapanese)
D.G Syarif, A Miyashita. T.YamaU TSurnita. Y 0 IOM 12035
ChoL H. Itoh.
- 338 -
JAERI-Review 2002-035
11J85 In-situ TEM observation of nucleation and growth
N. Soneda, S. shino, T. Diaz de la Rubia, of spherical graphitic clusters under ion
VacancyLoopFormationby 'CascadeCollapse' implantation.
in a -Fe: AMolecular Dynamics Study of So keV J Electron Microscopy 51 2002) s183.
Cascades., I IOM 12019
Philos. Mag. Lea 81(2001) 649.
0 IOM 12035 11J90
D. Huh. ovd K HosoL S. Kuroda, H. Abe, A
11J86 Oya�
K Morita, S. Ishino.; T. Tobita, Y Chira N. Carbon nanotubes; prepared from polymer
Ishikawa, A Iwase, rnicroshperes; by spinning and carbonizing
Use of high energy ions for the mechanistic study Mol. CrysL Liq. CrysLAccepted.
of irradiation embrittlement in pressure vessel I IOM 12019
steels using Fe-Cu model alloys,
Journal offuclear Materials., 2002) in press. 11J91
0 IOM 12035 Y ChoL S. Yamamoto, H. Abe, H. hoh,
Effect of annealing and quenching treatments on
11J87 reconstruction of rutile thin fms on sapphire
A Iwase, T Hasegawa. Y ChimL T Tobita, N. substrates,
IshJkawa, M. Suzuki T Kambara. S.1shino, Suiftice Scienca 499 (2002) 203 -209.
Hardening of Fe-Cu alloys by. swift heavy ion I IOM 12019
irradiators
Nuclear Insirments and Methods in Physics 11J92
Research B., (2002) in press. D. Huli. ovd, K. HosoL S. Kuroda, H. Abe. A
O IOM 12035 Oya,
Carbon nanotubes prepared by spinr�ing and
IIJ88 carbonizing fine core/slr1l polymer microsphere&
M. Ishino. 0. Yoda. Y HaishL E Arimoto, M. Advanced Materials 14 (2002) 452-455.
Takeda, S. Watanabe. S. Ohnuki H. Abe I IOM 12019
Boundary structure of Mo/Si multilayers for soft
X-ray mirrors 1IJ93
Jpn. J. Appl. Phys. 41 (2002) 3052-3056 H. Abe., S. Yamamoto A Miyashita, K.E.
I IOM 12019 Sickafus,
Formation mechanisms of carbon onions and
1 IJ89 nanocapsules in C+- ion implanted copper
H. Abe, S. Yamamoto, A Miyashita, J. Appl. Phys 90 (2001) 3353-3358.
- 339 -
JAERI-Review 2002-035
I 10M 12019 11J98
S. Yamamoto, T. Sumita, Sugiharuto, A Miyashita
11J94 and H. Naramoto,
H. Abe, Preparation of epitaxial TiO fms by pulsed laser
Nucleation of carbon onions and nanocapsules deposition technique;
under ion implantation at high temperaturq Thin SoAdFdnis 401 2001) 88-93.
Diamond and Related Materials 10 S IOM 12023
(2001)1201-1204.
1 IOM 12019 HJ99
S. Yamamoto, T. Surnita, T YamakL A Miyashita
IIJ95 and H. Naramotq
E. Waka A Hishinuma, H. Abe, S. Takag K Characterization of epitaxial Ti fms prepared
Abilco, by pulsed laser deposition
Microstructural evolution of Fe-5OCr-xW model J. Crystal Growth 237-239(2002) 569-573.
alloys during Fe+ ion Irradiation S IOM 12023
Materials transaction JIM vol.41, No.9 2000)
1176-1179. 11.1100
I IOM 12019 S. Yamamoto, H. Naramoto,
RBS/channeling analysis of epitaxial fms with
11J96 Nb buffer layer on sapphire substrate,
Y Kasukabe� R TanL H. Abe., Y Yamada. Nucl. Instr Meth. B 190 2002) 657-660.
In-situ transmission electron icroscopy and S IOM 12023
electron energy loss spxtroscopy observation of
TiN grown by N-implantation, W101
Jpn. J. Appl. Phys. 39 2000) 4395-4399. Y ChoL S.Yamamoto, H. Abe, H. Itoh,
I IOM 12019 Effects of annealing and quenching treatments on
reconstruction of rutile thin films on sapphire
11.197 substrates,
K. Yasuda, C. Kinoshita, M. Ohmura, H. Abe, Swjace Science 499 2002) 203-209.
Production and stability of dislocation loops in an S 10M 12023
MgO-A1203 system under concurrent irradiati(n
,with iorks and electrons, 11J102
Nucl sir and Meth. in Phys. Res. B166-167 H. Kudo,
(2000) 107-114. Ion-Induced Electron Eission from Crystalline
I 10M 12019 Solids,
(Springer Tracts in Modem Physics Vol. 175, 161
- 340 -
JAERI-Review 2002-035
pages, 5 figS.) SpTiDger, Berlin. Heidelberg, 2002.
T I 0 MAN 12026 11J107
H. Naramoto, YXu. K.Narumi X Zhu, J. Vac S.
11J1,03 Yamamoto and K. Miyashita.
Hiroshi Kudo, Katsuhiro Haruyarna. Takao Modification of Carbon Related Fms mrith
Kinoshita, Seiji Sek� Kazurnasa Narmi� Hiroshi Energy Beams,
Naramoto, Mat. Res. Soc. Proc. 647 2001) 05.18.1-05.18.
Carbon KVV Auger electron emission from 6.
highly oriented pyrolytic graphite bombarded by T S IOM 12029
fast ions,
NucL Instrum. Methods B190 2002) 160-163. 11J108
S 0 MAN 12026 X. Zhu, Y H Xu, H. Naramoto, K Narumi and
K Miyashita,
11J104 Role of simultaneous Ne+ ion bombardment in
K Takahiro, N. Takeshima, K.Kawatsura, S. preparing carbon films from Qo fullerene,
Nagata, S. Yamamoto, H. Naramoto, J. Phys.:CondensedMatter 14 2002) 5083-5090.
Irradiation-induced improvement of crystalline 0 IOM
quality of epitaxial Cu/Si(100 flm
Suiftice and Coating Technology, in press. IIJ109
0 IOM 12027 X D. hz, H. Naramoto Y H. Xu, K Narumi�
and K. Miyashita,
11J105. Tuning Surface Morphologies of on-Assisted
J. Vacik. H.Naramoto K NarumL S. Yamamoto Diamond-like Carbon Film on Nanometer Scale,
and K. Miyashita, JChemical Physics 116 2002) 10458-10461.
Pattern Formation Induced by Cadeposition of Ni 0 IOM
and Qo on MgO(100�
J. Chemical Physics 114 2001) 9115-9119. 11J110
0 IOM V Laverentiev, H. Abe, S. Yamamoto, H.
Naramoto, and K. NarumL
11J106 Formation of carbon nanotubes under conditions
H. Naramoto X D. Zhz, J. Vacik, Y H. Xu K of CO+CW film
NarumL S. Yamamoto, K Miyashita, Physica B.- Condensed Matter 2002) in print.
Allotropic Conversion of Carbon-related Films by 0 IOM
Using Energy Beam
Physics of the Solid State 44 2002) 668-673. Will
T S IOM 12029 Y Xu, K Narum K Miyasbita, and H.
- 341 -
JAERI-Review 2002-035
Naramoto, NucL Instr and Moth. in Phys. Res. B, in press.
AFM Observation of Nanosized SiC Dots T RCO 12040
Prepared by Ion Beam Depositiom
Sla*e andInterfaceAnalysis in press. 11J116
0 IOM T YamaguchL E. Watanabe, T Souno H.
Nishikawa M Hattori Y Olfld T Kamiya K
11J112 Arakawa,
V Laverentiev. H. Abe, S. Yamamoto, H. Evaluation of silica glasses iplanted by
Naramoto, and K Narum.L high-energy ions using a UV-Excited Microscopy,
Formation of carbon nanotubes under conditions Nuclear Insirmnents and Methods in Physics
of Co+Q0 film., Research Section B: Beam Interactions with
Physica B.- Condensed Matter (2002), in print Materials and Atoms,
0 lom Vol. 191, Issues 14, May 2002, Pages 371-374.
0 IOM 12041
11J113
V Laverentiev, H. Abe, S. Yamamoto, H. 11J117
Naramoto, and K. NarumL H. Nishikawa, T. Souno, M- Hatto6 Y Nishihara,
FORMATION OF PROMISING Co-C Y OW E Watanabe, M. Oikawa, T. Kamiya, K.
NANO-CDMPOSITIONS, Arakawa,
Suraface and InterfaceAnalysis 2002), in print Radiation effects and surface deformation of sica
0 IOM by ion rnicrobearn,
Nuclear Instrwnents and Methods in Physics
11J114 Research Section B: Beam Interactions with
V Laverentiev, H. Abe. S. Yamamoto, H. Materials and Atoms, Vol. 191, Issues 14, May
Naramoto. and K. NarumL 2002, Pages 342-345.
Co and Interaction under Conditions of T S IOM 12041
Mixture,
MOLECULAR CRYSTALS AND LJQUID IIJ118
CRYSTALS 2002), in press. M. HattorL Y Nishibara, Y OW M. FujimaU T.
0 10M Souno, H. Nishikawa, T Yamaguchi, E Watanabe,
M. Oikawa. T. Karriiya. K Arakawa,
11J115 Characterization of ion-implanted sica glass by
K Hirata, S. Saitolt K. NarurnL Y Nakajima, and vacuum ultraviolet absorption spectroscopy
Y Kobayashi Nuclear Instrwnents and Methods in Physics
Non-linear effect of cluster irradiation on chemical Research Section B: Beam Interactions with
modification of polycarbonate Materials and Atoms., Vol. 19L Issues 14, May
342 -
JAERI-Review 2002-035
2002, Pages 362-365.
0 IOM 12041 11J123
S. Watanabe, N. S. Ishioka T Seldne, A Osa, M.
IIJ119 Koizurni R. Shimomura, K Yoshilawa and H.
S. Watanabe, N. S. shioka, A Osa. M. Koizumi� T. Muramatsu,
Sekine, S. yomiya, H. Nakanishi and S. MorL Production of Endohedral 133Xe-Fullerene by Ion
Production of Positron Emitters of Metallic ImplantatiorL
Elements to Study Plant Uptake and D istribution. J. RadioanaL Nucl. Chem, in press.
Radiochhu Acta, 89 2001) 853. 0 NRI
C NRI 11036
11J124
11JI20 M. Kasahara, C.-J. Ma, T. Kamiya and I Sakai
Y. Suzuk J Li Y.Maekawa, M. Yoshida, K Preliminary studies on applications of rnicro-PI)CE
Maeyama, N. Yonezawa., to atmospheric aerosols,
Conversion of hydrophilic surface of NucLar Isawnent & Methods, B181, 622-627
poly(ethyleneterephthalate) filmto (2001)-
hydrophobic one under hydrophilic conditions. S ACI' 12046
Journal of Chemical Society of Japan 2255-259
(2002� 11JI25
C RCO 11038 C.J. Ma, M. Kasahara, S. Tohno and T. Kamiya,
A new approach for characterization of ngle
11JI21 raindrops,
S. TsujL S. Seki T Kozawa, and S. Tagawa, Water, Air, andSoil Poll., 130,1601-1606 2001)-
Reaction Mechanisms of Excimer Resists Studied S ATC 12046
by Laser Flash Photolysis,
J. Photopolym. Sci. Technol. 13 2000) 729-732. IIJ126
C RCO 11039 M Kasahara R Hbllor S Tobno Y Ohnishi and
C.-J. Ma,
IIJ122 Application of PLXE Technique to Studies on
M. Tashiro R K PujarL S. Sek Y Honda, S. Global Wartning/Cooling Effect of Atmospheric
N ishijima, and S. Tagawa. Aerosols,
Studies on Thermally Induced Structural Changes Nu&-ar Istnmwnts & Methods B, 204-208
in Silicon Based Polymers by Positron (2002)-
Annihilation S ACr 12046
Radiat. Phys. Chem. 58 2000) 587-592.
C RCO 11039 IIJ127
343 -
JAERI-Review 2002-035
T. Satoh, K. Ishii S. Matsuyama, H. Yamazaki� Ts.
Amartivan. A Tanaka, S. Sugihara, Y Komod K 11J131
Katoh, E. Kim, A Endo and Y Yamaguchi
Investigaation on the Influence of Back Scattered Development of SCINFUL-CG Code to Calculate
Protons PV(E Spectrum Response Function of Hybrid Neution Detectors
IJPDE,, Vol. 11, Nos. &Z 2001,49 59. Using Scintillators.
S ACT 12048 J. Nucl. ScL Tecnol., in press.
C RSH 11048
11J128
• OhnukL E Sakarnoto, N. Kozai� M. Samadfam, 11J132
• Kamiya, T. Sakai T Satoh and S. Oikawa, E. Kim, A Endo, Y YamagucK M. Yoshizawa, T
Application of the micro-PIXE technique for Nakamura and D.R-D. Rasolonjatovo,
analyzing Arsenic in Biornat and Lower Plants of Hybrid Neutron Detector Consisting of an Organic
Lichen and Mosses Around An Arsenic Mine Site, Liquid Scintillator and a Li6 Glass Scintillator for
Gunma, Japan, Wide Energy Rangq
Nuclear Isownents and Medwd in Physics Trans. Atomic Energy Soc. Jpn., in press.
Research B, 190,477-481 2002). RSH 11048
T C IOM 22049
11J133
11J129 T Sato, K Shin, R. Yuasa, S. Ban and H.S. Lee,
A Endo, H. Noguchi Su. Tanaka. Y Kanda, Y Measurement of the Neutron Spectrum by the
04 T. Eda, K Sato, S. T§uda, Irradiation of a 2.04-GeV Electron Beam into
Particle size anal)sis of radioactive aerosols Thick Targets,
formed by irradiation of argon using 65MeV Nuel, Instrum. Meth., A463, 299-308 200 1).
quasi-monoenergetic neutrons, C RSH 11048
AppL RadiaL Isotopes. 56, 615 -620, 2002)
C ACT 11046 11JI34
H.S. Lee, S. Ban, K. Shin, T. Sito, S. Mactaki, C.
11J130 Chung and H.D. Choi�
E. Kim A Endo, Y Yamagucli� M. Yoshizawa, T Systematics of Differential Photoneutroll Yields
Nakamura and T. ShiomL Produced from Al. Ti, C�L Sn, W ad K Targets
Measurement of Neutron Dose with an Organic by Irradiation of 2.04 GeV Electrom
Liquid Scintillator Coupled with a Spectrum J. Nucl. ScL Teckl, submitted
Weight Function, C RSH 11048
Radiat. Prot. Dosim., in press.
C RSH 11048 11J135
- 344 -
JAERI-Review 2002-035
K. Oda, IFI, Ichijo, N. Miyawa4 T Ywmchi and S ACF Machine Study
Y Nakane,
Improvement of Neutron Detection Efficiency
with 1-figh Sensitive CR-39 Track Detector,
Radiat A4,as, 34 (2001) 171-175.
C RSH 11048
IIJ136
K. Oda, Y Saito. N, Miyawak� T Yarnauchi, Y
Nakane and Y Yaimguchi,
Chmcteristic Respome pf Plastic Track Detectors
to 40-80 MeV Neutions,
Radial, Pror Dosim., (2002), in press.
C RSH 11 048
IIJ137
T Sawamura, T Joji and A. Homma,
Measurement of Neutron Detection Sensitivity of
Liquid in Metastable States,
Radiat Prot Dosim., submitted.
C RSH 11048
IIJ138
Yuichi SAITOR
Acceleration Of Cluster 10115 to MeV Energy
Region,
Ionizing Radiation, Vol. 27 No.3 July. 2001.
pp. 19-25.
T ACT 12050
IIJ139
T Sakai, T kamiya, M. Oika� T Sato, A.
Tanaka. and K. Ishii,
JAER1 TAKASAM IN AM MICRO PDCE
SYSTEM FOR VARIOUS APPLICATIONS,
Nucl. Instr Meth. B 190 (2002) 27 1.
345 -
JAERI-Review 2002-035
A 12 Publications in Proceeding
11C01 Matsuda, K. Sugimoto, 1. Nashiyama H.
A. Makihara, S. Kuboyama, S. Matsuda, N. Itoh,
Nemoto H Ohtomo, K. Furuse, S. Baba and Development of M Gate CMOS Gate Array,
T. Hirose, Europian Space Components Conference.
Non-Damaging Beam Blanking SEM Test C SCS 11002
Method and its Application to Highly
Integrated Devices, 11COS
The IEEE Nuclear and Space Radiation M. Imaizurni, T. Takamoto, T. Ohshima M.
Effects Conference(NSREC 2001 Yamaguchi, H. Itoh, S. Matsuda,
C SCS 11002 Radiation Effects on High-Efficiency
InGaP/InGaAs/Ge Triple-Junction Solar
11CO2 Cells Developed for Terrestrial Use,
A. Makihara, H. Shindou, N. Nemoto, S. Proc. of 29th IEEE Photovoltaic Specialists
Kuboyarna, S. Matsuda T. Ohshima, T. Hirao, Conference, May 2002 (New Orleans) in
H. Itoh, S. Buchner, A. B. Campbell, press.
Analysis of Single-Ion Multiple-Bit Upset in C T I SCS 12002/11003
High-Density DRAMs,
The IEEE Nuclear and Space Radiation 11CO6
Effects Conference(NSREC 2000). Ayako Sakamoto, Vo Thi Thuong Lan, Naoya
C SCS 11002 Shikazono. Atsushi Tanaka,
Analysis of a UVI3 and Gamma-ray Sensitive
11CO3 Mutant in Arabidopsis.,
N. Nemoto, H. Shindou, S. Kuboyarna, S. Abstracts of Annual Meeting and Symposia
Matsuda., H. Itoh., S. Okada, 1. Nashiyania, of the 2002, March 2002 (Okayama) p.158,
Relationship between Single-Event Upset C BIT 11009
Immunity and Fablication Processes of
Recent Memories, 11CO7
5th Europian conference radiation and its M. Okamura, N. Yasuno. M. Ohtuka, A.
Effects on Components and system Tanaka., N. Shikazono and Y Hase,
(RADECS99). Mutation generation in carnation plants
C SCS 11002 regenerated from in vitro leaf cultures
irradiated with in beams: Development of
11CO4 mutation varieties "Vital ion series",
N. Nemoto, R. Shindou. S. Kuboyania. S. Breeding Research, vol 4 supplement 2002).
- 346 -
JAERI-Review 2002-035
C BIT 11012
11C12
11CO8 M. Mizobuchi and A. Iwasaki�
K. Ueno, S. Nagayoshi, Y Hase, N. The Use of the Ion Beam to the Rice
Shikazono and A. Tanaka, Breeding,
Establishment of line breeding system using Shikoku J. Crop Sci. 2001 p.50-51.
tissue culture of chrysanthemums C BIT 11017
Ikushugaku Kenkyu 3 2001) (Suppl 2: 62,
C ACT 110 13 lIC13
H. Katai. M. Taneishi, A. Tanaka, N.
11CO9 Shikazono, Y Hase and H. Otsuka,
S. Nagayoshi, K. Ueno, Y Hase, N. Effects of ion beam irradiation on the growth
Shikazono and A. Tanaka, of netted melon (Cucumis melo L.),
Mutation Breeding by Irradiation in Breeding Research 2001(l) p 243.
Chrysanthemum cv. 'Jimba 'I, C BIT 11019
Kyushu Agric. Res � 64, 2002). 187.
C ACT 11013 11C14
G. Takata, M. Ikeda, K. Nakaya. K. Koizumi,
11C10 Y Sasuga, Y Sakata, H. Takenaga, and S.
Y Yamamoto, T. Tashiro, A. Tanaka, N. Tanaka,
Shikazono, Y Hase, A Search for Genes Responsible for
Basic Study on Mutation Induction with Ion Hydrotropism in Roots of Arabidopsis
Beam Irradiation in Garlic (Allium, sativurn thaliana,
L.), Plant Cell Physiology 43 (supplement) 2002
Jpn. J. Crop Sci. 70(extra issue p232.
2) 237-238(2001). C BIT 11024
C BIT 11015
lIC15
11C11 Y Kobayashi, T. Funayama, M. Tanaka, S.
M. Masuda, S. G.. Agong, A. Tanaka, N. Wada, H. Watanabe and K. Yamamoto.
Shikazono and Y Hase, SYSTEM OF CELL IRRADIATION WITH
Mutation Spectrum of Tomato, cv. First, APRECISENUMBEROFHEAVYIONS,
Induced by Seed Radiation with Carbon and Abstracts of the 2nd International Workshop
Helium Ion- beam, on Space Radiation Research (IWSSRR-2),
Acta Horticulturae, 2002. Nara, March 11-15, 2002, p. 37.
C BIT 11016 C BIT 11025
347 -
JAERI-Review 2002-035
N. Ohtake T Kawachi H Fujikake T.
lIC16 Suganuma, T. Ohyama, K.Sueyoshi, A. Osa,
T. Funayama, Y Kobayashi, S, Wada, M. M. Koizumi, S. Watanabe, T. Sekine.
Tanaka and K. Yamamoto, S.Matuhashi, N. Ishioka, C. Mizuniwa H.
THE EFFECT OF SINGLE HEAVY ION Uchida and A. Tsuj L
HIT ON THE MAMMALIAN CULTURED Effect of different phosphate application
CELLS, onsoybean nitrate absorption and
Abstracts of the 2nd International Workshop translocation,
on Space Radiation Research QWSSRR-2), The 38 1h Annual Meeting on Radioisotopes
Nara, March 11-15, 2002, p. 93. and Radiation in the Physical Sciences and
C BIT 11025 Industries. 2001 (Tokyo), 168.
C BIT 11030
11C17
S. Wada, Y Kobayashi, T. Funayama, M. lIC20
Natsuhori, N. Ito and K. Yamamoto Y. Kunimi, S. Seki, and S. Tagawa.
DETECTION OF DNA DAMAGE IN HE Investigation on Hole Drift Mobility in
INDIVIDUAL CELLS INDUCED BY Poly(n-hexylphenylsilane�
HEAVY ION IRRADIATION WITH Solid State Commun. 114 2000) 469-472.
COMETASSAY C RCO 11039
Abstracts of the 2nd International Workshop
on Space Radiation Research (IWSSRR-2), 11C21
Nara, March 11-15, 2002, p. 104-105. S. Seki, K. Maeda, Y Kunimi, S. Tagawa Y.
C BIT 11025 Yoshida., H. Kudoh., M Sgimoto, Y Morita,
T. Seguchi, T. Iwai, H. Shibata, K. Asai, and
11C18 K, shigure,
Y Kobayashi, T. Funayarna, S. Wada., M. Ion track structure in poly(di-n-bexylsilane)
Taguchi, T. Kamiya, W. Yokota, H. Proceedings of the 8th Japan-China bilateral
Watanabe, symposium on radiation chemistry 2000)
The effect of single ion irradiation on 287.
mammalian cells. C RCO 11039
Abs. of The 11th TIARA Research
Reviewing Meeting (Takasaki, July 112, 11C22
2002). S. Seki, Y Kunimi, Y Sakurai S. Tagawa
C BIT 11025 High-sensitive Negative Resist Materials
Based on Polysilane Derivatives.,
11C19 J. Photopolym. Sci. Technol, 13 2000) 395.
- 348 -
JAERI-Review 2002-035
C RCO 11039 Growth of Voids in Cu studied by Computer
Simulation,
11C23 Mat. Res. Soc. Symp. Proc., 650 2001)
S. Seki, K. Nishida, Y Kunimi, Y Yoshida, S. R3.23.1-R3.23.6.
Tagawa, T I S 10M 12008
Electronic Structure of or -conjugated
System of Polysilanes Studied by Electron lIC27
Beam Pulse Radiolysis, N. Sekimura. K. Kobayashi and T.
Proc. I-EE 13th ICDL, 646-649 1999). Morioka,
C RCO 11039 Surface Irradiation Effects by STM
Observation,
11C24 Proceeding,,z of SCR-2000 2000).
T Nakazawa. V Grishmanovs, D. Yamaki, Y T S I 10M 12009
Katano, T. Aruga, A. Iwamoto,
Study of ion-induced damage in Li2TiO3 lIC28
ceramics, T. Okita, N. Sekimura, L. R. Greenwood, W.
In ternational Conference on Ion G. Wolfer, Y Isobe and F. A. Garner.
Implantation Technolo y Proceedings. Neutron-induced Microstructural Evolution9
September 2000 Alpbach) p.753. of Fe-15U-16W at 400T During Neutron
TIS 10M 12006 Irradiation in the FTF Fast Neutrons,
Proceedings of the lUb International
11C25 Symposium on Environmental Degradation
Y Katano, T. Aruga, S. Yammoto, T.. of Materials in Nuclear Power Systems 2001,
Nakazawa, D. Yinaki, in press.
Implantation Mode Dependence of Damage TSI 10M 12009
Structure Depth Profiles in Al-,03
Irradiated with Triple earn of H., He and 11C29
Heavy Ions, T. Okita, N. Sekimura T. Iwai and F. A.
In ternational Conference on Ion Garner,
Implantation Technology Proceedings, Investigation of the Synergistic Influence of
September 2000 (Alpbach) p.805. Composition, Irradiation Temperature and
TIS 10M 1.2006 Atomic Displacement Rate on the
Microstructural Evolution of Ion-irradiated
11C26 Model Austenitic Alloys,
Y Shimomura and 1. Mukouda, Proceedings of the Wh International
Atomistic Mechanism of Nucleation and Symposium on Environmental Degradation
- 349 -
JAERI-Review 2002-035
of Materials in Nuclear Power Systems 2001, 1. loka, M. Futakawa Y Nanjyo, K. Kiuchi,
in press. Y Kuroda and T. Anegawa,
TSI IOM 12009 Effect of Triple Ion Beam Irradiation on
Mechanical Properties of High Chromium
11C30 Austenitic Stainless Steel,
T. Okita, N. Sekimura and F. A. Garner, Material Chemistry 02, March 13-15,
The Effect of Flux and Nuclear Transmutants 2002(Tsukuba).
on Microstructural Evolution and Swelling in T I MAN 12012
Austenitic Model Alloys Irradiated with
Heavy Ions and Fast Neutrons., 11C34
Proceedings of PRICM-4 2002, in press. 1. loka, K. Kiuchi Y Kuroda and T. Anegawa,
TSI IOM 12009 Evaluation of New Fe-Cr-Ni Alloy for Ultra
High Burnup Fuel Cladding Tube,
11C31 International Congress on Advanced Nuclear
E A. Garner, M. L. Hamilton, T. Okita, N. Power Plants, June 913, 2002(Florida).
Sekimura, D, L. Porter and T. R. Allen, TIS MAN 12012
The unexpectedly strong influence of
displacement rate on the neutron-induced lIC35
void swelling of pure metals, and K. Kiuchi, H. Ogawa, 1. Ioka Y Kuroda and
iron-based FCC and BCC alloys, T. Anegawa,
Proceedings of PRICM-4 2002, in press. Development of New Cladding Materials
TSI IOM 12009 Applied for Advanced WR Aiming at
Ultra-high Burn-up and Fast Neutron
11C32 Spectrum,
M. Ando, H. Tanigawa, E. Wakai, T. Sawai, International Congress on Advanced Nuclear
S. Jitsukawa, Y. Katoh, A. Kohyarna, K. Power Plants, June 913, 2002(Florida).
Nakamura, H. Takeuchi, TIS MAN 12012
Investigation of Irradiation-Induced
Hardening Changes on Ion-Irradiated lIC36
Reduced Activation Ferritic/Martensitic K. Kiuchi. H. Ogawa. 1. loka Y Kuroda, T.,
Steels, Anekawa,
Proc. of 4th Meeting of Fusion and Energy, Development of New Cladding Materials
JPSF, Osaka, 2002). p2W Applied for Advanced WR Aiming at Ultra
T I S IOM 12011 High Burnup and Fast Neutron Spectrurn.
Int.Cong.Advanced Florida., June 913(2002).
lIC33 T I S MAN 12014
- 350 -
JAERI-Review 2002-035
The Forth Pacific Rim International
11C37 Conference on Advanced Materials and
1. loka, K. Kiuchi, Y Kuroda, T Anekawa. Processing, Vol-1, ppl331-1333, 2001).
Evaluation of New Fe-Cr-Ni Alloy for Ultra TI IOM 12021
High Bumup Fuel Cladding Tube.,
Int. Cong. Advanced Florida, June lIC41
9-13(2002)� M. Takeda T Suda, S. Watanabe, S. Ohnuki,
T I S MAN 12014 H. Abe,
Preferential Amorphization and
11C38 Crystallization in polycrystalline Silicon
H. -S. Lee, H. Okada, A. Wakahara. A. under Ion-Irradiation,
Yoshida, T. Ohshima, H. Itoh. S. Kawakita, The Forth Pacific Rim International
M. Imaizumi, and S. Matsuda. Conference on Advanced Materials and
Effect of proton irradiation on electrical Processing, Vol-2, pp2539-2542, 2001).
properties of CuInSe2 thin films, TI IOM 12021
Technical Digest of the International
PVSEC-12 (June 20-22, 2001, Jeju, Korea) 11C42
pp.91-92. E. Shioya, T. Suda, S. Watanabe, S. Ohnuki,
I SCS 12004 M. Ishino, 0. Yoda, H. Abe, F. Phillipp,
Electron-Irradiation-Induced Amorphization
11C39 in Mo/Si Nano-Multilayer Material,
M. Takeda, S. Ohnuki, T. Suda, S. Watanabe, The Forth Pacific Rim International
H. Abe and 1. Nishiyarna, Conference on Advanced Materials and
Effect of Mass and Energy on Preferential Processing, Vol-1, ppl351-1353, 2001).
Amorphization in Polycrystalline Si Film TI IOM 12021
During Ion-Irradiation,
Effects of Radiation on Materials 20th 11C43
Symposium STP1405 836-845 2001). K. Narumi and H. Naramoto,
TI IOM 12021 SPM Investigation of 0 Thin Films
Irradiated with Energetic Ions,
11C40 Proc, 3rd International Symposium on
S. Ohnuki, F. Arimoto, S.Watanabe, P. R. Atomic Level Characterizations for New
Okamoto, N. Q. Lam and H. Abe. Materials and Devices '01, Nara, Japan,
Inter-Diffusion and Amorphization During November 11-14,2001.
Ion-Irradiation in Mo/Si Nano-Multi-Layer I IOM MAN 12030
Materials.
351 -
JAERI-Review 2002-035
11C44 H. Itoh,
S. Ishino, T. Hasegawa, Y Chimi, N. ESR study on the single vacancy related
Ishikawa, A. wase T Tobita, M. Suzuki, defects in 4H-, 6H-SiC,
Electrical Resistivity Measurements in FeCu Proceedings of International Conference on
Alloys Irradiated with Energetic Heavy Ions Silicon Carbide and Related Materials
and Electrons, 2001(Oct. 28-Nov 2 2001, Tsukuba, Japan),
The (129th) 2001-Fall Meeting of the Japan Matetr. Sci. Forum 389-393, 497-500 2002).
Institute of Metals, Fukuoka, September T IOM 12037
21-24, 2001.
S IOM 12035 11C48
E. Shioya, T. Suda, S. Watanabe, S. Ohnuki,
11C45 M. Ishino, 0, Yoda, H. Abe,
S. Ishino, Electron-irradiation-induced arnorphization
Studies of Dose Rate Effects by Means of Ion in Mo/Si nano multilayer material,
Irradiation, 4th Pacific Rim International Conference on
EPRI/CRIEPI Workshop on Dose Rate Advanced Materials and Processing,
Effects in Reactor Pressure Vessel Materials, 2001.12.11-15, Hawaii.
Olympic Valley, CA, U.S.A., November I IOM 12019
12-14, 2001.
S IOM .12035 11C49
S. Yamamoto, T. Surnita, A. Miyashita H.
11C46 Itoh,
S. Ishino T Hasegawa. Y Chimi, N. Characterization of TiO, films prepared by
Ishikawa, A. Iwase, T. Tobita, M, Suzuki, pulsed laser deposition
In-situ Measurements of Electrical resistivity Proc. of the third symposium o advanced
in Fe-Cu Alloys Using Heavy Ion and photon research, Dec. 2001 (Kyoto).
Electron accelerators, S IOM 12023
Symposium on 'The Mechanism of
Irradiation Embrittlement in Pressure Vessel lIC50
Materials', Tbhoku University, Sendai, V Laverentiev, H. Abe, S. Yamamoto, H.
November 22-24, 2001 Narainoto, and K. Narurni.
S IOM 12035 Formation of carhop nanotubes under
condition of Co+C6o film,
11C47 Anniversary of' its Discovery, October 35,
N. Mizuochi, J. Isoya, S. Yarnasaki, H. 2001 (Tsukuba Japan) p.1421
Takizawa, N. Morishita, T. Ohshirna and 0 IOM
352 -
JAERI-Review 2002-035
Naramoto, and K. Narumi,
11C51 Formation of intriguing carbon-related
V LaveTentiev, H. Abe, S. Yamamoto, H. structures in Co+C60 mixed films,
Naramoto, and K, Narumi Abstract of the 21th Fullerene General
Formation of promising Co-C Symposium, July 25-27. 2001 (Tsukuba,
nano-compositions. Japan) p.34.
3'd Internatiorial Symposium on Atomic 0 IOM
Level Characterizations for New Materials
and Devices '01, ALC'01, November 11-14, 11C55
2001 (Nara-Ken New Public Hall, Japan), P. Wei, Y Xu, K. Narumi., H. Nararnoto and S.
Program Abstracts. p. 113. Nagata,
0 lom Structural and optical properties of Ge/C
Multikayers Deposited on Si and Sapphire
11C52 Substrates by Magnetron Sputtering,
V Laverentiev, H. Abe, S. Yamamoto, H. The 8th Inter.Conf. on Electronic Materials
Naramoto and K. Narumi, OUMRS-ICEMS2002, Xan, 2002).
Co and C60 interaction under conditions of I S IOM 12029
mixture
International Symposium on Nano Carbons, 11C56
ISNC 2001, November 14-16,2001 (Nagano. T Ohshima. A. Uedono, H- Itoh M.
Japan). Program & Abstracts, p. 259. Yoshikawa, K. Kojima, 1. NashiyamaS.
0 10M Okada and K. Abe,
Relationship between donor activation and
11C53 defect annealing in 6H-SiC hot-implanted
V Laverentiev, S. Yamamoto, H. Naramoto with phosphorus ions,
nad K. Narumi, Materials Science Forum, 338-342 (2000)�
Structural Features of Epitaial Cobalt Films p.857.
Abstracts of the Thirteenth International I IOM 12039
Conference on Crystal Growth,
ICCG-13/IGVGE-II.. 30 July - 4 August 11C57
2001 (Doshisha University, Kyoto, Japan) p. H. Abe, A. Uedono, H. Uchida, A. Komatsu,
136. S. Okada and H. Itoh,
0 10M Positron annihilation studies of defects in ion
implanted Palladiurn,
11C54 Materials Science Forum., 363-365 2001) p.
V Laverentiev. H. Abe, S. Yamamoto, H. 156.
353 -
JAERI-Review 2002-035
1 10M 12039 N. S. Ishioka, S. Watanabe, S. Matsuhashi C.
Mizuniwa, T. Itoh and T. Sekine,
lIC58 Excitation Functions of Rhenium Isotopes on
T Ohshima. A. Uedono, H. Abe, Z. Q. Chen. the natW(dxn) Reactions and Production of
H. Itoh, and M. Yoshikawa, No-carrier-added 186Re,
Positron annihilation study of vacancy-type Proc. of Nuclear Data for Science and
defects in silicon carbide co-implanted with Technology (ND2001),Oct. 712, 2001,
aluminum and carbon ions., Tsukuba,.Japan.
21st Internat. Conf. on Defects in C, NRI, 11036
Semiconductors (ICDS21): Giessen, German,
July 16-20, 2001. 11C62
I Tom 12039 C. J. Ma, M. Kasahara, S. Tohno, R. Holler
and T. Kamiya,
11C59 Chemical composition of single raindrops
M. Hattori, Y Nishihara, M. Fujimaki, Y fallen in yellow rainfall episode in Japan,
Ohki, T. Souno, H. Nishikawa, T. Yamaguchi, The 2nd Asia Aerosol Conference, July 2001
E. Watanabe, M. Oikawa, T. Kamiya, K. (Pusan, Korea) p.7-8.
Arakawa, S ACT 12046
Evaluation of Three Dimensional
Microstructures on Silica Glass Fabricated by 11C63
Ion Microbeam, C. J. Ma, M. Kasahara, S, Tolmo, T. Kamiya
Abstracts of The 10th TIARA Research and T. SakaL
Review Meeting, p. 106 - 107. Sampling of individual fog droplets and its
S IOM 12041 chemical analysis,
2nd nternational Conference on Fog and Fog
11C60 Collection, July 2001, (Newfoundland,
H. Nishikawa. Y OhkL Canada) p.45-48.
Functionnal Silica-Based Glasses for S ACT 12046
Photonics.
The Transactions of The Instutute of lIC64
Electrical M. Kasahara, C.-J. Ma and S. Thno
Engineers of Japanpp.721-724, Vol. 121-A Physical and chemical properties of single
No.8. fog droplets applying fixation technique,
S IOM 12041 Fog 2001, July 2001 (Newfoundland,
Canada) p.69-72.
lIC61 S ACT 12046
354 -
JAERI-Review 2002-035
Tanaka,
11C65 Experiments on Neutron Scattering and
C. J. Ma, Y Inoguchi, M. Kasahara, S. Tolmo Prompt Fission Neutron Spectra,
and T. Kamiya, Proc. Int. Conf., on Nuclear Data fr SCi. &
New approaches for the characterization of Technol,, 2001, Thukuba) To be published
single and size-segregated raindrops, C NRI 11047
The 18th Symposium on Aerosol Science and
Technology, July 2001 (Tokyo, Japan) lIC69
p.140-141. M. Hagiwara, M. Hosokawa, M. Baba T.
S ATC 12046 Sanami, M. Takada,
Development of a Bragg curve spectrometer
11C66 (BCS) for fragment spectroscopy from
M. lbaraki, M. Baba, T. Miura, T. Aoki, T. neutron and proton induced reactions,
Hiroishi, H. Nakashima, S. Meigo, Su. Proc. Symposium on Radiation detectors and
Tanaka, their uses(2002),KEK-proceedings, to be
Measurement of Neutron Non-Elastic Cross published.
Sections of C, Si, Fe, Zr and Pb in 40- 80 C NRI 11047
MeV Region.,
Proc. Int. ConL on Nuclear Data for Sci. & 11C70
Technol,, 2001, Thukuba) To be published S. Ban, H.S. Lee, T. Sato, S. Maetaki and K.
C NRI 11047 Shin,
Measurements of Photo-Neutrons from Thick
11C67 Aluminum Target by 2 GeV Electrons,
T. Sanami, T. Hiroishi. M. Baba, M. Proc. of 9th EGS4 Users' Meeting in Japan,
Hagiwara, T. Miura, T. Aoki, T. Kawata, Su. August 2001, Tsukuba, pp.48-55.
Tanaka, H. Nakashima, S. Meigo, C RSH 11048
Double-differential hydrogen and helium
production cross section of oxygen and 11C71
nitrogen for 75 MeV neutrons, T. Sawamura, J. H. Kaneko, M. Abe, M.
Proc. nt. Conf.. on Nuclear Data for Sci. & Tamura, 1. Murai, A. Homma, F. Fujita and S.
Technol- 2001, Thukuba)To be published Tsuda,
C NRI 11047 Effect of lead converter on superheated drop
detector response to high energy neutrons,
11C68 Proc.10tb Symp on Rad. Meas. and
M. Baba, M. lbaraki, T. Miura, T. Aoki. Y Application, 2002. in press.
Hirasawa, H. Nakashima, 'S. Meigo, Su. C RSH 11048
355 -
JAERI-Review 2002-035
C ATC Machine Study
lIC72
Y Saitoh, Y Nakajima, K. Narumi, H. 11C75
Shibata T. Majima, L. K. Ohno, A. Itok S. Kurashima, N. Miyawaki, M. Fukuda, Y
Measurement of secondary charged Nakamura, T. Nara, T. Agematsu, I. Ishibori,
particle from Cu by MeV cluster W. Yokota, S. Okumura and K. Arakawa,
Irradiation, Design of the Flat-Top Resonator for the
Proceedings of 14Th Workshop on Tandem JAERI AVF Cyclotron,
Accelerator and Technology, JNC TN7200 Proc. 13th Symp. on Accelerator Science and
2001-001,pp.122-125. Technology, Suita, Japan, 232 2001).
T ACT 12050 C ACT Machine Study
11C73 11C76
S. Okumura, K. Arakawa, M. Fukuda, Y Y Nakamura. T. Nara, T. Agematsu I.
Nakamura, W. Yokota, T. Ishirnoto, S. Ishibori, H. Tamura, S. Kurashima W.
Kurashima, 1. Ishibori, T. Nara, T. Agernatsu, Yokota, S. Okumura, M. Fukuda, K. Akaiwa,
H. Tamura, A. Matsurnura, M. Sano., T. To. Yoshida., S. Ishiro, A. Matsumura, Y
Tachikawa, Arakawa, Tsu. Yoshida, S. Kanou, A. Ihara
Temperature Control of a Cyclotron Magnet and K. Takano,
for Stabilization of the JAERI AVF Cyclotron STATUS REPORT ON THE JAERI AVF
Beam, CYCLOTRON SYSTEM�
Proc. of the 16th International Conference on Proc. of 13th Sympo. Accel. Sci. Technol.,
Cyclotrons and their Applications, 2001 Suita, Osaka, Japan, October (2001)
(Michigan, USA) p.330. pp.193-195.
C ACT Machine Study C ACT Machine Study
11C74 11C77
S. Kurashima, M. Fukuda, Y Nakamura, T. Y Nakamura T. Nara, T Agematsu, I.
Nara, T Agernatsu I Ishibori. W Yokota, S. Ishibori, H. Tamura, S. Kurashima W.
Okumura. K. Arakawa, Y Kurnata, Y Yokota, S. Okumura, M Fukuda and K.
Fukumoto, Arakawa,
Design of the Flat-Top Acceleration System STATUS REPORT ON THE AERI AVF
for the JAERI AVF Cyclotron, CYCLOTRON SYSTEM,
Proc. 16th Int. Conf. on Cyclotron and Their Proc. of 16th Int. Conf. Cyclo. Their Applic.,
Applications, East Lansing, USA, 303 East Lansing, Michigan. USA (2001)
(2001). pp.129-132.
356 -
JAERI-Review 2002-035
C ACT Machine Study
JJC78
K Mzuhashi, S. Uno, K. Ohkoshi, A.Chiba,
Y Saithob, Y Ishii, T Kamiya, 1. Takada S.
Mkilma,
Status of TIARA electrostatic accelerators
facijity�
Proc. 15th Workshop on tandem accelerator
and technique(2003).
TIS ACT Machiiie Study
357 -
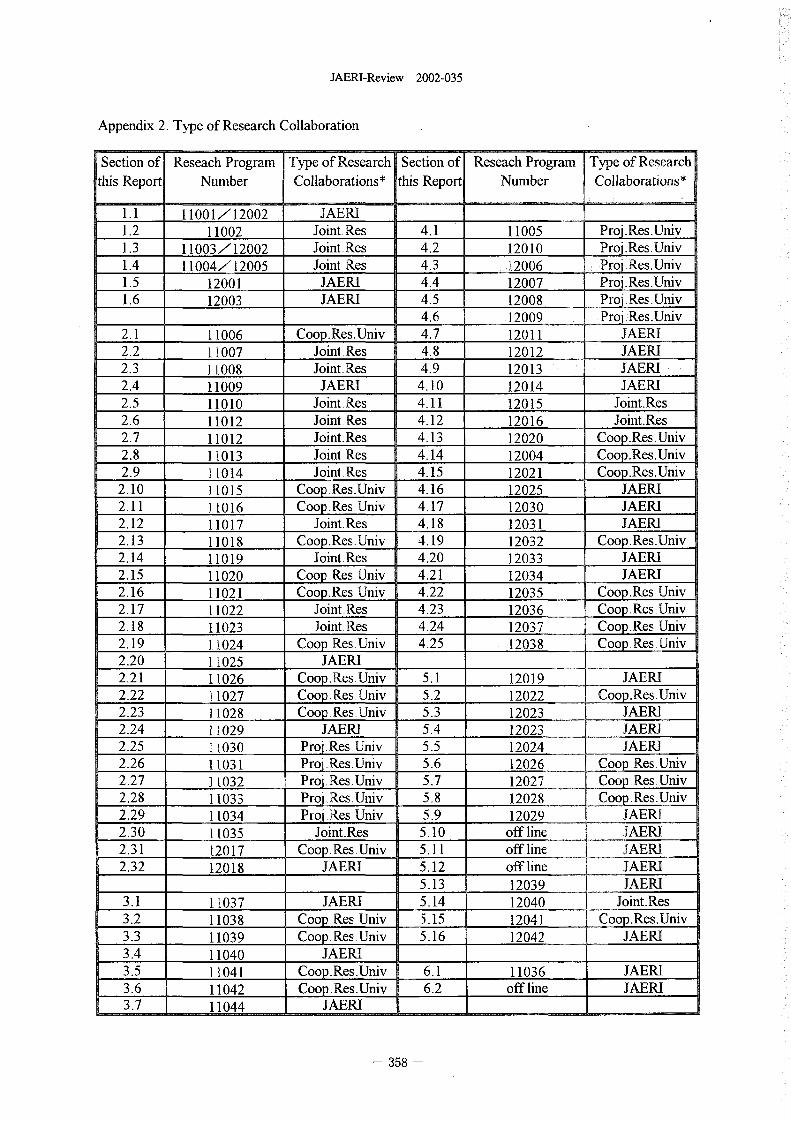
JAERI-Review 2002-035
Appendix 2 Type of Research Collaboration
Section of Reseach Program Type of Research Section of Reseach Program Type of Researchthis Report Number Collaborations* this Report Number Collaborations*
1.1 11001XI2002 JAERI1.2 11002 Joint, Res 4.1 11005 Pro'.Res.Univ1.3 1100'5//12002 Joint Res 4.2 12010 ___tLqLResUniv1.4 11004,/12005 Joint. Res 4.3 12006 ProIRes.Univ1.5 12001 JAERI 4.4 12007 Pr Res.Univ1.6 12003 JAERI 4.5 12008 Prol.Res.Univ
4.6 12009 Proj'Res.Umv2.1 11006_ Coop.Res.Univ 4.7 12011 JAERI2.2 11007 Joint, Res 4.8 12012 JAERI2.3 H008 Joint-Res 4.9 12013 JAERI2.4 11009 JAERI 4.10 12014 JAERI2.5 11010 JointRes 4.11 12015 -- JointRes2.6 11012 Joint, Res 4.12 12016 JointRes2.7 11012 JointRes 4.13 12020 CoopResUnIv2.8 11013 Joint. Res 4.14 12004 CoopRes.UnIv2.9 11014 Joint. Res 4.15 12021 CoopRes.UMv
2.10 11015_ Coop.Res.Univ 4.16 12025 JAERI2.11 ItO16 Coop Res Univ 4.17 12030 JAERI2.12 11017 Joint. Res 4.18 12031 JAERI2.13 11018 Coop.Res.Univ 4.19 12032 Coop.Res.Univ2.14 11019 JointRes 4.20 12033 JAERI2.15 11020 Coop. Res. Univ 4.21 12034 JAERI2.16 11021 CoopRes Univ 4.22 12035 Coo2.Res.Univ2.17 11022 JointRes 4.23 12036 Coop. Res, niv2.18 1102' Joint. Res 4.24 12037 CoopRes. niv2.19 11024 Coop, Res. Univ 4.25 12038 CoopRes.UnIv2.20 11025 JAERI2.21 11026_ CoopRes.Univ 5.1 12019 JAERI2.22 11027_ Coop.ResUniv 5.2 12022 Coop.ResUniv2.23 11028 Coop. Res, Univ 5.3 12023 JAERI2.24 11029 JAERI 5.4 12023 JAERJ2.25 11030_ Proij. Res, Univ 5.5 12024 JAERI2.26 11031 Pr!�Res.Univ 5.6 12026 CoRLL��Univ�2.27 11032 ProjRes.Univ 5.7 12027 Coop, Res. Univ2.28 11033 ProjResUniv 5.8 12028 CoovResUniv2.29 11034 P r� .Res. Univ 5.9 12029 JAERI2.30 11035 JointRes 5.10 off line JAERI2.31 12017 Coop Res Univ 5.11 off line JAERI2.32 12018 JAERI 5.12 off line JAERI
5.13 120393.1 11037 JAERI 5.14 12040 JointRes3.2 11038 Coop, Res. Univ 5.15 12041 Coop.Res.Univ3.3 11039_ Coop. Res, Univ 5.16 12042 JAERI3.4 11040 JAERI3.5 11041 Coop.Res.Univ 6.1 11036 JAERI3.6 11042 COOP.Res.Univ 6.2 off line JAERI3.7 11044 1
358 -
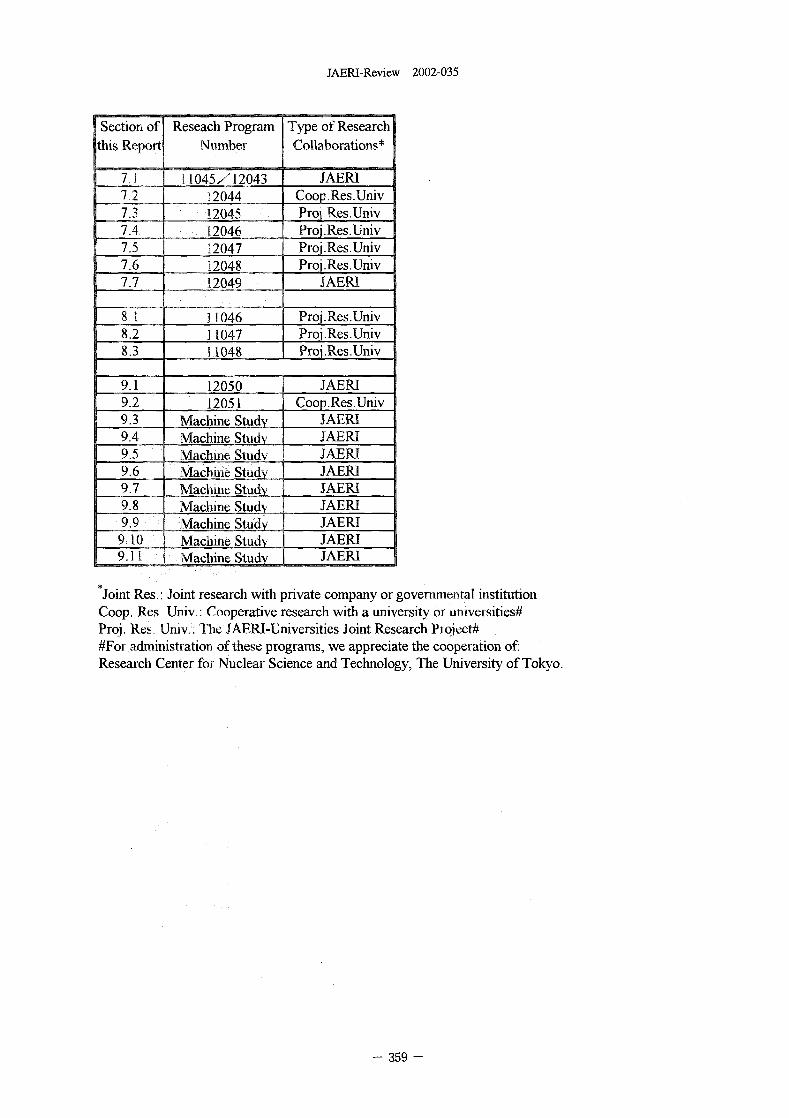
JAERI-Review 2002-035
Section of Reseach Program Type of Researchs Report Number Collaborations*
TI 11045ZI2043 JAERI
7.2 - 12044 Coop.Res.Univ7.3 12045 __Enjes-Univ7.4 12046 __��Res�Univ7.5 12047 ProjRes.Univ7.6 12048 Proi.Res.Univ7.7 12049 JAERI
8 1 11046_ Proj.Res.Univ8.2 11047 Prol.Res.Univ8.3 11048
9.1 12050 JAERI9.2 12051 CoopRes.UnIv9.3 Machine Sq�d, JAERI9.4 Machine Styd�, JAERI9.5 Machine Study JAERI9.6 Macbu'le Study JAERI9.7 -Machine Study JAERI9.8 Machine Sjqd�__ JAERI9.9 Machine Sjqdy_ JAERI9AO Machine S!qd3, JAERI9.11 Machine Studl JAERI
Joint Res.: Joint research with private company or governmeDtal institutionCoop. Res- Univ.: Cooperative research with a university or uiversities#P Res. Univ..' The JAERI-Uru'versities Joint Research Pro ect-4#For administration of these programs, we appreciate the cooperation ofResearch Center for Nuclear Science and Technology, The University of Tokyo.
359 -
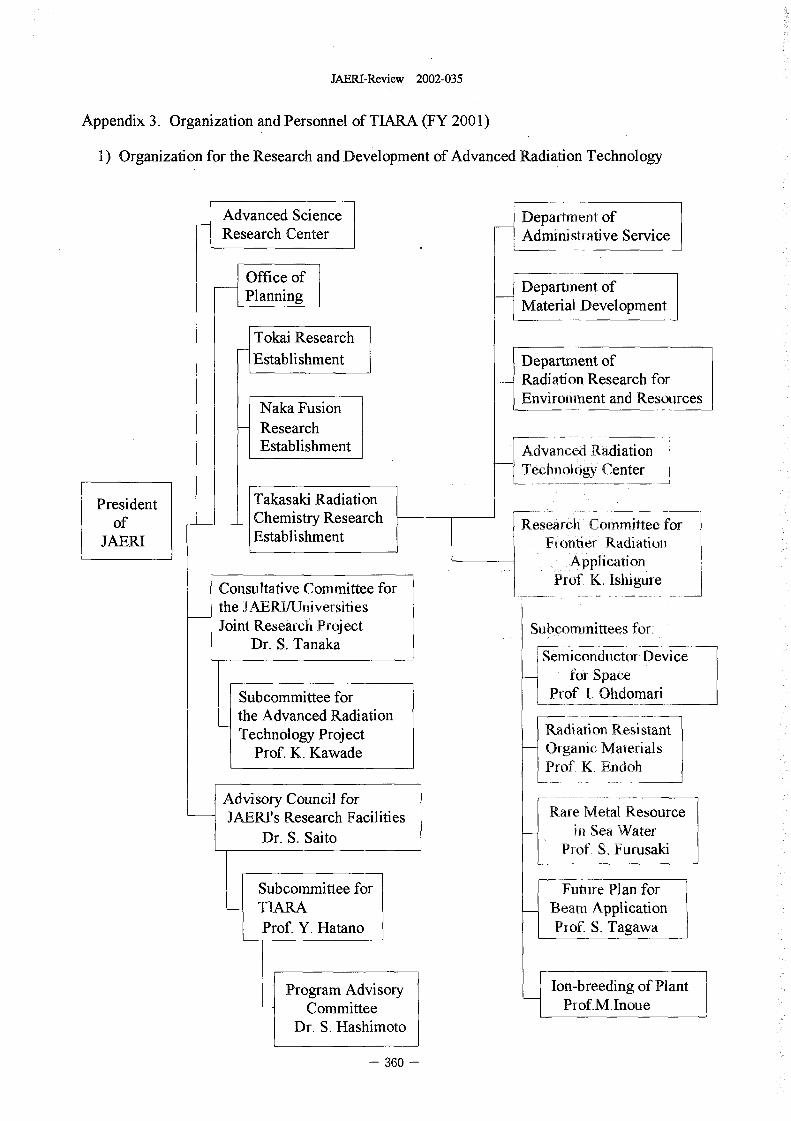
JAERI-Review 2002-035
Appendix 3 Organization and Personnel of TLkRA (FY 200 )
1) Organization for the Research and Development of Advanced Radiation Technology
Advanced Science Department OfResearch Center Administrative Service
Office ofPlanning Department of
Material Development
Tokai ResearchEstablishment Department of
Radiation Research forEnvironment and Resources
Naka FusionResearchEstablishment Advanced Radiation
Technology Center
President Takasaki RadiationChemistry Researchof Research Committee for
JAERI Establishment Frontier RadiationApplication
Consultative Committee for Prof. K. Ishigurethe JAERI[UniversitiesJoint Research Project Subcommittees for-
Dr. S. Tanaka - ---- -Semiconductor Device
for SpaceSubcommittee for f. t Ohdomarithe Advanced Radiation - ------------ --- ,Technology Project Radiation Resistant
Prof. K. Kawade Organic MaterialsProf K. Eirdoh
Advisory Council forJAERI's Research Facilities Rare Metal Resource
in Sea WaterDr. S. SaitoProf, S. Furusaki
Subcommittee for Future Plan forTURA Beam ApplicationProf. Y. Hatano Prof. S. Tagawa
Program Advisory Ion-breedina of PlantCommittee Prof M.Inoue
Dr. S. Hashimoto
360 -
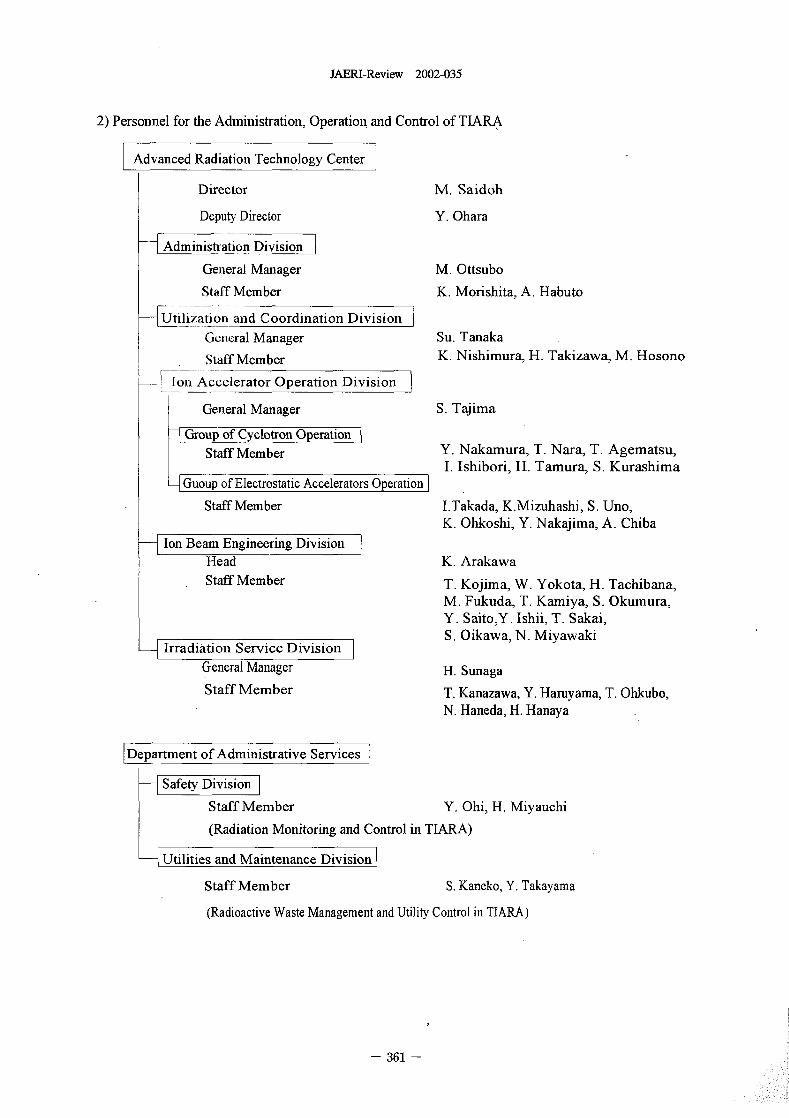
JAERI-Review 2002-035
2) Personnel for the Administration, Operation and Control of TIARA
Advanced ad'at'on Teelmolog
Director M. Saidoh
Deputy Director Y. Ohara
-- EAd=minis44tion ivi=sion
General Manager M. Ottsubo
Staff Member K. Morishita, A. Habuto
-�_-tihzatio ad Coordination Division
General Manager Su. Tanaka
Staff Member K. Nishimura, H. Takizawa, M. Hosono
Ion Accelerator Operation Division----- ------
General Manager S. Tajima
-FGrou-p of Cyclotron 0peration ]Staff Member Y. Nakamura, T. Nara, T. Agematsu,
1. Ishiborl, H. Tamura, S. Kurashima-VGuoup of Electrostatic Accelerators Operation
Staff Member I.Takada, K.Mizuhashi, S. Uno,
K. Ohkoshi, Y. Nakajima, A. Chiba
Ion Beam Engineering Division
Head K. Arakawa.
Staff Member T. Kojima, W. Yokota, H. Tachibana,
M. Fukuda, T. Karniya, S. Okumura,
Y. SaitoY. Ishii, T. Sakai,
S. Oikawa, N. Myawaki-IIrradiationServiceD-ivision
General Manager H. Sunaga
Staff Member T. Kanazawa, Y. Harayania, T. Ohkubo,
N. Haneda, H. Hanaya
[Re-partment of Administrative Services
Staff Member Y. Ohi, H. Myauchi
(Radiation Monitoring and Control in TIARA)
Staff Member S. Kaneko, Y. Takayama
(Radioactive Waste Management and Utility Control in TIARA)
- 361

This is a blank page.
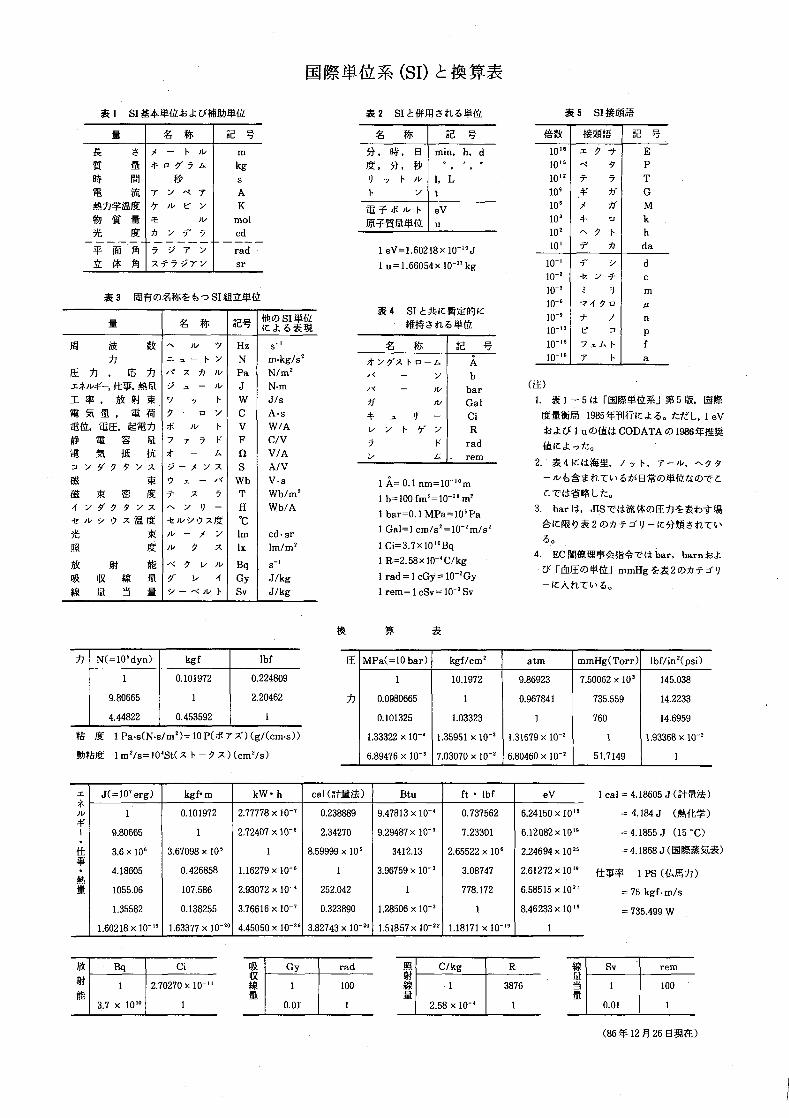
PI rx M V11 *1 (S 1)
A 2 SI �_- 4M L% h75 *a 5 SI 40�11ffi
2FF . S
FK m 5�, ", 0 min, hd loll Ein 4 C y kg it 6' I 0 I I I 1015 _Y p
rul s 1) Fji, 1, L 101, 5� 9 T
AL T -7 A v t 10, * G
M)j*MTk -t,- IL- Ef K 10, )y MM --e AI mol 'f, II, F eV 10, k
)j 7y 5 cd lo,
ad I e=1.60218x 10⁻¹⁹J to, 7y )tt da
sr- 1 u = 166054 x 10-17 kg lo-, -T dlo-, -L c
*3 [M:h6D?3 t SI tUM& 10-3 m
A4 SIJA1rNTn1r lo-, -f lufth CD SI Wa lo-, t nic r 6 Lt 10-12 e PI
S-1A A, 'y Hz 4� 10-11 7 fF N m.kgls' 10-11 7 a
EE Jj rL, h 7 �j IL, Pa N/m' b
fl*, Mt :�� - - IL, i N-m4-1 i� 17 F W Jifs bar
Gal 1. A I - 5 It RAWMW�j M 5 W. [NAxXt ft X n. 13 �/ C A-s 4 1) ci JORNN l985*T1MT1rJ,7z. tzt�L,, I eV
Ala. WE 9-4)] 't IL, F V W/A L, F 'Y R I u6DMA11 CODATA CD1986*fft,2
0 % �; 2 7 9 F F C/V 5i v rad ML f_t , tzla % la t�t t - A n V/A L rem
n -Yv A :; ;4 v A S A/V 2. 2A K(t;%T,
N 4i Wb V-s I 0. I nm=10-"m
9 T Wb/m' I LI= 100 fm'= 10" m2
- H Wb/A I bar-O. I MPa= IO'Pa 3- bar(t,
Aft IC 1 Gal= -' IC [W 1) A 2 6D b -3� Ic tt-cy �/ im cd-sr I cm/s' = 10' M/s' 6�
A ix Im/m, I Ci=3.7xio"Bq 4. EN1*(RVM-`TUbar, barn;tslL, IL, Bq S-1 1 R=2.58 x 10-'C/kg
-f Gy J/kg I rad = I cGy 10-'Gy Y riMF±CD*aj mmf-lg;�-SE 2 CDt, 9
a R la Sv IJ/kg I rem= I cSv 10-'Sv
N(=10'dyn) kgf W J1 MPa(=10 bar) kgf/cm' atm mmHg(Torr) lbf/in'(psi)
1 0.101972 0.224809 1 10.1972 9.86923 7.50062 x 10' 145.038
9.80665 1 2.20462 h 0.0980665 1 0.967841 735.559 14.2233
4.44822 0.453592 1 0.101325 1.03323 1 760 14.6959
M ft IPa-s(N.s/m')=IOP(,F,7;<)(g/(cm-s)) 1.33322 x 10⁻¹ 135951 x 10-'� 1.31579 x 10⁻¹ 1 1.93369 x 10⁻¹
aWk I MI/s= 101st(A F - �' 7) (Cm,/s) 6.89476 X 10⁻³ 7.03070 x 10' 6.80460 x 10⁻¹ 51.7149 1
X=10'erg) kgf- m kW- h c.1 U M&) Bt. ft Ibf I cal = 4.18605 J Ut-W&)
1 0.101972 2.77778 x 10⁻¹ 0.238889 9.47813 x 10⁻¹ 0.737562 6.24150 x IO 1 1 � 4.184 J (PAjL'4t)
9.80665 1 2.72407 x 10⁻¹ 2.34270 9.29487 x I 0- 1 7.23301 6.12082 x 1011 = 4.1855 J 15 'C)
3.6 x 10' 3.67098 x 10' 1 8.59999 x IO 1 3412.13 2.65522 x 10' 2.24694 x IO " � 4.1868 J (RIPMAX)
4.18605 0.426858 1.16279 x 10⁻¹ 1 3.96759 x 10⁻³ 3.08747 2.61272 x IO " f 1 pS (jLj
1055.06 107.586 2.93072 x 10⁻¹ 252.042 1 778.172 6.58515 x 10¹¹ 75 kgf -mls
1.35582 0.138255 3.76616 x 10⁻¹ 0.323890 1.28506 X 10⁻³ 1 8.46233 x 10 735.499 W
1.60218xlO-" 1.63377x)O-" 4.45050 x 10-213.82743 x 10⁻¹¹ 1.51857x 10⁻¹¹ 1.18171 x IO`9 1
Bq ci OR Gy rad R C/kg R Sv rem
1 2.70270 x 10⁻¹¹ 1 100 1 3876 i� 1 100
3.7 x 10" I 0.01 I 2.58 X 10⁻⁴ 1 It 0.01 1
(86 * 12A 26 El Na)
:2
c2)N-.4
x
Q
11Pl+.
tv
(Z
Q
f Po 1 Er: ii Er: t ,
6!adeftw '(