Genetic divergence and connectivity among river and reef spawning groups of walleye ( Sander vitreus...
12
Genetic divergence and connectivity among river and reef spawning groups of walleye (Sander vitreus vitreus) in Lake Erie Rex Meade Strange and Carol A. Stepien Abstract: Discerning population genetic structure is challenging for highly vagile open water animals, as contemporary gene flow may obscure historic phylogeographic patterns. We examined genetic variation among all 10 major river and reef spawning groups of walleye (Sander vitreus vitreus) in Lake Erie for evidence of isolation by distance, segregation by physiographic partitions, and natal site fidelity using 10 nuclear DNA microsatellite loci. Results revealed that al- though most spawning groups were distinguishable, relationships did not correspond with physiographic basins or dis- tances among localities. Bayesian analyses showed connectivity among some southern shore spawning groups, which included the largest-sized groups. Significant genetic divergence was discerned among walleye spawning in the river systems of eastern Lake Erie, as well as in two sites in western Lake Erie, along with marked isolation from Lake St. Clair. Population structure of Lake Erie walleye thus appears to reflect the interaction of two different intrinsic factors: isolation due to natal site fidelity that maintains patterns of divergence, and connectivity due to individuals that stray from their natal sites to spawn. Résumé : Il n’est pas facile de déterminer la structure génétique de la population chez les animaux très mobiles dans la masse d’eau, car le flux génique actuel peut obscurcir les patrons phylogéographiques du passé. Par l’analyse de 10 locus microsatellites d’ADN nucléaire, nous avons étudiéla variation génétique dans l’ensemble des dix principaux groupes de dorés jaunes (Sander vitreus vitreus) qui fraient dans les rivières et sur les récifs au lac Érié, à la recherche d’indices d’isolement par la distance, de ségrégation par partitions physiographiques et de fidélité au site de naissance. Nos résultats montrent que, bien qu’on puisse reconnaître la plupart des groupes de fraie, leurs relations ne correspon- dent pas aux bassins hydrographiques, ni aux distances entre les localités. Des analyses bayésiennes révèlent l’existence de connectivité entre certains groupes de fraie de la rive sud, qui incluent les groupes de plus grande taille. Nos don- nées indiquent aussi une divergence génétique significative chez les dorés qui fraient dans les bassins versants de l’est du lac Érié, de même qu’à deux sites dans l’ouest du lac Érié; elles montrent aussi un isolement vis-à-vis le lac St- Clair. La structure de population des dorés du lac Érié semble donc refléter l’interaction de deux facteurs intrinsèques distincts, l’isolement due à la fidélité au site de naissance qui maintient les patrons de divergence et la connectivité due aux individus qui s’éloignent de leur site de naissance pour se reproduire. [Traduit par la Rédaction] Strange and Stepien 448 Introduction The walleye (Sander (= Stizostedion) vitreus vitreus; Percidae) is one of the most economically important fish species in the Great Lakes. The species is a large and highly vagile piscivore endemic to the riverine and lacustrine sys- tems of eastern North America and attains greatest abun- dance in western Lake Erie (Hubbs and Lagler 2004). Only 10 primary spawning groups are recognized by Lake Erie fishery managers (Fig. 1), making the lake a geographically simple and relatively isolated system in which to assess mechanisms defining contemporary patterns of population connectivity and isolation. Understanding the ecological mechanisms regulating genetic divergences among spawning groups is important for successful resource management. Adult walleye forage in open water habitats and separate into discrete spawning groups in the spring. Walleye mature at age 2–3 in Lake Erie (Wolfert 1963) and spawn at night in small groups shortly after the ice breaks up in spring, with females depositing their eggs in a single night and males staying on the spawning grounds for up to several weeks (Scott and Crossman 1973). Some walleye groups spawn in specific tributary rivers, while other groups spawn on shal- low shoals or reefs of Lake Erie (Olson and Scidmore 1962; Todd and Haas 1993). Tagging studies indicate that individu- als tend to return to their natal spawning locations (Regier et Can. J. Fish. Aquat. Sci. 64: 437–448 (2007) doi:10.1139/F07-022 © 2007 NRC Canada 437 Received 31 July 2006. Accepted 14 December 2006. Published on the NRC Research Press Web site at http://cjfas.nrc.ca on 27 March 2007. J19455 R.M. Strange 1 and C.A. Stepien. 2 Great Lakes Genetics Laboratory, Lake Erie Center and Department of Environmental Sciences, The University of Toledo, 6200 Bayshore Road, Toledo, OH 43618, USA. 1 Present address: Department of Biology, University of Southern Indiana, Evansville, IN 47712, USA. 2 Corresponding author (e-mail: [email protected])
Transcript of Genetic divergence and connectivity among river and reef spawning groups of walleye ( Sander vitreus...
Genetic divergence and connectivity among riverand reef spawning groups of walleye (Sandervitreus vitreus) in Lake Erie
Rex Meade Strange and Carol A. Stepien
Abstract: Discerning population genetic structure is challenging for highly vagile open water animals, as contemporarygene flow may obscure historic phylogeographic patterns. We examined genetic variation among all 10 major river andreef spawning groups of walleye (Sander vitreus vitreus) in Lake Erie for evidence of isolation by distance, segregationby physiographic partitions, and natal site fidelity using 10 nuclear DNA microsatellite loci. Results revealed that al-though most spawning groups were distinguishable, relationships did not correspond with physiographic basins or dis-tances among localities. Bayesian analyses showed connectivity among some southern shore spawning groups, whichincluded the largest-sized groups. Significant genetic divergence was discerned among walleye spawning in the riversystems of eastern Lake Erie, as well as in two sites in western Lake Erie, along with marked isolation from Lake St.Clair. Population structure of Lake Erie walleye thus appears to reflect the interaction of two different intrinsic factors:isolation due to natal site fidelity that maintains patterns of divergence, and connectivity due to individuals that strayfrom their natal sites to spawn.
Résumé : Il n’est pas facile de déterminer la structure génétique de la population chez les animaux très mobiles dansla masse d’eau, car le flux génique actuel peut obscurcir les patrons phylogéographiques du passé. Par l’analyse de 10locus microsatellites d’ADN nucléaire, nous avons étudiéla variation génétique dans l’ensemble des dix principauxgroupes de dorés jaunes (Sander vitreus vitreus) qui fraient dans les rivières et sur les récifs au lac Érié, à la recherched’indices d’isolement par la distance, de ségrégation par partitions physiographiques et de fidélité au site de naissance.Nos résultats montrent que, bien qu’on puisse reconnaître la plupart des groupes de fraie, leurs relations ne correspon-dent pas aux bassins hydrographiques, ni aux distances entre les localités. Des analyses bayésiennes révèlent l’existencede connectivité entre certains groupes de fraie de la rive sud, qui incluent les groupes de plus grande taille. Nos don-nées indiquent aussi une divergence génétique significative chez les dorés qui fraient dans les bassins versants de l’estdu lac Érié, de même qu’à deux sites dans l’ouest du lac Érié; elles montrent aussi un isolement vis-à-vis le lac St-Clair. La structure de population des dorés du lac Érié semble donc refléter l’interaction de deux facteurs intrinsèquesdistincts, l’isolement due à la fidélité au site de naissance qui maintient les patrons de divergence et la connectivité dueaux individus qui s’éloignent de leur site de naissance pour se reproduire.
[Traduit par la Rédaction] Strange and Stepien 448
Introduction
The walleye (Sander (= Stizostedion) vitreus vitreus;Percidae) is one of the most economically important fishspecies in the Great Lakes. The species is a large and highlyvagile piscivore endemic to the riverine and lacustrine sys-tems of eastern North America and attains greatest abun-dance in western Lake Erie (Hubbs and Lagler 2004). Only10 primary spawning groups are recognized by Lake Eriefishery managers (Fig. 1), making the lake a geographicallysimple and relatively isolated system in which to assessmechanisms defining contemporary patterns of populationconnectivity and isolation. Understanding the ecological
mechanisms regulating genetic divergences among spawninggroups is important for successful resource management.
Adult walleye forage in open water habitats and separateinto discrete spawning groups in the spring. Walleye matureat age 2–3 in Lake Erie (Wolfert 1963) and spawn at night insmall groups shortly after the ice breaks up in spring, withfemales depositing their eggs in a single night and malesstaying on the spawning grounds for up to several weeks(Scott and Crossman 1973). Some walleye groups spawn inspecific tributary rivers, while other groups spawn on shal-low shoals or reefs of Lake Erie (Olson and Scidmore 1962;Todd and Haas 1993). Tagging studies indicate that individu-als tend to return to their natal spawning locations (Regier et
Can. J. Fish. Aquat. Sci. 64: 437–448 (2007) doi:10.1139/F07-022 © 2007 NRC Canada
437
Received 31 July 2006. Accepted 14 December 2006. Published on the NRC Research Press Web site at http://cjfas.nrc.ca on27 March 2007.J19455
R.M. Strange1 and C.A. Stepien.2 Great Lakes Genetics Laboratory, Lake Erie Center and Department of Environmental Sciences,The University of Toledo, 6200 Bayshore Road, Toledo, OH 43618, USA.
1Present address: Department of Biology, University of Southern Indiana, Evansville, IN 47712, USA.2Corresponding author (e-mail: [email protected])
al. 1969; Goodyear et al. 1982), which appears to have a ge-netic basis (Jennings et al. 1996). Thus, natal site fidelity isa likely mechanism for maintaining population structure inwalleye.
Demographic mechanisms may further regulate genetic struc-ture in Lake Erie walleye. The largest spawning runs occur inthe west, and smaller groups spawn in rivers and reefs of thecentral and eastern basins (Wolfert 1963; Schneider and Leach1977). Although tagging studies have revealed relatively littleoverall migration, some walleye move seasonally from the westto the east (Thomas et al. 2005) or west into Lake St. Clair (Fer-guson and Derksen 1971; Todd and Haas 1993). Walleye in thewestern basin outnumber those in the east by an order of magni-tude (Thomas et al. 2005); thus, connectivity may be driven bydifferent intrinsic growth rates among spawning groups. In otherwords, patterns of gene flow may be dominated by the largestspawning groups, which have greater reproductive success (i.e.,increased recruitment) and from which more migratory individu-als may stray (e.g., owing to overcrowding) to spawn with othergroups. Great year-class variation, faster growth, and earlier ma-turity characterize walleye in western Lake Erie from those inthe east (Colby and Nepszy 1981). Moreover, genetic structure
within Lake Erie may be complicated by the population crash ofwalleye (as measured by annual catches) from the late 1950sthrough 1970s because of exploitation and habitat loss and theirlater recovery (Colby and Nepszy 1981; Hatch et al. 1987;Knight 1997), which likely altered patterns of gene flow and di-vergence.
The objective of this study was to test whether populationgenetic structure exists within Lake Erie walleye and to inferits defining mechanisms. Although geographically isolatedpopulations of walleye are known to be genetically distinct(Billington and Strange 1995; Stepien and Faber 1998), fewstudies have investigated isolation and connectivity in a sin-gle system with a comprehensive sampling design (but seeStepien 1995 and Stepien and Faber 1998 for an mtDNA se-quence analysis of Lake Erie walleye). Here we employed alandscape genetics analytical approach (Manel et al. 2003)to test the spatial distribution of genetic diversity in relationto extrinsic environmental features and intrinsic behavior.This study examined genetic variation at 10 microsatelliteloci among walleye from all primary river and lake spawn-ing groups in Lake Erie for evidence of (i) isolation by geo-graphic distance, (ii) physiographic differences, and
© 2007 NRC Canada
438 Can. J. Fish. Aquat. Sci. Vol. 64, 2007
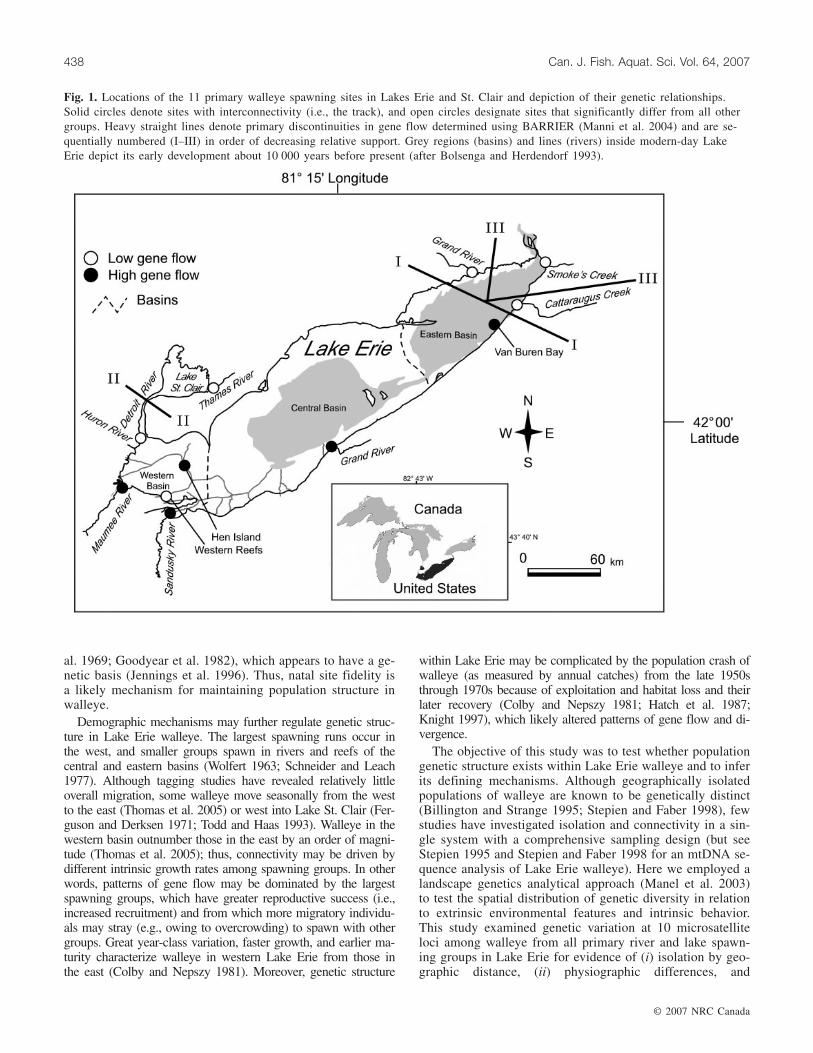
Fig. 1. Locations of the 11 primary walleye spawning sites in Lakes Erie and St. Clair and depiction of their genetic relationships.Solid circles denote sites with interconnectivity (i.e., the track), and open circles designate sites that significantly differ from all othergroups. Heavy straight lines denote primary discontinuities in gene flow determined using BARRIER (Manni et al. 2004) and are se-quentially numbered (I–III) in order of decreasing relative support. Grey regions (basins) and lines (rivers) inside modern-day LakeErie depict its early development about 10 000 years before present (after Bolsenga and Herdendorf 1993).
(iii) natal site fidelity. Finally, we asked whether geneticstructure is associated with or driven by demographic pro-cesses, and if so, to what extent.
Materials and methods
Study areaThe Great Lakes are geologically young (<13 000 years)
and formed during the retreat of the last of the Pleistoceneglaciations (Bolsenga and Herdendorf 1993). Most fishesnow present in the lower Great Lakes colonized the newlyformed habitats from lotic systems located south of the gla-cial maximum. In particular, fishes are believed to have en-tered Lake Erie from the west through a connection betweenthe Wabash River and Maumee River valleys, whereas othersare hypothesized to have entered from an eastern glacialrefugium (Bailey and Smith 1981; see also Billington et al.1992). Such physical isolation of different glacial refugiumgroups within the Lake Erie system may have existed as re-cently as 7 000 – 10 000 years before present, when the cen-tral and eastern basins of Lake Erie were relatively isolatedfrom one another and aquatic habitats in the western basinconsisted of a river system draining a low lying plain (seeshaded interior of Fig. 1; Holcombe et al. 2003).
Present-day Lake Erie is a relatively isolated system, andits drainage is separated by divides from adjacent river sys-tems (e.g., the Ohio River system to the south, from LakeOntario to the east by Niagara Falls, and from the upperGreat Lakes to the west by the Detroit River that drains fromLake St. Clair) (see Fig. 1). The Detroit River presumablyconstrains gene flow between Lake Erie and the upper GreatLakes through a narrow connection and thus may represent apotential bottleneck relative to the open water connections ofLake Erie.
Lake Erie is the shallowest of the five Great Lakes, and itsnatural division into three physiographic basins is of consid-
erable ecological importance. The western basin is the mostbiologically productive region of the Lake and houses manyislands and associated shoals (Bolsenga and Herdendorf1993). The western region of the Lake constitutes the mostimportant walleye spawning and nursery area in Lake Erie(Nepszy 1977). Each year, river spawning groups of walleyeenter the Huron (Michigan), Maumee (Ohio), and Sandusky(Ohio) rivers of the western basin, with the largest spawningrun occurring in the Maumee River (Nepszy 1977). Walleyealso spawn over an extensive reef system consisting of nu-merous shoals in the western basin (Jeffrey Tyson, Ohio Di-vision of Wildlife, 305 E. Shoreline Drive, Sandusky, OH44870, personal communication).
In contrast, the central basin is deeper, has few islands, andcontains a single primary spawning location for walleye in thesouth (e.g., Grand River (Ohio)). Habitats along the northerncoast of the Lake are unsuitable for walleye spawning. Theeastern basin contains the deepest regions of the Lake, has fewshoal areas, and is not as biologically productive as the westernbasin (Bolsenga and Herdendorf 1993). Resident populationsof walleye are known to spawn at a single shoal area (VanBuren Bay, New York) and in three rivers of the eastern basin:Cattaraugus Creek (New York), Smoke’s Creek (New York),and Grand River (Ontario). The shoal area at Van Buren Bayonce housed the “blue pike” walleye subspecies Sander vitreusglaucus, which became extinct by the late 1950s because of ex-ploitation (see Stone 1948; Scott and Crossman 1973; Stepienand Faber 1998). The physiographic differences in Lake Erierepresent a heterogeneous suite of foraging habitats, whichcombined with the small number of spawning sites for walleyemay result in the segregation of spawning groups situated in ei-ther the western or eastern basins.
Sample collectionA sound sampling strategy is necessary to avoid erroneous
conclusions regarding population structure in highly migra-
© 2007 NRC Canada
Strange and Stepien 439
Spawning group N HO HE FIS NA NPA PPA
Lake St. ClairThames River, Ont. 2004 38 0.745 0.766 0.028 79 1 0.013
Western basin, Lake ErieHuron River, Mich. 2003 20 0.745 0.761 0.021 84 1 0.012Maumee River, Ohio 2003 76 0.698 0.758 0.073* 107 3 0.028Western Reefs, Ohio 2004 20 0.675 0.675 0.001 72 1 0.014Hen Island Reef, Ont. 2003 82 0.671 0.735 0.087* 108 2 0.019Sandusky River, Ohio 2003 20 0.775 0.780 0.007 82 2 0.024
Central basin, Lake ErieGrand River, Ohio 2003 30 0.660 0.793 0.168* 88 1 0.011
Eastern basin, Lake ErieVan Buren Bay, N.Y. 2003 77 0.716 0.779 0.082* 104 7 0.067Cattaraugus Creek, N.Y. 2003 30 0.700 0.764 0.084* 92 3 0.033Smoke’s Creek, N.Y. 2003 20 0.780 0.787 0.009 84 2 0.024Grand River, Ont. 2003–2004 35 0.674 0.779 0.134* 91 2 0.022
Total for Lake Erie 410 0.704 0.778 0.095*Total for all sites 448 0.707 0.779 0.093*
Note: N, sample size; HO, observed and HE, expected heterozygosity; FIS, deviation from Hardy–Weinberg (HW) proportions; NA, number of alleles; NPA,number of private alleles; PPA, proportion of private alleles. Divergences from HW proportions prior to Bonferroni correction (P < 0.05) are denoted by aster-isks (*), although all spawning groups conformed to equilibrium expectations following Bonferroni correction and exclusion of the SviL8 locus (P < 0.0056).
Table 1. Summary statistics for walleye spawning groups from Lakes Erie and St. Clair based on 10 microsatellite loci.
tory fishes. Therefore, samples of fin clips in tag and releaseprograms were taken from spawning walleye either enteringor leaving or over their spawning locations, as recommendedby the International Great Lakes Fishery Commission’sLake Erie Walleye Task Group (Roger Knight, Ohio Divi-sion of Wildlife, 305 E. Shoreline Drive, Sandusky, OH44870, USA, personal communication). Most of the sampleswere taken by state, federal, and provincial agencies duringtheir monitoring programs and included the 10 primaryspawning groups in Lake Erie and a single spawning area inneighboring Lake St. Clair (Table 1; Fig. 1). The samplingsites did not have a known history of stocking, exceptCattaraugus Creek and Smoke’s Creek, New York, whichare no longer being stocked (Donald Einhouse, New YorkDepartment of Environmental Conservation, Dunkirk, NY14048, USA, personal communication) and whose briefstocking history was not successful and did not geneticallyaffect the native genotypes (see Stepien et al. 2004).
To reduce possible complications in comparing spawninggroups taken from different years, we restricted our LakeErie samples to the 2003 spawning season, except for theThames River (Lake St. Clair) and the Western Reefs, whichwere collected during the 2004 spawning season. The2003 year class produced by walleye spawning in Lake Eriewas the strongest for over 20 years (Roger Knight, Ohio Di-vision of Wildlife, 305 E. Shoreline Drive, Sandusky, OH44870, USA, personal communication), rendering the pres-ent study an important baseline. Sex information was re-corded for seven of the spawning groups (e.g., Huron River,Sandusky River, Grand River (Ohio), Van Buren Bay,Cattaraugus Creek, Smoke’s Creek, and Grand River (On-tario)), enabling us to test for differences in allelic distribu-tions between males and females. Each sample consisted ofa small (1–2 cm2) piece of pectoral or caudal fin fixed in95% ethanol (EtOH) and then stored at room temperature inthe laboratory. Most specimens were subsequently releasedby agency personnel.
DNA extraction, amplification, and allelic determinationGenomic DNA was extracted from the EtOH-fixed tissues
either following traditional phenol–chloroform procedures orwith the Qiagen DNeasy kit, following the manufacturer’sdirections (Qiagen, Inc., Valencia, California). DNA extrac-tions were frozen and archived in the Great Lakes GeneticsLaboratory for future studies. The polymerase chain reaction(PCR) was used to amplify allelic length variants from 10microsatellite loci developed by other investigators forwalleye, including Borer et al. (1999: Svi4, Svi6, Svi17,Svi18, Svi33), Wirth et al. (1999: SviL6, SviL7, SviL8), andEldridge et al. (2002: Svi2 and Svi7). PCR reactions con-sisted of 50 mmol·L–1 KCl, 1.5 mmol·L–1 MgCl2,10 mmol·L–1 Tris–HCl, 50 µmol·L–1 of each deoxy-nucleotide, 0.5 µmol·L–1 of both forward and reverse prim-ers, 5–30 ng DNA template, and 0.6–1.2 units of Taqpolymerase per 10 microlitres of reaction volume. For eachlocus, the forward primer was synthesized with a 5′ fluores-cent label to allow visualization on an ABI 3130 genetic an-alyzer (Applied Biosystems Inc., Fullerton, California), andfour different dye labels were used to facilitate multi- andpool-plexing of loci. A sterile mineral oil overlay was addedto ensure that the reaction volume remained constant
throughout the PCR cycles. A thermal cycle of 2 min at94 °C for initial denaturation was followed by 35 cycles ofdenaturation (94 °C, 30 s), primer annealing (1 min) at aprimer-specific temperature, and polymerase extension(72 °C, 30 s). A final extension at 72 °C for 5 min was in-cluded to minimize the number of partial strands. Annealingtemperatures were either 54 °C (SviL6, SviL7, SviL8, Svi17)or 60 °C (Svi2, Svi3, Svi4, Svi6, Svi7, Svi18, Svi33). Thisprocedure was found to be robust and allowed formultiplexing primer sets with similar annealing tempera-tures.
Amplification products were prepared prior to electropho-resis by diluting 1:50 with dH2O; 1 µL of this dilution wasthen added to 13 µL of a solution containing formamide andGene Scan 500 LIZ size standard (ABI) and loaded onto a96-well plate. Finally, microsatellite products were dena-tured for 2 min at 95 °C prior to loading. Allelic variantswere identified by size using GeneMapper 3.7 software(ABI).
Data analysesThe set of samples included in our data set was modeled
as a spatial set of panmictic subpopulations within the totalpopulation of Lake Erie walleye. There is an ongoing debateas to which equivalents of FST (i.e., the degree of genetic di-vergence among putative subpopulations) are best suited foranalyzing divergences based on microsatellite data (seeHedrick 1999; Balloux and Lugon-Moulin 2002). Since therelationships among recently diverged populations, such asthose tested here for our fine-scale analyses of Lake Erie,have been shown to be better resolved in models with θST(the FST estimate of Weir and Cockerham 1984; see Ballouxand Lugon-Moulin 2002), that method was adopted here.Thus, F statistic analogs (Wright 1943; Weir and Cockerham1984) and their associated levels of significance were usedto quantify genetic heterogeneity using the programs FSTAT(Goudet 1995) and GENEPOP 3.3 (Raymond and Rousset1995; also refer to http://genepop.curtin.edu.au/).
Genetic variability within subpopulations first was esti-mated as the number of alleles per locus (NA), the number ofprivate alleles (NPA), the proportion of private alleles (PPA),and estimates of the observed (HO) and expected (HE)heterozygosities (Table 1). Variation within each populationwas quantified as FIS = (1 – [HO(HE)–1]). Any departuresfrom Hardy–Weinberg (HW) expectations were assessed bya Markov chain method analogous to Fisher’s exact tests(Guo and Thompson 1992), as implemented by GENEPOPusing 5000 dememorizations, 500 batches, and 5000 itera-tions per batch. In addition, the loci were tested for linkagedisequilibrium. Possible occurrence of null (nonamplified)alleles was assessed using the procedure of van Oosterhoutet al. (2004, 2006) in the program MICRO-CHECKER (alsorefer to http://www.microchecker.hull.ac.uk).
Comparative pairwise tests of allelic frequency heteroge-neity also were conducted using Goudet et al.’s (1996) testfor genetic differentiation based on an exact nonparametricprocedure in GENEPOP, which was independent of FST andHW equilibrium expectations and employed the same pa-rameters as above for the Markov chain. Critical values forall tests involving multiple comparisons were subjected toBonferroni correction (Rice 1989). Similarly, we tested for
© 2007 NRC Canada
440 Can. J. Fish. Aquat. Sci. Vol. 64, 2007
possible differences in allelic representation between malesand females using Goudet et al.’s (1996) genetic differentia-tion test, within the seven spawning groups with availablesex data.
The distribution of allelic combinations (genotypes)within the total population of Lake Erie walleye was ana-lyzed by means of exact tests and quantified as FIT. The de-gree of genetic divergence among putative subpopulations(either spawning groups or basins) was estimated as FST,which assumes that divergences represent equilibrium be-tween gene flow and genetic drift (Wright 1978). Values ofFST that differ significantly (P < 0.05) from zero falsify thenull hypothesis of panmixia between the putativesubpopulations (spawning groups; Wright 1978).
Although evidence suggests that adult walleye tend to re-turn to their natal sites to spawn, it is reasonable to assumethat some may stray and join other spawning groups. If thisis true, it may be hypothesized that migrant walleye eitherspawn at localities close to their natal sites or randomly joinother spawning groups in Lake Erie. Isolation by distancewould be consistent with the elongate structure of the Lake(i.e., a stepping-stone model of gene flow). Therefore, wetested whether or not the stepping-stone model is an appro-priate model for walleye in Lake Erie through the regressionof FST(1 – FST)–1 against the natural logarithm of geograph-ical distance (which is expected to be linear under isolationby distance in two dimensions; Rousset 1997). Geographicaldistance was measured as the shortest waterway distance(km) between pairs of spawning sites. The significance ofthe regression was tested using the procedure of Mantel(1967). Pairwise gene flow between spawning groups wasestimated using Slatkin’s (1985) private allele measure ofNm (migration rate m of N individuals exchanged betweensites per generation) under the rationale that private allelesare likely to attain higher frequencies in sites when geneflow is low.
The relative magnitude of genetic structure amongwalleye spawning groups was further investigated bycombining the philosophy of continuous track analysis
developed by Alroy (1995) with an analytic approachbased on computational geometry using algorithmsimplemented in the program BARRIER 2.2 (Manni et al.2004; also refer to www.mnhn.fr/mnhn/ecoanthropologie/software/barrier.html). The locations of genetic disconti-nuities in these analyses were made without reference toa priori knowledge of landscape features that might de-fine population structure (e.g., basins). A track is definedas a geographically continuous assemblage of samplingsites (i.e., spawning groups here) that are linked by ap-preciable gene flow (Wright 1978). Pairwise estimates ofFST were mapped onto a matrix of their geographic co-ordinates (latitude and longitude), and a Monmoniermaximum-difference algorithm identified which of theborders between neighboring populations exhibited thehighest level of genetic divergence (Manni et al. 2004).Initial estimates of genetic discontinuities were madewith a multilocus FST matrix, followed by a second anal-ysis that incorporated single-locus FST values. This pro-cedure ranked each identified barrier in relativemagnitude, according to respective support from individ-ual loci FST values.
To further distinguish populations, we used a Bayesian-based clustering algorithm, which is independent of assump-tions about mutation process, as implemented in the programSTRUCTURE (vers. 2.2; Pritchard et al. 2000; also refer tohttp://pritch.bsd.uchicago.edu). Briefly, this analysis assignsindividual fish to putative groups on the basis of distinctivegenotypic frequencies without prior knowledge of their truespawning population identity. We analyzed correspondenceto spawning groups by specifying number of groups (K) inindependent runs of the algorithm, ranging from K = 1 (thustesting the null hypothesis of panmixia) to K = 10 (the totalN of spawning sites sampled in Lake Erie). The program as-signed individuals to one or more groups, with their relativefrequency of predicted membership in groups totaling 1.00.The burn-in period consisted of 100 000 replications, afterwhich 700 000 Markov chain Monte Carlo (MCMC) simula-tions were run on pooled samples for K = 1–10 under a
© 2007 NRC Canada
Strange and Stepien 441
Locus NA Size range (bp) FIS FIT FST
Svi2 14 190–220 0.069 0.120*** 0.016***Svi4 11 104–122 0.072 0.079*** 0.034***Svi6 21 140–170 0.022 0.068*** 0.017***Svi7 13 156–172 0.055 0.116*** 0.007*Svi17 9 102–118 0.056 0.106*** 0.019**Svi18 10 116–130 0.199* 0.323*** 0.154***Svi33 12 82–104 0.046 –0.002 0.034***SviL6 19 108–136 0.044 0.043* 0.003***SviL7 22 192–226 0.045 0.054*** 0.010***SviL8 18 120–144 0.266* 0.271*** 0.008***
Total 149 — 0.093* 0.117*** 0.029***
Note: NA is the number of alleles, bp indicates base pairs, FIS quantifies the average differentiation within aspawning group, FIT quantifies deviation in the total sample (i.e., all walleye sampled in the two lakes), andFST represents the average genetic divergence between pairs of spawning groups. Significant contribution topopulation genetic structure is indicated by asterisks: *, P < 0.05; **, P < 0.01; ***, P < 0.001. The SviL8 lo-cus was not used in further analyses, since it did not conform to Hardy–Weinberg (HW) equilibrium expecta-tions because of null alleles.
Table 2. Summary statistics for 10 microsatellite loci across the 11 spawning groups of walleyefrom Lakes Erie and St. Clair.
model assuming admixture. We then examined the consis-tency among 10 independent runs at each K, the comparativeprobabilities of individuals assigning to one or more groups,the log-likelihood and posterior probability values from eachrun, and their respective grouping patterns, following theprogram methodology. In addition, we calculated ∆K ac-cording to the procedure recommended by Evanno et al.(2005), which is based on the rate of change in the log prob-ability of data between successive K values. The magnitudeof ∆K over the 10 replicate runs was graphed against K forK = 2–10, and the height of the modal value of the distribu-tion was used to additionally verify the correct K value. Re-sults of the STRUCTURE analyses then were comparedwith spawning group relationships derived from theBARRIER and genetic divergence analyses.
Results
Variation within spawning groupsGenotypic data were collected for 448 walleye from 10
locations within Lake Erie and a single location in Lake St.Clair (Table 1; Fig. 1). Loci were unlinked and were highlypolymorphic, ranging from 9 (Svi17) to 22 (SviL7) allelesper locus (Table 2). Within each spawning group sample,each locus was represented by two to four common allelesand a larger number of alleles at lower frequencies. The av-erage number of alleles per spawning group was 90.18(range = 79–108); including one to three private alleles, ex-cept for Van Buren Bay where seven uniquely occurring al-leles were present (Table 1). Walleye spawning at Van BurenBay thus had the highest overall proportional representationof private alleles (PPA = 0.067), whereas the sample fromGrand River (Ohio) had the smallest proportion (PPA =0.011).
Observed heterozygosities for each spawning group weresimilar, ranging from 0.660 to 0.780 (Table 1). Out of the 11spawning locations sampled, FIS values for six (e.g., Hen Is-land, Maumee River, Grand River (Ohio), Van Buren Bay,Cattaraugus Creek, and Grand River, (Ontario)) showed sig-nificant deviations from HW equilibrium after Bonferronicorrection (critical P for 10 loci = 0.005). All deviationsfrom HW involved a single locus (SviL8), which was due tothe presence of null alleles for those spawning groups at thatlocus (based on analysis using MICRO-CHECKER (vanOosterhout et al. 2004)). After removal of the SviL8 locus,all populations were in HW equilibrium using the remainingnine loci. Therefore, all subsequent genetic analyses wereperformed without the SviL8 locus. We found no significantdifferences in allelic distributions between males and fe-males collected from the same locality within the seven sam-ples for which sex information was available.
Divergence patterns among spawning sitesCombining data from all 10 microsatellite loci for all sites
combined revealed a significant departure from HW propor-tions (FIT = 0.117, P < 0.0001), thus falsifying the null hy-pothesis of a single panmictic population. Similar significantresults were obtained when data from the SviL8 locus wasthen excluded from the analysis. Based on nine loci, signifi-cant allelic frequency differences were observed for 45 ofthe 55 pairwise comparisons among the 11 spawning sites
© 2007 NRC Canada
442 Can. J. Fish. Aquat. Sci. Vol. 64, 2007
Tha
mes
Riv
er,
Ont
.
Hur
onR
iver
,M
ich.
Mau
mee
Riv
er,
Ohi
o
Wes
tR
eefs
,O
hio
Hen
Isla
nd,
Ont
.
San
dusk
yR
iver
,O
hio
Gra
ndR
iver
,O
hio
Van
Bur
enB
ay,
N.Y
.
Cat
tara
ugus
Cre
ek,
N.Y
.
Sm
oke’
sC
reek
,N
.Y.
Gra
ndR
iver
,O
nt.
Tha
mes
Riv
er—
2.36
1.15
2.86
1.48
1.07
1.26
0.84
4.77
1.49
2.30
Hur
onR
iver
0.04
6***
—1.
202.
020.
951.
191.
170.
871.
473.
241.
74M
aum
eeR
iver
0.05
1***
0.03
8***
—1.
654.
615.
044.
348.
091.
281.
031.
96W
est
Ree
fs0.
018*
**0.
061*
**0.
057*
**—
1.58
1.96
1.52
1.09
2.41
2.06
2.43
Hen
Isla
nd0.
049*
**0.
031*
**0.
004*
0.05
8***
—4.
613.
703.
701.
271.
202.
43S
andu
sky
Riv
er0.
051*
**0.
045*
**0.
001
0.06
0***
0.00
3—
2.75
3.52
1.54
1.10
1.58
Gra
ndR
iver
,O
hio
0.04
3***
0.03
3***
0.00
10.
051*
**0.
002
0.00
2—
3.85
1.12
0.93
1.64
Van
Bur
enB
ay0.
059*
**0.
044*
**0.
002
0.06
3***
0.01
1*0.
001
0.00
8—
0.90
0.83
1.70
Cat
tara
ugus
Cre
ek0.
006
0.03
2***
0.04
8***
0.01
6***
0.04
7***
0.04
6***
0.03
7***
0.05
0***
—1.
712.
50S
mok
e’s
Cre
ek0.
044*
**0.
001
0.03
3***
0.05
5***
0.02
7***
0.03
1***
0.03
3***
0.03
1***
0.03
4**
—1.
45G
rand
Riv
er,
Ont
.0.
032*
**0.
051*
**0.
051*
**0.
055*
**0.
041*
**0.
045*
**0.
042*
**0.
052*
**0.
039*
**0.
029*
**—
Not
e:F
STva
lues
repr
esen
tW
eir
and
Coc
kerh
am’s
(198
4)co
rrec
tion
ofF
ST.
Sign
ific
ance
ofdi
verg
ence
betw
een
spaw
ning
grou
psis
indi
cate
dby
aste
risk
saf
ter
the
FST
valu
e:*,
P<
0.05
;**
,P
<0.
01;
***,
P<
0.00
1.
Tab
le3.
Pair
wis
ees
tim
ates
ofm
igra
tion
(Nm
;ab
ove
diag
onal
)an
dF
ST
valu
es(b
elow
diag
onal
)am
ong
spaw
ning
popu
lati
ons
ofw
alle
yefr
omL
akes
Eri
ean
dS
t.C
lair
base
don
nine
mic
rosa
tell
ite
loci
.
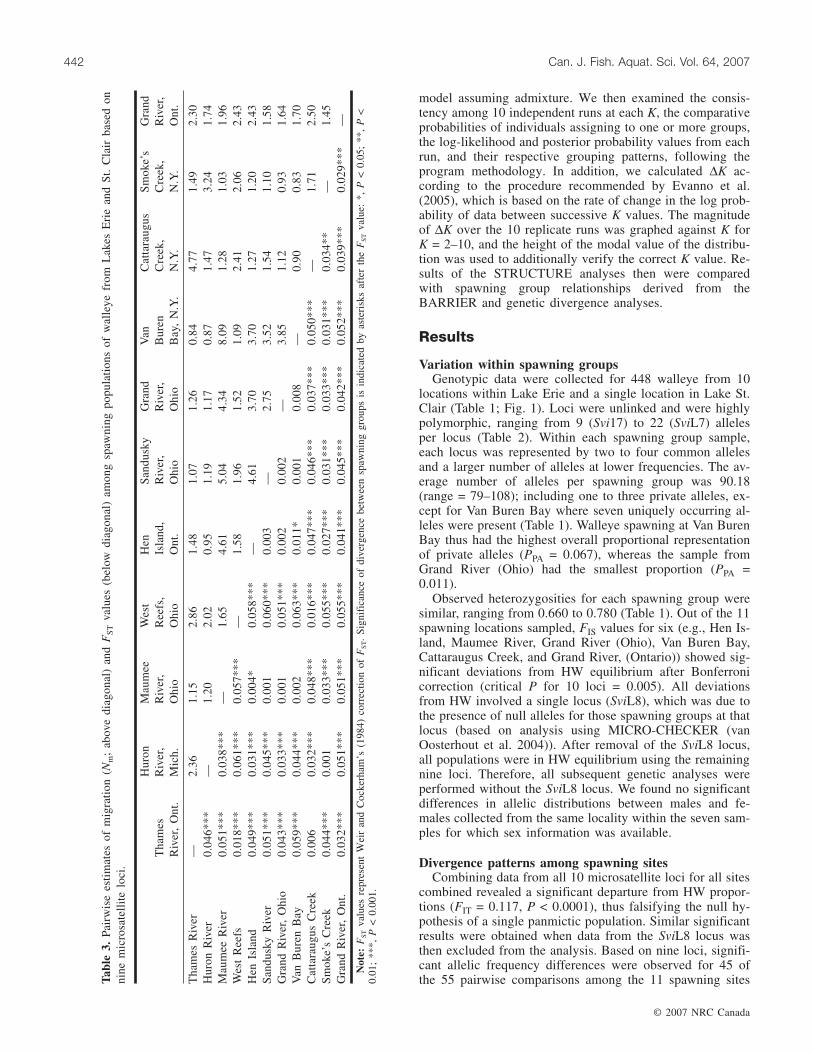
(Table 3). Using a critical P = 0.05 × 55–1 for Bonferronicorrection, 42 pairwise FST values remained significant.Pooling genotypic data from each spawning group into re-spective physiographic regions (Table 1) revealed a statisti-cally significant divergence between Lakes St. Clair andErie (FST = 0.026, P = 0.039). Overall distinctions betweenthe western and eastern basins of Lake Erie were not signifi-cant (FST = 0.006, P = 0.341) and suggest that walleye pop-ulations are not partitioned according to physiographicdifferences. Comparative pairwise tests of allelic frequencyheterogeneity (Goudet et al. 1996) were congruent with theFST results shown in Table 3.
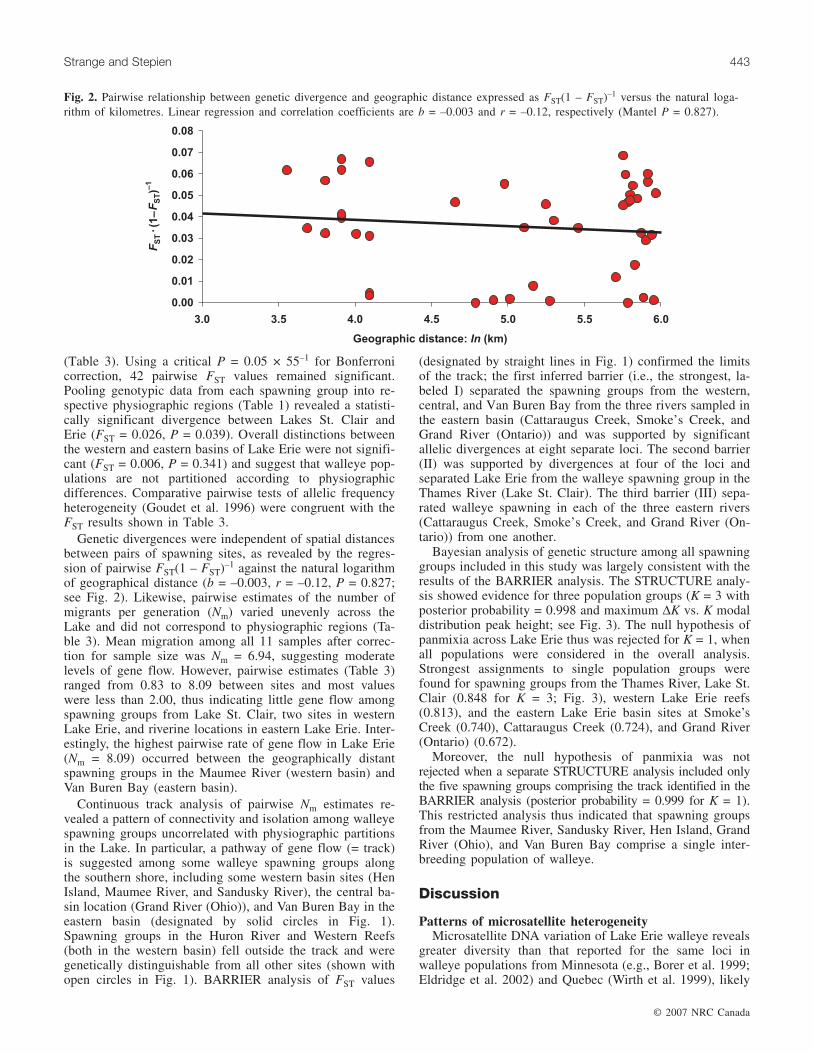
Genetic divergences were independent of spatial distancesbetween pairs of spawning sites, as revealed by the regres-sion of pairwise FST(1 – FST)–1 against the natural logarithmof geographical distance (b = –0.003, r = –0.12, P = 0.827;see Fig. 2). Likewise, pairwise estimates of the number ofmigrants per generation (Nm) varied unevenly across theLake and did not correspond to physiographic regions (Ta-ble 3). Mean migration among all 11 samples after correc-tion for sample size was Nm = 6.94, suggesting moderatelevels of gene flow. However, pairwise estimates (Table 3)ranged from 0.83 to 8.09 between sites and most valueswere less than 2.00, thus indicating little gene flow amongspawning groups from Lake St. Clair, two sites in westernLake Erie, and riverine locations in eastern Lake Erie. Inter-estingly, the highest pairwise rate of gene flow in Lake Erie(Nm = 8.09) occurred between the geographically distantspawning groups in the Maumee River (western basin) andVan Buren Bay (eastern basin).
Continuous track analysis of pairwise Nm estimates re-vealed a pattern of connectivity and isolation among walleyespawning groups uncorrelated with physiographic partitionsin the Lake. In particular, a pathway of gene flow (= track)is suggested among some walleye spawning groups alongthe southern shore, including some western basin sites (HenIsland, Maumee River, and Sandusky River), the central ba-sin location (Grand River (Ohio)), and Van Buren Bay in theeastern basin (designated by solid circles in Fig. 1).Spawning groups in the Huron River and Western Reefs(both in the western basin) fell outside the track and weregenetically distinguishable from all other sites (shown withopen circles in Fig. 1). BARRIER analysis of FST values
(designated by straight lines in Fig. 1) confirmed the limitsof the track; the first inferred barrier (i.e., the strongest, la-beled I) separated the spawning groups from the western,central, and Van Buren Bay from the three rivers sampled inthe eastern basin (Cattaraugus Creek, Smoke’s Creek, andGrand River (Ontario)) and was supported by significantallelic divergences at eight separate loci. The second barrier(II) was supported by divergences at four of the loci andseparated Lake Erie from the walleye spawning group in theThames River (Lake St. Clair). The third barrier (III) sepa-rated walleye spawning in each of the three eastern rivers(Cattaraugus Creek, Smoke’s Creek, and Grand River (On-tario)) from one another.
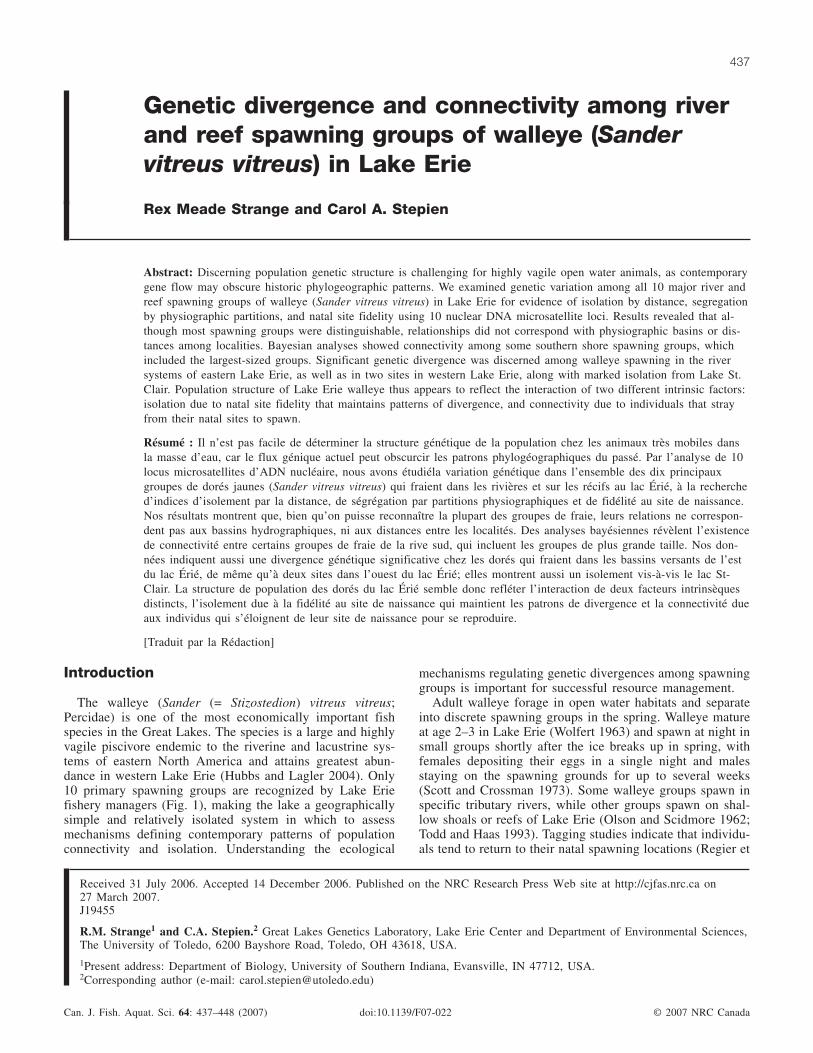
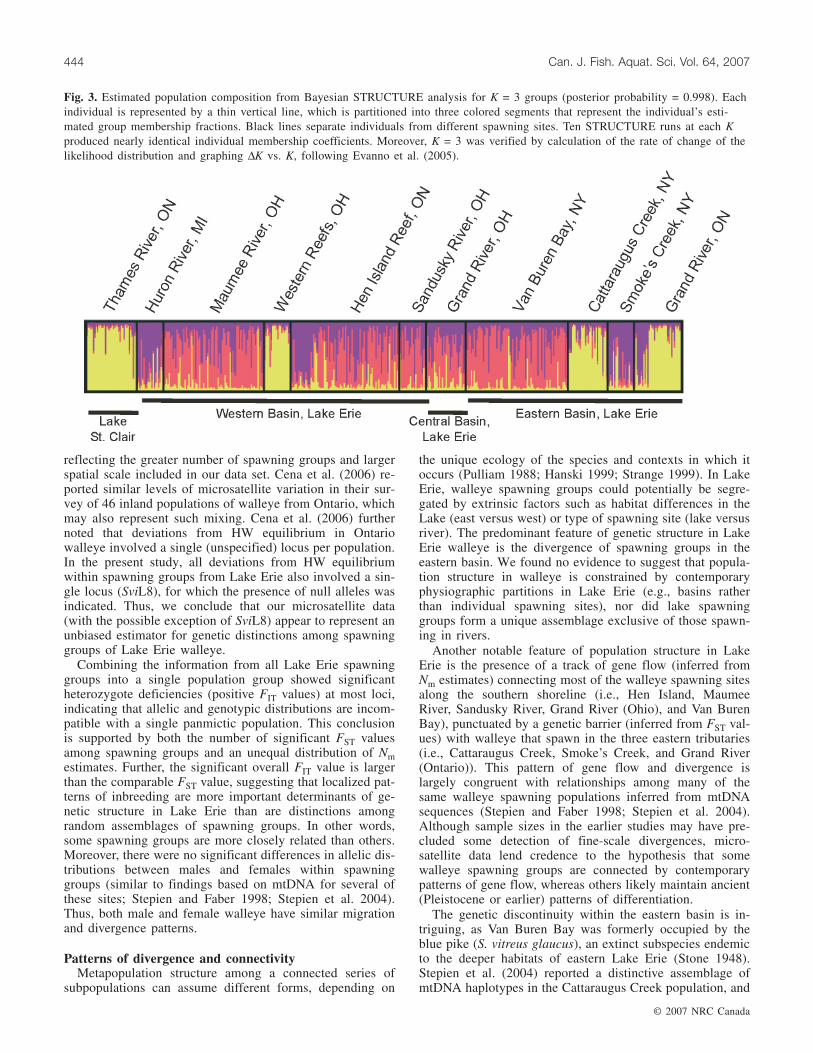
Bayesian analysis of genetic structure among all spawninggroups included in this study was largely consistent with theresults of the BARRIER analysis. The STRUCTURE analy-sis showed evidence for three population groups (K = 3 withposterior probability = 0.998 and maximum ∆K vs. K modaldistribution peak height; see Fig. 3). The null hypothesis ofpanmixia across Lake Erie thus was rejected for K = 1, whenall populations were considered in the overall analysis.Strongest assignments to single population groups werefound for spawning groups from the Thames River, Lake St.Clair (0.848 for K = 3; Fig. 3), western Lake Erie reefs(0.813), and the eastern Lake Erie basin sites at Smoke’sCreek (0.740), Cattaraugus Creek (0.724), and Grand River(Ontario) (0.672).
Moreover, the null hypothesis of panmixia was notrejected when a separate STRUCTURE analysis included onlythe five spawning groups comprising the track identified in theBARRIER analysis (posterior probability = 0.999 for K = 1).This restricted analysis thus indicated that spawning groupsfrom the Maumee River, Sandusky River, Hen Island, GrandRiver (Ohio), and Van Buren Bay comprise a single inter-breeding population of walleye.
Discussion
Patterns of microsatellite heterogeneityMicrosatellite DNA variation of Lake Erie walleye reveals
greater diversity than that reported for the same loci inwalleye populations from Minnesota (e.g., Borer et al. 1999;Eldridge et al. 2002) and Quebec (Wirth et al. 1999), likely
© 2007 NRC Canada
Strange and Stepien 443
Fig. 2. Pairwise relationship between genetic divergence and geographic distance expressed as FST(1 – FST)–1 versus the natural loga-rithm of kilometres. Linear regression and correlation coefficients are b = –0.003 and r = –0.12, respectively (Mantel P = 0.827).
reflecting the greater number of spawning groups and largerspatial scale included in our data set. Cena et al. (2006) re-ported similar levels of microsatellite variation in their sur-vey of 46 inland populations of walleye from Ontario, whichmay also represent such mixing. Cena et al. (2006) furthernoted that deviations from HW equilibrium in Ontariowalleye involved a single (unspecified) locus per population.In the present study, all deviations from HW equilibriumwithin spawning groups from Lake Erie also involved a sin-gle locus (SviL8), for which the presence of null alleles wasindicated. Thus, we conclude that our microsatellite data(with the possible exception of SviL8) appear to represent anunbiased estimator for genetic distinctions among spawninggroups of Lake Erie walleye.
Combining the information from all Lake Erie spawninggroups into a single population group showed significantheterozygote deficiencies (positive FIT values) at most loci,indicating that allelic and genotypic distributions are incom-patible with a single panmictic population. This conclusionis supported by both the number of significant FST valuesamong spawning groups and an unequal distribution of Nmestimates. Further, the significant overall FIT value is largerthan the comparable FST value, suggesting that localized pat-terns of inbreeding are more important determinants of ge-netic structure in Lake Erie than are distinctions amongrandom assemblages of spawning groups. In other words,some spawning groups are more closely related than others.Moreover, there were no significant differences in allelic dis-tributions between males and females within spawninggroups (similar to findings based on mtDNA for several ofthese sites; Stepien and Faber 1998; Stepien et al. 2004).Thus, both male and female walleye have similar migrationand divergence patterns.
Patterns of divergence and connectivityMetapopulation structure among a connected series of
subpopulations can assume different forms, depending on
the unique ecology of the species and contexts in which itoccurs (Pulliam 1988; Hanski 1999; Strange 1999). In LakeErie, walleye spawning groups could potentially be segre-gated by extrinsic factors such as habitat differences in theLake (east versus west) or type of spawning site (lake versusriver). The predominant feature of genetic structure in LakeErie walleye is the divergence of spawning groups in theeastern basin. We found no evidence to suggest that popula-tion structure in walleye is constrained by contemporaryphysiographic partitions in Lake Erie (e.g., basins ratherthan individual spawning sites), nor did lake spawninggroups form a unique assemblage exclusive of those spawn-ing in rivers.
Another notable feature of population structure in LakeErie is the presence of a track of gene flow (inferred fromNm estimates) connecting most of the walleye spawning sitesalong the southern shoreline (i.e., Hen Island, MaumeeRiver, Sandusky River, Grand River (Ohio), and Van BurenBay), punctuated by a genetic barrier (inferred from FST val-ues) with walleye that spawn in the three eastern tributaries(i.e., Cattaraugus Creek, Smoke’s Creek, and Grand River(Ontario)). This pattern of gene flow and divergence islargely congruent with relationships among many of thesame walleye spawning populations inferred from mtDNAsequences (Stepien and Faber 1998; Stepien et al. 2004).Although sample sizes in the earlier studies may have pre-cluded some detection of fine-scale divergences, micro-satellite data lend credence to the hypothesis that somewalleye spawning groups are connected by contemporarypatterns of gene flow, whereas others likely maintain ancient(Pleistocene or earlier) patterns of differentiation.
The genetic discontinuity within the eastern basin is in-triguing, as Van Buren Bay was formerly occupied by theblue pike (S. vitreus glaucus), an extinct subspecies endemicto the deeper habitats of eastern Lake Erie (Stone 1948).Stepien et al. (2004) reported a distinctive assemblage ofmtDNA haplotypes in the Cattaraugus Creek population, and
© 2007 NRC Canada
444 Can. J. Fish. Aquat. Sci. Vol. 64, 2007
Fig. 3. Estimated population composition from Bayesian STRUCTURE analysis for K = 3 groups (posterior probability = 0.998). Eachindividual is represented by a thin vertical line, which is partitioned into three colored segments that represent the individual’s esti-mated group membership fractions. Black lines separate individuals from different spawning sites. Ten STRUCTURE runs at each Kproduced nearly identical individual membership coefficients. Moreover, K = 3 was verified by calculation of the rate of change of thelikelihood distribution and graphing ∆K vs. K, following Evanno et al. (2005).
© 2007 NRC Canada
Strange and Stepien 445
our analyses further identified divergence betweenCattaraugus Creek and each of the three eastern rivers. It ispossible that the walleye populations in the eastern rivers areolder, resident populations, whereas the spawning group inVan Buren Bay contains strays from the western basin thatbegan to exploit this lake spawning habitat after the demiseof the blue pike in the late 1950s. Prior hybridization be-tween the two forms of walleye (S. v. vitreus and S. v.glaucus) may account for the higher number of private al-leles documented from Van Buren Bay in our study.
Correspondence of patterns in walleye with other fishesMany of these patterns are also evident in other Lake Erie
fishes, indicating similar biogeographic history. Notably, sev-eral species of Lake Erie fishes show west–east patterns inallelic frequencies: walleye S. vitreus (Stepien and Faber 1998;Stepien et al. 2004; this study), brown bullhead Ameiurusnebulosus (Murdoch and Hebert 1997), yellow perch Percaflavescens (Ford and Stepien 2004), and smallmouth bassMicropterus dolomieu (Stepien et al. 2007). Each of these spe-cies represents a different suite of life history attributes, includ-ing reproductive strategies, vagility, and habitat affinities.Shared patterns among species as different as these have beenused to postulate the role of Pleistocene–postPleistocene eventsresponsible for the structure of freshwater fish faunal assem-blages (e.g., Wiley and Mayden 1985; Strange and Burr 1997).
Unlike walleye, subpopulations of smallmouth bass acrossLake Erie correspond to a broadscale isolation by geo-graphic distance pattern (Stepien et al. 2007). Smallmouthbass spawning groups are linked by a smaller track along thesouthern Lake shore, which does not extend to Van BurenBay. Also, additional population units were discerned amongLake Erie spawning populations of smallmouth bass using asimilar STRUCTURE analysis of microsatellite data (K = 4,posterior probability = 0.997; Stepien et al. 2007). Differ-ences between smallmouth bass and walleye likely reflecttheir respective life histories and vagilities, with smallmouthbass being largely confined to a limited home range through-out its life history (Scott and Crossman 1973).
As in walleye, natal site fidelity appears to maintain re-productive isolation in a number of species, including rain-bow smelt (Osmerus mordax; Bernatchez 1997), Atlanticherring (Clupea harengus; Bekkevold et al. 2005; Jorgensenet al. 2005), walleye pollock (Theragra chalcogramma;O’Reilly et al. 2004), and mackerels (Scomber spp.; Zardoyaet al. 2004). Other species within the genus Sander areknown to migrate to specific rivers to spawn (Koed et al.2000, 2002), and this behavior may be a general pattern inthis genus. Although the mechanism for homing behavior isunknown in percids, a study by Gerlach et al. (2001) sug-gests that Eurasian perch Perca fluviatilis may recognize kinthrough olfactory cues. Thus, it is possible that walleye re-turn to their natal locations guided by olfactory informationimprinted during early stages of their life history, which maybe a primary mechanism for maintaining divergence amongthe respective spawning groups.
Mechanisms: patterns of gene flow and divergence inwalleye
Population genetic structure is the consequence of local-ized patterns of gene flow punctuated by isolation and diver-
gence. Lake Erie walleye exhibit patterns of genetic variabil-ity consistent with both phenomena: a track running alongthe southern shore and across the Lake that ends abruptly ata border separating the three relatively isolated eastern rivers(e.g., Cattaraugus Creek, Smoke’s Creek, and Grand River(Ontario)). Thus, there are two different attributes of popula-tion structure that must be considered to better understandthe mechanisms responsible for genetic relationships in LakeErie walleye: (i) genetic divergence in the rivers to the eastand west and (ii) connectivity within the track.
Our results suggest that river spawning groups in the east-ern basin of Lake Erie remain distinct because most adultsreturn to their natal locations to reproduce. Similar to manyanadromous fishes, walleye form seasonal mixed stocks inopen water habitats, but then separate at spawning and returnto their natal sites to spawn. This pattern of repeat homing tospecific spawning locations is well documented in walleye(Olson et al. 1978), and it is widely accepted that most indi-viduals display spawning-site philopatry (Regier et al. 1969;Colby and Nepszy 1981; Horrall 1981).
Whereas natal homing as a mechanism for divergenceamong walleye spawning groups from the eastern rivers isrelatively easy to postulate, the dynamics of gene flowthroughout the Lake is more challenging. Tagging studies in-dicate that walleye from the western basin tend to migrateeastward into the central and eastern basins, whereas thosetagged in Van Buren Bay are nonmigratory (Thomas et al.2005). The number of private alleles per spawning groupwithin the track ranged from one (Grand River (Ohio)) toseven (Van Buren Bay), whereas the remaining three popula-tions had two to three unique alleles each. A larger numberof private alleles in the spawning group from Van Buren Baymay reflect an accumulation of private alleles from recipientmigratory spawning groups (Kawecki and Holt 2002; Ken-nington et al. 2003). In other words, asymmetrical gene flowmay result from a greater number of individuals in a sinksubpopulation (here, Van Buren Bay), whose alleles trace toimmigrants from source subpopulations (e.g., sites to thewest along the track); this merits further testing in walleye.Alternatively, the additional private alleles in the Van BurenBay spawning group may trace their ancestry to the now-extinct blue pike that is hypothesized to have introgressedwith walleye (see Stone 1948 and Stepien and Faber 1998),which is being tested by the Great Lakes Genetics Labora-tory.
The mechanism(s) responsible for the track may be demo-graphic. For example, Fraser et al. (2004) reported evidencethat asymmetric migration proceeds from sites with a largereffective population size in brook trout (Salvelinusfontinalis) from a postglacial lake in Quebec, and a similarsituation may exist in Lake Erie walleye. Walleye populationsizes and recruitment (as estimated by management agenciesduring spawning runs; Roger Knight, Ohio Division of Wild-life, 305 E. Shoreline Drive, Sandusky, OH 44870, USA,personal communication) are significantly higher in thewestern basin than in the eastern basin. The Lake ErieWalleye Task Group of the Great Lakes Fishery Commissionestimates that western basin populations range from 30 to 40million spawning individuals, whereas those in the easternbasin number about 0.5–2 million (Thomas et al. 2005).Thus, it is possible that the greater population size of
walleye in the western basin contributes more individuals toa migrant pool than does the spawning group from VanBuren Bay.
Origins of the patternPopulation structure in Lake Erie walleye appears to re-
flect contemporary differences in natal site fidelity and de-mographic processes (e.g., population sizes); however, theoverall pattern (most notably the west–east distinction) maybe attributable to postPleistocene colonization of the Lake.Tributaries of eastern Lake Erie were isolated from the restof the Lake by ice sheets during the Pleistocene, and it is no-table that the eastern and central basins remained isolatedduring the earliest stages of Lake Erie (about 7 000 to10 000 years before present; Holcombe et al. 2003; see in-ternal shading in Fig. 1). The spawning groups of the threeeastern tributaries were separated from other walleye popu-lation groups until this barrier broke down, and this geneticdiscontinuity has been maintained by natal site fidelity asdiscussed above. On the other hand, the track consists ofsome spawning sites in the western basin and along thesouthern shore of the Lake. During the early stages of LakeErie, the western basin was dominated by a large river sys-tem that included the present Maumee and Sandusky riversas its headwaters. Kitchell et al. (1977) noted that thewalleye is primarily a large river fish and occupies habitatssimilar to the pools of large rivers when it occurs in lakes.Western Lake Erie is such a habitat in terms of shallowdepth, minimal flow, and appropriate spawning substrates(Kitchell et al. 1977, p. 1938), and it is likely that thespawning groups dominating the track are descendent fromthose occurring in the rivers of the western basin.
In conclusion, walleye in Lake Erie represent a classicalsubdivided population in which differences among spawninggroups are likely the result of two contemporary intrinsicmechanisms: (i) demographic patterns in which the differen-tial productivity and concomitant contributions to a commongene pool result in gene flow and (ii) natal site fidelity thatmaintains isolation of specific river spawning groups. Thesecontemporary patterns have modified but not obscured his-torical patterns of divergence attributable to postglacial colo-nization by different source populations, which is beingfurther investigated in a broader-scale study using bothmicrosatellite and mtDNA (C.A. Stepien, R.L. Lohner, andD.J. Murphy, unpublished data). Although walleye do notsegregate on the basis of physiographic differences in LakeErie or on distinctions between subpopulations that spawn inrivers versus shoals, we found evidence that Lake Eriewalleye appear to retain historic patterns of genetic diversitydespite recent patterns of exploitation and habitat destruc-tion.
Acknowledgements
This is publication No. 2007-006 from the Lake Erie Cen-ter. This project was developed by the Great Lakes GeneticsLaboratory in conjunction with the Lake Erie Walleye TaskForce of the Great Lakes Fishery Commission and GreatLakes fishery managers — especially the Ohio Division ofWildlife, the Michigan Department of Natural Resources,the Ontario Ministry of Natural Resources, the Pennsylvania
Fish and Boat Commission, and the New York Departmentof Environmental Conservation. The study was supported byNational Oceanic and Atmospheric Administration (NOAA)Ohio Sea Grants Nos. R/LR-4 and R/LR-8, an award fromthe US Fish and Wildlife Service Restoration Act throughthe Great Lakes Fishery Commission, and US Environmen-tal Protection Agency (USEPA) grant No. CR-83281401-0(all to CAS). Walleye were collected with the help ofD. Einhouse, R. Haas, T. Johnson, K. Kayle, C. Knight,R. Knight, E. Roseman, M. Turner, M. Thomas, J. Tyson,C. Vandergoot, and C. Wilson. DNA technicians D.Murphy, C. Taylor, and R. Lohner provided valuable helpwith laboratory and data analysis. The manuscript addition-ally benefited from proofreading and suggestions by M.Neilson, R. Lohner, and D. Murphy.
References
Alroy, J. 1995. Continuous track analysis: a new phylogenetic andbiogeographic method. Syst. Biol. 44: 152–178.
Bailey, R.M., and Smith, G.R. 1981. Origin and geography of thefish fauna of the Laurentian Great Lakes basin. Can. J. Fish.Aquat. Sci. 38: 1539–1561.
Balloux, F., and Lugon-Moulin, N. 2002. The estimation of popu-lation differentiation with microsatellite markers. Mol. Ecol. 11:155–165.
Bekkevold, D., Andre, C., Dahlgren, T.G., Clausen, L.A.W.,Tortensen, E., Mosegaard, H., Carvalho, G.R., Christensen, T.B.Norlinder, E., and Ruzzante, D.E. 2005. Environmental corre-lates of population differentiation in Atlantic herring. Evolution,59: 2656–2668.
Bernatchez, L. 1997. Mitochondrial DNA analysis confirms the ex-istence of two glacial races of rainbow smelt Osmerus mordaxand their reproductive isolation in the St. Lawrence River estu-ary (Quebec, Canada). Mol. Ecol. 6: 73–83.
Billington, N., and Strange, R.M. 1995. Mitochondrial DNA analy-sis confirms the existence of a genetically divergent walleyepopulation in northeastern Mississippi. Trans. Am. Fish. Soc.124: 770–776.
Billington, N., Barrette, R.J., and Hebert, P.D.N. 1992. Manage-ment implications of mitochondrial DNA variation in walleyestocks. N. Am. J. Fish. Manag. 12: 276–284.
Bolsenga, S.J., and Herdendorf, C.E. 1993. Lake Erie and Lake St.Clair handbook. Wayne State University Press, Detroit, Mich.
Borer, S.O., Miller, L.M., and Kapuscinski, A. 1999. Micro-satellites in walleye Stizostedion vitreum. Mol. Ecol. 8: 335–346.
Cena, C.J., Morgan, G.E., Malette, M.D., and Heath, D.D. 2006.Inbreeding, outbreeding, and environmental effects on geneticdiversity in 46 walleye (Sander vitreus) populations. Mol. Ecol.15: 303–320.
Colby, P.J., and Nepszy, S.J. 1981. Variation among stocks ofwalleye (Stizostedion vitreum): management implications. Can.J. Fish. Aquat. Sci. 38: 1814–1831.
Eldridge, W.H., Bacigalupi, M.D., Adelman, I.R., Miller, L.M.,and Kapuscinski, A.R. 2002. Determination of relative survivalof two stocked walleye populations and resident natural-originfish by microsatellite DNA parentage assignment. Can. J. Fish.Aquat. Sci. 59: 282–290.
Evanno, G., Regnaut, S., and Goudet, J. 2005. Detecting the num-ber of clusters of individuals using the software STRUCTURE:a simulation study. Mol. Ecol. 14: 2611–2620.
© 2007 NRC Canada
446 Can. J. Fish. Aquat. Sci. Vol. 64, 2007
Ferguson, R.G., and Derksen, A.J. 1971. Migrations of adult andjuvenile walleyes (Stizostedion vitreum vitreum) in southernLake Huron, Lake St. Clair, Lake Erie, and connecting waters. J.Fish. Res. Board Can. 28: 1133–1142.
Ford, A.M., and Stepien, C.A. 2004. Genetic variation and spawn-ing population structure in Lake Erie yellow perch, Percaflavescens: a comparison with a Maine population. In Proceed-ings of Percis III, the 3rd International Symposium on PercidFishes, 20–24 July 2003, University of Wisconsin, Madison,Wisc. Edited by T.P. Barry and J.A. Malison. University of Wis-consin Sea Grant Institute, Madison. pp. 131–132.
Fraser, D.J., Lippe, C., and Bernatchez, L. 2004. Consequences ofunequal population size, asymmetric gene flow and sex-biaseddispersal on population structure in brook charr (Salvelinusfontinalis). Mol. Ecol. 13: 67–80.
Gerlach, G., Schardt, U., Eckmann, R., and Meyer, A. 2001. Kinstructured subpopulations in Eurasian perch (Perca fluviatilis).Heredity, 86: 213–221.
Goodyear, C.S., Edsall, T.A., Dempsey, D.M., Moss, G.D., andPolanski, P.E. 1982. Atlas of spawning and nursery areas ofGreat Lakes fishes. Vols. 1–14; Vol. 8: Detroit River. US Fishand Wildlife Service, Washington, D.C. FWS/OBS-82/52.
Goudet, J. 1995. FSTAT (Version 1.2): a computer program to cal-culate F-statistics. J. Hered. 86: 485–486.
Goudet, J., Raymond, M., de Meeus, T., and Rousset, F. 1996.Testing differentiation in diploid populations. Genetics, 144:1933–1940.
Guo, S.W., and Thompson, E.A. 1992. Performing the exact test ofHardy–Weinberg proportions for multiple alleles. Biometrics,48: 361–372.
Hanski, I. 1999. Habitat connectivity, habitat continuity, andmetapopulations in dynamic landscapes. Oikos, 87: 209–219
Hatch, R.W., Nepszy, S.J., Muth, K.M., and Baker, C.T. 1987. Dy-namics of the recovery of the western Lake Erie walleye(Stizostedion vitreum vitreum) stock. Can. J. Fish. Aquat. Sci.44: 15–22.
Hedrick, P.W. 1999. Perspective: Highly variable loci and their in-terpretation in evolution and conservation. Evolution, 53: 313–318.
Holcombe, T.L., Taylor, L.A., Reid, D.F., Warren, J.S., Vincent,P.A., and Herdendorf, C.E. 2003. Revised Lake Erie postglaciallake level history based on new detailed bathymetry. J. Gt.Lakes Res. 29: 681–704.
Horrall, R.M. 1981. Behavioral stock-isolating mechanisms inGreat Lakes fishes with special reference to homing and site im-printing. Can. J. Fish. Aquat. Sci. 38: 1481–1496.
Hubbs, C.L., and Lagler, K.F. 2004. Fishes of the Great Lakes re-gion. Revised by G.R. Smith. The University of Michigan Press,Ann Arbor, Mich.
Jennings, M.J., Claussen, J.E., and Philipp, D.P. 1996. Evidencefor heritable preferences for spawning habitat between twowalleye groups. Trans. Am. Fish. Soc. 125: 978–982.
Jorgensen, H.B.H., Hansen, M.M., Bekkevold, D., Ruzzante, D.E.,and Loeschcke, V. 2005. Marine landscapes and population ge-netic structure of herring (Clupea harengus L.) in the Baltic Sea.Mol. Ecol. 14: 3219–3234.
Kawecki, T.J., and Holt, R.D. 2002. Evolutionary consequences ofasymmetric dispersal rates. Am. Nat. 160: 333–347.
Kennington, W.J., Gockel, J., and Partridge, L. 2003. Testing forasymmetrical gene flow in a Drosophila melanogaster body-sizecline. Genetics, 165: 667–673.
Kitchell, J.F., Johnson, M.G., Minns, C.K., Loftus, K.H., Greig, L.,and Oliver, C.H. 1977. Percid habitat: the river analogy. J. Fish.Res. Board Can. 34: 1936–1940.
Knight, R.L. 1997. Successful interagency rehabilitation of LakeErie walleye. Fisheries, 22: 16–17.
Koed, A., Mejlhelde, P., Balleby, K., and Aarestrup, K. 2000. An-nual movement of adult pikeperch in a lowland river. J. FishBiol. 57: 1266–1279.
Koed, A., Balleby, K., and Mejlhelde, P. 2002. Migratory behaviorof adult pikeperch (Stizostedion lucioperca) in a lowland river.Hydrobiologia, 483: 175–184.
Manel, S., Schwartz, M.K., Luikart, G., and Taberlet, P. 2003.Landscape genetics: combining landscape ecology and popula-tion genetics. Trend. Ecol. Evol. 18: 189–197.
Manni, F., Guerard, E., and Heyer, E. 2004. Geographic patterns of(genetic, morphologic, linguistic) variation: how barriers can bedetected by “Monmonier’s algorithm”. Hum. Biol. 76: 173–190.
Mantel, N. 1967. The detection of disease clustering and a general-ized regression approach. Cancer Res. 27: 209–220.
Murdoch, M.H., and Hebert, P.D.N. 1997. Mitochondrial DNA evi-dence of distinct glacial refugia for brown bullhead (Ameiurusnebulosus) in the Great Lakes. Can. J. Fish. Aquat. Sci. 54:1450–1460.
Nepszy, S.J. 1977. Changes in percid populations and species in-teractions in Lake Erie. J. Fish. Res. Board Can. 34: 1861–1868.
Olson, D.E., and Scidmore, W.J. 1962. Homing behavior in spawn-ing walleyes. Trans. Am. Fish. Soc. 91: 355–561.
Olson, D.E., Schupp, D.H., and Macins, V. 1978. An hypothesis ofhoming behavior of walleyes as related to observed patterns ofpassive and active movement. In Selected coldwater fishes ofNorth America. Edited by R.L. Kendall. Am. Fish. Soc. SpecialPubl. 11. Bethesda, Md. pp. 52–57.
O’Reilly, P.T., Canino, M.F., Bailey, K.M., and Bentzen, P. 2004.Inverse relationship between FST and microsatellite polymor-phism in the marine fish walleye pollock (Theragrachalcogramma): implications for resolving weak populationstructure. Mol. Ecol. 13: 1799–1814.
Pritchard, J.K., Stephens, M., and Donelly, P. 2000. Inference ofpopulation structure using multilocus genotype data. Genetics,155: 945–959.
Pulliam, H.R. 1988. Sources, sinks and population regulation. Am.Nat. 132: 652–661.
Raymond, M., and Rousset, F. 1995. GENEPOP. Version 1.2. Pop-ulation genetics software for exact tests and ecumenicism. J.Hered. 86: 248–249.
Regier, H.A., Applegate, V.C., and Ryder, R.A. 1969. The ecologyand management of the walleye in western Lake Erie. GreatLakes Fish. Comm. Tech. Rep. 15: 1–101.
Rice, W.R. 1989. Analyzing tables of statistical tests. Evolution,43: 223–225.
Rousset, F. 1997. Genetic differentiation and estimation of geneflow from F-statistics under isolation by distance. Genetics,145: 1219–1228.
Schneider, J.C., and Leach, J.H. 1977. Walleye (Stizostedionvitreum vitreum) fluctuations in the Great Lakes and possiblecauses, 1800–1975. J. Fish. Res. Board Can. 34: 1878–1889.
Scott, W.B., and Crossman, E.J. 1973. Freshwater fishes of Can-ada. Bull. Fish. Res. Board Can. Bull. 184. pp. 767–774.
Slatkin, M. 1985. Rare alleles as indicators of gene flow. Evolu-tion, 39: 53–65.
Stepien, C.A. 1995. Population genetic divergence and geographicpatterns from DNA sequences: examples from marine and fresh-water fishes. In Symposium 17: Evolution and the Aquatic Eco-system: Defining Unique Units in Group Conservation,Monterey, California, May 1994. Edited by J. Neilson. Ameri-can Fisheries Society, Bethesda, Md. pp. 263–287.
© 2007 NRC Canada
Strange and Stepien 447
Stepien, C.A., and Faber, J.E. 1998. Population genetic structure,phylogeography and spawning philopatry in walleye(Stizostedion vitreum) from mitochondrial DNA control regionsequences. Mol. Ecol. 7: 1757–1769.
Stepien, C.A., Taylor, C.D., and Einhouse, D.W. 2004. An analysisof genetic risk to a native spawning stock of walleye Sandervitreus (Stizostedion vitreum) due to stocking in CattaraugusCreek. In Proceedings of Percis III, the 3rd International Sym-posium on Percid Fishes, 20–24 July 2003, University of Wis-consin, Madison, Wisc. Edited by T.P. Barry and J.A. Malison.University of Wisconsin Sea Grant Institute, Madison. pp. 93–94.
Stepien, C.A., Murphy, D., and Strange, R.M. 2007. Broad- tofine-scale genetic patterning in smallmouth bass Micropterusdolomieu across the Laurentian Great Lakes and beyond: an in-terplay of behavior and geography. Mol. Ecol. 16. In press.
Stone, F.L. 1948. A study of the taxonomy of the blue and yellowpikeperches (Stizostedion) of Lake Erie and Lake Ontario. Ph.D.dissertation, University of Rochester, N.Y.
Strange, R.M. 1999. Historical biogeography, ecology, and fish dis-tributions: conceptual issues for establishing IBI criteria. In As-sessing the sustainability and biological integrity of waterresources using fish communities. Edited by T.P. Simon. CRCPress, Boca Raton, Fla. pp. 65–78.
Strange, R.M., and Burr, B.M. 1997. Intraspecific phylogeographyof North American highland fishes: a test of the Pleistocenevicariance hypothesis. Evolution, 51: 885–897.
Thomas, M., Einhouse, D., Isermann, D., Kayle, K., Turner, M.,Vandergoot, C., Belore, M., Cook, A., Johnson, T., Ryan, P.,Wright, E., and Kenyon, R. 2005. Report for 2004 by the LakeErie Walleye Task Group as presented to the Standing TechnicalCommittee, Lake Erie Committee, Great Lakes Fishery Com-mission, Niagara Falls, Ont.
Todd, T.N., and Haas, R.C. 1993. Genetic and tagging evidence formovement of walleyes between Lake Erie and Lake St. Clair. J.Gt. Lakes Res. 19: 445–452.
van Oosterhout, C., Hutchinson, W.F., Wills, D.P.M., and Shipley,P. 2004. MICRO-CHECKER: software for identifying and cor-recting genotyping errors in microsatellite data. Mol. Ecol.Notes, 4: 535–538.
van Oosterhout, C., Weetman, D., and Hutchinson, W.F. 2006. Es-timation and adjustment of microsatellite null alleles innonequilibrium populations. Mol. Ecol. Notes, 6: 255–256.
Weir, B.S., and Cockerham, C.C. 1984. Estimating F-statistics forthe analysis of population structure. Evolution, 38: 1358–1370.
Wiley, E.O., and Mayden, R.L. 1985. Species and speciation inphylogenetic systematics, with examples from the North Ameri-can fish fauna. Ann. Missouri Bot. Gard. 72: 596–635.
Wirth, T., Saint-Laurent, R., and Bernatchez, L. 1999. Isolationand characterization of microsatellite loci in the walleye(Stizostedion vitreum), and cross species amplification withinthe family Percidae. Mol. Ecol. 8: 1957–1969.
Wolfert, D.R. 1963. The movements of walleyes tagged as year-lings from the eastern and western basins of Lake Erie. Trans.Am. Fish. Soc. 92: 414–420.
Wright, S. 1943. Isolation by distance. Genetics, 28: 139–156.Wright, S. 1978. Evolution and the genetics of populations. Vol. 4.
Variability within and among populations. University of Chi-cago Press, Chicago, Ill.
Zardoya, R., Castilho, R., Grande, C., Favre-Krey, L., Caetano, S.,Marcato, S., Krey, G., and Patarnello, T. 2004. Differential popu-lation structuring of two closely related fish species, the mackerel(Scomber scombrus) and the cub mackerel (Scomber japonicus),in the Mediterranean Sea. Mol. Ecol. 13: 1785–1798.
© 2007 NRC Canada
448 Can. J. Fish. Aquat. Sci. Vol. 64, 2007