Reproductive biology of the planktonic copepod Temora stylifera
ARTICLE IN PRESS
0967-0637/$ - se
doi:10.1016/j.ds
�Correspondi
E-mail addre
Deep-Sea Research I 52 (2005) 1637–1661
www.elsevier.com/locate/dsr
Nitrogen uptake and dissolved organic nitrogen release inplanktonic communities characterised by phytoplankton
size–structure in the Central Atlantic Ocean
Marta M. Varelaa,�, A. Bodea, E. Fernandezb, N. Gonzaleza, V. Kitidisc,M. Varelaa, E.M.S. Woodwardd
aInstituto Espanol de Oceanografıa. Centro Oceanografico de A Coruna. Apdo. 130. 15080-A Coruna, SpainbFacultad de Ciencias del Mar. Universidad de Vigo. Campus Lagoas-Marcosende, s/n. Vigo, Spain
cUniversity of Newcastle, Department of Marine Sciences and Coastal Management, Newcastle upon Tyne, NE1 7 RU, UKdPlymouth Marine Laboratory. Prospect Place, West Hoe Plymouth PL1 3DH, UK
Received 3 May 2004; received in revised form 9 February 2005; accepted 4 March 2005
Available online 9 June 2005
Abstract
Ammonium, nitrate and urea uptake rates, as well as the release of dissolved organic nitrogen (DON), were measured
along a latitudinal transect (491N–331S) in the Atlantic Ocean during the 2000 summer-to-autumn transition period and
subsequently related to phytoplankton-size structure. The transect included upwelling areas, oligotrophic gyres and
temperate regions and, as a result, euphotic layer integrated uptake rates of ammonium (18–355 mmol m�2
h�1
), nitrate
(5–2830 mmol m�2
h�1
) and urea (26–1212 mmol m�2
h�1
) covered a wide productivity spectrum. The percentage of
extracellular DON release relative to total nitrogen uptake (PER) was highest when nitrate was used as the substrate
(mean 427SE 3.1%) whereas the uptake of ammonium and urea produced lower PER values (2272.1 and 2671.6%,
respectively). Small cells (o2mm) contributed between 20% and 80% of the total primary production; however, they
accounted for 50–80% of total chlorophyll-a. In upwelling areas of the ocean, dominated by large phytoplankton, PER
accounted for less than 30% of total nitrogen uptake and could be predicted from a regression equation relating the
contribution of o2mm phytoplankton to either total biomass or production. In contrast, in oligotrophic areas, small
cells formed the bulk of the phytoplankton biomass, but not of primary production. In these areas, PER often exceeded
50% and was very variable, displaying a low correlation with phytoplankton size, which suggests that processes not
directly related to the size of the primary producers influence DON release in the oligotrophic ocean.
r 2005 Elsevier Ltd. All rights reserved.
Keywords: Phytoplankton; Size distribution; Nitrogen uptake; Dissolved organic nitrogen (DON) release; Atlantic ocean
e front matter r 2005 Elsevier Ltd. All rights reserved.
r.2005.03.005
ng author. Tel.: +34 981205362; fax: +34 981229077.
ss: [email protected] (M.M. Varela).
ARTICLE IN PRESS
M.M. Varela et al. / Deep-Sea Research I 52 (2005) 1637–16611638
1. Introduction
On short time-scales (hours, days), primaryproduction is usually dependent on the in situregeneration of nitrogen, indicated by the generaldominance of ammomium and urea uptake whenthe input of new nitrogen (generally nitrate)decreases (Dugdale and Goering, 1967). In oceanicwaters, the relative proportions of inorganic andorganic nitrogen substrates have a direct impacton the rates of nitrogen uptake, and ultimatelyaffect both the species and size composition ofplanktonic communities (Glibert, 1998).
Ammonium regeneration has been extensivelymeasured at sea, being often found to occur at arate comparable with that of NH4
+ assimilation(e.g. Glibert et al., 1982; Glibert, 1998), but fewerdata are available on dissolved organic nitrogen(DON) release despite its recognition as animportant nitrogen flux (Bronk et al., 1994; Bronkand Ward, 2000). The majority of these observa-tions have been made in coastal or temperateenvironments. However, the information availablefor oligotrophic open-ocean environments isscarce. Previous studies suggest that DON is apotentially important nitrogen source for bothbacteria and phytoplankton populations (Jacksonand Williams, 1985; Antia et al., 1991; Tupas andKoike, 1991; Bronk and Glibert, 1993), whichlargely justifies the growing interest for measuringDON release in planktonic ecosystems (Bronket al., 1994; Bronk and Ward, 1999; Vidal et al.,1999; Bronk and Ward, 2000; Hasegawa et al.,2000, 2001; Ward and Bronk, 2001; Varelaet al., 2003). However, most studies have concen-trated on the magnitude and ecological signifi-cance of dissolved organic carbon (DOC). Suchwork has shown a relatively high contribution ofDOC production to total primary production,particularly in the oligotrophic ocean (e.g. Teiraet al., 2001, 2003).
In planktonic communities, most of the organiccompounds, including DON, originate from pri-mary producers (Meon and Kirchman, 2001).Several mechanisms have been postulated toexplain DON release by plankton, which includedirect release by phytoplankton, excretion byheterotrophs, sloppy feeding by zooplankton and
lysis by viral infection (see Nagata, 2000; Bronk,2002, for reviews). Studies of DON release(rDON) generally consider the percentage ofextracellular release (PER): i.e. the fraction ofDON released relative to total nitrogen uptake(Bronk and Ward, 2000; Hasegawa et al., 2000,2001). The technique generally employed for themeasurement of DON release rates by naturalmicrobial populations is based on the liberation oflabelled dissolved organic matter (DOM) inplankton incubations and does not allow for adistinction among the DON released by thedifferent processes. According to Bronk and Ward(2000), PER varies between 10% and 35% acrossdifferent marine ecosystems. However, occasion-ally PER values are much higher or lower thanthese values, suggesting that these higher or lowerrates are likely to indicate the presence or absenceof different trophic interactions, respectively. Asan example, Ward and Bronk (2001) reported thatPER increased as the result of intense grazing andsloppy feeding, stressing that some of the interac-tions leading to high rDON depend on thesize–structure of the community. High losses ofrecently incorporated nitrogen to the DOM poolwould be expected in stratified oligotrophicenvironments as a consequence of the dominanceof microbial food webs (Legendre and Le Fevre,1995; Azam, 1998), where grazing-mediated DONrelease is expected as a result of the bacteria–pro-tozoa (predator–prey) interaction (Ward andBronk, 2001). The phytoplankton–metazoan gra-zer food web is expected to show reduced loss ratesof microbial nitrogen to the DON pool because ofits low number of trophic steps from the primaryproducers to the consumers (Azam, 1998). Con-ceptual models of phytoplankton biomass andproduction size–structure (Tremblay and Le-gendre, 1994) have pointed to phytoplankton sizeas the principal mechanism controlling the trophicorganization of planktonic communities and,consequently, the cycling of nitrogen through thepelagic ecosystem.
In this study, we measured nitrogen uptake andDON release rates over a wide range of produc-tivity levels, in a latitudinal transect across sixbiogeochemical provinces (Longhurst, 1998) re-presentative of contrasting plankton regimes of the
ARTICLE IN PRESS
M.M. Varela et al. / Deep-Sea Research I 52 (2005) 1637–1661 1639
Atlantic Ocean from 491N to 331S. We alsostudied the relationship between nitrogen uptakerates, as well as the release of DON, and theplanktonic community structure, the latter in-ferred from phytoplankton size.
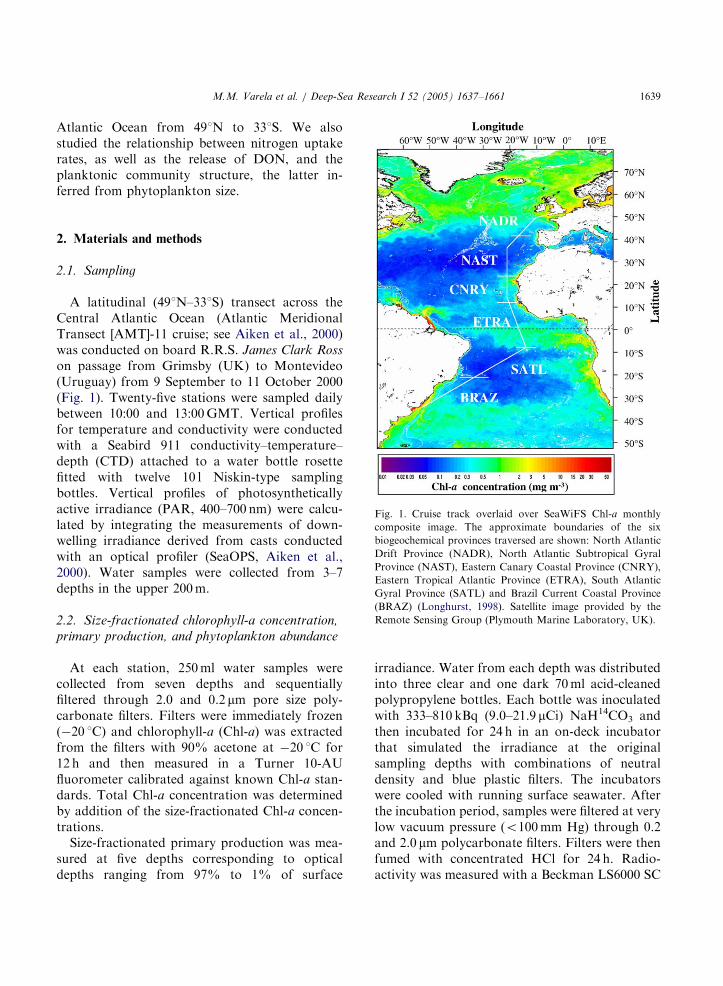
Fig. 1. Cruise track overlaid over SeaWiFS Chl-a monthly
composite image. The approximate boundaries of the six
biogeochemical provinces traversed are shown: North Atlantic
Drift Province (NADR), North Atlantic Subtropical Gyral
Province (NAST), Eastern Canary Coastal Province (CNRY),
Eastern Tropical Atlantic Province (ETRA), South Atlantic
Gyral Province (SATL) and Brazil Current Coastal Province
(BRAZ) (Longhurst, 1998). Satellite image provided by the
Remote Sensing Group (Plymouth Marine Laboratory, UK).
2. Materials and methods
2.1. Sampling
A latitudinal (491N–331S) transect across theCentral Atlantic Ocean (Atlantic MeridionalTransect [AMT]-11 cruise; see Aiken et al., 2000)was conducted on board R.R.S. James Clark Ross
on passage from Grimsby (UK) to Montevideo(Uruguay) from 9 September to 11 October 2000(Fig. 1). Twenty-five stations were sampled dailybetween 10:00 and 13:00 GMT. Vertical profilesfor temperature and conductivity were conductedwith a Seabird 911 conductivity–temperature–depth (CTD) attached to a water bottle rosettefitted with twelve 10 l Niskin-type samplingbottles. Vertical profiles of photosyntheticallyactive irradiance (PAR, 400–700 nm) were calcu-lated by integrating the measurements of down-welling irradiance derived from casts conductedwith an optical profiler (SeaOPS, Aiken et al.,2000). Water samples were collected from 3–7depths in the upper 200 m.
2.2. Size-fractionated chlorophyll-a concentration,
primary production, and phytoplankton abundance
At each station, 250 ml water samples werecollected from seven depths and sequentiallyfiltered through 2.0 and 0.2 mm pore size poly-carbonate filters. Filters were immediately frozen(�20 1C) and chlorophyll-a (Chl-a) was extractedfrom the filters with 90% acetone at �20 1C for12 h and then measured in a Turner 10-AUfluorometer calibrated against known Chl-a stan-dards. Total Chl-a concentration was determinedby addition of the size-fractionated Chl-a concen-trations.
Size-fractionated primary production was mea-sured at five depths corresponding to opticaldepths ranging from 97% to 1% of surface
irradiance. Water from each depth was distributedinto three clear and one dark 70 ml acid-cleanedpolypropylene bottles. Each bottle was inoculatedwith 333–810 kBq (9.0–21.9 mCi) NaH14CO3 andthen incubated for 24 h in an on-deck incubatorthat simulated the irradiance at the originalsampling depths with combinations of neutraldensity and blue plastic filters. The incubatorswere cooled with running surface seawater. Afterthe incubation period, samples were filtered at verylow vacuum pressure (o100 mm Hg) through 0.2and 2.0 mm polycarbonate filters. Filters were thenfumed with concentrated HCl for 24 h. Radio-activity was measured with a Beckman LS6000 SC

ARTICLE IN PRESS
M.M. Varela et al. / Deep-Sea Research I 52 (2005) 1637–16611640
scintillation counter. Quenching was corrected forby the use of an external standard. Total primaryproduction was determined as the addition of size-fractionated rates.
Composition and abundance of phytoplanktonspecies were determined on 250 ml samples pre-served with Lugol’s solution. Samples wereallowed to settle in sedimentation chambers andexamined with an inverted microscope. In addi-tion, the abundance of coccoid cyanobacteriaof the genus Synechococcus was determined byepifluorescence microscopy on samples preservedwith 25% glutaraldehyde and filtered onto Milli-pore polycarbonate, black stained filters (0.2 mmpore-size). Synechococcus cells retained by thefilter were identified by their yellow–orange auto-fluorescence when illuminated with blue light, andenumerated at 1250� magnification (Bode et al.,2001).
2.3. Nitrogen measurements
Samples were collected at each station fromthree optical depths corresponding to 100%, 7%and 1% of surface irradiance. From each depth,250 ml water samples were distributed into dupli-cate acid-cleaned polycarbonate bottles. Eachsample was labelled with 0.1 mM of ammonium(15NH4
+), nitrate (15NO3�) or urea [(15NH2)2CO]
and then incubated for 2–3 h in an on-deckincubator, similar to that employed for theprimary production measurements. Incubationswith each nitrogen source were run in duplicate.These additions yielded initial atom-percent en-richment values of 0.3–97.1%; however, ratesestimated in experiments with initial enrichments420% were significantly lower than those esti-mated from experiments with lower enrichments(ANOVA, po0:001). This suggests that largeenrichments did not cause large overestimation inthe measured rates. After the incubation period,samples were processed as described in Slawyk etal. (1998). Particulate organic nitrogen (PON) wasretained by Whatman GF/F filters and the filtratewas collected, poisoned with HgCl2 and storeduntil further determination of dissolved inorganicnitrogen (DIN) and DON concentrations and 15Nenrichment ashore. The procedure included first
the elimination of unused 15N in DIN byammonium diffusion in alkaline conditions, andsecond the recovery of 15N in DON by completeoxidation to nitrate and subsequent reduction toammonium (Slawyk and Raimbault 1995; Slawyket al., 1998). Concentrations of PON and 15Ncontent were measured on the particulate fractionretained by the filter. Also, initial nitrogenconcentrations in both particulate and dissolvedphases, along with 15N enrichment, were deter-mined in aliquots inoculated with 15N and filteredimmediately without incubation.
DIN concentrations (NO3�, NO2
� and NH4+)
were determined on board the research ship within2 h of sample collection, according to Woodwardand Rees (2001). Determinations of NO3
� andNO2
� were carried out by segmented flow colori-metric analysis with a Technicon Autoanalyzer II.For the determination of NH4
+ concentrations, ananomolar sensitivity, teflon-membrane, fluori-metric technique was used (Woodward and Rees,2001). The determinations of DON were carriedout by the persulfate oxidation method as de-scribed in Slawyk and Raimbault (1995) andSlawyk et al. (1998). Urea concentrations weredetermined by the colorimetric method, whichinvolves the formation of an imidazolone, givingrise to the formation of a red complex withthiosemicarbazide (Goeyens et al., 1998). Thedetermination of PON concentration was carriedout with a CHN analyser (Perkin Elmer). Enrich-ment of 15N of DIN, DON and PON wasdetermined with an isotope-ratio mass spectro-meter (Thermo Finnigan Mat Delta Plus). Filterswith particulate matter were dried at 50 1C beforeanalysis. DON and DIN were adsorbed ontoglass-fibre filters by previous conversion of allnitrogen forms into NH4
+ (Slawyk and Raimbault,1995). The filters were then dried and analysed aswith the filters with particulate matter.
Tests for tracer recovery at the end of theincubation, sample contamination with unlabellednitrogen and the efficiency of DIN removal duringDON isolation, were made as recommended inSlawyk and Raimbault (1995), Raimbault et al.(2000) and Hasegawa et al. (2000). Both tracerrecovery at the end of the incubation and DINremoval efficiency were generally over 95%, as

ARTICLE IN PRESS
M.M. Varela et al. / Deep-Sea Research I 52 (2005) 1637–1661 1641
found in other studies (Hasegawa et al., 2000;Raimbault et al., 2000), while the effect of samplecontamination with unlabelled nitrogen, mostlyammonium, was negligible (Slawyk and Raim-bault, 1995). Values of isotopic abundance of 15Natom percent excess enrichment of nitrogen poolsand mean variability of two replicates are shown inTable 1. Variability of nitrogen enrichment deter-mination between replicates was �20%.
The computation of rDON rates when nitrateand ammonium were used as substrates was madefollowing the equations of Table 4.2 (Slawyk et al.,1998). When urea was used as substrate it was notpossible to eliminate the unused labelled urea atthe end of the incubation, and therefore a differentcomputation procedure was employed. First, weassumed that DON released during incubationswith labelled urea included 14N from alreadyassimilated unlabelled nitrogen before the incuba-tion. Such DON would produce an isotopicdilution of the labelled DON which would reducethe value of 15N-atom enrichment in DON at theend of the incubation. Second, we assumed thatthere was no substantial isotopic fractionationduring DON production (i.e. that both isotopeswere mobilized equally when extracellular DONwas produced). Therefore, the mass balance of 15Ntaking into account both dissolved and particulatephases during the incubation would be
RDON0 DON0 ¼ RDON
f DONf þ RPONPON; (1)
where RDON0 , Rf
DON and RPON are 15N-atom excessin the dissolved phase at the beginning (DON0)and at the end (DONf) of the incubation and in theparticulate phase at the end of the incubation(PON), respectively. The measured 15N-atomexcess in the dissolved phase after the incubation(Rfm
DON) would be reduced by the recently released
Table 1
Range of 15N atom-percent excess enrichment (R) and average differen
organic N pools analysed in this study (n ¼ 75)
N pool R (%)
Dissolved inorganic nitrogen (DIN) 0.3469–97.0874
Particulate organic nitrogen (PON) 0.0040–1.7816
Dissolved organic nitrogen (DON) 0.0003–0.7028
unlabelled DON (DO14N):
RDONfm ¼ RDON
f DONf=ðDONf þ DO14NÞ. (2)
In turn, the amount of labelled DON after theincubation (DONf) could be estimated as
DONf ¼ DON0 � RPONPON: (3)
Finally, by substituting into Eqs. (1)–(3) weestimated DO14N:
DO14N ¼ ð½RDON0 DON0 � RPONPON=RDON
fm Þ
� DON0 þ RPONPON: ð4Þ
The release rate of DO14N from urea (rDONUrea)was estimated by taking into account the durationof the incubation (t):
rDONurea¼ DO14N=t. (5)
It must be taken into account that the rDONUrea
rates computed by the described procedure aresubject to higher error than those for ammoniumand nitrate (rDON
NHþ4 and rDON
NO�3 , respec-
tively), as the latter were computed from directmeasurements of the amount of label incoporatedinto DON. This is reflected by the higher number ofassumptions and terms in the computation formulaefor rDONUrea compared with the computationswhen nitrate or ammonium were used (see Table 2).However, in the absence of other publishedinformation on the subject, the results reported herecan be taken as preliminary estimations of DONrelease by natural planktonic communities whenurea is used as substrate for nitrogen uptake. Thetotal uptake and release rates using all nitrogensources were estimated as the sum of the ratesmeasured with each substrate.
ce between the estimates of two replicate samples of inorganic or
Average difference (%) n
22.6 75
22.8 75
20.2 75

ARTICLE IN PRESS
Table 2
Terminology and equations used to calculate nitrogen fluxes in this study
Abbreviation Description References
NXX ¼ NO3�, NH4
+ or (NH2)2CO (urea) Nitrogen source
DON Dissolved organic nitrogen
PON Particulate organic nitrogen
RNHþ
40
15N % excess in NH4+ over
natural abundance value of
atmospheric 15N (0.365%) at
the beginning of the
incubation
RfNXX 15N % excess in NXX over
natural abundance value of
atmospheric 15N at the end of
the incubation
RNH4m ¼ ½R
NHþ4
0 = lnðRNHþ
4f =R
NHþ4
0 Þf1 � exp½� lnðRNHþ
4f =R
NHþ4
0 ÞgExponential average of R0 and
Rf in case of NH4+
Glibert et al. 1982
RPON 15N % excess in PON over
natural abundance value of
atmospheric 15N at the end of
the incubation
RDON 15N % excess in DON over
natural abundance value of
atmospheric 15N at the end of
the incubation
t Incubation time (h)
rNXX ¼ RPONPON=ðRNXXf tÞ Net uptake of NO3
� or urea Dugdale and Goering 1967
rNHþ4 ¼ RPONPON=ðRNXX
m tÞ Net NH4+ uptake Glibert et al. 1982
rDONNXX¼ RDONDON=ðRNXX
f tÞ DON release ( ¼ extracellular
pool DON release ¼ loss of15N from DIN to DON)
Bronk et al. 1994
Slawyk et al. 1998
Bronk and Ward 2000
PERNXX¼ 100rDONNXX/(rNXX+rDONNXX) Percent extracellular DON
release (%) from NXX
f ¼ rNO�3 =ðrNO�
3 þ rNHþ4 Þ Net nitrate uptake relative to
nitrate plus ammonium uptake
(f-ratio)
f 0¼ rNO�
3 =ðrNO�3 þ rNHþ
4 þ rUreaÞ f-ratio computed from net
uptake rates of NO3�, NH4
+
and urea
M.M. Varela et al. / Deep-Sea Research I 52 (2005) 1637–16611642
3. Results
3.1. Water column thermohaline structure
The spatial distribution of temperature andsalinity reflects the hydrographical characteristicsof the different provinces (according to Longhurst,1998) traversed during the cruise: North AtlanticDrift Province (NADR), North Atlantic Subtro-
pical Gyral Province (NAST), Eastern CanaryCoastal Province (CNRY), Eastern TropicalAtlantic Province (ETRA), South Atlantic GyralProvince (SATL) and Brazil Current CoastalProvince (BRAZ) (Fig. 2). In the northernmostpart of the transect, the isotherms and isohalinesshowed that the surface waters were influenced bythe colder deeper Atlantic waters at the Europeanshelf break, while the deepening of isotherms and

ARTICLE IN PRESS
Temperature (°C)
250
200
150
100
50
0
Dep
th (
m)
50° 40° 30° 20° 10° 0° 10° 20° 30°
Latitude
Salinity
250
200
150
100
50
0
Dep
th (
m)
N S
BRAZSATLETRACNRYNASTNADR
37
(a)
(b)
Fig. 2. Spatial distribution of (a) temperature (1C) and (b)
salinity along the AMT-11 transect. Arrows and bars indicate
sampling stations and the extension of the biogeochemical
provinces, respectively. The depth of the euphotic layer (41%
surface irradiance) is indicated by a dotted line.
50° 40° 30° 20° 10° 0° 10° 20° 30°
Latitude
Chlorophyll-a (mg m )
250
200
150
100
50
0
Dep
th (
m)
-3
N S
BRAZSATLETRACNRYNASTNADR
Fig. 3. Spatial distributions of Chl-a concentration (mg m�3)
along the AMT-11 transect. Arrows and bars indicate sampling
stations and the extension of the biogeochemical provinces,
respectively. The depth of the euphotic layer (41% surface
irradiance) is indicated by a dotted line. Areas with Chl-
a40.3 mg m�3 are shaded.
M.M. Varela et al. / Deep-Sea Research I 52 (2005) 1637–1661 1643
isohalines marks the region where the transectcrosses the North Atlantic gyre (NAST). To thesouth of NAST, the cruise track approached thenorthwestern African coast, entering the CNRYprovince (�23–151N), where coastal upwelling wasevident by the outcropping of isotherms andisohalines from 22 to 20 1N. Southward of 15 1Nthe transect crosses the ETRA (�111N–10 1S),where several distinct hydrographic features werefound. At approximately 15 1N surface tempera-ture, salinity and the depth of the thermoclineprogressively decreased reaching the minimum atthe Guinea Dome (�121N). North of the Equator(�41N), the north tropical convergence lyingbetween the South Equatorial Current and theNorth Equatorial Counter Current caused thenarrowing of the separation between isotherms inthe upper 100 m, and deepened the thermocline to�70 m depth. Further south, the thermocline was
located at �50 m depth at the equatorial diver-gence, where an intense upwelling was responsibleof the tilting of the isotherms and isohalines andthe increase in surface Chl-a (Fig. 1). The relativelyshallow thermocline throughout ETRA is char-acteristic of this tropical area during the southernautumn–winter, as a result of the intensification ofTrade Winds (Longhurst, 1998). Southward of�121S the boundary between ETRA and SATLwas identified by the deepening of the uppermixed layer to 4100 m depth. A frontal zone atapproximately 251S defined the transition fromSATL to the cooler and less saline waters ofBRAZ. In the southernmost part of the transect(�301S), isotherms and isohalines tilted in thevicinity of the shelf break, as in the northern end ofthe transect.
3.2. Chlorophyll-a and phytoplankton species
composition
Low concentrations (o0.9 mg m�3) of Chl-awere measured along most of the transect(Fig. 3). Lowest Chl-a levels were found in thenorthern and southern oligotrophic gyres (NASTand SATL), where concentrations were usuallybelow 0.1 mg m�3. The deep Chl-a maximum waspresent at the base of the euphotic layer at low

ARTICLE IN PRESS
M.M. Varela et al. / Deep-Sea Research I 52 (2005) 1637–16611644
latitudes, as previously reported in the AtlanticOcean (Maranon et al., 2000). This maximum wascharacterised by 40.2 mg Chl-a m�3 and wasdeeper in SATL than in NAST, reflecting thedeeper position of the thermocline in the southerngyre. The upwelling areas of CNRY and theequatorial region of ETRA displayed a markedincrease in Chl-a, with maximum values observednear the surface (40.5 mg m�3). However, thehighest values of Chl-a (40.7 mg m�3) were foundin NADR, characterized by a shallow deep Chl-amaximum.
Small dinoflagellates (o30 mm) dominatedthe nano and microphytoplankton community in
Table 3
Mean abundance (7SE, cell m�1) of the main phytoplankton species
NADR NAST C
Mean SE n Mean SE n M
Dinophyceae
Cachonina hallii 2.71 1.31 8 1.32 0.37 16
Dinoflagellates 430 mm 0.92 0.16 8 0.59 0.04 16
Dinoflagellates o30 mm 46.33 4.33 8 11.63 1.01 16 2
Gonyaulax polygramma 1.13 1.12 8 0.00 0.00 16
Oxytoxum coronatum 0.12 0.12 8 0.04 0.04 16
Prorocentrum balticum 1.63 1.29 8 0.34 0.14 16
Prorocentrum dentatum 0.00 0.00 8 0.03 0.02 16
Prorocentrum minimum 0.92 0.36 8 0.07 0.04 16
Torodinium robustum 0.25 0.08 8 0.15 0.06 16
Diatomophyceae
Chaetoceros spp. 0.00 0.00 8 0.02 0.01 16
Climacodium frauenfeldianum 0.00 0.00 8 0.00 0.00 16
Pennate diatoms 430mm 0.00 0.00 8 0.00 0.00 16
Pennate diatoms o30mm 0.02 0.02 8 0.04 0.04 16
Neodelphineis sp 1.87 0.82 8 0.33 0.28 16
Nitzschia bicapitata 0.12 0.12 8 0.16 0.07 16
Nitzschia longissima 1.82 0.49 8 0.03 0.01 16
Pseudo-nitzschia pseudodelicatisima 0.17 0.10 8 0.02 0.01 16
Pseudo-nitzschia turgidula 1.92 1.77 8 0.03 0.02 16
Rhizosolenia fragilissima 0.00 0.00 8 0.00 0.00 16
Flagellate
Monads 48 mm 85.07 10.27 8 10.81 1.37 16 1
Prymnesiophyceae
Phaeocystis poucheti 0.80 0.58 8 0.00 0.00 16
Cryptophyceae
Cryptomonas spp. 20.20 1.40 8 1.95 0.47 16
Sampling stations were grouped into the six biogeochemical province
all the biogeochemical provinces, with averagevalues exceeding 60 cells ml�1 in ETRA (Table 3).Diatoms, although always present, were lessabundant than dinoflagellates. Large chain-form-ing species such as Climacodium frauenfeldianum
and Nitzschia longissima, and free cells of Nitzschia
bicapitata were the most abundant diatoms,with the highest abundance values (up to�3 cell ml�1) in the upwelling area of CNRY andthe equatorial region of ETRA (Table 3). Flagel-lates and Cryptophyceae were also present insignificant numbers, showing the highest abun-dance values (85 and 20 cell ml�1, respectively) inNADR.
NRY ETRA SATL BRAZ
ean SE n Mean SE n Mean SE n Mean SE n
0.92 0.20 13 1.47 0.00 31 1.99 0.00 12 1.14 0.00 8
1.03 0.25 13 0.58 0.25 31 0.48 0.97 12 0.59 0.23 8
6.73 3.49 13 60.36 4.92 31 23.53 0.02 12 34.11 3.35 8
0.00 0.00 13 0.00 0.00 31 0.03 0.00 12 0.00 0.00 8
0.37 0.05 13 1.54 0.01 31 0.42 0.00 12 0.62 0.02 8
0.20 0.18 13 0.38 0.00 31 0.08 0.00 12 1.05 0.36 8
0.09 0.07 13 0.79 0.19 31 0.08 0.00 12 0.03 0.00 8
0.21 0.11 13 0.03 0.00 31 0.12 0.07 12 0.58 0.41 8
0.24 0.02 13 1.07 0.00 31 0.26 0.08 12 0.20 0.06 8
0.25 0.11 13 0.04 0.00 31 0.03 0.02 12 0.53 0.31 8
1.71 1.61 13 0.00 0.01 31 0.00 0.00 12 0.00 0.00 8
0.05 0.03 13 0.19 0.57 31 0.10 0.03 12 0.08 0.01 8
0.35 0.35 13 1.12 0.93 31 0.05 0.03 12 0.19 0.07 8
0.50 0.39 13 0.08 0.17 31 0.00 0.00 12 0.34 0.24 8
0.13 0.08 13 2.38 1.23 31 1.02 0.22 12 0.37 0.01 8
2.72 0.28 13 0.95 0.02 31 0.00 0.00 12 1.27 0.78 8
0.22 0.06 13 0.87 0.02 31 0.18 0.07 12 0.05 0.03 8
0.06 0.06 13 0.31 0.00 31 0.02 0.01 12 0.16 0.06 8
0.08 0.07 13 0.02 0.00 31 0.00 0.00 12 0.65 0.46 8
2.50 2.24 13 18.92 0.00 31 6.91 0.22 12 32.02 14.13 8
0.42 0.42 13 0.28 0.18 31 0.00 0.00 12 0.72 0.51 8
4.25 0.45 13 9.16 0.49 31 1.49 0.22 12 3.16 1.44 8
s traversed by the AMT-11 transect. n ¼ number of samples.

ARTICLE IN PRESS
Latitude
0
20
40
60
80
Syne
choc
occu
s (x
103 c
ells
ml-1
) NADR NAST CNRY ETRA SATL BRAZ
N60° 40°20° 0° 20°40°
S
Fig. 4. Distribution of mean (7 SE) abundance of Synechoc-
cocus (� 103 cells ml�1) in the euphotic zone along the AMT-11
transect. The extension of the biogeochemical provinces is also
indicated.
M.M. Varela et al. / Deep-Sea Research I 52 (2005) 1637–1661 1645
Synechoccocus abundances (Fig. 4) were gener-ally low in oligotrophic waters, as in NAST and inthe transition zone between ETRA and SATL(o3� 103 cells ml�1), but reached high values(450� 103 cells ml�1) in areas with relativelyhigh Chl-a concentrations (particularly in theupwelling stations of CNRY and equatorial watersof ETRA). Such distribution and abundancevalues agree with published data obtained withflow cytometry (Zubkov et al., 1998). However, inour study we detected a clear difference inSynechococcus abundances between the northernand southern oligotrophic gyres. While the abun-dances at NAST stations were uniformly low,those at SATL varied from o2 to 420� 103
cells ml�1, with an increase towards the centre ofthe gyre and a decrease towards the boundary withBRAZ (Fig. 4).
3.3. Nitrogen uptake and DON release rates:
vertical variability
Ammonium uptake rates (rNHþ4 ) were gener-
ally higher at the surface or at intermediatedepths rather than in deep waters (Fig. 5). Maxi-mum values generally did not exceed2 nmol l�1 h�1, but were up to 8 nmol l�1 h�1 insome stations of NADR. In contrast, NO3
� uptake(rNO�
3 ) profiles always showed the highest valuesin deep-water samples. The vertical distribution ofurea uptake rates (rUrea) displayed an intermedi-
ate pattern between those of NH4+ and NO3
� butgenerally decreased with depth. Values of rUreawere in general lower than 5 nmol l�1 h�1, exceptat some stations of ETRA and BRAZ, where theyreached rates up to 24 and 18 nmol l�1 h�1,respectively. Nitrogen uptake showed significantpositive correlation within substrate types(r ¼ 0:677, po0:001, n ¼ 67; r ¼ 0:916, po0:001,n ¼ 56; r ¼ 0:821, po0:001, n ¼ 70, for NH4
+,NO3
� and urea, respectively). In all cases, nitrogenuptake rates exceeded DON release rates.
Vertical profiles of rDON (Fig. 6) showed asimilar pattern to nitrogen uptake for each of theprovinces examined. In the same way, rDON wasalso correlated within substrate types (r ¼ 0:829,po0:001, n ¼ 67; r ¼ 0:734, po0:001, n ¼ 56;r ¼ 0:648, po0:001, n ¼ 70, for NH4
+, NO3�
and urea, respectively). DON release as a result
of NH4+
ðrDONNHþ
4 Þ or urea (rDONUrea) utiliza-tion was significantly lower (maximum valueswere 2 and 10 nmol l�1 h�1, respectively) than
DON released from NO3�
ðrDONNO�
3 Þ uptake(up to 59 nmol l�1 h�1; Student-t, po0:001,n ¼ 225). Average (7SE) rDON was 0.3070.04,3.4070.92 and 1.7470.24 nmol l�1 h�1, for NH4
+,NO3
� and urea, respectively (n ¼ 75).
The vertical distribution of PER (Fig. 7) showeddifferent patterns depending on the nitrogencomponent considered. Values of PER resulting
from NH4+ and urea uptake (PER
NHþ4 and
PERUrea, respectively) followed an almost contin-uous increasing trend with depth. In contrast, PER
resulting from NO3� utilization ðPER
NO�3 Þ did not
show any clear vertical trend, except in NAST andSATL, where a slight decrease with depth was
observed. In all cases, the average PERNO�
3 values
(42%) were significantly higher than PERNHþ
4 orPERUrea (22 and 26%, respectively; Student t-test,po0:001, n ¼ 210).
Nitrogen release rates showed a pattern analo-gous to Chl-a distribution. Nitrogen uptakeand DON release rates were significantly corre-lated with Chl-a and to a lesser extent with PON(Table 4). However, there was not a significantcorrelation between Chl-a and PON, or with PERand any of the nitrogen substrates.

ARTICLE IN PRESS
100
7
1
ρρNH4+, ρρNO3
− or ρρUrea (nmol l-1 h-1)
SATL
100
7
1
0 10 20 30
100
7
1
ρρNH4+, ρρNO3
− or ρρUrea (nmol l-1 h-1)
ETRA
CNRY
BRAZ
I 0(%
)NAST
0 5 10 15 0 5 10 15
0 5 10 15 0 5 10 15 0 5 10 15
100
7
1
100
7
1
100
7
1
NADR
ρNH4+
ρNO3-
ρUrea
I 0(%
)
Fig. 5. Vertical distribution of mean (7SE) rates of NH4+ (white bars), NO3
� (black bars) and urea (grey bars) uptake in the different
biogeochemical provinces studied (see Fig. 1). I0: irradiance expressed as percent of irradiance received at the surface. Note the change
in the scale of the abscissa in the panel of the CNRY province. Number of cases averaged in each bar corresponds to the number of
stations in each province (see Fig. 2).
M.M. Varela et al. / Deep-Sea Research I 52 (2005) 1637–16611646
3.4. Euphotic-zone integrated nitrogen stocks,
nitrogen uptake and DON release rates: latitudinal
variability
Mean DIN concentrations integrated over theeuphotic layer were highly variable along theAMT-11 transect, from 13 mmol N m�2 measuredin the southern oligotrophic gyre (SATL) to4400 mmol N m�2 registered in the upwelling areaof CNRY and the equatorial region of ETRA(Table 5). Depth-integrated urea concentrations
showed slight changes along the transect, rangingfrom 16 mmol N m�2 in NAST to 41 mmol N m�2
in SATL. Although NH4+ was always detected in
all the stations sampled, the average contributionof NH4
+ to the concentration of total integratednitrogen substrates was generally low throughoutthe transect, showing the highest contribution(20%) in the northern temperate region (NADR).By contrast, NO3
� and urea accounted for a largerproportion of total nitrogen concentration thanNH4
+ (Fig. 8). Nitrate was the main form of

ARTICLE IN PRESS
100
7
1
100
7
1
100
7
1
0 1 2 3 4 5
0 1 2 3 4 5 0 1 2 3 4 5 0 1 2 3 4 5
0 1 2 3 4 5 0 10 20 30 40 50
100
7
1
100
7
1
100
7
1
rDON (nmol l-1 h-1)
rDON (nmol l-1 h-1)
NADR NAST CNRY
ETRA SATL BRAZ
I 0(%
)I 0
(%)
rDONNH4+
rDONNO3-
rDONUrea
Fig. 6. Vertical distribution of mean (7SE) rates of DON release from NH4+ (white bars), NO3
� (black bars) and urea (grey bars)
uptake in the different biogeochemical provinces studied (see Fig. 1). I0: irradiance expressed as percent of irradiance received at the
surface. Number of cases as in Fig. 5.
M.M. Varela et al. / Deep-Sea Research I 52 (2005) 1637–1661 1647
inorganic nitrogen available along most of theNorth Atlantic stations, reaching 490% of totalnitrogen concentration in the areas of CNRY andETRA. Urea showed the maximum contributionto the total nitrogen concentration in the southAtlantic waters (up to 70% in SATL).
The total integrated nitrogen uptake ratesshowed a similar distribution to Chl-a (Table 5).Maximum concentrations were detected in theupwelling area of CNRY (mean value2431 mmol N m�2 h�1), while minimum values werefound in the northern oligotrophic gyre (NAST,212 mmol N m�2 h�1). Similarly, the relative con-
tribution of rNO�3 to total N uptake (Fig. 8)
showed the highest values at the upwelling stationsof CNRY (78%) and ETRA (40%), while themaximum contribution of rNHþ
4 was measured atNADR (58%). In contrast, rUrea accounted forca. 80% of the total N uptake in South Atlanticwaters, particularly at BRAZ. A latitudinal trendwas also apparent for the depth integrated f0-ratio,with values ranging from 0.8 in the CNRYupwelling area to 0.1 in the northern oligotrophicgyre (Table 5). Euphotic depth integrated totalrDON was significantly correlated (r ¼ 0:770,po0:001, n ¼ 20) with total depth integrated N

ARTICLE IN PRESS
100
7
1
100
7
1
100
7
1
100
7
1
0 25 50 75 100 0 25 50 75 100 0 25 50 75 100
0 25 50 75 100 0 25 50 75 100 0 25 50 75 100
100
7
1
NADR NAST CNRY
ETRA SATL
PER (%)
PER (%)
100
7
1
BRAZ
I 0(%
)I 0
(%) PERNH4+
PERNO3-
PERUrea
Fig. 7. Vertical distribution of mean (7SE) rates of percentage of extracellular DON release relative to NH4+ (white bars), NO3
� (black
bars) and urea (grey bars) uptake in the different biogeochemical provinces studied (see Fig. 1). I0: irradiance expressed as percent of
irradiance received at the surface. Number of cases as in Fig. 5.
Table 4
Correlation values between Chl-a and PON and nitrogen uptake, DON release rates and PER computed from volumetric data
rNHþ4
rNO�3 rUrea rDON
NHþ4 rDONNO�
3 rDONUrea
PERNHþ
4 PERNO�3 PERUrea
Chl-a 0.517** 0.728*** 0.492** 0.564*** 0.734*** 0.690*** n.s. n.s. n.s.
PON 0.335* 0.592** 0.327* 0.248* 0.594** 0.574** n.s. n.s. n.s.
n 67 56 70 67 56 70 67 56 70
n ¼ number of data points.Significance (p) is indicated by asterisks: po0:05, po0:01, po0:001.n.s.: non-significant (p40:05).
M.M. Varela et al. / Deep-Sea Research I 52 (2005) 1637–16611648
uptake, indicating a close coupling between thetwo rates along the latitudinal transect of AMT-11. Furthermore, the relative contributions of
NH4+, NO3
� and urea to total euphotic layerintegrated rDON were also closely parallel tothose described for integrated nitrogen uptake
ARTICLE IN PRESS
Table 5
Mean (7SE) nitrogen stocks (mmol m�2), chlorophyll-a (mg m�2) and fluxes of nitrogen (mmol m�2 h�1) and carbon (PP,
mg C m�2 d�1) integrated in the euphotic layer
Biogeochemical province: NADR NAST CNRY ETRA SATL BRAZ
Mean integration depth (m): 60 110 80 80 140 90
Mean SE n Mean SE n Mean SE n Mean SE n Mean SE n Mean SE n
NH4+ 18.7 4.1 3 5.2 3.8 3 0.8 0.0 2 0.8 0.0 7 1.4 0.1 5 1.1 0.1 4
NO3�+NO2
� 52.5 40.3 3 50.0 12.1 3 399.3 289.1 2 453.4 145.4 7 13.2 4.9 5 20.3 7.5 4
DIN 71.2 44.4 3 55.2 15.9 3 400.1 289.1 2 454.2 145.4 7 14.6 4.8 5 21.4 7.4 4
Urea 19.2 11.8 3 16.4 2.9 3 29.4 3.0 2 34.3 4.4 7 33.1 8.5 5 41.6 10.4 4
PON 50.5 6.6 3 56.6 6.4 3 48.9 2.3 2 57.6 2.2 7 77.6 6.4 5 66.8 2.8 4
DON 233.9 66.8 3 388.1 18.7 3 550.7 125.5 2 427.6 32.1 7 732.6 56.0 5 406.2 84.3 4
Chl-a 19.1 1.3 3 15.7 0.6 3 22.5 0.3 2 21.3 1.0 7 18.3 1.2 5 26.2 0.4 4
% Chl-a o2 mm 61.1 9.0 3 72.9 2.5 3 58.4 10.9 2 65.3 3.2 7 76.3 1.6 5 66.3 3.5 4
PP 208.7 16.5 3 157.2 3.5 3 640.8 0.0 1 626.4 145.6 6 179.4 17.2 5 458.7 124.0 3
% PP o2mm 44.4 10.2 3 50.7 2.6 3 67.5 0.0 1 63.9 2.8 6 48.1 4.3 5 58.6 3.8 3
rNHþ4
164.5 96.2 3 81.0 11.9 3 79.0 0.8 2 61.1 12.8 7 123.8 33.4 4 56.1 6.6 3
rNO�3 39.0 25.8 3 21.5 6.7 3 1900.7 929.8 2 381.2 192.2 5 135.9 106.2 4 104.8 39.3 4
rUrea 78.5 30.7 3 109.9 9.6 3 451.5 117.4 2 522.2 99.5 7 478.8 108.0 5 642.8 255.7 4
rNtotal 282.0 87.2 3 212.4 15.8 3 2431.2 1048.0 2 910.5 162.4 5 590.8 158.1 4 803.7 297.1 4
f0 ratio 0.2 0.1 3 0.1 0.0 3 0.8 0.1 2 0.4 0.1 5 0.2 0.2 4 0.2 0.0 4
rDONNHþ
4 42.9 11.1 3 26.5 4.1 3 14.8 6.9 2 12.9 2.0 7 36.4 4.0 5 9.3 2.2 4
rDONNO�
3 41.0 17.9 3 33.1 8.0 3 867.3 596.1 2 346.9 131.3 7 88.9 35.9 5 47.4 28.4 4
rDONUrea 29.3 9.1 3 52.4 6.6 3 84.2 46.3 2 158.1 29.9 7 151.8 17.0 5 233.6 63.5 4
rDONtotal 113.2 30.5 3 112.0 5.2 3 966.3 542.9 2 517.9 128.8 7 277.1 38.7 5 290.3 85.2 4
PERNHþ
4 26.7 5.9 3 24.8 3.2 3 15.3 6.3 2 21.3 5.0 7 26.3 5.6 4 14.3 2.8 3
PERNO�3 60.2 20.9 3 60.5 16.2 3 28.0 6.1 2 39.4 7.3 5 49.0 6.7 4 24.2 5.5 4
PERUrea 28.6 2.3 3 32.1 1.5 3 17.2 10.9 2 23.7 1.8 7 24.3 4.0 5 31.6 4.9 4
PERtotal 28.7 1.9 3 34.6 2.4 3 28.4 3.4 2 28.8 6.3 5 38.0 11.3 4 28.3 3.1 3
Sampling stations were grouped into the six biogeochemical provinces traversed by the AMT-11 transect.
M.M. Varela et al. / Deep-Sea Research I 52 (2005) 1637–1661 1649
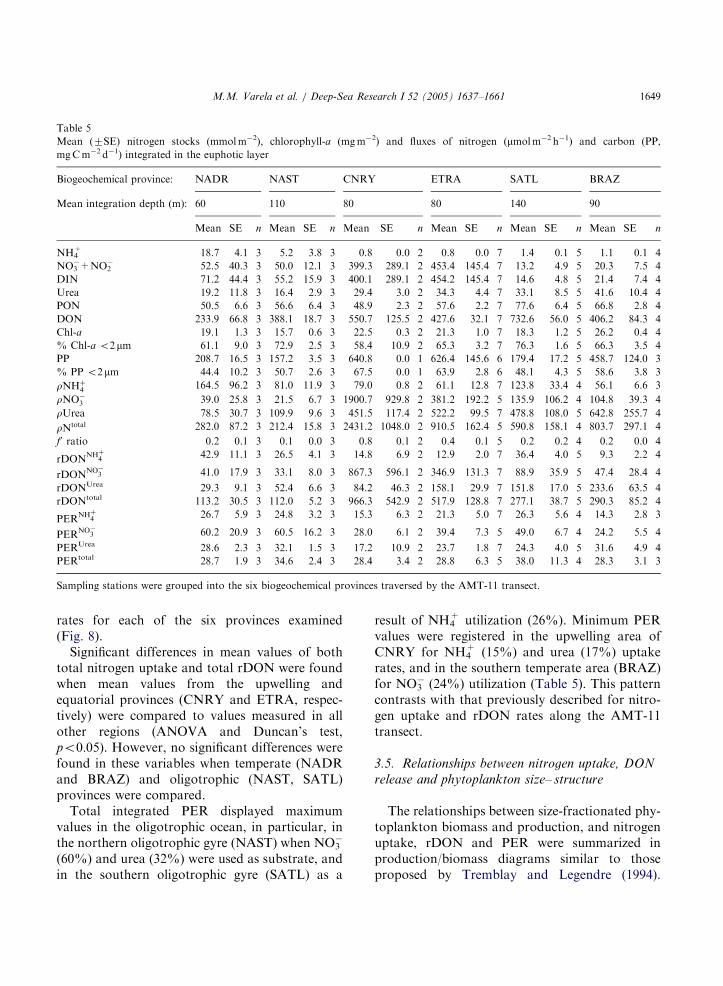
rates for each of the six provinces examined(Fig. 8).
Significant differences in mean values of bothtotal nitrogen uptake and total rDON were foundwhen mean values from the upwelling andequatorial provinces (CNRY and ETRA, respec-tively) were compared to values measured in allother regions (ANOVA and Duncan’s test,po0:05). However, no significant differences werefound in these variables when temperate (NADRand BRAZ) and oligotrophic (NAST, SATL)provinces were compared.
Total integrated PER displayed maximumvalues in the oligotrophic ocean, in particular, inthe northern oligotrophic gyre (NAST) when NO3
�
(60%) and urea (32%) were used as substrate, andin the southern oligotrophic gyre (SATL) as a
result of NH4+ utilization (26%). Minimum PER
values were registered in the upwelling area ofCNRY for NH4
+ (15%) and urea (17%) uptakerates, and in the southern temperate area (BRAZ)for NO3
� (24%) utilization (Table 5). This patterncontrasts with that previously described for nitro-gen uptake and rDON rates along the AMT-11transect.
3.5. Relationships between nitrogen uptake, DON
release and phytoplankton size– structure
The relationships between size-fractionated phy-toplankton biomass and production, and nitrogenuptake, rDON and PER were summarized inproduction/biomass diagrams similar to thoseproposed by Tremblay and Legendre (1994).

ARTICLE IN PRESS
0%
20%
40%
60%
80%
100%
NADR NAST CNRY ETRA SATL BRAZ
% o
f tot
al N
-con
cent
ratio
n
0%
20%
40%
60%
80%
100%
NADR NAST CNRY ETRA SATL BRAZ
% o
f tot
al N
-upt
ake
0%
20%
40%
60%
80%
100%
NADR NAST CNRY ETRA SATL BRAZ
% o
f tot
al D
ON
rel
ease
(a)
(b)
(c)
NH4+ NO3
− Urea
Fig. 8. Mean values of the relative contributions (%) of NH4+
(white bars), NO3� (black bars) and urea (grey bars) to (a) total
N concentration, (b) total N uptake, and (c) total DON release.
Sampling stations were grouped into the six biogeochemical
provinces traversed by the AMT-11 transect. Number of cases
as in Fig. 5.
M.M. Varela et al. / Deep-Sea Research I 52 (2005) 1637–16611650
Contour plots of nitrogen uptake, rDON and PERwere projected over the diagrams displaying therelative contribution of small phytoplankton(o2 mm) to either total chlorophyll or totalprimary production (Fig. 9). As the distribution
of total nitrogen uptake (rNtotal), total rDON(rDONtotal) and total PER (PERtotal) over theproduction/biomass diagram was similar to thosecalculated for the individual nitrogen sources, onlythe results calculated using the total nitrogen poolare presented. A similar procedure was used inprevious studies focused on the relationships ofDOC and DON release with phytoplankton size(Teira et al., 2001, 2003; Varela et al., 2003).
The distribution of size-fractionated phyto-plankton in all domains was characterized by thedominance of o2 mm cells, which contributed, onaverage, to more than 50% of both total biomassand primary production (Table 5). However, thecontribution of small cells to total biomassgenerally exceeded their input to total primaryproduction. The degree of mismatch between therelative contribution of each phytoplankton size-fraction to total biomass and primary productionwas more apparent at the subtropical provinces ofboth hemispheres (NAST and SATL), where, onaverage, small cells contributed �50% of totalprimary production and �75% of total Chl-abiomass (Fig. 9). In contrast, in the temperateprovinces (NADR and BRAZ) small cells ac-counted on average for a fraction of the totalbiomass (�60%) close to their relative contribu-tion to total primary production (�50%) and alsoin the upwelling and equatorial provinces (CNRYand ETRA, respectively), where the averagecontribution of small cells to both total biomassand primary production was �60% (Fig. 9).
The lowest rates of both rNtotal and rDONtotal
occurred when the relative contribution of smallcells to total biomass exceeded their contributionto total primary production (lower-right region ofthe diagram in Fig. 9a). Both rNtotal andrDONtotal increased as the contributions of smallcells to total biomass was close to their contribu-tion to primary production (i.e. rNtotal andrDONtotal increased toward the dotted line inFig. 9a and b). As a consequence, PERtotal valueswere maximum (450%) where the contribution ofsmall cells to total biomass largely exceeded theircontribution to total primary production (i.e.towards the lower right region in Fig. 9c), andminimum (o30%) where small cells had a similarcontribution to both total biomass and primary

ARTICLE IN PRESS
M.M. Varela et al. / Deep-Sea Research I 52 (2005) 1637–1661 1651
production. Despite these general patterns, thehigh variability of values measured along thelatitudinal transect makes it difficult to find more
(a)
(b)
(c)
40 50 60 70 80 90
% Chl-a < 2 µm
20
30
40
50
60
70
80
90PER (%)
40 50 60 70 80 90
% Chl-a < 2 µ
% P
P <
2 µ
m%
PP
< 2
µm
% P
P <
2 µ
m
m
20
30
40
50
60
70
80
90
40 50 60 70 80 90
% Chl-a < 2 µm
20
30
40
50
60
70
80
90rDON (µmol m h )-2 -1total
ρN (µmol m h )-2 -1total
total
precise relationships between nitrogen uptake,the release rates, or the size–structure of thephytoplankton community. For instance, therewere significant negative correlations betweeneither rNtotal or rDONtotal and the contributionof o2 mm cells to total chlorophyll biomass(r ¼ �0:476 and �0.474 for rNtotal and rDONtotal,respectively; n ¼ 21, po0:05), but there were nosignificant correlations between these variablesand the contribution of o2 mm cells to totalprimary production. In the same way, we did notfind a significant correlation between PERtotal andthe relative contribution of o2 mm cells to eitherbiomass or production.
To illustrate the latitudinal variation of PERtotal
with phytoplankton size, we computed a linearregression using PERtotal as the dependent variable(y) and the contributions of o2 mm cells to eitherbiomass or primary production as the independentvariables (x1 and x2, respectively), by taking intoaccount that independent variables were notsignificantly correlated in our dataset (p40:05,n ¼ 21). We used Least Trimmed Squares (LTS)robust regression (Venables and Ripley, 1997) toavoid the effect of extreme outliers in the estima-tion of regression parameters, and transformed theoriginal percent values of all the variables bymeans of the square root transformation (Sokaland Rohlf, 1981). The resulting equation(y ¼ 8:863 þ 0:417x120:919x2, r2 ¼ 0:707) wascomputed using 12 of the 21 data points andallowed for the estimation of PERtotal values fromphytoplankton size–structure. Such values weremostly within 10% of the measured values exceptat some stations (Fig. 10). Maximum deviationsbetween measured and estimated PERtotal gener-ally occurred in the southern Atlantic provinces,particularly in ETRA and SATL. Such deviations
Fig. 9. Contour plots of euphotic-zone integrated (a) total
nitrogen uptake (rNtotal, mmol m�2 h�1), (b) total DON release
(rDONtotal, mmol m�2 h�1), and (c) percentage of total DON
release relative to nitrogen uptake (PERtotal, %) superimposed
to dot-plots showing the relative contribution of small
phytoplankton to integrated chlorophyll-a (% Chl-ao2 mm)
and to particulate primary production (% PPo2 mm). The
dashed line in each plot indicates an equal contribution of small
cells to total biomass and to total primary production.

ARTICLE IN PRESS
-60
-40
-20
0
20
40
60
-60 -40 -20 0 20 40
NADR NAST CNRY ETRA SATL BRAZ
perc
ent d
iffe
renc
e or
per
cent
PE
Rto
tal
measured PERtotal – estimated PERtotal
% Chl-a < 2 µm – % PP < 2 µm
measured PERtotal
Latitude
60° 40°20° 0° 20°40°
N S
Fig. 10. Latitudinal distribution of the measured PERtotal (thick dashed line, closed circles) and the difference between measured
euphotic-zone integrated PERtotal values and those estimated from a regression equation using the contribution of small
phytoplankton to both total chlorophyll-a (% Chl-ao2 mm) and total primary production (% PPo2 mm) along the AMT-11 transect
(thick line, closed circles). The regression equation was computed by a robust least squares procedure (see Section 3 for details). The
mismatch between the contribution of small phytoplankton to total chlorophyll concentration and their contribution to total
production in each station (thin line, open circles), along with the extension of the biogeochemical provinces, is also indicated.
M.M. Varela et al. / Deep-Sea Research I 52 (2005) 1637–16611652
were often associated with stations where therewas also a large mismatch between the contribu-tions of small phytoplankton to total Chl-a and tototal production (as in SATL and one of thestations in NADR). However, we obtained reason-ably good estimates of PERtotal using the regres-sion equation in NAST (i.e. difference betweenmeasured and estimated values o5%), despite thefact that the contribution of small phytoplanktonto total Chl-a exceeded by 420% their contribu-tion to total production (Fig. 10).
4. Discussion
4.1. Nitrogen uptake
The grouping of sampling stations into biogeo-chemical provinces using the criteria defined byLonghurst (1998), as in this study, has beensuccessfully employed in a series of descriptions
of a variety of biological processes in the AtlanticOcean (e.g. Maranon et al., 2000; Zubkov et al.,2000; Teira et al., 2001). Aggregation of dataobtained for the described biogeochemical pro-vinces whose boundaries are in good agreementwith those obtained using exclusively hydro-graphic data (Hooker et al., 2000), may be usefulfor parameterising global budgets and models. Inthis way, the results for nitrogen uptake and DONrelease rates reported in this study are the firstcovering such a large range of biogeochemicalprovinces and considering the main nitrogensources (NH4
+, NO3� and urea) simultaneously.
Previous studies in the Atlantic Ocean reportedmostly rNO�
3 and rNHþ4 values that compare well
with our results (Table 6). Nevertheless, thecomparison of nitrogen uptake rates obtainedbetween different studies is not a straightforwardtask because of the variability caused by thegeographical and temporal dimension of thesestudies, and also by the different methodological
ARTIC
LEIN
PRES
S
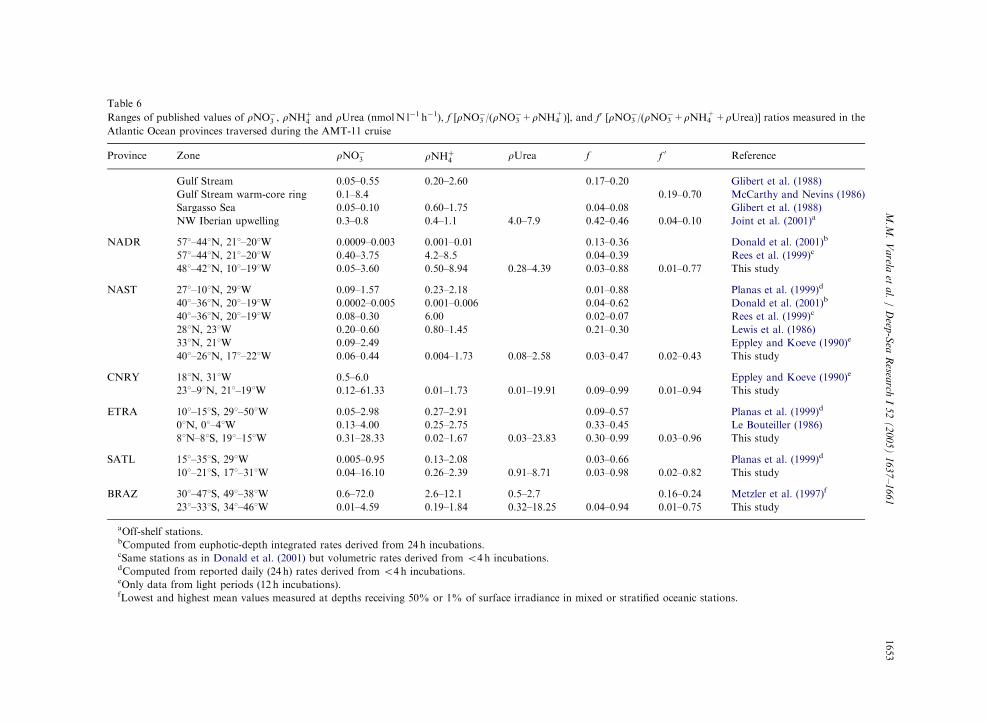
Table 6
Ranges of published values of rNO�3 , rNHþ
4 and rUrea (nmol N l�1 h�1), f [rNO3�/(rNO3
�+rNH4+)], and f0 [rNO3
�/(rNO3�+rNH4
++rUrea)] ratios measured in the
Atlantic Ocean provinces traversed during the AMT-11 cruise
Province Zone rNO�3 rNHþ
4rUrea f f 0 Reference
Gulf Stream 0.05–0.55 0.20–2.60 0.17–0.20 Glibert et al. (1988)
Gulf Stream warm-core ring 0.1–8.4 0.19–0.70 McCarthy and Nevins (1986)
Sargasso Sea 0.05–0.10 0.60–1.75 0.04–0.08 Glibert et al. (1988)
NW Iberian upwelling 0.3–0.8 0.4–1.1 4.0–7.9 0.42–0.46 0.04–0.10 Joint et al. (2001)a
NADR 571–441N, 211–201W 0.0009–0.003 0.001–0.01 0.13–0.36 Donald et al. (2001)b
571–441N, 211–201W 0.40–3.75 4.2–8.5 0.04–0.39 Rees et al. (1999)c
481–421N, 101–191W 0.05–3.60 0.50–8.94 0.28–4.39 0.03–0.88 0.01–0.77 This study
NAST 271–101N, 291W 0.09–1.57 0.23–2.18 0.01–0.88 Planas et al. (1999)d
401–361N, 201–191W 0.0002–0.005 0.001–0.006 0.04–0.62 Donald et al. (2001)b
401–361N, 201–191W 0.08–0.30 6.00 0.02–0.07 Rees et al. (1999)c
281N, 231W 0.20–0.60 0.80–1.45 0.21–0.30 Lewis et al. (1986)
331N, 211W 0.09–2.49 Eppley and Koeve (1990)e
401–261N, 171–221W 0.06–0.44 0.004–1.73 0.08–2.58 0.03–0.47 0.02–0.43 This study
CNRY 181N, 311W 0.5–6.0 Eppley and Koeve (1990)e
231–91N, 211–191W 0.12–61.33 0.01–1.73 0.01–19.91 0.09–0.99 0.01–0.94 This study
ETRA 101–151S, 291–501W 0.05–2.98 0.27–2.91 0.09–0.57 Planas et al. (1999)d
01N, 01–41W 0.13–4.00 0.25–2.75 0.33–0.45 Le Bouteiller (1986)
81N–81S, 191–151W 0.31–28.33 0.02–1.67 0.03–23.83 0.30–0.99 0.03–0.96 This study
SATL 151–351S, 291W 0.005–0.95 0.13–2.08 0.03–0.66 Planas et al. (1999)d
101–211S, 171–311W 0.04–16.10 0.26–2.39 0.91–8.71 0.03–0.98 0.02–0.82 This study
BRAZ 301–471S, 491–381W 0.6–72.0 2.6–12.1 0.5–2.7 0.16–0.24 Metzler et al. (1997)f
231–331S, 341–461W 0.01–4.59 0.19–1.84 0.32–18.25 0.04–0.94 0.01–0.75 This study
aOff-shelf stations.bComputed from euphotic-depth integrated rates derived from 24 h incubations.cSame stations as in Donald et al. (2001) but volumetric rates derived from o4 h incubations.dComputed from reported daily (24 h) rates derived from o4 h incubations.eOnly data from light periods (12 h incubations).fLowest and highest mean values measured at depths receiving 50% or 1% of surface irradiance in mixed or stratified oceanic stations.
M.M
.V
arela
eta
l./
Deep
-Sea
Resea
rchI
52
(2
00
5)
16
37
–1
66
11653
ARTICLE IN PRESS
M.M. Varela et al. / Deep-Sea Research I 52 (2005) 1637–16611654
approaches. For instance, long incubations (e.g.24 h) generally produce lower estimates of uptakerates than those derived from short incubations(o6 h), probably because of the exhaustion orrecycling of the nitrogen source in the former (e.g.Donald et al., 2001). When we consider only ratesderived from short incubations, which are ex-pected to be less influenced by recycling (Bronkand Ward, 2000, Slawyk et al., 2000), our resultsenlarge the lower limit of the range of rNO�
3 andrNHþ
4 values published in NADR, NAST, CNRYand BRAZ provinces. In the case of ETRA,our maximum rNO�
3 values exceed publishedrates, while minimum rNHþ
4 values were lowerthan those reported in the literature (Table 6).However, the maximum rNO�
3 rates measuredin this study (up to 61.2 nmol l�1 h�1 in CNRY)were actually typical of upwelling regions (e.g.Joint et al., 2001).
To our knowledge, this study is the firstreporting significant rUrea in areas of the centralAtlantic. In particular, we found maximum valuesin the South Atlantic, where the average contribu-tion of rUrea to total integrated nitrogen uptakeexceeded 50% in SATL and 80% in BRAZ. Somestudies showed relatively high rUrea rates inoceanic regions near the shelf break (McCarthy,1972; Joint et al., 2001), while others found thaturea contributed ca. 10% to total nitrogen uptake,as reported by Metzler et al. (1997) for waters offthe Brazilian shelf (Table 6). Although averagevalues of rUrea measured in our study were ca.20% of the values reported for coastal seas(Riegman and Noordelos, 1998; Varela andHarrison, 1999; Tremblay et al., 2000), thecontribution of urea to nitrogen dynamics in theeuphotic layer of oceanic regions would requirefurther consideration in future studies. However,rUrea rates may cause large changes in f-ratiovalues thus severely affecting the estimations ofnew production (Metzler et al., 1997). Forinstance, with computations of f-ratio taking intoaccount rUrea (f0-ratio) in our study, minimumvalues at ETRA were reduced by a factor of 10(Table 6). A similar effect was noted by Joint et al.(2001) off NW Iberia.
Taking rUrea into consideration, f0-ratio valuescomputed from rates integrated in the euphotic
zone (Table 5) were similar to the average f valueof 0.2 reported by Planas et al. (1999) for alatitudinal transect across the Central Atlantic,despite the high rNO�
3 values measured in ourstudy. These values also agree with independentestimates of f-ratio in the Central Atlantic fromthe natural abundance of stable nitrogen isotopesin PON (Mino et al., 2002). Only upwelling andequatorial regions showed significant increases inmean integrated f0-ratio values (up to 0.8 inCNRY). Therefore, our results confirm that mostof the short-term (e.g. hourly) production inwaters of the Central Atlantic is sustained byregenerated nutrients, as shown by previousstudies in the oligotrophic ocean (Le Bouteiller,1986; Lewis et al., 1986; Glibert et al., 1988; Planaset al., 1999). However, we found a predominantrole of DON sources (such as urea) over NH4
+,particularly in waters south of the equator.
Yet, our nitrogen uptake and DON releasevalues give account of that assimilated or releasedby the total microbial community, reflecting alsobacterial proceses, since bacteria (like phytoplank-ton) are capable of taking up both organic andinorganic nitrogen (Keil and Kirchman, 1999;Goldman and Dennet, 2001). In order to corro-borate this, we calculated the contribution ofthe bacterial compartment to PON and DONpools. The mean size of bacteria during theAMT-11 cruise, determined from measure-ments using an image analysis system linked toan epifluorescence microscope (M.M. Varela.,unpubl. results), was 0.11 (70.09 SD, n ¼ 14585)mm3, corresponding to a mean equivalent sphericaldiameter of 0.53 mm. However, the mean bacterialbiomass (12.077.8 nmol N l�1, n ¼ 72), estimatedfrom abundance measurements determined fromepifluorescence microscopy, conversion to carbonusing an allometric equation (Norland et al.,1987), and a C:N molar ratio value of 4.24(Nagata, 1986), was equivalent to o2% of PON.The low fraction of PON accounted for bacteriasuggests that their participation in nitrogen uptakewould be small. The same conclusion can bereached when computing uptake C:N molar ratiosusing the values given in Table 5 and dividing dailyprimary production rates by 10 h of sunlight(average photoperiod for the regions studied
ARTICLE IN PRESS
M.M. Varela et al. / Deep-Sea Research I 52 (2005) 1637–1661 1655
during the cruise). In this way, average uptake C:Nratios varied between 4.8 and 6.2 for most regions,except at the nitrate- rich stations CNRY andETRA, where they were as low as 2.2. As mostuptake C:N values were close to the Redfield valueof 6.6 (Redfield et al., 1963), it can be assumed thatthe measured rates were due mostly to phyto-plankton, although a significant uptake of DIN bybacteria could happen at some upwelling stations.
4.2. DON release
The use of glass-fibre GF/F filters for theseparation between PON and DON in this study,although frequently employed in similar studies(eg. Bronk et al., 1994; Slawyk and Raimbault,1995), may not be appropriate to retain thesmallest planktonic organisms (mainly bacteria),such as those dominating in oligotrophic oceanicwaters. If a substantial fraction of planktono1 mm pass through the GF/F filter, then ourmeasured DON would be underestimated (andPON overestimated). However, the results shownin the previous section indicated that, even in thecase that all bacteria would pass the GF/F filter,they would have a minimal effect on the reportedvalues for PON and DON stocks. Similarly,
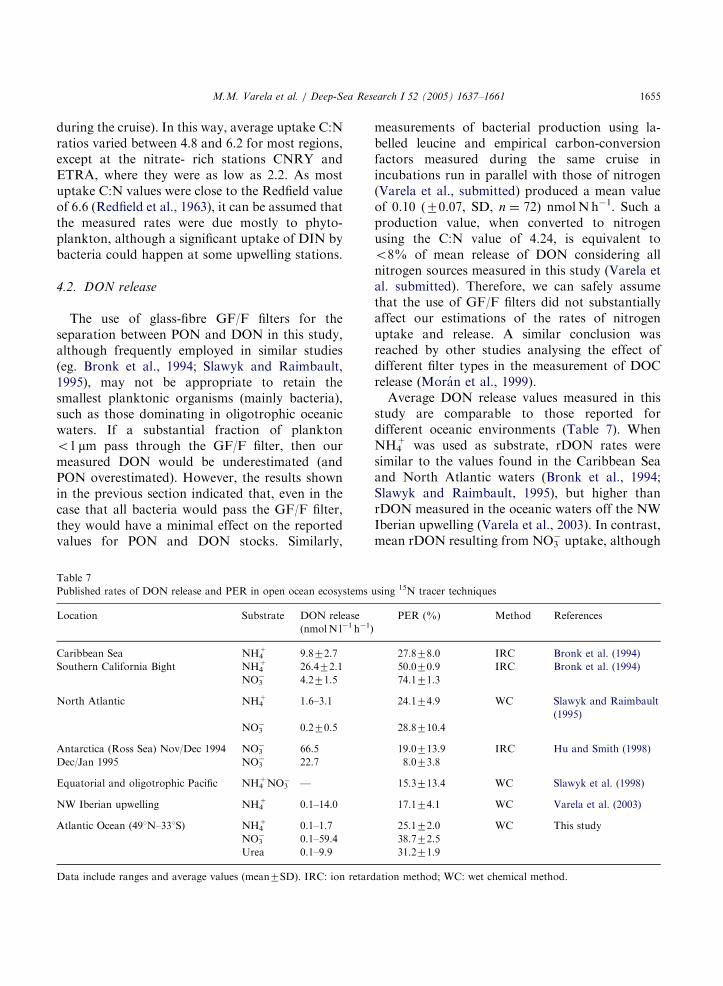
Table 7
Published rates of DON release and PER in open ocean ecosystems
Location Substrate DON release
(nmol N l�1 h�1)
Caribbean Sea NH4+ 9.872.7
Southern California Bight NH4+ 26.472.1
NO3� 4.271.5
North Atlantic NH4+ 1.6–3.1
NO3� 0.270.5
Antarctica (Ross Sea) Nov/Dec 1994 NO3� 66.5
Dec/Jan 1995 NO3� 22.7
Equatorial and oligotrophic Pacific NH4+NO3
� —
NW Iberian upwelling NH4+ 0.1–14.0
Atlantic Ocean (491N–331S) NH4+ 0.1–1.7
NO3� 0.1–59.4
Urea 0.1–9.9
Data include ranges and average values (mean7SD). IRC: ion retard
measurements of bacterial production using la-belled leucine and empirical carbon-conversionfactors measured during the same cruise inincubations run in parallel with those of nitrogen(Varela et al., submitted) produced a mean valueof 0.10 (70.07, SD, n ¼ 72) nmol N h�1. Such aproduction value, when converted to nitrogenusing the C:N value of 4.24, is equivalent too8% of mean release of DON considering allnitrogen sources measured in this study (Varela etal. submitted). Therefore, we can safely assumethat the use of GF/F filters did not substantiallyaffect our estimations of the rates of nitrogenuptake and release. A similar conclusion wasreached by other studies analysing the effect ofdifferent filter types in the measurement of DOCrelease (Moran et al., 1999).
Average DON release values measured in thisstudy are comparable to those reported fordifferent oceanic environments (Table 7). WhenNH4
+ was used as substrate, rDON rates weresimilar to the values found in the Caribbean Seaand North Atlantic waters (Bronk et al., 1994;Slawyk and Raimbault, 1995), but higher thanrDON measured in the oceanic waters off the NWIberian upwelling (Varela et al., 2003). In contrast,mean rDON resulting from NO3
� uptake, although
using 15N tracer techniques
PER (%) Method References
27.878.0 IRC Bronk et al. (1994)
50.070.9 IRC Bronk et al. (1994)
74.171.3
24.174.9 WC Slawyk and Raimbault
(1995)
28.8710.4
19.0713.9 IRC Hu and Smith (1998)
8.073.8
15.3713.4 WC Slawyk et al. (1998)
17.174.1 WC Varela et al. (2003)
25.172.0 WC This study
38.772.5
31.271.9
ation method; WC: wet chemical method.
ARTICLE IN PRESS
M.M. Varela et al. / Deep-Sea Research I 52 (2005) 1637–16611656
close to the values reported for North Atlanticwaters (Slawyk and Raimbault, 1995), was higherthan most of the previously published values (Huand Smith, 1998, Slawyk et al., 1998). In turn,both mean PER
NHþ4 and PER
NO�3 measured in the
present study were lower than values reported inearlier studies (e.g. Bronk et al., 1994, Slawyk andRaimbault, 1995) although the values are close tothose given in the recent literature (Hu and Smith,1998; Slawyk et al., 1998; Varela et al., 2003). Toour knowledge, rDONUrea rates measured in thisstudy are the first reported in the literature, andreveal that in some oceanic regions (mainly in theSouthern Atlantic) the uptake of urea and itsrelease as DON constitutes a significant nitrogenflux in the euphotic layer. Despite the larger errorexpected in our rDONUrea estimations whencompared with rDON
NHþ4 or rDON
NO�3 , the
obtained values are in general similar to those ofrDON
NHþ4 , thus suggesting that there are no large
overstimations. These results, although prelimin-ary, challenge the present knowledge on DONrelease in the ocean, which generally considersrelease from NO3
� and NH4+ (see references in
Table 7), although there are also reports of DONrelease in diazotrophic organisms (Glibert andBronk, 1994).
Nitrate-derived DON dominated total rDON inthe upwelling and equatorial provinces. Forinstance, DON release as a result of NO3
� uptakeexceeded by a factor of 10 the rates of DONrelease from either NH4
+ or urea uptake in theupwelling CNRY region. These results contrastwith earlier reports in open waters whererDONNO�
3 was on average o20% of total rDONderived from both NO3
� and NH4+ (Slawyk and
Raimbault, 1995; Bronk and Ward, 1999). In ourcase, we suggest that high rDON
NO�3 values are
associated with correspondingly high rNO�3 ,
particularly in the CNRY and ETRA regions. Inturn, large PER values (450%) were also mea-sured for NO3
� incubations. Although the causesfor the relatively high PERNO�
3 are not clear, wehypothesize that the differential effect of irradi-ance and temperature on NO3
� versus NH4+ or
urea uptake and DON release may be responsible.High PER
NO�3 values were generally found at
subsurface depths receiving 450% of surface
irradiance (c.f. Fig. 7), suggesting a positive effectof irradiance on the PER
NO�3 rate. Similarly, Hu
and Smith (1998) found that rNO�3 and NO3
�-derived DON increased with irradiance in bothlaboratory and field experiments. On the otherhand, PER
NO�3 values of the deep-water samples
(7 and 1% of surface irradiance) could be over-estimated because of the incubation surface watertemperatures higher than those of the depth fromwhich the samples were collected (c.f. Fig. 2). Inthis way, Reay et al. (1999) showed that affinity forNO3
� was strongly dependent on temperaturewhile the affinity for NH4
+ remained relativelyconstant over the same temperature range. Ac-cording to such results, our PER
NO�3 values of the
deep-water samples could be artificially increasedby a factor of 1.8, taking into account thedifference of temperature between the bottomand the surface water. A second potential mechan-ism that could be responsible for the high NO3
�-derived DON at the base of the euphotic zone hasbeen proposed by Lomas and Glibert (1999). Theyhypothesize that diatom cells have the ability totake up NO3
� in excess of their nutritionalrequirements for use as a sink for high-energyelectrons when the cells are exposed to damagingligh levels. In our experiments, this exposure to ahigh light environment could have occurred as thewater sample was drawn from the Niskin botle tothe sampling botles, into a darkened incubator. Inthis way, diatoms, which showed the highestvalues in the upwelling and equatorial provinces(where high NO3
�-derived DON values werefound) have been shown to increase rates ofnitrogen release after a shift from a low growthirradiance to a much higher irradiance (Lomas andGlibert, 2000; Lomas et al., 2000). While moredetailed tests of the effect of irradiance andtemperature on nitrate uptake and DON releaseare not yet available, our results on rates derivedfrom incubations with nitrate can be taken aspreliminary. Nevertheless, large PER values(480%), particularly for nitrate, have been foundfor natural assemblages (Bronk and Ward, 2000;Bronk, 2002).
Latitudinal differences in productivity were alsoparalleled by differences in the residence time ofDON in the euphotic layer. Assuming that part of
ARTICLE IN PRESS
M.M. Varela et al. / Deep-Sea Research I 52 (2005) 1637–1661 1657
the recently released DON is labile or semilabile(e.g. Doval et al., 1999), and that DON concen-trations in the euphotic zone of the CentralAtlantic are in steady-state (Vidal et al., 1999),we can estimate the average residence time oflabile DON (DON/rDON) using the values forrDONtotal in Table 5. Residence times ranged fromo1 month in the oligotrophic gyres (NAST andSATL) to ca. 2 months in the upwelling region ofCNRY and the ETRA equatorial province, whilevalues for the temperate provinces NADR andBRAZ were only about 1 month. These values aregenerally lower than those reported for the NWIberian upwelling (Varela et al., 2003), which werecalculated by taking into account exclusively NHþ
4
uptake. Also, they are much lower than residencetimes estimated by Vidal et al. (1999) in theCentral Atlantic (between o0.1 and 19000y), butthe latter were calculated using net diffusion ofDON across the thermocline (which probablyincludes refractory DON) instead of in situ DONrelease. The low residence times of recentlyreleased DON in open-ocean waters suggests aclose coupling between total DON released andthe utilization of dissolved organic substrates bymicrobial heterotrophs (e.g. Ducklow, 2000),particularly in the oligotrophic gyres.
Bacterial growth rates reported for the euphoticzone of oligotrophic Atlantic waters were ca.0.1 d�1, implying a turnover time of bacterialcarbon stock of about 1 week (Zubkov et al., 2000,2001). However, there are reports of growth ratesexceeding 0.2 d�1 for oceanic waters of theAtlantic (Head et al., 1996; Zubkov et al., 1999,Bode et al., 2001). In addition, mean (7SE)bacterial growth rates for the AMT-11 cruise(Varela et al., submitted) were 0.2170.02 d�1
(n ¼ 24), equivalent to a turnover time of about5 days for bacterial carbon. Relatively rapidcycling of DOM in the euphotic zone of theCentral Atlantic is further supported by reportedestimates of nanoplankton grazing, which ac-counts for at least half of the bacterial production(Zubkov et al., 2000, 2001) and for most of theprimary production in the subtropical Atlantic(Quevedo and Anadon, 2001). Nevertheless, Teiraet al. (2003) reported an uncoupling betweenphytoplankton and bacterioplankton carbon pro-
duction for NAST waters that suggests theexistence of DOC inputs besides the excretion ofrecent photosynthetates.
4.3. N uptake, DON release, and phytoplankton
size– structure
Considering the entire dataset, we found agenerally weak relationship between nitrogenuptake or release rates and phytoplankton size–s-tructure. The results from some stations suggestedan increase of nitrogen uptake and DON releasewith the increase in the relative importance oflarge cells (42 mm) in terms of biomass andproduction, and the converse when small cellsdominated. These results agree with our previousfinding of a consistent pattern of DON releaseincrease with the dominance of large cells in theupwelling area off NW Iberia (Varela et al., 2003),a finding similar to that of Teira et al. (2001) forDOC release in the same ecosystem. However, thispattern was not extensible to all the sampledstations.
The inclusion of stations from oligotrophicocean provinces in the study of the relationshipsbetween production processes and the size–struc-ture of the phytoplankton community revealed animportant difference between oligotrophic andupwelling ecosystems. Oligotrophic ecosystems ofthe Central Atlantic have a characteristically lowercontribution of small cells to primary productionthan to biomass (Figs. 9 and 10). In contrast, therewas a close relationship between the contributionof small cells to both biomass and production for alarge range of ecosystems (Tremblay and Le-gendre, 1994). A recent study (Fernandez et al.,2003) examined the discrepancy between thefraction of carbon incorporated by small-sizedphytoplankton and the corresponding contribu-tion to total Chl-a concentration in oligotrophicstations of the Central Atlantic. This studyconcluded that the differential contribution ofsmall cells to biomass or production cannot beattributable to experimental artefacts associatedwith the incubation methods employed in thedetermination of primary production but rather toa high production efficiency (i.e. the ratio ofprimary production to chlorophyll biomass) of

ARTICLE IN PRESS
M.M. Varela et al. / Deep-Sea Research I 52 (2005) 1637–16611658
large phytoplankton (as diatoms). A differentialremoval of large cells by grazers was proposed asan alternative explanation of the relatively lowdominance of large cells in the total phytoplank-ton biomass of oligotrophic ecosystems (Tremblayand Legendre, 1994). However, grazing in theseecosystems seems to be dominated by protozoa(e.g. Quevedo and Anadon, 2001) while largegrazers (e.g. copepods) are of relatively minorimportance (Huskin et al., 2001). Furthermore, itis unlikely that a significant number of largegrazers were included in the incubation bottlesgenerally employed in the determinations ofprimary production (Fernandez et al., 2003).
The biogeochemical implications of a higherproduction efficiency for large phytoplanktonwere explored by Conan et al. (1999) in Mediter-ranean waters, where they found a negative powerfit between integrated bacterial production andphytoplankton production efficiency. Such arelationship implies that, in the regions character-ized by low phytoplankton production efficiencyvalues typical of oligotrophic ecosystems, a largefraction of primary production would be releasedas DOM to support a variable fraction of bacterialproduction. In these conditions, processes such ascell lysis (Agustı et al., 1998) or hydrolysis ofparticulate organic matter (Hoppe et al., 1993)would become more important than direct releaseof DOM through phytoplankton exudates (Søn-dergaard et al., 2000; Meon and Kirchman, 2001)or through sloppy-feeding (Nagata, 2000; Wardand Bronk, 2001).
Our finding of a weak relationship between PERof DON and phytoplankton-size in open ocean,low primary productivity waters is consistent withthe differential role of processes leading to DOMenrichment in oligotrophic versus upwelling eco-systems. Size-dependent physiological (e.g. exuda-tion) or trophic (e.g. grazing) processes woulddominate DON release in coastal, highly produc-tive waters, where most experimental studies weremade (Bronk et al., 1994; Bronk and Ward, 1999,2000; Hasegawa et al., 2000, 2001; Ward andBronk, 2001; Varela et al., 2003). Such a sizedependence would be reflected by the significantcorrelation between DON release and the con-tribution of small cells to biomass, as found in this
study, when all euphotic-depth integrated valuesare considered. Nevertheless, the uncouplingbetween biomass and production in oligotrophicprovinces was associated with a large variability inPER, which in turn would fuel a variable, butgenerally high, fraction of bacterial production(Conan et al., 1999). Teira et al. (2003) also founda large variability in PER of DOC in oligotrophicareas of the Central Atlantic, which was between10 and 42% of total, recently photosynthesisedcarbon.
The variability found in the magnitude of theallochtonous inputs of DOM (Vidal et al., 1999),the production of DOC and DON in the euphoticzone, and the weak relationship between theserates and phytoplankton size in oligotrophicprovinces of the Central Atlantic, calls for morestudies on the specific mechanisms of DOMenrichment in these waters. In addition, thedifferences found between NAST and SATL inthe vertical structure of the water column (i.e.depth of the thermocline and of the Chl-amaximum), nutrient sources (e.g. urea in SATL),abundance of phytoplankton (e.g. Synechococcus),and in nitrogen uptake and DON release (averagevalues of both rates in SATL almost double thosein the NAST), suggest the existence of largedifferences in the cycling of organic matter inthese provinces.
Acknowledgements
We are grateful to the crew of the R.R.S. James
Clark Ross for their help during the cruise.Satellite data were processed by P. Miller at thePlymouth Marine Laboratory (UK) Remote Sen-sing Group (www.npm.ac.uk/rsdas/). Irradiancedata were kindly provided by R. Varela. SeaWiFSdata are used by courtesy of the NASA SeaWiFSproject and Orbital Sciences Corporation. Weacknowledge the comments and suggestions ofthree anonymous referees. This research wassupported by funds of projects CIRCANA(MAR1999-1072-C02) of the Ministerio de Cien-cia y Tecnologia (MCYT, Spain) and AMT (UK).M.M. Varela was supported by a PFPI fellowshipof MCYT (Spain). This is contribution no. 83 of

ARTICLE IN PRESS
M.M. Varela et al. / Deep-Sea Research I 52 (2005) 1637–1661 1659
the AMT Project, supported by the PlymouthMarine Laboratory of the UK Natural Environ-ment Research Council.
References
Agustı, S., Satta, M.P., Mura, M.P., Benavent, E., 1998.
Dissolved esterase activity as a tracer of phytoplankton
lysis: evidence of high phytoplankton lysis rates in the
NW Mediterranean. Limnology and Oceanography 43,
1836–1849.
Aiken, J., Rees, N., Hooker, S., Holligan, P., Bale, A., Robins,
D., Moore, G., Harris, R., Pilgrim, D., 2000. The atlantic
meridional transect: overview and syntesis of data. Progress
in Oceanography 45, 1836–1849.
Antia, N.J., Harrison, P.J., Oliveira, L., 1991. The role of
dissolved organic nitrogen in phytoplankton nutrition, cell
biology and ecology. Phycologia 30, 1–89.
Azam, F., 1998. Microbial control of oceanic carbon flux: the
plot thickens. Science 280, 694–696.
Bode, A., Barquero, S., Varela, M., Braun, J.G., Armas, D.,
2001. Pelagic bacteria and phytoplankton in oceanic waters
near the Canary Islands in summer. Marine Ecology
Progress Series 209, 1–17.
Bronk, D.A., 2002. Dynamics of organic nitrogen. In: Hansell,
D.A., Carlson, C.A. (Eds.), Biogeochemistry of Marine
Dissolved Organic Matter. Academic Press, San Diego, pp.
153–247.
Bronk, D.A., Glibert, P.M., 1993. Contrasting patterns of
dissolved organic nitrogen release by two size fractions of
estuarine plankton during a period of rapid NH4+ con-
sumption and NO2� production. Marine Ecology Progress
Series 96, 291–299.
Bronk, D.A., Ward, B.B., 1999. Gross and net nitrogen uptake
and DON release in the euphotic zone of Monterey Bay,
California. Limnology and Oceanography 44, 573–585.
Bronk, D.A., Ward, B.B., 2000. Magnitude of dissolved organic
nitrogen release relative to gross nitrogen uptake in marine
systems. Limnology and Oceanography 45, 1879–1883.
Bronk, D.A., Glibert, P.M., Ward, B.B., 1994. Nitrogen
uptake, dissolved organic nitrogen release, and new
production. Science 265, 1843–1846.
Conan, P., Turley, C., Stutt, E., Pujo-Pay, M., Van Wambeke,
F., 1999. Relationship between phytoplankton efficiency
and the proportion of bacterial production to primary
production in the Mediterranean Sea. Aquatic Microbial
Ecology 17, 131–144.
Donald, K.M., Joint, I., Rees, A.P., Woodward, E.M.S.,
Savidge, G., 2001. Uptake of carbon, nitrogen and
phosphorus by phytoplankton along the 201W meridian in
the NE Atlantic between 57.51N and 371N. Deep-Sea
Research II 48, 873–897.
Doval, M.D., Perez, F.F., Berdalet, E., 1999. Dissolved and
particulate organic carbon and nitrogen in the North-
western Mediterranean. Deep-Sea Research I 46, 511–527.
Ducklow, H., 2000. Bacterial production and biomass in the
oceans. In: Kirchman, D.L. (Ed.), Microbial Ecology of the
Oceans. Wiley-Liss Inc., New York, pp. 85–119.
Dugdale, R.C., Goering, J.J., 1967. Uptake of new and
regenerated forms of nitrogen in primary productivity.
Limnology and Oceanography 12, 196–206.
Eppley, R.W., Koeve, W., 1990. Nitrate use by plankton in the
eastern subtropical North Atlantic, March–April 1989.
Limnology and Oceanography 35, 1781–1788.
Fernandez, E., Maranon, E., Moran, X-A., Serret, P., 2003.
Potential causes for the unequal contribution of picophyto-
plankton to total biomass and productivity in oligotrophic
waters. Marine Ecology Progress Series 254, 101–109.
Glibert, P.M., 1998. Interactions of top–down and bottom–up
control in planktonic nitrogen cycling. Hydrobiologia 363,
1–12.
Glibert, P.M., Bronk, D.A., 1994. Release of dissolved organic
nitrogen by the marine diazotrophic cyanobacterium
Trichodesmium spp. Applied Environmental Microbiology
60, 3996–4000.
Glibert, P.M., Lipschultz, F., McCarthy, J.J., Altabet, M.A.,
1982. Isotope dilution models of uptake and remineraliza-
tion of ammonium by marine plankton. Limnology and
Oceanography 27, 639–650.
Glibert, P.M., Dennett, M.R., Caron, D.A., 1988. Nitrogen
uptake and NH4 regeneration by pelagic microplankton and
marine snow from the North Atlantic. Journal of Marine
Research 46, 837–852.
Goeyens, L., Kindermans, N., Abu-Yusuf, M., Elskens, M.,
1998. A room temperature method for the manual
determination of urea in seawater. Estuarine Coastal Shelf
Science 47, 415–418.
Goldman, J.C., Dennet, M.R., 2001. Rapid nitrogen uptake
by marine bacteria. Limnology and Oceanography 46,
1195–1198.
Hasegawa, T., Koike, I., Mukai, H., 2000. Release of dissolved
organic nitrogen by size-fractionated natural planktonic
assemblages in coastal waters. Marine Ecology Progress
Series 198, 43–99.
Hasegawa, T., Koike, I., Mukai, H., 2001. Release of dissolved
organic nitrogen by a planktonic community in Akkeshi
Bay. Aquatic Microbial Ecology 24, 99–107.
Head, E.J.H., Harrison, W.G., Irwin, B.I., Horne, E.P.W., Li,
W.K.W., 1996. Plankton dynamics and carbon flux in an
area of upwelling off the coast of Morocco. Deep-Sea
Research I 43, 1713–1738.
Hooker, S.B., Rees, N.P., Aiken, J., 2000. An objective
methodology for identifying oceanic provinces. Progress in
Oceanography 45, 313–338.
Hoppe, H-G., Ducklow, H., Karrasch, B., 1993. Evidence for
dependency of bacterial growth on enzymatic hydrolisis of
particulate organic matter in the mesopelagic ocean. Marine
Ecology Progress Series 93, 277–283.
Hu, S., Smith Jr., W.O., 1998. The effects of irradiance on
nitrate uptake and dissolved organic nitrogen release by
phytoplankton in the Ross Sea. Continental Shelf Research
18, 971–990.
ARTICLE IN PRESS
M.M. Varela et al. / Deep-Sea Research I 52 (2005) 1637–16611660
Huskin, I., Anadon, R., Woodd-Walker, R.S., Harris, R.P.,
2001. Basin-scale latitudinal patterns of copepod grazing in
the Atlantic Ocean. Journal of Plankton Research 23,
1361–1371.
Jackson, G.A., Williams, P.M., 1985. Importance of dissolved
organic nitrogen and phosphorus to biological nutrient
cycling. Deep-Sea Research 32, 223–235.
Joint, I., Rees, A.P., Woodward, E.M.S., 2001. Primary
production and nutrient assimilation in the Iberian
upwelling in August 1998. Progress in Oceanography 51,
303–320.
Keil, R.G., Kirchman, D.L., 1999. Utilization of dissolved
proteins and aminoacids in the northern Sargasso Sea.
Aquatic Microbial Ecology 18, 293–300.
Le Bouteiller, A., 1986. Environmental control of nitrate and
ammonium uptake by phytoplankton in the Equatorial
Atlantic Ocean. Marine Ecology Progress Series 30,
167–179.
Legendre, L., Le Fevre, J., 1995. Microbial food webs and the
export of biogenic carbon in the oceans. Aquatic Microbial
Ecology 9, 69–77.
Lewis, M.R., Harrison, W.G., Oakey, N.S., Hebert, D., Platt,
T., 1986. Vertical nitrate fluxes in the oligotrophic ocean.
Science 234, 870–873.
Lomas, M.W., Glibert, P.M., 1999. Temperature regulation of
nitrate uptake: a novel hypothesis about nitrate and
reduction in cool-water diatoms. Limnology and Oceano-
graphy 44, 556–572.
Lomas, M.W., Glibert, P.M., 2000. Comparisons of nitrate
uptake, storage, and reduction in marine diatoms and
flagellates. Journal Phycology 36, 903–913.
Lomas, M.W., Rumbley, C.J., Glibert, P.M., 2000. Ammonium
release by nitrogen sufficient diatoms in response to rapid
increases in irradiance. Journal of Plankton Research 22,
2351–2366.
Longhurst, A., 1998. Ecological Geography of the Sea.
Academic Press, New York.
Maranon, E., Holligan, P.M., Varela, M., Mourino, B., Bale,
B.M., 2000. Basin-scale variability of phytoplankton
biomass, production and growth in the Atlantic Ocean.
Deep-Sea Research I 47, 825–857.
McCarthy, J.J., 1972. The uptake of urea by natural popula-
tions of marine phytoplankton. Limnology and Oceano-
graphy 17, 738–748.
McCarthy, J.J., Nevins, J.L., 1986. Sources of nitrogen for
primary production in warm-core rings 79-E and 81-D.
Limnology and Oceanography 31, 690–700.
Meon, B., Kirchman, D.L., 2001. Dynamics and molecular
composition of dissolved organic material during phyto-
plankton blooms. Marine Chemistry 75, 185–199.
Metzler, P.M., Glibert, P.M., Gaeta, S.A., Ludlam, J.M., 1997.
New and regenerated production in the South Atlantic off
Brazil. Deep-Sea Research I 44, 363–384.
Mino, Y., Saino, T., Suzuki, K., Maranon, E., 2002. Isotopic
composition of suspended particulate nitrogen (d15Nsus) in
surface waters of the Atlantic Ocean from 501N to 501S.
Global Biogeochemistry Cycles 16.
Moran, X.A.G., Gasol, J.M., Arın, L., Estrada, M., 1999. A
comparison between glass fibre and membrane filters for the
estimation of phytoplankton POC and DOC production.
Marine Ecology Progress Series 187, 31–41.
Nagata, T., 1986. Carbon and nitrogen content of natural
planktonic bacteria. Applied Environmental Microbiology
52, 28–32.
Nagata, T., 2000. Production mechanisms of dissolved organic
matter. In: Kirchman, D.L. (Ed.), Microbial Ecology of the
Oceans. Wiley-Liss Inc., New York, pp. 121–152.
Norland, S., Heldal, M., Tumyr, O., 1987. On the relation
between dry matter and volume of bacteria. Microbial
Ecology 13, 95–103.
Planas, D., Agusti, S., Duarte, C.M., Granata, T.C., Merino,
M., 1999. Nitrate uptake and diffusive nitrate supply in the
Central Atlantic. Limnology and Oceanography 44,
116–126.
Quevedo, M., Anadon, R., 2001. Protist control of phyto-
plankton growth in the subtropical north-east Atlantic.
Marine Ecology Progress Series 221, 29–38.
Raimbault, P., Slawyk, P., Garcia, N., 2000. Comparison
between chemical and isotopic measurements of biological
nitrate utilization: further evidence of low new production
levels in the equatorial Pacific. Marine Biology 136,
1147–1155.
Reay, D.S., Nedwell, D.B., Priddle, J., Ellis-Evans, J.C., 1999.
Temperature dependence of inorganic nitrogen uptake:
reduced affinity for nitrate at suboptimal temperatures in
both algae and bacteria. Applied and Environmental
Microbiology 65, 2577–2584.
Redfield, A.C., Ketchum, B.H., Richards, F.A., 1963. The
influence of organisms on the composition of sea-water. In:
Hill, M.N. (Ed.), The Sea, vol. 2. Wiley Interscience, New
York.
Rees, A., Woodward, E.M.S., Joint, I., 1999. Measure-
ments of nitrate and ammonium uptake at ambient
concentrations in oligotrophic waters of the North-East
Atlantic Ocean. Marine Ecology Progress Series 187,
295–300.
Riegman, R., Noordelos, A.A.M., 1998. Size-fractionated
uptake of nitrogenous nutrients and carbon by phytoplank-
ton in the North Sea during summer 1994. Marine Ecology
Progress Series 173, 85–94.
Slawyk, G., Raimbault, P., 1995. Simple procedure for
simultaneous recovery of dissolved inorganic and organic
nitrogen in 15N tracer experiments and improving the
isotopic mass balance. Marine Ecology Progress Series 124,
289–299.
Slawyk, G., Raimbault, P., Garcia, N., 1998. Measuring gross
uptake of 15N-labeled nitrogen by marine phytoplankton
without particulate matter collection: evidence of low 15N
losses to the dissolved organic nitrogen pool. Limnology
and Oceanography 43, 1734–1739.
Slawyk, G., Raimbault, P., Garcia, N., 2000. Use of15N to measure dissolved organic nitrogen release by
marine phytoplankton. Limnology and Oceanography 45,
1884–1886.
ARTICLE IN PRESS
M.M. Varela et al. / Deep-Sea Research I 52 (2005) 1637–1661 1661
Sokal, R.R., Rohlf, F.J., 1981. Biometry. W.H. Freeman and
Co., New York.
Søndergaard, M., Williams, P.J., Le, B., Cauwet, G., Riemann,
B., Robinson, C., Terzic, S., Woodward, E.M.S., Worm, J.,
2000. Net accumulation and flux of dissolved organic
carbon and dissolved organic nitrogen in marine plankton
communities. Limnology and Ocenography 45, 1097–1111.
Teira, E., Pazo, M.J., Serret, P., Fernandez, E., 2001. Dissolved
organic carbon production by microbial populations in the
Atlantic Ocean. Limnology and Oceanography 46,
1370–1377.
Teira, E., Pazo, M.J., Quevedo, M., Fuentes, M.V., Niell, F.X.,
Fernandez, E., 2003. Rates of dissolved organic carbon
production and bacterial activity in the eastern North
Atlantic Subtropical Gyre during summer. Marine Ecology
Progress Series 249, 53–67.
Tremblay, J-E., Legendre, L., 1994. A model for the size-
fractionated biomass and production of marine phytoplank-
ton. Limnology and Oceanography 39, 2004–2014.
Tremblay, J.-E., Legendre, L., Klein, B., Therriault, J.-C., 2000.
Size-differential uptake of nitrogen and carbon in a
marginal sea (Gulf of St. Lawrence, Canada): significance
of diel periodicity and urea uptake. Deep-Sea Research II
47, 489–518.
Tupas, L., Koike, I., 1991. Simultaneous uptake and regenera-
tion of ammonium by mixed assemblages of heterotrophic
marine bacteria. Marine Ecology Progress Series 70,
273–282.
Varela, D.E., Harrison, P.J., 1999. Seasonal variability in
nitrogenous nutrition of phytoplankton assemblages in the
northeastern subarctic Pacific Ocean. Deep-Sea Research II
46, 2505–2538.
Varela, M.M., Barquero, S., Bode, A., Fernandez, E.,
Gonzalez, N., Teira, E., Varela, M., 2003. Microplanktonic
regeneration of ammonium and dissolved organic nitrogen
in the upwelling area of the Galician shelf (NW Spain):
relationships with phytoplankton size-structure and produc-
tion. Journal of Plankton Research 25, 719–736.
Varela, M.M., Bode, A., Moran, X.A.G., Valencia, J.
Dissolved organic nitrogen (DON) release and bacterial
activity in the upper layers of the Atlantic Ocean. Microbial
Ecology, submitted for publication.
Venables, W.N., Ripley, B.D., 1997. Modern and Applied
Statistics with S-PLUS. Springer, New York.
Vidal, M., Agustı, S., Duarte, C.M., 1999. Dissolved organic
nitrogen and phosphorus pools and fluxes in the central
Atlantic Ocean. Limnology and Oceanography 44, 106–115.
Ward, B.B., Bronk, D.A., 2001. Net nitrogen uptake and DON
release in surface waters: importance of trophic interactions
implied from size fractionation experiments. Marine Ecol-
ogy Progress Series 219, 11–24.
Woodward, E.M.S., Rees, A.P., 2001. Nutrient distributions in
an anticyclonic eddy in the northeast Atlantic Ocean, with
reference to nanomolar ammonium concentrations. Deep-
Sea Research II 48, 775–793.
Zubkov, M.V., Sleigh, M.A., Tarran, G.A., Burkill, P.H.,
Leakey, R.J.G., 1998. Picoplanktonic community structure
on an Atlantic transect from 501N to 501S. Deep-Sea
Research I 45, 1339–1355.
Zubkov, M.V., Fuchs, B.M., Eilers, H., Burkill, P.H., Amann,
R., 1999. Determination of total protein content of bacterial
cells by SYPRO staining and flow cytometry. Applied and
Environmental Microbiology 65, 3251–3257.
Zubkov, M.V., Sleigh, M.A., Burkill, P.H., Leakey, R.J.G.,
2000. Bacterial growth and grazing loss in contrasting areas
of North and South Atlantic waters. Journal of Plankton
Research 22, 685–711.
Zubkov, M.V., Sleigh, M.A., Burkill, P.H., 2001. Heterotrophic
bacterial turnover along the 201W meridian between 591N
and 371N in July 1996. Deep-Sea Research II 48, 987–1001.
Copyright © 2022 FDOKUMEN