Differences in Metabolism between the Biofilm and Planktonic Response to Metal Stress
10
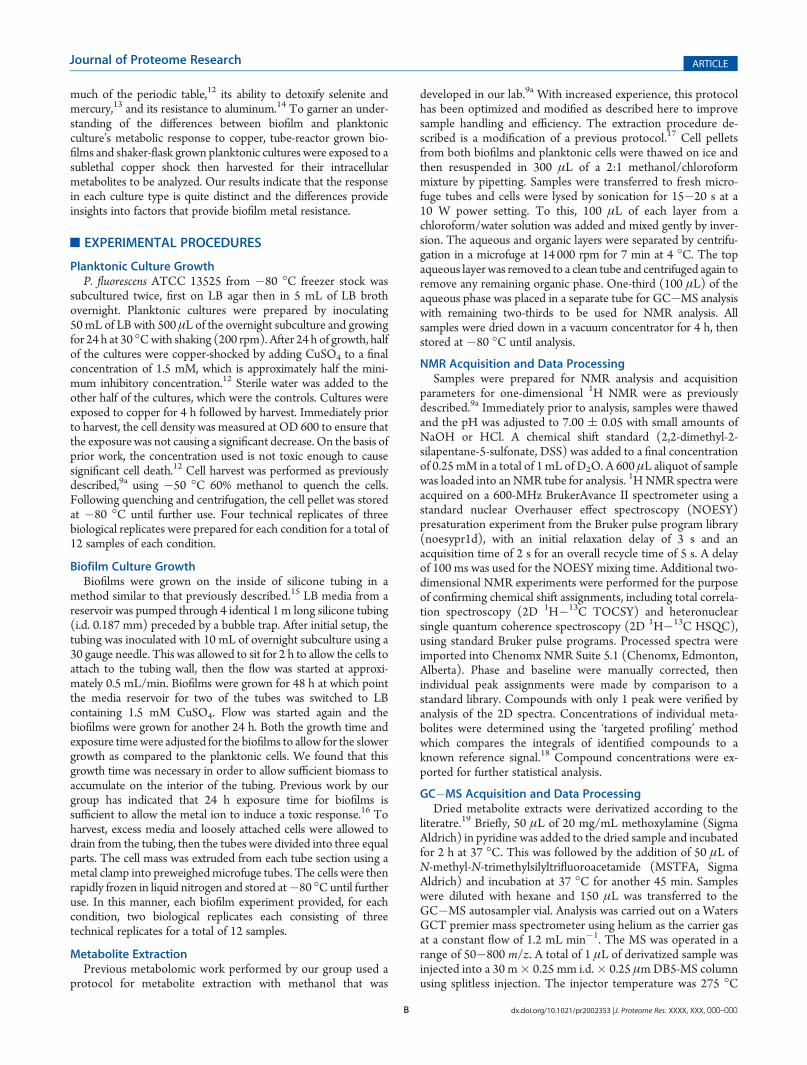
rXXXX American Chemical Society A dx.doi.org/10.1021/pr2002353 | J. Proteome Res. XXXX, XXX, 000–000 ARTICLE pubs.acs.org/jpr Differences in Metabolism between the Biofilm and Planktonic Response to Metal Stress Sean C. Booth, † Matthew L. Workentine, ‡,þ Jing Wen, § Rustem Shaykhutdinov, § Hans J. Vogel, †,§ Howard Ceri, ‡ Raymond J. Turner, †,‡ and Aalim M. Weljie* ,†,§ † Department of Biological Sciences, ‡ Biofilm Research Group, and the § Metabolomics Centre, University of Calgary, Calgary, AB, Canada T2N 1N4 ’ INTRODUCTION Even after years of study, bacterial biofilms remain a frontier of microbiology as they exhibit many industrial, environmental and medically important properties not displayed by their planktonic counterparts which have yet to be fully explained. 1 One such property is the increased tolerance and resistance of biofilms to concentrations of toxic metals compared to planktonic cultures. 2 This has been attributed to several factors inherent to the biofilm lifestyle including quorum-sensing mediated gene regulation, metal chelation by the extracellular polymeric substance (EPS), and increased persister cell formation. 2 Another important factor is the presence of phenotypic and metabolic heterogeneity within the biofilm environment. 3 This heterogeneity is considered to be caused by gradients of pH, oxygen, and nutrients in the biofilm matrix not present in planktonic cultures. 3 Given that these factors all have an impact on cellular metabolism, it can be expected that metabolism occurring in biofilms would be differ- ent than in planktonic cultures, and hence, it may also be a factor in their differential tolerance/resistance to metal ions. Metabolism represents one of the most dynamic aspects of cellular physiology and by studying it directly one can obtain a unique snapshot of underlying physiological processes. 4 Meta- bolomics has grown in recent years as a powerful tool both for complementing other ‘omic’ studies and for investigating the immense metabolic diversity found in prokaryotes. 5 It has been used to study the effects of antibiotics in Mycobacterium tuberculosis, 6 to compare ethanol and iron-limitation stress in Staphylococcus aureus, 7 and to identify metabolic differences between biofilms and planktonic cultures of Pseudomonas aeruginosa. 8 Additionally, previous studies by our group have revealed significant metabolic differences between different Pseudomonas fluorescens mutant strains and between Pseudomonas pseudoalcaligenes KF707 strains exposed to tellurite using a proton nuclear magnetic resonance ( 1 H NMR) based technique on planktonic cultures. 9 Although 1 H NMR is commonly used for metabolomic analyses, 10 it is still hampered by insensitivity and difficulty in identi fication of low concentration metabolites. Gas chromatography mass spectrometry (GCMS), also frequently used for meta- bolomics, is highly sensitive with semi-automated metabolite identification capabilities, though it is somewhat less quantitative. Here, we present their combined use as an improved adaptation over prior microbial metabolomics studies. 9 P. fluorescens is an excellent model organism for this study due to its varied metabolic capabilities 11 and its well-studied interactions with toxic metals. A brief sampling of these studies includes a systematic exposure to Received: March 14, 2011 ABSTRACT: Bacterial biofilms are known to withstand the effects of toxic metals better than planktonic cultures of the same species. This phenomenon has been attributed to many features of the sessile lifestyle not present in free-swimming populations, but the contribution of intracellular metabolism has not been previously examined. Here, we use a combined GCMS and 1 H NMR metabolomic approach to quantify whole-cell metabolism in biofilm and planktonic cultures of the multimetal resistant bacterium Pseudomonas fluorescens exposed to copper ions. Metabolic changes in response to metal exposure were found to be significantly different in biofilms compared to planktonic cultures. Planktonic metabolism indicated an oxida- tive stress response that was characterized by changes to the TCA cycle, glycolysis, pyruvate and nicotinate and niacotinamide metabolism. Similar metabolic changes were not observed in biofilms, which were instead dominated by shifts in exopolysaccharide related metabolism suggesting that metal stress in biofilms induces a protective response rather than the reactive changes observed for the planktonic cells. From these results, we conclude that differential metabolic shifts play a role in biofilm-specific multimetal resistance and tolerance. An altered metabolic response to metal toxicity represents a novel addition to a growing list of biofilm-specific mechanisms to resist environmental stress. KEYWORDS: biofilm, Pseudomonas fluorescens, copper resistance, metabolomics, metabolism, metal resistance, biofilm physiology, environmental toxicology, toxicometabolomics
-
Upload
independent -
Category
Documents
-
view
0 -
download
0
Transcript of Differences in Metabolism between the Biofilm and Planktonic Response to Metal Stress
rXXXX American Chemical Society A dx.doi.org/10.1021/pr2002353 | J. Proteome Res. XXXX, XXX, 000–000
ARTICLE
pubs.acs.org/jpr
Differences in Metabolism between the Biofilm and PlanktonicResponse to Metal StressSean C. Booth,† Matthew L. Workentine,‡,þ Jing Wen,§ Rustem Shaykhutdinov,§ Hans J. Vogel,†,§
Howard Ceri,‡ Raymond J. Turner,†,‡ and Aalim M. Weljie*,†,§
†Department of Biological Sciences, ‡Biofilm Research Group, and the §Metabolomics Centre, University of Calgary, Calgary, AB,Canada T2N 1N4
’ INTRODUCTION
Even after years of study, bacterial biofilms remain a frontier ofmicrobiology as they exhibit many industrial, environmental andmedically important properties not displayed by their planktoniccounterparts which have yet to be fully explained.1 One suchproperty is the increased tolerance and resistance of biofilms toconcentrations of toxic metals compared to planktonic cultures.2
This has been attributed to several factors inherent to the biofilmlifestyle including quorum-sensing mediated gene regulation,metal chelation by the extracellular polymeric substance (EPS),and increased persister cell formation.2 Another important factoris the presence of phenotypic andmetabolic heterogeneity withinthe biofilm environment.3 This heterogeneity is considered to becaused by gradients of pH, oxygen, and nutrients in the biofilmmatrix not present in planktonic cultures.3 Given that thesefactors all have an impact on cellular metabolism, it can beexpected that metabolism occurring in biofilms would be differ-ent than in planktonic cultures, and hence, it may also be a factorin their differential tolerance/resistance to metal ions.
Metabolism represents one of the most dynamic aspects ofcellular physiology and by studying it directly one can obtain aunique snapshot of underlying physiological processes.4 Meta-bolomics has grown in recent years as a powerful tool both forcomplementing other ‘omic’ studies and for investigating the
immense metabolic diversity found in prokaryotes.5 It has beenused to study the effects of antibiotics inMycobacterium tuberculosis,6
to compare ethanol and iron-limitation stress in Staphylococcusaureus,7 and to identify metabolic differences between biofilmsand planktonic cultures of Pseudomonas aeruginosa.8 Additionally,previous studies by our group have revealed significant metabolicdifferences between different Pseudomonas fluorescensmutant strainsand between Pseudomonas pseudoalcaligenes KF707 strains exposedto tellurite using a proton nuclear magnetic resonance (1H NMR)based technique on planktonic cultures.9
Although 1H NMR is commonly used for metabolomicanalyses,10 it is still hampered by insensitivity and difficulty inidentification of low concentrationmetabolites. Gas chromatography�mass spectrometry (GC�MS), also frequently used for meta-bolomics, is highly sensitive with semi-automated metaboliteidentification capabilities, though it is somewhat less quantitative.Here, we present their combined use as an improved adaptationover prior microbial metabolomics studies.9 P. fluorescens is anexcellent model organism for this study due to its varied metaboliccapabilities11 and its well-studied interactions with toxic metals.A brief sampling of these studies includes a systematic exposure to
Received: March 14, 2011
ABSTRACT: Bacterial biofilms are known to withstand theeffects of toxic metals better than planktonic cultures of thesame species. This phenomenon has been attributed to manyfeatures of the sessile lifestyle not present in free-swimmingpopulations, but the contribution of intracellular metabolismhas not been previously examined. Here, we use a combinedGC�MS and 1H NMR metabolomic approach to quantifywhole-cell metabolism in biofilm and planktonic cultures of themultimetal resistant bacterium Pseudomonas fluorescens exposedto copper ions. Metabolic changes in response to metal exposurewere found to be significantly different in biofilms compared toplanktonic cultures. Planktonic metabolism indicated an oxida-tive stress response that was characterized by changes to theTCA cycle, glycolysis, pyruvate and nicotinate and niacotinamide metabolism. Similar metabolic changes were not observed inbiofilms, which were instead dominated by shifts in exopolysaccharide related metabolism suggesting that metal stress in biofilmsinduces a protective response rather than the reactive changes observed for the planktonic cells. From these results, we conclude thatdifferential metabolic shifts play a role in biofilm-specificmultimetal resistance and tolerance. An alteredmetabolic response tometaltoxicity represents a novel addition to a growing list of biofilm-specific mechanisms to resist environmental stress.
KEYWORDS: biofilm, Pseudomonas fluorescens, copper resistance, metabolomics, metabolism, metal resistance, biofilm physiology,environmental toxicology, toxicometabolomics
B dx.doi.org/10.1021/pr2002353 |J. Proteome Res. XXXX, XXX, 000–000
Journal of Proteome Research ARTICLE
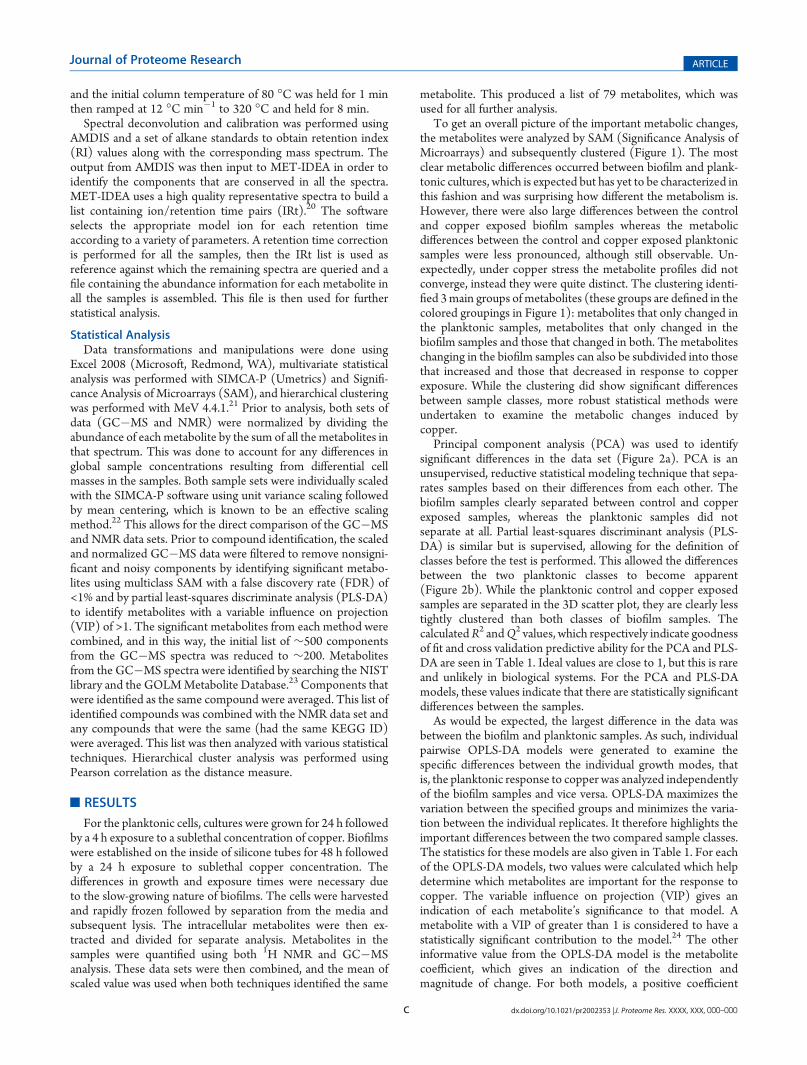
much of the periodic table,12 its ability to detoxify selenite andmercury,13 and its resistance to aluminum.14 To garner an under-standing of the differences between biofilm and planktonicculture’s metabolic response to copper, tube-reactor grown bio-films and shaker-flask grown planktonic cultures were exposed to asublethal copper shock then harvested for their intracellularmetabolites to be analyzed. Our results indicate that the responsein each culture type is quite distinct and the differences provideinsights into factors that provide biofilm metal resistance.
’EXPERIMENTAL PROCEDURES
Planktonic Culture GrowthP. fluorescens ATCC 13525 from �80 �C freezer stock was
subcultured twice, first on LB agar then in 5 mL of LB brothovernight. Planktonic cultures were prepared by inoculating50mL of LB with 500 μL of the overnight subculture and growingfor 24 h at 30 �Cwith shaking (200 rpm). After 24 h of growth, halfof the cultures were copper-shocked by adding CuSO4 to a finalconcentration of 1.5 mM, which is approximately half the mini-mum inhibitory concentration.12 Sterile water was added to theother half of the cultures, which were the controls. Cultures wereexposed to copper for 4 h followed by harvest. Immediately priorto harvest, the cell density was measured at OD 600 to ensure thatthe exposure was not causing a significant decrease. On the basis ofprior work, the concentration used is not toxic enough to causesignificant cell death.12 Cell harvest was performed as previouslydescribed,9a using �50 �C 60% methanol to quench the cells.Following quenching and centrifugation, the cell pellet was storedat �80 �C until further use. Four technical replicates of threebiological replicates were prepared for each condition for a total of12 samples of each condition.
Biofilm Culture GrowthBiofilms were grown on the inside of silicone tubing in a
method similar to that previously described.15 LB media from areservoir was pumped through 4 identical 1 m long silicone tubing(i.d. 0.187 mm) preceded by a bubble trap. After initial setup, thetubing was inoculated with 10 mL of overnight subculture using a30 gauge needle. This was allowed to sit for 2 h to allow the cells toattach to the tubing wall, then the flow was started at approxi-mately 0.5 mL/min. Biofilms were grown for 48 h at which pointthe media reservoir for two of the tubes was switched to LBcontaining 1.5 mM CuSO4. Flow was started again and thebiofilms were grown for another 24 h. Both the growth time andexposure timewere adjusted for the biofilms to allow for the slowergrowth as compared to the planktonic cells. We found that thisgrowth time was necessary in order to allow sufficient biomass toaccumulate on the interior of the tubing. Previous work by ourgroup has indicated that 24 h exposure time for biofilms issufficient to allow the metal ion to induce a toxic response.16 Toharvest, excess media and loosely attached cells were allowed todrain from the tubing, then the tubes were divided into three equalparts. The cell mass was extruded from each tube section using ametal clamp into preweighedmicrofuge tubes. The cells were thenrapidly frozen in liquid nitrogen and stored at�80 �Cuntil furtheruse. In this manner, each biofilm experiment provided, for eachcondition, two biological replicates each consisting of threetechnical replicates for a total of 12 samples.
Metabolite ExtractionPrevious metabolomic work performed by our group used a
protocol for metabolite extraction with methanol that was
developed in our lab.9a With increased experience, this protocolhas been optimized and modified as described here to improvesample handling and efficiency. The extraction procedure de-scribed is a modification of a previous protocol.17 Cell pelletsfrom both biofilms and planktonic cells were thawed on ice andthen resuspended in 300 μL of a 2:1 methanol/chloroformmixture by pipetting. Samples were transferred to fresh micro-fuge tubes and cells were lysed by sonication for 15�20 s at a10 W power setting. To this, 100 μL of each layer from achloroform/water solution was added and mixed gently by inver-sion. The aqueous and organic layers were separated by centrifu-gation in a microfuge at 14 000 rpm for 7 min at 4 �C. The topaqueous layer was removed to a clean tube and centrifuged again toremove any remaining organic phase. One-third (100 μL) of theaqueous phase was placed in a separate tube for GC�MS analysiswith remaining two-thirds to be used for NMR analysis. Allsamples were dried down in a vacuum concentrator for 4 h, thenstored at �80 �C until analysis.
NMR Acquisition and Data ProcessingSamples were prepared for NMR analysis and acquisition
parameters for one-dimensional 1H NMR were as previouslydescribed.9a Immediately prior to analysis, samples were thawedand the pH was adjusted to 7.00 ( 0.05 with small amounts ofNaOH or HCl. A chemical shift standard (2,2-dimethyl-2-silapentane-5-sulfonate, DSS) was added to a final concentrationof 0.25 mM in a total of 1 mL of D2O. A 600 μL aliquot of samplewas loaded into an NMR tube for analysis. 1HNMR spectra wereacquired on a 600-MHz BrukerAvance II spectrometer using astandard nuclear Overhauser effect spectroscopy (NOESY)presaturation experiment from the Bruker pulse program library(noesypr1d), with an initial relaxation delay of 3 s and anacquisition time of 2 s for an overall recycle time of 5 s. A delayof 100 ms was used for the NOESY mixing time. Additional two-dimensional NMR experiments were performed for the purposeof confirming chemical shift assignments, including total correla-tion spectroscopy (2D 1H�13C TOCSY) and heteronuclearsingle quantum coherence spectroscopy (2D 1H�13C HSQC),using standard Bruker pulse programs. Processed spectra wereimported into Chenomx NMR Suite 5.1 (Chenomx, Edmonton,Alberta). Phase and baseline were manually corrected, thenindividual peak assignments were made by comparison to astandard library. Compounds with only 1 peak were verified byanalysis of the 2D spectra. Concentrations of individual meta-bolites were determined using the ‘targeted profiling’ methodwhich compares the integrals of identified compounds to aknown reference signal.18 Compound concentrations were ex-ported for further statistical analysis.
GC�MS Acquisition and Data ProcessingDried metabolite extracts were derivatized according to the
literatre.19 Briefly, 50 μL of 20 mg/mL methoxylamine (SigmaAldrich) in pyridine was added to the dried sample and incubatedfor 2 h at 37 �C. This was followed by the addition of 50 μL ofN-methyl-N-trimethylsilyltrifluoroacetamide (MSTFA, SigmaAldrich) and incubation at 37 �C for another 45 min. Sampleswere diluted with hexane and 150 μL was transferred to theGC�MS autosampler vial. Analysis was carried out on a WatersGCT premier mass spectrometer using helium as the carrier gasat a constant flow of 1.2 mL min�1. The MS was operated in arange of 50�800 m/z. A total of 1 μL of derivatized sample wasinjected into a 30 m� 0.25 mm i.d.� 0.25 μmDB5-MS columnusing splitless injection. The injector temperature was 275 �C
C dx.doi.org/10.1021/pr2002353 |J. Proteome Res. XXXX, XXX, 000–000
Journal of Proteome Research ARTICLE
and the initial column temperature of 80 �C was held for 1 minthen ramped at 12 �C min�1 to 320 �C and held for 8 min.
Spectral deconvolution and calibration was performed usingAMDIS and a set of alkane standards to obtain retention index(RI) values along with the corresponding mass spectrum. Theoutput from AMDIS was then input to MET-IDEA in order toidentify the components that are conserved in all the spectra.MET-IDEA uses a high quality representative spectra to build alist containing ion/retention time pairs (IRt).20 The softwareselects the appropriate model ion for each retention timeaccording to a variety of parameters. A retention time correctionis performed for all the samples, then the IRt list is used asreference against which the remaining spectra are queried and afile containing the abundance information for each metabolite inall the samples is assembled. This file is then used for furtherstatistical analysis.
Statistical AnalysisData transformations and manipulations were done using
Excel 2008 (Microsoft, Redmond, WA), multivariate statisticalanalysis was performed with SIMCA-P (Umetrics) and Signifi-cance Analysis of Microarrays (SAM), and hierarchical clusteringwas performed with MeV 4.4.1.21 Prior to analysis, both sets ofdata (GC�MS and NMR) were normalized by dividing theabundance of each metabolite by the sum of all the metabolites inthat spectrum. This was done to account for any differences inglobal sample concentrations resulting from differential cellmasses in the samples. Both sample sets were individually scaledwith the SIMCA-P software using unit variance scaling followedby mean centering, which is known to be an effective scalingmethod.22 This allows for the direct comparison of the GC�MSand NMR data sets. Prior to compound identification, the scaledand normalized GC�MS data were filtered to remove nonsigni-ficant and noisy components by identifying significant metabo-lites using multiclass SAM with a false discovery rate (FDR) of<1% and by partial least-squares discriminate analysis (PLS-DA)to identify metabolites with a variable influence on projection(VIP) of >1. The significant metabolites from each method werecombined, and in this way, the initial list of ∼500 componentsfrom the GC�MS spectra was reduced to ∼200. Metabolitesfrom the GC�MS spectra were identified by searching the NISTlibrary and the GOLMMetabolite Database.23 Components thatwere identified as the same compound were averaged. This list ofidentified compounds was combined with the NMR data set andany compounds that were the same (had the same KEGG ID)were averaged. This list was then analyzed with various statisticaltechniques. Hierarchical cluster analysis was performed usingPearson correlation as the distance measure.
’RESULTS
For the planktonic cells, cultures were grown for 24 h followedby a 4 h exposure to a sublethal concentration of copper. Biofilmswere established on the inside of silicone tubes for 48 h followedby a 24 h exposure to sublethal copper concentration. Thedifferences in growth and exposure times were necessary dueto the slow-growing nature of biofilms. The cells were harvestedand rapidly frozen followed by separation from the media andsubsequent lysis. The intracellular metabolites were then ex-tracted and divided for separate analysis. Metabolites in thesamples were quantified using both 1H NMR and GC�MSanalysis. These data sets were then combined, and the mean ofscaled value was used when both techniques identified the same
metabolite. This produced a list of 79 metabolites, which wasused for all further analysis.
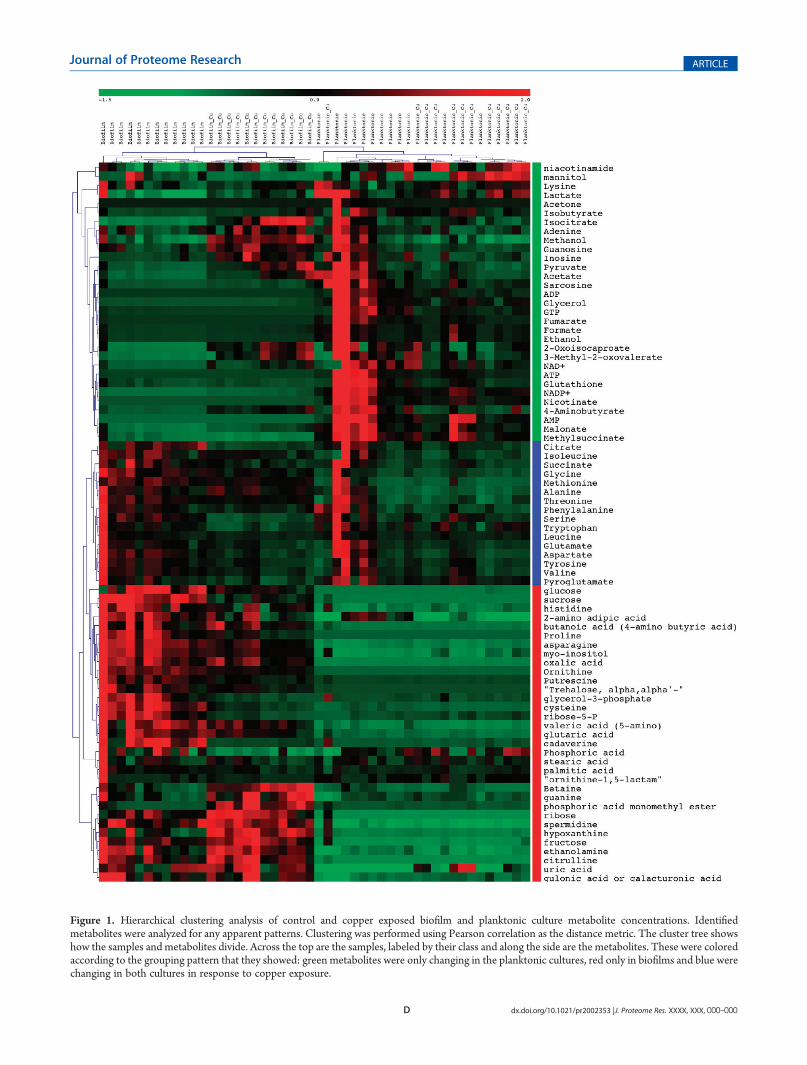
To get an overall picture of the important metabolic changes,the metabolites were analyzed by SAM (Significance Analysis ofMicroarrays) and subsequently clustered (Figure 1). The mostclear metabolic differences occurred between biofilm and plank-tonic cultures, which is expected but has yet to be characterized inthis fashion and was surprising how different the metabolism is.However, there were also large differences between the controland copper exposed biofilm samples whereas the metabolicdifferences between the control and copper exposed planktonicsamples were less pronounced, although still observable. Un-expectedly, under copper stress the metabolite profiles did notconverge, instead they were quite distinct. The clustering identi-fied 3main groups of metabolites (these groups are defined in thecolored groupings in Figure 1): metabolites that only changed inthe planktonic samples, metabolites that only changed in thebiofilm samples and those that changed in both. The metaboliteschanging in the biofilm samples can also be subdivided into thosethat increased and those that decreased in response to copperexposure. While the clustering did show significant differencesbetween sample classes, more robust statistical methods wereundertaken to examine the metabolic changes induced bycopper.
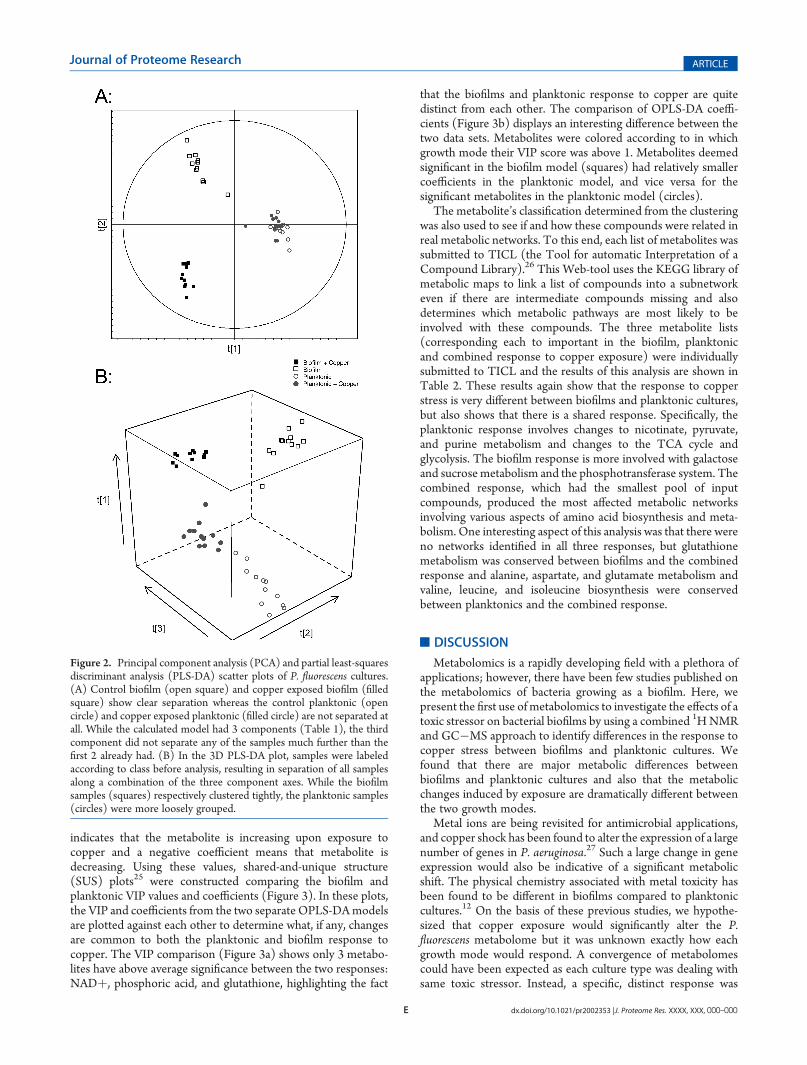
Principal component analysis (PCA) was used to identifysignificant differences in the data set (Figure 2a). PCA is anunsupervised, reductive statistical modeling technique that sepa-rates samples based on their differences from each other. Thebiofilm samples clearly separated between control and copperexposed samples, whereas the planktonic samples did notseparate at all. Partial least-squares discriminant analysis (PLS-DA) is similar but is supervised, allowing for the definition ofclasses before the test is performed. This allowed the differencesbetween the two planktonic classes to become apparent(Figure 2b). While the planktonic control and copper exposedsamples are separated in the 3D scatter plot, they are clearly lesstightly clustered than both classes of biofilm samples. ThecalculatedR2 andQ2 values, which respectively indicate goodnessof fit and cross validation predictive ability for the PCA and PLS-DA are seen in Table 1. Ideal values are close to 1, but this is rareand unlikely in biological systems. For the PCA and PLS-DAmodels, these values indicate that there are statistically significantdifferences between the samples.
As would be expected, the largest difference in the data wasbetween the biofilm and planktonic samples. As such, individualpairwise OPLS-DA models were generated to examine thespecific differences between the individual growth modes, thatis, the planktonic response to copper was analyzed independentlyof the biofilm samples and vice versa. OPLS-DA maximizes thevariation between the specified groups and minimizes the varia-tion between the individual replicates. It therefore highlights theimportant differences between the two compared sample classes.The statistics for these models are also given in Table 1. For eachof the OPLS-DA models, two values were calculated which helpdetermine which metabolites are important for the response tocopper. The variable influence on projection (VIP) gives anindication of each metabolite’s significance to that model. Ametabolite with a VIP of greater than 1 is considered to have astatistically significant contribution to the model.24 The otherinformative value from the OPLS-DA model is the metabolitecoefficient, which gives an indication of the direction andmagnitude of change. For both models, a positive coefficient
D dx.doi.org/10.1021/pr2002353 |J. Proteome Res. XXXX, XXX, 000–000
Journal of Proteome Research ARTICLE
Figure 1. Hierarchical clustering analysis of control and copper exposed biofilm and planktonic culture metabolite concentrations. Identifiedmetabolites were analyzed for any apparent patterns. Clustering was performed using Pearson correlation as the distance metric. The cluster tree showshow the samples and metabolites divide. Across the top are the samples, labeled by their class and along the side are the metabolites. These were coloredaccording to the grouping pattern that they showed: green metabolites were only changing in the planktonic cultures, red only in biofilms and blue werechanging in both cultures in response to copper exposure.
E dx.doi.org/10.1021/pr2002353 |J. Proteome Res. XXXX, XXX, 000–000
Journal of Proteome Research ARTICLE
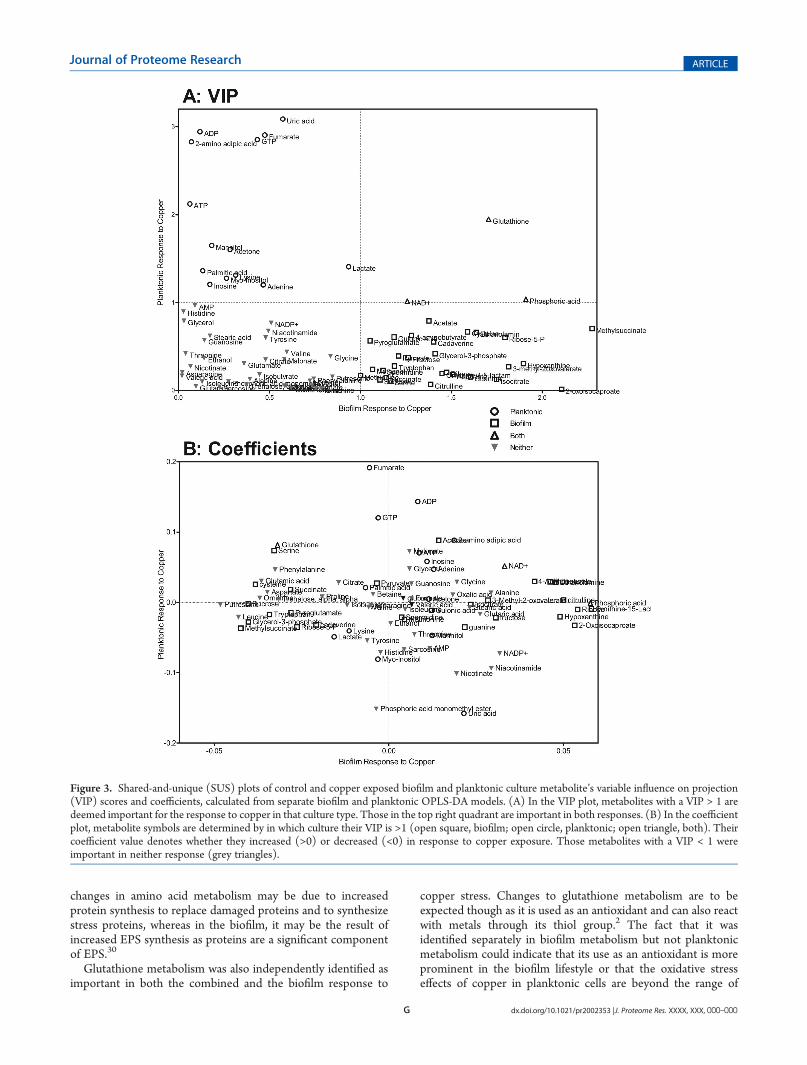
indicates that the metabolite is increasing upon exposure tocopper and a negative coefficient means that metabolite isdecreasing. Using these values, shared-and-unique structure(SUS) plots25 were constructed comparing the biofilm andplanktonic VIP values and coefficients (Figure 3). In these plots,the VIP and coefficients from the two separate OPLS-DAmodelsare plotted against each other to determine what, if any, changesare common to both the planktonic and biofilm response tocopper. The VIP comparison (Figure 3a) shows only 3 metabo-lites have above average significance between the two responses:NADþ, phosphoric acid, and glutathione, highlighting the fact
that the biofilms and planktonic response to copper are quitedistinct from each other. The comparison of OPLS-DA coeffi-cients (Figure 3b) displays an interesting difference between thetwo data sets. Metabolites were colored according to in whichgrowth mode their VIP score was above 1. Metabolites deemedsignificant in the biofilm model (squares) had relatively smallercoefficients in the planktonic model, and vice versa for thesignificant metabolites in the planktonic model (circles).
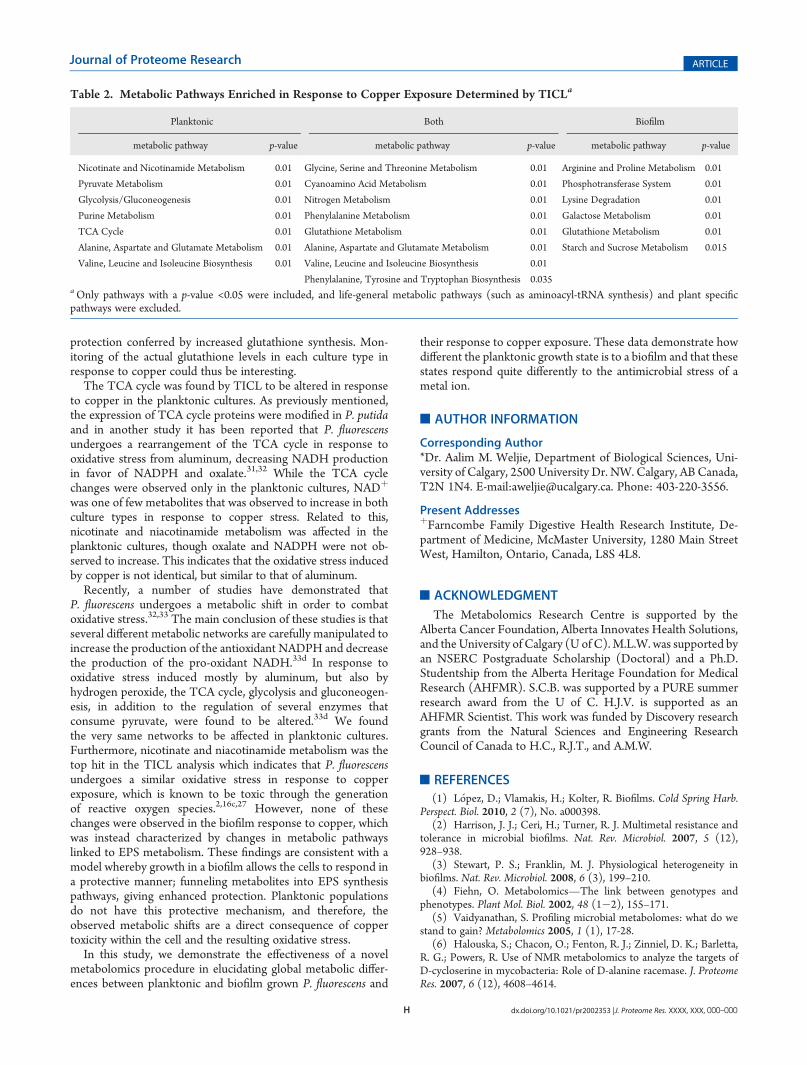
The metabolite’s classification determined from the clusteringwas also used to see if and how these compounds were related inreal metabolic networks. To this end, each list of metabolites wassubmitted to TICL (the Tool for automatic Interpretation of aCompound Library).26 This Web-tool uses the KEGG library ofmetabolic maps to link a list of compounds into a subnetworkeven if there are intermediate compounds missing and alsodetermines which metabolic pathways are most likely to beinvolved with these compounds. The three metabolite lists(corresponding each to important in the biofilm, planktonicand combined response to copper exposure) were individuallysubmitted to TICL and the results of this analysis are shown inTable 2. These results again show that the response to copperstress is very different between biofilms and planktonic cultures,but also shows that there is a shared response. Specifically, theplanktonic response involves changes to nicotinate, pyruvate,and purine metabolism and changes to the TCA cycle andglycolysis. The biofilm response is more involved with galactoseand sucrose metabolism and the phosphotransferase system. Thecombined response, which had the smallest pool of inputcompounds, produced the most affected metabolic networksinvolving various aspects of amino acid biosynthesis and meta-bolism. One interesting aspect of this analysis was that there wereno networks identified in all three responses, but glutathionemetabolism was conserved between biofilms and the combinedresponse and alanine, aspartate, and glutamate metabolism andvaline, leucine, and isoleucine biosynthesis were conservedbetween planktonics and the combined response.
’DISCUSSION
Metabolomics is a rapidly developing field with a plethora ofapplications; however, there have been few studies published onthe metabolomics of bacteria growing as a biofilm. Here, wepresent the first use of metabolomics to investigate the effects of atoxic stressor on bacterial biofilms by using a combined 1HNMRand GC�MS approach to identify differences in the response tocopper stress between biofilms and planktonic cultures. Wefound that there are major metabolic differences betweenbiofilms and planktonic cultures and also that the metabolicchanges induced by exposure are dramatically different betweenthe two growth modes.
Metal ions are being revisited for antimicrobial applications,and copper shock has been found to alter the expression of a largenumber of genes in P. aeruginosa.27 Such a large change in geneexpression would also be indicative of a significant metabolicshift. The physical chemistry associated with metal toxicity hasbeen found to be different in biofilms compared to planktoniccultures.12 On the basis of these previous studies, we hypothe-sized that copper exposure would significantly alter the P.fluorescens metabolome but it was unknown exactly how eachgrowth mode would respond. A convergence of metabolomescould have been expected as each culture type was dealing withsame toxic stressor. Instead, a specific, distinct response was
Figure 2. Principal component analysis (PCA) and partial least-squaresdiscriminant analysis (PLS-DA) scatter plots of P. fluorescens cultures.(A) Control biofilm (open square) and copper exposed biofilm (filledsquare) show clear separation whereas the control planktonic (opencircle) and copper exposed planktonic (filled circle) are not separated atall. While the calculated model had 3 components (Table 1), the thirdcomponent did not separate any of the samples much further than thefirst 2 already had. (B) In the 3D PLS-DA plot, samples were labeledaccording to class before analysis, resulting in separation of all samplesalong a combination of the three component axes. While the biofilmsamples (squares) respectively clustered tightly, the planktonic samples(circles) were more loosely grouped.
F dx.doi.org/10.1021/pr2002353 |J. Proteome Res. XXXX, XXX, 000–000
Journal of Proteome Research ARTICLE
observed for each growth mode. The success of our techniquein identifying this dichotomy indicates that it can be used tofurther examine the effects of toxic stressors and their differentialeffects on any bacterial biofilms and planktonic cultures, perhapsexamining cocontaminant toxic synergy, media effects, andanaerobic growth conditions.
Prior studies have repeatedly demonstrated the increasedtolerance/resistance of biofilms to toxic concentrations of metalsand attributed this phenomenon to a range of different factors.2
Our results here suggest that altered metabolism is another factorthat could play an important role in decreasing biofilm suscept-ibility to toxic metals. Many genes in biofilms are expresseddifferentially compared to planktonic cells, such as those foradherence, EPS production, signaling, and the generation ofphenotypically different subpopulations.1 The presence of het-erogeneous cell types within a biofilm could thus be expected toresult in large differences between the metabolomes of replicatecultures. Such a phenomenon was not observed, indicated bythe close clustering of the biofilm replicate samples in the PCAand PLS-DA analysis, suggesting that the sampling procedurehomogenized any metabolic heterogeneity within the biofilmpopulation.
Using unsupervised data analysis techniques (hierarchicalclustering and PCA), the difference between control and copperexposed biofilms was easy to discern whereas the planktonicsamples remained more or less comparable. While this similaritywas not present in the supervised PLS and OPLS-DA models,still it indicates that the effects of copper stress in planktoniccultures are different and less dramatic than in biofilms. This isfurther supported by each of the SUS plots. The VIP plot showsthat the important metabolites are widely different betweengrowth modes and that there are few shared metabolites. Also,the Coefficient plot shows how distinct the two responses are asmetabolites deemed significant in each model tended to havesmaller coefficients (indicating little change) in the oppositegrowthmode. These differences indicate that biofilmmetabolismundergoes orchestrated changes compared to the dissonant wayplanktonic cultures react to copper toxicity. While that much isclear, the data contain no indication as to whether the observedmetabolic changes are the direct result of copper toxicity or theeffect of a cellular response to stress. Biofilms have many generalprotective mechanisms in order to withstand the effects of toxicmetals,2 whereas planktonic cells are muchmore vulnerable. Thus,it may be that the observed metabolic changes in biofilms are dueto the activation and action of one or more of these mechanisms,whereas the changes seen in the planktonic samples are due to theactual effect of copper ions on the cells. Discerning this dif-ference was beyond the scope of the current study, though if ametabolome similar to the planktonic cultures’ could be foundin high copper concentration exposed biofilms it may confirm thishypothesis.
The metabolites were separately divided by both the hierarch-ical clustering and the OPLS-DA VIP scores into those thatchanged in the planktonic cultures, those that changed in thebiofilms, and those that changed in both. This resulted indifferent but somewhat overlapping categorization of the meta-bolites. Once categorized, the lists of metabolites were submittedto TICL for analysis in order to infer biological meaning. Becauseof the exclusion of metabolites with VIP scores below 1, asignificant (p < 0.05) subnetwork could only be generated fromthe biofilm list obtained from the OPLS-DA models (data notshown). This supports the idea of the biofilm response beingconcerted as the ability to generate a subnetwork indicates thatthe changing metabolites are related and connected. Conversely,this also supports the notion that the planktonic response isgenerally less concerted.
The enriched pathways identified from the TICL analysis ofthe lists obtained from the hierarchical clustering allow biologicalmeaning to be inferred about each growth mode and thecommon response to copper stress. The extracellular-polymericsubstance (EPS) of biofilms protects cells in Pseudomonasaureofaciens biofilms from copper ions adsorbing to the cell wallby blocking phosphoryl groups that would bind the Cu2þ ions.28
Also, biofilms of P. aeruginosa were found to chelate Cu2þ ionswithin the EPS.29 Thus, we could expect EPS related metabo-lism to change in response to copper exposure. Galactosemetabolism was altered in biofilms, as was sugar and starchmetabolism and the phosphotransferase system, all of which arerelated to polysaccharide use and transport, which could indicatea change in EPS related metabolism. This is quite likely as theEPS is one of the most distinct features of biofilm physiologyand has been largely implicated in the biocide resistance ofbiofilms.2,30
As seen in Table 1, most of the pathways identified in bothculture types involve the metabolism of various amino acids.Proteomic analysis of Pseudomonas putida planktonic culturesexposed to copper revealed a significant oxidative stress response,including changes to the expression of a number of TCA andglyoxylate cycle proteins.31 It was also found that the expressionof Ts, the guanine nucleotide-exchange factor for elongationfactor Tu, to be increased and it was suggested that this was dueto increased protein synthesis in response to the copper expo-sure. The observed shared response to copper indicates a largenumber of changes in amino acid metabolism and synthesiswhich could be occurring to help with increased protein synth-esis. While both valine, leucine, and isoleucine biosynthesis andalanine, aspartate, and glutamate metabolism were found to beimportant in the combined response, they were independentlyidentified in the planktonic response. This could indicate that thechanges to amino acid metabolism are due to different pathwaysof toxicity as arginine and proline metabolism was only identifiedin the biofilm response. In the planktonic cultures, the observed
Table 1. Statistical Values Associated with Multivariate Statistical Models
Model Statistics
Model Description Type Model Type Components R2 Q2
Planktonic and Biofilm ( Cu Unsupervised PCA-X 3 0.692 0.580
Planktonic and Biofilm ( Cu Supervised PLS-DA 3 0.681 0.871
Biofilm ( Cu Supervised OPLS-DA 1 þ 3 þ 0 0.944 0.975
Planktonic ( Cu Supervised OPLS-DA 1 þ 2 þ 0 0.952 0.780
G dx.doi.org/10.1021/pr2002353 |J. Proteome Res. XXXX, XXX, 000–000
Journal of Proteome Research ARTICLE
changes in amino acid metabolism may be due to increasedprotein synthesis to replace damaged proteins and to synthesizestress proteins, whereas in the biofilm, it may be the result ofincreased EPS synthesis as proteins are a significant componentof EPS.30
Glutathione metabolism was also independently identified asimportant in both the combined and the biofilm response to
copper stress. Changes to glutathione metabolism are to beexpected though as it is used as an antioxidant and can also reactwith metals through its thiol group.2 The fact that it wasidentified separately in biofilm metabolism but not planktonicmetabolism could indicate that its use as an antioxidant is moreprominent in the biofilm lifestyle or that the oxidative stresseffects of copper in planktonic cells are beyond the range of
Figure 3. Shared-and-unique (SUS) plots of control and copper exposed biofilm and planktonic culture metabolite’s variable influence on projection(VIP) scores and coefficients, calculated from separate biofilm and planktonic OPLS-DA models. (A) In the VIP plot, metabolites with a VIP > 1 aredeemed important for the response to copper in that culture type. Those in the top right quadrant are important in both responses. (B) In the coefficientplot, metabolite symbols are determined by in which culture their VIP is >1 (open square, biofilm; open circle, planktonic; open triangle, both). Theircoefficient value denotes whether they increased (>0) or decreased (<0) in response to copper exposure. Those metabolites with a VIP < 1 wereimportant in neither response (grey triangles).
H dx.doi.org/10.1021/pr2002353 |J. Proteome Res. XXXX, XXX, 000–000
Journal of Proteome Research ARTICLE
protection conferred by increased glutathione synthesis. Mon-itoring of the actual glutathione levels in each culture type inresponse to copper could thus be interesting.
The TCA cycle was found by TICL to be altered in responseto copper in the planktonic cultures. As previously mentioned,the expression of TCA cycle proteins were modified in P. putidaand in another study it has been reported that P. fluorescensundergoes a rearrangement of the TCA cycle in response tooxidative stress from aluminum, decreasing NADH productionin favor of NADPH and oxalate.31,32 While the TCA cyclechanges were observed only in the planktonic cultures, NADþ
was one of few metabolites that was observed to increase in bothculture types in response to copper stress. Related to this,nicotinate and niacotinamide metabolism was affected in theplanktonic cultures, though oxalate and NADPH were not ob-served to increase. This indicates that the oxidative stress inducedby copper is not identical, but similar to that of aluminum.
Recently, a number of studies have demonstrated thatP. fluorescens undergoes a metabolic shift in order to combatoxidative stress.32,33 The main conclusion of these studies is thatseveral different metabolic networks are carefully manipulated toincrease the production of the antioxidant NADPH and decreasethe production of the pro-oxidant NADH.33d In response tooxidative stress induced mostly by aluminum, but also byhydrogen peroxide, the TCA cycle, glycolysis and gluconeogen-esis, in addition to the regulation of several enzymes thatconsume pyruvate, were found to be altered.33d We foundthe very same networks to be affected in planktonic cultures.Furthermore, nicotinate and niacotinamide metabolism was thetop hit in the TICL analysis which indicates that P. fluorescensundergoes a similar oxidative stress in response to copperexposure, which is known to be toxic through the generationof reactive oxygen species.2,16c,27 However, none of thesechanges were observed in the biofilm response to copper, whichwas instead characterized by changes in metabolic pathwayslinked to EPS metabolism. These findings are consistent with amodel whereby growth in a biofilm allows the cells to respond ina protective manner; funneling metabolites into EPS synthesispathways, giving enhanced protection. Planktonic populationsdo not have this protective mechanism, and therefore, theobserved metabolic shifts are a direct consequence of coppertoxicity within the cell and the resulting oxidative stress.
In this study, we demonstrate the effectiveness of a novelmetabolomics procedure in elucidating global metabolic differ-ences between planktonic and biofilm grown P. fluorescens and
their response to copper exposure. These data demonstrate howdifferent the planktonic growth state is to a biofilm and that thesestates respond quite differently to the antimicrobial stress of ametal ion.
’AUTHOR INFORMATION
Corresponding Author*Dr. Aalim M. Weljie, Department of Biological Sciences, Uni-versity of Calgary, 2500 University Dr. NW. Calgary, AB Canada,T2N 1N4. E-mail:[email protected]. Phone: 403-220-3556.
Present AddressesþFarncombe Family Digestive Health Research Institute, De-partment of Medicine, McMaster University, 1280 Main StreetWest, Hamilton, Ontario, Canada, L8S 4L8.
’ACKNOWLEDGMENT
The Metabolomics Research Centre is supported by theAlberta Cancer Foundation, Alberta Innovates Health Solutions,and the University of Calgary (U of C).M.L.W. was supported byan NSERC Postgraduate Scholarship (Doctoral) and a Ph.D.Studentship from the Alberta Heritage Foundation for MedicalResearch (AHFMR). S.C.B. was supported by a PURE summerresearch award from the U of C. H.J.V. is supported as anAHFMR Scientist. This work was funded by Discovery researchgrants from the Natural Sciences and Engineering ResearchCouncil of Canada to H.C., R.J.T., and A.M.W.
’REFERENCES
(1) L�opez, D.; Vlamakis, H.; Kolter, R. Biofilms. Cold Spring Harb.Perspect. Biol. 2010, 2 (7), No. a000398.
(2) Harrison, J. J.; Ceri, H.; Turner, R. J. Multimetal resistance andtolerance in microbial biofilms. Nat. Rev. Microbiol. 2007, 5 (12),928–938.
(3) Stewart, P. S.; Franklin, M. J. Physiological heterogeneity inbiofilms. Nat. Rev. Microbiol. 2008, 6 (3), 199–210.
(4) Fiehn, O. Metabolomics—The link between genotypes andphenotypes. Plant Mol. Biol. 2002, 48 (1�2), 155–171.
(5) Vaidyanathan, S. Profiling microbial metabolomes: what do westand to gain? Metabolomics 2005, 1 (1), 17-28.
(6) Halouska, S.; Chacon, O.; Fenton, R. J.; Zinniel, D. K.; Barletta,R. G.; Powers, R. Use of NMR metabolomics to analyze the targets ofD-cycloserine in mycobacteria: Role of D-alanine racemase. J. ProteomeRes. 2007, 6 (12), 4608–4614.
Table 2. Metabolic Pathways Enriched in Response to Copper Exposure Determined by TICLa
Planktonic Both Biofilm
metabolic pathway p-value metabolic pathway p-value metabolic pathway p-value
Nicotinate and Nicotinamide Metabolism 0.01 Glycine, Serine and Threonine Metabolism 0.01 Arginine and Proline Metabolism 0.01
Pyruvate Metabolism 0.01 Cyanoamino Acid Metabolism 0.01 Phosphotransferase System 0.01
Glycolysis/Gluconeogenesis 0.01 Nitrogen Metabolism 0.01 Lysine Degradation 0.01
Purine Metabolism 0.01 Phenylalanine Metabolism 0.01 Galactose Metabolism 0.01
TCA Cycle 0.01 Glutathione Metabolism 0.01 Glutathione Metabolism 0.01
Alanine, Aspartate and Glutamate Metabolism 0.01 Alanine, Aspartate and Glutamate Metabolism 0.01 Starch and Sucrose Metabolism 0.015
Valine, Leucine and Isoleucine Biosynthesis 0.01 Valine, Leucine and Isoleucine Biosynthesis 0.01
Phenylalanine, Tyrosine and Tryptophan Biosynthesis 0.035aOnly pathways with a p-value <0.05 were included, and life-general metabolic pathways (such as aminoacyl-tRNA synthesis) and plant specificpathways were excluded.
I dx.doi.org/10.1021/pr2002353 |J. Proteome Res. XXXX, XXX, 000–000
Journal of Proteome Research ARTICLE
(7) Sadykov, M. R.; Zhang, B.; Halouska, S.; Nelson, J. L.; Kreimer,L. W.; Zhu, Y.; Powers, R.; Somerville, G. A. Using NMRmetabolomicsto investigate tricarboxylic acid cycle-dependent signal transduction inStaphylococcus epidermidis. J. Biol. Chem. 2010, 285 (47), 36616–36624.(8) Gjersing, E. L.; Herberg, J. L.; Horn, J.; Schaldach, C. M.;
Maxwell, R. S. NMR metabolomics of planktonic and biofilm modesof growth in Pseudomonas aeruginosa. Anal. Chem. 2007, 79 (21),8037–8045.(9) (a) Tremaroli, V.; Workentine, M. L.; Weljie, A. M.; Vogel, H. J.;
Ceri, H.; Viti, C.; Tatti, E.; Zhang, P.; Hynes, A. P.; Turner, R. J.;Zannoni, D. Metabolomic investigation of the bacterial response to a metalchallenge. Appl. Environ. Microbiol. 2009, 75 (3), 719–28. (b) Workentine,M. L.; Harrison, J. J.;Weljie, A.M.; Tran, V. A.; Stenroos, P. U.; Tremaroli,V.; Vogel, H. J.; Ceri, H.; Turner, R. J. Phenotypic and metabolic profilingof colony morphology variants evolved from Pseudomonas fluorescensbiofilms. Environ. Microbiol. 2010, 12 (6), 1565–1577.(10) Issaq, H. J.; Van, Q. N.; Waybright, T. J.; Muschik, G. M.;
Veenstra, T. D. Analytical and statistical approaches to metabolomicsresearch. J. Sep. Sci. 2009, 32 (13), 2183–2199.(11) (a) O’Sullivan, D. J.; O’Gara, F. Traits of fluorescent Pseudo-
monas spp. involved in suppression of plant root pathogens. Microbiol.Rev. 1992, 56 (4), 662–676. (b) Paulsen, I. T.; Press, C. M.; Ravel, J.;Kobayashi, D. Y.; Myers, G. S. A.; Mavrodi, D. V.; DeBoy, R. T.;Seshadri, R.; Ren, Q.; Madupu, R.; Dodson, R. J.; Durkin, A. S.; Brinkac,L. M.; Daugherty, S. C.; Sullivan, S. A.; Rosovitz, M. J.; Gwinn, M. L.;Zhou, L.; Schneider, D. J.; Cartinhour, S. W.; Nelson, W. C.; Weidman,J.; Watkins, K.; Tran, K.; Khouri, H.; Pierson, E. A.; Pierson Iii, L. S.;Thomashow, L. S.; Loper, J. E. Complete genome sequence of the plantcommensal Pseudomonas fluorescens Pf-5. Nat. Biotechnol. 2005, 23(7), 873–878.(12) Workentine, M. L.; Harrison, J. J.; Stenroos, P. U.; Ceri, H.;
Turner, R. J. Pseudomonas fluorescens’ view of the periodic table.Environ. Microbiol. 2008, 10 (1), 238–50.(13) Belzile, N.; Wu, G.; Chen, Y.; Appanna, V. Detoxification of
selenite and mercury by reduction and mutual protection in theassimilation of both elements by Pseudomonas fluorescens. Sci. TotalEnviron. 2006, 367 (2�3), 704–14.(14) (a) Appanna, V. D.; Hamel, R. D.; L�evasseur, R. The metabo-
lism of aluminum citrate and biosynthesis of oxalic acid in Pseudomonasfluorescens. Curr. Microbiol. 2003, 47 (1), 32–9. (b) Hamel, R.;Appanna, V. Modulation of TCA cycle enzymes and aluminum stressin Pseudomonas fluorescens. J. Inorg. Biochem. 2001, 87 (1�2), 1–8.(c) Singh, R.; Beriault, R.; Middaugh, J.; Hamel, R.; Chenier, D.;Appanna, V.; Kalyuzhnyi, S. Aluminum-tolerant Pseudomonas fluores-cens: ROS toxicity and enhanced NADPH production. Extremophiles2005, 9 (5), 367–73.(15) Sauer, K.; Camper, A. K.; Ehrlich, G. D.; Costerton, J. W.;
Davies, D. G. Pseudomonas aeruginosa displays multiple phenotypesduring development as a biofilm. J. Bacteriol. 2002, 184 (4), 1140–54.(16) (a) Harrison, J. J.; Ceri, H.; Stremick, C.; Turner, R. J.
Differences in biofilm and planktonic cell mediated reduction ofmetalloid oxyanions. FEMS Microbiol. Lett. 2004, 235 (2), 357–62.(b) Harrison, J. J.; Ceri, H.; Stremick, C. A.; Turner, R. J. Biofilmsusceptibility to metal toxicity. Environ. Microbiol. 2004, 6 (12), 1220–1227.(c) Harrison, J. J.; Tremaroli, V.; Stan, M. A.; Chan, C. S.; Vacchi-Suzzi, C.;Heyne, B. J.; Parsek,M. R.; Ceri, H.; Turner, R. J. Chromosomal antioxidantgenes have metal ion-specific roles as determinants of bacterial metaltolerance. Environ. Microbiol. 2009, 11 (10), 2491–2509. (d) Harrison,J. J.; Turner, R. J.; Ceri, H. High-throughput metal susceptibility testing ofmicrobial biofilms. BMC Microbiol. 2005, 5, 53.(17) Bligh, E. G.; Dyer, W. J. A rapid method of total lipid extraction
and purification. Can. J. Biochem. Physiol. 1959, 37 (8), 911–917.(18) Weljie, A. M.; Newton, J.; Mercier, P.; Carlson, E.; Slupsky,
C. M. Targeted profiling: Quantitative analysis of 1H NMR metabolo-mics data. Anal. Chem. 2006, 78 (13), 4430–4442.(19) Gullberg, J.; Jonsson, P.; Nordstr€om, A.; Sj€ostr€om, M.; Moritz,
T. Design of experiments: An efficient strategy to identify factorsinfluencing extraction and derivatization of Arabidopsis thaliana samples
in metabolomic studies with gas chromatography/mass spectrometry.Anal. Biochem. 2004, 331 (2), 283–295.
(20) Broeckling, C. D.; Reddy, I. R.; Duran, A. L.; Zhao, X.; Sumner,L. W. MET-IDEA: Data extraction tool for mass spectrometry-basedmetabolomics. Anal. Chem. 2006, 78 (13), 4334–4341.
(21) Saeed, A. I.; Bhagabati, N. K.; Braisted, J. C.; Liang, W.; Sharov,V.; Howe, E. A.; Li, J.; Thiagarajan, M.; White, J. A.; Quackenbush, J.,TM4Microarray Software Suite. 2006; Vol. 411, pp 134�193.
(22) van den Berg, R. A.; Hoefsloot, H. C. J.; Westerhuis, J. A.;Smilde, A. K.; van der Werf, M. J., Centering, scaling, and transforma-tions: Improving the biological information content of metabolomicsdata. BMC Genomics 2006, 7 (142).
(23) Hummel, J.; Strehmel, N.; Selbig, J.; Walther, D.; Kopka, J.Decision tree supported substructure prediction of metabolites fromGC-MS profiles. Metabolomics 2010, 6 (2), 322–333.
(24) Eriksson, L. ; Johansson, E.; Kettaneh-Wold, N.;Wold, S.Multi-and Megavariate Data Analysis: Principles and Applications; Umetrics AB:Umea, Sweden, 2001.
(25) Wiklund, S.; Johansson, E.; Sj€ostr€om, L.; Mellerowicz, E. J.;Edlund, U.; Shockcor, J. P.; Gottfries, J.; Moritz, T.; Trygg, J. Visualiza-tion of GC/TOF-MS-based metabolomics data for identification ofbiochemically interesting compounds using OPLS class models. Anal.Chem. 2008, 80 (1), 115–122.
(26) Antonov, A. V.; Dietmann, S.; Wong, P.; Mewes, H. W. TICL -a web tool for network-based interpretation of compound lists inferredby high-throughput metabolomics. FEBS J. 2009, 276 (7), 2084–2094.
(27) Teitzel, G. M.; Geddie, A.; De Long, S. K.; Kirisits, M. J.;Whiteley, M.; Parsek, M. R. Survival and growth in the presence ofelevated copper: Transcriptional profiling of copper-stressed Pseudo-monas aeruginosa. J. Bacteriol. 2006, 188 (20), 7242–7256.
(28) Gonz�alez, A. G.; Shirokova, L. S.; Pokrovsky, O. S.; Emnova,E. E.; Martínez, R. E.; Santana-Casiano, J. M.; Gonz�alez-D�avila, M.;Pokrovski, G. S. Adsorption of copper on Pseudomonas aureofaciens:Protective role of surface exopolysaccharides. J. Colloid Interface Sci.2010, 350 (1), 305–314.
(29) Harrison, J. J.; Turner, R. J.; Ceri, H. Persister cells, the biofilmmatrix and tolerance to metal cations in biofilm and planktonicPseudomonas aeruginosa. Environ. Microbiol. 2005, 7 (7), 981–94.
(30) Flemming, H. C.; Neu, T. R.; Wozniak, D. J. The EPS matrix:The “house of biofilm cells”. J. Bacteriol. 2007, 189 (22), 7945–7947.
(31) Miller, C. D.; Pettee, B.; Zhang, C.; Pabst, M.; McLean, J. E.;Anderson, A. J. Copper and cadmium: responses in Pseudomonas putidaKT2440. Lett. Appl. Microbiol. 2009, 49 (6), 775–783.
(32) (a) Chenier, D.; Beriault, R.; Mailloux, R.; Baquie, M.; Abramia,G.; Lemire, J.; Appanna, V. Involvement of fumarase C and NADHoxidase in metabolic adaptation of Pseudomonas fluorescens cellsevoked by aluminum and gallium toxicity. Appl. Environ. Microbiol.2008, 74 (13), 3977–3984. (b) Lorenz, M. C.; Singh, R.; Lemire, J.;Mailloux, R. J.; Ch�enier, D.; Hamel, R.; Appanna, V. D. An ATP andoxalate generating variant tricarboxylic acid cycle counters aluminumtoxicity in Pseudomonas fluorescens. PLoS One 2009, 4 (10), e7344.
(33) (a) Beriault, R.; Hamel, R.; Chenier, D.; Mailloux, R.; Joly, H.;Appanna, V. The overexpression of NADPH-producing enzymes coun-ters the oxidative stress evoked by gallium, an iron mimetic. BioMetals2006, 20 (2), 165–176. (b) Lemire, J.; Kumar, P.; Mailloux, R.; Cossar,K.; Appanna, V. D. Metabolic adaptation and oxaloacetate homeostasisin P. fluorescens exposed to aluminum toxicity. J. Basic Microbiol. 2008,48 (4), 252–259. (c) Lemire, J.; Mailloux, R.; Auger, C.; Whalen, D.;Appanna, V. D. Pseudomonas fluorescens orchestrates a fine metabolic-balancing act to counter aluminium toxicity. Environ. Microbiol. 2010, 12(6), 1384–1390. (d) Mailloux, R. J.; Lemire, J.; Appanna, V. D. Meta-bolic networks to combat oxidative stress in Pseudomonas fluorescens.Antonie van Leeuwenhoek 2011, 99 (3), 433–442. (e) Mailloux, R. J.;Lemire, J.; Kalyuzhnyi, S.; Appanna, V. A novel metabolic network leadsto enhanced citrate biogenesis in Pseudomonas fluorescens exposed toaluminum toxicity. Extremophiles 2008, 12 (3), 451–459. (f) Mailloux,R. J.; Singh, R.; Brewer, G.; Auger, C.; Lemire, J.; Appanna, V. D. Alpha-ketoglutarate dehydrogenase and glutamate dehydrogenase work in

J dx.doi.org/10.1021/pr2002353 |J. Proteome Res. XXXX, XXX, 000–000
Journal of Proteome Research ARTICLE
tandem to modulate the antioxidant alpha-ketoglutarate during oxida-tive stress in Pseudomonas fluorescens. J. Bacteriol. 2009, 191 (12),3804–3810. (g) Singh, R.; Lemire, J.; Mailloux, R. J.; Appanna, V. D. Anovel strategy involved in [corrected] anti-oxidative defense: the con-version of NADH into NADPH by a metabolic network. PLoS One2008, 3 (7), e2682. (h) Singh, R.; Lemire, J.; Mailloux, R. J.; Ch�enier, D.;Hamel, R.; Appanna, V. D. An ATP and oxalate generating varianttricarboxylic acid cycle counters aluminum toxicity in Pseudomonasfluorescens. PLoS One 2009, 4 (10), e7344.