Nitrate in groundwater in the Waikato Region, New Zealand
26
Selvarajah, N., Maggs, G.R., Crush, J.R. and Ledgard, S.F. 1994. Nitrate in ground water in the Waikato region. In The Efficient Use of Fertilizers in a Changing Environment: Reconciling productivity with sustainability. (Eds. L D Currie and P Loganathan). Occasional Report No. 7. Fertilizer and Lime Research Centre, Massey University, Palmerston North, pp 160-185. NITRATE IN GROUND WATER IN THE WAIKATO REGION N. Selvarajah 1 , G.R. Maggs 1 , J.R. Crush 2 and S.F. Ledgard 2 1 Environment Waikato, P O Box 4010, Hamilton; 2 AgResearch, Private Bag 3123, Hamilton Abstract There is wide concern that intensive farming practices are likely to provide non-point sources of ground water NO3-N pollution. Similarly, land based disposal of industrial effluent provides numerous point sources of ground water NO3-N. This study uses ground water NO3-N data (including consents monitoring data) collected by Environment Waikato to investigate both non-point and point sources of NO3-N pollution in the Waikato region. Elevated ground water NO3-N levels are found in the north Waikato (south of Pukekohe), Coromandel coastal settlements, Tokoroa, Upper Piako catchment (Hauraki District), and Hamilton Basin. The full extent of ground water NO3-N pollution in the Waikato region will not be known until extensive ground water monitoring is completed. Monitoring wells in an intensively farmed area between Hamilton and Cambridge reveal NO3- N concentrations above 10 mg L -1 . The effects of non-point sources of NO3-N are found predominantly in shallow bores (<30 metres) with water levels within several metres of ground surface. The major mechanisms that control NO3-N fluctuation in shallow aquifers are water recharge and ground water outflow to adjacent streams. Rapid increases in NO3-N levels are attributed to accumulation of soil NO3-N during dry periods, combined with the NO3-N flushing effect of infiltrating rainwater. It has been estimated that NO3-N leaching from intensively farmed areas contributes at least 60 kg NO3-N ha -1 y -1 to shallow aquifers in the Hamilton Basin. During a period of declining ground water levels, the apparent NO3-N decrease from these shallow aquifers equals 280 g NO3-N d -1 . Regardless of intensive land use, certain shallow aquifers contain little or no NO3-N. This may be attributed to reducing soil and water conditions prevailing in these areas (e.g. Lower Piako catchment). Under these conditions there is little or no dissolved oxygen present, and NO3-N is reduced by Fe 2+ . Consequently, ground water containing elevated levels of Fe 2+ (>0.2 mg L - 1 ) has very low NO3-N levels. A significant part of the intensively farmed area in the Waikato region falls into this category. Nitrogen loading rates at industrial waste disposal sites are several fold greater than N loading due to non-point sources. A case study of one such industrial disposal site is presented, where dairy factory waste water disposal onto land has markedly increased ground water NO3-N pollution. At individual bores, NO3-N levels have increased over the last decade from background levels (e.g. <1 mg L -1 ) to more than 70 mg L -1 . The high N and hydraulic loading from this point source contribute at least 13 t NO3-N y -1 to the adjacent Mangaone Stream. Proposals for the disposal of industrial waste water onto land will require an appropriate N management strategy. These N management strategies must demonstrate that applied-N is unlikely to adversely affect ground water quality in the region.
-
Upload
independent -
Category
Documents
-
view
5 -
download
0
Transcript of Nitrate in groundwater in the Waikato Region, New Zealand

Selvarajah, N., Maggs, G.R., Crush, J.R. and Ledgard, S.F. 1994. Nitrate in ground water in the Waikato region. In The Efficient Use of
Fertilizers in a Changing Environment: Reconciling productivity with sustainability. (Eds. L D Currie and P Loganathan). Occasional Report No. 7. Fertilizer and Lime Research Centre, Massey University, Palmerston North, pp 160-185.
NITRATE IN GROUND WATER IN THE WAIKATO REGION
N. Selvarajah1, G.R. Maggs1, J.R. Crush2 and S.F. Ledgard2
1Environment Waikato, P O Box 4010, Hamilton; 2AgResearch, Private Bag 3123, Hamilton
Abstract
There is wide concern that intensive farming practices are likely to provide non-point sources
of ground water NO3-N pollution. Similarly, land based disposal of industrial effluent provides
numerous point sources of ground water NO3-N. This study uses ground water NO3-N data
(including consents monitoring data) collected by Environment Waikato to investigate both
non-point and point sources of NO3-N pollution in the Waikato region. Elevated ground water
NO3-N levels are found in the north Waikato (south of Pukekohe), Coromandel coastal
settlements, Tokoroa, Upper Piako catchment (Hauraki District), and Hamilton Basin. The full
extent of ground water NO3-N pollution in the Waikato region will not be known until
extensive ground water monitoring is completed.
Monitoring wells in an intensively farmed area between Hamilton and Cambridge reveal NO3-
N concentrations above 10 mg L-1. The effects of non-point sources of NO3-N are found
predominantly in shallow bores (<30 metres) with water levels within several metres of ground
surface. The major mechanisms that control NO3-N fluctuation in shallow aquifers are water
recharge and ground water outflow to adjacent streams. Rapid increases in NO3-N levels are
attributed to accumulation of soil NO3-N during dry periods, combined with the NO3-N
flushing effect of infiltrating rainwater. It has been estimated that NO3-N leaching from
intensively farmed areas contributes at least 60 kg NO3-N ha-1 y-1 to shallow aquifers in the
Hamilton Basin. During a period of declining ground water levels, the apparent NO3-N
decrease from these shallow aquifers equals 280 g NO3-N d-1.
Regardless of intensive land use, certain shallow aquifers contain little or no NO3-N. This may
be attributed to reducing soil and water conditions prevailing in these areas (e.g. Lower Piako
catchment). Under these conditions there is little or no dissolved oxygen present, and NO3-N
is reduced by Fe2+. Consequently, ground water containing elevated levels of Fe2+ (>0.2 mg L-
1) has very low NO3-N levels. A significant part of the intensively farmed area in the Waikato
region falls into this category.
Nitrogen loading rates at industrial waste disposal sites are several fold greater than N loading
due to non-point sources. A case study of one such industrial disposal site is presented, where
dairy factory waste water disposal onto land has markedly increased ground water NO3-N
pollution. At individual bores, NO3-N levels have increased over the last decade from
background levels (e.g. <1 mg L-1) to more than 70 mg L-1. The high N and hydraulic loading
from this point source contribute at least 13 t NO3-N y-1 to the adjacent Mangaone Stream.
Proposals for the disposal of industrial waste water onto land will require an appropriate N
management strategy. These N management strategies must demonstrate that applied-N is
unlikely to adversely affect ground water quality in the region.

Selvarajah, N., Maggs, G.R., Crush, J.R. and Ledgard, S.F. 1994. Nitrate in ground water in the Waikato region. In The Efficient Use of
Fertilizers in a Changing Environment: Reconciling productivity with sustainability. (Eds. L D Currie and P Loganathan). Occasional Report No. 7. Fertilizer and Lime Research Centre, Massey University, Palmerston North, pp 160-185.
Introduction
New Zealand has an abundance of good quality surface and ground water resources. In the
Waikato region (Figure 1) approximately 50% of the population depend on ground water
supplies. Dependency on ground water is steadily increasing due to increasing farming activity
and population growth. For the last three years, on average about 400 ground water bores have
been drilled in the Waikato region. Moreover, there is also a growing domestic and overseas
interest in using ground water for commercial bottling as drinking water (e.g. bore water at
Raglan). Industrial and agricultural uses place considerable demands on water resources in the
Waikato region, and the dairy farming, horticulture and market gardening industries are
particularly dependent on ground water supplies.
Selvarajah, N., Maggs, G.R., Crush, J.R. and Ledgard, S.F. 1994. Nitrate in ground water in the Waikato region. In The Efficient Use of
Fertilizers in a Changing Environment: Reconciling productivity with sustainability. (Eds. L D Currie and P Loganathan). Occasional Report No. 7. Fertilizer and Lime Research Centre, Massey University, Palmerston North, pp 160-185.
According to the New Zealand drinking water standards, the maximum acceptable level for
NO3-N is 10 mg L-1 (Board of Health, 1989; Australian and New Zealand Environment and
Conservation Council (ANZECC), 1992). The significance of this level and health hazard due
to the presence of NO3-N in drinking water have been explained elsewhere (e.g. Johnson et al.,
1987; Weisenburger, 1991; Burden, 1992). High levels of NO3-N in drinking water can also
affect livestock (Driscoll, 1987). The ANZECC guideline for NO3-N for livestock drinking
water is 30 mg L-1 (ANZECC, 1992). Moreover, in the Waikato region, ground water often
contributes directly to surface water bodies such as streams, rivers and wetlands. Consequently,
water polluted with NO3-N can pollute waterways causing algal blooms and may subsequently
affect aquatic life such as fish. Many waterways in the region are used for recreation, and
unwanted algal growths can be a nuisance and may affect the revenue gained by tourism.
The dairy export market is becoming increasingly competitive, and meeting stringent quality
standards is very important for assuring successful participation in international trade,
especially in the European market. Consequently, heavy emphasis is placed on the quality of
water used in the dairy farming industry. Thus dairy farming requires good quality water (Class
1 - used for human consumption) for stock consumption, milking sheds, and washing
requirements. New Zealand's economy depends heavily on the dairy industry and about 50%
of milk production is generated in the Waikato region. Every effort must be made to prevent
ground water contamination in the region so that such a valuable industry remains viable.
In the past the task of ground water quality monitoring has been undertaken either by the
Department of Health or regional authorities. Department of Health monitoring programmes
are used to assess the quality of potable ground water supplies. Most of the regional authority
monitoring programmes have been carried out to investigate the hydrogeochemistry of ground
water. The objective of these programmes is usually to understand the formation from which
ground water is derived, and to assess the general quality of ground water (e.g. mineral
composition and contaminants such as NO3-N) for different uses. Such studies generally
require one-off sampling and hence the majority of bores monitored during these ground water
studies have been sampled only once. Excluding consent monitoring programmes, the only
systematic ground water NO3-N studies conducted in the Waikato region have been that of
Baber (1978) and Marshall (1986).
Nitrate-N contamination of ground water is identified as a major threat to ground water quality
in the region. The first part of this paper identifies sources of non-point NO3 pollution in the
Waikato region, and presents a case study of ground water NO3 levels in the Hamilton to
Cambridge area. The second part discusses NO3-N contamination from point sources and
presents a case study of NO3 pollution adjacent to a dairy factory waste water irrigation site in
the Hamilton Basin.
(1) Ground water NO3-N contamination caused by non-point sources in the
Waikato region
The potential non-point sources for NO3-N are soil organic-N, N fertilisers, grazed pasture,
cultivated soils and on-site sewage treatment. The literature on non-point sources of ground
water NO3-N in New Zealand is abundant (e.g. Baber, 1978; Burden, 1982; Sinton, 1984;
Hoare, 1986; Cameron, 1993; Smith et al., 1993). Thus the following discussion emphasises
processes that generate non-point sources of ground water N03-N, which have previously
received little or no attention in the literature.

Selvarajah, N., Maggs, G.R., Crush, J.R. and Ledgard, S.F. 1994. Nitrate in ground water in the Waikato region. In The Efficient Use of
Fertilizers in a Changing Environment: Reconciling productivity with sustainability. (Eds. L D Currie and P Loganathan). Occasional Report No. 7. Fertilizer and Lime Research Centre, Massey University, Palmerston North, pp 160-185.
Soil organic-N
Surface soils in the Waikato region (up to 20 cm depth) contain about 0.3-0.6% N, mainly in
the form of organic-N. During mineralisation, heterotrophic microbes (ammonifiers)
breakdown soil organic-N into ammoniacal-N (NH4-N) when moisture and warm conditions
are available. Depending on the labile organic-C availability in soil the released ammoniacal-
N can be assimilated by microbes, a process referred to as immobilisation (Okereke and Meints,
1985). Both mineralisation and immobilisation are dynamic processes, and depending on the
rate of these processes, there will be a net mineralisation or net immobilisation. Net
mineralisation can also depend on the quality and quantity of organic-N substrates available in
soil, soil type, soil management and climatic conditions. Often net mineralisation is estimated
using the amount of N removed by herbage from unfertilised soils (Ryden, 1984). Using this
approach, it has been reported that the annual rates of net mineralisation are between 100 and
900 kg N ha-1 for 38 different sites in the U.K. (Brockman, 1969). Such an estimate does not
indicate any excess mineral-N remaining in soil following plant uptake and other N loss
pathways, which is important from the point of view of NO3-N leaching.
When surplus NH4-N is present in soils, under aerobic conditions, nitrifiers can oxidise NH4-
N into NO3-N. Once NO3-N is produced in soil, unlike NH4-N little is incorporated into
biomass by heterotrophs, and a build-up of NO3-N occurs in soil provided plant uptake and
denitrification are low. There is evidence for the preference for NH4-N over NO3-N by
heterotrophs during immobilisation (Hauck, 1984; Wickramasinghe et al., 1985; Recous et al.,
1988). Thus the low nitrifying potential of a soil can lead to high immobilisation (Nannipieri
et al., 1990). Most Waikato soils have a high nitrification potential due to the presence of
allophanic minerals (Baber, 1978; Sarathchandra, 1978). These soils are expected to have low
immobilisation potential and hence a high NO3-N build-up in soil. Nevertheless, NO3-N build-
up in soil also depends on season and is substantially reduced during cold (autumn and winter)
and dry (summer) weather conditions due to lower nitrification rates.
Intensively grazed land in the Waikato region typically comprises a well established clover-
based pasture. Under Waikato conditions, a well established clover-based pasture could
contribute approximately 200 kg N ha-1 y-1 to soil-N, although certain cultivars are capable of
fixing up to 280 kg N ha-1 y-1 (Ledgard et al., 1990). In the absence of livestock, N fixed by
clover is in the form of organic-N and is unlikely to cause NO3-N build-up in soil.
Animal excreta
Urine deposition has been identified as the major source of NO3-N loss by leaching from
pasture (Walker, 1956; Quin, 1982). Such major losses by leaching do not occur from ungrazed
grassland (Foster et al., 1982). Ryden et al. (1984) demonstrated that the amount of NO3-N
leached below a grass sward grazed by cattle was 5.6 times greater than that leached below a
comparable cut sward. Under grazing the source of N is unimportant - when inputs of N from
fertiliser and clover are similar there is little difference in NO3-N leached (Jarvis, 1990; Cuttle,
1992).
The typically large volume of urine voided per urination by dairy and beef cows applies N at
rates of up to 970 kg N ha-1 under New Zealand conditions (Steele 1982). Sheep return N at
lower rates (480 kg N ha-1) (Doak, 1952). Most N in urine is urea, and this urea is rapidly
hydrolysed to NH3 in soil. Some of the NH3 may be volatilised (Ball et al., 1979), with the
Selvarajah, N., Maggs, G.R., Crush, J.R. and Ledgard, S.F. 1994. Nitrate in ground water in the Waikato region. In The Efficient Use of
Fertilizers in a Changing Environment: Reconciling productivity with sustainability. (Eds. L D Currie and P Loganathan). Occasional Report No. 7. Fertilizer and Lime Research Centre, Massey University, Palmerston North, pp 160-185.
remainder being nitrified to NO3-N. Since the amount of NO3-N in these urine patches is much
greater than NO3-N used by pasture, the excess NO3-N is at risk of being leached.
Intensive dairying has greater potential to leach NO3-N than intensive sheep farming. Leaching
occurs whenever water drains down the soil profile, but rates tend to be highest in winter
because of wet soils and low NO3-N uptake rates by pastures. Soil factors such as friable texture
and earthworms that promote pasture growth may also exacerbate NO3-N leaching down
channels in the soil.
During milking periods about 8% of the excreta is deposited in milking sheds. Most dairy shed
'waste' is water (more than 95%) that has been used for washing. Liquid 'wastes' are either
applied onto land or treated and disposed into surface water bodies. Disposal of liquid ' waste'
may be a problem due to the large volumes generated. When managed poorly, land application
of 'waste' can cause leaching of NO3-N into ground water.
Nitrogen fertiliser
The use of nitrogenous fertilisers is steadily increasing in New Zealand. When used in excess,
NO3-N accumulates in soil and causes substantial leaching loss of applied-N. Dairy farming in
New Zealand often relies on nitrogenous fertilisers to increase soil NO3-N levels and to
compensate a natural reduction in soil NO3-N during autumn and winter. During wet conditions
residual NO3-N may be washed down below the root zone to reach the water table. However,
heavy rainfall immediately following the application of fertiliser N may contribute directly to
NO3-N pollution of ground water and surface water, because leaching and surface runoff
remove applied-N before it can be absorbed.
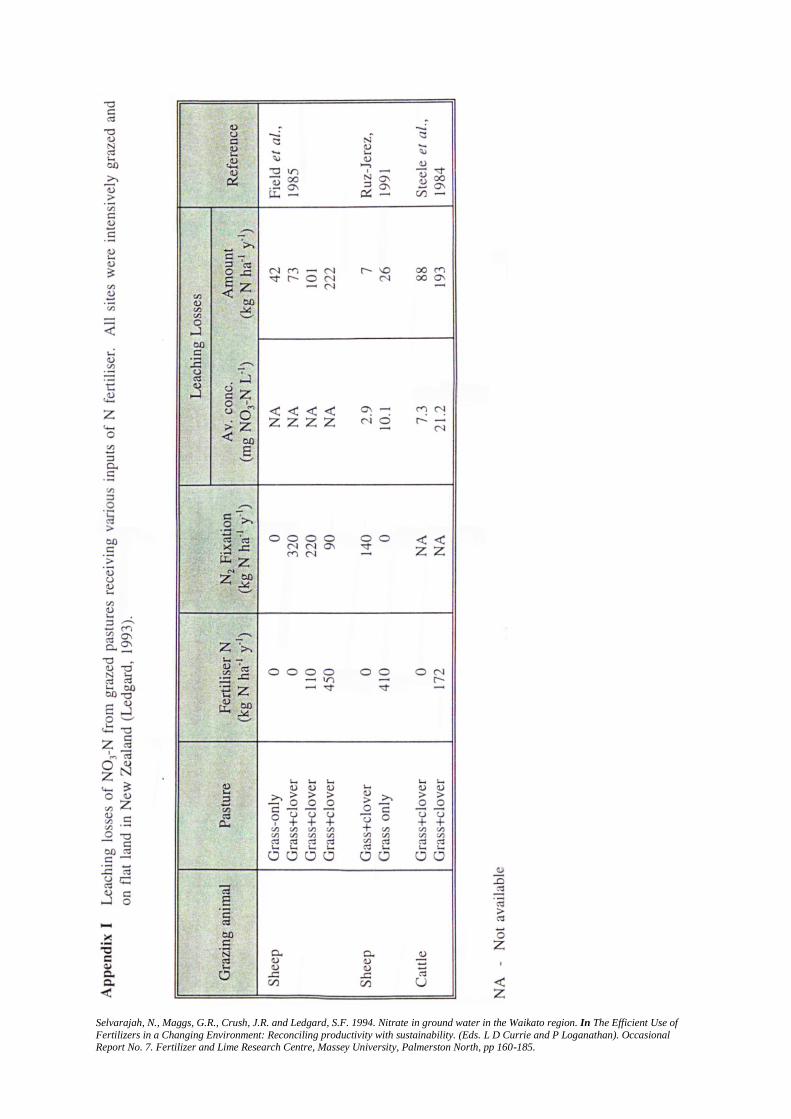
Three New Zealand studies have examined leaching losses in grazed pastures with or without
N fertiliser addition (Appendix I). In all cases, the application of N fertiliser enhanced pasture
and animal production, and increased NO3-N leaching. Associated analyses indicated that
much of this extra NO3-N in leachate was not from direct leaching of fertiliser N, but was from
urine-N after uptake into pasture and consumption by grazing animals. Increased N fertiliser
input simply increases N flow in a dairy pasture system, which in turn increases NO3-N
leaching potential (Jarvis et al., 1989). The leaching losses from N fertilised pastures in
Appendix I are similar to those measured under grazing in the U.K. (Garwood and Ryden,
1986; Jarvis et al., 1989).
There is an important role for strategic use of N fertiliser in intensive farming systems in New
Zealand. However, regular application of N fertiliser at rates similar to those used on European
grassland seems inappropriate in view of our favourable climate for clover growth and N2
fixation. Various studies on flat land (e.g. Field et al., 1985; Crush et al., 1982) have shown
that increasing N fertiliser inputs lead to decreasing N2 fixation by legumes due to partial
replacement of N fixation by fertiliser N and to increased competition by grasses.
Septic tanks or sewage outflows
After the introduction of reticulated sewage systems in many parts of the region, the threats to
ground water from sewage systems are relatively small. However, some coastal settlements on
the Coromandel Peninsula have elevated ground water NO3-N levels that may be attributable
to the number and spacing of septic tanks.
Selvarajah, N., Maggs, G.R., Crush, J.R. and Ledgard, S.F. 1994. Nitrate in ground water in the Waikato region. In The Efficient Use of
Fertilizers in a Changing Environment: Reconciling productivity with sustainability. (Eds. L D Currie and P Loganathan). Occasional Report No. 7. Fertilizer and Lime Research Centre, Massey University, Palmerston North, pp 160-185.
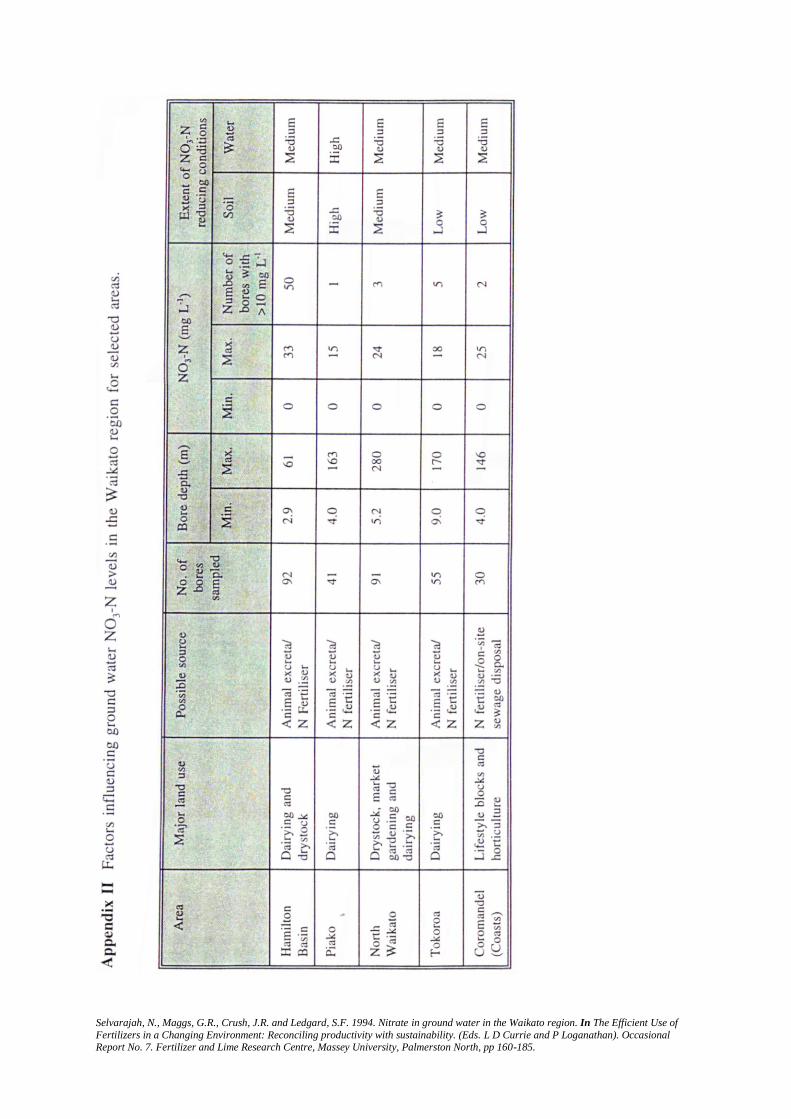
(a) Extent of ground water NO3-N pollution
Except for hill country areas such as Te Kuiti, western coastal catchments, and the Taupo Basin,
most of the Waikato region has been studied for ground water quality. Nitrate-N data are
available for the north Waikato (Ringham et al., 1990), Hamilton Basin (Hoare, 1986;
Marshall, 1986), Tokoroa (Bird, 1987), Piako catchment (Hadfield, 1993), and Coromandel
Peninsula (Selvarajah, 1993a). Except for the Coromandel study all the others have been
terminated. The Coromandel investigation is currently performed on a quarterly basis at 30
different locations.
Approximately half of the bores sampled in the Hamilton Basin have NO3-N levels > 10 mg L-
1 (Appendix II). In contrast, most bores in the Piako catchment, north Waikato (south of
Pukekohe), and Coromandel areas have little or no NO3-N. This is surprising because some of
these areas are used for intensive farming and receive relatively high N input. Low NO3-N
levels in these areas can be attributed to greater use of deeper aquifers, and to soil and/or water
reducing conditions.
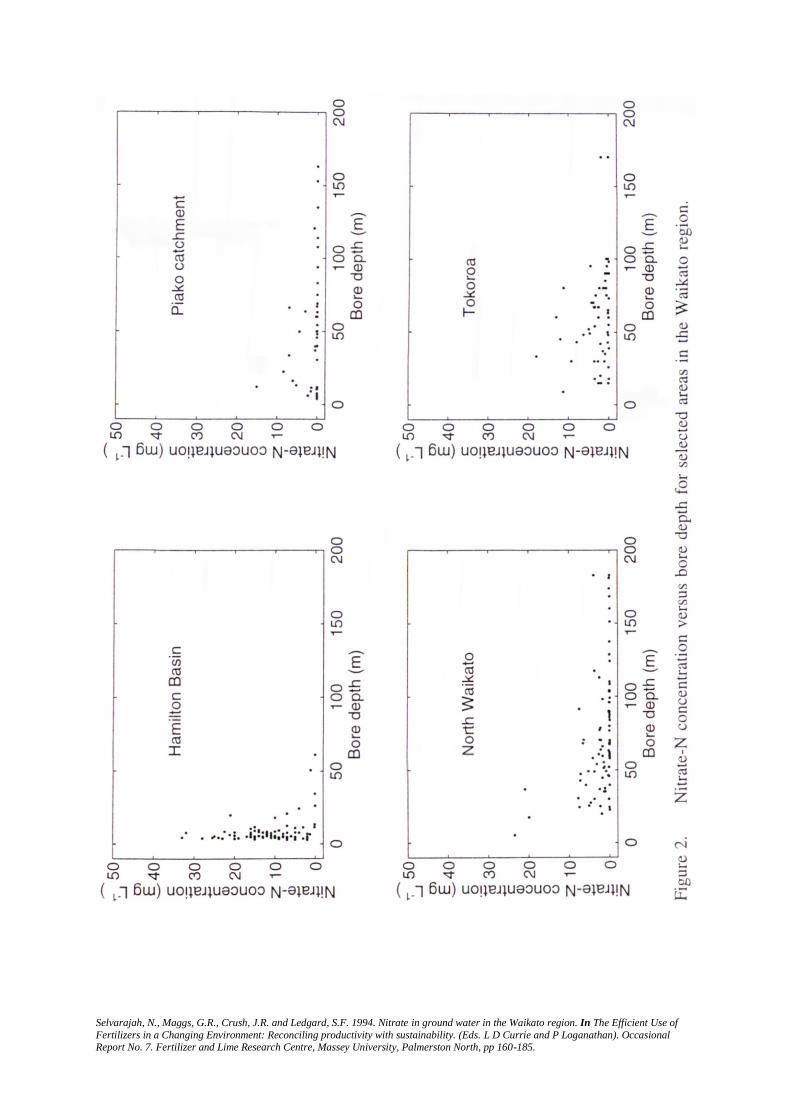
It has been well established that NO3-N levels generally decline with increasing depth (Trudell
et al., 1986; Hallberg, 1989; Postma and Boesen, 1991). Our data indicate a similar trend
(Figure 2). Various hypotheses have been proposed to explain the vertical distribution of NO3-
N in ground water. High NO3-N levels in shallow unconfined aquifers may be attributed to
greater dissolved oxygen levels and the proximity of the NO3-N source. The absence of NO3-
N at greater depth has been attributed previously to the presence of denitrifying bacteria
(Behnke and Haskell, 1968). Recent papers emphasise that in addition to anaerobic conditions
and the presence of heterotrophic bacteria, the denitrification process requires an electron donor
such as dissolved organic-C (DOC) (Postma and Boesen, 1991; Korom, 1992). Consequently,
DOC is the main factor limiting denitrification of NO3-N in ground water. However, in the
absence of DOC other electron donors such as Fe2+ and Mn2+ can enhance the denitrification
process through autotrophic bacteria (Korom, 1992).
Ground water scientists have frequently observed that ground water containing Fe2+ has little
or no NO3-N (Postma and Boesen, 1992). Regardless of the depth of ground water, many
ground waters in the Waikato region contain high Fe2+ levels. Of the known bores in the
Waikato region with Fe2+ > 0.2 mg L-1, over 90% have less than 1 mg N03-N L-1 (Appendix
III). However, the absence of NO3-N in ground water cannot be attributed entirely to
autotrophic denitrification in ground water. Many areas in the Waikato region have reduced
soil conditions (e.g. peat and gley soils in the Lower Piako catchment; Appendix II). Soils with
a moisture content near saturation or a high water table are able to reduce NO3-N due to
prevailing anaerobic conditions (Barkle et al., 1993).
Ground water NO3-N levels decrease from the southern Piako towards the north (Firth of
Thames) (Figure 3). In the south, greater NO3-N levels are detected in the shallow sand and
gravel aquifers, whereas fine-grained silt and clay sediments in the north provide reduced
conditions conducive for NO3-N reduction. Higher NH4-N concentrations found in the northern
part of this catchment suggest a possible mechanism of dissimilatory NO3-N reduction to NH4-
N in ground water or low nitrification rates in soil.
Figure 2 clearly indicates that except for the Hamilton Basin, other areas may have NO3-N
contamination at greater depths. In the case of north Waikato bores, NO3-N contamination
occurs at considerable depths (e.g. >100 m). High use of fertiliser-N and intensive cultivation
Selvarajah, N., Maggs, G.R., Crush, J.R. and Ledgard, S.F. 1994. Nitrate in ground water in the Waikato region. In The Efficient Use of
Fertilizers in a Changing Environment: Reconciling productivity with sustainability. (Eds. L D Currie and P Loganathan). Occasional Report No. 7. Fertilizer and Lime Research Centre, Massey University, Palmerston North, pp 160-185.
practices are considered to be the main source of NO3-N pollution in the market gardening and
intensive horticultural areas of the north Waikato (south of Pukekohe) (where most bores are
>50 m deep). However, it should be emphasised that the presence of NO3-N in deeper bores
may not always indicate that deeper aquifers are polluted. The casing of some deep bores can
allow mixing of shallow and deep ground water.
Even if bores are cased appropriately to exclude shallow aquifer sources, large abstraction
volumes taken from deep bores may induce leakage from overlying shallow aquifers, and hence
allow mixing of NO3-N contaminated shallow ground water with deeper uncontaminated
aquifers. Consequently, the construction and use of deeper bores may not provide a satisfactory
alternative to the use of NO3-N contaminated shallow aquifers.
(b) Case study - Non-point source
Ground water NO3-N data have been collected from Environment Waikato's electronic data
base, technical reports, and resource monitoring data sets. Apart from the resource consent
Selvarajah, N., Maggs, G.R., Crush, J.R. and Ledgard, S.F. 1994. Nitrate in ground water in the Waikato region. In The Efficient Use of
Fertilizers in a Changing Environment: Reconciling productivity with sustainability. (Eds. L D Currie and P Loganathan). Occasional Report No. 7. Fertilizer and Lime Research Centre, Massey University, Palmerston North, pp 160-185.
monitoring programmes, most data have been collected for catchment based ground water
studies rather than for state of the environment (SOE) monitoring. The only SOE monitoring
Selvarajah, N., Maggs, G.R., Crush, J.R. and Ledgard, S.F. 1994. Nitrate in ground water in the Waikato region. In The Efficient Use of
Fertilizers in a Changing Environment: Reconciling productivity with sustainability. (Eds. L D Currie and P Loganathan). Occasional Report No. 7. Fertilizer and Lime Research Centre, Massey University, Palmerston North, pp 160-185.
performed on a regular basis was a monthly ground water NO3-N data collection programme
which monitored 12 different wells and 2 bores in the Hamilton to Cambridge area (Figure 1)
from October 1981 to February 1988. Data from 6 sites were omitted from the analysis of non-
point sources of NO3-N, because these sites were either (a) located near a known point source
of NO3-N contamination or (b) a deep bore with NO3-N levels typically below detection limits.
The remaining 8 sites were originally chosen on the basis of higher than average NO3-N levels,
and therefore, may provide a slight overestimate of spatially averaged NO3-N levels in the
sampling area. The sampling area is representative of the Hamilton Basin, which covers an area
of 2040 km2 centred around Hamilton City. Land use in the Hamilton to Cambridge sampling
area comprises dairying; small drystock farms; horticulture; cropping (especially maize); and
rural residential blocks.
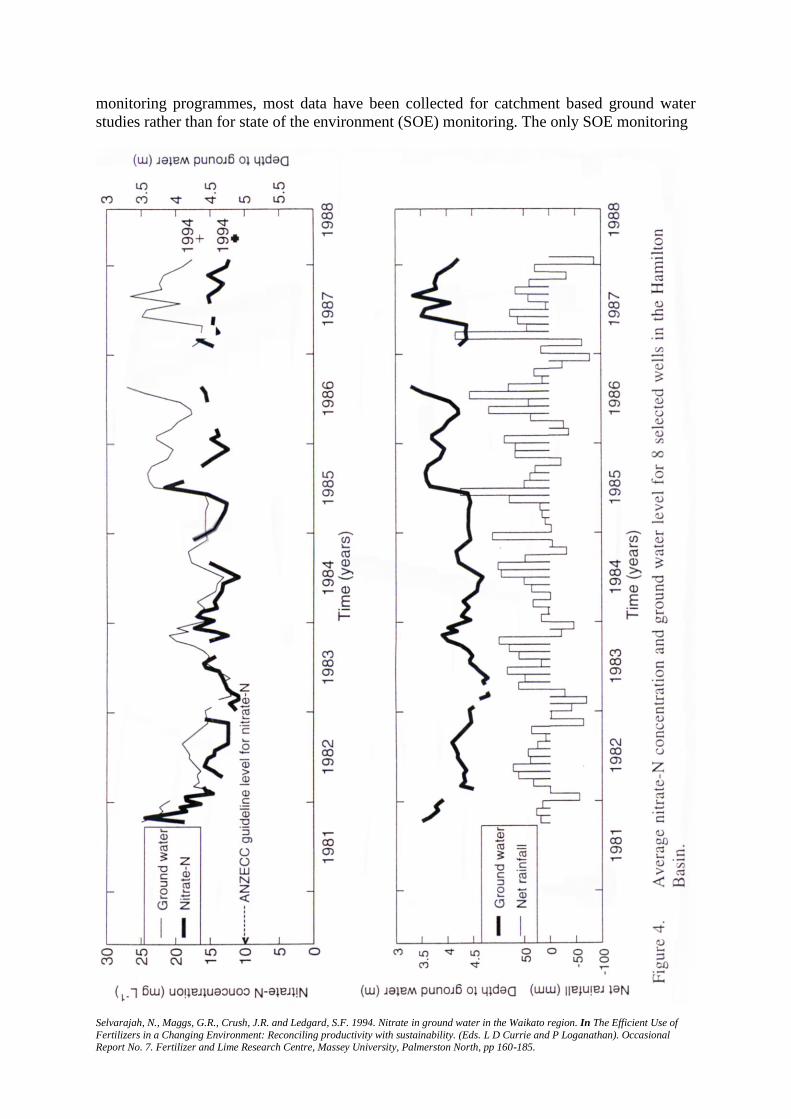
Figure 4 illustrates the fluctuation of ground water and NO3-N levels for the sampling period.
Changes in NO3-N in shallow (< 10 m depth) aquifers in the Hamilton Basin correspond
generally with ground water levels (r = 0.53; P<0.01). Ground water NO3-N levels are
consistently greater than 10 mg L-1 but less than 25 mg L-1. Ground water level increases
following winter rainfall (June/July) to reach a typical peak value in August/September. Net
rainfall provides the driving force for NO3-N contamination in these shallow aquifers (Hall,
1992). However, a rapid decline of ground water NO3-N appears to correspond with relatively
stable ground water levels - indicating a reduction in the rate of NO3-N leaching.
Nitrate-N levels and ground water levels (Figure 4) in February 1994 (one-off sampling run)
are very similar to those measured in February 1988. Consequently, it may be assumed that
non-point sources of NO3-N in the Hamilton Basin sampling area remain unchanged since
monitoring began in October 1981.
Figure 5 shows a schematic representation of changing ground water NO3-N concentration and
ground water level for a shallow, idealised aquifer in the Hamilton Basin. Nitrate-N leaching
to the aquifer is estimated from the difference in NO3-N concentration, water level change and
aquifer storage, and NO3-N outflow as a component of ground water outflow to surface waters.
Consequently, NO3-N leaching to shallow aquifers in the Hamilton Basin is as follows:
(NO3-N)l = 10000 ((NO3-N)final x Wfinal x S) - 10000 ((NO3-N)initial x Winitial x S) + 10000
(((NO3-Ninitial + NO3-Nfmal)/2) x qt) [ 1 ];
where (NO3-N), is mass nitrate-N per hectare leaching to the aquifer (g ha-1);
(NO3-N)initjal is nitrate concentration at time zero (g m-3);
(NO3-N)final is nitrate concentration at some later time (g m-3);
Wjmtial and Wfinal are initial and final ground water level (m);
S is aquifer storativity; and
qt is ground water outflow (m) during time, t = tfinal - tinitial .
Assuming an average storativity of 0.1 for the generally poorly sorted sediments (Sherwood,
1972) of these shallow alluvial aquifers, and using an average (n = 150) aquifer thickness of
approximately 7 m (Figure 5) gives an estimate of NO3-N leaching for the period 3 May to 8
July 1985:
(NO3-N), = 10000 (21.7 x 4.325 x 0.1) - 10000 (12.7 x 3.538 x 0.1) + 10000 (((12.7 + 21.7)/2)
x 0.053)

Selvarajah, N., Maggs, G.R., Crush, J.R. and Ledgard, S.F. 1994. Nitrate in ground water in the Waikato region. In The Efficient Use of
Fertilizers in a Changing Environment: Reconciling productivity with sustainability. (Eds. L D Currie and P Loganathan). Occasional Report No. 7. Fertilizer and Lime Research Centre, Massey University, Palmerston North, pp 160-185.
= 93852.5 - 44932.6 + 9116
= 58035.9 g ha-1
Annual NO3-N leaching may be greater than 58 kg NO3-N ha-1 if allowance is made for NO3-
N influx during periods of apparent NO3-N reduction. This conservatism allows for error in the
estimate of aquifer storativity, which because of the mixture of grain sizes present in the various
strata (Table 1), is likely to vary between 0.05 and 0.15. Furthermore, as the sampling area is
used only partially for intensive farming, NO3-N leaching from grazed pasture in the Hamilton
Basin is likely to be greater than 58 kg NO3-N ha-1 y-1. This estimate is in close agreement with
an estimate of annual NO3-N leaching (59 kg NO3-N ha-1 y-1) obtained using all periods (1981
to 1988) of apparent NO3-N increase (Figure 4).
Using a similar approach to Equation [1], a decrease in ground water NO3-N levels of 280 g d-
1 is apparent during a 5 month period of declining NO3-N levels. It is suspected that dilution is
the main mechanism for decreases in NO3-N levels. Ground water outflow contributes most of
the flow of rivers and streams in the Waikato region, and therefore, most of the NO3-N entering
shallow aquifers in the region eventually reaches surface waterways.

Selvarajah, N., Maggs, G.R., Crush, J.R. and Ledgard, S.F. 1994. Nitrate in ground water in the Waikato region. In The Efficient Use of
Fertilizers in a Changing Environment: Reconciling productivity with sustainability. (Eds. L D Currie and P Loganathan). Occasional Report No. 7. Fertilizer and Lime Research Centre, Massey University, Palmerston North, pp 160-185.
Table 1. Typical stratigraphic sequence for shallow sediments in the Hamilton Basin.
Depth from ground surface
(m)
Lithology
1 soil
8 rhyolitic and pumiceous sands and gravels
10 Silt, clay, peat
15 pumiceous sands and gravels
>15 Pumiceous sands and gravels with layers of silt, clay and peat
(2) Ground water NO3-N contamination caused by point sources in the Waikato
region
It was common practice a decade ago for many industries to discharge their effluent into
waterways. Dairy factories, tanneries, rendering plants, meat processing plants, sewage
treatment plants, wood treatment plants, dairy sheds and piggeries are some examples. Former
catchment authorities placed pressure on many of these waste generators, and consequently,
land application of waste became popular. Currently, Environment Waikato strongly
encourages waste water disposal onto land.
(a) Discharge to waterways
Despite the increasing number of resource users who discharge waste water to land, many
waste generators are still using surface water as a receiving environment for waste disposal.
There are about 30 major permanent discharges to the Waikato River from various industries.
Many of these discharges are sewage outfalls. For example, the Hamilton City sewage outflow
carries on average 1.3 t N d-1. Apart from these direct discharges, the Waikato River receives
N from other rivers and streams and subsurface flow of ground water. Another source of N for
the Waikato River is surface runoff and storm water produced from paved areas. It is estimated
that on average the Waikato River discharges about 10.5 t dissolved inorganic N (DIN) d-1 into
the Tasman Sea at Port Waikato. The amount of total-N transported would be many fold higher
than the estimated daily DIN amount. Since the volume of water flow is large in Waikato River,
the concentration of DIN is only 0.3 mg L-1. Small rivers or streams in the Waikato region have
greater DIN concentrations. For example, the Waitoa River DIN level is 4.0 mg L-1. An
estimated 0.4 t DIN d-1 is discharged by the Waitoa River into the Piako River.
Although high treatment standards are required for treating waste prior to surface water
disposal, the large volume of waste generated results in a large mass loading in waterways. For
example, the concentration of a major sewage outflow described in the preceding paragraph is
only 33 mg total-N L-1. In contrast an outflow from a typical treated dairy shed effluent pond
system contains 200 mg total-N L-1. Nevertheless, considering the small volume of 'waste' (10
m3 d-1) discharged, the daily N loading to surface water from a dairy farm will be 0.002 t d-1.
Consequently, on a daily basis, the waste-N from a major sewage outfall is equivalent to the
'waste-N' from 650 dairy farms.

Selvarajah, N., Maggs, G.R., Crush, J.R. and Ledgard, S.F. 1994. Nitrate in ground water in the Waikato region. In The Efficient Use of
Fertilizers in a Changing Environment: Reconciling productivity with sustainability. (Eds. L D Currie and P Loganathan). Occasional Report No. 7. Fertilizer and Lime Research Centre, Massey University, Palmerston North, pp 160-185.
(b) Discharge to land
Dairy shed effluent
Currently, many industries in the Waikato region are using land for waste water disposal. Most
of these industries still use surface water for waste discharge during part of the year. One of
the major waste water generators in the Waikato region is the dairy industry. There are more
than 6000 dairy farms with an average herd size of 185 cows and 10 dairy factories in the
Waikato region. More than 4000 of these farms had been disposing treated effluent into
waterways until the 1990s. The treatment systems comprise either a barrier ditch or oxidation
pond system. Approximately two-thirds of the 4000 farms described previously have oxidation
pond systems. These systems have been constructed and maintained according to Ministry of
Agriculture and Fisheries specifications (Ministry of Agriculture and Fisheries, 1991).
Although these systems are capable of reducing total-N in dairy shed effluent by 75%, the
discharge from these systems is generally of poor quality (Taranaki Regional Council, 1990).
More than 50% of the N in the raw dairy shed effluent is urea-N. Removal of urea-N does not
require any treatment system since it can be hydrolysed and volatilised rapidly as ammonia gas
within 1-2 days. Thus the 75% removal of total-N attained by oxidation ponds is mainly due to
NH3 volatilisation. The N treatment efficiency of the ponds is only 50% of the residual N after
NH3 volatilisation loss of N.
Recently, there has been a substantial move towards land application of dairy shed effluent by
dairy farmers. Environment Waikato's transitional regional plan for dairy shed effluent
management has proposed land disposal of dairy shed effluent as a permitted activity (i.e. does
not require a resource consent). The proposal is currently being reviewed by Environment
Waikato after a hearing to consider submissions from the public and other organisations. The
current statistics indicate that many dairy farmers are changing from pond systems to dairy
shed effluent irrigation systems. Among the 5571 dairy farms surveyed in the 1992-1993
season in the Waikato region, 33.2% of the farms were disposing dairy shed effluent onto land.
This was a 16.3% increase from the 1991-1992 survey conducted on 5427 dairy farms where
29.3% of the farms used land based disposal. The 1993-1994 season survey currently in
progress shows that among the 2474 farms surveyed to date, 37.5% are using a land based
disposal system. Future projected dairy shed effluent disposal to land is much higher and within
the next 3 seasons it is anticipated that more than 50% of dairy farms in the Waikato region
will use a land based disposal system.
Although the land application of dairy shed effluent will be a permitted activity, careful
consideration has been given to hydraulic and N loading of the effluent applied onto land. A
recommendation for N loading (100 kg ha y-1) for a well established clover based pasture has
been determined using a rigorous N budget for a typical dairy farm in the Waikato region
(Selvarajah, 1993b). The N loading is currently under review by Environment Waikato's
Hearings Committee. Once the decision is made, a specific N loading rate will be approved as
part of the condition for land application of dairy shed effluent. However, considering the
relatively small volume of 'waste' water generated, coupled with the large land area available
at most dairy farms, the N loading due to dairy shed effluent land application will be minor
compared to most industrial waste loading onto land.
Industrial waste
In an attempt to save waterways from excessive nutrient loading and depleted dissolved oxygen
levels caused former catchment authorities to grant very lenient hydraulic and nutrient loading
rates for land application of waste. Industrial wastes can vary substantially in the composition
and concentration of N. Characteristics of these wastes have been well documented (Hart and

Selvarajah, N., Maggs, G.R., Crush, J.R. and Ledgard, S.F. 1994. Nitrate in ground water in the Waikato region. In The Efficient Use of
Fertilizers in a Changing Environment: Reconciling productivity with sustainability. (Eds. L D Currie and P Loganathan). Occasional Report No. 7. Fertilizer and Lime Research Centre, Massey University, Palmerston North, pp 160-185.
Speir, 1992). The rationale for land application of a waste was often based on engineering
principles, hence the main objective was to avoid surface runoff of irrigated waste water into
drains or streams. Well drained soils have often been preferred over poorly drained
counterparts to achieve rapid infiltration of waste water. Waste water irrigation is often
performed regardless of wet weather conditions. Most of these waste waters contain a high
level of N. Consequently, the nutrient loading problem has been gradually shifted from surface
water to ground water resources.
Case study - Point source
Land application of dairy factory waste water in the Hamilton Basin has been taken here as an
example of the effect of high N waste loading (and high volume) on the receiving environment.
The dairy factory waste water disposal operation involves several dairy farms. Only one farm
has been considered for the current discussion. The farm size is 140 ha with a herd of 300. The
soil is predominantly Horotiu sandy loam, although some parts of the farm have Te Kowhai
silt loam. Pasture comprises ryegrass with little or no clover. A fixed sprinkler irrigation system
was installed in 1968, with an initial disposal area of 56 ha. This irrigation area has been used
extensively since 1969. The irrigation system was replaced in the early 1980s and 110 ha of
the 140 ha area is now used for irrigation. Irrigation is carried out soon after the grazing is
completed.
The waste water characteristics are given in Table 2. Average annual loading of N applied is
1200 kg ha-1. The waste water disposal operation holds a current consent, first issued by the
Waikato Valley Authority in 1978 which has been reviewed twice and will expire in 1997. The
consent holder is authorised to discharge waste water up to 2700 m3 d-1 over any 20 day period.
Special conditions attached to this consent require the system to be operated in accordance with
a waste management plan. The consent holder is required to provide Environment Waikato
with irrigation records (including whey equivalents and total-N data) and NO3-N and NH4-N
levels for a network of shallow piezometers located beneath and adjacent to the disposal area.
Nitrate-N data are available for the Mangaone Stream adjacent to the farm at sites upstream
and downstream of the disposal area.
Table 2. Waste water characteristics for a selected 2 ha paddock at the effluent disposal site
(1985-1993).
Irrigation Season Hydraulic loading (mm) NO3-N (mg L-1) Total-N (mg L-1)
1985/86 582 * *
1986/87 565 * *
1987/88 434 16 261
1988/89 453 42 300
1989/90 550 51 267
1990/91 459 52 247
1991/92 502 49 222
1992/93 522 67 215
* missing value
Selvarajah, N., Maggs, G.R., Crush, J.R. and Ledgard, S.F. 1994. Nitrate in ground water in the Waikato region. In The Efficient Use of
Fertilizers in a Changing Environment: Reconciling productivity with sustainability. (Eds. L D Currie and P Loganathan). Occasional Report No. 7. Fertilizer and Lime Research Centre, Massey University, Palmerston North, pp 160-185.
Ground water NO3-N and ground water levels have been monitored on an approximate monthly
basis at 18 piezometers. Continuous data are available for only 4 piezometers for the period
June 1982 to January 1994. However, a continuous record has been synthesised at a further 4
piezometers using simple linear regression to estimate values for the missing record (about
10% of the complete record). Figure 6 shows mean water levels and ground water NO3-N levels
for the 8 piezometers. The total-N data include 64 values estimated from the very strong
relationship (r = 0.97; P<0.01) between whey equivalents and total-N. Monthly net recharge of
ground water has been estimated as in equation [2].
R = (I + P) – ET [2];
where R is net recharge of ground water (or net hydraulic loading) (mm);
I is waste water irrigation (mm);
P is precipitation (mm); and
ET is potential evapotranspiration1 for the Hamilton Basin (mm).
1 As site specific evapotranspiration data are not readily available and because annual variations in monthly
evapotranspiration data have a negligible effect on the recharge estimate, long-term (normal) evapotranspiration
data were estimated using raised pan evaporation estimates at Ruakura, Hamilton. Pan evaporation data have been
reduced by a factor of 0.73 (Finkelstein, 1973).
The N in the waste water comprises mainly organic-N and NO3-N (Table 2). Nitrate-N is
derived from nitric acid (HNO3) used in the cleaning process. Approximately 40 t y-1 of
elemental-N is contributed by the use of HNO3. The amount of NO3-N present in the waste
water reached a peak in the 1992/93 season.
Effect on ground water quality
Ground water NO3-N levels have increased markedly during the last decade under grazed
pasture applied with dairy factory waste water. There has been a steady increase in ground
water NO3-N levels since detailed monitoring commenced. Within 3 seasons of waste water
application, NO3-N increased 4 fold, from approximately 10 to 40 mg L-1. The ground water
NO3-N levels attained a peak of approximately 70 mg L-1 following the 1990/91 season (Figure
6).
There is no obvious seasonal pattern during the steady increase of ground water NO3-N until
the 1987/88 season. Since the 1987/88 season, ground water NO3-N has followed a seasonal
cycle of NO3-N build-up and decrease. Peak NO3-N levels are usually attained early (February-
March) in a calendar year. The annual N loading does not appear to have a direct influence on
either the peak NO3-N levels (r = 0.09; not significant) in ground water or average NO3-N
levels during an irrigation season (r = 0.18; not significant). For example, a high total-N loading
(155.1 t y-1) during the 1988/89 season corresponds with a NO3-N peak of 58 mg NO3-N L-1.
In contrast, the 1990/91 season had a loading of 127.3 t total-N y-1 and attained a peak of 68
mg NO3-N L-1.
There is an approximate 5 month lag between ground water NO3-N concentration and ground
water levels beneath the effluent disposal site. It may be inferred that large increases in NO3-
N levels are related to peak hydraulic loading rates (e.g. 218 mm net rainfall and 29 mm
irrigation during August 1990) and supply of total-N. For example, at this site, Barnett and

Selvarajah, N., Maggs, G.R., Crush, J.R. and Ledgard, S.F. 1994. Nitrate in ground water in the Waikato region. In The Efficient Use of
Fertilizers in a Changing Environment: Reconciling productivity with sustainability. (Eds. L D Currie and P Loganathan). Occasional Report No. 7. Fertilizer and Lime Research Centre, Massey University, Palmerston North, pp 160-185.
Parkin (1985) report NO3-N levels above 400 mg L-1 in soil water at 30 cm depth in the Horotiu
sandy loam. At this depth in the soil profile, peak NO3-N levels typically occur from February
to April. Nitrate-N levels in ground water decline very rapidly corresponding with the end of
each irrigation season (June/July) because of moderate to large net rainfall occurring during
this period. Sharp reductions in ground water NO3-N may be due principally to dilution,
corresponding with rising ground water levels and increasing NO3-N in the adjacent stream.
Ground water denitrification may also contribute towards NO3-N loss from the system.
Beyond the boundaries of the effluent disposal site several monitoring sites (including water
supply wells) have increased from background levels (e.g. < 0.5 mg NO3-N L-1 in 1982) to >
40 mg NO3-N L-1 in 1994. Furthermore, at the boundary of the disposal site, 3 piezometers not
used in Figure 6 had NO3-N concentrations of 63, 68, and 77 mg L-1 respectively in December
1993.
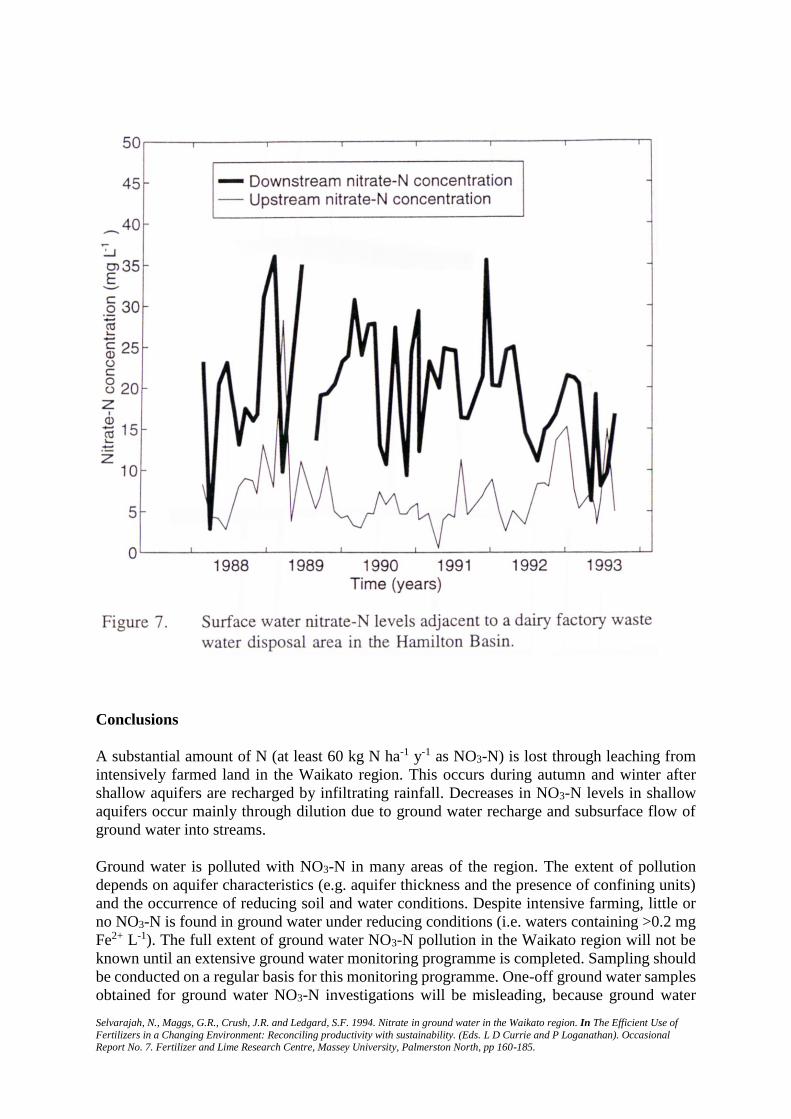
Effect on water quality of the Mangaone Stream
In most cases ground water provides base flow for rivers and streams in the Waikato region
(approximately 3000 m3 ha-1 y-1 in the Hamilton Basin). Dairy factory waste water applied onto
pasture has significantly increased NO3-N levels in the adjacent stream through ground water
outflow (Figure 7). On average, downstream NO3-N levels increased to > 20 mg L-1 from an
already polluted level upstream of > 7 mg L-1 (an increase of 185%). An estimated 13 tonnes
ground water NO3-N enters the stream adjacent to the waste water disposal farm every year.
This is a conservative estimate based on stream flow upstream of the disposal site and the
estimate does not consider ground water outflow from the disposal site. The increase of NO3-
N downstream generally follows an annual bimodal pattern. Peaks during summer/autumn
correspond with periods where ground water contributes a large proportion of stream flow, and
peaks during winter correspond with peak ground water NO3-N levels.
Nitrogen management
The consent holder has been making efforts to reduce N loading through better N recovery and
reduction of HN03 use in the factory. Consequently, total-N in the waste water has been reduced
over recent years (e.g. Table 2; Figure 6). Ideally, the use of HNO3 should be avoided
completely. Alternative chemicals such as phosphoric or sulphuric acid should be considered.
However, the environmental impact of these alternative chemicals should not be overlooked
(e.g. P accumulation and SO4 leaching).
It must be emphasised that a high N loading onto grazed pasture requires careful N balancing.
The amount of N removed through milk production is small compared to the large total-N flow
in the system (e.g. at a stocking rate of 2.7 cows ha-1 and milk protein production of 350 kg ha-
1 the approximate annual N removal will be 60 kg N ha-1). With an average N application rate
of 1200 kg N ha-1 y-1, this will be only 5% of the N applied onto land. A considerable amount
of applied-N can be lost through denitrification, due to high hydraulic loading combined with
waste water enriched with carbonaceous materials. Under these conditions, maximum
denitrification loss is unlikely to exceed 50% of applied-N. Denitrification losses of up to 30%
of applied-N have been recorded from meat processing effluent irrigation with a N loading of
about 1000 kg ha-1 y-1 (Russell and Cooper, 1992). Using a conservative denitrification loss of
up to 50% of applied-N, there will be at least 570 kg left as residual-N in the soil annually.
Thus it is not surprising that large amounts of NO3-N leach every year. It becomes clear that
the system is overloaded with applied-N, and N loading should be reduced substantially if NO3-
N leaching and ground water contamination are to be reduced.
Selvarajah, N., Maggs, G.R., Crush, J.R. and Ledgard, S.F. 1994. Nitrate in ground water in the Waikato region. In The Efficient Use of
Fertilizers in a Changing Environment: Reconciling productivity with sustainability. (Eds. L D Currie and P Loganathan). Occasional Report No. 7. Fertilizer and Lime Research Centre, Massey University, Palmerston North, pp 160-185.
Conclusions
A substantial amount of N (at least 60 kg N ha-1 y-1 as NO3-N) is lost through leaching from
intensively farmed land in the Waikato region. This occurs during autumn and winter after
shallow aquifers are recharged by infiltrating rainfall. Decreases in NO3-N levels in shallow
aquifers occur mainly through dilution due to ground water recharge and subsurface flow of
ground water into streams.
Ground water is polluted with NO3-N in many areas of the region. The extent of pollution
depends on aquifer characteristics (e.g. aquifer thickness and the presence of confining units)
and the occurrence of reducing soil and water conditions. Despite intensive farming, little or
no NO3-N is found in ground water under reducing conditions (i.e. waters containing >0.2 mg
Fe2+ L-1). The full extent of ground water NO3-N pollution in the Waikato region will not be
known until an extensive ground water monitoring programme is completed. Sampling should
be conducted on a regular basis for this monitoring programme. One-off ground water samples
obtained for ground water NO3-N investigations will be misleading, because ground water

Selvarajah, N., Maggs, G.R., Crush, J.R. and Ledgard, S.F. 1994. Nitrate in ground water in the Waikato region. In The Efficient Use of
Fertilizers in a Changing Environment: Reconciling productivity with sustainability. (Eds. L D Currie and P Loganathan). Occasional Report No. 7. Fertilizer and Lime Research Centre, Massey University, Palmerston North, pp 160-185.
NO3-N levels demonstrate significant temporal and spatial fluctuations. It is also recommended
that future work be directed at investigating the effects of soil and water reducing conditions
on ground water NO3-N levels.
Point sources can affect ground water quality adversely when applied-N is managed poorly
(e.g. from background levels of 0.5 mg L-1 (1982) to current levels of 30-70 mg L-1 (1994)). In
such cases ground water monitoring for NO3-N in shallow aquifers will not indicate the full
extent of NO3-N leaching and ground water contamination, because a substantial quantity of
leached NO3-N is continuously drained into streams (e.g. >13 t NO3-N y-1 are lost from one
waste water disposal site through subsurface flow of ground water into the Mangaone stream
in the Hamilton Basin). Any proposal to apply waste onto land requires careful consideration,
including the development of an appropriate N management strategy. This requirement is
necessary especially when nitrogenous waste is applied onto grazed pasture, where most
applied-N is recycled in the system and hence is available for NO3-N leaching.
References
ANZECC. 1992. National Water Quality Management Strategy. Australian water quality
guidelines for fresh and marine waters. Australian and New Zealand Environment and
Conservation Council.
Baber, H.L. 1978. A study of some nitrate and phosphate problems in New Zealand agriculture.
D. Phil. Thesis, University of Waikato, Hamilton.
Ball, P.R., Keeney, D.R., Theobald, P.W. and Nes, P. 1979. Nitrogen balance in urine-affected
areas of a New Zealand pasture. Agronomy Journal 71, 309-314.
Barkle, G., Singleton, P. and Roberts, A. 1993. Progress report on enhancing denitrification of
land based effluents. In Land application of farm wastes, N.Z. Land Treatment Collective,
Papers for Technical Session No. 9.
Barnett, J.W. and Parkin, M.F. 1985. Land disposal of dairy plant wastewater in New Zealand
- A case study. Presented at the Eighth Annual Madison Waste Conference, September 18-19,
1985, Department of Engineering Professional Development, University of Wisconsin-
Madison.
Behnke, J.J. and Haskell, E.E. 1968. Ground water nitrate distributions beneath Fresno,
California. Journal of American Waterworks Association 60, 447-480.
Bird, G.B. 1987: A study of the groundwater resources of the Tokoroa Region. Waikato Valley
Authority Technical Publication No. 47. Waikato Valley Authority, Hamilton, pp. 1-155.
Board of Health. 1989. Drinking water standards for New Zealand. A report prepared for the
Board of Health by the Department of Health. Department of Health, Wellington, pp. 1-49.
Brockman, J.S. 1969. The relationship between total N input and the yield of cutgrass. Journal
of the British Grassland Society 24, 89-96.
Burden, R.J. 1982. Nitrate contamination of New Zealand aquifers: a review. New Zealand
Journal of Science 42, 205-220.

Selvarajah, N., Maggs, G.R., Crush, J.R. and Ledgard, S.F. 1994. Nitrate in ground water in the Waikato region. In The Efficient Use of
Fertilizers in a Changing Environment: Reconciling productivity with sustainability. (Eds. L D Currie and P Loganathan). Occasional Report No. 7. Fertilizer and Lime Research Centre, Massey University, Palmerston North, pp 160-185.
Cameron, K.C. 1993. The impact of fertiliser use and other farming activities on ground water
quality. New Zealand Fertiliser Manufacturers' Research Association Conference, Dunedin,
November 1993 (in press).
Crush, J.R., Cosgrove, G.P. and Brougham, R.W. 1982. The effect of nitrogen fertiliser on
clover nitrogen fixation in an intensively grazed Manawatu pasture. New Zealand Journal of
Experimental Agriculture 10, 395-399.
Cuttle, S.P., Hallard, M., Daniel, G. and Scurlock, R.V. 1992. Nitrate leaching from sheep-
grazed grass/clover and fertilized grass pastures. Journal of Agricultural Science, Cambridge
119, 335-343.
Doak, B.W. 1952. Some chemical changes in the nitrogenous constituents of urine when voided
on pasture. Journal of Agricultural Science, Cambridge 42, 162-171.
Driscoll, F.G. (ed.), 1987. Groundwater and Wells. Johnson Division, St. Paul, Minnesota.
Field, T.R.O., Ball, P.R. and Theobald, P.W. 1985. Leaching of nitrate from sheep-grazed
pastures. Proceedings of the New Zealand Grassland Association 46, 209-214.
Finkelstein, J. 1973. Survey of New Zealand Tank Evaporation. Journal of Hydrology (NZ) 12,
119-131.
Foster, S.S.D., Cripps, A.C., Smith-Carrington, A. 1982. Nitrate leaching to groundwater.
Philosophical Transactions of the Royal Society, London 296, 477-489.
Garwood, E.A. and Ryden, J.C. 1986. Nitrate loss through leaching and surface runoff from
grassland: Effects of water supply, soil type and management. In Nitrogen Fluxes in Intensive
Grassland Systems. (H.G. van der Meer, J.C. Ryden and G.C. Ennik eds.) Martinus Nijhoff,
Dordrecht, pp. 99-113.
Hadfield, J.C. 1993. Groundwater chemistry of the Piako catchment, Hauraki Plains.
Environment Waikato Technical Report 1993/7. Environment Waikato, P O Box 4010,
Hamilton East. pp. 1-66.
Hall, D.W. 1992. Effects of nutrient management on nitrate levels in ground water near
Ephrata, Pennsylvania. Ground water 30, 720-730.
Hallberg, G.R. 1989. Nitrate in groundwater in the United States. In Nitrogen Management
and Groundwater Protection. (R.F. Follett ed.). Elsevier, Amsterdam, pp. 35-74.
Hart, P.B.S. and Speir, T.W. 1992. Agricultural and industrial effluents and wastes as fertilisers
and soil amendments in New Zealand. In The Use of Wastes and Byproducts as Fertilizers and
Soil Amendments for Pasture and Crops. (P.E.H. Gregg and L.D. Currie eds.) Occasional
Report 6, Fertilizer and Lime Research Centre, Massey University, Palmerston North, pp. 69-
90.
Hauck, R.D. 1984. Significance of nitrogen fertilizer microsite reactions in soil. In Nitrogen in
Crop Production (R.D. Hauck, ed.) American Society of Agronomy, Madison, Wisconsin,
U.S.A. pp. 507-519.

Selvarajah, N., Maggs, G.R., Crush, J.R. and Ledgard, S.F. 1994. Nitrate in ground water in the Waikato region. In The Efficient Use of
Fertilizers in a Changing Environment: Reconciling productivity with sustainability. (Eds. L D Currie and P Loganathan). Occasional Report No. 7. Fertilizer and Lime Research Centre, Massey University, Palmerston North, pp 160-185.
Hoare, R.A. 1986. Groundwater nitrate in the Hamilton Basin. Waikato Valley Authority
Technical Report 1986/16. Waikato Valley Authority, Hamilton, pp. 1-18.
Jarvis, S.C., Hatch, D.J., and Roberts, D.H. 1989. The effects of grassland management on
nitrogen losses from grazed swards through ammonia volatilisation; the relationship to excretal
N-returns from cattle. Journal of Agricultural Science, Cambridge 112, 205-216.
Jarvis, S.C. 1990. Nutrient flows and transfers. AFRC Institute of Grassland and Environmental
Research Report, pp. 48-56.
Johnson, C.J., Bonrud, P.A., Dosch, T.L. Kilness, A.W., Senger, K.A., Busch, D.C. and Meyer,
M.R. 1987. Fatal outcome of methemoglobinemia in an infant. Journal of American Medical
Association 257, 2796-2797.
Korom, S.F. 1992. Natural denitrification in the saturated zone: a review. Water Resources
Research 28, 1657-1668.
Ledgard, S.F., Brier, G.J. and Upsdell, M.P. 1990. Effect of clover cultivar on production and
nitrogen fixation in clover-ryegrass swards under dairy cow grazing. New Zealand Journal of
Agricultural Research 33, 243-249.
Ledgard, S.F. 1993. Nitrate contamination of ground and surface water in pastoral agriculture
in New Zealand. Proceedings of the International Meeting on Nitric-Acid-Based Fertilisers (in
press).
Marshall, T.W. 1986. Ground water chemistry characteristics of the Mangaonua-Mangaone
catchments. Waikato Valley Authority Technical Report No. 86/2. Waikato Valley Authority,
Hamilton, pp. 1-23.
Ministry of Agriculture and Fisheries. 1991. Effluent Disposal Manual. Prepared by Ministry
of Agriculture and Fisheries in association with Waikato Regional Council. Waikato Regional
Council, P O Box 4010, Hamilton East. pp. 1-27.
Nannipieri, P., Ciardi, C., Palazzi, T. and Badalucco, L. 1990. Short-term nitrogen reactions
following the addition of urea to grass-legume association. Soil Biology and Biochemistry 22,
549-553.
Okereke, G.U. and Meints, V.W. 1985. Immediate immobilization of labelled ammonium
sulfate and urea nitrogen in soils. Soil Science 140, 105-109.
Postma, D. and Boesen, C. 1991. Nitrate reduction in an unconfined sandy aquifer: water
chemistry, reduction processes and geochemical modeling. Water Resources Research 27,
2027-2045.
Quin, B.F. 1982. The influence of grazing animals on nitrogen balances. In Nitrogen Balances
in New Zealand Ecosystems. (P.W. Gandar ed.) DSIR, Palmerston North, pp. 95-102.
Recous, S., Fresneau, C., Faurie, G. and Mary, B. 1988. The fate of labelled "N urea and
ammonium nitrate applied to winter wheat crop. I. Nitrogen transformation in the soil. Plant
and Soil 112, 205-214.

Selvarajah, N., Maggs, G.R., Crush, J.R. and Ledgard, S.F. 1994. Nitrate in ground water in the Waikato region. In The Efficient Use of
Fertilizers in a Changing Environment: Reconciling productivity with sustainability. (Eds. L D Currie and P Loganathan). Occasional Report No. 7. Fertilizer and Lime Research Centre, Massey University, Palmerston North, pp 160-185.
Ringham, K.L., Cochrane, P.R. and Petch, R.A. 1990: Ground water chemistry of the Northern
Waikato District. Waikato Regional Council Technical Report 1990/5. Waikato Regional
Council, Hamilton, pp. 1-73.
Russell, J.M. and Cooper, R.N. 1992. The use of meat processing effluents for irrigation of
pasture. In Use of Wastes and Byproducts as Fertilizers and Soil Amendments for Pasture and
Crops. (P.E.H. Gregg and L.D. Currie eds.) Occasional Report 6, Fertilizer and Lime Research
Centre, Massey University, Palmerston North, pp. 208-213.
Ruz-Jerez, B.E. 1991. Dynamics of nitrogen in three contrasting pastures grazed by sheep. PhD
Thesis, Massey University, Palmerston North, New Zealand.
Ryden, J.C. 1984. The flow of nitrogen in grassland. Proceedings of the Fertiliser Society 229,
1-44.
Sarathchandra, S.U. 1978. Nitrification activities of some New Zealand soils and the effect of
some clay types on nitrification. New Zealand Journal of Agricultural Research 21, 615-621.
Selvarajah, N. 1993a. Ground water chemistry - Coromandel Peninsula. Unpublished Internal
Memorandum, Environment Waikato, 15 June 1993, File 22 05 50. Copy held Environment
Waikato files, Hamilton.
Selvarajah, N. 1993b. Nitrogen loading rate for dairy pasture system in the Waikato region. In
Proposed changes to Environment Waikato's Transitional Regional Plan - 1 Dairy shed
effluent. Staff report to Council on submissions. Environment Waikato, P O Box 4010,
Hamilton East. pp. 1-156.
Sherwood, A.M. 1972. Sedimentary structures, texture, and Paleo-environment of the Hinuera
formation. B. Phil. Thesis, University of Waikato, Hamilton.
Sinton, L.W. 1984. Groundwater contamination in New Zealand. New Zealand Environment
42, 21-25.
Smith, C.M., Wilcock, R.J., Vant, W.N., Smith, D.G. and Cooper, A.B. 1993. Towards
sustainable agriculture: freshwater quality in New Zealand and the influence of agriculture.
MAJF Policy Technical Report 93/10. pp. 1-208.
Steele, K.W. 1982. Nitrogen in grassland soils. In Nitrogen fertilisers in New Zealand
agriculture (P.B. Lynch ed.) New Zealand Institute of Agricultural Science, pp. 29-444.
Steele, K.W., Judd, M.J. and Shannon, P.W. 1984. Leaching of nitrate and other nutrients from
a grazed pasture. New Zealand Journal of Agricultural Research 27, 5-11.
Taranaki Regional Council, 1990. Review of monitoring and inspectorial procedures for dairy
shed oxidation pond waste treatment systems. Taranaki Regional Council Technical Report 90-
42. Taranaki Regional Council, Private Bag, Stratford, pp. 1-59.
Trudell, M.R., Gillham, R.W. and Cherry, J.A. 1986. An in-situ study of the occurrence and
rate of denitrification in a shallow unconfined sand aquifer. Journal of Hydrology 83, 251-268.
Selvarajah, N., Maggs, G.R., Crush, J.R. and Ledgard, S.F. 1994. Nitrate in ground water in the Waikato region. In The Efficient Use of
Fertilizers in a Changing Environment: Reconciling productivity with sustainability. (Eds. L D Currie and P Loganathan). Occasional Report No. 7. Fertilizer and Lime Research Centre, Massey University, Palmerston North, pp 160-185.
Walker, T.W. 1956. The nitrogen cycle in grassland soils. Journal of the Science of Food and
Agriculture 7, 66-72.
Weisenburger, D.D. 1991. Potential health consequences of ground-water contamination by
nitrates in Nebraska. In Nitrate Contamination (I. Bogardi and R.D. Kuzelka eds.) NATO ASI
Series. VolG30, Springer-Verlag, Berlin, Heidelberg, pp. 309-315.
Wickramasinghe, K.N., Rodgers, G.A. and Jenkinson, D.S. 1985. Transformations of nitrogen
fertilizers in soil. Soil Biology and Biochemistry 17, 625-630.
Selvarajah, N., Maggs, G.R., Crush, J.R. and Ledgard, S.F. 1994. Nitrate in ground water in the Waikato region. In The Efficient Use of
Fertilizers in a Changing Environment: Reconciling productivity with sustainability. (Eds. L D Currie and P Loganathan). Occasional Report No. 7. Fertilizer and Lime Research Centre, Massey University, Palmerston North, pp 160-185.