Cumulative Effects of Septic System Disposal and Evolution of Nitrate Contamination Impact on...
12
ISSN: 0975-8585 October - December 2013 RJPBCS Volume 4 Issue 4 Page No. 1207 Research Journal of Pharmaceutical, Biological and Chemical Sciences Cumulative Effects of Septic System Disposal and Evolution of Nitrate Contamination Impact on Coastal Groundwater in Tuticorin, South Tamilnadu, India. S Selvam*, G Manimaran, and P Sivasubramanian Department of Geology, VO Chidambaram College, Tuticorin, Tamilnadu, India. ABSTRACT The objective of our study is to investigate the nitrate pollution vulnerability of groundwater aquifers in the coastal regions of Tuticorin Corporation, South Tamil Nadu, India. In the last few decades nitrate concentrations in groundwater have increased dramatically. Groundwater contamination by nitrate (NO 3 ) is a global problem and is most often associated with leachates derived from fertilizers and animal or human wastes. Twenty groundwater samples were analyzed form the study area. The water quality parameters were investigated for summer (May, 2010) and winter (December, 2010) seasons and were compared with the standard values given by WHO and ICMR. The hydro-chemical analysis of these water samples reveals that 12 samples exceeding the permissible limit of WHO (50mg/l) which is due to the use of improper disposal of sewage and nitrogenous fertilizers in the study area. Linear Trent Analysis on seasonal and annual basis clearly depicted that nitrate pollution in the study area is increasing significantly. Keywords: Nitrate, Human wastes, Linear Trent Analysis, Tuticorin Corporation, ICMR *Corresponding author
Transcript of Cumulative Effects of Septic System Disposal and Evolution of Nitrate Contamination Impact on...
ISSN: 0975-8585
October - December 2013 RJPBCS Volume 4 Issue 4 Page No. 1207
Research Journal of Pharmaceutical, Biological and Chemical
Sciences
Cumulative Effects of Septic System Disposal and Evolution of Nitrate Contamination Impact on Coastal Groundwater in Tuticorin, South
Tamilnadu, India.
S Selvam*, G Manimaran, and P Sivasubramanian
Department of Geology, VO Chidambaram College, Tuticorin, Tamilnadu, India.
ABSTRACT
The objective of our study is to investigate the nitrate pollution vulnerability of groundwater aquifers in the coastal regions of Tuticorin Corporation, South Tamil Nadu, India. In the last few decades nitrate concentrations in groundwater have increased dramatically. Groundwater contamination by nitrate (NO3) is a global problem and is most often associated with leachates derived from fertilizers and animal or human wastes. Twenty groundwater samples were analyzed form the study area. The water quality parameters were investigated for summer (May, 2010) and winter (December, 2010) seasons and were compared with the standard values given by WHO and ICMR. The hydro-chemical analysis of these water samples reveals that 12 samples exceeding the permissible limit of WHO (50mg/l) which is due to the use of improper disposal of sewage and nitrogenous fertilizers in the study area. Linear Trent Analysis on seasonal and annual basis clearly depicted that nitrate pollution in the study area is increasing significantly. Keywords: Nitrate, Human wastes, Linear Trent Analysis, Tuticorin Corporation, ICMR
*Corresponding author

ISSN: 0975-8585
October - December 2013 RJPBCS Volume 4 Issue 4 Page No. 1208
INTRODUCTION Septic systems, also known as “on-site wastewater treatment systems,” are widely
used in rural and suburban settings to dispose of wastewater. When operating properly, septic systems remove many pollutants and provide some measure of protection for human health and for the environment. But as rural populations grow and aquifers exhaust their ability to dilute wastes from ever-increasing numbers of septic tanks, water quality steadily deteriorates. Most state and local governments have regulations designed to protect public health from the worst contaminants from septic systems: water-borne pathogens and nitrates. But very few governments have created effective measures to address the increasing threat that septic tanks pose to the ecosystems of rivers and lakes. Many countries all over the world depend entirely on groundwater resources for various uses [1-5]. However, the population growth and the increase in demand for water and food supplies place an increasing stress on the groundwater quantity and quality where over-abstraction depletes the available quantity of groundwater. In addition, the increase in demand for food supplies may lead to groundwater contamination by nitrate since the major contributor to nitrate contamination in groundwater is the use of nitrogen-based fertilizers associated with cropping activities [6-8]. Elevated nitrate concentration in drinking water can cause health risk to humans, especially so to sensitive groups and infants. The consumption of waters with high concentrations decreases the oxygen capacity of blood [9-10]. Nitrate is transformed into nitrite in the digestive system, which causes methaemoglobinaemia. Infants and unborn babies are particularity at risk because of their low gastric acidity and undeveloped enzymatic system [11]. Epidemiological studies have provided suggestive evidence relating dietary nitrate exposure to cancer, especially gastric cancer. It must be recognized that many factors in addition to environmental nitrate exposure may be involved [12]. The EU drinking water standard maximum admissible limit for nitrates is 50 mg l-1 [13-14]. Source of groundwater contamination by nitrate can be classified into point and non-point sources. Non-point sources of nitrogen include fertilizers, manure application, leguminous crops, irrigation return-flow and dry deposition. Nitrates in groundwater can come from natural sources such as soil, bedrock and organic material; however, the overwhelming loading of nitrates originates from anthropogenic sources, particularly agricultural practices and residential septic systems[3]. Point source contamination such as septic tank system is also the major source of nitrate pollution. Nitrogen applied through fertilizer or manure is converted to plant available nitrate by bacteria living in the soil [15-16]. The growing plants uptake part of this nitrate. The nitrate that is not taken up by the crops, immobilized by bacteria into soil organic matter or converted to atmospheric gases by denitrification can leach from the root zone and possibly end up in groundwater [17-18]. Nitrogen-based fertilizers used on a soil have a high potential to cause nitrate to leach to groundwater when compared to clay soil. Water moves rapidly through sandy or other coarse-textured soils [19-21]. The negative charge on the clay particles retains ammonium ions which prevents ammonia from leaching. Nitrate ions are negatively charged and are not retained by the clay particles. For the present study, we have selected Tuticorin coastal aquifer where both over-pumping and high-density population major water quality and quality problems. The objective of this study is to provide an overview of the current condition of groundwater of Tuticorin with respect to

ISSN: 0975-8585
October - December 2013 RJPBCS Volume 4 Issue 4 Page No. 1209
nitrate contamination and to evaluate the potential for ongoing problem of nitrate contamination. Study Area
Tuticorin is located on the southeast coat of Tamilnadu, India. Historically, Tuticorin
is famous for its maritime activity and pearl culture. It was the seaport of the Pandyan kingdom; it was later taken over by the Portuguese in 1548, captured by the Dutch in 1658, and ceded to the British in 1825. The lighthouse built in 1842 marked the beginning of the history of harbour development in the city. Tuticorin was established as a Municipality in 1866. It attained the status of Corporation on 5th August, 2008 after 142 years. The city was industrially developed after the port construction and became district head quarters in the year 1986.
Fig: 1 Location map of the nitrate sample area After the formation of the district head quarters, the economic development was
boosted and began to develop rapidly. Therefore, the urban expansion takes place in the
ISSN: 0975-8585
October - December 2013 RJPBCS Volume 4 Issue 4 Page No. 1210
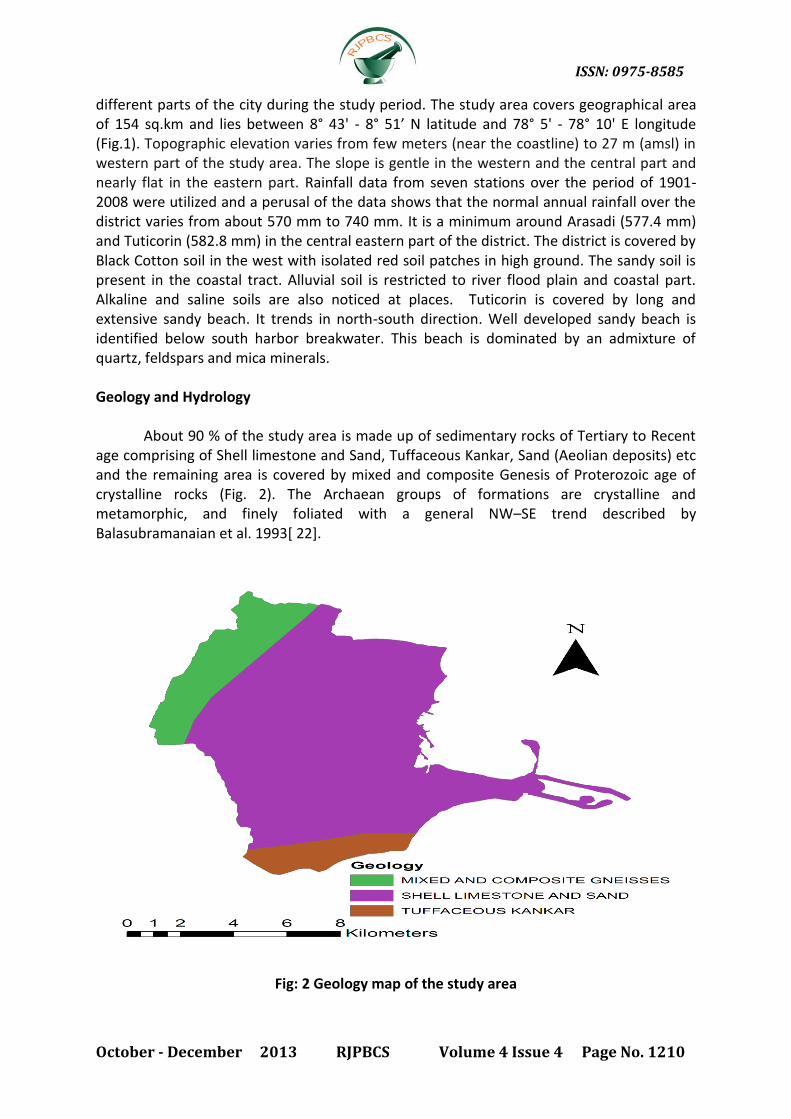
different parts of the city during the study period. The study area covers geographical area of 154 sq.km and lies between 8° 43' - 8° 51’ N latitude and 78° 5' - 78° 10' E longitude (Fig.1). Topographic elevation varies from few meters (near the coastline) to 27 m (amsl) in western part of the study area. The slope is gentle in the western and the central part and nearly flat in the eastern part. Rainfall data from seven stations over the period of 1901- 2008 were utilized and a perusal of the data shows that the normal annual rainfall over the district varies from about 570 mm to 740 mm. It is a minimum around Arasadi (577.4 mm) and Tuticorin (582.8 mm) in the central eastern part of the district. The district is covered by Black Cotton soil in the west with isolated red soil patches in high ground. The sandy soil is present in the coastal tract. Alluvial soil is restricted to river flood plain and coastal part. Alkaline and saline soils are also noticed at places. Tuticorin is covered by long and extensive sandy beach. It trends in north-south direction. Well developed sandy beach is identified below south harbor breakwater. This beach is dominated by an admixture of quartz, feldspars and mica minerals. Geology and Hydrology About 90 % of the study area is made up of sedimentary rocks of Tertiary to Recent age comprising of Shell limestone and Sand, Tuffaceous Kankar, Sand (Aeolian deposits) etc and the remaining area is covered by mixed and composite Genesis of Proterozoic age of crystalline rocks (Fig. 2). The Archaean groups of formations are crystalline and metamorphic, and finely foliated with a general NW–SE trend described by Balasubramanaian et al. 1993[ 22].
Fig: 2 Geology map of the study area
ISSN: 0975-8585
October - December 2013 RJPBCS Volume 4 Issue 4 Page No. 1211
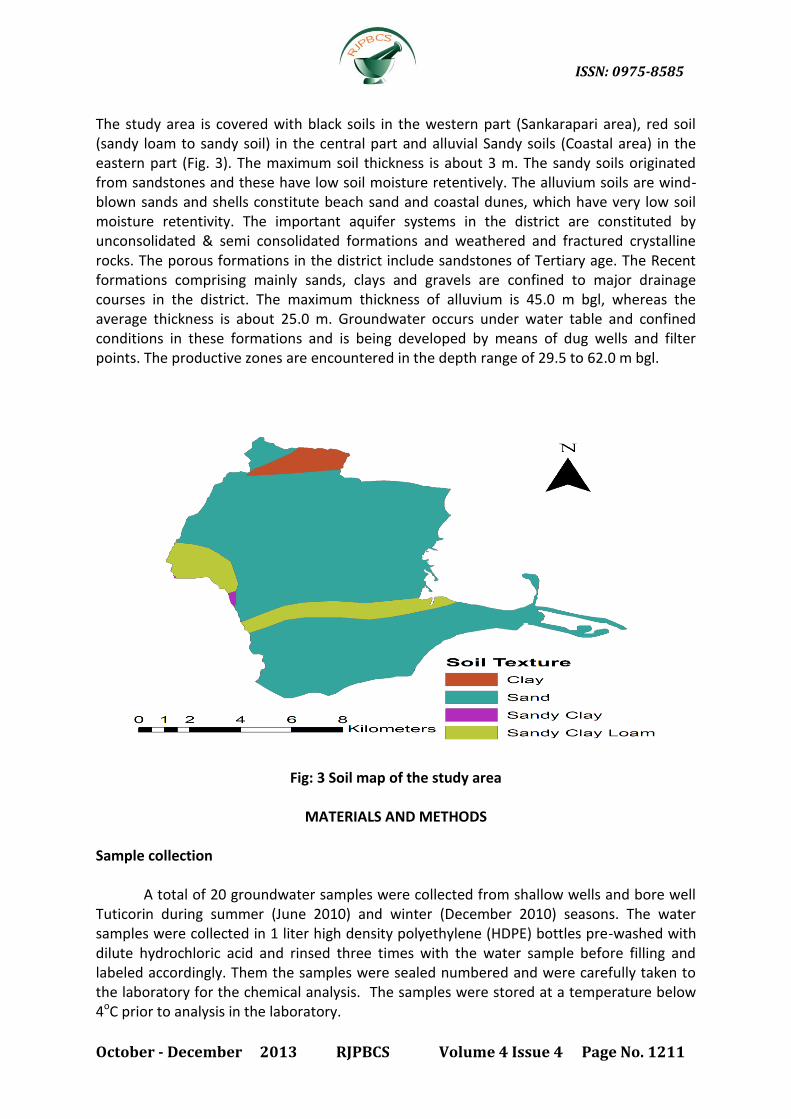
The study area is covered with black soils in the western part (Sankarapari area), red soil (sandy loam to sandy soil) in the central part and alluvial Sandy soils (Coastal area) in the eastern part (Fig. 3). The maximum soil thickness is about 3 m. The sandy soils originated from sandstones and these have low soil moisture retentively. The alluvium soils are wind-blown sands and shells constitute beach sand and coastal dunes, which have very low soil moisture retentivity. The important aquifer systems in the district are constituted by unconsolidated & semi consolidated formations and weathered and fractured crystalline rocks. The porous formations in the district include sandstones of Tertiary age. The Recent formations comprising mainly sands, clays and gravels are confined to major drainage courses in the district. The maximum thickness of alluvium is 45.0 m bgl, whereas the average thickness is about 25.0 m. Groundwater occurs under water table and confined conditions in these formations and is being developed by means of dug wells and filter points. The productive zones are encountered in the depth range of 29.5 to 62.0 m bgl.
Fig: 3 Soil map of the study area
MATERIALS AND METHODS
Sample collection
A total of 20 groundwater samples were collected from shallow wells and bore well Tuticorin during summer (June 2010) and winter (December 2010) seasons. The water samples were collected in 1 liter high density polyethylene (HDPE) bottles pre-washed with dilute hydrochloric acid and rinsed three times with the water sample before filling and labeled accordingly. Them the samples were sealed numbered and were carefully taken to the laboratory for the chemical analysis. The samples were stored at a temperature below 4oC prior to analysis in the laboratory.
ISSN: 0975-8585
October - December 2013 RJPBCS Volume 4 Issue 4 Page No. 1212
Laboratory measurements
Samples were analyzed in the laboratory for the physico-chemical attributes like pH, electrical conductivity (EC), total hardness (TH), total dissolved solids (TDS) and major cations like calcium(Ca), magnesium(Mg), sodium(Na), potassium(K), and anions like bicarbonate(HCO3), carbonate(CO3), chloride(Cl), nitrate(NO3), and sulfate (SO4),phosphate (PO4) in the laboratory using the standard methods given by the American Public Health Association (APHA 1995). These parameters are tabulated in Table 2. pH, EC and TDS were measured using portable water quality analyzers. Major cations (Ca, Mg, Na, and K) were determined using ICP-Mass Spectrometer while the anions were determined as follows: bicarbonate (HCO3), and Total hardness (TH) were analyzed by volumetric method and sulphate (SO4) was estimated by the spectrophotometeric technique. Chloride (Cl) by volumetric titration using AgNO3 and K2Cr, HCO3 and carbonate (CO3) was determined by Portamess using HCl, phenolphthalein, methyl orange by titration method. Fluoride was estimated by using an ion-selective electrode (ISE) with a pH/ISE meter (Orion 4-Star meter). Nitrate concentrations were analyses by Na- Salicylic method with a UV-VIS Spectrophotometer method (APHA, AWWA, WPCF 1998). All concentrations are expressed in milligrams per liter (mg/l), except pH and EC. The results were evaluated in accordance with the drinking water quality standards given by the World Health Organization (WHO 2004).
RESULTS AND DISCUSSION
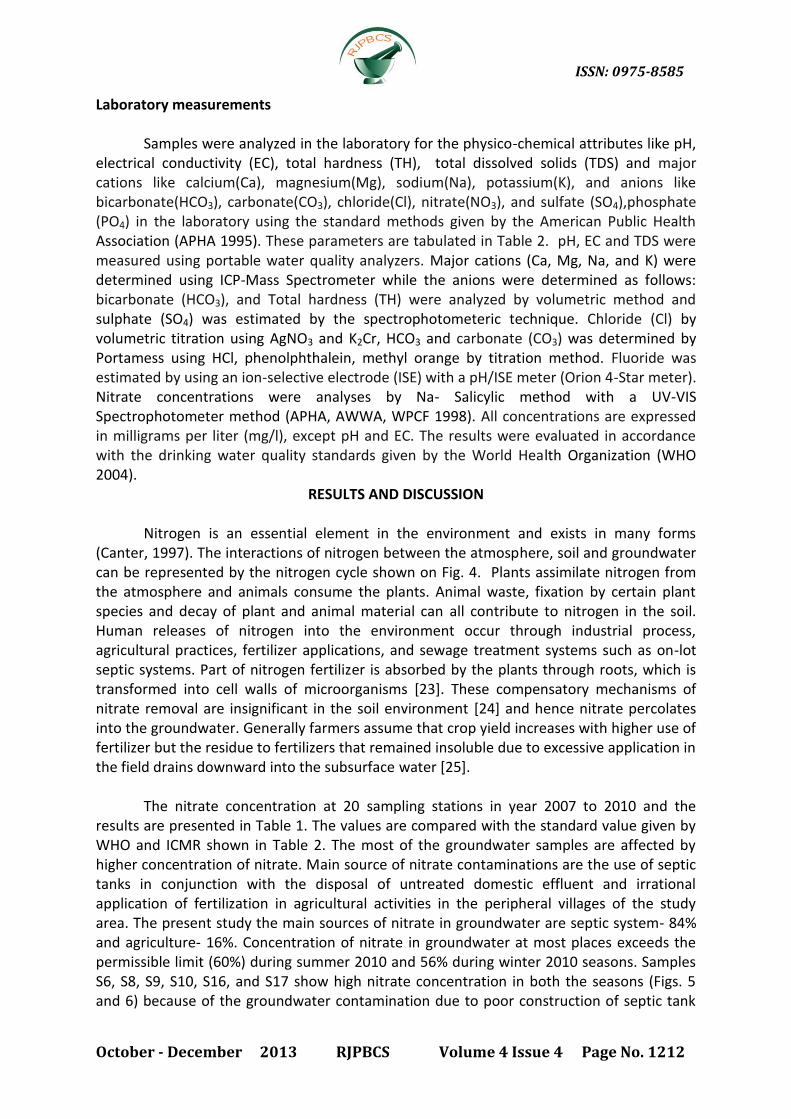
Nitrogen is an essential element in the environment and exists in many forms (Canter, 1997). The interactions of nitrogen between the atmosphere, soil and groundwater can be represented by the nitrogen cycle shown on Fig. 4. Plants assimilate nitrogen from the atmosphere and animals consume the plants. Animal waste, fixation by certain plant species and decay of plant and animal material can all contribute to nitrogen in the soil. Human releases of nitrogen into the environment occur through industrial process, agricultural practices, fertilizer applications, and sewage treatment systems such as on-lot septic systems. Part of nitrogen fertilizer is absorbed by the plants through roots, which is transformed into cell walls of microorganisms [23]. These compensatory mechanisms of nitrate removal are insignificant in the soil environment [24] and hence nitrate percolates into the groundwater. Generally farmers assume that crop yield increases with higher use of fertilizer but the residue to fertilizers that remained insoluble due to excessive application in the field drains downward into the subsurface water [25].
The nitrate concentration at 20 sampling stations in year 2007 to 2010 and the results are presented in Table 1. The values are compared with the standard value given by WHO and ICMR shown in Table 2. The most of the groundwater samples are affected by higher concentration of nitrate. Main source of nitrate contaminations are the use of septic tanks in conjunction with the disposal of untreated domestic effluent and irrational application of fertilization in agricultural activities in the peripheral villages of the study area. The present study the main sources of nitrate in groundwater are septic system- 84% and agriculture- 16%. Concentration of nitrate in groundwater at most places exceeds the permissible limit (60%) during summer 2010 and 56% during winter 2010 seasons. Samples S6, S8, S9, S10, S16, and S17 show high nitrate concentration in both the seasons (Figs. 5 and 6) because of the groundwater contamination due to poor construction of septic tank
ISSN: 0975-8585
October - December 2013 RJPBCS Volume 4 Issue 4 Page No. 1213
system and the absence of central municipal sewage-treatment system. Concentration of Nitrate was found decreased during December-2010 indicating the dilution by rain water in the study area.
Fig: 4 Nitrogen cycle
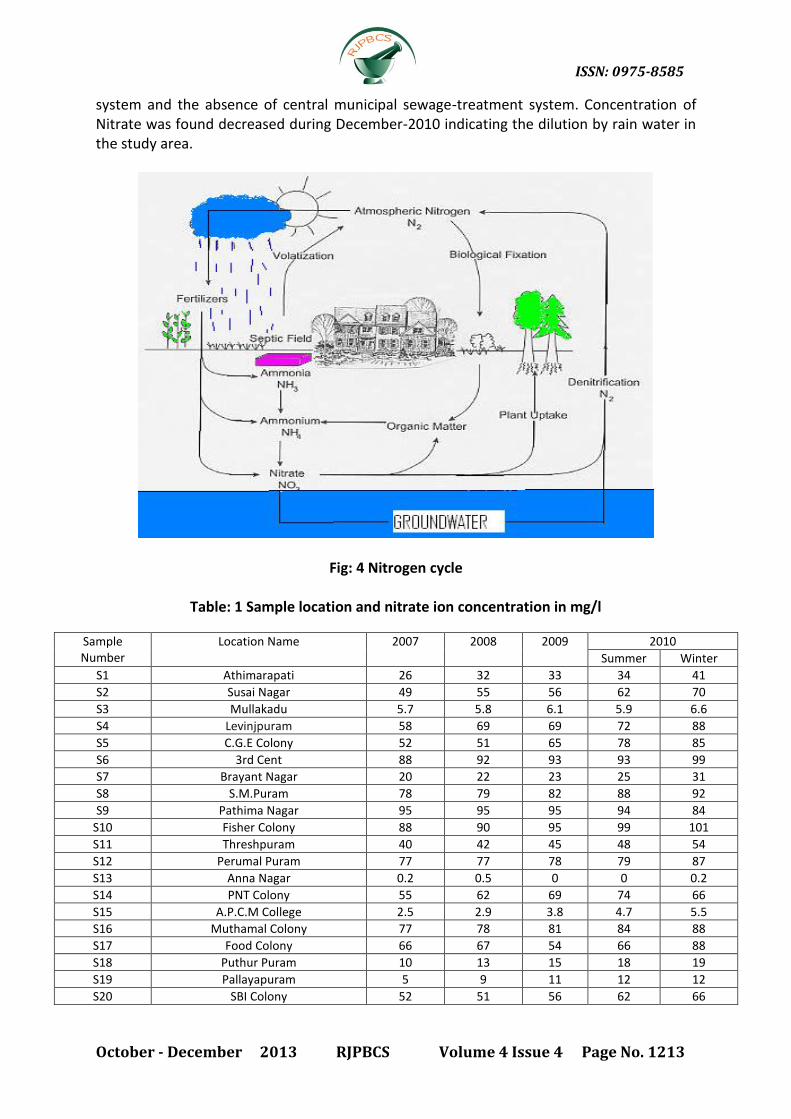
Table: 1 Sample location and nitrate ion concentration in mg/l
Sample Number
Location Name 2007 2008 2009 2010
Summer Winter
S1 Athimarapati 26 32 33 34 41
S2 Susai Nagar 49 55 56 62 70
S3 Mullakadu 5.7 5.8 6.1 5.9 6.6
S4 Levinjpuram 58 69 69 72 88
S5 C.G.E Colony 52 51 65 78 85
S6 3rd Cent 88 92 93 93 99
S7 Brayant Nagar 20 22 23 25 31
S8 S.M.Puram 78 79 82 88 92
S9 Pathima Nagar 95 95 95 94 84
S10 Fisher Colony 88 90 95 99 101
S11 Threshpuram 40 42 45 48 54
S12 Perumal Puram 77 77 78 79 87
S13 Anna Nagar 0.2 0.5 0 0 0.2
S14 PNT Colony 55 62 69 74 66
S15 A.P.C.M College 2.5 2.9 3.8 4.7 5.5
S16 Muthamal Colony 77 78 81 84 88
S17 Food Colony 66 67 54 66 88
S18 Puthur Puram 10 13 15 18 19
S19 Pallayapuram 5 9 11 12 12
S20 SBI Colony 52 51 56 62 66

ISSN: 0975-8585
October - December 2013 RJPBCS Volume 4 Issue 4 Page No. 1214
Table 2 Water quality parameters
Parameters Standard (Sn and Si) Weightage (Wn)
pH 85 0.1420
TDS 1000 0.0012
Nitrate 50 0.0242
Chloride 250 0.0048
Sulfate 250 0.0048
Alkalinity 20 0.0101
Sodium 200 0.0060
Flouride 1.5 0.8090
(Their ICMR/WHO standards and assigned unit weight)
Linear Trent Analysis (LTA) of nitrate showed that the 2010 summer linear trend line indicating that nitrate pollution is higher during summer seasons as compared to that of winter of 2010 (Fig. 7). LTA graph clearly shows that nitrate contamination is steadily increasing with the passage of time from 2007 to 2010 (Fig.5). The nitrate contamination source in the Susai Nagar (S2), Levinjpuram (S4), C.G.E Colony (S5), 3rd Cent (S6), S.M.Puram (S8), Fathima Nagar (S9), Fisher Colony (S10), Threshpuram (S11), PNT Colony (S14), Muthamal Colony (S16), SBI Colony (S20) areas is on-site sewage disposal and septic tank systems. These areas covered with unconsolidated sediments and hence compensation of nitrate is insignificant in the soil environment and the excess nitrate percolates into the groundwater. Decomposition of soil organic matter leaching of chemical fertilizers (particularly N- Fertilizers) human and animal excreta is potential sources of nitrate in groundwater [26-28]. Other significant sources of this nitrate pollution in the areas like Athimarapati (S1) and Perumal Puram (S12) are caused by irrigation return-flow and irrational use of fertilizers for the agricultural activity (Fig.8). The water samples of S1 and S12 presently threatening the health of people residing there was once called as an “ELIXIR” by the local people because of its purity.
Fig. 5 Nitrate ion concentration of the study area, during summer season (May, 2010)

ISSN: 0975-8585
October - December 2013 RJPBCS Volume 4 Issue 4 Page No. 1215
Fig. 6 Nitrate ion concentration of the study area, during winter season (December, 2010)
Fig.7 The Linear trend analysis of seasonal variation in nitrate ion concentration
Fig.8 Showing LTA of nitrate ion in years from 2007-2010

ISSN: 0975-8585
October - December 2013 RJPBCS Volume 4 Issue 4 Page No. 1216
Fig.9 Showing the sources nitrates pollution in the study area 2
Following remedial steps can reduce the risk of nitrate contamination Proper well location and constriction: Well should be located in higher elevation and at least 100ft away from septic tanks and fertilized area[29-31]. Ensure that the well casing extends above the ground. Operate septic system correctly: Maintaining the septic system regularly would help to avoid system failure, which could lead the water contamination, spreading of disease and avoiding costly repairs. Following guidelines are suggested: 1. Stringent rule to be adopted to eliminate the construction of septic tanks out of the house premises and on the side of the road to avoid the damage of septic tanks by the heavy vehicles running on the road. 2. Avoid plastics and other non-biodegradable materials which block the septic tank system and cause the overflow of material from the septic tank to reduce the contamination. 3. Reputable constructor should be hired to pump out the material and clean the tank in a regular time interval. Reduce your use of fertilizers: A code of good agricultural practice should be followed to use optimum amount of fertilizer in the agricultural activity to reduce the nitrate contamination in groundwater.
CONCLUSION
Nitrate ion assessment studies around Tuticorin, Tamilnadu, India indicate that the concentration of nitrate is higher than WHO permissible limit (50 mg/l) in twelve groundwater samples collected from bore wells during the May and December, 2010. The septic tank system is the primary sources of nitrate pollution within the city limit were the dense population is available. But in few areas were agriculture is the main activity, viz., Athimarapatti and Perumalpuram, fertilizer is the main source of nitrate pollution. Nitrate concentration is high in the groundwater samples collected during the summer than the groundwater samples collected during winter. Dilution of groundwater due to monsoon rain is the reason for the less concentration of nitrate in groundwater samples collected during winter. Underground drainage system and centralized sewage treatment systems are the

ISSN: 0975-8585
October - December 2013 RJPBCS Volume 4 Issue 4 Page No. 1217
remedial measure recommended reducing the nitrate contamination in the groundwater of Tuticorin.
ACKNOWLEDGEMENTS
The author is thankful to Department of Science & Technology, Government of India, New Delhi for awarding INSPIRE Fellowship to carry out this study (Ref. No. DST/INSPIRE FELLOWSHIP/2010/ (308), Date: 3rd August 2010). Author is also grateful to Shri A.P.C.V.Chockalingam, Secretary, V.O.C College, Tuticorin for his support to carry out study. I thankful to the anonymous reviewers have provided their valuable suggestions to improve the manuscript.
REFERENCES
[1] Almasri MN, Kaluarachchi JJ. J American Water Res Assoc 2004, 40, 165–186. [2] Babiker IS, Mohamed MAA, Terao H, Kato K, Ohta K. Environ Int 2003, 29, 1009–
1017. [3] Selvam S. Universal J Env Res and Tech 2012, 2, 233-241. [4] Srinivasa RY, Reddy TVK, Nayudu PT. Environ Geol 1997, 1, 56-63. [5] Thirumalaivasan D, Karmegam M, Venugopal K. Environ Modell Software 2003, 18,
645–656. [6] Dar Imran A, Dar Mithas A, Sankar K. Arab J Geosci 2009, 3, 267–272. [7] Santhi C, Srinivasan R, Arnold JG, Williams JR. Environ Modell Software 2006, 21,
1141–1157. [8] Yadav SN, Wall DB. Water Resources Res 1998, 34, 497–504. [9] Kacaroglou F and Gunay G. Environ Geol 1997, 31, 178 184. [10] Hill AR. Groundwater 1982, 20, 696-702. [11] Rajagopal P and Tobin G. Groundwater 1989, 27, 835-847. [12] WHO. World Health Organization, Geneva, 1983 [13] U.S. Environmental Protection Agency., Office of Water, 2000, 822-B-00-001, pp 12. [14] WHO., 2007, WHO/SDE/WSH/07.01/16. [15] Joosten LTA, Buijze ST, Jansen DM. Environ Poll 1998, 102, 487–492. [16] Mercado A. Water Resources Res 1976, 12, 731–747. [17] Bhumbla DK htm, 1999 , (accessed 28.09.11) [18] Metcalf Eddy, USAID and PWA, Gaza, Palestine, 2000. [19] Babiker IS, Mohamed MAA, Terao H, Kato K, Ohta K. Environ Int 2003, 29, 1009–
1017. [20] Kraft GJ, Stites W. Agric Ecosyst Environ 2003, 100, 63–74. [21] Mitchell RJ, Babcock RS, Gelinas S, Nanus L, Stansey E. Environ Quality 2003, 32,
789–800. [22] Balasubramanaian AR, Thirugnana S, Chellaswamy R, Radhakrishnan V. Tech Report
1993:21. [23] Srinivasa Rao Y, Reddy TVK and Nayudu PT. Environ Geol 1997, 32, 56-63. [24] Lance JC. J Water Poll Control 1972;44:1352-1361. [25] Sunitha V and Rajeswara Reddy B. J Appl Hydrol 2006;XIX:111-120. [26] Hill AR. Groundwater 1982, 20, 696-702. [27] Selvam S and Sivasubramanian P. International Journal of Geomatics Geoscience.
2012;3(1):55–62.

ISSN: 0975-8585
October - December 2013 RJPBCS Volume 4 Issue 4 Page No. 1218
[28] Selvam S, Manimaran G, Sivasubramanianm P. Appl Wat Sci 2013a;3(1):145-159. [29] Selvam S, Manimaran G, Sivasubramanian P, Balasubramanian N, Seshunarayana T.
Environmental Earth Sciences. 2013b, DOI 10.1007/s12665-013-2662-y. [30] Selvam S, Iruthaya Jeba Dhana Mala R, Muthukakshmi V. International Journal of
Advanced Engineering Applications. 2013b;2(3):25-37. [31] Selvam S, Magesh NS, Poovalingam Sivasubramanian, John Prince Soundranayagam,
Manimaran G, Seshunarayana T. Journal of the Geological Society of India 2013. DOI 10.1007/s16589-013-01232-s.