Seagrass Restoration Enhances “Blue Carbon” Sequestration in Coastal Waters
Upload
khangminh22Category
view
0download
0
Rehabilitation of degraded seagrass area in Tuticorin coast of Gulf of Mannar, Tamil Nadu, to support long term conservation of seagrass habitats Suganthi Devadason Marine Research Institute (SDMRI)
December 2013 – March 2015
Faunal biodiversity has increased amongst the transplanted seagrass in the Gulf of Mannar © SDMRI

2
This report has been designed and published by Suganthi Devadason Marine Research Institute (SDMRI) Produced with the financial support of Danida, Norad and Sida
Citation: SDMRI, Rehabilitation of degraded seagrass area in Tuticorin coast of Gulf of Mannar, Tamil Nadu, to support long term conservation of seagrass habitats All rights reserved. No part of this publication may be reproduced in any form or by any means without the prior permission of the IUCN and MFF. The designation of geographical entities in this report, and presentation of the material, do not imply the expression of any opinion whatsoever on the part of International Union for Conservation of Nature and Natural Resources (IUCN) or The Mangroves for the Future (MFF) Initiative concerning the legal status of any country, territory, or area, or of its authorities, or concerning the delimitation of its frontiers or boundaries. The views expressed in this publication do not necessarily reflect those of IUCN or the MFF Initiative, nor does citing of trade names or commercial processes constitute endorsement. Available from: IUCN India Country Office (New Delhi) and from SDMRI (Tuticorin, Tamil Nadu)
3
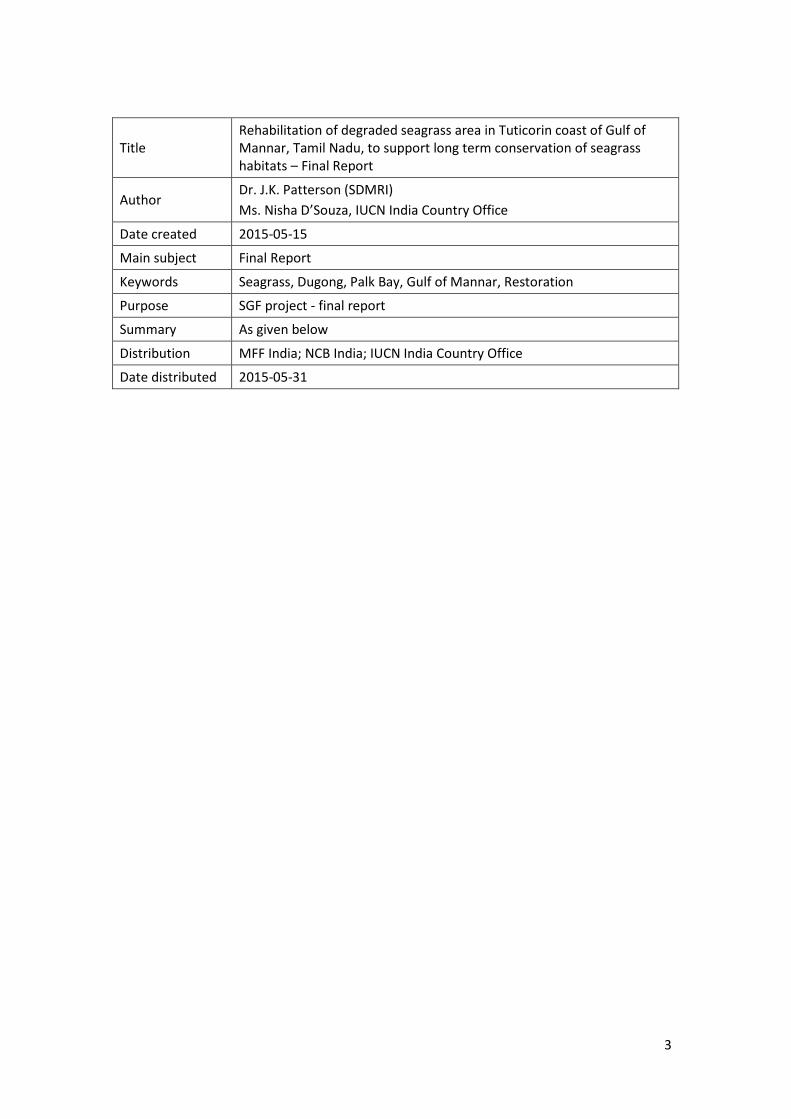
Title Rehabilitation of degraded seagrass area in Tuticorin coast of Gulf of Mannar, Tamil Nadu, to support long term conservation of seagrass habitats – Final Report
Author Dr. J.K. Patterson (SDMRI) Ms. Nisha D’Souza, IUCN India Country Office
Date created 2015-05-15
Main subject Final Report
Keywords Seagrass, Dugong, Palk Bay, Gulf of Mannar, Restoration
Purpose SGF project - final report
Summary As given below
Distribution MFF India; NCB India; IUCN India Country Office
Date distributed 2015-05-31

4
Introduction
Seagrass meadows are specialized marine flowering plants that have adapted to near shore underwater environments. Forming extensive meadows, they support high levels of biodiversity, stabilize sediments and trap heavy metals and nutrient rich runoff, thereby improving the water quality for large numbers of associated coral reef communities. They are important nursery habitats for fishes and feeding grounds for endangered species such as turtles and dugongs, the latter for who the presence of seagrass is highly correlated with its ability to survive. Additionally, seagrass rhizome systems bind and stabilize bottom sediments and provide habitats for hundreds of in-faunal organisms.
Seagrasses are amongst the least understood marine ecosystems in India. Seagrass beds in the country are predominantly found in mudflats and sandy regions along open shores and in island lagoons, from the lower intertidal zone to a depth of approximately 10–15m (Jagtap, 1991, Ramamurthy et al., 1992). The major seagrass meadows are distributed amongst the Lakshadweep and Andaman and Nicobar Islands and along the southeast coast of India, in the Gulf of Mannar and Palk Bay. It is estimated that the maximum extent (3,000ha) of seagrass are found in the latter region; fourteen species of seagrass have been conclusively identified in the region (Jagtap and Inamdar, 1991).
The Gulf of Mannar extends from Rameswaram Island in the north to Kanyakumari in the south. It consists of a chain of 21 islands stretching from Mandapam to Tuticorin. The islands are located approximately 2 - 10km from the mainland and are classified based on their proximity to mainland into four major groups Tuticorin, Vembar, Keezhakkarai and Mandapam groups. The region was declared a Marine Biosphere Reserve in 1989 under the Man and Biosphere Programme of UNESCO in lieu of its invaluable biodiversity and multiple use status. The 21 islands are protected under the Gulf of Mannar Marine National Park. In previous years, area estimates of seagrass beds from different regions were generally made from aerial photographs, ground survey, and naval hydrographic charts, whereas standing crop was calculated by using biomass data collected by line transect and quadrat methods.
Globally, there has been a decrease in seagrass abundance and associated organisms due to anthropogenic activities (Kemp 2000). A number of countries have given high priority to conserving seagrass ecosystems, and rehabilitation programs have been implemented since 1945 in some areas (Thorhaug 1986). Seagrass beds from India have been included as ecologically sensitive regions and are protected by the Coastal Regulation Zone Act. Despite this seagrasses, and associated fauna like dugongs (a highly endangered Sirenian species; dugongs are afforded the highest protection under the Wildlife Protection Act, 1972, in India although very little is known about them), have been largely left out of education, research, and management consideration, as compared to other ecologically sensitive habitats such as mangroves and coral reefs.
In 2011 SDMRI, under the IUCN Mangroves for the Future SGF initiative conducted an assessment of the seagrass beds of Gulf of Mannar and Palk Bay, to inform the development of a plan for the long-term management of the seagrass ecosystem. The study revealed that, in the Gulf of Mannar, approximately 101 sq.kms are covered by seagrass beds with 35.89% of seagrass percentage cover along 140 km coastline between Pamban and Tuticorin. It was estimated that over 20% of the total seagrass bed areas were damaged/degraded due to various human induced threats as well as natural factors like strong waves, currents etc. In addition there is a need to connect isolated patches of seagrass to each other to increase connectivity for faunal species, particularly in sites where seagrasses were historically prevalent.

5
The results of surveys on seagrass habitats in the Gulf of Mannar through MFF projects were presented at a COP 11, IUCN in Hyderabad, India on 16 October 2012; it was recommended that the degraded seagrass habitats be restored. Additionally the development of the protocol was a request from the State Forest Dep. of Tamil Nadu, who manages the Gulf of Mannar Marine National Park, and Biosphere Reserve; they will implement the protocol as needed within the protected area.
The objectives of this project were to rehabilitate one km2
Implementation of Activities
of degraded seagrass beds off the Tuticorin coast of Tamil Nadu, and develop a protocol for rehabilitating seagrass in the Gulf of Mannar.
One km2
The site for rehabilitation of seagrass was identified through boat surveys in January 2014. The final site was located on the periphery of the Gulf of Mannar Marine National Park off the Tuticorin coast, in Tamil Nadu. The site is located adjacent to Koswari Island (refer to Figure 1. below)
degraded seagrass bed in Tuticorin coast in Gulf of Mannar rehabilitated
Figure 1. Map indicating the location in Tuticorin coast, parallel to Koswari Island, where seagrass rehabilitation was undertaken.
The site, 1 km2
Table 1: Seagrass rehabilitation location details
in size, was divided into 3 blocks for easier implementation of restoration activities. The details of each block with GPS coordinates are given in Table 1.

6
Site Compass bearing Area cover Depth GPS mark
Block 1 NE 0.42 Km 3 to 3.5 m 2 08052'792"N 78013'427"E Block 2 NE 0.45 Km 2.5 to 3.2 m 2 08052'658"N 078013'326"E Block 3 SE 0.28 Km 3 to 3.8 m 2 08052'545"N 078013'248"E
The seagrass rehabilitation activities commenced in February 2014, and were completed by May 2014. The restoration methodology was replicated from Seagrass Watch and contextualized for the Gulf of Mannar conditions. 400 PVC frames (1 x 1m) were constructed - 165 frames with seagrass shoots attached to them were transplanted in Block 1, 150 frames in Block 2, and 85 frames in Block 3. Three common seagrass species including, Cymodocea serrulata, Syringodium isoetifolium and Thalassia hemprichii were transplanted. Species were planted according to the dominant structures of the neighboring assemblages. The PVC tubes will be removed from underwater once the shots have latched on to the bottom substrate, and processes of natural succession are visible.
10 fisher youth from Tuticorin were employed under the project to carry out the restoration activities. They were first made aware of the importance of seagrass, and then capacity built to restore seagrass, and monitor and evaluate survival and health of the plantations.
Figure 2. Seagrass shoots attached to PVC frames © SDMRI
Results and Impacts
Monitoring of the seagrass rehabilitated site was conducted between June 2014 and February 2015. The average survival recorded after 9 months of transplantation was 81.5%, 85.7%, and 78.6%for Thalassia hemprichii, Cymodocea serrulata and Syringodium isoetifolium respectively. In Block 1, overall survival rate was 83.5%, 86.22%, and 80.4% for

7
Thalassia hemprichii, Cymodocea serrulata and Syringodium isoetifolium respectively. In Block 2, overall survival rate was recorded to be 78.4%, 80.36%, and 79.84% for Thalassia hemprichii, Cymodocea serrulata and Syringodium isoetifolium respectively. In Block 3, overall survival rate was 82.45%, 90.37%, and 78.55% for Thalassia hemprichii, Cymodocea serrulata and Syringodium isoetifolium respectively.
Percentage cover in the transplanted quadrats started increasing from June 2014, following the transplantation in February 2014. The percentage cover of seagrasses during June 2014 was 28.7%, 30.45%, and 25.48% respectively for Thalassia hemprichii, Cymodocea serrulata and Syringodium isoetifolium. This gradually increased to 62.78%, 68.44% and 50.44% between June 2014 and February 2015 (refer to Annex 1. Figures 1. and 2.). Seagrass shoot density also increased correspondingly from 18.4 no.m-2, 22.4 no.m-2 and 15.6 no.m-2, to 92.7 no.m-2, 118.6 no.m-2 and 64.5 no.m-2 respectively between June 2014 and February 2015, for Thalassia hemprichii, Cymodocea serrulata and Syringodium isoetifolium respectively. Total shoot density was gradually increased from June 2014 to February 2015 (56.20 to 275.80 no.m-2
Figure 3. Seagrass growth amongst the PVC frames © SDMRI
) (refer to Annex 1. Figures 3. and 4.)
Benthic macrcofaunal communities increased in density with the increase in seagrass percentage cover. In Block 1, the densities of bivalves, gastropods, echinoderms, sea anemones and sponges were 0 no.5 m-2 initially but increased to 0.96 no.5 m-2, 1.52 no.5 m-
2, 0.52 no.5 m-2, 1.2 no.5 m-2 and 2.11 no.5 m-2 respectively, by February 2015. In Block 2, the densities increased to 0.56 no.5 m-2, 1.43 no.5 m-2, 0.42 no.5 m-2, and 2.18 no.5 m-2 respectively for bivalves, gastropods, echinoderms and sponges. In Block 3, the densities of bivalves, gastropods, echinoderms, sea anemones and sponges were increased to 2.45 no.5 m-2, 1.69 no.5 m-2, 0.47 no.5 m-2, 1.75 no.5 m-2 and 2.47 no.5 m-2 respectively, by February 2015 (refer to Annex 1. Table 1). In total, 8 common seagrass associated fish genus were recorded. Among them, genus Terapon sp. was the dominant followed by Lutjanus sp.

8
Highest fish density was observed in Block 3 with 118 no. 50 m2 followed by Block 1 with 105 no. 50 m2
Based on the above rehabilitation activities, a restoration protocol was developed in English and translated into Tamil. It was disseminated amongst organizations working in the region, as well as the State Forest Dep. and MoEF&CC (refer to Annex 2.)
(refer to Annex 1. Figure 5.)
Challenges
Artisanal fishing has been traditionally conducted in the site where the transplantation took place. Some fishing nets, and strong wave action did damage the new growth of seagrass. However, consultations with the fishermen to reduce the fishing pressure in and around the site have been promising, and SDMRI will continue to work with them to ensure healthy growth of the seagrass.
References
1. Jagtap, T.G. 1991. Distribution of Seagrasses along the Indian coast. Aquat. Bot., 40: 379-386.
2. Ramamurthy, K., N.P. Balakrishnan, K. Ravikumar and R. Ganesan, 1992. Seagrasses of Coromandel coast, India. Flora of India – Series 4, Botanical Survey of India, 80 p.

9
28.2 30.634.8
40.343.9
49.352.2
56.460.6
0.0
10.0
20.0
30.0
40.0
50.0
60.0
70.0
Jun 14' Jul 14' Aug 14' Sep 14' Oct 14' Nov 14' Dec 14' Jan 15' Feb 15'
% co
ver o
f sea
gras
s
0
10
20
30
40
50
60
70
80
Jun 14' Jul 14' Aug 14' Sep 14' Oct 14' Nov 14' Dec 14' Jan 15' Feb 15'
% co
ver o
f sea
gras
s spe
cies
Thalassia hemprichii Cymodocea serrulata Syringodium isoetifolium
Annex 1.
Figure 1. % increase in transplanted seagrass in all blocks
Figure 2. % increase in transplanted seagrass species in all blocks

10
56.2
88.1
123
155.6
196.84207.6
225
254.8275.8
0
50
100
150
200
250
300
Jun 14' Jul 14' Aug 14' Sep 14' Oct 14' Nov 14' Dec 14' Jan 15' Feb 15'
Tota
l sho
ot d
ensi
ty(m
-2)
0
20
40
60
80
100
120
140
Jun 14' Jul 14' Aug 14' Sep 14' Oct 14' Nov 14' Dec 14' Jan 15' Feb 15'Seag
rass
spec
ies s
hoot
den
sity
(m-2
)
Thalassia hemprichii Cymodocea serrulata Syringodium isoetifolium
Figure 3.: Increase in shoot density of transplanted seagrass
Figure 4.: Increase in shoot density of transplanted seagrass species

11
0
20
40
60
80
100
120
140
Jun 14' Jul 14' Aug 14' Sep 14' Oct 14' Nov 14' Dec 14' Jan 15' Feb 15'
Fish
den
sity
(no.
50m
2 )
Block-1 Block-2 Block-3
Figure 5.: Fish density in the transplanted seagrass area
Table 1: Macro faunal density in the seagrass rehabilitation area
Block 1 Jun 14' Jul 14' Aug 14' Sep 14'
Oct 14'
Nov 14' Dec 14' Jan
15' Feb 15'
Bivalve 0 0 0 0.52 0.85 0.85 0.9 0.9 0.96 Gastropod 0 0 1.2 1.35 1.52 1.68 1.22 1.75 1.52 Echinoderms 0 0 0 0.25 0.36 0.53 0.62 0.76 0.52 Sea anemone 0 0 0 0.34 0.85 1.25 1.35 1.48 1.2
Sponges 0 0.32 0.55 0.85 1.56 1.85 2.11 2.32 2.11 Block 2 Bivalve 0 0 1.2 0.69 0.42 0.74 0.85 0.84 0.56 Gastropod 0 0 0 1.11 1.05 1.23 1.12 1.23 1.43 Echinoderms 0 0 0.56 0.35 0.27 0.42 0.56 0.85 0.42 Sea anemone 0 0.86 0 0 0.23 1.11 1.14 1.21 0
Sponges 0 0.12 0.43 0 0.23 0 1.85 1.96 2.18 Block 3 Bivalve 0 0 2.54 1.54 1.23 2.12 2.75 2.65 2.45 Gastropod 0 0.56 1.68 1.21 1.86 1.42 1.65 1.24 1.69 Echinoderms 0 0 0 0.23 0.45 0.68 0.75 0.85 0.47 Sea anemone 0 0 1.21 0.17 0.75 1.34 1.47 1.23 1.75
Sponges 0 0 0.68 1.26 1.32 1.75 2.33 2.75 2.47

12
Annex 2.
Copyright © 2022 FDOKUMEN