Acoustic impedance of an artificially lengthened and constricted vocal tract
Upload
independentCategory
view
0download
0
STR analysis of artificially degraded DNA—results ofa collaborative European exercise
Peter M. Schneidera,*, Klaus Bendera, Wolfgang R. Mayrb, Walther Parsonc,Bernadette Hosted, Ronny Decortee, Jan Cordonnierf, Daniel Vanekg, Niels Morlingh,
Matti Karjalaineni, C. Marie-Paule Carlottij, Myriam Sabatierk, Carsten Hohoffl,Hermann Schmitterm, Werner Pflugn, Rainer Wenzelo, Dieter Patzeltp, Rudiger Lessigq,
Peter Dobrowolskir, Geraldine O’Donnells, Luciano Garafanot, Marina Doboszu,Peter de Knijffv, Bente Mevagw, Ryszard Pawlowskix, Leonor Gusmaoy,
Maria Conceicao Videz, Antonio Alonso Alonsoa1, Oscar Garcıa Fernandeza2,Pilar Sanz Nicolasa3, Ann Kihlgreena4, Walter Bara5, Verena Meiera6,
Anne Teyssiera7, Raphael Coquoza8, Conxita Brandta9, Ursula Germanna10,Peter Gilla11, Justine Halletta12, Matthew Greenhalgha13
aInstitut fur Rechtsmedizin, Universitat Mainz, Mainz, GermanybKlinische Abteilung fur Blutgruppenserologie, Universitat Wien, Wien, Austria
cInstitut fur Gerichtliche Medizin, Universitat Innsbruck, Innsbruck, AustriadInstitut National de Criminalistique, Bruxelles, Belgium
eLaboratory for Forensic Genetics and Molecular Archaeology, Leuven, BelgiumfChemiphar, Brugge, Belgium
gInstitute of Criminalistics, Prague, Czech RepublichDepartment of Forensic Genetics, Institute of Forensic Medicine,
University of Copenhagen, Copenhagen, DenmarkiNational Bureau of Investigation, Vantaa, Finland
jInstitut de Recherche Criminelle, Rosny-Sous-Bois, FrancekLaboratoire de Police Scientifique, Toulouse, France
lInstitut fur Rechtsmedizin, Universitat Munster, GermanymBundeskriminalamt, Wiesbaden, Germany
nLKA Baden-Wurttemberg, Stuttgart, GermanyoLKA Rheinland-Pfalz, Mainz, Germany
pInstitut fur Rechtsmedizin, Universitat Wurzburg, Wurzburg, GermanyqInstitut fur Rechtsmedizin, Universitat Leipzig, Leipzig, Germany
rLKA Sachsen, Dez. DNA-Analytik, Dresden, GermanysForensic Science Laboratory, Dublin, Ireland
tReparto Carabinieri Investigazioni Scientifiche, Parma, ItalyuIstituto di Medicina Legale Universita Cattolica, Roma, Italy
vForensics Laboratory, University of Leiden, Leiden, The NetherlandswRettsmedisinsk Institutt, University of Oslo, Oslo, Norway
xInstitute of Forensic Medicine, Medical University of Gdansk, Gdansk, PolandyIPATIMUP, Universidade do Oporto, Oporto, Portugal
zInstituto de Medicina Legal, Universidade de Coimbra, Coimbra, Portugala1Instituto National de Toxicologia, Madrid, Spain
a2Area de Laboratorio Ertzaina, Bilbao, Spaina3Instituto National de Toxicologia, Sevilla, Spain
Forensic Science International 139 (2004) 123–134
* Corresponding author. Present address: Institute of Legal Medicine, Am Pulverturm 3, D-55131 Mainz, Germany.
Tel.: þ49-6131-3932687; fax: þ49-6131-3933183.
E-mail address: [email protected] (P.M. Schneider).
0379-0738/$ – see front matter # 2003 Elsevier Ireland Ltd. All rights reserved.
doi:10.1016/j.forsciint.2003.10.002

a4National Laboratory of Forensic Science, Linkoping, Swedena5Institut fur Rechtsmedizin, Universitat Zurich, Zurich, Switzerland
a6Instiut fur Rechtsmedizin, Universitat Basel, Basel, Switzerlanda7Institut Universitaire de Medecine Legale, Universite de Geneve, Geneve, Switzerland
a8Laboratoire AMS, Lausanne, Switzerlanda9Institut Universitaire de Medecine Legale, Lausanne, Switzerland
a10Institut fur Rechtsmedizin, Universitat St. Gallen, St. Gallen, Switzerlanda11Forensic Science Service Headquarters, Birmingham, UK
a12LGC, Teddington Middlesex, UKa13Orchid Bioscience Europe, Abingdon, UK
Received 21 May 2003; received in revised form 2 October 2003; accepted 3 October 2003
Abstract
Degradation of human DNA extracted from forensic stains is, in most cases, the result of a natural process due to the exposure of
the stain samples to the environment. Experiences with degraded DNA from casework samples show that every sample may exhibit
different properties in this respect, and that it is difficult to systematically assess the performance of routinely used typing systems
for the analysis of degraded DNA samples. Using a batch of artificially degraded DNA with an average fragment size of approx.
200 bp a collaborative exercise was carried out among 38 forensic laboratories from 17 European countries. The results were
assessed according to correct allele detection, peak height and balance as well as the occurrence of artefacts. A number of common
problems were identified based on these results such as strong peak imbalance in heterozygous genotypes for the larger short
tandem repeat (STR) fragments after increased PCR cycle numbers, artefact signals and allelic drop-out. Based on the observations,
strategies are discussed to overcome these problems. The strategies include careful balancing of the amount of template DNA and
the PCR cycle numbers, the reaction volume and the amount of Taq polymerase. Furthermore, a careful evaluation of the results of
the fragment analysis and of automated allele calling is necessary to identify the correct alleles and avoid artefacts.
# 2003 Elsevier Ireland Ltd. All rights reserved.
Keywords: Short tandem repeat; Alleles; PCR degradation
1. Introduction
Genetic analysis of short tandem repeat (STR) loci is
currently the most powerful and widely used method to
identify the contributor of biological samples collected in the
context of criminal investigations, and the identification of
human remains. The successful application includes a vari-
ety of substrates such as blood, saliva, epithelial cells, hair
roots and even compact bone samples [1,2]. However, when
more problematic samples such as old stains or decomposed
tissue are subjected to STR typing, failure to obtain repro-
ducible results may occur due to degradation of high mole-
cular weight DNA [3].
In crime case investigations, degradation of human
DNA usually is the result of a natural process resulting
from the exposure of the stain or tissue samples to the
environment. Light, humidity, elevated temperatures as
well as bacterial and fungal contaminations followed by
the growth of these microorganisms lead to physical,
chemical and biochemical degradation of genomic
DNA. Once the average DNA fragment length is reduced
to sizes smaller than 300 bp, loss of genetic information
may occur due to the lack of suitable template DNA and
the subsequent failure of frequently used STR typing
methods [4].
Experience with degraded DNA from casework samples
shows that every sample may exhibit different properties in
this respect, and that it is difficult to systematically assess the
performance of routinely used typing systems to analyze
degraded DNA samples. To learn more about the efficiency
of STR systems, a standardized reference sample of
degraded DNA in sufficient amounts would be quite helpful,
and could also be used for validation studies of new STR
typing systems [5–7]. Therefore, a collaborative exercise on
degraded DNA was planned in the process of the ‘‘Standar-
dization of DNA Profiling Methods in the European Union’’
(STADNAP) network, and participation was offered to 50
forensic DNA laboratories across Europe. The intention of
this exercise was to better understand the different para-
meters influencing STR typing results obtained from
degraded DNA as well as to learn more about the strategies
applied by the participating laboratories to optimize the
typing of problematic samples.
2. Materials and methods
2.1. Production of degraded DNA samples
Batches of high molecular weight genomic DNA were
prepared from two human cell lines, HepG2 and P118, with
124 P.M. Schneider et al. / Forensic Science International 139 (2004) 123–134

male and female genotypes, respectively. The DNA samples
were degraded under standardized conditions to an average
fragment length of less than 200 bp using a combination of
physical and biochemical methods, i.e. sonication and treat-
ment with DNAse I. Based on previous experiences from a
smaller exercise among the STADNAP partner laboratories
using a single degraded DNA sample (data not shown) it was
intended to achieve a slightly higher degree of degradation in
sample B compared to sample A. The degradation process was
closely monitored to control the resulting fragment sizes as
well as the suitability to obtain partial results by multiplex
STR typing. It was observed that the final fragment size
distribution heavily depends on the DNA quality and con-
centration, the reaction conditions and volumes, as well as the
properties and the concentration of the DNAse I digestion.
Batch to batch reproducibility could only be achieved by
repeatedly testing the degraded DNA using STR analysis [8].
2.2. Exercise design
Two aliquots of 20 ml each were shipped to the 50
participating laboratories with the following instructions:
� Apply your standard combination of forensic STR typing
systems using regular PCR conditions.
� If your first amplification fails, try to modify these con-
ditions as you would do in casework, or use singleplex
systems.
� Record the results for each locus with successful ampli-
fication by allele designation and peak height in a tabu-
lated form, and enclose prints showing the DNA profiles
using the GeneScan or GenoTyper format.
� If you routinely perform mtDNA typing, please try to
sequence HV-I and HV-II.
In addition, the participating laboratories were asked to
provide further information about equipment, routine typing
procedures, PCR conditions and rules for data analysis, e.g.
the threshold for allele calling.
2.3. Data analysis
The submitted data were recorded for each STR locus
based on the peak height (in relative fluorescence units, rfu)
for each allele observed. To allow a comparison between
laboratories, the peak heights were grouped into three
categories: strong signal: >150 rfu, low signal: 150–
30 rfu, very low or no signal: <30 rfu. Furthermore, two
categories of data were defined based on the exercise
instructions (see above): ‘‘standard’’ PCR conditions using
0.25–2.5 ng degraded DNA and 28 PCR cycles, and
‘‘enhanced’’ PCR conditions using 0.5–5 ng DNA and
28–36 PCR cycles. Unexpected results, artefacts or incorrect
alleles were recorded separately for each locus and were not
included in the peak height analysis.
3. Results and discussion
Results were received from 38 laboratories from 17
European countries (Fig. 1). All laboratories submitted data
for at least one multiplex STR kit. The total number of
datasets for each STR kit included in the study are summar-
ized in Fig. 2. The majority of laboratories (63%) used the
Profiler SGM Plus kit from Applied Biosystems (ABI). A
total of 26% of the laboratories used the PowerPlex 16 kit
from Promega, and another 29% used the Profiler, Profiler
Plus and Cofiler multiplexes from ABI. In addition, 29% of
the laboratories submitted data for other commercial kits or
‘‘home made’’ singleplex STR systems, and 21% of the
laboratories performed a DNA sequence analysis of the
hypervariable D-loop regions of mitochondrial DNA. The
majority of laboratories (58%) carried out capillary electro-
phoresis using the ABI Prism 310 Analyzer (Fig. 2, columns
on the right).
The correct typing results for the DNA samples A and B
are listed in Table 1 for all STR loci comprised in the SGM
Plus, Profiler Plus and PowerPlex 16 multiplexes, including
Fig. 1. Number and country of origin of the participating laboratories.
P.M. Schneider et al. / Forensic Science International 139 (2004) 123–134 125

data on the maximal fragment size and fluorescent dye label
color for each system. Fragment sizes for each locus are
consistent among the kits manufactured by ABI, although
some have been labeled with different colors as shown. In
the Promega multiplex kit, some STR systems are located in
a different size range in comparison to the ABI kits.
The multiplex typing results based on the recorded peak
heights (in rfu) are depicted for the three most commonly
used multiplexes SGM Plus (Fig. 3), Profiler Plus including
the blue and yellow systems from Profiler (Fig. 4), and
PowerPlex 16 (Fig. 5). In each histogram, the STR systems
are arranged with increasing fragment size from left to right
(see also Table 1). In each figure, the results for sample A (a,
b) and sample B (c, d) are shown for standard (a, c) and
enhanced (b, d) PCR conditions.
The amount of genomic DNA and the number of cycles
varied significantly between laboratories. Therefore, the
decision to assign the results into the two categories
Fig. 2. STR multiplex kits and sequencing equipment used by exercise participants.
Table 1
STR loci, fragment sizes and dye label colors of three multiplex kits used by the exercise participants
STR system Genotypes SGM Plus Profiler/Plus Power Plex
Sample A Sample B Allele size
range (bp)
Ba Ga Ya Allele size
range (bp)
B G Y Allele size
range (bp)
B G Y
D3S1358 15, 16 16, 17 <150 þ <150 þ <150 þVWA 17 16, 18 <210 þ <210 þ <170 þFGA 22, 25 21, 22 <360 þ <360 þ <450 þAmelogenin XY XX <112 þ <112 þ <112 þD8S1179 15, 16 14 <170 þ <170 þ <250 þD21S11 29, 31 30 <250 þ <250 þ <260 þD18S51 13, 14 13 <350 þ <350 þ <370 þD5S818 11, 12 12, 14 <180 þ <160 þD13S317 9, 13 11, 12 <240 þ <200 þD7S820 10 8, 10 <300 þ <250 þD19S433 15.2 14, 15 <140 þTHO1 9 6 <200 þ <200 þTPOX 8, 9 8, 12 <290 þCSF1PO 10, 11 10, 11 <360 þD16S539 12, 13 9, 11 <270 þ <305 þD2S1338 19, 20 16, 17 <350 þPenta E 15, 20 5 <480 þPenta D 9, 13 11, 13 <440 þ
a B: blue; G: green; Y: yellow.
126 P.M. Schneider et al. / Forensic Science International 139 (2004) 123–134

‘‘standard’’ and ‘‘enhanced’’ PCR conditions could not be
based on clear-cut rules. In general, results were assigned to
the ‘‘standard’’ category when 28 cycles were performed,
and to the ‘‘enhanced’’ category for 30 cycles or more.
However, some laboratories either did not use more than 28
cycles, but rather increased the amount of DNA for enhance-
ment, or used 30 cycles already as their standard procedure.
Furthermore, other laboratories provided only one result for
each sample, which had then to be assigned to one of the two
categories for analysis. Thus, the ranges for the number of
Fig. 3. Results of STR typing for the SGM Plus multiplex kit. For each locus, the data are summarized for the three peak height categories:
>150 rfu (black columns), 150–30 rfu (grey columns) and <30 rfu (white columns). The results for all STR loci are arranged in the order of
observed fragment sizes from left (small fragments) to right (large fragments) for the three categories. (a) Results for degraded DNA sample A
using standard PCR conditions, i.e. 0.25–2 ng of DNA and 28–30 PCR cycles according to manufacturer or established operational procedures
(n ¼ 15 laboratories); (b) results for degraded DNA sample A using enhanced PCR conditions, i.e. up to 5 ng of DNA and up to 35 PCR cycles
according to established operational procedures (n ¼ 19 laboratories); (c) results for degraded DNA sample B using standard PCR conditions,
i.e. 0.5–2 ng of DNA and 28 PCR cycles according to manufacturer or established operational procedures (n ¼ 12 laboratories); (d) results for
degraded DNA sample B using enhanced PCR conditions, i.e. up to 10 ng of DNA and up to 35 PCR cycles according to established
operational procedures (n ¼ 17 laboratories).
P.M. Schneider et al. / Forensic Science International 139 (2004) 123–134 127
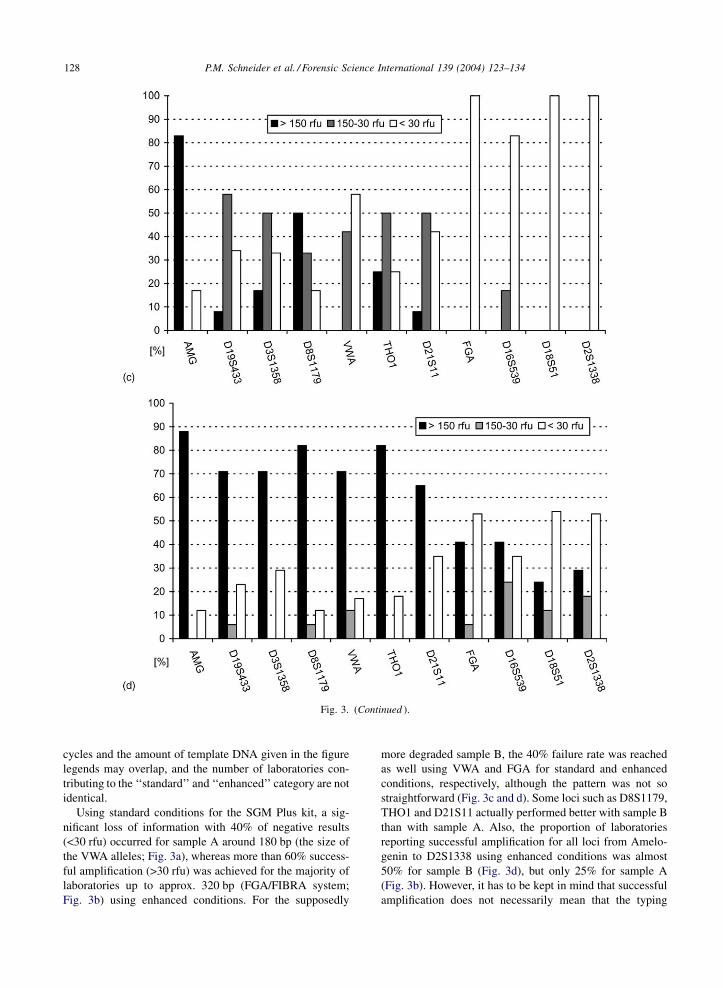
cycles and the amount of template DNA given in the figure
legends may overlap, and the number of laboratories con-
tributing to the ‘‘standard’’ and ‘‘enhanced’’ category are not
identical.
Using standard conditions for the SGM Plus kit, a sig-
nificant loss of information with 40% of negative results
(<30 rfu) occurred for sample A around 180 bp (the size of
the VWA alleles; Fig. 3a), whereas more than 60% success-
ful amplification (>30 rfu) was achieved for the majority of
laboratories up to approx. 320 bp (FGA/FIBRA system;
Fig. 3b) using enhanced conditions. For the supposedly
more degraded sample B, the 40% failure rate was reached
as well using VWA and FGA for standard and enhanced
conditions, respectively, although the pattern was not so
straightforward (Fig. 3c and d). Some loci such as D8S1179,
THO1 and D21S11 actually performed better with sample B
than with sample A. Also, the proportion of laboratories
reporting successful amplification for all loci from Amelo-
genin to D2S1338 using enhanced conditions was almost
50% for sample B (Fig. 3d), but only 25% for sample A
(Fig. 3b). However, it has to be kept in mind that successful
amplification does not necessarily mean that the typing
Fig. 3. (Continued ).
128 P.M. Schneider et al. / Forensic Science International 139 (2004) 123–134

results were correct for all loci. This aspect will be discussed
in the context of the results from all three multiplexes.
The results for the Profiler Plus kit were supplemented
with data from the ‘‘blue’’ and ‘‘yellow’’ systems from the
Profiler kit as these have an identical locus composition in
both kits. When compared to the SGM Plus results, the
Profiler Plus data exhibited a higher proportion of low
molecular weight alleles with peak heights >150 rfu both
Fig. 4. Results of STR typing for the Profiler/Profiler-Plus multiplex kit. For each locus, the data are summarized for the three peak height
categories: >150 rfu (black columns), 150–30 rfu (grey columns) and <30 rfu (white columns). The results for all STR loci are arranged in the
order of observed fragment sizes from left (small fragments) to right (large fragments) for the three categories. (a) Results for degraded DNA
sample A using standard PCR conditions, i.e. 0.25–1.25 ng of DNA and 28–32 PCR cycles according to manufacturer or established
operational procedures (n ¼ 8 laboratories); (b) results for degraded DNA sample A using enhanced PCR conditions, i.e. up to 2.5 ng of DNA
and up to 34 PCR cycles according to established operational procedures (n ¼ 5 laboratories); (c) results for degraded DNA sample B using
standard PCR conditions, i.e. 0.25–1.25 ng of DNA and 28–32 PCR cycles according to manufacturer or established operational procedures
(n ¼ 6 laboratories); (d) results for degraded DNA sample B using enhanced PCR conditions, i.e. up to 2.5 ng of DNA and up to 34 PCR
cycles according to established operational procedures (n ¼ 5 laboratories).
P.M. Schneider et al. / Forensic Science International 139 (2004) 123–134 129

for samples A and B. A loss of information with >40%
failure rate begins with D21S11 around 220 bp for standard
conditions (Fig. 4a and c), and, using enhanced conditions,
with D7S820 for sample A (approx. 280 bp, Fig. 4b) and
D13S317 for sample B which has a similar size as D21S11
(Fig. 4d). It might be speculated that some of these differ-
ences can be related to the fact that some loci have changed
colors when the SGM Plus kit was designed to accommodate
the additional STR loci (Table 1). In particular, using
standard conditions, FGA performed significantly better
in the Profiler Plus kit carrying a blue dye (30–50% success-
ful amplification) compared to the SGM Plus kit with a
yellow dye (complete failure; Fig. 4a and c). Similar obser-
vations were made in a recent study on the interpretation of
mixtures from forensic casework. It was found that the
detection of mixed profiles was more successful using
blue-labeled STR systems [9]. On the other hand, successful
amplification across all loci (>30 rfu) using enhanced con-
ditions was not better than for the SGM Plus kit, i.e. 25% for
both samples due to the low values for D18S51, and although
the equally large D2S1338 system is present in the SGM
Plus kit.
Fig. 4. (Continued ).
130 P.M. Schneider et al. / Forensic Science International 139 (2004) 123–134
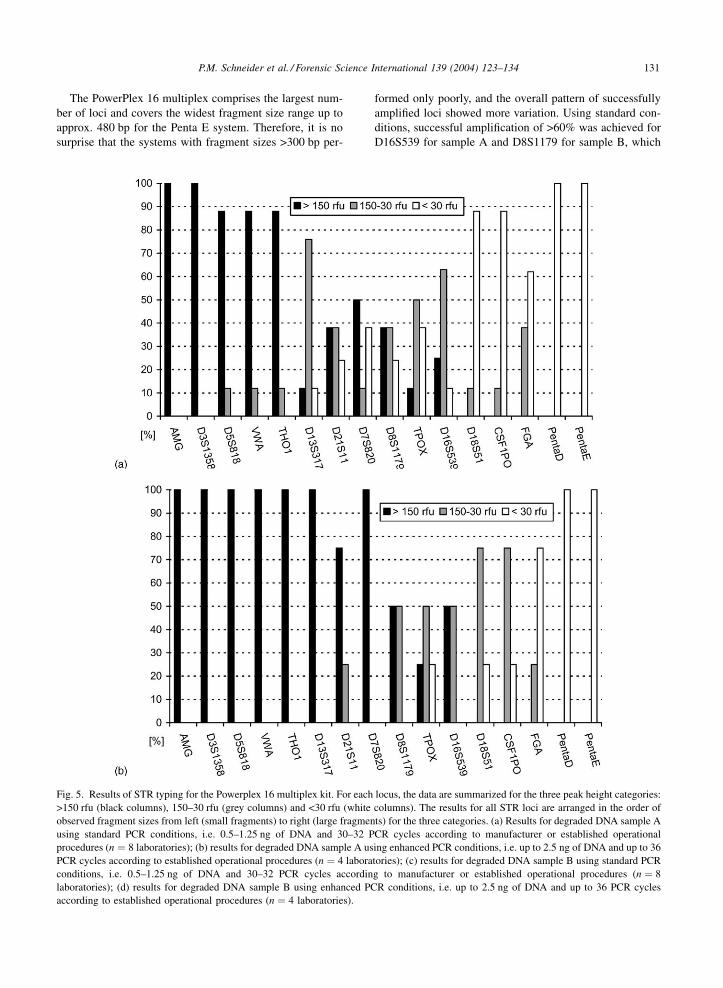
The PowerPlex 16 multiplex comprises the largest num-
ber of loci and covers the widest fragment size range up to
approx. 480 bp for the Penta E system. Therefore, it is no
surprise that the systems with fragment sizes >300 bp per-
formed only poorly, and the overall pattern of successfully
amplified loci showed more variation. Using standard con-
ditions, successful amplification of >60% was achieved for
D16S539 for sample A and D8S1179 for sample B, which
Fig. 5. Results of STR typing for the Powerplex 16 multiplex kit. For each locus, the data are summarized for the three peak height categories:
>150 rfu (black columns), 150–30 rfu (grey columns) and <30 rfu (white columns). The results for all STR loci are arranged in the order of
observed fragment sizes from left (small fragments) to right (large fragments) for the three categories. (a) Results for degraded DNA sample A
using standard PCR conditions, i.e. 0.5–1.25 ng of DNA and 30–32 PCR cycles according to manufacturer or established operational
procedures (n ¼ 8 laboratories); (b) results for degraded DNA sample A using enhanced PCR conditions, i.e. up to 2.5 ng of DNA and up to 36
PCR cycles according to established operational procedures (n ¼ 4 laboratories); (c) results for degraded DNA sample B using standard PCR
conditions, i.e. 0.5–1.25 ng of DNA and 30–32 PCR cycles according to manufacturer or established operational procedures (n ¼ 8
laboratories); (d) results for degraded DNA sample B using enhanced PCR conditions, i.e. up to 2.5 ng of DNA and up to 36 PCR cycles
according to established operational procedures (n ¼ 4 laboratories).
P.M. Schneider et al. / Forensic Science International 139 (2004) 123–134 131

have sizes up to 270 bp (Fig. 5a and c). The size range of
successful amplification was extended using enhanced con-
ditions to CSF1PO for sample A and to D18S51 for sample B
(both approx. 340 bp). Using enhanced conditions, the pro-
portion of systems exhibiting peak heights of >150 rfu was
clearly improved. In general, the performance of the Power-
Plex 16 kit was comparable to those of the ABI kits based on
fragment length assessment, although the locus composition
is quite different regarding STR size ranges and dye colors
(Table 1).
As already mentioned, not all alleles could be identified
correctly for all loci. A number of common problems were
observed. However, due to the heterogeneity of the submitted
data regarding the amount of DNA used, the PCR parameters
and other conditions it was not possible to compile a locus-by-
locus statistical analysis. Therefore, typical problems are
summarized. A strong peak imbalance was found in hetero-
zygous genotypes in particular for the larger STR systems, and
for enhanced conditions applying more than 30 cycles. Arte-
fact signals (‘‘pull-ups’’) occurred due to overamplification
mimicking alleles not present in the sample. Allelic drop-out
(i.e. the complete loss of one allele in a heterozygous geno-
type) was observed more frequently, and sometimes the
smaller of two alleles at a given locus was affected.
Fig. 5. (Continued ).
132 P.M. Schneider et al. / Forensic Science International 139 (2004) 123–134

Some STR loci repeatedly exhibited problems. FGA,
D21S11 and D18S51 were most frequently affected by
allelic dropout in the ABI multiplexes. This was more
prominent using enhanced conditions for loci that did not
amplify at all under standard conditions. A similar pattern
was found for the D21S11, D8S1179 and D16S539 systems
for the PowerPlex 16. The fragment sizes of these loci are
around or slightly above the fragment size threshold of
successful amplification, and stochastic effects most prob-
ably generate the ambiguous and unreliable results. A
special situation was found in the D19S433 system of the
SGM Plus kit. Although this locus generates very small
fragments <140 bp, two laboratories reported the presence
of a 14.2 allele, and another two laboratories a 15 allele for
sample A which was homozygous for the 15.2 allele. The
peak heights of these extra alleles had almost the same
height as the correct allele. Whereas the presence of the 14.2
allele could be explained by an extreme stutter effect, this
cannot be the case for the false 15 allele, as it is separated by
only 2 bp from the true allele.
Most laboratories apply a lower threshold for allele
detection to prevent the inclusion of false alleles or stutter
bands. A total of 60% of the laboratories use a peak height
threshold of 50 rfu (see Table 2). Thus, the use of the
GenoTyper software for automatic data analysis some-
times prevented the detection of a regular allele due to
the threshold settings of peak height detection, although
this threshold also prevented the inclusion of artefact bands
in some cases. As we have included a peak height category
of 30–150 rfu for our analysis, we have of course picked up
more alleles than the majority of participating laboratories
would do using their standard threshold. This was done
deliberately to learn more about the detection limits and
the occurrence of artefacts using the various multiplexes.
In a real casework scenario, some of the wrongly recorded
low level alleles as well as low level correct alleles would
have been left out in favor of a more reliable analysis. Only
two laboratories have reported results using a flexible
threshold for allele calling based on the overall quality
of the results (Table 2).
A number of laboratories have used ‘‘home-made’’ sin-
gleplex STR systems such as THO1, VWA, FGA, D2S1338,
SE33, D8S1179, D18S51, and others. As these results are
quite diverse regarding the loci studied, they could not be
subjected to a comparative analysis. However, all results
submitted were correct. Most laboratories typically use these
singleplex systems for difficult samples such as degraded
DNA. In particular, several STR systems with redesigned
primer sequences to generate short amplicons gave complete
and correct results for both samples [10,11].
Eight laboratories reported their results for mitochon-
drial DNA sequence analysis (Table 3). Of these, four
laboratories failed to obtain results due to poor amplifica-
tion. The other four laboratories reported either complete or
partial results, as the HV-II region was not analyzed by all
participants. The two laboratories with complete results
applied an overlapping PCR amplification strategy with
short fragments of approx. 200 bp. Our control experiments
after preparation of the degraded DNA indicated that such
fragments can be amplified reliably [8]. This has also been
shown in recent studies on the genetic identity of historical
samples [12].
From these results, some conclusions can be drawn:
� To overcome the effects of template DNA degradation, a
PCR protocol optimized for all parameters such as the
Table 2
Allele calling thresholds for STR systems based on peak heights in
relative fluorescence units (rfu)
Threshold (rfu) No. of labs
n %
30 4 10.5
50 23 60.5
60–100 3 7.9
>100 3 7.9
Flexible 2 5.3
n.d. 3 7.9
Total 38 100
n.d.: not defined.
Table 3
Results of HV-I and HV-II mitochondrial DNA sequence analysis
Sample HV-I Resultsa
16126 16182 16183 16189 16217 16294 16295 16304 Pos. Neg. n.t.
A – C C C C – T – 4 4
B C – – – – T – C 3 4 1
HV-II
73 146 152 263 309.1 315.1
A G C – G – C 2 5 1
B G – C G C C 2 4 2
a Pos.: correct result; Neg.: no result; n.t.: not tested.
P.M. Schneider et al. / Forensic Science International 139 (2004) 123–134 133

amount of template DNA and Taq polymerase concentra-
tion relative to the number of PCR cycles has to be
established.
� Flexible guidelines for the interpretation of the observed
DNA profiles have to be applied. The guidelines should
include strategies to reanalyze the sample if evidence for
low-level peak signals is obtained. To allow for this, a
careful human evaluation of all results in addition to a
computer-based analysis (e.g. using the GenoTyper soft-
ware) is recommended.
� For mtDNA analysis of heavily degraded DNA, PCR
primers covering short overlapping DNA regions (as
described e.g. in [13]) should be applied.
Some of the characteristics of STR typing results from
degraded DNA samples from this study have also been
observed under ‘‘low copy number’’ (LCN) conditions,
where stochastic effects strongly influence the outcome of
PCR amplification. Thus, some of the guidelines developed
for interpretation of LCN STR profiles [14] may also be
applicable when highly degraded DNA has to be analyzed.
The use of standardized degraded control DNA is helpful
to understand and optimize the parameters affecting the
success of STR typing. The availability of such a degraded
control DNA in sufficient amounts would enable the forensic
laboratories to simulate a situation of heavily decomposed
DNA, and thus allow studies to enhance the efficiency of
their typing methods.
Acknowledgements
The present study was supported by contract SMT 97-
7506 from the European Commission in the context of the
‘‘Standardization of DNA Profiling Methods in the European
Union’’ (STADNAP) network initiative.
References
[1] P.D. Martin, H. Schmitter, P.M. Schneider, A brief history of
the formation of DNA databases in forensic science within
Europe, Forensic Sci. Int. 119 (2001) 225–231.
[2] P. Gill, Role of short tandem repeat DNA in forensic
casework in the UK—past, present, and future perspectives,
Biotechniques 32 (2002) 366–368.
[3] M. Graw, H.J. Weisser, S. Lutz, DNA typing of human
remains found in damp environments, Forensic Sci. Int. 113
(2000) 91–95.
[4] J.P. Whitaker, T.M. Clayton, A.J. Urquhart, E.S. Millican, T.J.
Downes, C.P. Kimpton, P. Gill, Short tandem repeat typing of
bodies from a mass disaster: high success rate and
characteristic amplification patterns in highly degraded
samples, Biotechniques 18 (1995) 670–677.
[5] R. Sparkes, C. Kimpton, S. Watson, N. Oldroyd, T. Clayton,
L. Barnett, J. Arnold, C. Thompson, R. Hale, J. Chapman, A.
Urquhart, P. Gill, The validation of a seven-locus multiplex
STR test for use in forensic casework. Part I. Mixtures,
ageing. degradation and species studies, Int. J. Legal Med.
109 (1996) 186–194.
[6] E.A. Cotton, R.F. Allsop, J.L. Guest, R.R. Frazier, P. Koumi,
I.P. Callow, A. Seager, R.L. Sparkes, Validation of the
AMPFlSTR SGM plus system for use in forensic casework,
Forensic Sci. Int. 112 (2000) 151–161.
[7] B.E. Krenke, A. Tereba, S.J. Anderson, E. Buel, S. Culhane,
C.J. Finis, C.S. Tomsey, J.M. Zachetti, A. Masibay, D.R.
Rabbach, E.A. Amiott, C.J. Sprecher, Validation of a 16-locus
fluorescent multiplex system, J. Forensic Sci. 47 (2002) 773–
785.
[8] K. Bender, M.J. Farfan, P.M. Schneider, Preparation of
degraded human DNA under controlled conditions, Forensic
Sci. Int., in press.
[9] Y. Torres, I. Flores, V. Prieto, M. Lopez-Soto, M.J. Farfan, A.
Carracedo, P. Sanz, DNA mixtures in forensic casework: a 4-
year retrospective study, Forensic Sci. Int. 134 (2003) 180–186.
[10] A. Hellmann, U. Rohleder, H. Schmitter, M. Wittig, STR
typing of human telogen hairs—a new approach, Int. J. Legal.
Med. 114 (2001) 269–273.
[11] P. Grubwieser, R. Muhlmann, W. Parson, New sensitive
amplification primers for the STR locus D2S1338 for degraded
casework DNA, Int. J. Legal Med. 117 (2003) 185–188.
[12] E. Jehaes, K. Toprak, N. Vanderheyden, H. Pfeiffer, J.J.
Cassiman, B. Brinkmann, R. Decorte, Pitfalls in the analysis of
mitochondrial DNA from ancient specimens and the con-
sequences for forensic DNA analysis: the historical case of the
putative heart of Louis XVII, Int. J. Legal. Med. 115 (2001)
135–141.
[13] M.N. Gabriel, E.F. Huffine, J.H. Ryan, M.M. Holland, T.J.
Parsons, Improved mtDNA sequence analysis of forensic
remains using a ‘‘mini-primer set’’ amplification strategy, J.
Forensic Sci. 46 (2001) 247–253.
[14] J.P. Whitaker, E.A. Cotton, P. Gill, A comparison of the
characteristics of profiles produced with the AMPFlSTR
SGM Plus multiplex system for both standard and low copy
number (LCN) STR DNA analysis, Forensic Sci. Int. 123
(2001) 215–223.
134 P.M. Schneider et al. / Forensic Science International 139 (2004) 123–134
Copyright © 2022 FDOKUMEN